Embed Size (px)
Citation preview
Habib bank limited
Rabia Abbas BalochRohma Alavi
Zeeshan Akram
Letter of Transmittal
Sir Irfan Ali,
Course Instructor,
Operation Management,
Faculty of Management Sciences
Bahria University,
Karachi.
Date: 26th December 2011
Respected Sir,
We hereby present our term project on the practical application of Pareto analysis on the problem “Growing discomfort among customers walking in HBL’, assigned by you as a mandatory part of the course.
This report covers details about the problem mentioned above and the tools studied in the class have been applied on the problem in this report
Hopefully our report will fulfill its purpose and prove to be beneficial for the students of Operation Management
We sincerely hope that the report will meet your expectations. Any information, query or feedback regarding the report will be highly appreciated and acknowledged.
Yours Sincerely,
Nisha Lalwai
Rabia Abbas Baloch
Rohma Alavi
Zeeshan Akram
Acknowledgement
All the praise to Almighty Allah the most beneficent and merciful who gave us the Opportunity to, make our own investment fund.
We are very thankful to our course instructor Sir Irfan Ali who was very co-operative and helpful throughout this work. He helped us a lot and provided proper guidance to us. We hope that he will continue to guide us in the similar way so as to enlighten our future as well.
This report is the combination of lot of sincere hard work and dedication.
We will highly appreciate suggestions for improvement in this report or any other queries regarding this report and its contents from everyone
Especially from my companions and well wishers as we strongly believe that nothing is perfect in this world and there is always room for improvement.
ContentsLetter of Transmittal....................................................................................................................................1
Acknowledgement.......................................................................................................................................3
Background..................................................................................................................................................6
Rating..........................................................................................................................................................6
History.........................................................................................................................................................6
Awards.........................................................................................................................................................7
Organogram................................................................................................................................................7
HBL Brands..................................................................................................................................................8
Vision.......................................................................................................................................................9
Mission....................................................................................................................................................9
Values..........................................................................................................................................................9
Excellence................................................................................................................................................9
Integrity...................................................................................................................................................9
Customer Focus.......................................................................................................................................9
Meritocracy.............................................................................................................................................9
Progressiveness.......................................................................................................................................9
Pareto Analysis............................................................................................................................................9
Pareto Index:.........................................................................................................................................10
Pareto Chart:.........................................................................................................................................10
How to construct Pareto diagram..........................................................................................................10
Pareto Principle:....................................................................................................................................11
Pareto Efficiency:...................................................................................................................................11
Pareto Distribution:...............................................................................................................................11
Pareto Law:............................................................................................................................................11
Objective...............................................................................................................................................12
Benefits of Pareto Analysis:...................................................................................................................12
Application in service industry (HBL):........................................................................................................12
Using Pareto Analysis:...........................................................................................................................13
Cause and Effect Analysis..........................................................................................................................15
How cause and effect diagram is used..................................................................................................15
Diagrammatic Analysis of HBL:..................................................................................................................15
Recommendations.....................................................................................................................................17
References:................................................................................................................................................18
Pareto Analysis
Pareto analysis is a statistical technique of prioritizing probable changes by identifying the areas where the problem is, and the where the change has to be implemented in order to resolve the problem. Pareto analysis is used by the teams and managers to quickly focus on the key problems.
Vilfredo Pareto, 19th century an Italian Economist and Sociologist that founded “Pareto Analysis”. He made further contributions in Pareto index, Pareto chart, Pareto principle, Pareto efficiency, Pareto distribution and Pareto’s law.
Pareto Index:A Pareto index is basically a measure of the inequality of income distribution. According to Vilferdo Pareto income and wealth is highly skewed i.e. few number of people holds it.
Pareto Chart:Vilferdo Pareto defines Pareto charts as a specialized version of histogram that shows the ranking from the most frequent to the least frequent. Pareto charts are more useful for non-numeric data and it is performed over a fixed interval of performance. It is a vertical bar chart.
How to construct Pareto diagramPareto diagram focuses on problems and causes of the problems. Pareto diagram is an extremely essential tool of how problems should be tackled and addressed. A Pareto chart is similar to the histogram or the bar chart. The bar represents the faults or problems that are occurred in a decreasing way from the left to the right according to their importance.
Following are the steps that are used to construct a Pareto diagram:
Step # 1:
Record the raw data.
Step # 2:
Order the data
Step # 3:
Label the vertical axis – X axis
Step # 4:
Label the horizontal axis – Y axis
Step # 5:
Plot a bar for each category
Step # 6:
Find cumulative counts
Step # 7:
Add a cumulative point. This point is optional.
Pareto Principle:The Pareto principle is also known as 80-20 rule, the law of vital few or principle of factor sparsely. The Pareto principle simply means that 20 percent of the people owned 80 percent of the wealth. It has been identified that 20% of the defects are causing 80% of the problem. Pareto's Principle, the 80-20 rule serves as a daily reminder to focus on 80% of your time and energy on the 20% of the work that is really important.
Pareto Efficiency:Pareto efficiency is also called Pareto optimality. Pareto efficiency is the minimal concept of efficiency that does not result in desirable well-being and equality about the society. It does not imply equality or fairness.
Pareto Distribution:Pareto distribution is a power law probability distribution. The type of distributions is highly skewed, stable over time, through various geographical areas. The Pareto distribution was initially used to describe the allocation of wealth among individuals.
Pareto Law:“The law of the vital few and the trivial many”
Pareto’s Law, is also known as the 80/20 or 90/10 rule. Pareto law typically relates:
80 % of a stock is filled with 20 % of the products. 20 % of the customer’s account for 80 % of the sales volume. 80 % of the profit is achieved with 20 % of the customers.
Pareto’s Law was named after him by business management professional Joseph M. Juran, who spotted that the 80–20 rule was common across many areas of business. Pareto law is a useful application in business. It is rarely 100% accurate. Pareto law is recommended before making
any logical decisions and assessments. Pareto law is rule of only thumb application and therefore it can be misused.
ObjectivePareto Analysis identifies major area of problems so that improvements can be made. The problems are arranged priority wise. The problem that is foremost important to be resolved at first is kept on the top. The related tools that Pareto analysis uses are fishbone diagram, scatter diagram, run charts and flow charts.
Benefits of Pareto Analysis: Correct and accurate collection of data shows efficiency. Problems are solved efficiently and properly by identifying the problem according to
their importance. Analysis shows where to focus and give improvements. Analysis allows efficient use of limited resources.
Application in service industry (HBL):
Habib Bank Limited is one of the most widely disbursed banking networks of Pakistan covering most of the cities across the country. It has numerous branches in Karachi alone out of which we picked Tariq road commercial centre for the Pareto analysis. It is a branch as well as commercial centre with high account turnovers as the branch falls in commercial banking group which look after SME’s and Commercial companies. The Commercial Banking group is however similar to Corporate Banking group. The only difference is in the portfolio and ticket size.
It was noticed that the customers walking in the Tariq road branch, which as discussed above is a Commercial centre, leaves from the branch unsatisfied and agitated due to various reasons. Customers, in any service industry are a main business. For any bank to hold on to its position needs a stable clientele. Loosing a customer is least affordable as this would mean loss of every repetitive visit and potential profit. If the customer is not satisfied by the service being delivered to him, he will immediately switch to other bank as the cost of doing the same is very low since the supply is in abundance. Hence to ensure the customer loyalty towards the brand, Banks have to be on the toes and ensure superior service delivery at what ever cost incurred in incorporating quality standards. Any loophole in service delivery will result in customer disgust.
However, note that in service industry lot of factors contribute towards delivering best service. As in case of Bank, these can be:
Trained Service personnel
Conducive environment Timely service Courtesy/greetings Convenience Right balance between bank rules and favors on moral grounds etc.
Discrepancy in any of the above mentioned factors may result in customer complaints and a downward graph of the Bank’s performance. Such was the case with Tariq road branch. To cater to the problem, they conducted a survey within their branch. They formulated a close ended questionnaire which were filled by the customers visiting the branch but could not experience the level of service they perceived. Total numbers of respondents surveyed were 200.
Using Pareto Analysis:Upon the analysis of these questionnaires and observation, following factors were identified which were pressing this problem.
1. Branch going offline.2. High customer turnover3. Insufficient staff to handle customers4. Discourteous staff5. Load shedding and generator going out of order
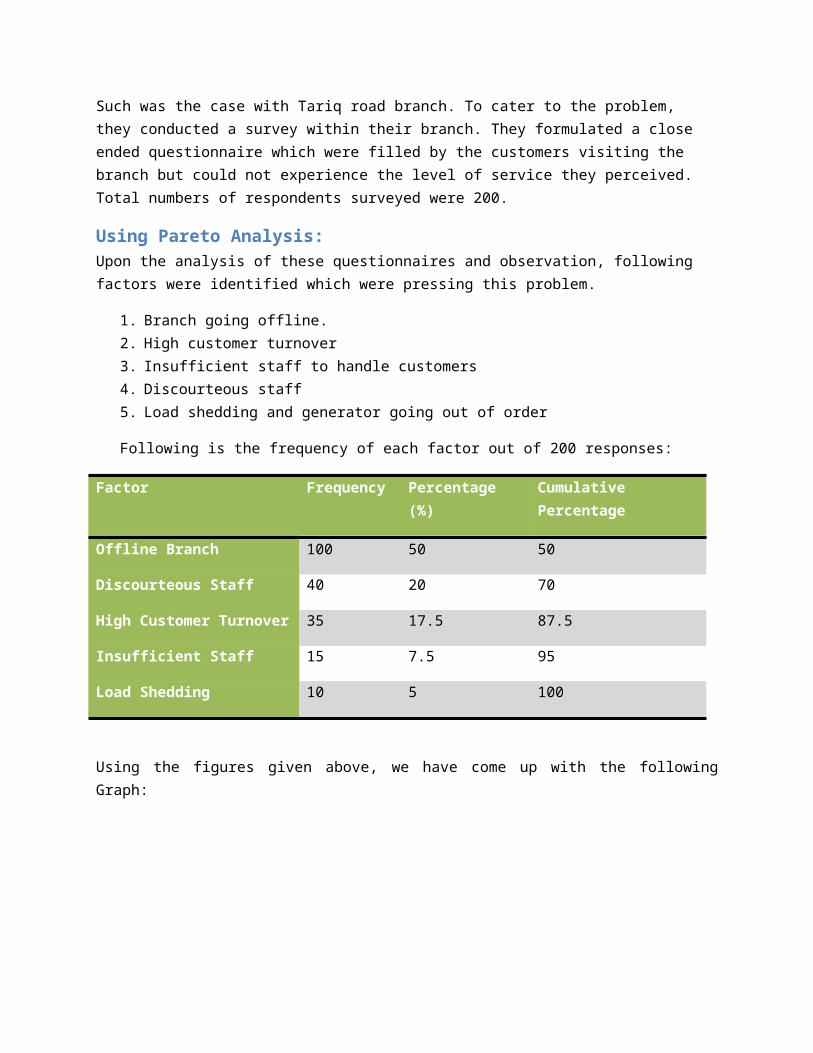
Following is the frequency of each factor out of 200 responses:
Factor Frequency Percentage (%) Cumulative Percentage
Offline Branch 100 50 50
Discourteous Staff 40 20 70
High Customer Turnover 35 17.5 87.5
Insufficient Staff 15 7.5 95
Load Shedding 10 5 100
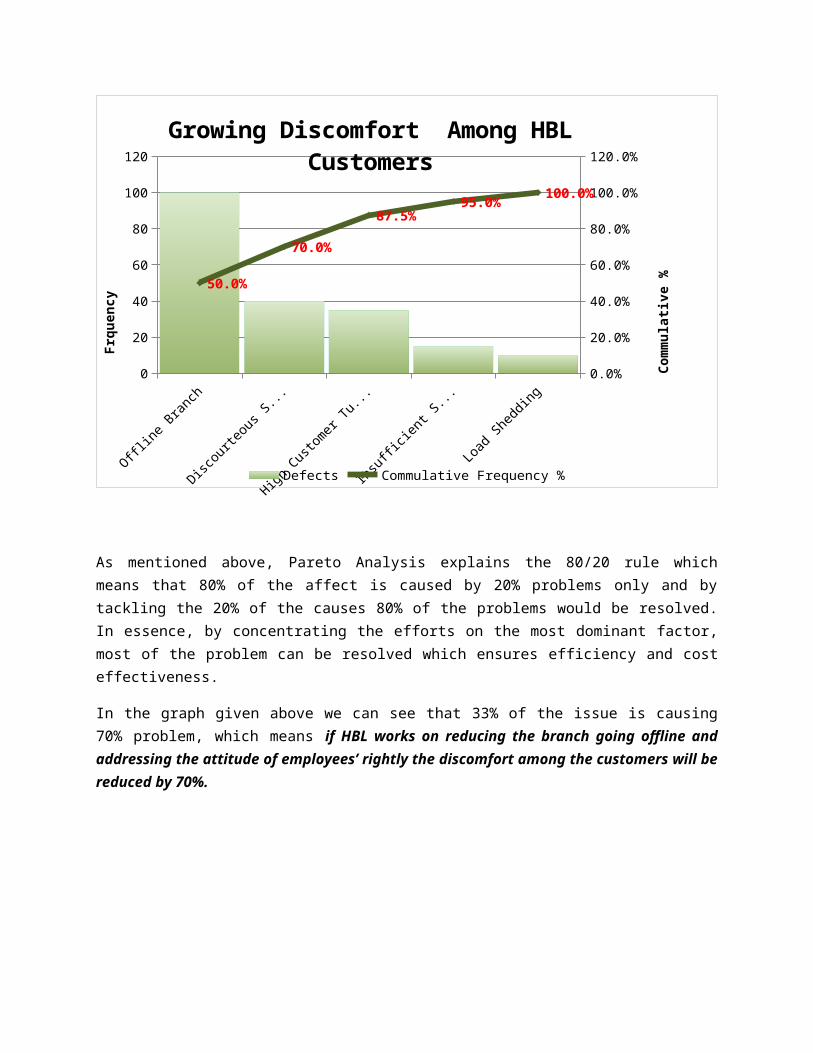
Using the figures given above, we have come up with the following Graph:
Offline Branch Discourteous Staff
High Customer Turnover
Insufficient Staff
Load Shedding0
20
40
60
80
100
120
0.0%
20.0%
40.0%
60.0%
80.0%
100.0%
120.0%
50.0%
70.0%
87.5%95.0%
100.0%
Growing Discomfort Among HBL Customers
Defects Commulative Frequency %
Frqu
ency
Com
mul
ative
%
As mentioned above, Pareto Analysis explains the 80/20 rule which means that 80% of the affect is caused by 20% problems only and by tackling the 20% of the causes 80% of the problems would be resolved. In essence, by concentrating the efforts on the most dominant factor, most of the problem can be resolved which ensures efficiency and cost effectiveness.
In the graph given above we can see that 33% of the issue is causing 70% problem, which means if HBL works on reducing the branch going offline and addressing the attitude of employees’ rightly the discomfort among the customers will be reduced by 70%.
Cause and Effect Analysis
The cause and effect analysis or fish bone analysis help us provide the causes of the problems in a structured manner. It is called fish bone diagram because after completing the figure it looks like a fish skeleton and like “ishikawa diagram”. The major benefit of the cause and effect diagram is that they push you to consider all possible causes of the problem, rather than just the ones that are most prior. The ‘Five Whys’ approach can be used, when the problem is analyzed. Cause-and-effect analysis is a systematic way of generating and sorting hypothesis about possible causes of a problem.
How cause and effect diagram is used Following are the steps to solve the problem by cause and effect diagram:
Step # 1:
Identify the problem
Step # 2:
Work out the major factors involved
Step # 3:
Identify possible causes
Step # 4:
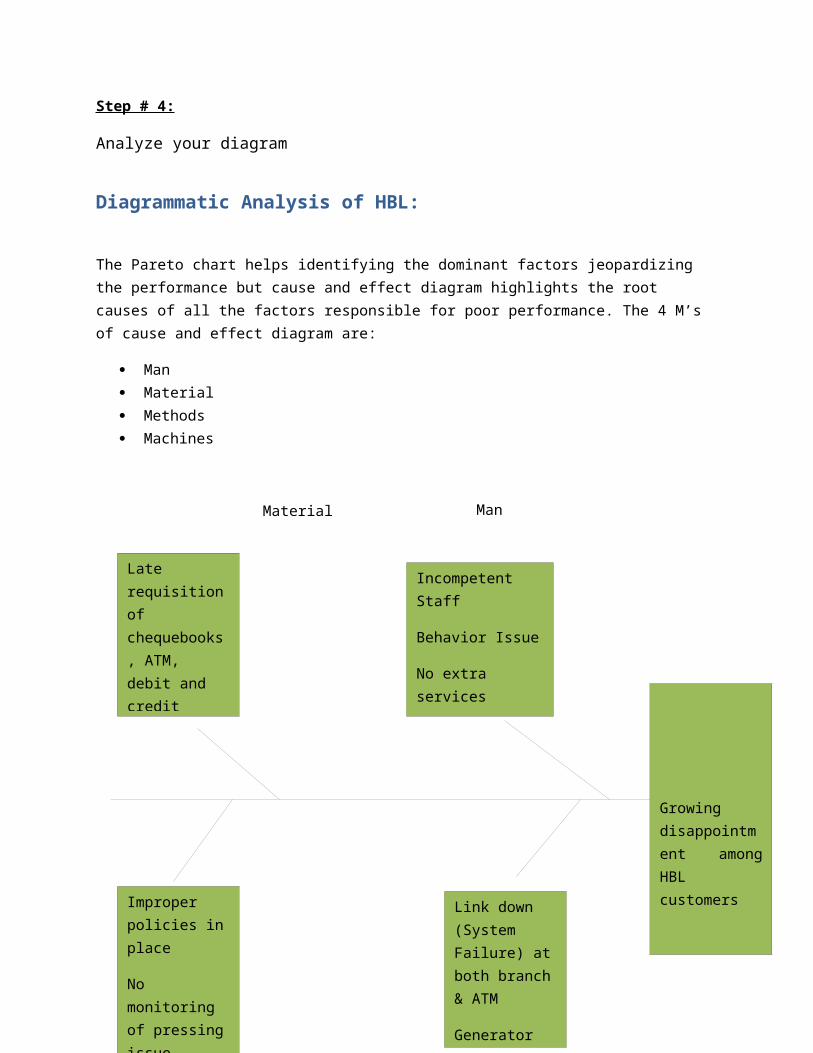
Analyze your diagram
Diagrammatic Analysis of HBL:
The Pareto chart helps identifying the dominant factors jeopardizing the performance but cause and effect diagram highlights the root causes of all the factors responsible for poor performance. The 4 M’s of cause and effect diagram are:
Man Material Methods Machines
Material
The plausible reasons in all 4 domains are found out with the help of cause and effect diagrammatic analysis. This analysis highlights which area specifically needs improvement. Now it is up to the manager how he rectifies each cause and what strategy he employs to deal with them. However, we are offering some recommendations ourselves which we feel may prove to be significant in improving the Bank’s performance and result in increased customer satisfaction.
Late requisition of chequebooks, ATM, debit and credit cards
Incompetent Staff
Behavior Issue
No extra services
Lack of staff support and guidance
Improper policies in place
No monitoring of pressing issue
Improper technical assistance
No prompt and timely decisions taken to ratify issues
Link down (System Failure) at both branch & ATM
Generator issues
Growing disappointment among HBL customers
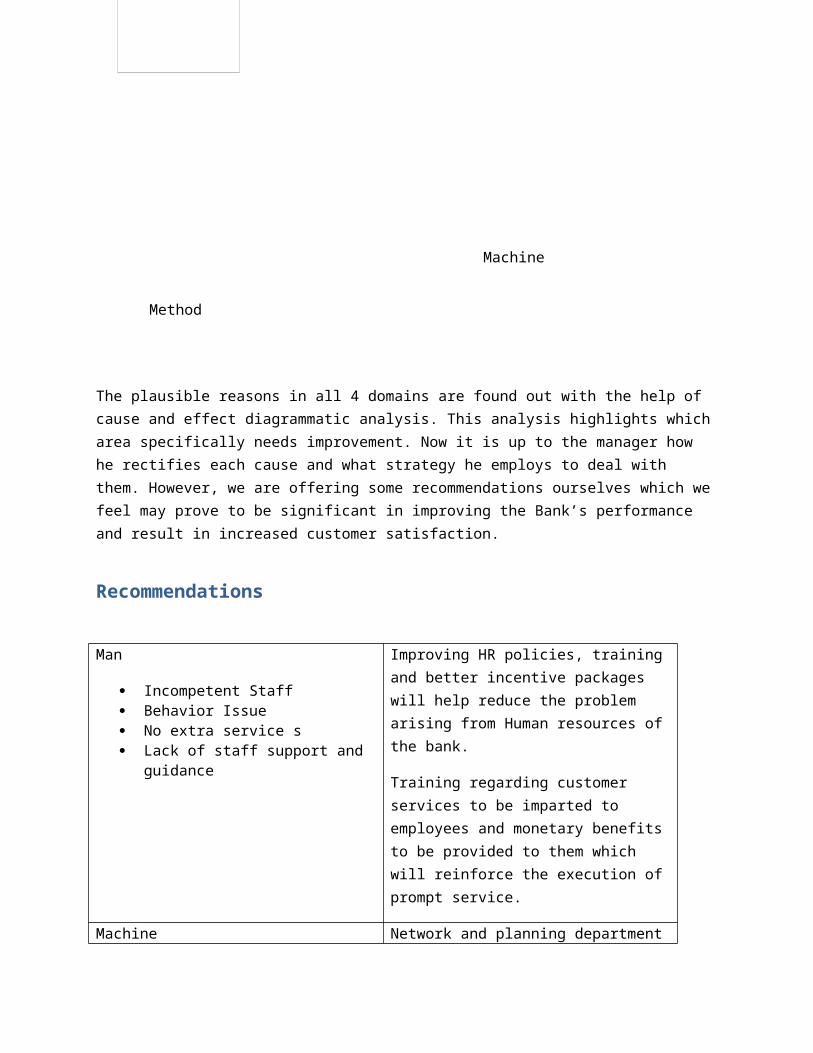
Man
Method
Machine
Recommendations
Man
Incompetent Staff Behavior Issue No extra service s Lack of staff support and guidance
Improving HR policies, training and better incentive packages will help reduce the problem arising from Human resources of the bank.
Training regarding customer services to be imparted to employees and monetary benefits to be provided to them which will reinforce the execution of prompt service.
Machine
Link down (System Failure) at both branch & ATM
Generator issues
Network and planning department must ensure un interrupted supply of network so that branch doesn’t go offline.
Back up servers should be installed which can take over the extra traffic on peak days ( Salary Days)
IT trained personnel should also be employed
Generator discrepancy should be permanently fixed and if necessary, replacement should take place to ensure continuous electricity supply.
Material
Late requisition of cheque books, ATM, debit and credit cards.
Bringing expediency in the process.
Check and balance once order for cheque, ATM, debit and cards have been made to ensure timely availability
Method
Improper policies in place No monitoring of pressing issue Improper technical assistance No prompt and timely decisions taken
to ratify issues
Better policies should be implemented for ratification of issues
A team should be formulated which provide technical support to branches.
References:
Links of Pareto Analysis
http://www.sigmaxl.com/ParetoCharts.htm?gclid=CMy-7qPimq0CFcdG3god8T6Ing
http://erc.msh.org/quality/pstools/pspareto.cfm
http://www.google.com.pk/webhp?sclient=psy&hl=en&site=&source=hp&pbx=1&oq=&aq=&aqi=&gs_upl=#sclient=psy-ab&hl=en&site=webhp&source=hp&q=how%20to%20use%20pareto%20analysis&pbx=1&oq=how%20to%20use%20pareto&aq=2&aqi=g4&aql=&gs_sm=sc&gs_upl=643243l649738l1l651809l34l13l15l4l4l1l378l3641l2-8.5l22l0&bav=on.2,or.r_gc.r_pw.,cf.osb&fp=6b5478ec4af8c885&biw=1252&bih=592&pf=p&pdl=300
http://dictionary.reference.com/browse/pareto%27s+law
http://www.qfinance.com/performance-management-checklists/understanding-paretos-law
http://www.pistonheads.com/gassing/topic.asp?h=0&f=180&t=815757&mid=0
http://www.realworldmagazine.com/natasha-coombes-pareto-law-graduate-sales-case-study
http://www.thesaleslion.com/paretos-law-marketing-21st-century-80-20/
http://www.merriam-webster.com/dictionary/pareto%27s%20law
http://www.pareto.co.uk/
http://en.wikipedia.org/wiki/Pareto%27s_law
http://gilles.trehin.urville.pagesperso-orange.fr/pareto_distributions.htm
http://www.ds.unifi.it/VL/VL_EN/special/special12.html
http://mathworld.wolfram.com/ParetoDistribution.html
http://en.wikipedia.org/wiki/Pareto_efficiency#See_also
http://www.investopedia.com/terms/p/pareto-efficiency.asp
http://www.google.com.pk/search?sclient=psy-ab&hl=en&biw=1252&bih=592&noj=1&site=webhp&source=hp&q=pareto+efficiency+definition&oq=pareto+eff&aq=5&aqi=g10&aql=&gs_sm=e&gs_upl=3251831l3254766l0l3260609l27l11l0l0l0l3l441l2346l3.2.2.3.1l11l0
http://en.wikipedia.org/wiki/Pareto_principle
http://www.encyclo.co.uk/define/Pareto%20index
http://www.mindtools.com/pages/article/newTED_01.htm
http://management.about.com/cs/generalmanagement/a/Pareto081202.htm
http://en.wikipedia.org/wiki/Vilfredo_Pareto
Links for Cause and Effect
http://www.mindtools.com/pages/article/newTMC_03.htm
http://www.cityprocessmanagement.com/Downloads/CPM_5Ys.pdf
http://www.isixsigma.com/index.php?option=com_k2&view=item&id=963:decision-making-with-cause-and-effect-analysis-and-doe&Itemid=200
http://www.information-management.com/infodirect/20050708/1031665-1.html