Embed Size (px)
Citation preview
Opium for the masses?
Conflict-induced narcotics production in Afghanistan∗
Jo Thori Lind Karl Ove Moene Fredrik Willumsen†
October 2008
Abstract
We show that the recent dramatic rise in Afghan opium production is caused by
escalating violent conflicts. Violence destroys roads and irrigation, crucial to alternative
crops. It weakens local incentives to rebuild the infrastructure and to enforce law and
order, sustaining the new level of opium production. Exploiting a unique data set, we
show that Western hostile casualties, our proxy for conflict, have a strong impact on
subsequent local opium production. This proxy is shown to be exogenous to opium.
We exploit the discontinuity at the end of the planting season: Conflicts have a strong
effect before and no effect after planting, assuring causality. The strongest effects of
conflicts are found where government law enforcement is weak. Finally, the causality
from conflicts to opium is also confirmed by a Granger test.
Keywords: Conflict, narcotics production, resource curse, Afghanistan
JEL Codes: D74, H56, K42, O1
∗This paper is part of the cooperation between ESOP, Department of Economics, University of Oslo andCSCW at the International Peace Research Institute, Oslo (PRIO). We are grateful to Astrid Sandsør forexcellent research assistance, and to Jens Chr. Andvig, Erik Biørn, Joan Esteban, Raquel Fernandez, JonH. Fiva, Steinar Holden, Alfonso Irarrazabal, Rocco Macchiavello, Halvor Mehlum, Debraj Ray, Carl-ErikSchulz, Tore Schweder, Gaute Torsvik, and Bertil Tungodden for useful discussions. We have also benefitedfrom comments from participants at the Annual Meeting of the Norwegian Economics Association, Oslo2008, the CMI development seminar, Bergen 2008, the ESOP/CSCW Workshop on Conflicts and EconomicPerformance, Oslo 2008, the Nordic Conference in Development Economics, Stockholm 2008, and the ESOPworkshop on Development and Inequality, Oslo 2008.
†Department of Economics, University of Oslo. Emails: [email protected], [email protected],and [email protected].
1
1 Introduction
Opium production in Afghanistan has helped finance holy wars against Soviet occupation,
violent power contests among warlords, the rise of Taliban and its way to power, and the
present resistance against Western intervention. What is less well known is how conflicts
have spurred opium production as well. This paper shows how the recent rise in poppy
cultivation in Afghanistan can be understood as a direct consequence of the rising violent
conflicts.
The traditional explanation for why the production of illegal substances is so high in
conflict areas focuses on drugs-for-arms strategies. This explanation rests on centralized
power within rebel organizations or governments, where strongmen organize the growing of
illegal substances to finance military campaigns. We emphasize a reverse mechanism, what
we call conflict-induced narcotics production. It rests on more fragmented power where local
producers and leaders react to military activities by raising drug production; not because
they want to hoard cash to buy arms, but because the production decisions reflect a new
social and economic situation, and a shorter time horizon. In the case of Afghanistan, the key
is the observation that opium cultivation requires a minimum of investments and provides a
maximum of economic turnover. These are desirable features under the political instability
generated by conflict.
Why do production decisions change? Opium is more drought resistant than wheat, the
main alternative crop, and opium does not require road transportation. Military activities
that destroy infrastructure such as irrigation and roads therefore make opium relatively more
profitable. Hence, farmers and local warlords shift to opium because it is less affected by
the fighting and can more easily be produced and sold in the new conflict environment.
Violence and political instability also erodes the remains of local law and order by making
it possible to ignore the law (opium has been illegal in Afghanistan since 1945 (UNODC,
1949)). As David Keen (2000, p. 22) stresses, conflicts should be regarded as “the emergence
of an alternative system of profit, power, and even protection”. The social stigma attached
to illegal activities easily vanishes and expected punishment declines. A fragmented state
enables warlords and militia leaders to earn a living by protecting local cultivators, opium
traders, and laboratories. Their behavior makes conflict-induced opium production persis-
tent. Faced with higher risks of violence and hostile take-overs, they find it less profitable
to rebuild the destroyed infrastructure.
Since physical conditions and the climate are extremely well suited for opium production
in Afghanistan1 a small alteration in incentives may have great impacts on the amount of
1Average yield in Afghanistan is about 40 kg/ha compared to for instance only about 10 kg/ha in Burma,the former major global producer of illicit opium (UNODC, 2008). In Indian test stations, which generallyhave much higher yields than an average farmer, yields of a maximum of 60 kg/ha has been obtained (Kapoor,1995, p. 66).
2
opium produced. In sum, the physical and social conditions for poppy cultivation and heroin
production constitute the opium curse of Afghanistan where illegal production displaces legal
production.2 The soaring of opium production in recent years, that amounts to more than
a doubling from 2002 to 2007, is fueled by military actions. It is conflict-induced.
To empirically test the main mechanism of how violent conflicts induce subsequent opium
production, we have gathered a unique data set with information from the 329 Afghan
districts from 2001 to 2007 on the area under opium cultivation and the localization of
conflict. To measure violent conflicts, we use information on the occurrence of Western
hostile casualties. For earlier periods there are no consistent conflict data, but we provide a
brief historical account.
The data show a strong positive relationship between conflict and subsequent poppy cul-
tivation. The direction of causality is not obvious, however. First we note that the leaders
of the Western ISAF forces insist that they are “not directly involved in poppy eradication”
or “in taking military action against narcotic producers” (see citations below). Empirically,
we do not find any correlation between eradication of opium poppies and Western casual-
ties either. Both are clear indications that the variation in conflict is exogenous to opium
production.
We also undertake a number of tests to verify that the line of causality indeed goes
from conflict to opium production. First, we show that conflict in one year induces opium
production in the next, whereas opium production in one year does not induce fighting the
year after. Hence we conclude that conflict Granger causes opium production. Second, we
compare the impacts of fighting on opium production just before and just after the planting
season. Only the conflicts before the planting season have an impact on production. Third,
to further check for simultaneity biases we instrument opium production by deviations from
normal rainfall. This exercise indicates that there is no causal link from opium production
to conflict, and hence that the correlation must be driven by conflict leading to opium
production. To test for whether opium production could be caused by the mere presence of
Western soldiers, and not by fighting in itself, we compare the effect of hostile and non-hostile
casualties on poppy cultivation. Hostile casualties have a strong effect whereas non-hostile
casualties have no effect. Finally, we show that the effect of conflict on opium production
is much lower when law enforcement is good, supporting our assertion that conflict-induced
narcotics production relies on institutional failure.
More generally, there seems to be an empirical correlation between violent conflict and
2This is a variant of the “resource curse” (see e.g. Sachs and Warner, 1995, 1997, 2001). In general, theresource curse can be a misnomer. In most cases it is the combination of bad institutions and “lootable”resource rents that leads to these kinds of development failures (Mehlum, Moene, and Torvik, 2006). Theproblem in Afghanistan is not the resources or high productivity of opium per se, but rather the circumstancesfor resource rent extraction. In fact, the whole Afghan opium trade becomes so valuable just because thecountry has such bad institutions. Institutions that obeyed international conventions would restrict opiumproduction to legal medical use.
3
drugs production in a number of countries (Cornell, 2005). There is a small literature
explaining this conflict-drugs relationship, with an emphasis on civil war. The main channels
explored are how drugs production help finance rebellion activity, what we call drugs-for-arms
strategies. The identification of a positive effect of coca production on conflicts in Colombia
is derived quite convincingly by Angrist and Kugler (2008). They explore variations across
regions of how an exogenous increase in coca prices affects rebellion activities. Cornell
(2005) provides a further survey of some other case studies. The reverse effect, what we call
conflict-induced narcotics production, is mostly absent from the literature.3
In Section 2 we provide a brief overview of the background of opium in Afghanistan
emphasizing how large increases follow the outbreak of serious conflicts. Section 3 provides
a simple model that highlights the main mechanisms behind the association between conflicts
and opium cultivation. Section 4 contains our empirical findings and a number of tests for
causality and robustness. Section 5 concludes.
2 Background
Afghanistan’s dominant role in the world opium production does not go back more than
three decades, as can be seen from Table 1.4 The low initial production may seem puzzling
as the favorable physical circumstances for growing and processing opium seem to have been
almost the same for decades. The soil and climate conditions fit well with opium production.
Opium poppies can grow almost everywhere in Afghanistan. The cultivation requires a factor
endowment of much labor5 and little land, which fits the Afghan situation. In addition,
dried raw opium takes up little space relative to its value. It can easily be stored and kept
as savings, and can readily be exchanged even in times of serious conflicts. The processing
and transport facilities seem to be largely unaffected by war conditions. The process of
transforming raw opium to heroin is also fairly simple requiring only commonly available
chemicals and a rudimentary laboratory.6 These laboratories can easily be established and
operated. Today Afghanistan has a large number of them. Most of the laboratories are
small and family run, producing about 10kg per day (UNODC, 2003, p. 139f). Some are
even mobile, which is particularly important in areas with violent conflicts and contested
3The only paper we know of is the study of coca production in Colombia by Dıaz and Sanches (2004).Their mechanism is that an increase in the power and territorial control of the rebel groups lead to a rise incoca production, since only rebel groups produce coca.
4The table is compiled from different sources and hence the figures are not necessarily directly comparable.The upward trend, however, is very clear.
5To collect the opium from the poppy, the pod of the plant has to be cut, a procedure known as lancing.As all the poppies do not mature at the same time, the farmer has to go over the same area several timeslancing the mature pods. Once a pod has been cut open, the opium oozes out and is collected. This processis repeated until the plant stops yielding.
6See e.g. Booth (1996, 77f) for details of the process.
4
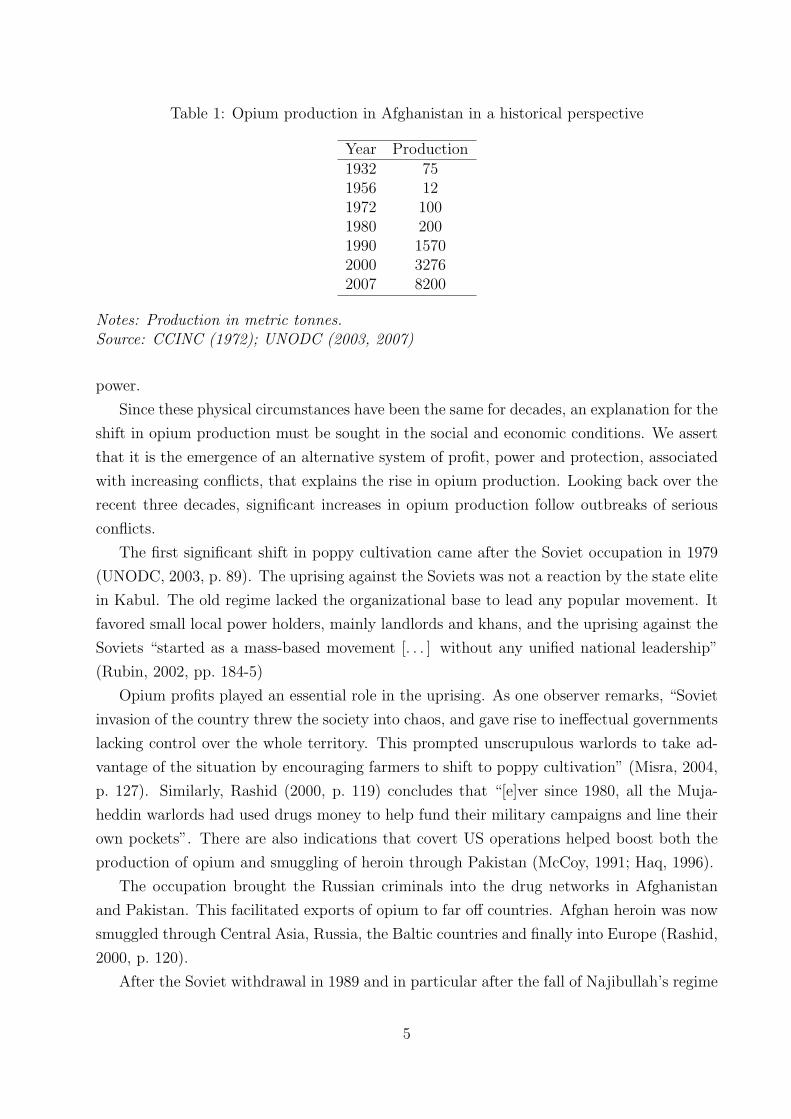
Table 1: Opium production in Afghanistan in a historical perspective
Year Production1932 751956 121972 1001980 2001990 15702000 32762007 8200
Notes: Production in metric tonnes.Source: CCINC (1972); UNODC (2003, 2007)
power.
Since these physical circumstances have been the same for decades, an explanation for the
shift in opium production must be sought in the social and economic conditions. We assert
that it is the emergence of an alternative system of profit, power and protection, associated
with increasing conflicts, that explains the rise in opium production. Looking back over the
recent three decades, significant increases in opium production follow outbreaks of serious
conflicts.
The first significant shift in poppy cultivation came after the Soviet occupation in 1979
(UNODC, 2003, p. 89). The uprising against the Soviets was not a reaction by the state elite
in Kabul. The old regime lacked the organizational base to lead any popular movement. It
favored small local power holders, mainly landlords and khans, and the uprising against the
Soviets “started as a mass-based movement [. . . ] without any unified national leadership”
(Rubin, 2002, pp. 184-5)
Opium profits played an essential role in the uprising. As one observer remarks, “Soviet
invasion of the country threw the society into chaos, and gave rise to ineffectual governments
lacking control over the whole territory. This prompted unscrupulous warlords to take ad-
vantage of the situation by encouraging farmers to shift to poppy cultivation” (Misra, 2004,
p. 127). Similarly, Rashid (2000, p. 119) concludes that “[e]ver since 1980, all the Muja-
heddin warlords had used drugs money to help fund their military campaigns and line their
own pockets”. There are also indications that covert US operations helped boost both the
production of opium and smuggling of heroin through Pakistan (McCoy, 1991; Haq, 1996).
The occupation brought the Russian criminals into the drug networks in Afghanistan
and Pakistan. This facilitated exports of opium to far off countries. Afghan heroin was now
smuggled through Central Asia, Russia, the Baltic countries and finally into Europe (Rashid,
2000, p. 120).
After the Soviet withdrawal in 1989 and in particular after the fall of Najibullah’s regime
5
in 1992, warlords who earlier were unified against the Russians, started to fight each other.
It was a violent power struggle with shifting alliances between ethnic groups and between
local commanders. Amalendu Misra (2004, p. 52) claims that between 1992 and 1996 “every
major group had both allied with and fought against every other major group at one time
or another” (see also Giustozzi, 2000; Kaplan, 2001).
At the same time agriculture and trade revived. But “[m]uch of this renewed production
took the form of opium growing, heroin refining, and smuggling; these enterprises were
organized by combines of mujahidin parties, Pakistani military officers, and Pakistani drug
syndicates.” (Rubin, 2002, p. 183). The acceleration of opium production around 1989
is also noted by UNODC (2003, p. 90). Poppy cultivation in Pakistan was dramatically
reduced as the government started to fight against the narcotics Mafia that had developed
in the Pakistani armed forces. Warlords in Afghanistan took over the production.
When Taliban entered the scene in 1994, it acted as other warlords when it came to
opium production. According to Rashid (2000), the area for poppy cultivation was expanded
and new trade and transport routes were established as Taliban fought its way to power.
Taliban also extracted parts of the opium profits through levying the traditional ushr and
zakat taxes on the opium traders (UNODC, 2003, p. 92). The taxes on opium production
were interpreted as a sign of its religious and political acceptance.
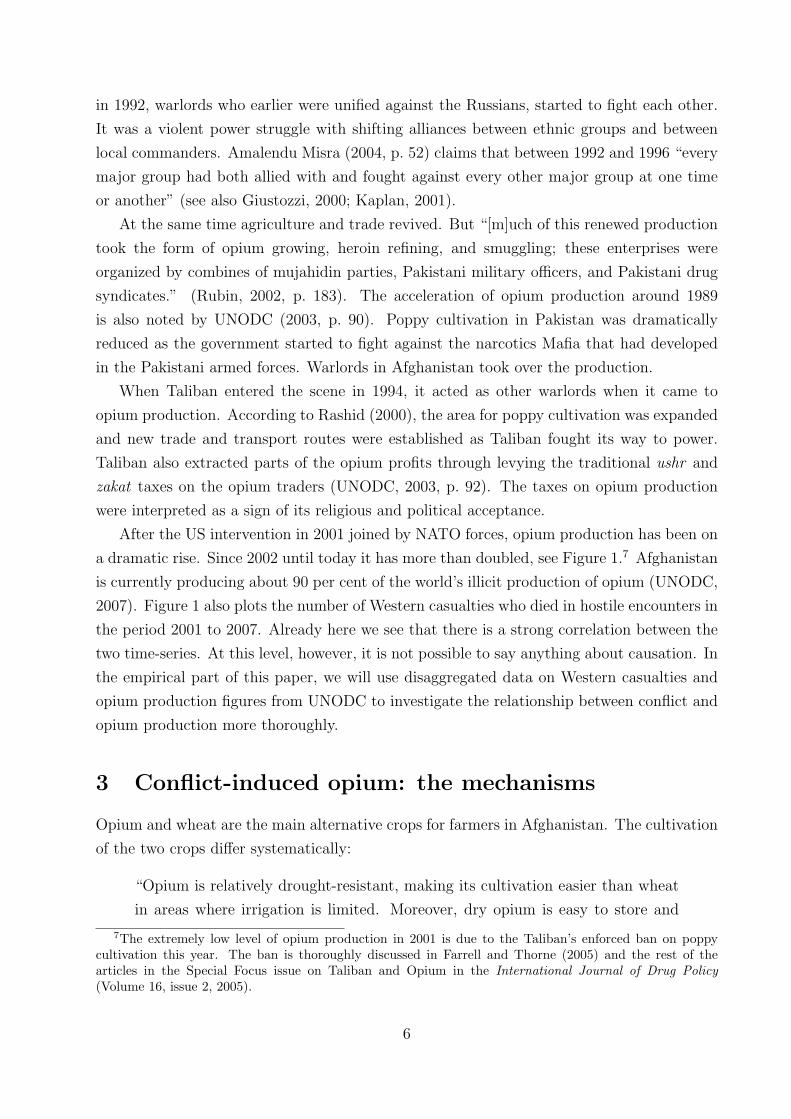
After the US intervention in 2001 joined by NATO forces, opium production has been on
a dramatic rise. Since 2002 until today it has more than doubled, see Figure 1.7 Afghanistan
is currently producing about 90 per cent of the world’s illicit production of opium (UNODC,
2007). Figure 1 also plots the number of Western casualties who died in hostile encounters in
the period 2001 to 2007. Already here we see that there is a strong correlation between the
two time-series. At this level, however, it is not possible to say anything about causation. In
the empirical part of this paper, we will use disaggregated data on Western casualties and
opium production figures from UNODC to investigate the relationship between conflict and
opium production more thoroughly.
3 Conflict-induced opium: the mechanisms
Opium and wheat are the main alternative crops for farmers in Afghanistan. The cultivation
of the two crops differ systematically:
“Opium is relatively drought-resistant, making its cultivation easier than wheat
in areas where irrigation is limited. Moreover, dry opium is easy to store and
7The extremely low level of opium production in 2001 is due to the Taliban’s enforced ban on poppycultivation this year. The ban is thoroughly discussed in Farrell and Thorne (2005) and the rest of thearticles in the Special Focus issue on Taliban and Opium in the International Journal of Drug Policy(Volume 16, issue 2, 2005).
6
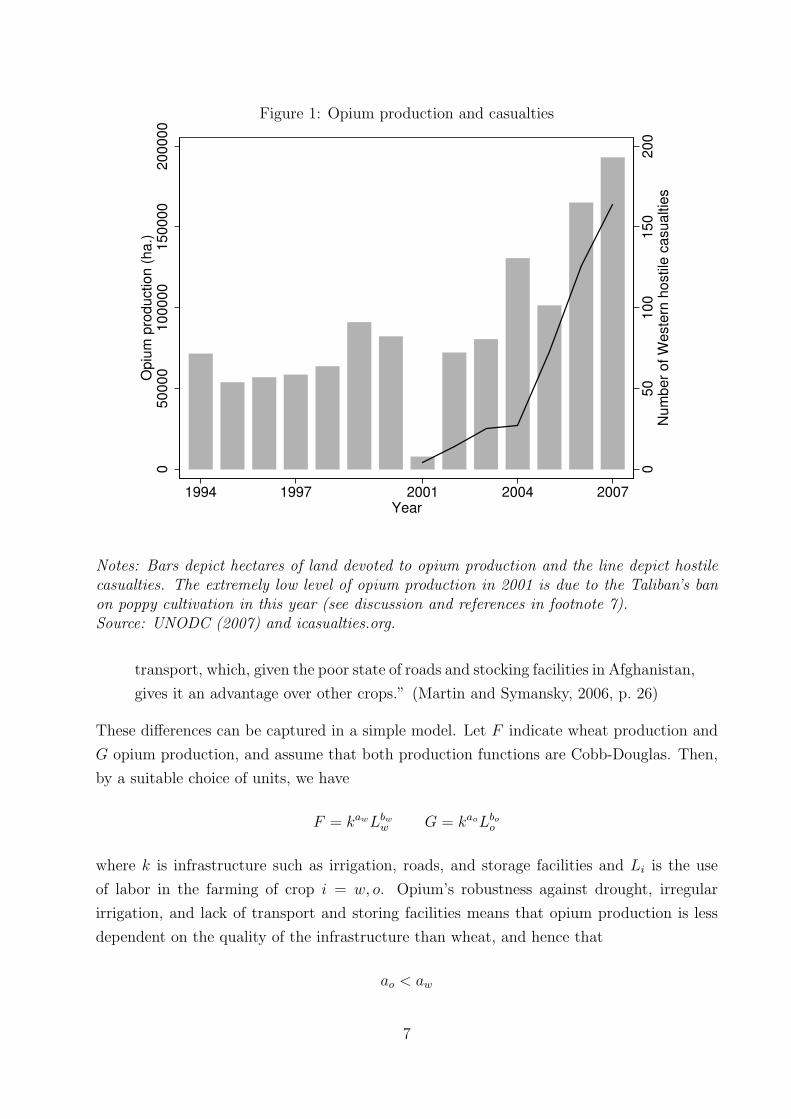
Figure 1: Opium production and casualties
050
100
150
200
Num
ber o
f Wes
tern
hos
tile c
asua
lties
050
000
1000
0015
0000
2000
00O
pium
pro
duct
ion
(ha.
)
1994 1997 2001 2004 2007Year
Notes: Bars depict hectares of land devoted to opium production and the line depict hostilecasualties. The extremely low level of opium production in 2001 is due to the Taliban’s banon poppy cultivation in this year (see discussion and references in footnote 7).Source: UNODC (2007) and icasualties.org.
transport, which, given the poor state of roads and stocking facilities in Afghanistan,
gives it an advantage over other crops.” (Martin and Symansky, 2006, p. 26)
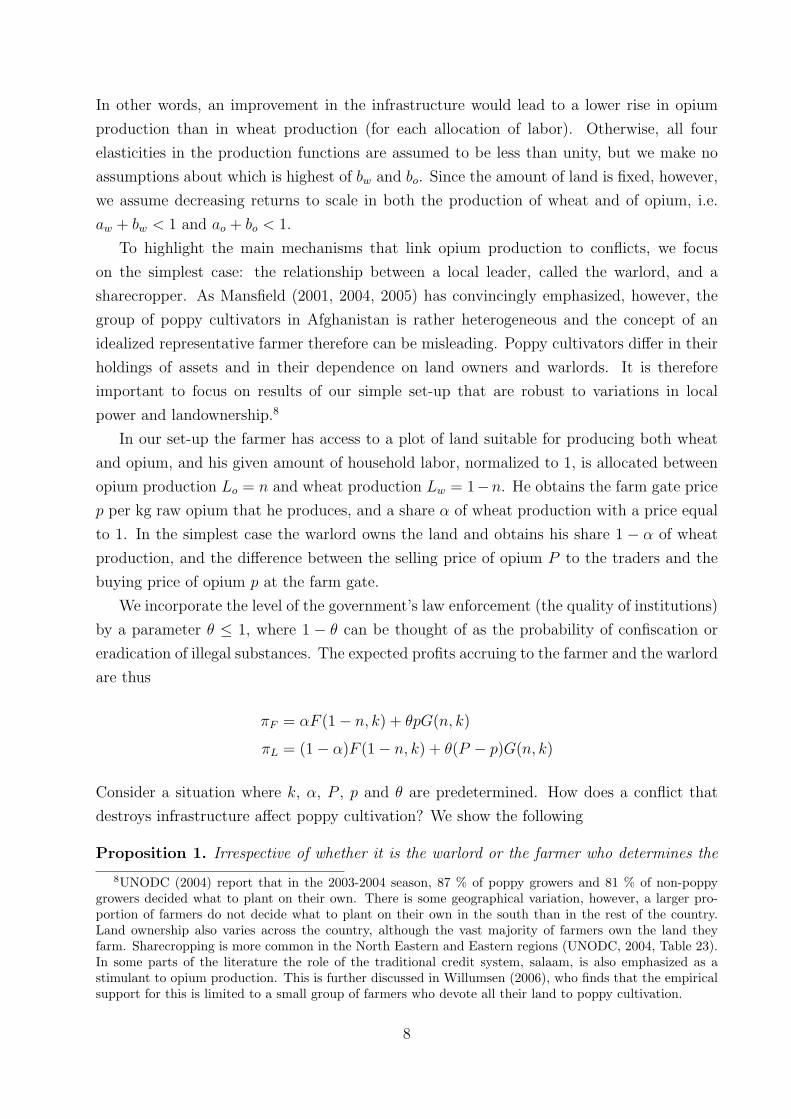
These differences can be captured in a simple model. Let F indicate wheat production and
G opium production, and assume that both production functions are Cobb-Douglas. Then,
by a suitable choice of units, we have
F = kawLbww G = kaoLbo
o
where k is infrastructure such as irrigation, roads, and storage facilities and Li is the use
of labor in the farming of crop i = w, o. Opium’s robustness against drought, irregular
irrigation, and lack of transport and storing facilities means that opium production is less
dependent on the quality of the infrastructure than wheat, and hence that
ao < aw
7
In other words, an improvement in the infrastructure would lead to a lower rise in opium
production than in wheat production (for each allocation of labor). Otherwise, all four
elasticities in the production functions are assumed to be less than unity, but we make no
assumptions about which is highest of bw and bo. Since the amount of land is fixed, however,
we assume decreasing returns to scale in both the production of wheat and of opium, i.e.
aw + bw < 1 and ao + bo < 1.
To highlight the main mechanisms that link opium production to conflicts, we focus
on the simplest case: the relationship between a local leader, called the warlord, and a
sharecropper. As Mansfield (2001, 2004, 2005) has convincingly emphasized, however, the
group of poppy cultivators in Afghanistan is rather heterogeneous and the concept of an
idealized representative farmer therefore can be misleading. Poppy cultivators differ in their
holdings of assets and in their dependence on land owners and warlords. It is therefore
important to focus on results of our simple set-up that are robust to variations in local
power and landownership.8
In our set-up the farmer has access to a plot of land suitable for producing both wheat
and opium, and his given amount of household labor, normalized to 1, is allocated between
opium production Lo = n and wheat production Lw = 1−n. He obtains the farm gate price
p per kg raw opium that he produces, and a share α of wheat production with a price equal
to 1. In the simplest case the warlord owns the land and obtains his share 1 − α of wheat
production, and the difference between the selling price of opium P to the traders and the
buying price of opium p at the farm gate.
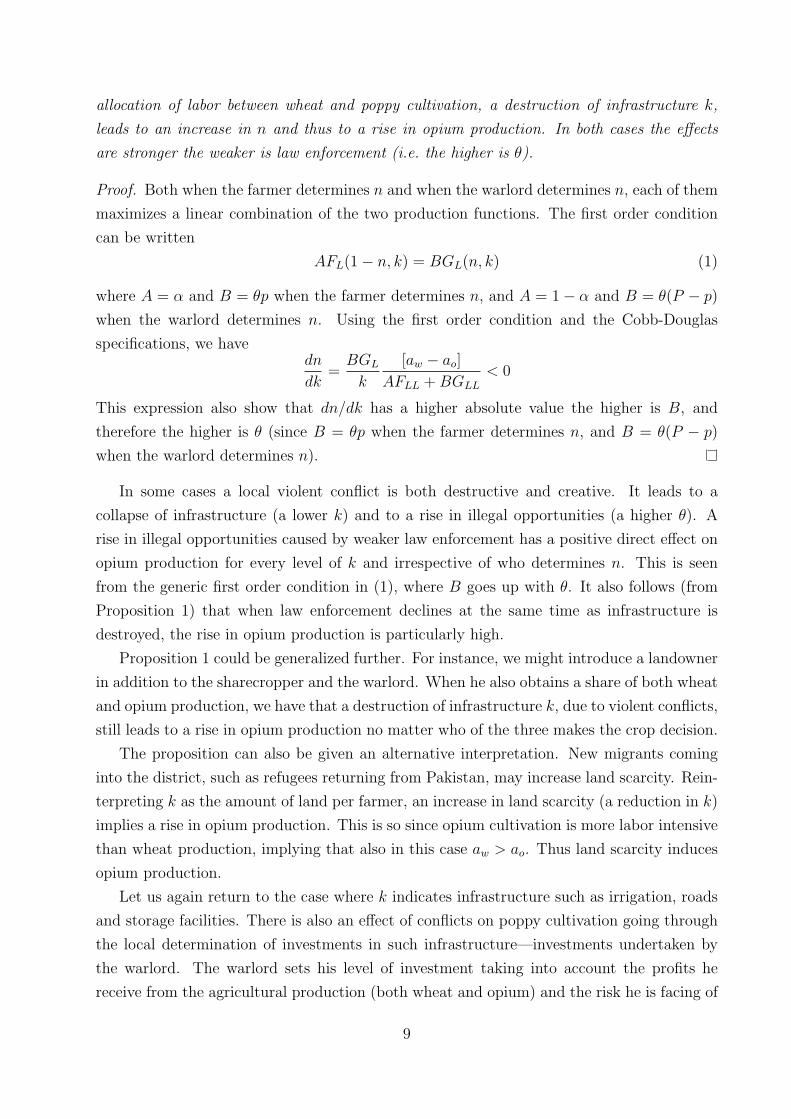
We incorporate the level of the government’s law enforcement (the quality of institutions)
by a parameter θ ≤ 1, where 1 − θ can be thought of as the probability of confiscation or
eradication of illegal substances. The expected profits accruing to the farmer and the warlord
are thus
πF = αF (1− n, k) + θpG(n, k)
πL = (1− α)F (1− n, k) + θ(P − p)G(n, k)
Consider a situation where k, α, P , p and θ are predetermined. How does a conflict that
destroys infrastructure affect poppy cultivation? We show the following
Proposition 1. Irrespective of whether it is the warlord or the farmer who determines the
8UNODC (2004) report that in the 2003-2004 season, 87 % of poppy growers and 81 % of non-poppygrowers decided what to plant on their own. There is some geographical variation, however, a larger pro-portion of farmers do not decide what to plant on their own in the south than in the rest of the country.Land ownership also varies across the country, although the vast majority of farmers own the land theyfarm. Sharecropping is more common in the North Eastern and Eastern regions (UNODC, 2004, Table 23).In some parts of the literature the role of the traditional credit system, salaam, is also emphasized as astimulant to opium production. This is further discussed in Willumsen (2006), who finds that the empiricalsupport for this is limited to a small group of farmers who devote all their land to poppy cultivation.
8
allocation of labor between wheat and poppy cultivation, a destruction of infrastructure k,
leads to an increase in n and thus to a rise in opium production. In both cases the effects
are stronger the weaker is law enforcement (i.e. the higher is θ).
Proof. Both when the farmer determines n and when the warlord determines n, each of them
maximizes a linear combination of the two production functions. The first order condition
can be written
AFL(1− n, k) = BGL(n, k) (1)
where A = α and B = θp when the farmer determines n, and A = 1− α and B = θ(P − p)
when the warlord determines n. Using the first order condition and the Cobb-Douglas
specifications, we havedn
dk=
BGL
k
[aw − ao]
AFLL + BGLL
< 0
This expression also show that dn/dk has a higher absolute value the higher is B, and
therefore the higher is θ (since B = θp when the farmer determines n, and B = θ(P − p)
when the warlord determines n).
In some cases a local violent conflict is both destructive and creative. It leads to a
collapse of infrastructure (a lower k) and to a rise in illegal opportunities (a higher θ). A
rise in illegal opportunities caused by weaker law enforcement has a positive direct effect on
opium production for every level of k and irrespective of who determines n. This is seen
from the generic first order condition in (1), where B goes up with θ. It also follows (from
Proposition 1) that when law enforcement declines at the same time as infrastructure is
destroyed, the rise in opium production is particularly high.
Proposition 1 could be generalized further. For instance, we might introduce a landowner
in addition to the sharecropper and the warlord. When he also obtains a share of both wheat
and opium production, we have that a destruction of infrastructure k, due to violent conflicts,
still leads to a rise in opium production no matter who of the three makes the crop decision.
The proposition can also be given an alternative interpretation. New migrants coming
into the district, such as refugees returning from Pakistan, may increase land scarcity. Rein-
terpreting k as the amount of land per farmer, an increase in land scarcity (a reduction in k)
implies a rise in opium production. This is so since opium cultivation is more labor intensive
than wheat production, implying that also in this case aw > ao. Thus land scarcity induces
opium production.
Let us again return to the case where k indicates infrastructure such as irrigation, roads
and storage facilities. There is also an effect of conflicts on poppy cultivation going through
the local determination of investments in such infrastructure—investments undertaken by
the warlord. The warlord sets his level of investment taking into account the profits he
receive from the agricultural production (both wheat and opium) and the risk he is facing of
9
being overturned—either by competing warlords, by the Kabul government, or by Western
forces. Overturned, the warlord would not be able to keep any locally invested assets. One
reason could be that the new power holder considers the warlord’s property illegitimate.
Conflict, or a higher threat of conflict, leads the warlord to invest less in infrastructure as
his expected capital loss goes up with higher risk of conflict. From Proposition 1, we know
that reductions in infrastructure is accompanied by a higher level of opium production, since
poppies are less dependent on infrastructure than wheat. We show that
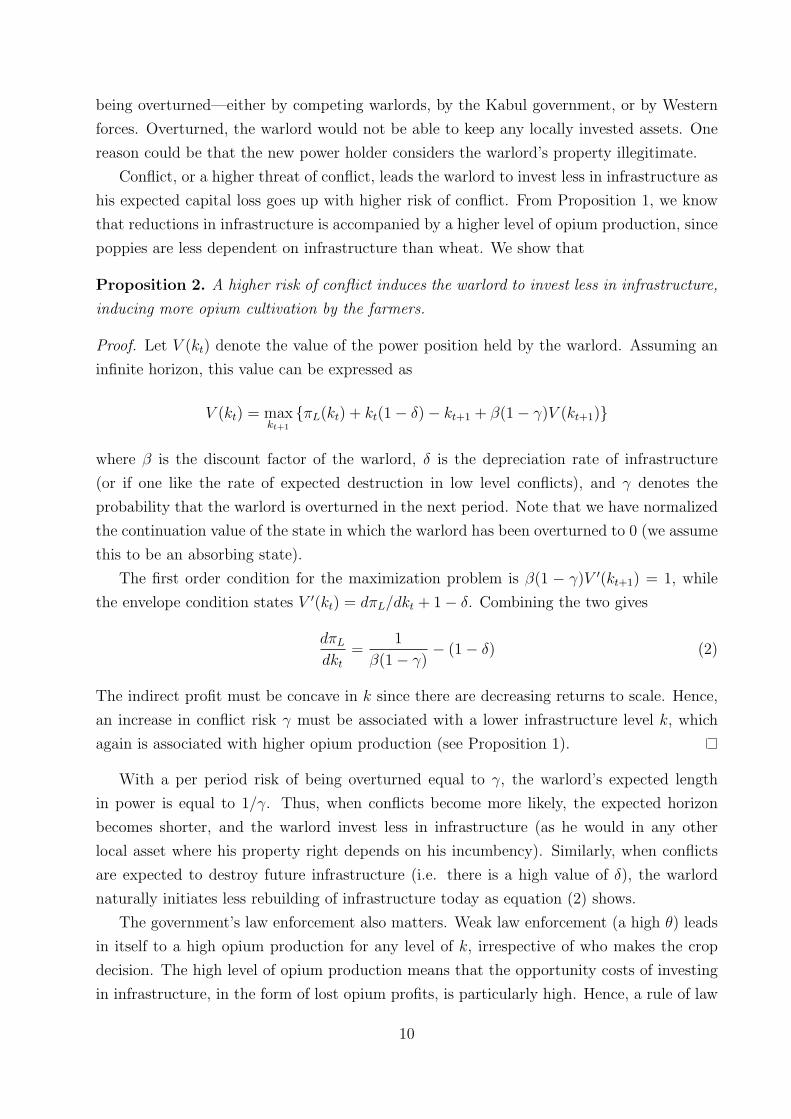
Proposition 2. A higher risk of conflict induces the warlord to invest less in infrastructure,
inducing more opium cultivation by the farmers.
Proof. Let V (kt) denote the value of the power position held by the warlord. Assuming an
infinite horizon, this value can be expressed as
V (kt) = maxkt+1
{πL(kt) + kt(1− δ)− kt+1 + β(1− γ)V (kt+1)}
where β is the discount factor of the warlord, δ is the depreciation rate of infrastructure
(or if one like the rate of expected destruction in low level conflicts), and γ denotes the
probability that the warlord is overturned in the next period. Note that we have normalized
the continuation value of the state in which the warlord has been overturned to 0 (we assume
this to be an absorbing state).
The first order condition for the maximization problem is β(1 − γ)V ′(kt+1) = 1, while
the envelope condition states V ′(kt) = dπL/dkt + 1− δ. Combining the two gives
dπL
dkt
=1
β(1− γ)− (1− δ) (2)
The indirect profit must be concave in k since there are decreasing returns to scale. Hence,
an increase in conflict risk γ must be associated with a lower infrastructure level k, which
again is associated with higher opium production (see Proposition 1).
With a per period risk of being overturned equal to γ, the warlord’s expected length
in power is equal to 1/γ. Thus, when conflicts become more likely, the expected horizon
becomes shorter, and the warlord invest less in infrastructure (as he would in any other
local asset where his property right depends on his incumbency). Similarly, when conflicts
are expected to destroy future infrastructure (i.e. there is a high value of δ), the warlord
naturally initiates less rebuilding of infrastructure today as equation (2) shows.
The government’s law enforcement also matters. Weak law enforcement (a high θ) leads
in itself to a high opium production for any level of k, irrespective of who makes the crop
decision. The high level of opium production means that the opportunity costs of investing
in infrastructure, in the form of lost opium profits, is particularly high. Hence, a rule of law
10
that is weak against illicit opium production induces the warlord to invest less in assets that
basically benefit legal activities.
Finally, the power over what crop to plant can have a strong influence on infrastructure
investments as well. Maybe surprisingly, an all-powerful warlord—who determines both the
allocation of labor between wheat and opium, and the investments in infrastructure—is likely
to invest more in infrastructure than a less powerful warlord who does not determine the
allocation of labor. This can be seen by writing out the left hand side of (2) to obtain
dπL
dk= (1− α)Fk + θ(P − p)Gk + [θ(P − p)GL − (1− α)FL]
dn
dk(3)
When the warlord determines n, the term in square brackets is equal to zero. When the
farmer determines n (which, as stated, seems to be the case in almost 90 per cent of the
cases), the first order condition (1) for the determination of n, implies that
[θ(P − p)GL − (1− α)FL] = θ(P − p
α
)GL (4)
The effective relative price of opium to wheat is θ(P − p)/(1− α) to the warlord and θP/α
to the farmer. As long as θ(P − p)/(1 − α) > θP/α (the most interesting case), P > p/α,
and the expression in (4) is positive. Hence, in this case we see from (3) that dπL/dk is lower
(since dn/dk < 0) when the farmer determines n than when the warlord is all powerful.
The intuition is that when the farmer has power to decide on n (and when P > p/α), the
warlord must create bad opportunities for wheat production in order to induce the farmer
to choose opium. Hence, strong underdevelopment and high opium production go together
as the warlord would like to allocate more labor to opium production than the farmer would
choose himself. Again this effect is strongest when θ is high and thus the government’s law
enforcement is weak.
4 Conflict-induced opium: the magnitudes
In our model a conflict has two important properties linking it to subsequent opium produc-
tion: destruction of infrastructures k and higher political risks γ. Our proxy for these are
Western soldiers observed dying in hostile combats. These three characteristics are jointly
observed in most battles. For instance, on the twelfth day of Operation Medusa, NATO’s
largest offensive in Afghanistan, The Times reports that
“Heavy gates to walled compounds were blown open, a warren of Taleban tunnels
and bunkers were destroyed by explosives and grenades were thrown into wells
and fired through doors [. . . ] But it is gruelling, dangerous work. At least 20
Nato troops have been killed in the battle, and [. . . ] Nato claimed to be in control
11
of only 65 per cent of the Panjawyi area”. (The Times, 2006)
Under such conditions law and order easily decline. More destruction, higher political risk,
and declining law enforcement are complementary factors in the explanation of conflict-
induced opium production. As indicated above, however, we have no reason to rule out
a link from opium to conflicts. Yet, the novelty of our paper is conflict-induced opium
production and our efforts are particularly oriented toward demonstrating this empirically.
Clearly, this also indicates that we have to confront some endogeneity problems.
4.1 Data and empirical strategy
To be able to test the mechanism, we need exogenous variation in conflict. There is no data
on the direct amount of fighting available. One approach could be to use the number of
combat activities by year, but data on such events are scarce and mostly based on media
coverage. Also, these data have not been coded so far. More importantly, basing our
empirical studies on data like these would lead us into severe endogeneity issues, as all internal
power struggles between different warlords and traders over future opium production would
lead us to conclude that fighting causes opium production, although in this case the causality
would go the other way around. Instead, we base our measure of conflict on casualties from
hostile encounters involving Western ISAF forces or US forces in the Operation Enduring
Freedom. Afghani casualties are not available, but Western casualties are. The placement of
Western forces is arguably more exogenous relative to opium production than more general
data on where fighting occurs.
Western ISAF forces do not involve themselves in fighting related to opium production,
as they make clear on their web site:
“While supporting the Afghan government counter-narcotics programmes is an
ISAF key supporting task, ISAF is not directly involved in poppy eradication, nor
does it participate in the destruction of processing facilities, or in any military
action against narcotic producers”9,
and in their description of their mandate:
“ISAF aims at: [. . . ] provide support to the Afghan government and internationally-
sanctioned counter-narcotics efforts through intelligence-sharing and the conduct
of an efficient public information campaign, as well as support to the Afghan Na-
tional Army Forces conducting counter-narcotics operations. ISAF, however, is
not directly involved in the poppy eradication or destruction of processing facil-
ities, or in taking military action against narcotic producers”.10
9http://www.nato.int/isaf/topics/recon dev/cn.html, accessed on Aug. 28, 200810http://www.nato.int/isaf/topics/mandate/index.html, accessed on Aug. 28, 2008.
12
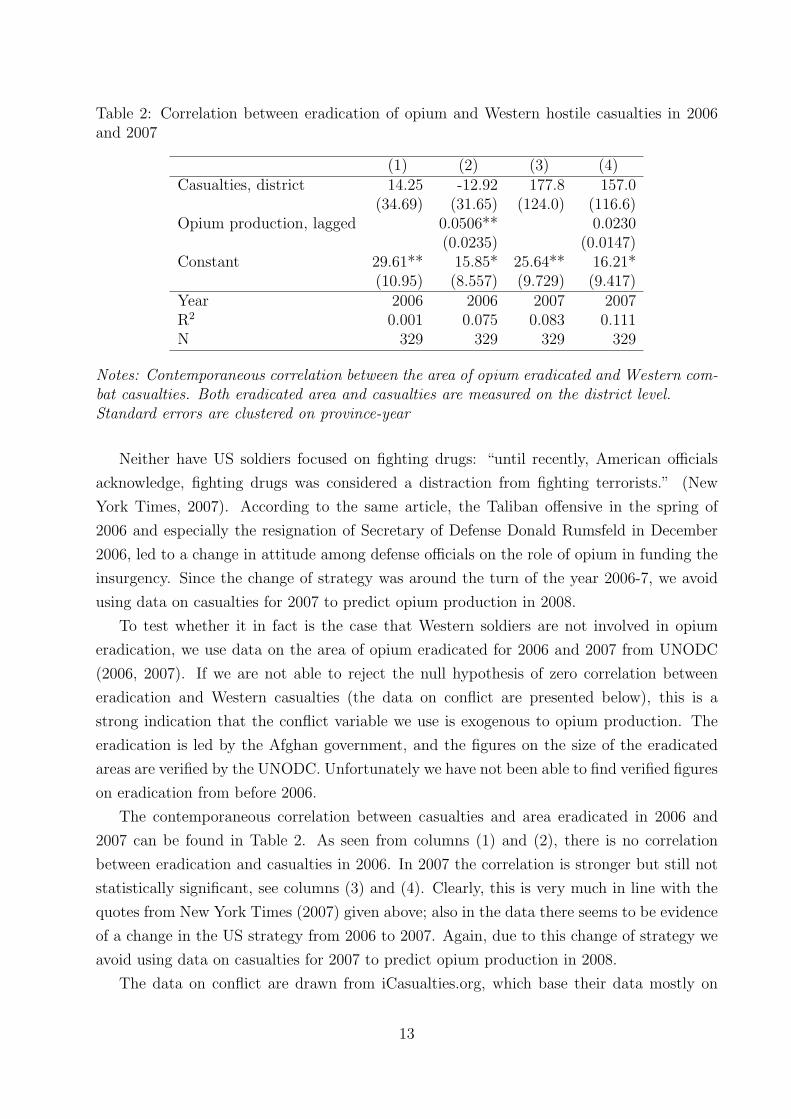
Table 2: Correlation between eradication of opium and Western hostile casualties in 2006and 2007
(1) (2) (3) (4)Casualties, district 14.25 -12.92 177.8 157.0
(34.69) (31.65) (124.0) (116.6)Opium production, lagged 0.0506** 0.0230
(0.0235) (0.0147)Constant 29.61** 15.85* 25.64** 16.21*
(10.95) (8.557) (9.729) (9.417)Year 2006 2006 2007 2007R2 0.001 0.075 0.083 0.111N 329 329 329 329
Notes: Contemporaneous correlation between the area of opium eradicated and Western com-bat casualties. Both eradicated area and casualties are measured on the district level.Standard errors are clustered on province-year
Neither have US soldiers focused on fighting drugs: “until recently, American officials
acknowledge, fighting drugs was considered a distraction from fighting terrorists.” (New
York Times, 2007). According to the same article, the Taliban offensive in the spring of
2006 and especially the resignation of Secretary of Defense Donald Rumsfeld in December
2006, led to a change in attitude among defense officials on the role of opium in funding the
insurgency. Since the change of strategy was around the turn of the year 2006-7, we avoid
using data on casualties for 2007 to predict opium production in 2008.
To test whether it in fact is the case that Western soldiers are not involved in opium
eradication, we use data on the area of opium eradicated for 2006 and 2007 from UNODC
(2006, 2007). If we are not able to reject the null hypothesis of zero correlation between
eradication and Western casualties (the data on conflict are presented below), this is a
strong indication that the conflict variable we use is exogenous to opium production. The
eradication is led by the Afghan government, and the figures on the size of the eradicated
areas are verified by the UNODC. Unfortunately we have not been able to find verified figures
on eradication from before 2006.
The contemporaneous correlation between casualties and area eradicated in 2006 and
2007 can be found in Table 2. As seen from columns (1) and (2), there is no correlation
between eradication and casualties in 2006. In 2007 the correlation is stronger but still not
statistically significant, see columns (3) and (4). Clearly, this is very much in line with the
quotes from New York Times (2007) given above; also in the data there seems to be evidence
of a change in the US strategy from 2006 to 2007. Again, due to this change of strategy we
avoid using data on casualties for 2007 to predict opium production in 2008.
The data on conflict are drawn from iCasualties.org, which base their data mostly on
13
press releases from the US Department of Defense and CENTCOM.11 This database lists
every casualty by name, cause of death, and location. We separate between hostile and
non-hostile casualties, and use the reported location to measure casualties by district. Some
casualties are not reported with a sufficiently precise location to code their district. These
are coded at the province level, so we have somewhat richer data on the province level.
The casualties data are very skewed, mostly since in one encounter there may be several
Western casualties. We have therefore chosen to focus on a dummy for whether there were
casualties or not in a given area.12 The reason for this is twofold. First, as we do not observe
the exact location of death for all the casualties in our data set, focusing on a dummy for
conflict minimizes measurement error if the reporting of the exact location is correlated with
other characteristics of the area where the conflict took place. Second, it is not obvious that
the number of casualties in an area is a good indicator of the seriousness of the conflict in
that area. An illustrating example is a shot-down helicopter. An event like this is likely to
have a large number of casualties, but does the number of casualties indicate that the conflict
is more serious than one in which solders die on the ground while fighting? We think not.
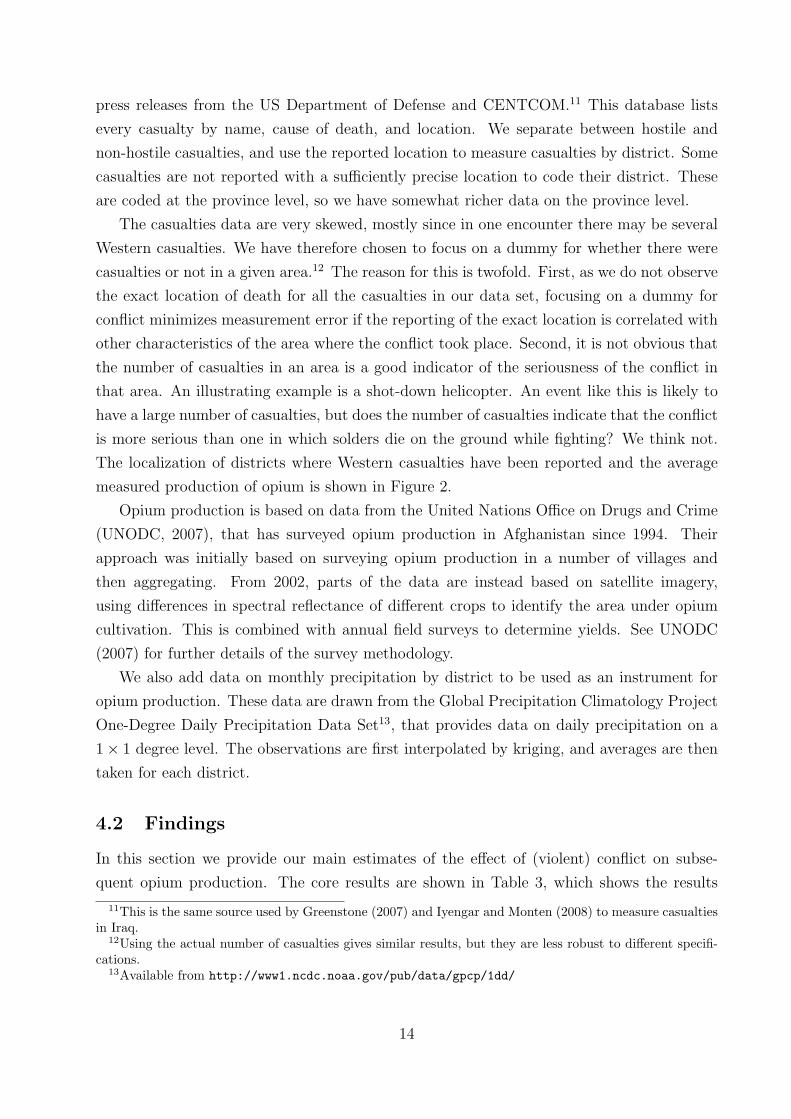
The localization of districts where Western casualties have been reported and the average
measured production of opium is shown in Figure 2.
Opium production is based on data from the United Nations Office on Drugs and Crime
(UNODC, 2007), that has surveyed opium production in Afghanistan since 1994. Their
approach was initially based on surveying opium production in a number of villages and
then aggregating. From 2002, parts of the data are instead based on satellite imagery,
using differences in spectral reflectance of different crops to identify the area under opium
cultivation. This is combined with annual field surveys to determine yields. See UNODC
(2007) for further details of the survey methodology.
We also add data on monthly precipitation by district to be used as an instrument for
opium production. These data are drawn from the Global Precipitation Climatology Project
One-Degree Daily Precipitation Data Set13, that provides data on daily precipitation on a
1× 1 degree level. The observations are first interpolated by kriging, and averages are then
taken for each district.
4.2 Findings
In this section we provide our main estimates of the effect of (violent) conflict on subse-
quent opium production. The core results are shown in Table 3, which shows the results
11This is the same source used by Greenstone (2007) and Iyengar and Monten (2008) to measure casualtiesin Iraq.
12Using the actual number of casualties gives similar results, but they are less robust to different specifi-cations.
13Available from http://www1.ncdc.noaa.gov/pub/data/gpcp/1dd/
14
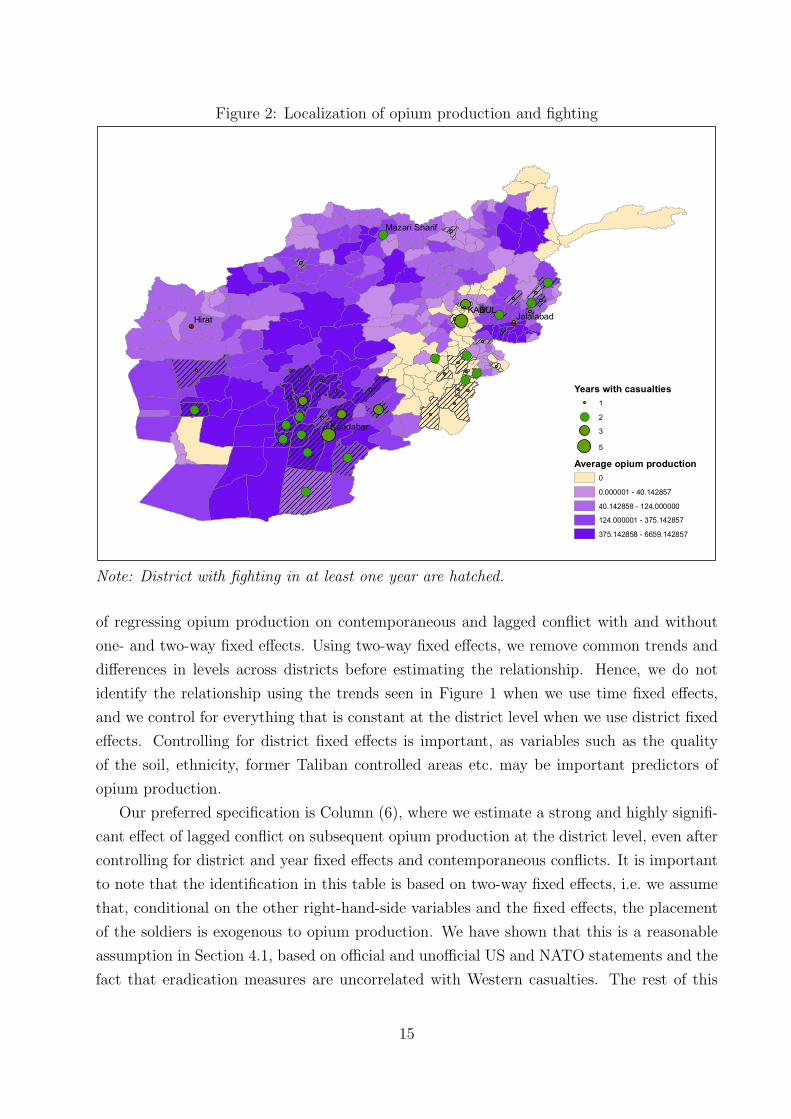
Figure 2: Localization of opium production and fighting
_
!(
!(
!(!(
!(!(
!(!(
!(!(
!(!(
!(!(
!(
!(
HiratKABUL
Kandahar
Jalalabad
Mazari Sharif
Years with casualties1
!( 235
Average opium production00.000001 - 40.14285740.142858 - 124.000000124.000001 - 375.142857375.142858 - 6659.142857
Note: District with fighting in at least one year are hatched.
of regressing opium production on contemporaneous and lagged conflict with and without
one- and two-way fixed effects. Using two-way fixed effects, we remove common trends and
differences in levels across districts before estimating the relationship. Hence, we do not
identify the relationship using the trends seen in Figure 1 when we use time fixed effects,
and we control for everything that is constant at the district level when we use district fixed
effects. Controlling for district fixed effects is important, as variables such as the quality
of the soil, ethnicity, former Taliban controlled areas etc. may be important predictors of
opium production.
Our preferred specification is Column (6), where we estimate a strong and highly signifi-
cant effect of lagged conflict on subsequent opium production at the district level, even after
controlling for district and year fixed effects and contemporaneous conflicts. It is important
to note that the identification in this table is based on two-way fixed effects, i.e. we assume
that, conditional on the other right-hand-side variables and the fixed effects, the placement
of the soldiers is exogenous to opium production. We have shown that this is a reasonable
assumption in Section 4.1, based on official and unofficial US and NATO statements and the
fact that eradication measures are uncorrelated with Western casualties. The rest of this
15
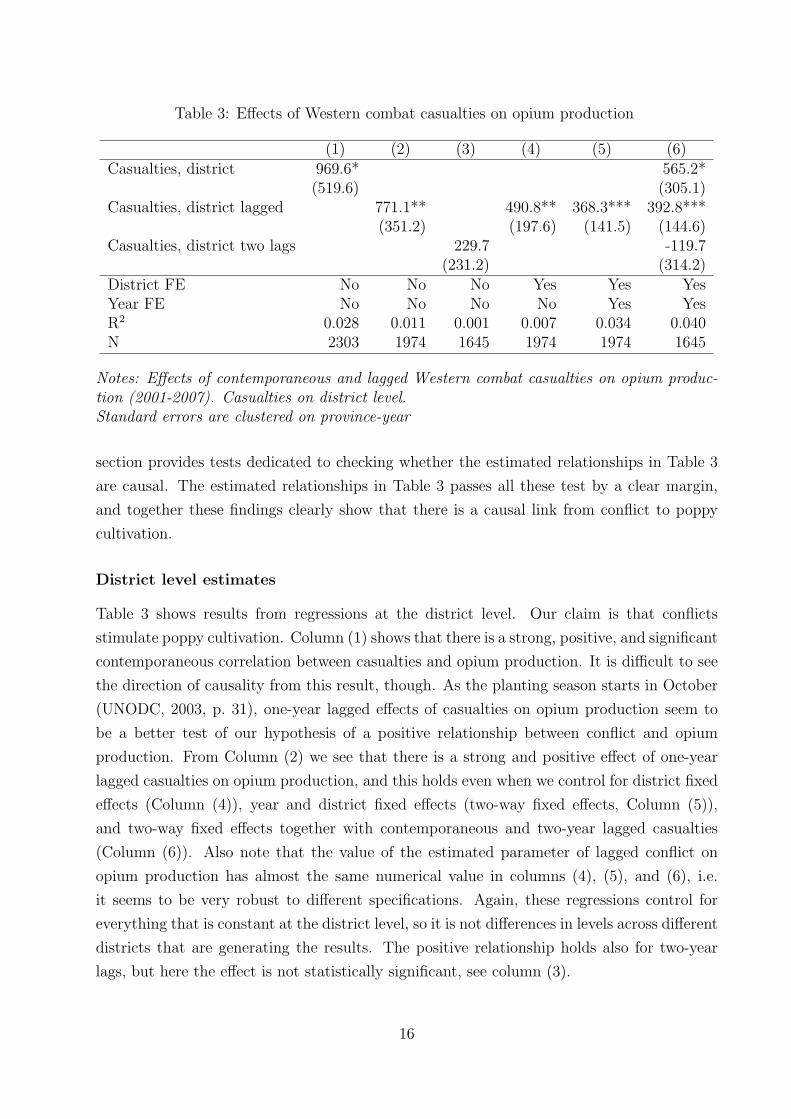
Table 3: Effects of Western combat casualties on opium production
(1) (2) (3) (4) (5) (6)Casualties, district 969.6* 565.2*
(519.6) (305.1)Casualties, district lagged 771.1** 490.8** 368.3*** 392.8***
(351.2) (197.6) (141.5) (144.6)Casualties, district two lags 229.7 -119.7
(231.2) (314.2)District FE No No No Yes Yes YesYear FE No No No No Yes YesR2 0.028 0.011 0.001 0.007 0.034 0.040N 2303 1974 1645 1974 1974 1645
Notes: Effects of contemporaneous and lagged Western combat casualties on opium produc-tion (2001-2007). Casualties on district level.Standard errors are clustered on province-year
section provides tests dedicated to checking whether the estimated relationships in Table 3
are causal. The estimated relationships in Table 3 passes all these test by a clear margin,
and together these findings clearly show that there is a causal link from conflict to poppy
cultivation.
District level estimates
Table 3 shows results from regressions at the district level. Our claim is that conflicts
stimulate poppy cultivation. Column (1) shows that there is a strong, positive, and significant
contemporaneous correlation between casualties and opium production. It is difficult to see
the direction of causality from this result, though. As the planting season starts in October
(UNODC, 2003, p. 31), one-year lagged effects of casualties on opium production seem to
be a better test of our hypothesis of a positive relationship between conflict and opium
production. From Column (2) we see that there is a strong and positive effect of one-year
lagged casualties on opium production, and this holds even when we control for district fixed
effects (Column (4)), year and district fixed effects (two-way fixed effects, Column (5)),
and two-way fixed effects together with contemporaneous and two-year lagged casualties
(Column (6)). Also note that the value of the estimated parameter of lagged conflict on
opium production has almost the same numerical value in columns (4), (5), and (6), i.e.
it seems to be very robust to different specifications. Again, these regressions control for
everything that is constant at the district level, so it is not differences in levels across different
districts that are generating the results. The positive relationship holds also for two-year
lags, but here the effect is not statistically significant, see column (3).
16
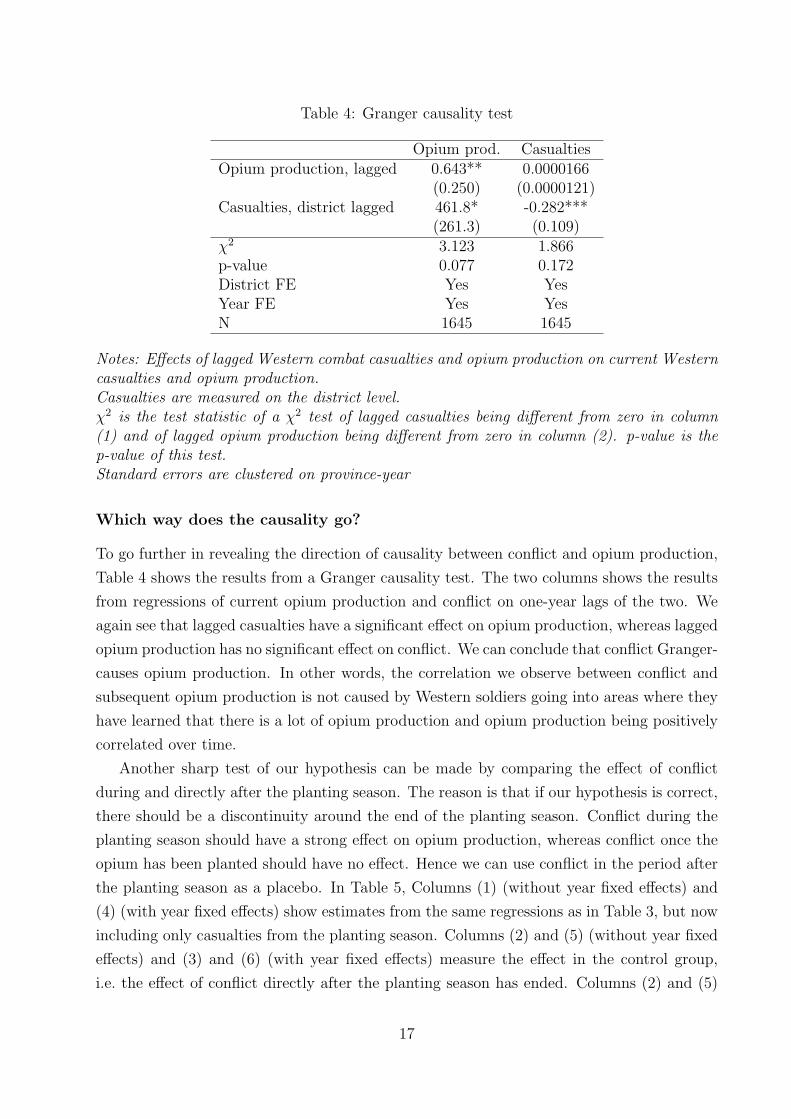
Table 4: Granger causality test
Opium prod. CasualtiesOpium production, lagged 0.643** 0.0000166
(0.250) (0.0000121)Casualties, district lagged 461.8* -0.282***
(261.3) (0.109)χ2 3.123 1.866p-value 0.077 0.172District FE Yes YesYear FE Yes YesN 1645 1645
Notes: Effects of lagged Western combat casualties and opium production on current Westerncasualties and opium production.Casualties are measured on the district level.χ2 is the test statistic of a χ2 test of lagged casualties being different from zero in column(1) and of lagged opium production being different from zero in column (2). p-value is thep-value of this test.Standard errors are clustered on province-year
Which way does the causality go?
To go further in revealing the direction of causality between conflict and opium production,
Table 4 shows the results from a Granger causality test. The two columns shows the results
from regressions of current opium production and conflict on one-year lags of the two. We
again see that lagged casualties have a significant effect on opium production, whereas lagged
opium production has no significant effect on conflict. We can conclude that conflict Granger-
causes opium production. In other words, the correlation we observe between conflict and
subsequent opium production is not caused by Western soldiers going into areas where they
have learned that there is a lot of opium production and opium production being positively
correlated over time.
Another sharp test of our hypothesis can be made by comparing the effect of conflict
during and directly after the planting season. The reason is that if our hypothesis is correct,
there should be a discontinuity around the end of the planting season. Conflict during the
planting season should have a strong effect on opium production, whereas conflict once the
opium has been planted should have no effect. Hence we can use conflict in the period after
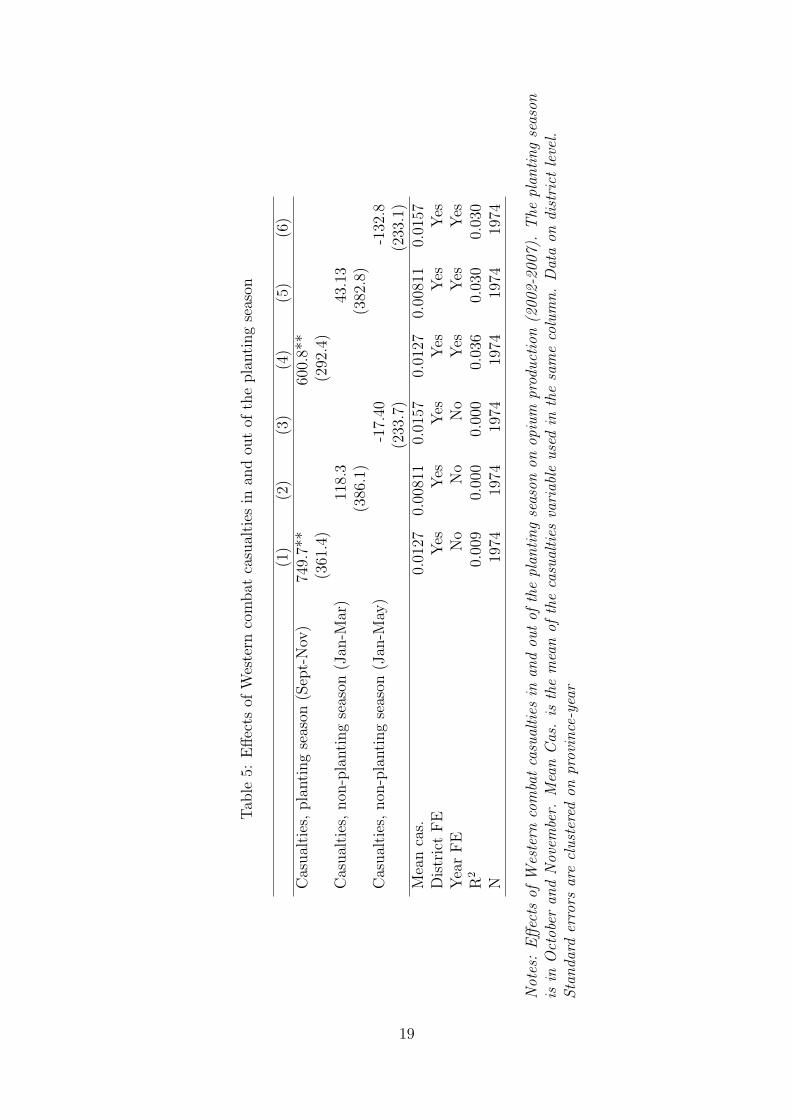
the planting season as a placebo. In Table 5, Columns (1) (without year fixed effects) and
(4) (with year fixed effects) show estimates from the same regressions as in Table 3, but now
including only casualties from the planting season. Columns (2) and (5) (without year fixed
effects) and (3) and (6) (with year fixed effects) measure the effect in the control group,
i.e. the effect of conflict directly after the planting season has ended. Columns (2) and (5)
17
include casualties from a period equally long as the planting season variable. There is less
conflict in this period than in September to November; the mean of the conflict variables
is reported at the bottom of the table. Therefore, we also try the same experiment using a
control period that contains approximately the same level of conflict, shown in Columns (3)
and (6). From the Table we see that there is a sharp difference in the estimated effect of
conflict on opium production in the planting season relative to directly after, the estimated
effect in the planting season is strongly significant and in numerical value somewhat above
what we found in Table 3. The effect of casualties directly after the planting season is much
smaller in numerical value, and it is far from significant.
Where is the effect strongest?
Our mechanism should be stronger in areas in which the government has less control and
where it is easier to extract opium profits, i.e. areas in which governmental law enforcement
is weak. This can be viewed as a combination of bad institutions and “lootable” resource
rents, emphasized as a special bad case in the resource curse literature (Mehlum, Moene,
and Torvik, 2006). In our context, bad institutions mean weak law enforcement and policing
efforts.
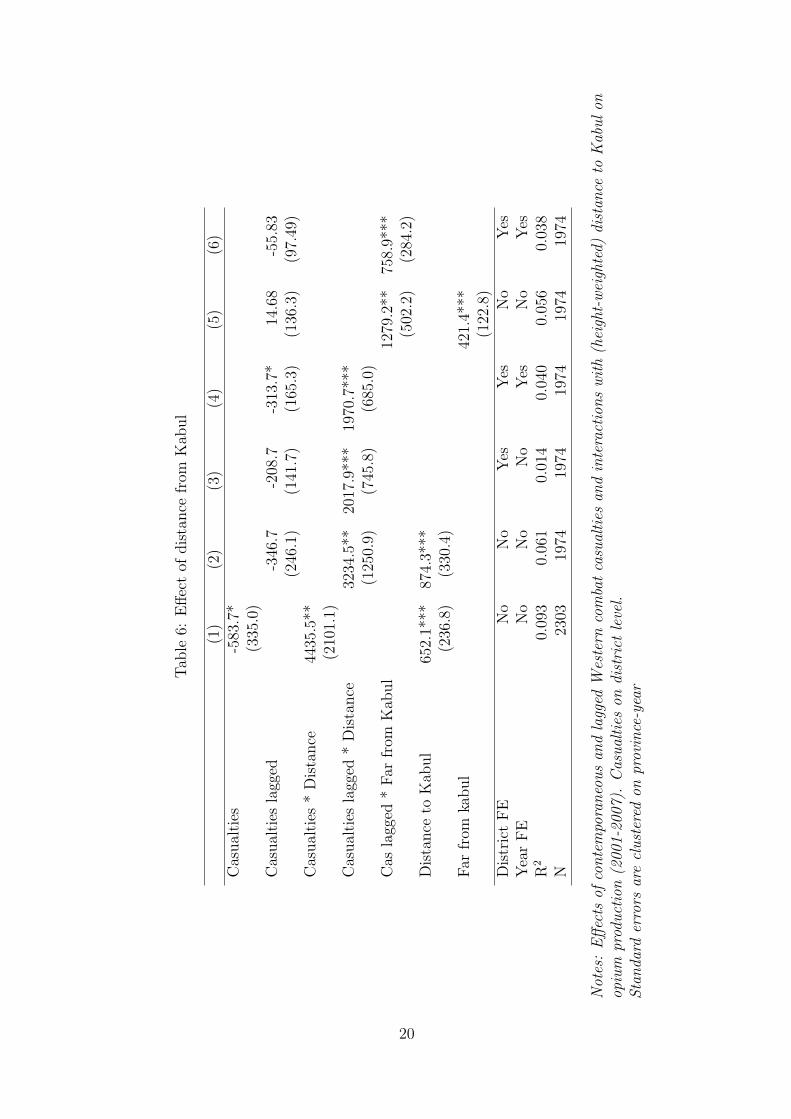
To study this, we proxy bad institutions with (altitude-weighted) distance to Kabul. Law
enforcement is clearly best in Kabul, the area in which the government has full control, and
is declining in the distance from the capital. In Table 6 we study the interaction of fighting
with the distance to Kabul. The effect of casualties is stronger further away from Kabul.
With an even split between the half of the districts closest to and furthest away from Kabul,
only the furthest half shows any relationship between fighting and opium production. That
conflicts stimulate opium production in areas in which the law enforcement is weak, is clearly
in line with our theory.
Conflict or just the presence of Western soldiers?
One objection that could be raised to the results reported above is that Western casualties
in a district may be a measure of the presence of Western soldiers rather than the occurrence
of fighting. One mechanism that could generate the positive correlation in Table 3 could be
the following: when Western forces have control over an area, it is easier to smuggle drugs
out since these forces have an explicit policy of not intervening in drugs trade (see quotes
above). To control for this, we separate between the effects of hostile and non-hostile Western
casualties. Non-hostile casualties are events such as car accidents or illness, and indicates
the presence of Western soldiers in a district without indicating occurrences of fighting.
Table 7 reports the results from this analysis. The coefficients on hostile casualties are
about the same as in Table 3. The coefficients on non-hostile casualties are negative or
18
Tab
le5:
Effec
tsof
Wes
tern
com
bat
casu
alties
inan
dou
tof
the
pla
nti
ng
seas
on
(1)
(2)
(3)
(4)
(5)
(6)
Cas
ual
ties
,pla
nti
ng
seas
on(S
ept-
Nov
)74
9.7*
*60
0.8*
*(3
61.4
)(2
92.4
)C
asual
ties
,non
-pla
nti
ng
seas
on(J
an-M
ar)
118.
343
.13
(386
.1)
(382
.8)
Cas
ual
ties
,non
-pla
nti
ng
seas
on(J
an-M
ay)
-17.
40-1
32.8
(233
.7)
(233
.1)
Mea
nca
s.0.
0127
0.00
811
0.01
570.
0127
0.00
811
0.01
57D
istr
ict
FE
Yes
Yes
Yes
Yes
Yes
Yes
Yea
rFE
No
No
No
Yes
Yes
Yes
R2
0.00
90.
000
0.00
00.
036
0.03
00.
030
N19
7419
7419
7419
7419
7419
74
Not
es:
Effec
tsofW
este
rnco
mba
tca
sual
ties
inan
dou
tof
the
plan
ting
seas
onon
opiu
mpr
oduct
ion
(200
2-20
07).
The
plan
ting
seas
onis
inO
ctob
eran
dN
ovem
ber.
Mea
nCas
.is
the
mea
nof
the
casu
alties
vari
able
use
din
the
sam
eco
lum
n.
Dat
aon
dist
rict
leve
l.Sta
nda
rder
rors
are
clust
ered
onpr
ovin
ce-y
ear
19
Tab
le6:
Effec
tof
dis
tance
from
Kab
ul
(1)
(2)
(3)
(4)
(5)
(6)
Cas
ual
ties
-583
.7*
(335
.0)
Cas
ual
ties
lagg
ed-3
46.7
-208
.7-3
13.7
*14
.68
-55.
83(2
46.1
)(1
41.7
)(1
65.3
)(1
36.3
)(9
7.49
)C
asual
ties
*D
ista
nce
4435
.5**
(210
1.1)
Cas
ual
ties
lagg
ed*
Dis
tance
3234
.5**
2017
.9**
*19
70.7
***
(125
0.9)
(745
.8)
(685
.0)
Cas
lagg
ed*
Far
from
Kab
ul
1279
.2**
758.
9***
(502
.2)
(284
.2)
Dis
tance
toK
abul
652.
1***
874.
3***
(236
.8)
(330
.4)
Far
from
kabul
421.
4***
(122
.8)
Dis
tric
tFE
No
No
Yes
Yes
No
Yes
Yea
rFE
No
No
No
Yes
No
Yes
R2
0.09
30.
061
0.01
40.
040
0.05
60.
038
N23
0319
7419
7419
7419
7419
74
Not
es:
Effec
tsof
conte
mpo
raneo
us
and
lagg
edW
este
rnco
mba
tca
sual
ties
and
inte
ract
ions
with
(hei
ght-wei
ghte
d)di
stan
ceto
Kab
ulon
opiu
mpr
oduct
ion
(200
1-20
07).
Cas
ual
ties
ondi
stri
ctleve
l.Sta
nda
rder
rors
are
clust
ered
onpr
ovin
ce-y
ear
20
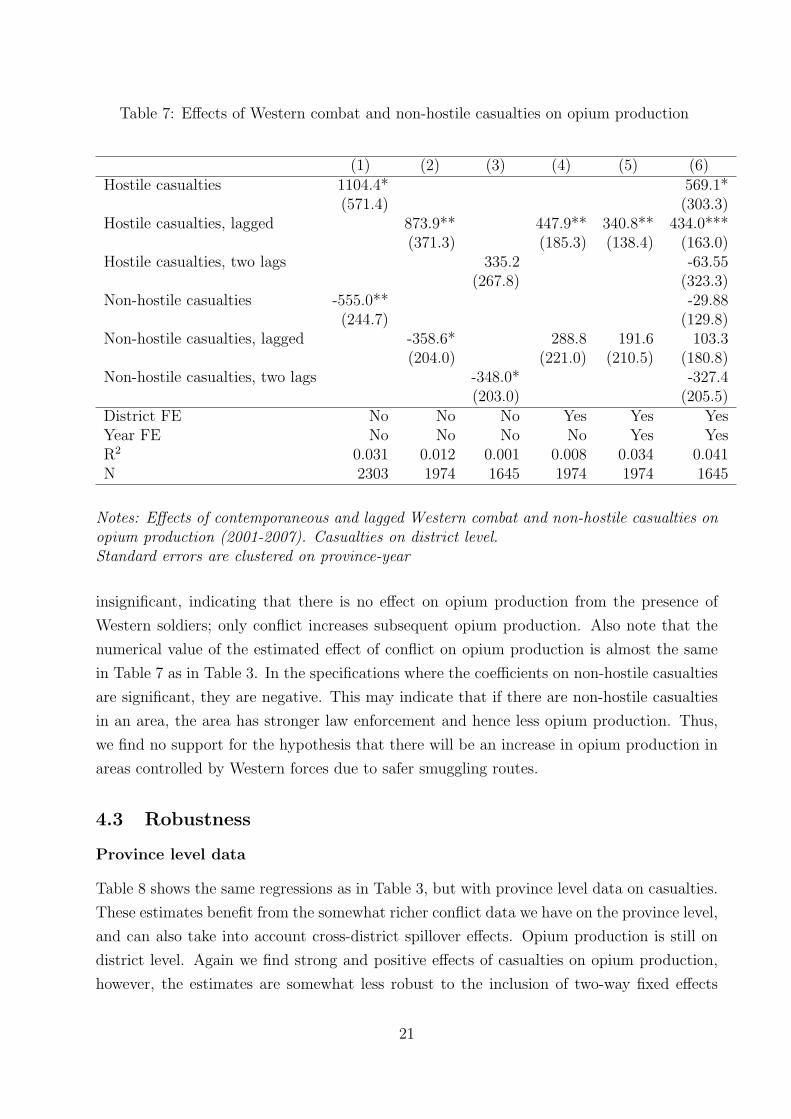
Table 7: Effects of Western combat and non-hostile casualties on opium production
(1) (2) (3) (4) (5) (6)Hostile casualties 1104.4* 569.1*
(571.4) (303.3)Hostile casualties, lagged 873.9** 447.9** 340.8** 434.0***
(371.3) (185.3) (138.4) (163.0)Hostile casualties, two lags 335.2 -63.55
(267.8) (323.3)Non-hostile casualties -555.0** -29.88
(244.7) (129.8)Non-hostile casualties, lagged -358.6* 288.8 191.6 103.3
(204.0) (221.0) (210.5) (180.8)Non-hostile casualties, two lags -348.0* -327.4
(203.0) (205.5)District FE No No No Yes Yes YesYear FE No No No No Yes YesR2 0.031 0.012 0.001 0.008 0.034 0.041N 2303 1974 1645 1974 1974 1645
Notes: Effects of contemporaneous and lagged Western combat and non-hostile casualties onopium production (2001-2007). Casualties on district level.Standard errors are clustered on province-year
insignificant, indicating that there is no effect on opium production from the presence of
Western soldiers; only conflict increases subsequent opium production. Also note that the
numerical value of the estimated effect of conflict on opium production is almost the same
in Table 7 as in Table 3. In the specifications where the coefficients on non-hostile casualties
are significant, they are negative. This may indicate that if there are non-hostile casualties
in an area, the area has stronger law enforcement and hence less opium production. Thus,
we find no support for the hypothesis that there will be an increase in opium production in
areas controlled by Western forces due to safer smuggling routes.
4.3 Robustness
Province level data
Table 8 shows the same regressions as in Table 3, but with province level data on casualties.
These estimates benefit from the somewhat richer conflict data we have on the province level,
and can also take into account cross-district spillover effects. Opium production is still on
district level. Again we find strong and positive effects of casualties on opium production,
however, the estimates are somewhat less robust to the inclusion of two-way fixed effects
21
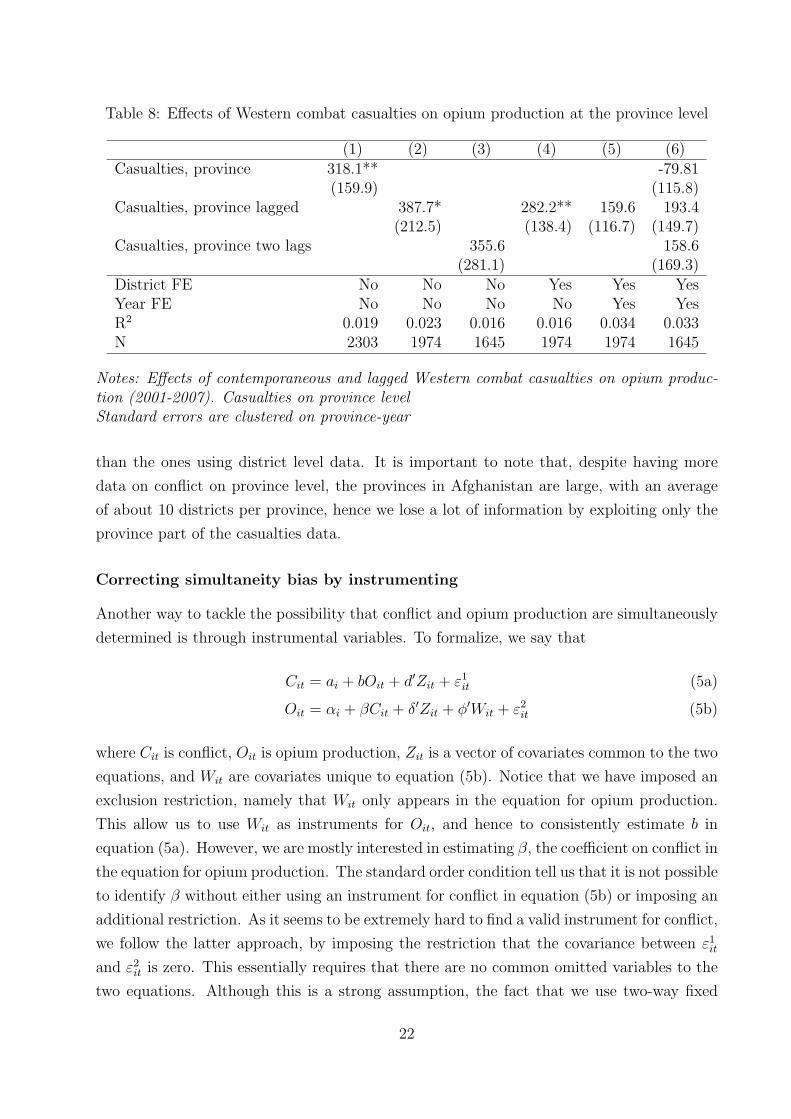
Table 8: Effects of Western combat casualties on opium production at the province level
(1) (2) (3) (4) (5) (6)Casualties, province 318.1** -79.81
(159.9) (115.8)Casualties, province lagged 387.7* 282.2** 159.6 193.4
(212.5) (138.4) (116.7) (149.7)Casualties, province two lags 355.6 158.6
(281.1) (169.3)District FE No No No Yes Yes YesYear FE No No No No Yes YesR2 0.019 0.023 0.016 0.016 0.034 0.033N 2303 1974 1645 1974 1974 1645
Notes: Effects of contemporaneous and lagged Western combat casualties on opium produc-tion (2001-2007). Casualties on province levelStandard errors are clustered on province-year
than the ones using district level data. It is important to note that, despite having more
data on conflict on province level, the provinces in Afghanistan are large, with an average
of about 10 districts per province, hence we lose a lot of information by exploiting only the
province part of the casualties data.
Correcting simultaneity bias by instrumenting
Another way to tackle the possibility that conflict and opium production are simultaneously
determined is through instrumental variables. To formalize, we say that
Cit = ai + bOit + d′Zit + ε1it (5a)
Oit = αi + βCit + δ′Zit + φ′Wit + ε2it (5b)
where Cit is conflict, Oit is opium production, Zit is a vector of covariates common to the two
equations, and Wit are covariates unique to equation (5b). Notice that we have imposed an
exclusion restriction, namely that Wit only appears in the equation for opium production.
This allow us to use Wit as instruments for Oit, and hence to consistently estimate b in
equation (5a). However, we are mostly interested in estimating β, the coefficient on conflict in
the equation for opium production. The standard order condition tell us that it is not possible
to identify β without either using an instrument for conflict in equation (5b) or imposing an
additional restriction. As it seems to be extremely hard to find a valid instrument for conflict,
we follow the latter approach, by imposing the restriction that the covariance between ε1it
and ε2it is zero. This essentially requires that there are no common omitted variables to the
two equations. Although this is a strong assumption, the fact that we use two-way fixed
22
effects reduces the problem considerably. Under this restriction, Hausman and Taylor (1983)
have shown that a valid instrument for Cit in equation (5b) is the estimated residuals ε1it
obtained from a 2SLS regression on equation (5a) with Wit as instruments for opium. Due
to the restriction on the covariance matrix of the errors, ε1it will be correlated with Cit (from
equation (5a)), but will be uncorrelated with ε2it, i.e. ε1
it satisfies the standard conditions for
being a valid instrumental variable.
A common instrument for agricultural production is deviation from trend in rainfall (see
among others Miguel, Satyanath, and Sergenti, 2004; Paxson, 1992). Even though opium is
more drought-resistant than wheat, poppy cultivation, as with the cultivation of all other
crops, requires some water during the growth cycle (Kapoor, 1995, Ch. 4). Therefore,
rainfall is likely to be correlated with opium production. Furthermore, it seems unlikely
that rainfall should have any direct impact on western hostile casualties, making it a valid
instrument. The reason for making the last claim is that conflict is here measured as a
dummy for whether there have been hostile casualties in a district on a yearly basis. Even
though deviations from normal rainfall such as snow storms may influence the timing of the
Western forces’ operations somewhat, it seems unlikely that this should have any effect on
whether the operations are implemented or not. Thus, it seems unlikely that rainfall affects
conflict directly in our setting.
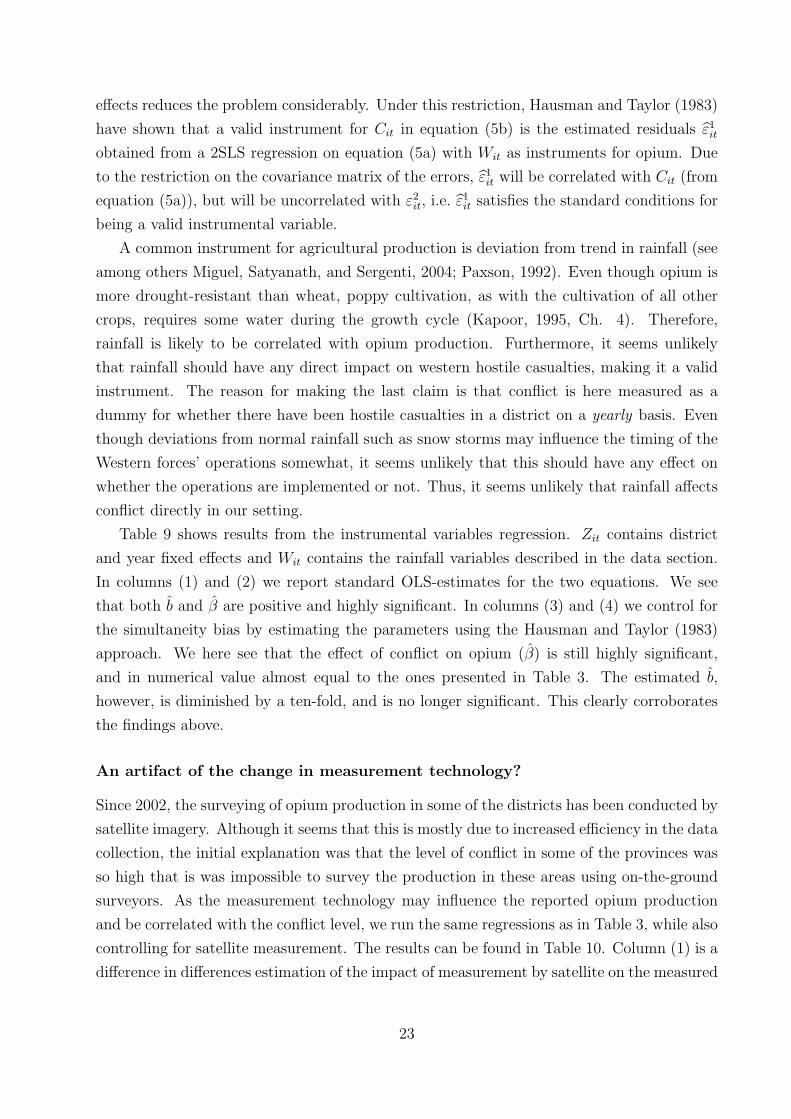
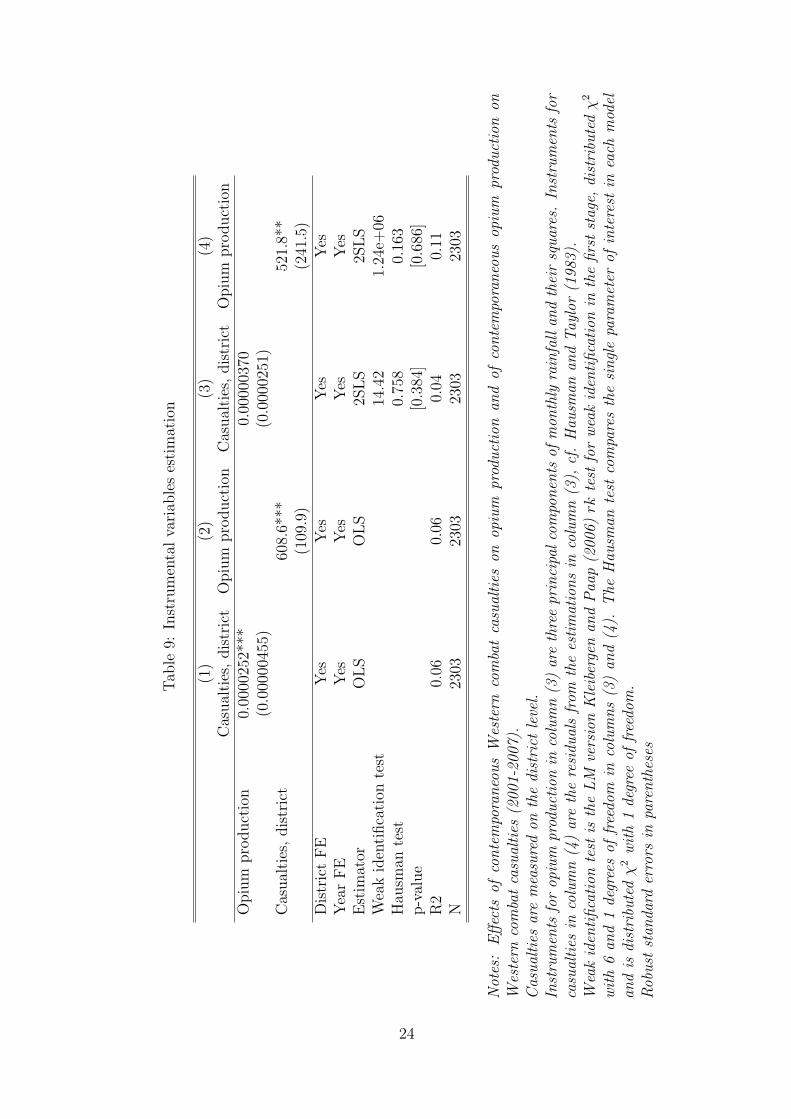
Table 9 shows results from the instrumental variables regression. Zit contains district
and year fixed effects and Wit contains the rainfall variables described in the data section.
In columns (1) and (2) we report standard OLS-estimates for the two equations. We see
that both b and β are positive and highly significant. In columns (3) and (4) we control for
the simultaneity bias by estimating the parameters using the Hausman and Taylor (1983)
approach. We here see that the effect of conflict on opium (β) is still highly significant,
and in numerical value almost equal to the ones presented in Table 3. The estimated b,
however, is diminished by a ten-fold, and is no longer significant. This clearly corroborates
the findings above.
An artifact of the change in measurement technology?
Since 2002, the surveying of opium production in some of the districts has been conducted by
satellite imagery. Although it seems that this is mostly due to increased efficiency in the data
collection, the initial explanation was that the level of conflict in some of the provinces was
so high that is was impossible to survey the production in these areas using on-the-ground
surveyors. As the measurement technology may influence the reported opium production
and be correlated with the conflict level, we run the same regressions as in Table 3, while also
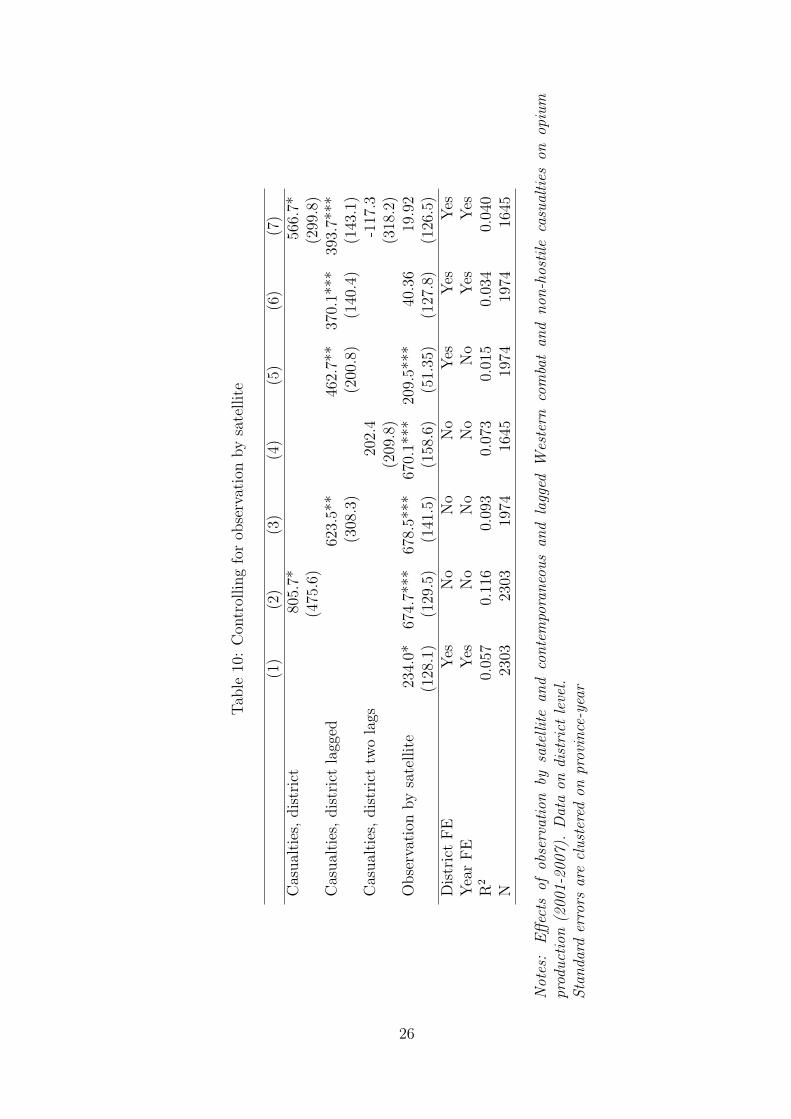
controlling for satellite measurement. The results can be found in Table 10. Column (1) is a
difference in differences estimation of the impact of measurement by satellite on the measured
23
Tab
le9:
Inst
rum
enta
lva
riab
les
estim
atio
n
(1)
(2)
(3)
(4)
Cas
ual
ties
,dis
tric
tO
piu
mpro
duct
ion
Cas
ual
ties
,dis
tric
tO
piu
mpro
duct
ion
Opiu
mpro
duct
ion
0.00
0025
2***
0.00
0003
70(0
.000
0045
5)(0
.000
0251
)C
asual
ties
,dis
tric
t60
8.6*
**52
1.8*
*(1
09.9
)(2
41.5
)D
istr
ict
FE
Yes
Yes
Yes
Yes
Yea
rFE
Yes
Yes
Yes
Yes
Est
imat
orO
LS
OLS
2SLS
2SLS
Wea
kid
enti
fica
tion
test
14.4
21.
24e+
06H
ausm
ante
st0.
758
0.16
3p-v
alue
[0.3
84]
[0.6
86]
R2
0.06
0.06
0.04
0.11
N23
0323
0323
0323
03
Not
es:
Effec
tsof
conte
mpo
raneo
us
Wes
tern
com
bat
casu
alties
onop
ium
prod
uct
ion
and
ofco
nte
mpo
raneo
us
opiu
mpr
oduct
ion
onW
este
rnco
mba
tca
sual
ties
(200
1-20
07).
Cas
ual
ties
are
mea
sure
don
the
dist
rict
leve
l.In
stru
men
tsfo
rop
ium
prod
uct
ion
inco
lum
n(3
)ar
eth
ree
prin
cipa
lco
mpo
nen
tsof
mon
thly
rain
fall
and
thei
rsq
uar
es.
Inst
rum
ents
for
casu
alties
inco
lum
n(4
)ar
eth
ere
sidu
als
from
the
estim
atio
ns
inco
lum
n(3
),cf
.H
ausm
anan
dTay
lor
(198
3).
Wea
kid
entifica
tion
test
isth
eLM
vers
ion
Kleiber
gen
and
Paa
p(2
006)
rkte
stfo
rwea
kid
entifica
tion
inth
efirs
tst
age,
dist
ribu
ted
χ2
with
6an
d1
degr
ees
offree
dom
inco
lum
ns
(3)
and
(4).
The
Hau
sman
test
com
pare
sth
esingle
para
met
erof
inte
rest
inea
chm
odel
and
isdi
stri
bute
dχ
2with
1de
gree
offree
dom
.Rob
ust
stan
dard
erro
rsin
pare
nth
eses
24
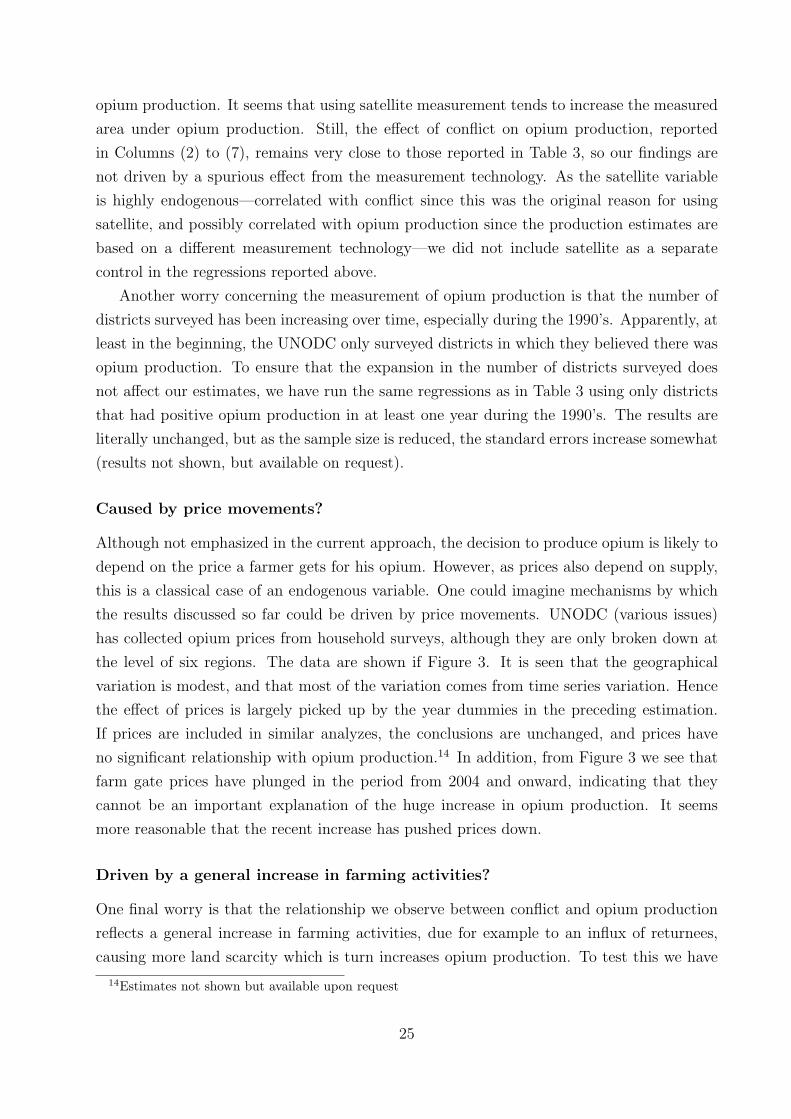
opium production. It seems that using satellite measurement tends to increase the measured
area under opium production. Still, the effect of conflict on opium production, reported
in Columns (2) to (7), remains very close to those reported in Table 3, so our findings are
not driven by a spurious effect from the measurement technology. As the satellite variable
is highly endogenous—correlated with conflict since this was the original reason for using
satellite, and possibly correlated with opium production since the production estimates are
based on a different measurement technology—we did not include satellite as a separate
control in the regressions reported above.
Another worry concerning the measurement of opium production is that the number of
districts surveyed has been increasing over time, especially during the 1990’s. Apparently, at
least in the beginning, the UNODC only surveyed districts in which they believed there was
opium production. To ensure that the expansion in the number of districts surveyed does
not affect our estimates, we have run the same regressions as in Table 3 using only districts
that had positive opium production in at least one year during the 1990’s. The results are
literally unchanged, but as the sample size is reduced, the standard errors increase somewhat
(results not shown, but available on request).
Caused by price movements?
Although not emphasized in the current approach, the decision to produce opium is likely to
depend on the price a farmer gets for his opium. However, as prices also depend on supply,
this is a classical case of an endogenous variable. One could imagine mechanisms by which
the results discussed so far could be driven by price movements. UNODC (various issues)
has collected opium prices from household surveys, although they are only broken down at
the level of six regions. The data are shown if Figure 3. It is seen that the geographical
variation is modest, and that most of the variation comes from time series variation. Hence
the effect of prices is largely picked up by the year dummies in the preceding estimation.
If prices are included in similar analyzes, the conclusions are unchanged, and prices have
no significant relationship with opium production.14 In addition, from Figure 3 we see that
farm gate prices have plunged in the period from 2004 and onward, indicating that they
cannot be an important explanation of the huge increase in opium production. It seems
more reasonable that the recent increase has pushed prices down.
Driven by a general increase in farming activities?
One final worry is that the relationship we observe between conflict and opium production
reflects a general increase in farming activities, due for example to an influx of returnees,
causing more land scarcity which is turn increases opium production. To test this we have
14Estimates not shown but available upon request
25
Tab
le10
:C
ontr
olling
for
obse
rvat
ion
by
sate
llit
e
(1)
(2)
(3)
(4)
(5)
(6)
(7)
Cas
ual
ties
,dis
tric
t80
5.7*
566.
7*(4
75.6
)(2
99.8
)C
asual
ties
,dis
tric
tla
gged
623.
5**
462.
7**
370.
1***
393.
7***
(308
.3)
(200
.8)
(140
.4)
(143
.1)
Cas
ual
ties
,dis
tric
ttw
ola
gs20
2.4
-117
.3(2
09.8
)(3
18.2
)O
bse
rvat
ion
by
sate
llit
e23
4.0*
674.
7***
678.
5***
670.
1***
209.
5***
40.3
619
.92
(128
.1)
(129
.5)
(141
.5)
(158
.6)
(51.
35)
(127
.8)
(126
.5)
Dis
tric
tFE
Yes
No
No
No
Yes
Yes
Yes
Yea
rFE
Yes
No
No
No
No
Yes
Yes
R2
0.05
70.
116
0.09
30.
073
0.01
50.
034
0.04
0N
2303
2303
1974
1645
1974
1974
1645
Not
es:
Effec
tsof
obse
rvat
ion
bysa
tellite
and
conte
mpo
raneo
us
and
lagg
edW
este
rnco
mba
tan
dnon
-hos
tile
casu
alties
onop
ium
prod
uct
ion
(200
1-20
07).
Dat
aon
dist
rict
leve
l.Sta
nda
rder
rors
are
clust
ered
onpr
ovin
ce-y
ear
26
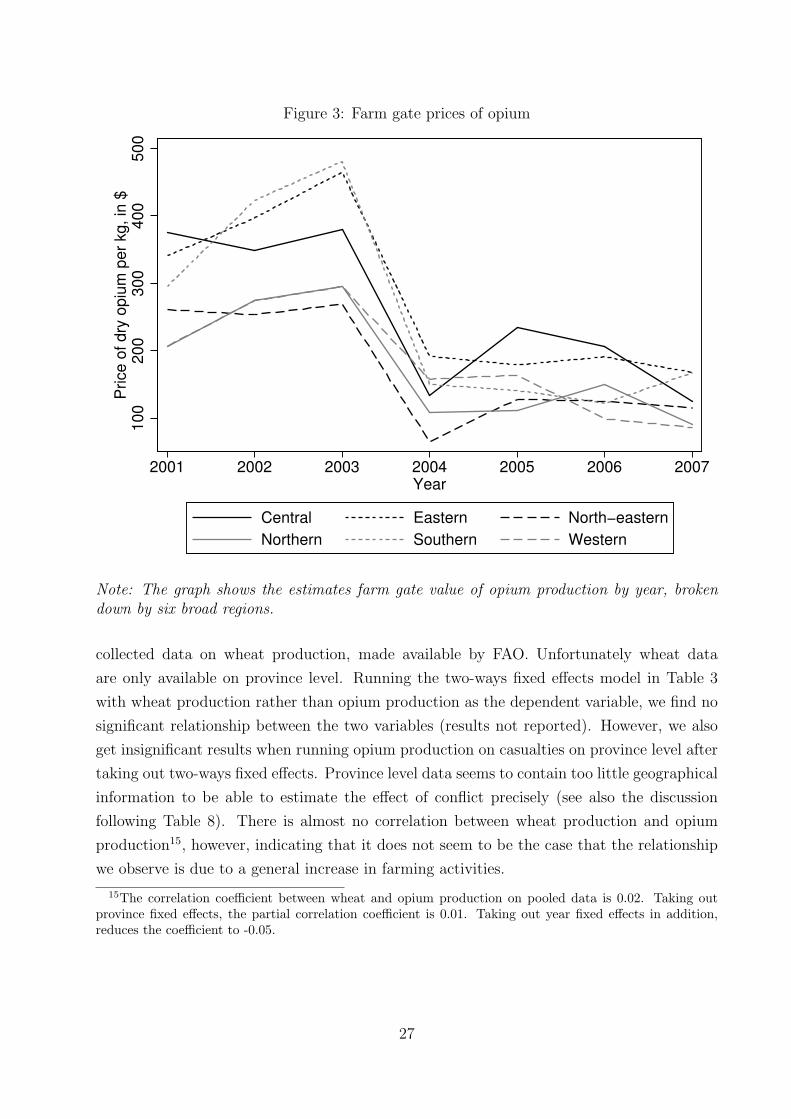
Figure 3: Farm gate prices of opium
100
200
300
400
500
Price
of d
ry o
pium
per
kg,
in $
2001 2002 2003 2004 2005 2006 2007Year
Central Eastern North−easternNorthern Southern Western
Note: The graph shows the estimates farm gate value of opium production by year, brokendown by six broad regions.
collected data on wheat production, made available by FAO. Unfortunately wheat data
are only available on province level. Running the two-ways fixed effects model in Table 3
with wheat production rather than opium production as the dependent variable, we find no
significant relationship between the two variables (results not reported). However, we also
get insignificant results when running opium production on casualties on province level after
taking out two-ways fixed effects. Province level data seems to contain too little geographical
information to be able to estimate the effect of conflict precisely (see also the discussion
following Table 8). There is almost no correlation between wheat production and opium
production15, however, indicating that it does not seem to be the case that the relationship
we observe is due to a general increase in farming activities.
15The correlation coefficient between wheat and opium production on pooled data is 0.02. Taking outprovince fixed effects, the partial correlation coefficient is 0.01. Taking out year fixed effects in addition,reduces the coefficient to -0.05.
27
5 Conclusion
While most conflict studies focus on the behavior of the fighting contestants, we focus more
on the behavior of local leaders and the people living in the conflict areas. Afghanistan is a
good example of how rising conflicts change their incentives and behaviors. The changes may
come about because conflicts are destructive, destroying physical capital and infrastructure,
and because conflicts are creative, opening up new opportunities for economic activities.
Opium production in Afghanistan benefit on both fronts.
Opium production is less hurt than other activities by the local destructions that con-
flicts cause; it is less dependent on infrastructure such as roads and irrigation systems and
it becomes more socially feasible as conflicts alter local power and moral norms. The new
and more flexible interpretations of “legality”, combined with the decline in legal opportuni-
ties, make opium production tempting for many local people who otherwise would be more
reluctant to be involved.
We capture some of this in a simple model which is used as a motivation for an empirical
assessment of how conflicts induce opium production in Afghanistan. We find strong support
for our main mechanism. Exploiting a unique data set, we show that Western hostile casu-
alties, our proxy for conflict, have a strong impact on subsequent local opium production.
This proxy is shown to be exogenous to opium, both by statements from US and NATO
forces claiming that they are not involved in military actions against opium producers, and
by the zero correlation between eradication of opium production and Western casualties.
If it was the case that the warlords only fought back in areas with much opium, the posi-
tive correlation between casualties and subsequent opium production could still be observed
even with the placement of the soldiers being random. But there is no support for this story
about defending opium in particular, since we show that hostile casualties only have an effect
prior to the planting season. If the battles were over the opium territory, warlords would be
equally interested in fighting back in January as in October. We therefore conclude that the
dramatic rise in Afghan poppy cultivation in the period 2002-2007 is a direct consequence
of the rising violent conflicts in the country. This is why we claim that narcotics production
is conflict-induced.
We believe that there also is a strong drugs-for-arms mechanism at work in Afghanistan.
Our focus on those conflicts that are exogenous to opium production enables us to identify
the link from conflict to opium production. Due to this exogeneity, however, we are unable to
quantify the traditional drugs-for-arms mechanism with our data. If both conflict-induced
narcotics production and drugs-for-arms mechanisms are at work at the same time, the
combination of the two may create a vicious circle: more intense conflicts stimulate more
opium production enabling warlords, militia leaders and other strongmen to finance military
campaigns escalating the conflicts further.
28
Clearly, opium production creates profit opportunities for local strongmen and warlords.
Large sums of money must be involved from a trade that covers 90 percent of the world’s
illegal consumption of opium. This speaks to the current debate on how Afghanistan should
treat warlords and drug traffickers who presently profit on the drug trade.16 When erad-
ication teams moved into the Helmand province, for instance, the governor announced an
amnesty for drug traffickers: “We as a government will provide the opportunity to use their
money for the national benefit [. . . ] they must invest in industries. They must invest in
construction companies” (quoted in MacDonald (2007, p. 97)). We do not know whether
amnesty is a good solution to Afghanistan’s opium related development crisis. What we do
claim, however, is that the local insecurity in the country has detrimental effects on local
investments, which in turn induce even higher opium production.
References
Angrist, J. D., and A. D. Kugler (2008): “Rural windfall or new resource curse? Coca,
income and civil conflict in Colombia,” Review of Economics and Statistics, 90, 191–215.
Booth, M. (1996): Opium. A History. Simon&Schuster, London.
CCINC (1972): “World Opium Survey 1972,” Washington, DC: US Cabinet Committee on
International Narcotics Control.
Cornell, S. E. (2005): “The Interaction of Narcotics and Conflict,” Journal of Peace
Research, 42, 751–60.
Dıaz, A. M., and F. Sanches (2004): “A Geography of Illicit Crops (Coca Leaf) and
Armed Conflict in Colombia,” Crisis States Programme Working Paper no. 47.
Farrell, G., and J. Thorne (2005): “Where have all the flowers gone?: evaluation of
the Taliban crackdown against opium poppy cultivation in Afghanistan,” International
Journal of Drug Policy, 16(2), 81–91.
Giustozzi, A. (2000): War, Politics and Society in Afghanistan, 1978-1992. Georgetown
University Press.
Greenstone, M. (2007): “Is the “Surge” Working? Some New Facts,” National Bureau
of Economic Research Working Paper Series, 13458.
Grossman, H. I., and D. Mejıa (2008): “The war against drug producers,” Economics
of Governance, 9, 5–23.
16See Grossman and Mejıa (2008) for an analysis of the effectiveness of anti-drug policies in the case ofColombia.
29
Haq, I. (1996): “Pak-Afghan drug trade in historical perspective,” Asian Survey, 36, 945–
63.
Hausman, J. A., and W. E. Taylor (1983): “Identification in Linear Simultaneous
Equations Models with Covariance Restrictions: An Instrumental Variables Interpreta-
tion,” Econometrica, 51(5), 1527–1549.
Iyengar, R., and J. Monten (2008): “Is There an “Emboldenment” Effect? Evidence
from the Insurgency in Iraq,” National Bureau of Economic Research Working Paper
Series, 13839.
Kaplan, R. D. (2001): Soldiers of God: With Islamic Warriors in Afghanistan and Pak-
istan. Vintage Books, New York.
Kapoor, L. D. (1995): Opium Poppy: Botany, Chemistry, and Pharmacology. Haworth
Press.
Keen, D. (2000): “Incentives and Disincentives for Violence,” in Greed and Greivance.
Economic Agendas in Civil War, ed. by M. Berdal, and D. M. Malone, chap. 2. Lynne
Rienner, Boulder.
Kleibergen, F., and R. Paap (2006): “Generalized reduced rank tests using the singular
value decomposition,” Journal of Econometrics, 133(1), 97–126.
MacDonald, D. (2007): Drugs in Afghanistan: Opium, Outlaws and Scorpion Tales. Pluto
Press.
Mansfield, D. (2001): “The Economic Superiority of Illicit Drug Production: Myth and
Reality. Opium Poppy Cultivation in Afghanistan,” in International Conference on Alter-
native Development in Drug Control and Cooperation, Feldafing.
(2004): “What is Driving Opium Poppy Cultivation? Decision Making Amongst
Opium Poppy Cultivators in Afghanistan in the 2003/4 Growing Season,” in Second Tech-
nical Conference on Drug Control Research. UNODC/ONDCP.
(2005): “What is Driving Opium Poppy Cultivation? The Pressures to Reduce
Opium Poppy Cultivation in Afghanistan in the 2004/05 Growing Season,” Discussion
paper, Afghan Drugs Inter Departmental Unit of the UK Government.
Martin, E., and S. Symansky (2006): “Macroeconomic Impact of the Drug Economy
and Counter-Narcotics Efforts,” in Afghanistan’s Drug Industry: Structure, Functioning,
Dynamics, and Implications for Counter-Narcotics Policy, ed. by W. A. Byrd, and D. Bud-
denberg. The World Bank.
30
McCoy, A. (1991): The politics of heroin: CIA complicity in the global drug trade. Lawrence
Hill, New York.
Mehlum, H., K. Moene, and R. Torvik (2006): “Institutions and the Resource Curse,”
The Economic Journal, 116(508), 1–20.
Miguel, E., S. Satyanath, and E. Sergenti (2004): “Economic Shocks and Civil
Conflict: An Instrumental Variables Approach,” Journal of Political Economy, 112, 725–
53.
Misra, A. (2004): Afghanistan: The Labyrinth of Violence. Polity.
New York Times (2007): “Poppy Fields Are Now a Front Line in Afghan War,” 16.5.2007.
Available at http://www.nytimes.com/2007/05/16/world/asia/16drugs.html.
Paxson, C. H. (1992): “Using weather variability to estimate the response of savings to
transitory income in Thailand,” American Economic Review, 82, 15–33.
Rashid, A. (2000): Taliban: Militant Islam, Oil and Fundamentalism in Central Asia. Yale
University Press.
Rubin, B. R. (2002): The Fragmentation of Afghanistan: State Formation and Collapse in
the International System, Second Edition. Yale University Press.
Sachs, J. D., and A. M. Warner (1995): “Natural Resource Abundance and Economic
Growth,” NBER Working Paper 5398.
(1997): “Sources of Slow Growth in African Economies,” Journal of African Eco-
nomics, 6(3), 335–376.
(2001): “The curse of natural resources,” European Economic Review, 45, 827–838.
The Times (2006): “Amid the thud of artillery, soldiers stormed into a Tale-
ban stronghold,” 14.09.2006. Available at http://www.timesonline.co.uk/tol/news/
world/article1073949.ece.
UNODC (1949): “Opium Production Throughout The World,” Bulletin on Narcotics, 1(1),
6–38, Available at http://www.unodc.org/unodc/en/data-and-analysis/bulletin/
bulletin 1949-01-01 1 page005.html.
UNODC (2003): “The Opium Economy in Afghanistan—An International Problem,”
United Nations, Office on Drugs and Crime, New York.
(2004): “Farmers Intentions Survey 2003/2004,” United Nations, Office on Drugs
and Crime, Vienna.
31
(2006): “Afghanistan Opium Survey 2006,” United Nations, Office on Drugs and
Crime, Vienna.
(2007): “Afghanistan Opium Survey 2007,” United Nations, Office on Drugs and
Crime, Vienna.
(2008): “World Drug Report 2008,” United Nations, Office on Drugs and Crime,
Vienna.
Willumsen, F. (2006): “Debt and poppy cultivation—Driving factors behind Afghan
opium production,” Master’s thesis, University of Oslo.
32