Embed Size (px)
Citation preview
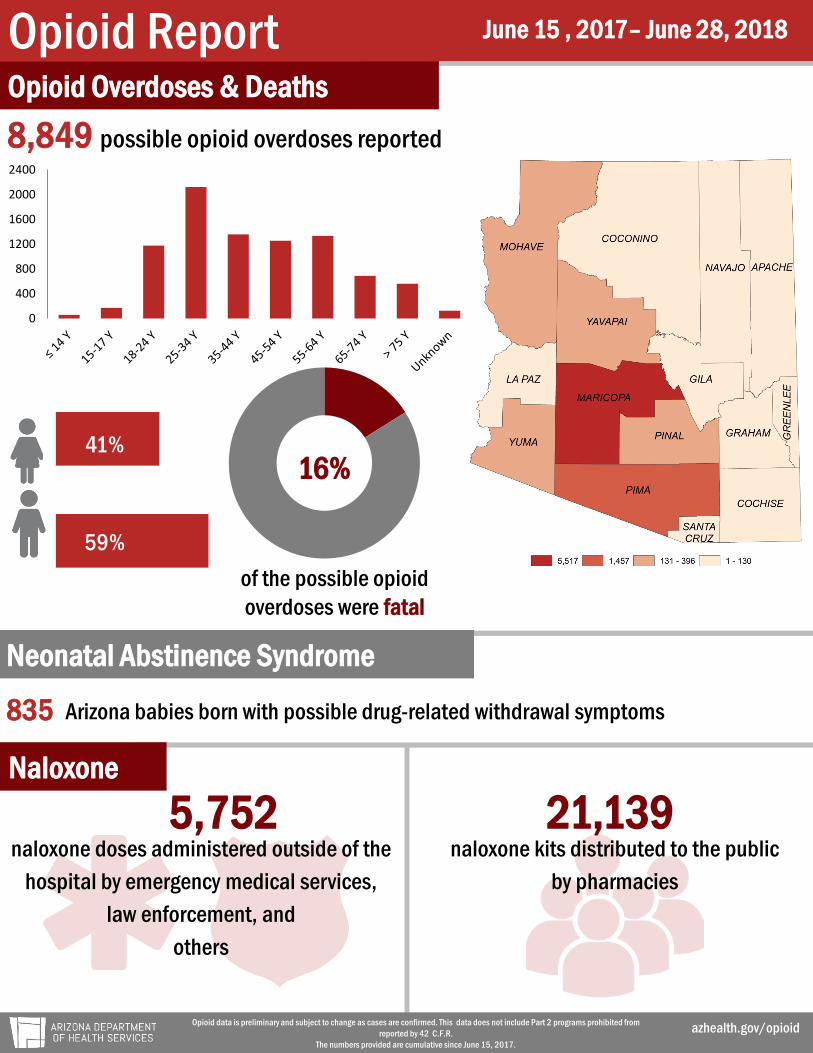
Opioid Report Opioid Overdoses & Deaths
Naloxone
Neonatal Abstinence Syndrome
June 15 , 2017– June 28, 2018
Opioid data is preliminary and subject to change as cases are confirmed. This data does not include Part 2 programs prohibited from reported by 42 C.F.R.
The numbers provided are cumulative since June 15, 2017.
naloxone doses administered outside of the hospital by emergency medical services,
law enforcement, and others
naloxone kits distributed to the public by pharmacies
Arizona babies born with possible drug-related withdrawal symptoms
of the possible opioid overdoses were fatal
azhealth.gov/opioid
5,752 21,139
8,849 possible opioid overdoses reported
835
41%
59%
0
400
800
1200
1600
2000
2400
16%
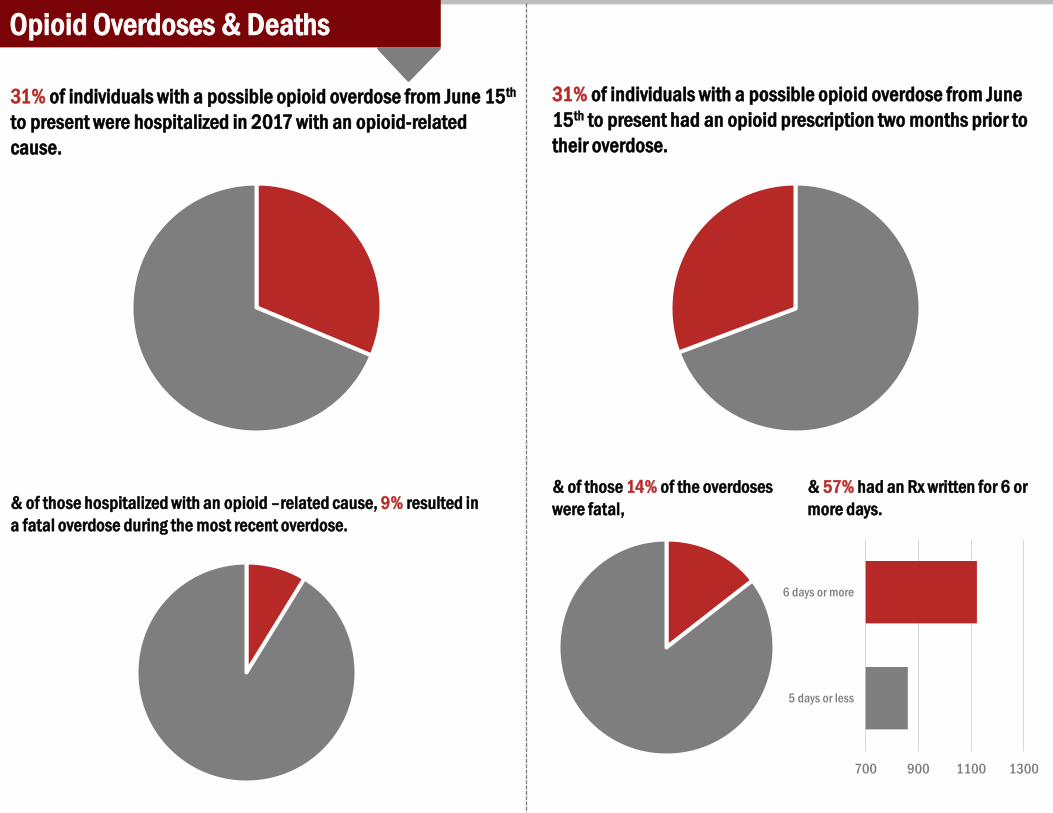
Opioid Overdoses & Deaths
31% of individuals with a possible opioid overdose from June 15th to present were hospitalized in 2017 with an opioid-related cause.
31% of individuals with a possible opioid overdose from June 15th to present had an opioid prescription two months prior to their overdose.
& of those 14% of the overdoses were fatal,
700 900 1100 1300
5 days or less
6 days or more
& 57% had an Rx written for 6 or more days. & of those hospitalized with an opioid –related cause, 9% resulted in
a fatal overdose during the most recent overdose.
Opioid Overdoses & Deaths
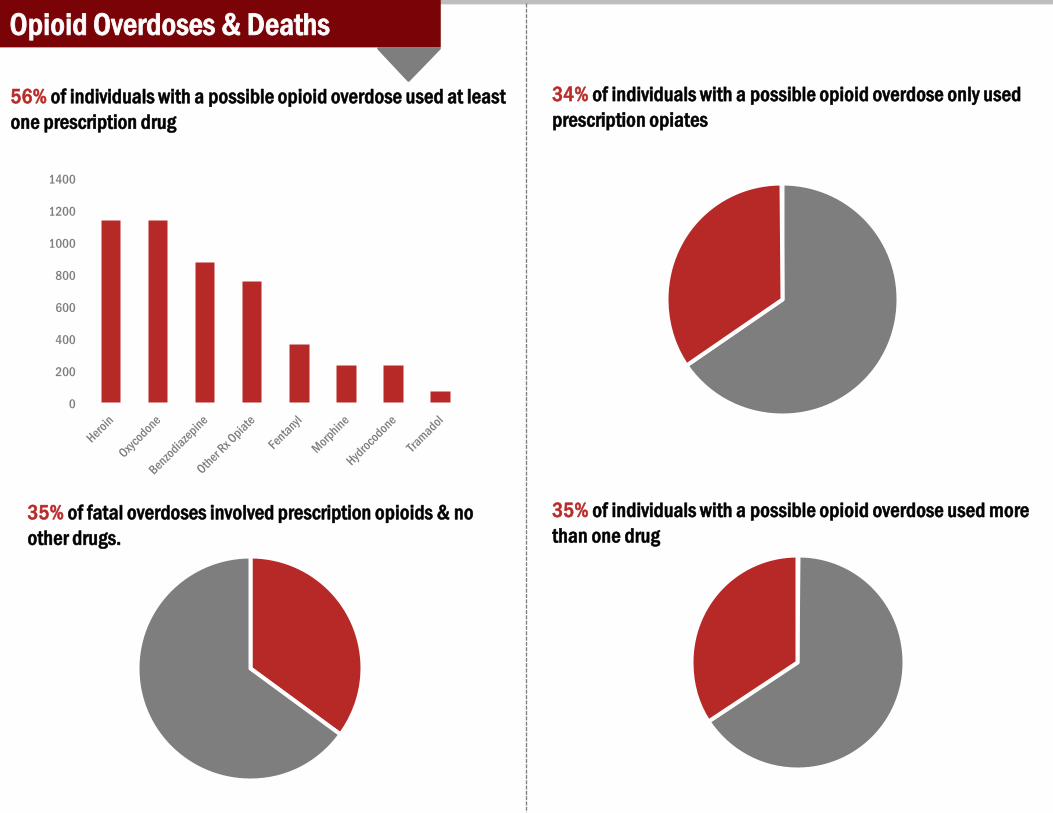
56% of individuals with a possible opioid overdose used at least one prescription drug
34% of individuals with a possible opioid overdose only used prescription opiates
35% of fatal overdoses involved prescription opioids & no other drugs.
35% of individuals with a possible opioid overdose used more than one drug
0
200
400
600
800
1000
1200
1400
Opioid Overdoses & Deaths
103
164
181 196 204 189
222 213 220 219
207
270
233 233 247 247
162
234
148 132 145
130 105
121 118 117 143
126 152
134 148
134 156 154
138 144 132
168 168 165 134 149
155
139 127 151
127 139 131 138 118
164
112
0255075
100125150175200225250275300
6/22
6/29 7/
67/
137/
207/
27 8/3
8/10
8/17
8/24
8/31 9/
79/
149/
219/
2810
/510
/12
10/1
910
/26
11/2
11/9
11/1
611
/23
11/3
012
/712
/14
12/2
112
/28
1/5
1/11
1/18
1/25 2/
12/
82/
152/
22 3/1
3/8
3/15
3/22
3/29 4/
54/
124/
194/
26 5/3
5/10
5/17
5/24
5/31 6/
76/
146/
21
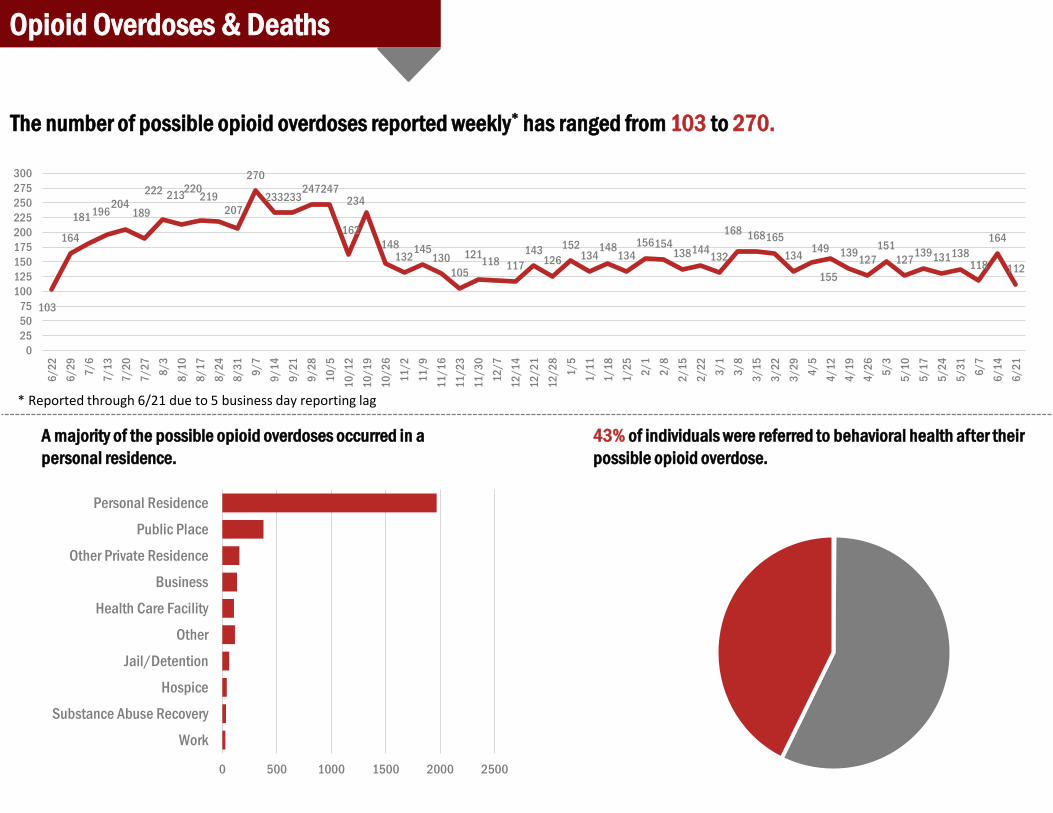
The number of possible opioid overdoses reported weekly* has ranged from 103 to 270.
0 500 1000 1500 2000 2500
Work
Substance Abuse Recovery
Hospice
Jail/Detention
Other
Health Care Facility
Business
Other Private Residence
Public Place
Personal Residence
A majority of the possible opioid overdoses occurred in a personal residence.
43% of individuals were referred to behavioral health after their possible opioid overdose.
* Reported through 6/21 due to 5 business day reporting lag
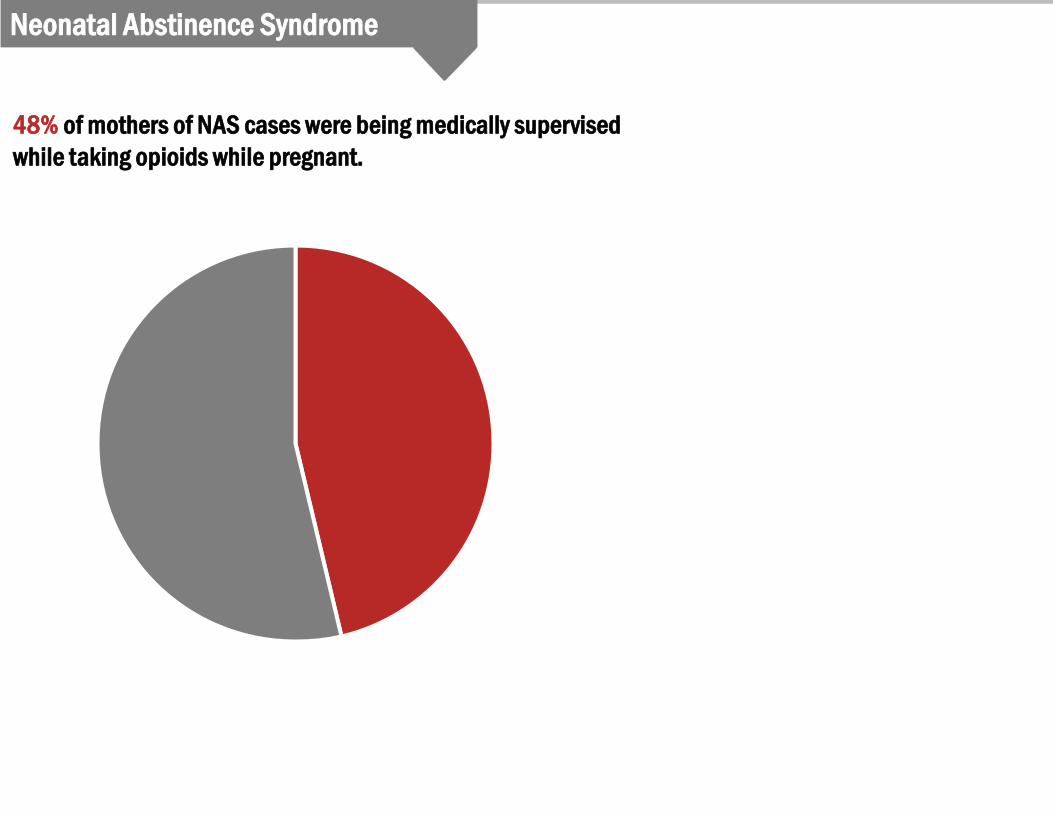
Neonatal Abstinence Syndrome
48% of mothers of NAS cases were being medically supervised while taking opioids while pregnant.
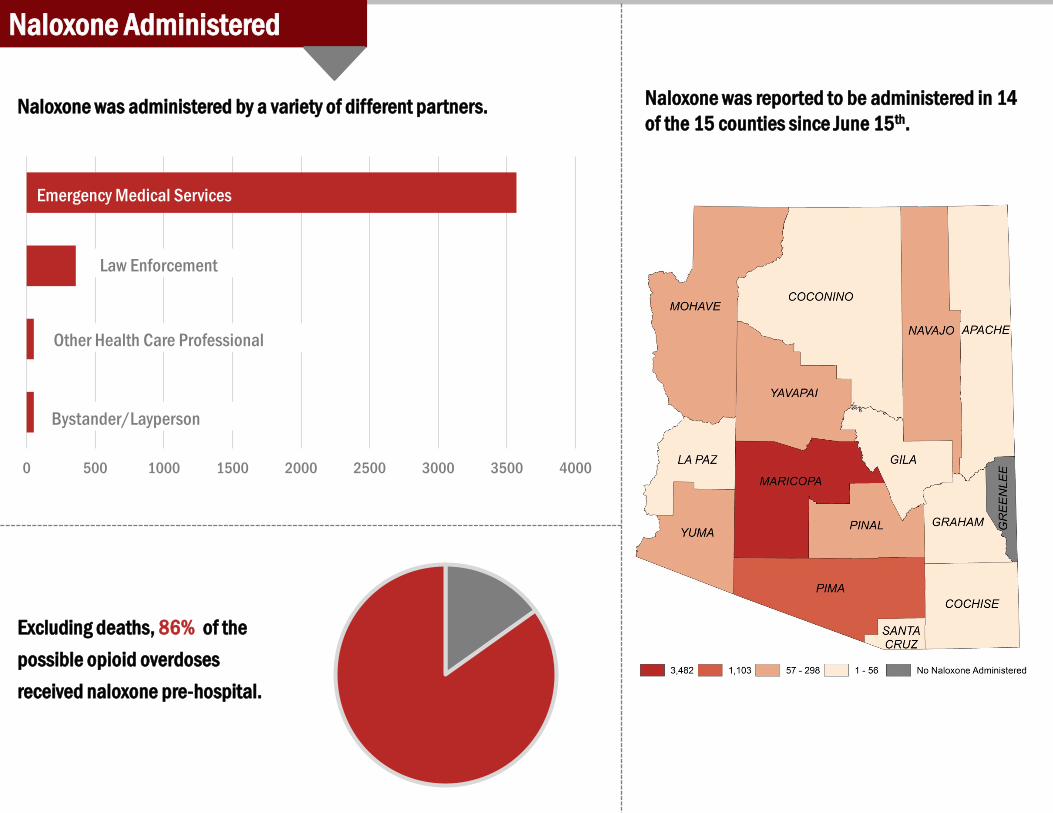
Naloxone Administered
0 500 1000 1500 2000 2500 3000 3500 4000
Emergency Medical Services
Law Enforcement
Other Health Care Professional
Bystander/Layperson
Naloxone was administered by a variety of different partners.
Excluding deaths, 86% of the possible opioid overdoses received naloxone pre-hospital.
Naloxone was reported to be administered in 14 of the 15 counties since June 15th.
Navajo Nation
Kingman Flagstaff
Page
Buckeye
Ajo
Quartzsite
Colorado City
EloyFortuna Foothills
Thatcher
Payson
Williamson
Morenci
Grand Canyon
Winslow
Hopi Tribe
Tohono O'odhamNation
Chino Valley
Rio Rico
Globe
Willcox & BowieBenson
Black Canyon City
San Carlos Apache Tribe
Bisbee
Snowflake/Heber Springerville/Eager
Douglas &Pirtleville
SaddlebrookeMarico
pa
Green Valley
Florence
White MountainApache Tribe
Sierra Vista
Safford
GoldenValley
Hualapai Tribe
Prescott Valley
Cottonwood\
Sedona
Surprise North &Wickenburg
Yuma
Show Low
Lake HavasuCity
BullheadCity
GoldCanyon
CasaGrande
San Luis
Colorado RiverIndian Tribe
Coolidge
Prescott
Hopi Tribe
Nogales
Parker
Somerton
Scottsdale North
Buckeye
Peoria North
Goodyear & Litchfield Park
Gila River Indian Community
Gold Canyon
San TanValley
Mesa North
Glendale West
Buckeye
Surprise North &Wickenburg
MesaGateway
New River/Cave Creek
Desert View
North Gateway/Rio Vista
Avonda
le
Fountain Hills/Rio Verde
Deer ValleySurprise
South
QueenCreek
GilbertSouth
MesaWestLaveen
Glenda
le North
ApacheJunctionTempe
North
Salt River Pima-MaricopaIndian Community
SunCity
GilbertCentral
ParadiseValley Village
MesaEast
Maryvale
Chandler Central
Scottsd
ale
Centr
al
Ahwatukee Foothills
Estrella
CamelbackEast
NorthMountain
PeoriaSouth
Gilbert North
Central City
ChandlerSouth
ChandlerNorth
Alhambra
TempeSouth
Mesa Central
Paradise Valley
Anthem
GlendaleCentral
Fort M
cDow
ellYav
apai N
ationSun CityWest
South Mountain
Encanto ScottsdaleSouth
El Mirag
e
SunLakes
Black Canyon City
Vail
Marana
Picture Rocks
Eloy
Tanque Verde
Green Valley
Tohono O'odham Nation
CatalinaFoothills
San Xavier
Tucson Estates Tucson South
Sahuarita
Tucson West
ValenciaWest
OroValley
TucsonSouth East
Tucson East
Casas Adobes
TucsonCentral Tucson Foothills
Drexel
Heigh
ts
FlowingWells
Pascua Yaqui
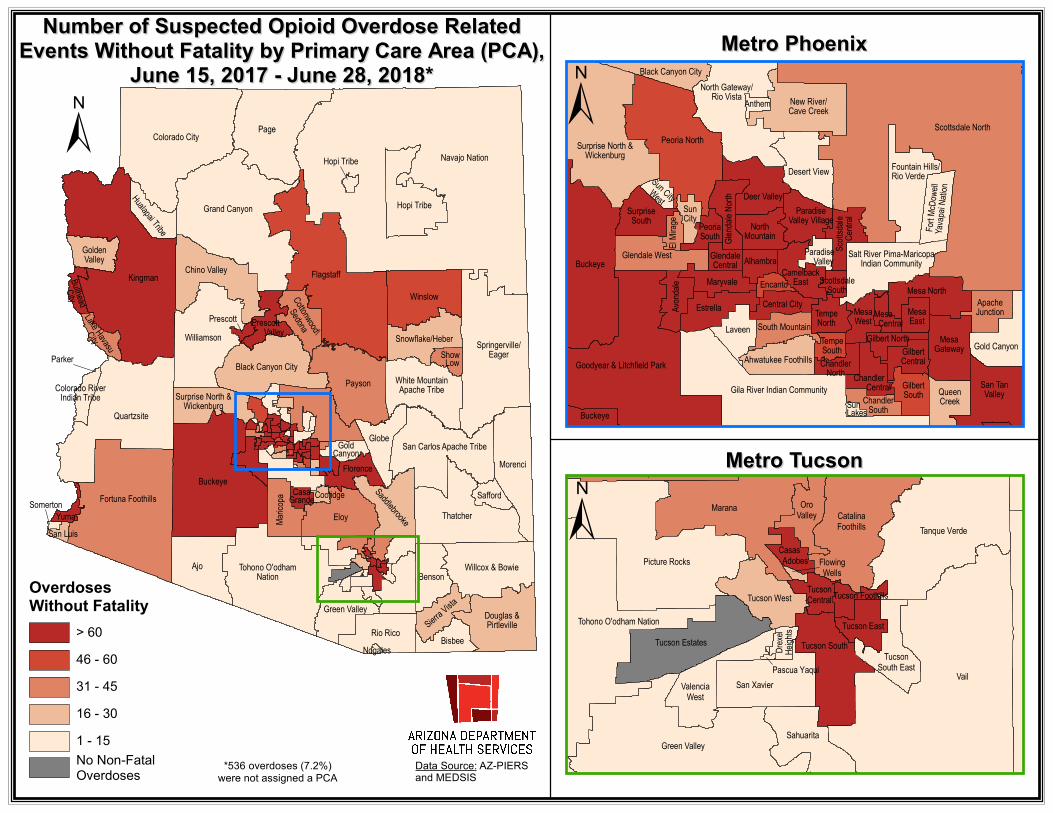
Number of Suspected Opioid Overdose RelatedNumber of Suspected Opioid Overdose RelatedEvents Without Fatality by Primary Care Area (PCA),Events Without Fatality by Primary Care Area (PCA),
June 15, 2017 - June 28, 2018*June 15, 2017 - June 28, 2018*Metro PhoenixMetro Phoenix
Metro TucsonMetro Tucson
± ±
±OverdosesWithout Fatality
> 6046 - 6031 - 4516 - 301 - 15No Non-FatalOverdoses *536 overdoses (7.2%)
were not assigned a PCAData Source: AZ-PIERSand MEDSIS