Embed Size (px)
Citation preview

R E P O R T B Y T H E B O A R D O F D I R E C T O R SA N D F I N A N C I A L S T A T E M E N T S 2 0 2 0
Ophthalmic diagnostic solutions

Parent company financial statements
Signatures
Parent company profit & loss statement
44
Parent company balance sheet 45
Parent company cash flow statement
46
Notes to parent company financial statements
47
Signatures to the Financial Statements and Report by the Board of Directors
54
Report by the Board of Directors
Consolidated financial statements
Auditor's report
Report by the Board of Directors
3
Key figures 12
Distribution of shareholdings and information about shareholders
14
Consolidated comprehensive profit & loss Statement
15
Consolidated balance sheet 16
Consolidated cash flow statement
17
Consolidated statement of changes in equity
18
Notes to the consolidated financial statements
19
Auditor's report 55
Content

3REPORT BY THE
BOARD OF DIRECTORS
CONSOLIDATED
FINANCIAL STATEMENTS
PARENT COMPANY
FINANCIAL STATEMENTSSIGNATURES AUDITOR'S NOTE
Review by the Board of Directors
Operating on the international market, Revenio is a health technology group and a global pioneer in ophthalmic diagnostic solutions. Following the strategic acquisition in spring 2019, the company strengthened its position in the ophthalmic diagnostic care pathway.
Revenio is known for its globally leading iCare intraocular pressure measurement devices (tonometers) and retinal imaging devices. The Group’s range of ophthalmic diagnostic products includes devices for detecting age-related eye diseases, such as glaucoma, macular degeneration, diabetic retinopathy and cataracts, in their early stages.
Revenio's strong expertise in technology, a strict quality system applied throughout the supply chain, and an understanding of different markets provide a strong basis for the company to be a global leader in health-tech-related screening devices in the future as well. Continuous investment in research and product development will open up new opportunities for the Group and strengthen the market position of its existing products.
As a health technology group, Revenio is also running research and development projects to identify and bring new health technology products to market. At the moment, the Research function is focusing on bringing systems for diagnostics and treatment planning of conditions such as skin cancer and asthma to market.
The Revenio Group comprises the Group’s parent company Revenio Group Corporation, Icare Finland Oy, Icare USA Inc., Revenio Italy S.R.L., CenterVue SpA, Revenio Research Oy, Oscare Medical Oy, and Done Medical Oy.
Changes in the Group structure during the financial period CenterVue Inc. was merged with Icare USA Inc. As of April 1, 2020, Revenio Group’s subsidiary in the United States is Icare USA Inc.
Business operations and development of the operating environment Revenio’s markets are global and influenced by structural long-term growth drivers, primarily the globally increasing incidence of eye diseases caused by population aging. As populations age, diseases such as glaucoma, diabetic retinopathy, and macular degeneration are becoming increasingly common. Revenio's position in the ophthalmic care pathway is strong. The company’s profitable growth is based on a comprehensive range of products for the entire ophthalmic diagnostic care pathway, unique technology, and a global distribution network.
Thanks to the acquisition of CenterVue in April 2019, Revenio is now operating on a considerably larger market, and the company’s position as a global supplier of ophthalmic devices for diagnostics of the eye has strengthened significantly. Revenio’s product portfolio covers intraocular pressure measurement devices (tonometers), retinal imaging devices, and perimeters.
In 2020, the impacts of the Covid-19 pandemic were felt in Revenio’s global business as challenges in arranging customer meetings. On the other hand, the increased hygiene requirements were reflected in exceptionally strong demand for both iCare intraocular pressure measurement devices and their single-use probes throughout the year. Revenio responded to the increased demand by expanding the production capacity for probes. The unique features of the iCare intraocular pressure measurement devices demonstrated their strengths, allowing patient measurements to continue uninterrupted in a market situation marked by the pandemic.
The Covid-19 restrictions affected sales of iCare retinal imaging devices particularly in early 2020, as they are capital goods and require in-person meetings for both sales and installation. Their sales began to pick up from May onwards towards the end of the year, with deliveries also resuming.
The iCare DRSplus retinal imaging device, in particular, has been well received on the market. Demand for the device was strong, despite the fact that the product launch occurred at the start of the pandemic and a full-scale launch has yet to be executed.
Fixed costs were at an exceptionally low level throughout 2020 due to the travel restrictions imposed because of the Covid-19 pandemic. Opportunities for physical customer meetings were extremely limited, and important industry conferences were transferred online or cancelled altogether.
The United States is the single largest health technology market, and Revenio’s sales there grew strongly during 2020. Demand was particularly strong for iCare intraocular pressure measurement devices and their single-use probes. Sales in the US were boosted by some unusually large orders.
Ophthalmic products were combined under the unified iCare brand in 2020. The synergies already achieved through the CenterVue acquisition, especially in terms of sales and marketing and the supply chain, will further strengthen the company’s competitiveness and market position.
Development of Ventica and Cutica continued as planned. Clinical trials and the development of artificial intelligence were also continued for Cutica.
During the fall, Revenio successfully conducted remote follow-up audits under the Medical Device Single Audit Program (MDSAP) in both Finland and Italy. MDSAP certification is also recognized by the authorities in the United States, Canada, Australia, Brazil, and Japan. The company also prepared for the adoption of the new European Medical Device Regulation (MDR) as scheduled in spring 2021.
January 1–December 31, 2020

4REPORT BY THE
BOARD OF DIRECTORS
CONSOLIDATED
FINANCIAL STATEMENTS
PARENT COMPANY
FINANCIAL STATEMENTSSIGNATURES AUDITOR'S NOTE
Impact of the Covid-19 pandemic and actions taken in 2020The risks and uncertainties related to the global Covid-19 pandemic grew significantly during the first quarter of 2020. During the second quarter of 2020, a gradual market reopening could be observed around the world. Towards the end of the year, the uncertainty caused by the Covid-19 pandemic again increased.
In the early stages of the pandemic, the entire Revenio Group transitioned widely to remote working at all its locations, and customer meetings were conducted mainly via remote tools. We have continued the remote working recommendation until further notice, taking official local guidelines into consideration. The sales and marketing organization has transferred customer and distributor events online. Despite the Covid-19 pandemic, Revenio has continued its R&D projects without interruption.
The pandemic has not had a significant impact on the supply chain. Sales of intraocular pressure measurement devices (tonometers) and their single-use probes have been good due to their hygiene in the Covid-19 situation. Imaging devices, on the other hand, are capital goods, and their market is expected to recover more slowly, as they require both face-to-face presentations and physical installation and deployment.
Revenio’s balance sheet and cash flow have remained strong throughout the period. The Covid-19 pandemic has not had a significant impact on Revenio's financial position. No material changes have been observed in customers’ liquidity.
Net sales, profitability and profitRevenio reports the health technology business as one entity.
Revenio Group’s consolidated net sales in January 1–December 31, 2020 totaled EUR 61.1 (49.5) million. This represented net sales growth of 23.4%. The
currency-adjusted growth of net sales in January–December was 26.5%, or 3.1% percentage points stronger than reported.
EBITDA was EUR 21.7 (14.6) million, representing 35.5% of net sales, an increase of 48.4%. EBITDA for the reference period was weighed down by non-recurring acquisition costs amounting to EUR 2.8 million. EBITDA adjusted for non-recurring acquisition costs was EUR 17.4 million. In relation to the adjusted EBITDA for the reference period, EBITDA grew by 24.8% in the financial period.
Earnings before tax totaled EUR 16.7 (12.3) million, a growth of 36.2% from the preceding year.
In the third quarter, an impairment of EUR 1.9 million was recorded in the capitalized product development expenses for the Cutica skin cancer camera due to the weakened outlook for future return expectations. Clinical trials and the development of artificial intelligence will continue as planned.
Operating profit was EUR 17.1 (12.6) million, an increase of 36.0%.
Undiluted earnings per share came to EUR 0.505 (0.365). Equity per share was EUR 2.61 (2.42).
Balance sheet, financing activities and cash flowThe consolidated balance sheet total stood at EUR 114.4 (109.8) million on December 31, 2020. The consolidated goodwill recorded on the balance sheet on December 31, 2020 was EUR 50.4 (50.4) million.
Shareholders’ equity amounted to EUR 69.7 (64.4) million. At the end of the review period, net liabilities amounted to EUR -1.7 (2.2) million and net leveraging stood at -2.4% (3.4%). The consolidated equity ratio was 60.9% (58.6%). The Group’s liquid assets amounted to EUR 28.9 (26.7) at the end of the period on December
31, 2020. Cash flow from operations totaled EUR 15.2 (12.4) million.
The Group’s purchases of PPE and intangible assets totaled EUR 1.6 (59.7) million. Investments focused mainly on production machinery and equipment.
Personnel and managementJouni Toijala, B.Sc., MBA (b. 1968) was appointed as President & CEO of Revenio Group Corporation on May 18, 2020. Timo Hildén served as President & CEO of Revenio Group Corporation in the first half of the year before Jouni Toijala took office.
The Management Team of Revenio Group at the time of the financial statement’s publication includes Revenio Group Corporation’s CEO Jouni Toijala (chair), R&D Director of Imaging Devices Giuliano Barbaro, QA Director Heli Valtanen, Operations Director Ari Isomäki, Sales and Marketing Director Tomi Karvo, CFO Robin Pulkkinen, and R&D Director of Tonometers Mika Salkola.
The annualized average number of personnel employed by the Group in January–December amounted to 135 (88). At the end of the period on December 31, 2020, the number of employees was 143 (120), an increase of 23 employees. The growth was mainly due to new recruitments.
JAN-DEC/ 2020
JAN-DEC/ 2019
JAN–DEC/ 2018
Revenio Group 135 88 53
Wages, salaries, and other remuneration paid in January–December amounted to EUR 11.0 (8.3) million.
AVERAGE NUMBER OF PERSONNEL DURING THE PERIOD

5REPORT BY THE
BOARD OF DIRECTORS
CONSOLIDATED
FINANCIAL STATEMENTS
PARENT COMPANY
FINANCIAL STATEMENTSSIGNATURES AUDITOR'S NOTE
Loans granted to key management personnel
During the financial year 2020, Revenio Group Corporation's President & CEO Jouni Toijala took out a loan of EUR 50,000 granted by the company on market terms for the purchase of Revenio’s shares. The shares acquired using the loan will act as security for the loan. This arrangement was entered into at the request of Revenio’s Board of Directors in order to secure the commitment and motivation of the CEO. The CEO has agreed to hold the company shares he acquired using the loan financing granted by the company for a period of five (5) years. The CEO’s obligation to hold the acquired shares ends if the CEO’s employment relationship ends before the end of the five-year period.
Shares, share capital, and management and employee holdingsOn December 31, 2020, the Revenio Group Corporation’s fully paid-up share capital registered with the Trade Register was EUR 5,314,918.72 and the number of shares totaled 26,658,952.
The company has one class of share, and all shares confer the same voting rights and an equal right to dividends and the company’s funds. On December 31, 2020, the President & CEO, members of the Board of Directors and their related parties held 0.23% of the company’s shares, or 59,986 shares and 0.0% of the option rights.
During the financial period, the company bought back 80,000 of its own shares. At the end of the period, the company held 131,058 of its own shares.
During the financial period, the number of shares increased by 49,545 following subscriptions made on the basis of the 2015B series B option rights and by 64,665 following subscriptions made on the basis of the 2015C option schemes. A total of
114,210 shares were subscribed for. Following these subscriptions, the number of shares and votes of Revenio Group Oyj increased to 26,658,952.
In late 2015, the employees of Revenio Group established a personnel fund, into which any bonuses earned by employees working in Finland on the basis of incentive schemes can be paid. The arrangement is widely used by the personnel.
The Annual General Meeting of Revenio Group Corporation held on June 8, 2020 decided that 40% of Board members' emoluments will be settled in the form of company shares. By December 31, 2020, shares had been transferred as follows: 2,126 shares.
Authorization for the purchase of own sharesOn June 8, 2020, the Annual General Meeting authorized the Board to make the decision to buy back a maximum of 1,329,951 of the company's own shares in one or several tranches using the company's non-restricted equity capital. The authorization is valid until the end of the Annual General Meeting to be held in 2021, however, no later than until 30 June 2021. This authorization supersedes the buyback authorization granted at the Annual General Meeting of March 20, 2019.
Authorization to decide on a share issue and on the granting of stock options and other special rights giving entitlement to sharesThe Annual General Meeting of June 8, 2020 authorized the Board of Directors to decide to issue a maximum of 1,329,951 shares or to grant special rights (including stock options) entitling to shares, as referred to in chapter 10, section 1 of the Limited Liability Companies Act, in one or several tranches.
This authorization will be used to finance and implement any prospective corporate acquisitions or other transactions, to implement the company’s share-based incentive plans, or for other purposes determined by the Board.
The authorization is valid until the end of the Annual General Meeting to be held in 2021, however, no later than until June 30, 2021. This authorization supersedes the share-issue authorization granted at the Annual General Meeting of March 20, 2019.

6REPORT BY THE
BOARD OF DIRECTORS
CONSOLIDATED
FINANCIAL STATEMENTS
PARENT COMPANY
FINANCIAL STATEMENTSSIGNATURES AUDITOR'S NOTE
Current option schemesBased on the share issue authorization granted by the Annual General Meeting of March 19, 2015, Revenio Group Corporation's Board of Directors decided, on August 10, 2015, to implement a new option scheme comprising a maximum of 150,000 option rights. One option right entitles its holder to subscribe for three shares. New shares subscribed for via the option program entitle the holder to a dividend from the year of subscription onwards. The option rights will be allocated, as determined by the Board of Directors, to key personnel employed or to be employed by the Revenio Group in accordance with the terms and conditions of the option scheme.
These option rights are divided into three series: Series A (50,000), Series B (50,000), and Series C (50,000). The subscription periods for options were as follows: Series A: May 31, 2017–May 31, 2019; Series B: May 31, 2018–May 31, 2020; and Series C: May 31, 2019–May 31, 2021. The share subscription price for Series C options is the trade-weighted average price of a Revenio share quoted on Nasdaq Helsinki Oy during the period September 1–October 15, 2017, plus 15 per cent. On December 31, 2020, the share subscription price for Series C options was EUR 12.48. In accordance with the terms and conditions of the option scheme, the subscription price is reduced by the amount of dividends decided before the share subscription, on the record date of each dividend payment.
.
Share planOn March 20, 2018, June 20, 2019, and March 13, 2020, the Board of Directors of Revenio Group Corporation decided on a long-term incentive scheme directed towards the President & CEO and other Management Team of Revenio Group. Long-term incentive schemes form part of the company's remuneration program for key personnel and are aimed at supporting the implementation of the company's strategy and harmonizing the objectives of key personnel and company shareholders in order to grow the company's value. Moreover, the CEO is entitled to a restricted share plan if certain conditions are met. According to the plan, the CEO would be entitled to receive a total of 3,000 company shares during 2021–2023.
Trading on Nasdaq HelsinkiDuring the period January 1–December 31, 2020, Revenio Group Corporation’s share turnover on the Nasdaq Helsinki exchange totaled EUR 446.8 (123.9) million, representing 14.4 (6.0) million shares or 54.1% (22.4) of all shares outstanding. The highest trading price was EUR 51.50 (28.05) and the lowest was EUR 18.48 (12.56). At the end of the period, the closing price was EUR 50.30 (26.25), and the average share price was EUR 30.98 (20.8). Revenio Group Corporation’s market value stood at EUR 1,341 (697) million on December 31, 2020.
SUMMARY OF TRADING ON NASDAQ HELSINKI JANUARY 1–DECEMBER 31, 2020
JANUARY- DECEMBER 2020
TURNOVER, NUMBER OF
SHARES
VALUETOTAL, EUR
HIGHEST, EUR
LOWEST,EUR
AVERAGE PRICE, EUR
LATEST, EUR
REG1V 14,420,198 446,788,330 51.50 18.48 30.98 50.30
DEC 31, 2020 DEC 31, 2019
Market value, EUR 1,340,945,286 696,799,478
Number of shareholders 20,184 12,338
7REPORT BY THE
BOARD OF DIRECTORS
CONSOLIDATED
FINANCIAL STATEMENTS
PARENT COMPANY
FINANCIAL STATEMENTSSIGNATURES AUDITOR'S NOTE
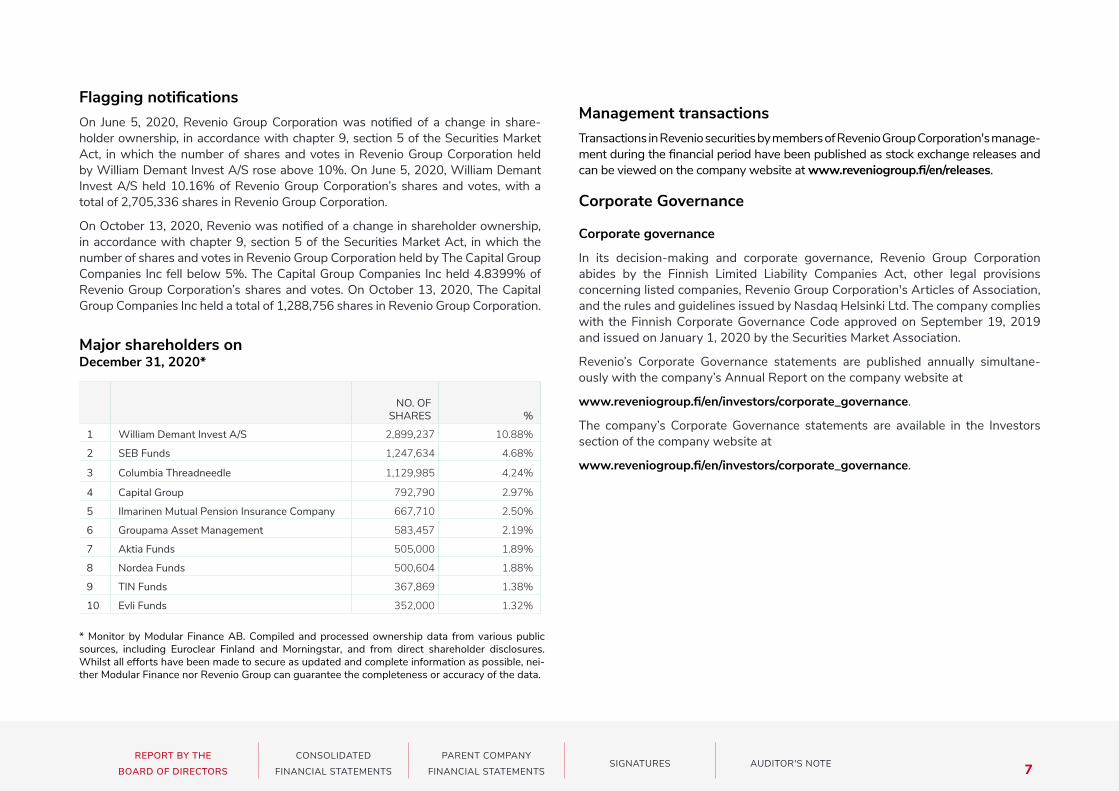
Major shareholders onDecember 31, 2020*
NO. OF SHARES %
1 William Demant Invest A/S 2,899,237 10.88%
2 SEB Funds 1,247,634 4.68%
3 Columbia Threadneedle 1,129,985 4.24%
4 Capital Group 792,790 2.97%
5 Ilmarinen Mutual Pension Insurance Company 667,710 2.50%
6 Groupama Asset Management 583,457 2.19%
7 Aktia Funds 505,000 1.89%
8 Nordea Funds 500,604 1.88%
9 TIN Funds 367,869 1.38%
10 Evli Funds 352,000 1.32%
Flagging notificationsOn June 5, 2020, Revenio Group Corporation was notified of a change in shareholder ownership, in accordance with chapter 9, section 5 of the Securities Market Act, in which the number of shares and votes in Revenio Group Corporation held by William Demant Invest A/S rose above 10%. On June 5, 2020, William Demant Invest A/S held 10.16% of Revenio Group Corporation’s shares and votes, with a total of 2,705,336 shares in Revenio Group Corporation.
On October 13, 2020, Revenio was notified of a change in shareholder ownership, in accordance with chapter 9, section 5 of the Securities Market Act, in which the number of shares and votes in Revenio Group Corporation held by The Capital Group Companies Inc fell below 5%. The Capital Group Companies Inc held 4.8399% of Revenio Group Corporation’s shares and votes. On October 13, 2020, The Capital Group Companies Inc held a total of 1,288,756 shares in Revenio Group Corporation.
Management transactionsTransactions in Revenio securities by members of Revenio Group Corporation's management during the financial period have been published as stock exchange releases and can be viewed on the company website at www.reveniogroup.fi/en/releases.
Corporate Governance
Corporate governance
In its decision-making and corporate governance, Revenio Group Corporation abides by the Finnish Limited Liability Companies Act, other legal provisions concerning listed companies, Revenio Group Corporation's Articles of Association, and the rules and guidelines issued by Nasdaq Helsinki Ltd. The company complies with the Finnish Corporate Governance Code approved on September 19, 2019 and issued on January 1, 2020 by the Securities Market Association.
Revenio’s Corporate Governance statements are published annually simultaneously with the company’s Annual Report on the company website at
www.reveniogroup.fi/en/investors/corporate_governance.
The company’s Corporate Governance statements are available in the Investors section of the company website at
www.reveniogroup.fi/en/investors/corporate_governance.
* Monitor by Modular Finance AB. Compiled and processed ownership data from various public sources, including Euroclear Finland and Morningstar, and from direct shareholder disclosures. Whilst all efforts have been made to secure as updated and complete information as possible, neither Modular Finance nor Revenio Group can guarantee the completeness or accuracy of the data.

8REPORT BY THE
BOARD OF DIRECTORS
CONSOLIDATED
FINANCIAL STATEMENTS
PARENT COMPANY
FINANCIAL STATEMENTSSIGNATURES AUDITOR'S NOTE
Annual General Meeting and Board authorizations in effect
Decisions by the Annual General Meeting of Revenio Group Corporation on June 8, 2020
1. FINANCIAL STATEMENTS, BOARD AND AUDITORS
The Annual General Meeting confirmed the company’s financial statements for the financial year January 1–December 31, 2020 and discharged the members of the Board of Directors and the Managing Director from liability.
The Annual General Meeting decided to elect six members to the Board of Directors. Pekka Rönkä, Kyösti Kakkonen, Ann-Christine Sundell, and Pekka Tammela were re-elected as Board members and Arne Boye Nielsen and Bill Östman were elected as new members. At its organization meeting, held after the Annual General Meeting, the Board of Directors elected Pekka Rönkä as Chair of the Board. The Board also decided on the composition of the Audit Committee and re-elected Pekka Rönkä, Pekka Tammela, and Ann-Christine Sundell as its members. Pekka Tammela was re-elected as Chair of the Audit Committee.
The Annual General Meeting decided that the Chair of the Board is entitled to an annual emolument of EUR 48,000, Board members acting as Chair of a committee to an annual emolument of EUR 30,000, and other Board members to an annual emolument of EUR 24,000.
A total of 40% of Board members’ emoluments will be paid out in the form of company shares, while 60% will comprise a monetary payment. The Annual General Meeting also decided that the members of the Board of Directors and committees will be paid a fee of EUR 600 for board and committee meetings and EUR 300 per meeting for telephone meetings.
The Annual General Meeting decided to re-appoint Deloitte Oy, Authorized Public Accountants, as the company’s auditors, with Mikko Lahtinen, Authorized Public Accountant, as the principal auditor. The Annual General Meeting decided to compensate the auditors upon the presentation of an invoice approved by the company.
2. ANNUAL PROFIT DISTRIBUTION AND DIVIDEND DISTRIBUTION
In accordance with the proposal of the Board of Directors, the Annual General Meeting decided that a dividend of EUR 0.30 per share will be paid. Dividends will be paid to shareholders who have been registered in the company’s shareholder register, maintained by Euroclear Finland Ltd, by the dividend record date June 10, 2020. The dividend payment date was June 17, 2020.
3. AUTHORIZING THE BOARD OF DIRECTORS TO DECIDE TO REPURCHASE THE COMPANY’S OWN SHARES
The Annual General Meeting authorized the Board to make the decision to buy back a maximum of 1,329,951 of the company's own shares in one or several tranches using the company's non-restricted equity capital. The company may buy back shares to develop its capital structure, to finance and implement any corporate acquisitions or other transactions, to implement share-based incentive plans, to pay Board members’ emoluments or otherwise transfer or cancel them.
The company may buy back shares in public trading on marketplaces whose rules and regulations allow the company to trade in its own shares. In such a case, the company will buy back shares through a directed purchase, that is, in a proportion other than its shareholders’ holdings in company shares, with the
consideration for the shares based on their publicly quoted market price. This will be done in such a manner that the minimum price of the purchased shares equals the lowest market price quoted in public trading during the authorization period, and, similarly, their highest price equals the highest market price quoted in public trading during that period.
The authorization is valid until the end of the Annual General Meeting to be held in 2021, however, no later than until 30 June 2021. This authorization supersedes the previous buyback authorizations granted at Annual General Meetings.
4. AUTHORIZATION TO THE BOARD OF DIRECTORS TO DECIDE ON A SHARE ISSUE AND ON THE GRANTING OF STOCK OPTIONS AND OTHER SPECIAL RIGHTS GIVING ENTITLEMENT TO SHARES
The Annual General Meeting authorized the Board of Directors to decide to issue a maximum of 1,329,951 shares or to grant special rights (including stock options) entitling to shares, as referred to in chapter 10, section 1 of the Limited Liability Companies Act, in one or several tranches.
This authorization will be used to finance and implement any prospective corporate acquisitions or other transactions, to implement the company’s share-based incentive plans, or for other purposes determined by the Board.
It grants the Board the right to decide on all terms and conditions governing the said share issue and the granting of special rights, including the subscribers or grantees of the special rights, and the consideration payable. It also includes the right to waive shareholders' preemptive subscription rights, and it covers the issue of new shares and the transfer of any shares that may be held by the company.

9REPORT BY THE
BOARD OF DIRECTORS
CONSOLIDATED
FINANCIAL STATEMENTS
PARENT COMPANY
FINANCIAL STATEMENTSSIGNATURES AUDITOR'S NOTE
The authorization is valid until the end of the Annual General Meeting to be held in 2021, however, no later than until June 30, 2021. This authorization supersedes the authorizations to decide on a share issue and the granting of other special rights giving entitlement to shares granted at previous Annual General Meetings.
Board of Directors and AuditorsUp to the Annual General Meeting, the members of the Board of Directors were Pekka Rönkä (Chair), Kyösti Kakkonen, Ari Kohonen, Ann-Christine Sundell, and Pekka Tammela. At the Annual General Meeting of June 8, 2020, Pekka Rönkä, Kyösti Kakkonen, Arne Boye Nielsen, Ann-Christine Sundell, Pekka Tammela, and Bill Östman were elected as members of the Board of Directors. At its organization meeting following the Annual General Meeting, the Board of Directors elected Pekka Rönkä as Chair of the Board from among its members.
At its organization meeting following the 2020 Annual General Meeting, the Board also elected the members of the Audit Committee from among its members. The following members were re-elected for the Audit Committee: Pekka Tammela (Chair), Pekka Rönkä and Ann-Christine Sundell.
On October 21, 2020, the Board of Directors established a Nomination and Remuneration Committee and, in accordance with the charter of the Committee, elected the following members from among its members for the Committee: Ann-Christine Sundell (Chair), Arne Boye Nielsen, and Bill Östman.
In 2020, the Board of Directors met 27 times, and the average attendance rate of Board members at meetings was 99%. In 2019, the attendance rate was 97%.
In 2020, the Audit Committee met 6 times, and the attendance rate was 100%. In 2019, the attendance rate
was 100%. In 2020, the Nomination and Remuneration Committee met once, and the attendance rate was 100%.
In the course of the financial year, the company paid, in total, EUR 180,000 in payments as Board emoluments. In addition, a total of 2,126 Revenio Group Corporation shares were granted as Board emoluments. Members of the Audit Committee were paid a fee of EUR 600 per meeting for attendance in person and a fee of EUR 300 per meeting for attendance by telephone, a total of EUR 6,900. Members of the Nomination and Remuneration Committee were paid a fee of EUR 600 per meeting for attendance in person and a fee of EUR 300 per meeting for attendance by telephone, a total of EUR 900.
Deloitte Oy, Authorized Public Accountants, acts as the company’s auditors, with Mikko Lahtinen, Authorized Public Accountant, as the principal auditor.
Audit CommitteeAt its organization meeting following the 2020 Annual General Meeting, the Board of Directors elected the members of the Audit Committee from among its members. The following members were re-elected for the Audit Committee: Pekka Tammela (Chair), Pekka Rönkä and Ann-Christine Sundell.
The duties of the Audit Committee are to:
• monitor and assess the financial reporting system;
• monitor and assess the efficiency of internal control and auditing as well as of the risk management systems;
• monitor and assess how agreements and other legal acts between the company and its related parties meet the requirements of the ordinary course of business and market terms;
• monitor and evaluate the independence of the auditor and, in particular, the offering of services other than auditing services by the auditor;
• monitor the company’s auditing;
• prepare the appointment of the company’s auditor.
In addition, the tasks of the company Audit Committee include:
• monitoring the statutory auditing of the financial statements and consolidated financial statements as well as the reporting process and ensure their accuracy;
• supervising the financial reporting process;
• reviewing the effectiveness of Revenio Group Corporation's internal control and risk management systems, the Group's risks, and the quality and scope of risk management;
• approving the internal audit guidelines and reviewing the internal audit plans and reports;
• reviewing the description of the main features of the internal control and risk management systems in relation to the financial reporting process, which is included in the company's Corporate Governance Statement;
• evaluating the independence and work of the statutory auditor and proposing a resolution on the election and fee of the auditor;
• evaluating compliance with laws, regulations, and Company policies and monitoring significant litigations of Group companies;
• executing any other duties bestowed upon it by the Board.

10REPORT BY THE
BOARD OF DIRECTORS
CONSOLIDATED
FINANCIAL STATEMENTS
PARENT COMPANY
FINANCIAL STATEMENTSSIGNATURES AUDITOR'S NOTE
RemunerationRevenio’s remuneration reporting consists of the Remuneration Policy presented to the Annual General Meeting at least once every four years and, from 2020, the Remuneration Report, presented each year, which provides information on the fees paid to the company’s governing bodies in the financial period. The company will publish the Remuneration Report for 2020 as a separate document available on the company’s website at www.reveniogroup.fi/en/investors/corporate_gover-nance/remuneration. In addition, the company’s website provides information on the current remuneration schemes of the Board of Directors and the President & CEO as well information on the remuneration of the Group Management Team on an aggregate level.
Assessment of significant risks and uncertainty factorsRevenio Group’s typical risks are divided into strategic, operational, trade cycle, hazard, financial, and political risks. In addition, the threat of the global impact of pandemics and the risk of cyber threats have increased.
The Group’s strategic risks include competition in all sectors, the threat posed by new competing products, and any other actions of the company’s rivals that may affect the competitive situation. Another strategic risk is related to the ability to succeed in R&D activities and to maintain a competitive product mix. The Group develops new technologies under Icare Finland Oy, Revenio Research Oy and CenterVue SpA, and any failure in the commercialization of individual development projects may result in the depreciation of capitalized development expenses, with an impact on the result. Strategic risks in the Group's segments that require special expertise are also associated with the successful management and development of key
human resources and the management of the subcontractor and supplier network.
Corporate acquisitions and the purchase of assets with growth potential related to health tech are part of the Group strategy. The success of these acquisitions has a significant impact on the achievement of growth and profitability targets. Acquisitions may also change the Group’s risk profile.
Strategic risks and the need for action are regularly assessed and are monitored in connection with day-to-day management, monthly Group reporting, and annual strategy updates.
Operational risks are associated with the retention and development of major customers, the operations of the distribution network, and success in extending the customer base and markets. In the health technology sector especially, operational risks include factors related to expansion into new markets, such as various countries' national regulations of marketing authorizations for medical instruments and the related official decisions concerning the health care market. Success in health tech R&D projects launched in accordance with the strategy can also be classified as an operational risk.
The operational risks related to the manufacture, product development, and production control of medical instruments are estimated to be higher than average due to the sector’s requirements concerning quality.
Hazard risks are covered by insurance. Property and business interruption insurance provides protection against risks in these areas. The business pursued is covered by international liability insurance.
Financial risks can be further categorized into credit, interest-rate, liquidity, and foreign exchange risks. To manage credit loss risks, the Group’s credit policy lays
Nomination and Remuneration CommitteeOn October 21, 2020, Revenio's Board of Directors established a Nomination and Remuneration Committee. The Nomination and Remuneration Committee assists the Board of Directors in preparatory work for the election of Board members, the nomination and remuneration of the President & CEO and other management, and the remuneration schemes for other personnel.
In accordance with the charter of the Nomination and Remuneration Committee, the Board elected the following members from among its members for the Committee: Ann-Christine Sundell (Chair), Arne Boye Nielsen and Bill Östman.
The duties of the Nomination and Remuneration Committee include:
• preparing a proposal to the Annual General Meeting on the members of the Board of Directors;
• preparing a proposal to the Annual General Meeting on the remuneration of Board members;
• preparatory work for the nomination of the President & CEO;
• preparing proposals related to the salary and other financial benefits of the President & CEO and other management;
• preparing matters related to the Company’s remuneration schemes;
• assessing the remuneration of the President & CEO and other management and ensuring the appropriateness of the remuneration schemes;
• preparing the Remuneration Report;
• answering questions related to the Remuneration Report at the Annual General Meeting.
11REPORT BY THE
BOARD OF DIRECTORS
CONSOLIDATED
FINANCIAL STATEMENTS
PARENT COMPANY
FINANCIAL STATEMENTSSIGNATURES AUDITOR'S NOTE
down the requirements for selling on credit and the requirements for credit management. Every month, and more frequently if necessary, the Board, in its meetings, assesses matters related to financial issues. If required, the Board provides decisions and guidelines for the management of financial risks concerning interest-rate and currency hedging, for instance. The liquidity risk can be affected by the availability of external financing, the development of the Group’s credit standing, the trend in business operations, and changes in the payment behavior of customers. Liquidity risks are monitored by means of cash forecasts, which are drawn up for periods of 12 months at the most at a time.
Revenio Group sells products in nearly 100 countries. Trade policy uncertainties, an unstable political situation, Brexit, and any protective tariffs may affect demand for Revenio Group’s products. Revenio actively monitors political developments in different market areas from the risk management perspective. Developments in the political operating environment and legislation may have an impact on Revenio Group’s business.
Moreover, global pandemics such as Covid-19 could have direct and indirect effects on Revenio Group's business, and a pandemic could increase the risk of personnel falling ill. Closures of factories and borders in accordance with government regulations could potentially weaken Revenio's business conditions, and restrictions on movement could hamper the sales and delivery of Revenio's products.
DisputesThe company is not currently involved in any disputes or legal proceedings that, in the opinion of the Board, would have a significant impact on the Group's financial position.
Corporate responsibilityResponsibility is an important part of Revenio Group’s operations. During the year, Revenio continued to further develop its corporate responsibility program and define the responsibility goals. The corporate responsibility priorities are based on the Group’s strategic guidelines and the value created for stakeholders, society, the environment, and the climate. In every aspect of its operations, the Group takes into account the special characteristics of the business and operating environment in the field of health technology and supports the UN’s Sustainable Development Goals.
Research and development activitiesR&D expenditure during the financial year totaled EUR 4.6 (4.2) million. A total of EUR 0.1 (0.5) million of R&D costs were capitalized during the period.
Major events after the financial periodThere were no major events after the end of the financial period.
Financial guidance for 2021Revenio Group’s exchange rate-adjusted net sales are estimated to grow strongly from the previous year and profitability is to remain at a good level without non-recurring items.
The Board's Proposal to the Annual General MeetingThe Group's profit for the period was EUR 13,361,739.31 and the parent company's profit was EUR 13,655,019.23. The parent company’s distributable earnings on December 31, 2020 totaled EUR 68,822,657.00. The Board of Directors will propose to
the Annual General Meeting on March 17, 2021 that the parent company’s distributable earnings be allocated by paying a per-share dividend of EUR 0.32 (0.30), for a total of EUR 8,530,864.64, against the total number of shares at the close of the reporting period. The remainder of the distributable earnings will be retained in equity.
In the Board’s opinion, the proposed distribution of earnings does not endanger the parent company’s or Group’s liquidity.

12REPORT BY THE
BOARD OF DIRECTORS
CONSOLIDATED
FINANCIAL STATEMENTS
PARENT COMPANY
FINANCIAL STATEMENTSSIGNATURES AUDITOR'S NOTE
1–12/2020 1–12/2019 1–12/2018 1–12/2017 1–12/2016
Net sales, TEUR 61,067 49,474 30,658 26,791 23,434
Net sales, TEUR 17,130 12,593 10,205 8,120 7,058
Operating profit, TEUR 28.1 25.5 33.3 30.3 30.1
Profit before taxes, TEUR 16,719 12,273 10,235 8,290 7,116
Profit before taxes, % 27.4 24.8 33.4 30.9 30.4
Net profit for financial period, TEUR 13,362 9,343 8,103 6,850 5,584
Net profit, % 21.9 18.9 26.4 25.6 23.8
Gross capital expenditure in non-current assets, TEUR 2,389 68,167 1,895 816 1,494
Gross capital expenditure, % of net sales 3.9 137.8 6.2 3 6.4
R&D expenses, TEUR 4,602 4,227 3,477 2,379 776
R&D expenses, % 7.5 8.5 11.3 8.9 3.3
Return on equity, % 19.9 22.7 47.6 44.3 37.2
Return on investment, % 18.1 22.6 59.5 53.2 45.6
Equity ratio, % 60.9 58.6 81.8 84 78.9
Net leveraging, % -2.4 2.2 -55.6 -47.6 -43.8
Leveraging, % 39.0 44.8 1.8 2.1 5
Average number of personnel 135 88 48 41 41
Key figures
12 MONTHS, IFRS 12 MONTHS, IFRS
KEY INDICATORS PER SHARE 1–12/2020 1–12/2019 1–12/2018 1–12/2017 1–12/2016
Earnings per share, EUR 0.50 0.36 0.34 0.29 0.23
Equity attributable to equity owners of the parent company per share, EUR
2.61 2.42 0.75 0.67 0.66
Dividend per share, EUR 0.32 0.30 0.28 0.26 0.25
Dividend payout ratio, % 63.4 85.1 82.6 90.3 105.8
Effective dividend yield, % 0.6 1.1 2.2 2.2 2.4
P/E ratio 99.6 72.0 37.0 41.7 43.5
Diluted number of shares at end of period 26,658,92 26,544,742 24,016,476 7,979,406 7,979,406
Diluted number of shares average during period (acquired own shares excluded)
26,476, 975 25,645,898 23,960,263 7,975,947 7,968,685
Share price, year low, EUR 18.48 12.56 11.35 29.23 22.2
Share price, year high, EUR 51.5 28.05 16.6 41.41 30.74
Share price, average, EUR 30.98 20.80 13.93 34.09 25.66
Share price at the end of period, EUR 50.30 26.25 12.56 36.00 30.48
Market capitalization at endof period, MEUR 1341 696.8 301.6 287.3 243.2
Turnover, number of shares 14,420,198 5,957,650 6,521,878 6,611,787 5,640,423
Turnover, % 54.1 22.4 27.2 27.6 23.6

13REPORT BY THE
BOARD OF DIRECTORS
CONSOLIDATED
FINANCIAL STATEMENTS
PARENT COMPANY
FINANCIAL STATEMENTSSIGNATURES AUDITOR'S NOTE
ALTERNATIVE GROWTH INDICATOR, TEUR 1–12/2020 1–12/2019
Reported net sales 61,067 49,474
Effect of exchange rates on net sales 1,493 -841
Net sales adjusted with the effect of exchange rates 62,560 48,634
Growth in net sales, adjusted with the effect of exchange rates 26.5% 58.6%
Reported net sales growth 23.4% 61.4%
Difference, % points 3.1% 2.8%
Alternative key figure
Revenio Group's revenue is impacted heavily by the fluctuations of the EUR/USD exchange rate. As a alternative performance measure we have presented our revenue also with constant exchanges rates.
Net profit for the period (share calculated for the parent company's shareholders)Average number of shares during the period – own shares purchased
Equity attributable to shareholdersNumber of shares at end of period
Profit before taxes + interest and other financial expensesBalance sheet total – non-interest-bearing debt
Earnings per share
Profit before taxes
Equity per share
Return on investment (ROI), %
Equity ratio, %
Net leveraging, %
Return on equity (ROE), %
x 100
x 100
Definition of key figures:
Operating profit + financial income – financial expenses
Shareholders’ equity on balance sheet + Non-controlling interestBalance sheet total – Advance payments received
Interest-bearing debt – cash & equivalentsTotal equity
Profit for the periodShareholders’ equity + non-controlling interest
EBITDA Operating profit + amortization + impairments
x 100
x 100
14REPORT BY THE
BOARD OF DIRECTORS
CONSOLIDATED
FINANCIAL STATEMENTS
PARENT COMPANY
FINANCIAL STATEMENTSSIGNATURES AUDITOR'S NOTE
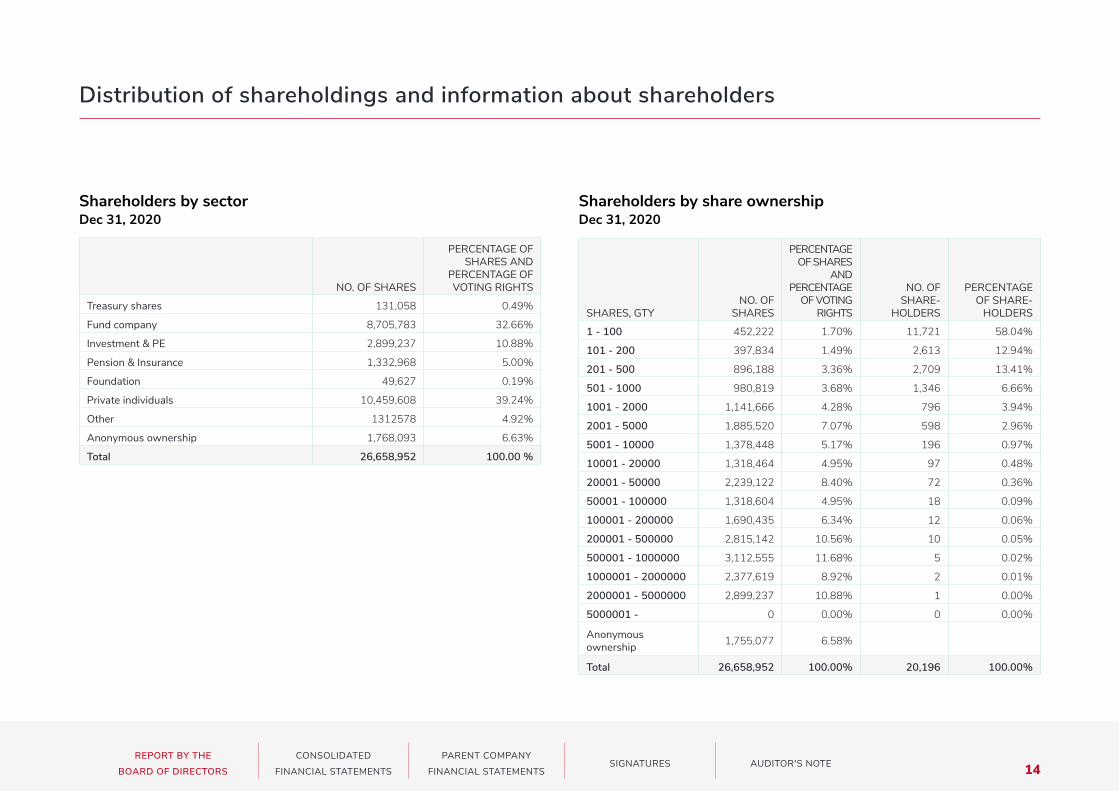
Distribution of shareholdings and information about shareholders
Shareholders by share ownershipDec 31, 2020
SHARES, GTYNO. OF
SHARES
PERCENTAGE OF SHARES
AND PERCENTAGE
OF VOTING RIGHTS
NO. OF SHARE
HOLDERS
PERCENTAGE OF SHARE
HOLDERS
1 - 100 452,222 1.70% 11,721 58.04%
101 - 200 397,834 1.49% 2,613 12.94%
201 - 500 896,188 3.36% 2,709 13.41%
501 - 1000 980,819 3.68% 1,346 6.66%
1001 - 2000 1,141,666 4.28% 796 3.94%
2001 - 5000 1,885,520 7.07% 598 2.96%
5001 - 10000 1,378,448 5.17% 196 0.97%
10001 - 20000 1,318,464 4.95% 97 0.48%
20001 - 50000 2,239,122 8.40% 72 0.36%
50001 - 100000 1,318,604 4.95% 18 0.09%
100001 - 200000 1,690,435 6.34% 12 0.06%
200001 - 500000 2,815,142 10.56% 10 0.05%
500001 - 1000000 3,112,555 11.68% 5 0.02%
1000001 - 2000000 2,377,619 8.92% 2 0.01%
2000001 - 5000000 2,899,237 10.88% 1 0.00%
5000001 - 0 0.00% 0 0.00%
Anonymous ownership 1,755,077 6.58%
Total 26,658,952 100.00% 20,196 100.00%
Shareholders by sectorDec 31, 2020
NO. OF SHARES
PERCENTAGE OF SHARES AND
PERCENTAGE OF VOTING RIGHTS
Treasury shares 131,058 0.49%
Fund company 8,705,783 32.66%
Investment & PE 2,899,237 10.88%
Pension & Insurance 1,332,968 5.00%
Foundation 49,627 0.19%
Private individuals 10,459,608 39.24%
Other 1312578 4.92%
Anonymous ownership 1,768,093 6.63%
Total 26,658,952 100.00 %

15REPORT BY THE
BOARD OF DIRECTORS
CONSOLIDATED
FINANCIAL STATEMENTS
PARENT COMPANY
FINANCIAL STATEMENTSSIGNATURES AUDITOR'S NOTE
NOTE NO.
JAN 1–DEC 31, 2020
JAN 1–DEC 31, 2019
Net sales 1, 2 61,067 49,474
Other operating income 3 1,316 1,311
Use of materials and services
Materials:
Purchases during the financial period -14,095 -5,899
Change in inventories 759 -5,396
External services -4,392 -3,642
Materials and services total -17,728 -14,937
Employee benefit expenses 4, 5, 6
Salaries and fees -11,023 -8,325
Indirect personnel costs
Pension costs -1,444 -1,156
Other indirect personnel expenses -250 -291
Employee benefit expenses total -12,718 -9,772
Depreciation, amortization, and impairment 12, 13
Depreciation -2,606 -2,023
Impairments -1,956 0
Depreciation, amortization, and impairment total -4,563 -2,023
NOTE NO.
JAN 1–DEC 31, 2020
JAN 1–DEC 31, 2019
Other operating expenses 7, 8 -10,244 -11,460
Operating profit 17,130 12,593
Financial income and expenses 9
Financial income 1 5
Financial expenses -412 -325
Financial income and expenses total -411 -320
Profit before taxes 16,719 12,273
Taxes 10
Income taxes -3,357 -2,930
Taxes total -3,357 -2,930
Profit for the period 13,362 9,343
Other comprehensive income items
Items that may be reclassified subsequently to profit or loss
Translation differences from foreign operations -386 19
Items that are not reclassified to profit or loss
Remeasurements of defined benefit liabilities -194 -6
TOTAL COMPREHENSIVE INCOME FOR THE PERIOD 12,782 9,356
Earnings per share calculated from the profit Earnings per share 11
Undiluted earnings per share (EUR) 0.505 0.365
Diluted earnings per share (EUR) 0.504 0.364
Consolidated comprehensive profit & loss statementThe notes to the financial statements form an essential part of the financial statements.
TEUR TEUR

16REPORT BY THE
BOARD OF DIRECTORS
CONSOLIDATED
FINANCIAL STATEMENTS
PARENT COMPANY
FINANCIAL STATEMENTSSIGNATURES AUDITOR'S NOTE
ASSETSNOTE
NO. DEC 31, 2020 DEC 31, 2019
Non-current assets
Goodwill 12 50,409 50,409
Other intangible assets 12 16,861 19,438
Property, plant, and equipment 12 2,018 1,809
Right-of-use assets 13 932 757
Other receivables 157 83
Non-current assets total 70,378 72,496
Current assets
Inventories 14 4,875 3,452
Trade and other receivables 15 8,565 6,402
Deferred tax assets 10 1,009 766
Assets for current tax 714 0
Cash and cash equivalents 15 28,878 26,675
Current assets total 44,041 37,295
ASSETS TOTAL 114,419 109,791
EQUITY AND LIABILITIESNOTE
NO. DEC 31, 2020 DEC 31, 2019
Equity 16, 17
Share capital 5,315 5,315
Fair value reserve 300 300
Reserve for invested unrestricted equity 52,505 51,152
Other reserves 280 280
Retained earnings 13,971 7,999
Translation differences -329 57
Own shares -2,333 -740
SHAREHOLDERS’ EQUITY TOTAL 69,710 64,363
LIABILITIESNOTE
NO. DEC 31, 2020 DEC 31, 2019
Non-current liabilities
Deferred tax liabilities 10 3,856 4,120
Interest-bearing non-current liabilities 19 21,659 23,817
Lease liabilities 376 367
Pension obligations 6 701 428
Other non-current liabilities 19 0 1,155
Non-current liabilities total 26,591 29,888
Current liabilities
Deferred tax liabilities 10 425 225
Current tax liabilities 2,108 1,030
Interest-bearing current liabilities 19 4,604 4,259
Lease liabilities 581 420
Provisions 20 330 397
Trade and other payables 21 10,071 9,209
Current liabilities total 18,118 15,540
LIABILITIES TOTAL 44,709 45,428
EQUITY AND LIABILITIES TOTAL 114,419 109,791
Consolidated balance sheet
The notes to the financial statements form an essential part of the financial statements. TEUR
TEUR
TEUR
17REPORT BY THE
BOARD OF DIRECTORS
CONSOLIDATED
FINANCIAL STATEMENTS
PARENT COMPANY
FINANCIAL STATEMENTSSIGNATURES AUDITOR'S NOTE
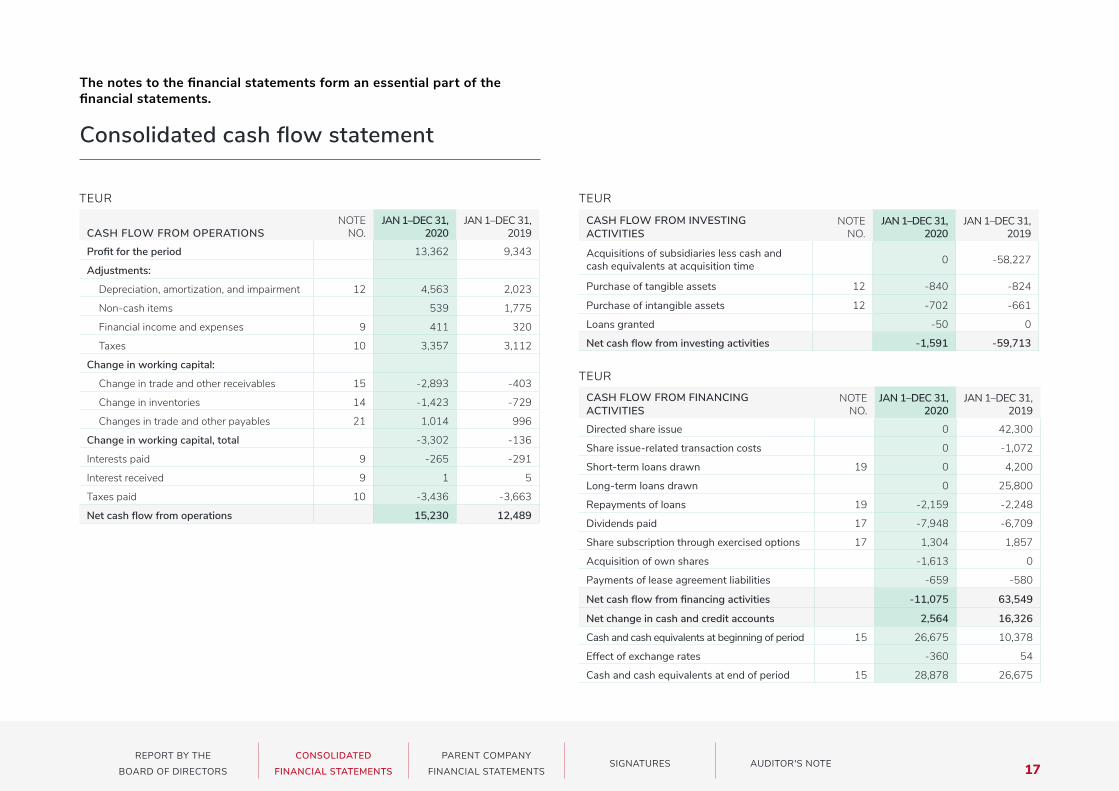
CASH FLOW FROM OPERATIONSNOTE
NO.JAN 1–DEC 31,
2020JAN 1–DEC 31,
2019
Profit for the period 13,362 9,343
Adjustments:
Depreciation, amortization, and impairment 12 4,563 2,023
Non-cash items 539 1,775
Financial income and expenses 9 411 320
Taxes 10 3,357 3,112
Change in working capital:
Change in trade and other receivables 15 -2,893 -403
Change in inventories 14 -1,423 -729
Changes in trade and other payables 21 1,014 996
Change in working capital, total -3,302 -136
Interests paid 9 -265 -291
Interest received 9 1 5
Taxes paid 10 -3,436 -3,663
Net cash flow from operations 15,230 12,489
CASH FLOW FROM INVESTING ACTIVITIES
NOTE NO.
JAN 1–DEC 31,2020
JAN 1–DEC 31,2019
Acquisitions of subsidiaries less cash and cash equivalents at acquisition time 0 -58,227
Purchase of tangible assets 12 -840 -824
Purchase of intangible assets 12 -702 -661
Loans granted -50 0
Net cash flow from investing activities -1,591 -59,713
CASH FLOW FROM FINANCING ACTIVITIES
NOTE NO.
JAN 1–DEC 31,2020
JAN 1–DEC 31,2019
Directed share issue 0 42,300
Share issue-related transaction costs 0 -1,072
Short-term loans drawn 19 0 4,200
Long-term loans drawn 0 25,800
Repayments of loans 19 -2,159 -2,248
Dividends paid 17 -7,948 -6,709
Share subscription through exercised options 17 1,304 1,857
Acquisition of own shares -1,613 0
Payments of lease agreement liabilities -659 -580
Net cash flow from financing activities -11,075 63,549
Net change in cash and credit accounts 2,564 16,326
Cash and cash equivalents at beginning of period 15 26,675 10,378
Effect of exchange rates -360 54
Cash and cash equivalents at end of period 15 28,878 26,675
TEUR TEUR
TEUR
Consolidated cash flow statement
The notes to the financial statements form an essential part of the financial statements.
18REPORT BY THE
BOARD OF DIRECTORS
CONSOLIDATED
FINANCIAL STATEMENTS
PARENT COMPANY
FINANCIAL STATEMENTSSIGNATURES AUDITOR'S NOTE
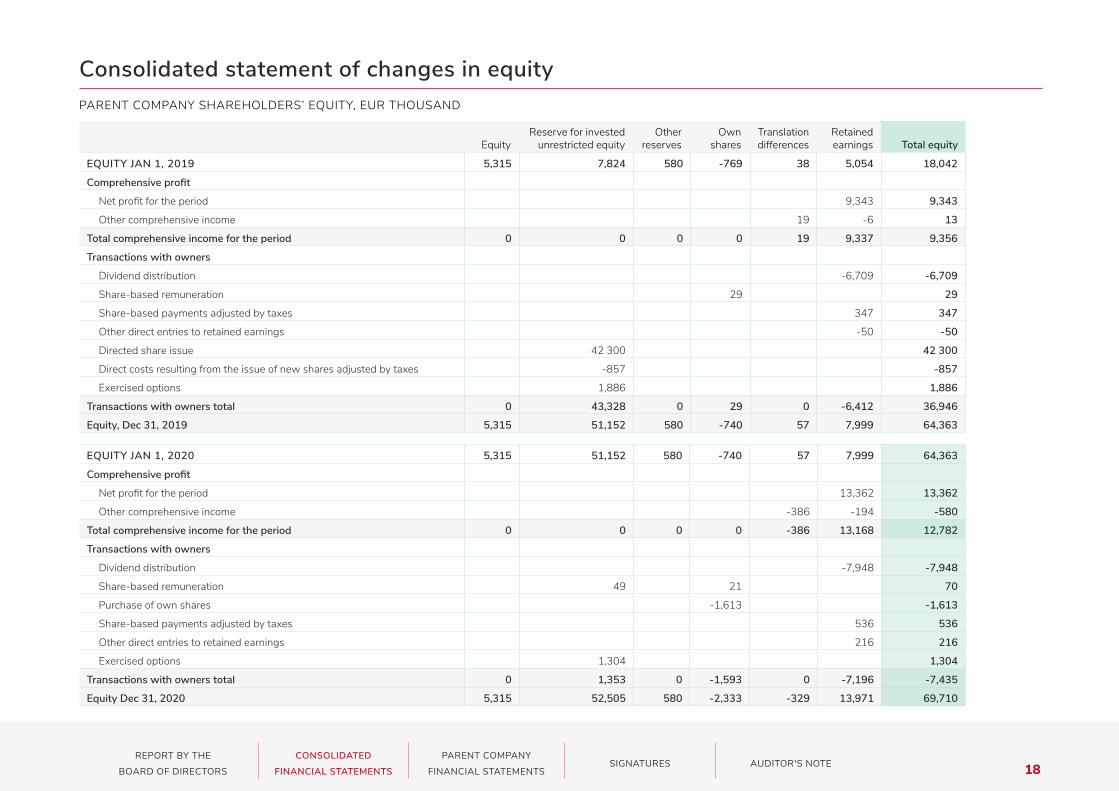
EquityReserve for invested
unrestricted equity Other
reservesOwn
sharesTranslation differences
Retained earnings Total equity
EQUITY JAN 1, 2020 5,315 51,152 580 -740 57 7,999 64,363
Comprehensive profit
Net profit for the period 13,362 13,362
Other comprehensive income -386 -194 -580
Total comprehensive income for the period 0 0 0 0 -386 13,168 12,782
Transactions with owners
Dividend distribution -7,948 -7,948
Share-based remuneration 49 21 70
Purchase of own shares -1,613 -1,613
Share-based payments adjusted by taxes 536 536
Other direct entries to retained earnings 216 216
Exercised options 1,304 1,304
Transactions with owners total 0 1,353 0 -1,593 0 -7,196 -7,435
Equity Dec 31, 2020 5,315 52,505 580 -2,333 -329 13,971 69,710
PARENT COMPANY SHAREHOLDERS’ EQUITY, EUR THOUSAND
Consolidated statement of changes in equity
EQUITY JAN 1, 2019 5,315 7,824 580 -769 38 5,054 18,042
Comprehensive profit
Net profit for the period 9,343 9,343
Other comprehensive income 19 -6 13
Total comprehensive income for the period 0 0 0 0 19 9,337 9,356
Transactions with owners
Dividend distribution -6,709 -6,709
Share-based remuneration 29 29
Share-based payments adjusted by taxes 347 347
Other direct entries to retained earnings -50 -50
Directed share issue 42 300 42 300
Direct costs resulting from the issue of new shares adjusted by taxes -857 -857
Exercised options 1,886 1,886
Transactions with owners total 0 43,328 0 29 0 -6,412 36,946
Equity, Dec 31, 2019 5,315 51,152 580 -740 57 7,999 64,363
19REPORT BY THE
BOARD OF DIRECTORS
CONSOLIDATED
FINANCIAL STATEMENTS
PARENT COMPANY
FINANCIAL STATEMENTSSIGNATURES AUDITOR'S NOTE
Notes to the consolidatedfinancial statements
Dec 31, 2020
General Revenio is a health tech group operating on the international market and a global leader in ophthalmological devices. Revenio Group's ophthalmic diagnostic solutions include intraocular pressure measurement devices under the Icare brand and retinal imaging devices. The main tools for the detection and diagnosis of glaucoma and its monitoring during treatment are intraocular pressure measurement (tonometry), retinal imaging, and visual field tests (perimetry). The Group’s product range also includes the Ventica device, designed to detect asthma in children, and the skin cancer camera Cutica, still in the development phase.
Revenio Group Corporation (1700625-7) is the parent company of the Revenio Group. The company is a public limited company registered in Finland, with its domicile in the City of Vantaa, and is listed on the Nasdaq Helsinki Stock Exchange since October 2001. The company’s registered address is Äyritie 22, 01510 Vantaa, Finland.
The Board of Directors of the Revenio Group Corporation approved these financial statements for publication at its meeting on February 19, 2021. According to the Finnish Limited Liability Companies Act, shareholders have the right to approve or reject the financial statements at the Annual General Meeting following their issuance. The AGM may also decide on amendments to the financial statements.
Copies of the financial statements are available on the company’s website at www.reveniogroup.fi and at the Head Office of the Group’s parent company.
Accounting principles for the consolidated financial statements
Basis of preparation
The consolidated financial statements have been prepared in accordance with the International Financial Reporting Standards, IFRS, approved for use in the EU. The IAS and IFRS Standards and SIC and IFRIC Interpretations in effect on December 31, 2020 have been applied. International Financial Reporting Standards refer to the Standards and their interpretations approved for application in the EU in accordance with the procedure stipulated in Regulation (EC) No 1606/2002 and embodied in Finnish accounting legislation and the statutes enacted under it. The notes to the consolidated financial statements also comply with Finnish accounting and company legislation complementing the IFRS Standards.
The consolidated financial statements are presented in the euro currency, which is the operational and accounting currency for the Group’s parent company and all of its subsidiaries, with the exception of Icare USA Inc., whose operating currency is the U.S. dollar.
Application of new or revised IFRS Standards and IFRIC Interpretations
The consolidated financial statements have been prepared on the same principles as in 2019, with the exception of the following new Standards, Interpretations, and amendments to existing Standards, which the Group has applied as of January 1, 2020.
• IAS 1 and IAS 8; amendments to definition of materiality
• IFRS 3; amendments to definition of a business
• IFRS 9, IAS 39 and IFRS 7; interest rate benchmark reform
• IFRS 16; amendment regarding Covid-19-related rent concessions
The amendments to the standards listed above have not had a material impact on the financial statements presented herein.
Critical accounting estimates and assumptions
The preparation of the financial statements requires the use of estimates and assumptions about the future. The actual results may differ from these estimates and assumptions. In addition, judgment needs to be exercised in the application of accounting principles. The most significant items of the financial statements where the management has been required to use its judgment and for which the estimates include uncertainty are presented below.
• Note 6) Pension liabilities
Assumptions and judgment have been exercised to determine the actuarial assumptions used for calculating the present value of the defined benefit pension plans.
• Note 12) Intangible and tangible assets, section Goodwill
The Group tests goodwill annually and assesses indications of impairment as described under accounting principles. The recoverable amounts of cash-generating units are defined based on value in use. These calculations require the use of estimates on the profitability of the business and on all factors that may affect it.
• Note 12) Intangible and tangible assets, section Other intangible assets
For other intangible assets with a limited useful life, it is estimated annually whether any indications of their impairment exist. If such indications are detected, the other intangible assets are subjected to impairment testing. These calculations require the use of estimates.
Besides the Group strategy, and action and financial plans and prognoses for the coming years, Group management bases its prognoses on estimates about the macro- and micro-economic factors that affect demand in the business. The estimates used reflect actual history and are consistent with external information.
§

20REPORT BY THE
BOARD OF DIRECTORS
CONSOLIDATED
FINANCIAL STATEMENTS
PARENT COMPANY
FINANCIAL STATEMENTSSIGNATURES AUDITOR'S NOTE
Consolidation principles
The consolidated financial statements include the parent company Revenio Group Oyj and all subsidiaries in which the Group has a controlling interest. The Group has a controlling interest in a company if the interest exposes the Group to the company’s variable returns or entitles it to such returns, and the Group is able to influence these returns by exercising its power over the company. Subsidiary companies are consolidated wholly from and including the date on which the Group has acquired the right of control. The consolidation will cease when the right of control ends.
The acquisition of subsidiaries is handled using the procurement method. The consideration paid for the acquisition is the fair value of the assets transferred, the equity interests issued, and the liabilities incurred to the former owners. Any contingent consideration is recognized at fair value on the acquisition date and classified as a liability or shareholder equity. Contingent consideration classified as a liability is measured at fair value on the last day of each reporting period. The resulting profit or loss is recognized in the consolidated income statement. The identifiable assets acquired, liabilities assumed and contingent liabilities are initially measured at their acquisition-date fair values. Goodwill is recognized as the amount by which the transferred consideration exceeds the fair value of the net assets acquired. If the acquisition cost is less than the net assets acquired, the resulting profit is recognized through profit or loss at the date of acquisition. All acquisition-related costs are recognized as expenses in the periods in which the costs are incurred and the services are received, with the exception of costs arising from the issuance of debt or equity securities.
All intercompany transactions, receivables, payables, unrealized profits, and internal distribution of profit between subsidiaries are eliminated as part of the consolidation process. Unrealized losses are not eliminated if the loss is a result of impairment.
Foreign currency items
In Group companies, transactions are recorded in the operating currencies of each Group company. Foreign currency transactions are recognized at the exchange rate on the transaction date rate in the operating currency. At the end of the financial period, outstanding receivables, liabilities and monetary items are measured at the exchange rate prevailing on the balance sheet date through profit or loss. Exchange rate gains and losses are included in the corresponding items above operating profit. Exchange rate gains and losses from financing are recorded in financial gains and losses.
The presentation currency of the consolidated financial statements is the euro and the parent company's operating currency is the euro. The income statement of the non-euro area Group company is translated into euros using the average exchange rate in the financial period and the balance sheet is translated at the rates in effect on the last day of the financial period. The translation of the income statement and balance sheet at different rates results in a translation difference to be recognized under equity, the impact of which is recorded in other comprehensive income items. When a Group company outside Finland is founded by the Group itself, its acquisition does not entail goodwill or adjustments to its fair book value and the resulting asset items that should be translated into euros. Changes in translation differences resulting from the translation of equity items accumulated after founding the company are recorded in other comprehensive income. When a company is disposed of, the accumulated translation differences are recognized as part of capital gain or loss.

21REPORT BY THE
BOARD OF DIRECTORS
CONSOLIDATED
FINANCIAL STATEMENTS
PARENT COMPANY
FINANCIAL STATEMENTSSIGNATURES AUDITOR'S NOTE
1) Operating segmentsThe Group consists of a single reportable segment formed out of its independent subsidiaries with business operations and the parent company.
The health technology segment reported by the Group designs, manufactures, and sells health technology products for screening and monitoring. Its focus is on devices that support the diagnosis of eye diseases, skin cancer and asthma and planning their treatment. The clientele consists of health care professionals and patients.
Information on management’s employment benefits are presented in Note 5 Share-based payments and Note 24 Related parties and remuneration of management.
The conditions of the additional purchase price related to the acquisition completed in 2019 were not met, so the company has recorded an adjustment of EUR 986,000 in 2020 for other income and additional purchase price debt.
3) Other operating income
Basis of preparation
Other operating income is income that is not considered to be related to operational activities. Government grants for offsetting realized expenses are recorded under other operating income. Government grants are recognized at the same time as the expenses relating to the target of the grant are recorded as an expense. The Group estimates that it will fulfil the conditions for the grants and considers it reasonably certain that the recognized grants will be awarded.
4) Personnel and personnel expenses2) Net sales
Basis of preparation
The proceeds from the sale of the products and services are shown as net sales to the amount to which the group expects to be entitled for the goods and services promised to the customer. Revenue from sales is recognized when the customer gains control over the goods or services (performance obligation). A performance obligation is an item of goods or services from which the customer may separately benefit. A performance obligation is an individual indicator, device or maintenance service. In the case of imaging equipment, the performance obligation includes not only the equipment but also its delivery and installation. As a rule, control is transferred to the customer upon delivery as per the terms and conditions of agreement.
The sale of tonometers, probes and macular imaging devices represents more than 99% of the Group's net sales.
2020, TEUR FINLAND OTHER EUROPE OTHERS TOTAL
Net sales 871 12,554 47,642 61,067
Non-current assets 6,151 61,297 2,930 70,378
2019, TEUR FINLAND OTHER EUROPE OTHERS TOTAL
Net sales 919 10,416 38,140 49,474
Non-current assets 9,932 61,914 650 72,496
EMPLOYEE BENEFIT EXPENSESJAN 1–DEC 31, 2020
TEURJAN 1–DEC 31, 2019
TEUR
Salaries and wages -10,297 -8,060
Share-based remuneration, paid in shares -726 -265
Pension costs – defined contribution plans -1,356 -1,101
Pension costs – defined benefit plans -88 -55
Other indirect personnel expenses -250 -291
Total -12,718 -9,772
AVERAGE NUMBER OF PERSONNEL DURING FINANCIAL PERIOD JAN 1–DEC 31, 2020 JAN 1–DEC 31, 2019
135 88
Information about geographical areas JAN 1–DEC 31, 2020 TEUR
JAN 1–DEC 31, 2019 TEUR
Grants and subsidies received 244 236
Change in additional purchase price debt 986 0
Change in purchase price debt 0 1,048
Others 87 28
Total 1,316 1,311
§
§

22REPORT BY THE
BOARD OF DIRECTORS
CONSOLIDATED
FINANCIAL STATEMENTS
PARENT COMPANY
FINANCIAL STATEMENTSSIGNATURES AUDITOR'S NOTE
5) Share-based payments
Basis of preparation
The company has a stock option program decided by the Board of Directors on August 10, 2015, based on the authorization of the Annual General Meeting on March 19, 2015, comprising a maximum of 150,000 option rights. The option rights are divided into three series. One option right entitles the holder to subscribe for three Revenio Group Corporation shares. The share subscription price is the trade-weighted average price of the share on Nasdaq Helsinki Oy plus 15 per cent. On the record date of dividend distribution, the subscription price is decreased by the amount of dividend decided between the end of the determination period and the beginning of the share subscription period. By way of deviation from the shareholders' preemptive subscription right, the option rights will be granted, without consideration, to key personnel employed or to be employed by Revenio Group, as decided by the Board of Directors. The shareholders’ preemptive subscription right is waived as the option rights are intended to constitute a part of the incentive program of Revenio Group. To the extent that the option rights are not allocated to the Group's personnel, they will be granted to Done Medical Oy, a wholly owned subsidiary of Revenio.
The benefits granted on the basis of the arrangement are recognized at fair value at grant date, and they are recognized as expenses in the income statement on a straight-line basis during the vesting period. The expense at grant date is based on fair value calculated according to the Black-Scholes option pricing model. The fair value of the shares is based on actual quotations. The expected volatility is determined on the basis of actual historical share price development, taking into account the remaining validity periods of the options. The effect on the financial result of the arrangement is recorded in the income statement under employee benefit expenses and equity earnings. Granted options are equity instruments. When option rights are exercised, the considerations received on the basis of share subscriptions are recorded in the unrestricted equity reserve under shareholders’ equity.
OPTION PROGRAM 2015
SERIESTOTAL
AMOUNTSUBSCRIPTION
PERIOD
TURNOVER PERIOD
DETERMINING THE SUBSCRIP
TION PRICE
DIVIDEND- ADJUSTED
SUBSCRIPTION PRICE
A 50,000 Ended Sep 1, 2015–Oct 15, 2015 Ended
B 50,000 Ended Sep 1, 2016–Oct 15, 2016 Ended
C 50,000 May 31, 2019–May 31, 2021
Sep 1, 2017–Oct 15, 2017 12,48
CHANGES IN OPTIONS 2020
Exercisable options at end of financial period 50,492
New options granted during financial period 2,000
Options returned to the company 0
Reallocated options 0
Used options 38,070
Expired options 2,034
Outstanding options at end of financial period 10,388
Exercisable options at end of financial period 10,388
OPTION RIGHT 31.12.2020 31.12.2019
2015 0 14,850
Total 0 14,850
Members of the Management Team and the managing directors of subsidiaries possessed the following option rights at the end of the financial period:
Option rights of personnel
§

23REPORT BY THE
BOARD OF DIRECTORS
CONSOLIDATED
FINANCIAL STATEMENTS
PARENT COMPANY
FINANCIAL STATEMENTSSIGNATURES AUDITOR'S NOTE
Management incentive scheme
Basis of preparation
The Board of Directors of Revenio Group Corporation decided on three share-based long-term incentive schemes directed towards the Management Team of Revenio Group. Long-term incentive schemes form part of the company's remuneration program for key personnel and are aimed at supporting the implementation of the company's strategy and harmonizing the objectives of key personnel and the company in order to grow the company's value.
The Board of Directors shall decide separately on the minimum, target and maximum bonus of each participant, as well as performance criteria and the related targets. The amount of bonus payable to the participants depends on the achievement of the pre-set targets. No bonus will be paid if the targets are not met, or if the participant's work or employment relationship ends before the bonus is paid. Each performance share plan shall cover a maximum of 10 persons and the objectives of the plan shall be related to the absolute total yield of the company's share and the cumulative operating result over a period of three years.
If the targets of the incentive scheme are met, the bonuses will be paid in the spring of the year following the earning period. The total amount of share bonus to be paid on the basis of the program earning period is gross earnings minus the amount of cash required to cover taxes due on the share bonus and any other tax-like payments, after which the remaining net bonus shall be paid in shares. However, in certain circumstances the company has the right to pay the entire bonus in cash.
The number of shares to be granted is based on the value of the shares on the grant date. The present value of the dividends received during the earning period is deducted from the fair value. Benefits granted under the share plan are recognized as expenses in the income statement on a straight-line basis during the vesting period up until payout.
EARNING YEARS TIME OF BONUS PAYMENTMAXIMUM AMOUNT
OF SHARE BONUS
2018-2020 2021 50,000
2019-2021 2022 50,000
2020-2022 2023 50,000
6) Pension liabilities
Basis of preparation
The Group’s pensions are handled by external pension insurance companies. The Group has both defined contribution and defined benefit pension plans. Expenses related to defined contribution plans are recorded as expenses for the financial period they arise.
Revenio also has an individual supplementary pension scheme for a limited personnel group. The insured retirement age is 63 years. These supplementary pensions are arranged with external pension insurance companies.
Defined benefit pension plans
Basis of preparation
The Group has a defined benefit pension plan (TFR) in Italy. In the TFR plan, employees are entitled to an accrued benefit that is paid as a lump sum either upon retirement or termination of the employment relationship. The plan is unfunded and the Group has no related asset items.
The defined benefit pension plan is recognized in the balance sheet as a liability based on the difference between the present value of the pension obligations and the fair value of plan assets. Liabilities are calculated as the present values of estimated cash flows discounted at the interest rate corresponding to the interest rate of high-quality bonds issued by companies. Actuarial gains and losses are recognized in comprehensive income and are not subsequently reclassified to profit or loss. Current service cost, past service cost, and net interest on the net defined benefit liability are recognized in the income statement.
If the yields of the bonds on which the discount rate is based change, the Group may have to adjust the discount interest rate. This will affect both net defined benefit liabilities and items recognized in other comprehensive income due to remeasurements. TFR benefits are linked to inflation, and growth in the inflation rate will increase the defined benefit obligation. If the development of the employer’s productivity lags behind inflation, the acceleration of inflation may increase the deficit of defined benefit plans.
The Group’s defined benefit obligations relate to the provision of benefits for employed members. The expected increase in life expectancy will increase the amount of the defined benefit obligations. The TFR benefit is accrued annually on the basis of the employee’s annual salary. If actual salary growth is higher than the salary increase rate assumption used for calculating the pension obligation, this may increase the amount of the pension obligation.
§
§
§

24REPORT BY THE
BOARD OF DIRECTORS
CONSOLIDATED
FINANCIAL STATEMENTS
PARENT COMPANY
FINANCIAL STATEMENTSSIGNATURES AUDITOR'S NOTE
DEFINED BENEFIT PENSION LIABILITIES RECOGNIZED IN THE BALANCE SHEET
DEC 31, 2020 TEUR
DEC 31, 2019 TEUR
Present value of funded obligations 701 428
Fair value of assets 0 0
Present value of funded obligations on Dec 31 701 428
CHANGES IN FAIR VALUES OF PLAN ASSETSDEC 31, 2020
TEURDEC 31, 2019
TEUR
Fair value of plan assets on Jan 1 0 0
Interest income from assets 0 0
Contributions paid by the employer to the plan 9 42
Benefits paid -9 -42
Fair values of plan assets on Dec 31 0 0
PRESENT VALUE OF FUNDED OBLIGATIONSDEC 31, 2020
TEURDEC 31, 2019
TEUR
Obligation at the beginning of the period 428 0
Acquired businesses 0 410
Service cost 86 52
Interest costs 2 3
Actuarial gains and losses arising from changes in financial assumptions 194 6
Benefits paid -9 -42
Present value of funded obligations 701 428
CHANGES OF LIABILITIES PRESENTED IN THE BALANCE SHEET
DEC 31, 2020 TEUR
DEC 31, 2019 TEUR
Liabilities Jan 1 428 0
Acquired businesses 0 410
Pension costs in the income statement 88 55
Pension costs in the comprehensive income statement 194 6
Benefits paid -9 -42
Liabilities Dec 31 701 428
ACTUARIAL ASSUMPTIONS USEDDEC 31, 2020
TEURDEC 31, 2019
TEUR
Discount rate, % 0.2% 0.5%
Future salary increase rate, % 4.2% 4.1%
Inflation assumption, % 1.1% 1.1%
Employee turnover, % 5.5% 8.0%
IMPACT OF CHANGES IN KEY ASSUMPTIONS
ASSUMPTIONCHANGE IN
ASSUMPTION
EFFECT OF GROWTH IN
ASSUMPTION, TEUR
EFFECT OF GROWTH IN
ASSUMPTION, %
Discount rate 0.5 percentage point -45 -6%
Future salary increase rate 0.5 percentage point 51 7%
Employee turnover 0.5 percentage point -7 -1%
DEFINED BENEFIT PENSION COSTS RECOGNIZED IN THE INCOME STATEMENT AND COMPREHENSIVE INCOME STATEMENT
JAN 1–DEC 31, 2020 TEUR
JAN 1–DEC 31, 2019 TEUR
Current service cost -86 -52
Interest costs -2 -3
Pension costs in the income statement -88 -55
Actuarial gains and losses -194 -6
Defined benefit pension costs recognized in the income statement and comprehensive income statement -282 -61

25REPORT BY THE
BOARD OF DIRECTORS
CONSOLIDATED
FINANCIAL STATEMENTS
PARENT COMPANY
FINANCIAL STATEMENTSSIGNATURES AUDITOR'S NOTE
7) Research and development expensesBasis of preparation
Research expenses are recognized through profit or loss. Development expenses for new or more advanced products are capitalized on the balance sheet as intangible goods from the moment the product is technically feasible, it can be utilized commercially, and it is estimated that commercial benefits can be extracted from it. Capitalized development expenses include those material, work, and testing costs directly attributable to the completion of the product for its intended use. Development expenses recognized as expenses earlier are not capitalized later.
Amortization is recognized for a good from the moment it is ready for use. A good not yet ready for use is annually tested for impairment. After initial recording, capitalized R&D expenses are recognized adjusted by amortization on the purchase cost and impairment. The useful life of capitalized R&D costs is 10 years on average, during which period they are recorded as expenses through straight-line amortization.
The research and development expenses included in the income statement are presented in Note 8 Other operating expenses.
8) Other operating expensesJAN 1–DEC 31, 2020
TEURJAN 1–DEC 31, 2019
TEUR
Voluntary personnel expenses -571 -620
Office space expenses -277 -151
IT, machinery, and equipment expenses -1,112 -720
Marketing and travel expenses -2,134 -3,249
Research and development -1,768 -1,573
Administrative services -4,447 -5,263
Other operating expenses 63 116
Total -10,244 -11,460
Administrative services include the auditor’s fees as itemized below.
AUDITOR’S FEESJAN 1–DEC 31, 2020
TEURJAN 1–DEC 31, 2019
TEUR
Deloitte
Auditing fees -102 -121
Certificates and statements -25 -17
Total -127 -138
9) Financing expenses (net)JAN 1–DEC 31, 2020
TEURJAN 1–DEC 31, 2019
TEUR
Interest on financial liabilities -236 -214
Exchange rate losses -160 -20
Other financial expenses -17 -91
Interest income 1 5
Total -411 -320
§

26REPORT BY THE
BOARD OF DIRECTORS
CONSOLIDATED
FINANCIAL STATEMENTS
PARENT COMPANY
FINANCIAL STATEMENTSSIGNATURES AUDITOR'S NOTE
10) Income taxesBasis of preparation
The tax expense in the income statement comprises the tax based on the company’s taxable income for the period together with deferred taxes. The tax based on taxable income for the period is the taxable income of the Group companies calculated according to the applicable tax rate. The tax is adjusted for any tax related to previous periods. Deferred tax is calculated on all temporary differences between their book and actual tax values. Deferred tax liability is not recognized for accountable assets and liabilities unless they concern the combination of operations. Deferred tax liability is not recognized if the recognition of such an asset or liability will neither affect accounting results nor taxable income at the time of the transaction. Deferred tax is not recognized for non-deductible goodwill impairment or for distributable earnings of subsidiaries where it is probable that the difference will not reverse in the foreseeable future.
The principal temporary differences, i.e. deferred taxes, arise from internal margins on inventories and changes in the fair value of intangible rights arising in connection with acquisitions.
Deferred tax assets are recognized to the extent that it is probable that future taxable profit, against which the temporary differences can be utilized, will be available.
TAX RATE RECONCILIATION
JAN 1–DEC 31, 2020TEUR
JAN 1–DEC 31, 2019TEUR
Profit before taxes 16,719 12,273
Income tax using parent company tax rate -3,344 -2,455
Different tax rates of foreign subsidiaries -100 -241
Non-taxable income 203 967
Non-deductible expenses -426 -1,238
Temporary differences created and reversed in deferred tax assets and liabilities 306 30
Tax adjustments for previous fiscal years 3 7
Taxes recognized in the income statement -3,357 -2,930
Reconciliation of tax expenses in the income statement and taxes calculated using the parent company tax rate 20% (20%):
Income taxes in the income statement
JAN 1–DEC 31, 2020TEUR
JAN 1–DEC 31, 2019TEUR
Tax based on taxable income for the current period -4,096 -3,474
Tax from previous financial periods -3 7
Change in deferred tax liabilities and assets 741 537
Total -3,357 -2,930
§

27REPORT BY THE
BOARD OF DIRECTORS
CONSOLIDATED
FINANCIAL STATEMENTS
PARENT COMPANY
FINANCIAL STATEMENTSSIGNATURES AUDITOR'S NOTE
11) Earnings per share
JAN 1–DEC 31, 2020
JAN 1–DEC 31, 2019
Profit for the period (TEUR) 13,362 9,343
Profit for the period attributable to owners of parent (TEUR) 13,362 9,343
Weighted average number of outstanding shares during the financial period (own shares deducted), qty 26,608,033 25,645,898
Undiluted earnings per share (EUR) 0.505 0.365
Diluted earnings per share (EUR) 0.504 0.364
Basis of preparation
The basic earnings per share are calculated by dividing profit for the period by the weighted average number of outstanding shares during the financial period. The diluted earnings per share are calculated by dividing profit for the period by the weighted average number of outstanding shares during the financial period, including the diluting effect of stock options.
The 10,388 (50,492) stock options had a diluting effect of 18,611 shares at the end of the financial period.
ITEMIZATION OF DEFERRED TAX ASSETS, 2020
JAN 1, 2020TEUR
ACQUIRED BUSINESSES
TEUR
RECOGNIZED IN THE INCOME
STATEMENT TEUR
DEC 31, 2020TEUR
Internal inventory margin 551 0 276 827
Other temporary differences 215 0 -33 182
Total 766 0 243 1,009
ITEMIZATION OF DEFERRED TAX LIABILITIES, 2020
JAN 1, 2020TEUR
ACQUIRED BUSINESSES
TEUR
RECOGNIZED IN THE INCOME
STATEMENT TEUR
DEC 31, 2020TEUR
Measurement of tangible and intangible assets at fair value in connection with combinations of business
4,120 0 -264 3,856
Other temporary differences 225 0 200 425
Total 4,344 0 -63 4,281
DEC 31, 2020 DEC 31, 2019
Deferred tax liabilities net 3,272 3,578
ITEMIZATION OF DEFERRED TAX LIABILITIES, 2019
JAN 1, 2019TEUR
ACQUIRED BUSINESSES
TEUR
RECOGNIZED IN THE INCOME
STATEMENT TEUR
DEC 31, 2019TEUR
Measurement of tangible and intangible assets at fair value in connection with combinations of business
0 4,633 -514 4,120
Other temporary differences 8 0 217 225
Total 8 4,633 -297 4,344
ITEMIZATION OF DEFERRED TAX ASSETS, 2019
JAN 1, 2019TEUR
ACQUIRED BUSINESSES
TEUR
RECOGNIZED IN THE INCOME
STATEMENT TEUR
DEC 31, 2019TEUR
Internal inventory margin 174 164 213 551
Other temporary differences 56 70 89 215
Total 230 234 302 766
Deferred tax assets and liabilities
§
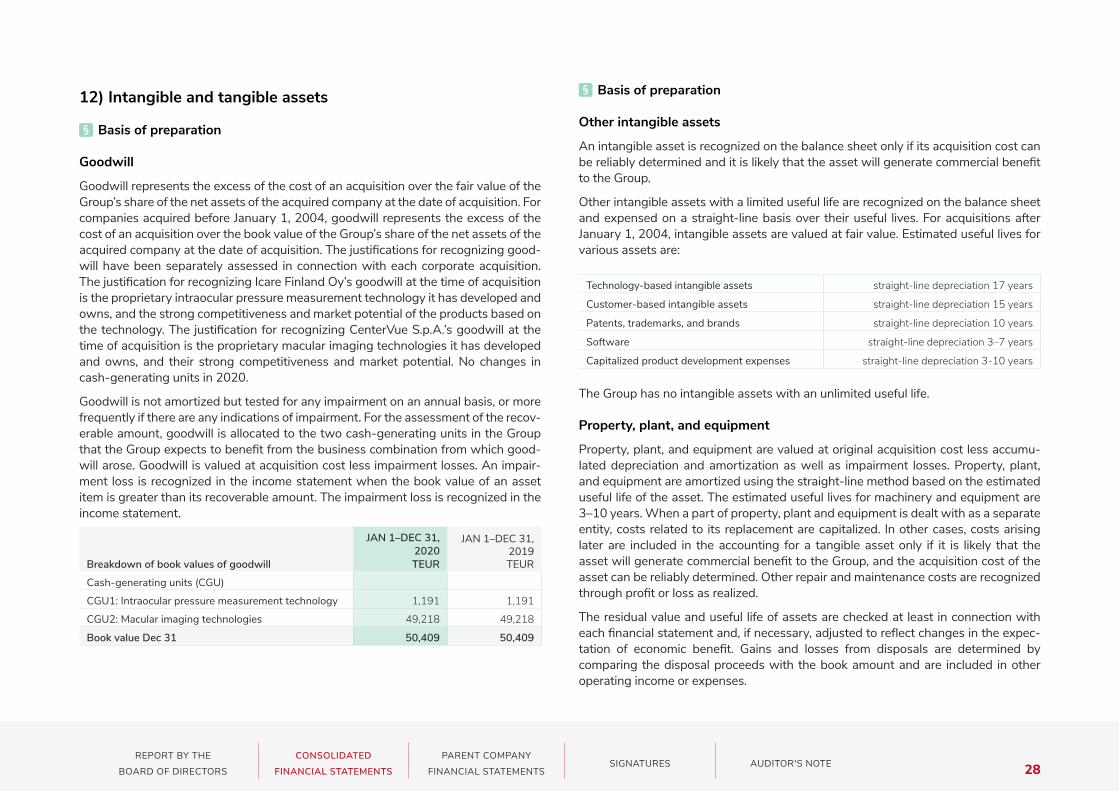
28REPORT BY THE
BOARD OF DIRECTORS
CONSOLIDATED
FINANCIAL STATEMENTS
PARENT COMPANY
FINANCIAL STATEMENTSSIGNATURES AUDITOR'S NOTE
Breakdown of book values of goodwill
JAN 1–DEC 31, 2020TEUR
JAN 1–DEC 31, 2019TEUR
Cash-generating units (CGU)
CGU1: Intraocular pressure measurement technology 1,191 1,191
CGU2: Macular imaging technologies 49,218 49,218
Book value Dec 31 50,409 50,409
12) Intangible and tangible assets
Basis of preparation
Goodwill
Goodwill represents the excess of the cost of an acquisition over the fair value of the Group’s share of the net assets of the acquired company at the date of acquisition. For companies acquired before January 1, 2004, goodwill represents the excess of the cost of an acquisition over the book value of the Group’s share of the net assets of the acquired company at the date of acquisition. The justifications for recognizing goodwill have been separately assessed in connection with each corporate acquisition. The justification for recognizing Icare Finland Oy’s goodwill at the time of acquisition is the proprietary intraocular pressure measurement technology it has developed and owns, and the strong competitiveness and market potential of the products based on the technology. The justification for recognizing CenterVue S.p.A.’s goodwill at the time of acquisition is the proprietary macular imaging technologies it has developed and owns, and their strong competitiveness and market potential. No changes in cash-generating units in 2020.
Goodwill is not amortized but tested for any impairment on an annual basis, or more frequently if there are any indications of impairment. For the assessment of the recoverable amount, goodwill is allocated to the two cash-generating units in the Group that the Group expects to benefit from the business combination from which goodwill arose. Goodwill is valued at acquisition cost less impairment losses. An impairment loss is recognized in the income statement when the book value of an asset item is greater than its recoverable amount. The impairment loss is recognized in the income statement.
Basis of preparation
Other intangible assets
An intangible asset is recognized on the balance sheet only if its acquisition cost can be reliably determined and it is likely that the asset will generate commercial benefit to the Group.
Other intangible assets with a limited useful life are recognized on the balance sheet and expensed on a straight-line basis over their useful lives. For acquisitions after January 1, 2004, intangible assets are valued at fair value. Estimated useful lives for various assets are:
The Group has no intangible assets with an unlimited useful life.
Property, plant, and equipment
Property, plant, and equipment are valued at original acquisition cost less accumulated depreciation and amortization as well as impairment losses. Property, plant, and equipment are amortized using the straight-line method based on the estimated useful life of the asset. The estimated useful lives for machinery and equipment are 3–10 years. When a part of property, plant and equipment is dealt with as a separate entity, costs related to its replacement are capitalized. In other cases, costs arising later are included in the accounting for a tangible asset only if it is likely that the asset will generate commercial benefit to the Group, and the acquisition cost of the asset can be reliably determined. Other repair and maintenance costs are recognized through profit or loss as realized.
The residual value and useful life of assets are checked at least in connection with each financial statement and, if necessary, adjusted to reflect changes in the expectation of economic benefit. Gains and losses from disposals are determined by comparing the disposal proceeds with the book amount and are included in other operating income or expenses.
Technology-based intangible assets straight-line depreciation 17 years
Customer-based intangible assets straight-line depreciation 15 years
Patents, trademarks, and brands straight-line depreciation 10 years
Software straight-line depreciation 3–7 years
Capitalized product development expenses straight-line depreciation 3-10 years
§
§

29REPORT BY THE
BOARD OF DIRECTORS
CONSOLIDATED
FINANCIAL STATEMENTS
PARENT COMPANY
FINANCIAL STATEMENTSSIGNATURES AUDITOR'S NOTE
Impairment
The Group management continuously reviews Group items for any indication of impairment. If there are such indications, the amount recoverable from the said asset item is assessed. The recoverable amount is the higher of the asset item’s fair value less the cost arising from disposal and its value in use. When determining value in use, the expected future net cash flows from the asset item or cash-generating unit are discounted based on their present values. The interest rate calculated using the WACC method (Weighted Average Cost of Capital) before taxes is used as the discount interest rate. Factors that affect the interest in the WACC calculation include a risk-free interest rate, the cost of borrowed capital, the risk premium on the stock market, the beta coefficient, and the industry’s capital structure.
An impairment loss is recognized in the income statement when the book value of an asset item is greater than its recoverable amount. The impairment loss is recognized in the income statement. For other asset items except goodwill, the impairment loss can later be reversed if a change in the estimates used for determining the recoverable amount has occurred. The impairment loss is, however, not reversed by more than what the book value of the asset would be without the recognition of the impairment loss.
Factors considered by the Group management as central to determining whether impairment testing should be done include the asset item’s significantly lower profit in comparison with previous or expected future profits, negative changes in the industry or market conditions or threats thereof, and significant changes in the way the asset item is used or in the business strategy.

30REPORT BY THE
BOARD OF DIRECTORS
CONSOLIDATED
FINANCIAL STATEMENTS
PARENT COMPANY
FINANCIAL STATEMENTSSIGNATURES AUDITOR'S NOTE
Intangible assets
JAN 1–DEC 31, 2020TEUR GOODWILL
TECHNOLOGY-BASED
CUSTOMERBASED
OTHER INTANGIBLE
ASSETSTOTAL
Acquisition cost Jan 1 50,409 8,606 5,211 8,058 72,285
Increase during the period 0 0 0 767 767
Impairment 0 0 0 -1,956 -1,956
Acquisition cost Dec 31 50,409 8,606 5,211 6,869 71,096
Accumulated depreciation Jan 1
0 -337 -232 -1,869 -2,438
Depreciation during the year 0 -506 -347 -528 -1,381
Impairment 0 0 0 -6 -6
Accumulated depreciation Dec 31
0 -844 -579 -2,403 -3,826
Book value Dec 31 50,409 7,762 4,632 4,466 67,270
Book value Jan 1 50,409 8,268 4,980 6,189 69,847
JAN 1–DEC 31, 2019TEUR GOODWILL
TECHNOLOGY-BASED
CUSTOMERBASED
OTHER INTANGIBLE
ASSETSTOTAL
Acquisition cost Jan 1 1,191 0 0 5,604 6,795
Increase during the period 0 0 0 672 672
Acquiredbusinesses 49,218 8,606 5,211 1,783 64,818
Acquisitioncost Dec 31 50,409 8,606 5,211 8,058 72,285
Accumulated depreciation Jan 1
0 0 0 -1,442 -1,442
Depreciation during the year 0 -337 -232 -427 -996
Accumulated depreciation Dec 31
0 -337 -232 -1,869 -2,438
Book value Dec 31 50,409 8,268 4,980 6,189 69,847
Book value Jan 1 1,191 0 0 4,161 5,352
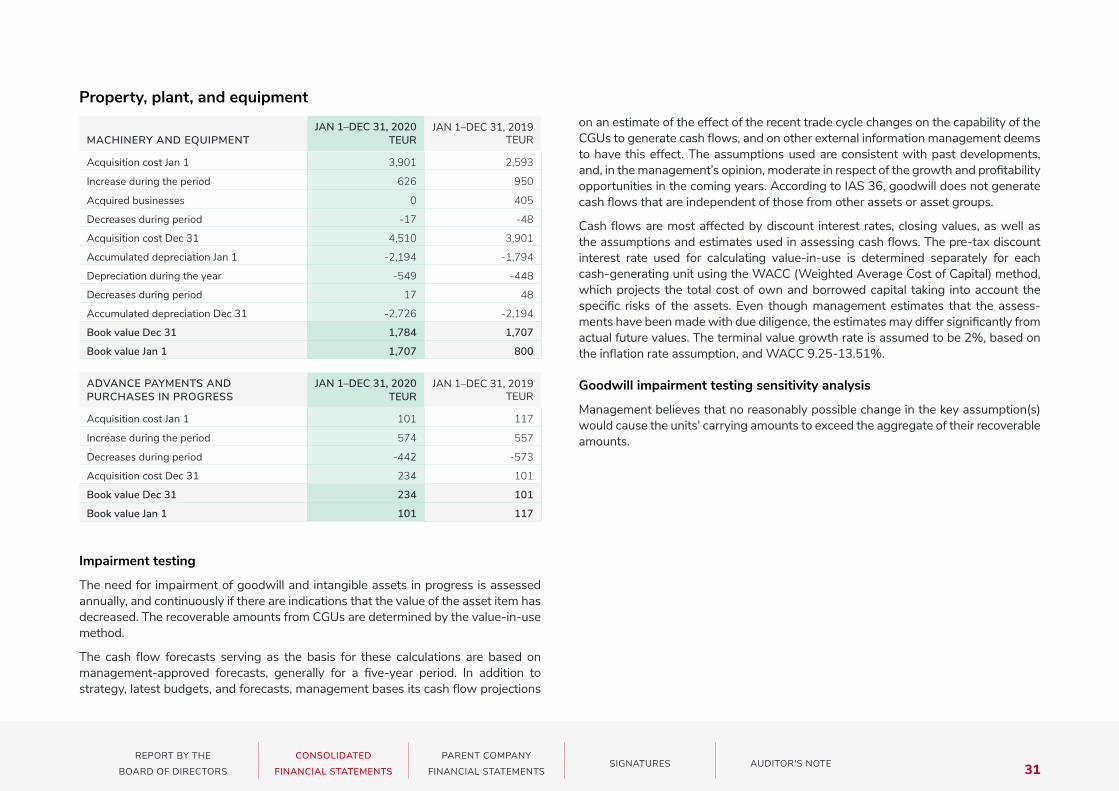
31REPORT BY THE
BOARD OF DIRECTORS
CONSOLIDATED
FINANCIAL STATEMENTS
PARENT COMPANY
FINANCIAL STATEMENTSSIGNATURES AUDITOR'S NOTE
MACHINERY AND EQUIPMENTJAN 1–DEC 31, 2020
TEURJAN 1–DEC 31, 2019
TEUR
Acquisition cost Jan 1 3,901 2,593
Increase during the period 626 950
Acquired businesses 0 405
Decreases during period -17 -48
Acquisition cost Dec 31 4,510 3,901
Accumulated depreciation Jan 1 -2,194 -1,794
Depreciation during the year -549 -448
Decreases during period 17 48
Accumulated depreciation Dec 31 -2,726 -2,194
Book value Dec 31 1,784 1,707
Book value Jan 1 1,707 800
Property, plant, and equipment
ADVANCE PAYMENTS AND PURCHASES IN PROGRESS
JAN 1–DEC 31, 2020TEUR
JAN 1–DEC 31, 2019TEUR
Acquisition cost Jan 1 101 117
Increase during the period 574 557
Decreases during period -442 -573
Acquisition cost Dec 31 234 101
Book value Dec 31 234 101
Book value Jan 1 101 117
Impairment testing
The need for impairment of goodwill and intangible assets in progress is assessed annually, and continuously if there are indications that the value of the asset item has decreased. The recoverable amounts from CGUs are determined by the value-in-use method.
The cash flow forecasts serving as the basis for these calculations are based on management-approved forecasts, generally for a five-year period. In addition to strategy, latest budgets, and forecasts, management bases its cash flow projections
on an estimate of the effect of the recent trade cycle changes on the capability of the CGUs to generate cash flows, and on other external information management deems to have this effect. The assumptions used are consistent with past developments, and, in the management’s opinion, moderate in respect of the growth and profitability opportunities in the coming years. According to IAS 36, goodwill does not generate cash flows that are independent of those from other assets or asset groups.
Cash flows are most affected by discount interest rates, closing values, as well as the assumptions and estimates used in assessing cash flows. The pre-tax discount interest rate used for calculating value-in-use is determined separately for each cash-generating unit using the WACC (Weighted Average Cost of Capital) method, which projects the total cost of own and borrowed capital taking into account the specific risks of the assets. Even though management estimates that the assessments have been made with due diligence, the estimates may differ significantly from actual future values. The terminal value growth rate is assumed to be 2%, based on the inflation rate assumption, and WACC 9.25-13.51%.
Goodwill impairment testing sensitivity analysis
Management believes that no reasonably possible change in the key assumption(s) would cause the units' carrying amounts to exceed the aggregate of their recoverable amounts.

32REPORT BY THE
BOARD OF DIRECTORS
CONSOLIDATED
FINANCIAL STATEMENTS
PARENT COMPANY
FINANCIAL STATEMENTSSIGNATURES AUDITOR'S NOTE
Impairment of intangible assets
During the financial period, there were indications that it will take longer than originally estimated to launch the skin cancer camera Cutica on the market. The delay in the schedule is particularly attributable to research to evaluate the use of artificial intelligence for the automatic processing of image material. As a result, the Group has recorded a partial impairment of EUR 1.9 million. The development and validation of Cutica will continue, which is why it was not fully impaired. The impairment decision was based on the weakened outlook for future return expectations and project-related uncertainties. The calculations are based on cash flows over a 10-year period. The terminal value growth rate is assumed to be 2%, based on the inflation rate assumption, and WACC 13.51%. The product development expenses of the first phase of the project will not be capitalized later.
13) Lease agreements
Basis of preparation
The Group acts as a lessee andleases the warehouses and office premises it uses, as well as equipment and vehicles, under non-cancelable operating leases. Short-term lease agreements and leases concerning low-value assets are recognized in the income statement as an expense on a straight-line basis over the period of the lease. All other leases are recognized in tangible assets at the lower of the fair value of the leased asset at the commencement of the lease term or the present value of the minimum lease payments. Lease obligations are entered in the lease liability. Assets entered under intangible assets are amortized based on the estimated useful life of the asset or over the lease period, if shorter. Lease payments are apportioned between repayment of principal and the financing charge so as to produce a constant rate of interest on the remaining balance of the liability. The Group does not act as a lessor towards external parties.
Right-of-use assets
TEURBUSINESS PREMISES CARS DEVICES
JAN 1–DEC 31, 2020TOTAL
Acquisition cost Jan 1 1,382 374 29 1,786
Increase during the period 806 55 41 902
Decreases during period -54 -73 -29 -156
Acquisition cost Dec 31 2,135 356 41 2,532
Accumulated depreciation Jan 1 -887 -118 -24 -1,029
Depreciation during the year -516 -125 -14 -655
Decreases during period 28 28 29 85
Accumulated depreciation Dec 31 -1,376 -215 -8 -1,599
Book value Dec 31 759 141 32 932
Book value Jan 1 495 256 6 757
TEURBUSINESS PREMISES CARS DEVICES
JAN 1–DEC 31, 2019TOTAL
Acquisition cost Jan 1 1,238 145 15 1,398
Increase during the period 7 212 15 233
Acquired businesses 138 17 0 155
Decreases during period 0 0 0 0
Acquisition cost Dec 31 1,382 374 29 1,786
Accumulated depreciation Jan 1 -377 -28 -8 -414
Depreciation during the year -479 -87 -15 -581
Accumulated depreciation for acquired business operations -31 -3 0 -34
Accumulated depreciation Dec 31 -887 -118 -24 -1,029
Book value Dec 31 495 256 6 757
Book value Jan 1 861 117 6 984
§

33REPORT BY THE
BOARD OF DIRECTORS
CONSOLIDATED
FINANCIAL STATEMENTS
PARENT COMPANY
FINANCIAL STATEMENTSSIGNATURES AUDITOR'S NOTE
Amounts recognized for leases in the income statement
Inventories
JAN 1–DEC 31, 2020TEUR
JAN 1–DEC 31, 2019TEUR
Depreciation -655 -581
Interest on lease liabilities -15 -16
Other operating expenses, leases
Expenses from short-term leases -95 -93
Expenses from low-value leases -1 -5
Expenses related to variable lease payments not included in lease liabilities -98 -33
JAN 1–DEC 31, 2020TEUR
JAN 1–DEC 31, 2019TEUR
Cash outflow from leases
Payments of lease liabilities -659 -580
Items recognized in the income statement, excluding depreciation -209 -147
14) Inventories
15) Financial assets
Basis of preparation
Inventories are recognized at the lower of cost and net realizable value. The acquisition cost is determined using the FIFO method. The net realizable value is the estimated selling price in a conventional transaction less the cost to make the sale. The acquisition cost of completed products and work in progress comprises direct costs such as materials, direct costs of labor, other direct costs, and the allocation of the variable manufacturing overheads and fixed overhead at normal operating capacity.
Basis of preparation
The Group's financial assets are classified into the following categories: measured at amortized cost, measured at fair value through other comprehensive income items or measured subsequently at fair value through profit or loss. Financial assets are classified and valued when recorded for the first time in the balance sheet. Classification is based on the entity’s business model for managing the financial assets and the contractual cash flow characteristics of the financial asset.
Financial assets that are valued at amortized costs are held within a business model whose objective is to hold financial assets in order to collect contractual cash flows, and the contractual terms for items falling under financial assets give rise on specified dates to cash flows to be realized at specific times that constitute solely payments of principal and interest on the principal outstanding.
Financial assets that are valued at fair value through other comprehensive income items are held within a business model whose objective is achieved both by collecting contractual cash flows and selling financial assets, and the contractual terms for items falling under financial assets give rise on specified dates to cash flows that are solely payments of principal and interest on the principal amount outstanding.
Financial assets subsequently measured at fair value through profit and loss are assets that are not measured at amortized cost or at fair value through other comprehensive income items.
FINANCIAL ASSETS — RECOGNITION AND MEASUREMENT
The Group estimates the expected credit losses for the full lifetime of the sales receivables. For the assessment of expected credit losses, sales receivables are grouped geographically and by customer group, and the credit loss provision is recognized based on past experience. The balance sheet values of sales and other receivables constitute the maximum credit risk amounts. No significant credit risk concentrations are included in the receivables. A final impairment loss is recognized when evidence exists that the company cannot collect its receivables in accordance with the initial terms and conditions. The impairment loss is the difference between the book value of the receivables and their recoverable amount, and it corresponds to the present value of expected cash flows.
DEC 31, 2020TEUR
DEC 31, 2019TEUR
Materials and supplies 870 826
Work in progress/advance payments 458 402
Finished products 3,547 2,224
Total 4,875 3,452
§
§

34REPORT BY THE
BOARD OF DIRECTORS
CONSOLIDATED
FINANCIAL STATEMENTS
PARENT COMPANY
FINANCIAL STATEMENTSSIGNATURES AUDITOR'S NOTE
Trade and other receivablesDEC 31, 2020
TEURDEC 31, 2019
TEUR
Sales receivables 7,047 5,147
Other receivables 590 430
Accrued income 928 824
Total 8,565 6,402
DEC 31, 2020 UNITED STATES, USD
NOT FALLEN DUE
< 30 DAYS
> 30 DAYS
> 60 DAYS
> 90 DAYS TOTAL
Hospitals and public corporations
Expected credit losses (ECL coefficient) 0% 0% 0% 0.5% 5%
Gross book value 105 126 838 78 590 1,736
ECL over validity period 0 0 0 0 29 30
Other
Expected credit losses (ECL coefficient) 0% 0% 0% 2% 4%
Gross book value 1,191 1,120 630 606 0 3,547
ECL over validity period 0 0 0 12 0 12
OTHER COUNTRIES, EUR
NOT FALLEN DUE
< 30 DAYS
> 30 DAYS
> 60 DAYS
> 90 DAYS TOTAL
Expected credit losses (ECL coefficient) 0% 1% 2% 3% 5%
Gross book value 1,508 258 6 0 0 1,772
ECL over validity period 0 3 0 0 0 3
Expected credit losses (ECL coefficient) 0.5% 1% 2% 5% 13.3%
Gross book value 890 27 36 0 8 962
ECL over validity period 4 0 1 0 1 7
Evidence is generally considered appropriate when the receivable is more than 180 days outstanding when no credit insurance or a security through other means is available. External evidence of a risk related to a receivable even before it is 180 days outstanding will lead to the recognition of impairment loss. Such evidence may be, for example, the debtor’s significant economic difficulties, company reorganization, or bankruptcy proceedings. The impairment loss is recognized in the income statement in other operating expenses.
Loans and other receivables are measured at amortized cost using the effective interest method.
Unrealized and realized gains and losses due to changes in fair value relating to assets categorized as financial assets at fair value through profit or loss are recognized in operating profit in the accounting period in which they arise. Dividend income from financial assets recognized at fair value, through profit or loss, are recorded on the balance sheet as other income when the right to payment has arisen for the Group.
The fair values of quoted investments are based on current bid prices. If there is no active market for a financial asset, fair value is established by using valuation techniques. These include the use of recent arm’s length transactions, the fair values of other instruments that are substantially the same, or the present value of discounted cash flows.
CASH AND CASH EQUIVALENTS
Cash and cash equivalents include cash in hand, bank deposits withdrawable on demand, and other liquid short-term investments with original maturities of one month or less from acquisition.

35REPORT BY THE
BOARD OF DIRECTORS
CONSOLIDATED
FINANCIAL STATEMENTS
PARENT COMPANY
FINANCIAL STATEMENTSSIGNATURES AUDITOR'S NOTE
DEC 31, 2019 UNITED STATES, USD
NOT FALLEN DUE
< 30 DAYS
> 30 DAYS
> 60 DAYS
> 90 DAYS TOTAL
Hospitals and public corporations
Expected credit losses (ECL coefficient) 0% 0% 0% 0.5% 5%
Gross book value 781 585 137 20 255 1,778
ECL over validity period 0 0 0 0 13 13
Other
Expected credit losses (ECL coefficient) 0% 0% 0% 2% 4%
Gross book value 0 735 276 107 125 1,243
ECL over validity period 0 0 0 2 5 7
OTHER COUNTRIES, EUR
NOT FALLEN DUE
< 30 DAYS
> 30 DAYS
> 60 DAYS
> 90 DAYS TOTAL
Expected credit losses (ECL coefficient) 0% 1% 2% 3% 5%
Gross book value 1,629 268 6 0 27 1,931
ECL over validity period 0 3 0 0 1 4
Expected credit losses (ECL coefficient) 0.5% 1% 2% 5% 13.3%
Gross book value 1,511 128 0 0 1 1,640
ECL over validity period 8 1 0 0 0 9
Cash and cash equivalents
DEC 31, 2020TEUR
DEC 31, 2019TEUR
Bank accounts and cash in hand 28,878 26,675
Total 28,878 26,675
JAN 1–DEC 31, 2020 JAN 1–DEC 31, 2019
Financial liabilities 27,219 28,863
Cash and cash equivalents 28,878 26,675
Net liabilities -1,659 2,189
Total equity 69,710 64,363
Net leveraging, % -2.4% 2.2%
The Group monitors its capital structure through leveraging. At the end of 2020, the Group's interest-bearing net liabilities totaled EUR -1,7 million (EUR 2.2 million at the end of 2019) and leveraging stood at -2.4 percent (3.4%). When calculating leveraging, interest-bearing net liabilities are divided by shareholders' equity. Net liabilities comprise debts less receivables and cash equivalents. The Group's strategy is to keep leveraging below 25 percent. There has been no change in this strategy since the previous year.
The loan taken out by the Group for the acquisition includes the following covenants:
The Group has complied with these covenants throughout the reporting period. The ratio of net debt to EBITDA was -9.2% on December 31, 2020.
16) Capital structure
The ratio of net debt to EBITDA may not exceed 2
Equity ratio must be more than 35%
The Group's capital management activities seek to optimize capital structure and thereby support the Group's business activities by ensuring normal operating conditions for business activities, while also increasing shareholder value and aiming for the best possible profit.
Capital structure can be influenced by dividend distribution and the issue of shares. The Group may vary and adjust the amount of dividends paid to shareholders, or the number of new shares issued, or decide to sell assets in order to reduce its debts.

36REPORT BY THE
BOARD OF DIRECTORS
CONSOLIDATED
FINANCIAL STATEMENTS
PARENT COMPANY
FINANCIAL STATEMENTSSIGNATURES AUDITOR'S NOTE
17) Equity
Basis of preparation
Outstanding ordinary shares are presented as share capital. Transaction costs due to the issuance of new equity instruments are presented as a deduction from equity. The own shares repurchased by Revenio Group Corporation are presented as a deduction from equity. Dividend distribution is recognized as a deduction from equity once the payment of dividend has been approved by the Annual General Meeting.
The invested unrestricted equity fund includes other equity investments and the subscription price of shares to the extent this price is not recognized in share capital by an explicit decision.
The difference between the fair value and the subscription price of directed share issues used for consideration for acquired operations is recognized in the fair value reserve.
Other reserves include the option schemes implemented in 2010–2012.
§

37REPORT BY THE
BOARD OF DIRECTORS
CONSOLIDATED
FINANCIAL STATEMENTS
PARENT COMPANY
FINANCIAL STATEMENTSSIGNATURES AUDITOR'S NOTE
Changes in the number of shares and their impact on equityAll issued shares have been paid in full. The company's share capital consists of 26,658,952 shares of a single class. At the end of the financial period, the company held 131,058 of its own shares (REG1V). All shares confer an equal right to dividends and the company’s funds.
NUMBER OF SHARES
SHARE CAPITAL
TEUR
RESERVE FOR INVESTED
UNRESTRICTED, TEUR
OWN SHARES,
TEURTOTAL TEUR
01/01/2019 24,016,476 5,315 7,824 -769 12,371
Directed share issue April 26, 2019 2,350,000 41,443 41,443
Share issue with A option rights May 9, 2019 6,270 50 50
Share issue with A option rights Jun 25, 2019 23,472 187 187
Share issue with B option rights Jun 25, 2019 15,045 148 148
Share issue with B option rights Oct 24, 2019 44,367 437 437
Share issue with C option rights Oct 24, 2019 12,900 165 165
Share issue with B option rights Dec 20, 2019 34,941 344 344
Share issue with C option rights Dec 20, 2019 41,271 527 527
Transfer of the company's own shares May 13, 2019 28 29 58
31/12/2019 26,544,742 5,315 51,152 -740 55,727
NUMBER OF SHARES
SHARE CAPITAL
TEUR
RESERVE FOR INVESTED
UNRESTRICTED, TEUR
OWN SHARES,
TEURTOTAL TEUR
01/01/2020 26,544,742 5,315 51,152 -740 55,727
Share issue with B option rights March 6, 2020 18,447 182 182
Share issue with C option rights March 6, 2020 19,119 244 244
Purchase of own shares March 18, 2020 -405 -405
Purchase of own shares March 19, 2020 -594 -594
Purchase of own shares March 20, 2020 -614 -614
Share issue with B option rights April 20, 2020 10,608 104 104
Share issue with C option rights April 20, 2020 6,105 78 78
Share issue with B option rights Jun 5, 2020 20,490 202 202
Share issue with C option rights Jun 5, 2020 7,725 99 99
Share issue with C option rights Aug 19, 2020 321 4 4
Transfer of the company's own shares Sep 18, 2020 49 21 70
Share issue with C option rights Nov 4, 2020 29,382 367 367
Share issue with C option rights Dec 29, 2020 2,013 25 25
31/12/2020 26,658,952 5,315 52,505 -2,333 55,488

38REPORT BY THE
BOARD OF DIRECTORS
CONSOLIDATED
FINANCIAL STATEMENTS
PARENT COMPANY
FINANCIAL STATEMENTSSIGNATURES AUDITOR'S NOTE
18) Management of financial risks
Financial risks and the risk management process
The management of financial risks is the responsibility of the CEO together with the Board of Directors. The Board defines the main outlines of the company’s financing and the general management principles for financial risks, and it gives guidelines as necessary for any special issues such as liquidity risk, interest risk, credit risk, and the investment of surplus liquid funds. The Board of Directors discusses the Group’s financial standing and funding at its monthly meetings.
According to its strategy, the company may seek growth through acquisitions of companies and business operations. The implementation of these acquisitions may require debt financing. Debt can also be used for other strategic and operational purposes decided on by the Board. Equity financing may also be used for all financing needs, in particular for acquisitions of companies and business operations.
Types of financial risks
In its operational activities, the company may be exposed to several types of financial risks, including changes in currency exchange rates, interest rates, and changes in the stock market. A central objective of financial risk management is to identify financial market risks that are relevant to the Group, and seek to minimize the harmful effects of financial market changes on the Group’s profit.
The main areas of financial risk management are:
(I) CURRENCY RISK
A significant export market for the company is the United States, where the company has a subsidiary and through which sales are conducted on the U.S. market. The operating currency of the subsidiary is the U.S. dollar. In sales to and local purchases in the U.S., the
company is exposed to a risk of fluctuating exchange rates between the U.S. dollar and the euro. At the end of the financial period, the company’s cash and cash equivalents in U.S. dollars were USD 10,373,000. In the event the euro strengthens against the U.S. dollar by 10 percent, this would decrease the company’s cash and cash equivalents on the closing date by EUR 845,000.
Invoicing between Icare Finland Oy and Icare USA Inc. and also between CenterVue S.p.A. and Icare USA Inc. takes place in USD. The currency risk is borne by Icare Finland Oy and CenterVue S.p.A. since business transactions between Group companies are not hedged against currency risks. Sales in U.S. dollars represent approximately 53.1% of the total net sales of the Group's continuing functions. Icare USA Inc. had USD 5,283,000 in account receivables from sales on the closing date. Icare USA Inc. had USD 2,719,000 cash in bank on the closing date. Icare Finland Oy and Revenio Group Corporation's USD accounts had a balance of USD 7,653,000 on the closing date.
(II) INTEREST RATE RISK
In the company’s balance sheet structure, interest rate risk is involved in borrowings. The Group’s profit and cash flow from operations are to an essential extent independent of fluctuations in market interest.
When taking up new financing, for example for corporate acquisitions, the company always evaluates the need for interest rate hedging, taking into account the amount of debt, hedging costs, and expected interest rate development during the financing period. All of the Group’s borrowings have fixed interest rates. As the Group does not have floating rate loans, the Group is not exposed to interest rate risk arising from changes in interest rates. The company has no interest rate investments or derivatives to which cash flow hedging would be applied.
(III) CREDIT RISK
The Group’s credit policy lays down the requirements for selling on credit and the requirements for credit management. The credit quality of a new customer is controlled by applying for a credit insurance limit if necessary every time a new customer relationship is established. The credit limit and credit sales eligibility is reassessed if the customer’s purchase volumes change or if the credit insurance company changes the granted credit limit as a result of a change in the customer’s credit quality.
No single customer or customer group constitutes a significant credit risk concentration for the Group. During the financial period, credit losses and expected credit losses recognized through profit and loss totaled EUR 6,000 (EUR 69,000). The theoretical maximum credit risk at the end of the period corresponds to the book value of sales receivables. The aging of sales receivables is presented in Note 15.
(IV) LIQUIDITY RISK
The most significant factor affecting the sufficiency of liquid funds in the short term is the profitability of the business operations. Thus, the development of cash flows from operations is affected by management’s profitability management measures, and additionally, operational risks and external risks such as general economic development, financial market conditions, and other macroeconomic demand factors over which the company management has no control. The Group’s liquidity in 2020 remained good. Liquid funds were decreased in 2020 by the payment of dividends. On December 31, 2020, the Group’s cash and cash equivalents totaled EUR 28,878,000 (EUR 26,675,000). The company continuously monitors and assesses the financing needs of its business operations to ensure sufficient liquidity for financing its operations. The Board of Directors follows the actual and forecast development of the Group’s liquidity monthly, and decides on possible corrective actions.

39REPORT BY THE
BOARD OF DIRECTORS
CONSOLIDATED
FINANCIAL STATEMENTS
PARENT COMPANY
FINANCIAL STATEMENTSSIGNATURES AUDITOR'S NOTE
19) Financial liabilities
Basis of preparation
Group loans are classified at amortized cost using the effective interest method to be measured later. Loans are recognized at fair value less transaction costs at the time of acquisition. Financial liabilities include current and non-current liabilities. Financial liabilities are categorized as current unless the Group has an unconditional right to postpone payment at least for 12 months after the closing date.
Commissions associated with loan commitments are recognized as transaction costs to the extent that it is probable that the entire loan commitment or part of it will be taken up. In such a case, the commission is entered in the balance sheet until the loan is taken up. When it is, the commission associated with the loan commitment is recognized as part of the transaction cost. If the loan commitment is unlikely to be taken up, the commission is recognized as an advance payment for a liquidity service and is amortized as a cost for the period of the loan commitment.
A financial liability is removed from the balance sheet when the contractual obligations related to the liability expire. If needed, credit accounts are included in loans recognized in current debt.
§

40REPORT BY THE
BOARD OF DIRECTORS
CONSOLIDATED
FINANCIAL STATEMENTS
PARENT COMPANY
FINANCIAL STATEMENTSSIGNATURES AUDITOR'S NOTE
Classification of financial liabilities
31/12/2020
AT FAIR VALUETHROUGH PROFIT OR
LOSSAMORTIZED
COSTBOOK
VALUEFAIR
VALUE
Interest-bearing non-current liabilities 0 22,034 22,034 22,034
Interest-bearing current liabilities 0 5,185 5,185 5,185
Trade payables and other non-interest- bearing current liabilities
0 12,603 12,603 12,603
31/12/2019
AT FAIR VALUETHROUGH PROFIT OR
LOSSAMORTIZED
COSTBOOK
VALUEFAIR
VALUE
Interest-bearing non-current liabilities 0 24,185 24,185 24,185
Non-interest-bearing non-current liabilities 986 0 986 986
Interest-bearing current liabilities 0 4,679 4,679 4,679
Trade payables and other non-interest-bearing current liabilities
0 10,464 10,464 10,464
All non-current loans are fixed-rate, and their book values have been measured at amortized cost. The average interest rate is 0.75% (2019: 0.75%). All of the Group’s current and non-current financial liabilities are in the euro denomination. The loans will mature by the end of 2022.
LIABILITY USE
INITIAL AMOUNT,
TEUR
PRINCIPAL OUTSTANDING,
TEURYEAR WHEN
ESTABLISHED
TEKES loan Initial financing of the subsidiary 502 117 2010–2013
Loan from financial institution
Acquired businesses 30,000 25,800 2019
31/12/2020UNDER 1
YEAR1–2
YEARS 2–5
YEARSOVER
5 YEARSTOTAL
CASH FLOW
Trade payables and other non-interest- bearing debt
12,603 0 0 0 12,603
Lease liabilities 590 170 212 0 973
Interest-bearing debt
-principal 4,604 21,659 0 0 26,262
-interest payments 119 88 0 0 207
31/12/2019UNDER 1
YEAR1–2
YEARS 2–5
YEARSOVER
5 YEARSTOTAL
CASH FLOW
Trade payables and other non-interest- bearing debt
10,464 0 0 0 10,464
Lease liabilities 431 204 174 0 810
Interest-bearing debt
-principal 4,259 4,259 19,559 0 28,076
-interest payments 164 137 47 0 348
The Group’s interest-bearing debt at end of period:
Maturity analysis of contractual liabilities
The loan related to the acquired business operations includes covenants, which the company has complied with during the 2020 financial period. The loan is secured by mortgages on Revenio Group Corporation assets worth EUR 91,000,000.
The figures are not discounted and include both interest and principal payments.
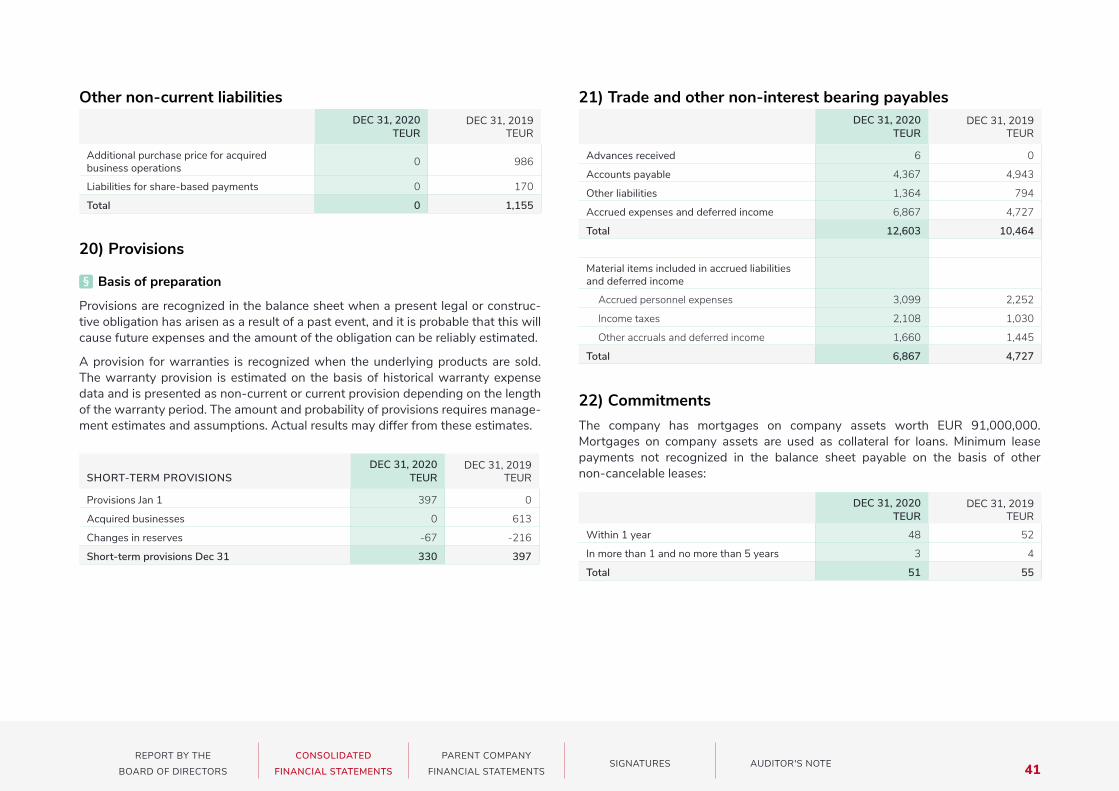
41REPORT BY THE
BOARD OF DIRECTORS
CONSOLIDATED
FINANCIAL STATEMENTS
PARENT COMPANY
FINANCIAL STATEMENTSSIGNATURES AUDITOR'S NOTE
22) CommitmentsThe company has mortgages on company assets worth EUR 91,000,000. Mortgages on company assets are used as collateral for loans. Minimum lease payments not recognized in the balance sheet payable on the basis of other non-cancelable leases:
Other non-current liabilitiesDEC 31, 2020
TEURDEC 31, 2019
TEUR
Additional purchase price for acquired business operations 0 986
Liabilities for share-based payments 0 170
Total 0 1,155
21) Trade and other non-interest bearing payablesDEC 31, 2020
TEURDEC 31, 2019
TEUR
Advances received 6 0
Accounts payable 4,367 4,943
Other liabilities 1,364 794
Accrued expenses and deferred income 6,867 4,727
Total 12,603 10,464
Material items included in accrued liabilities and deferred income
Accrued personnel expenses 3,099 2,252
Income taxes 2,108 1,030
Other accruals and deferred income 1,660 1,445
Total 6,867 4,727
20) Provisions
Basis of preparation
Provisions are recognized in the balance sheet when a present legal or constructive obligation has arisen as a result of a past event, and it is probable that this will cause future expenses and the amount of the obligation can be reliably estimated.
A provision for warranties is recognized when the underlying products are sold. The warranty provision is estimated on the basis of historical warranty expense data and is presented as non-current or current provision depending on the length of the warranty period. The amount and probability of provisions requires management estimates and assumptions. Actual results may differ from these estimates.
SHORT-TERM PROVISIONSDEC 31, 2020
TEURDEC 31, 2019
TEUR
Provisions Jan 1 397 0
Acquired businesses 0 613
Changes in reserves -67 -216
Short-term provisions Dec 31 330 397
DEC 31, 2020TEUR
DEC 31, 2019TEUR
Within 1 year 48 52
In more than 1 and no more than 5 years 3 4
Total 51 55
§

42REPORT BY THE
BOARD OF DIRECTORS
CONSOLIDATED
FINANCIAL STATEMENTS
PARENT COMPANY
FINANCIAL STATEMENTSSIGNATURES AUDITOR'S NOTE
23) Acquired businesses
The Group did not acquire any new businesses in the 2020 financial period.
Purchases in the financial year 2019
Revenio completed the acquisition of the entire share capital of the Italian company CenterVue S.p.A. ("CenterVue") on April 30, 2019.
The conditions for the additional purchase price of EUR 1,0 million included in the purchase price were not met by the end of 2020. The additional purchase price debt has expired and is recognized in the income statement in other operating income.
24) Related parties and remuneration of management
All Group companies are consolidated in the parent company’s consolidated financial statements.
Expenses arising from incentive programs are recognized as provisions in the financial statements of the year of their determination and are presented under Related party transactions in the financial period during which the Board of Directors decides on their payment.
PARENT AND SUBSIDIARY RELATIONSHIPS OF THE GROUP DOMICILE HOLDING
Parent company Revenio Group Corporation Vantaa
Done Medical Oy Seinäjoki 100%
Icare Finland Oy Helsinki 100%
Revenio Research Oy Vantaa 100%
Oscare Medical Oy Helsinki 100%
Icare USA Inc Missouri 100%
CenterVue S.p.A. Padua 100%
Revenio Italy S.R.L. Milan 100%
EMPLOYMENT BENEFITS FOR MANAGEMENTJAN 1–DEC 31, 2020
TEURJAN 1–DEC 31, 2019
TEUR
Management includes the Board and the Group's Management Team
Salaries and other short-term employment benefits 1,931 2,733
Other long-term benefits 61 74
Pension costs 268 465
Total 2,260 3,273
SALARIES AND REMUNERATIONS OF THE MEMBERS OF THE BOARD OF DIRECTORS AND THE CEO:
JAN 1–DEC 31, 2020
JAN 1–DEC 31, 2019
CEO Toijala Jouni 132 0
CEO Hildén Timo 204 500
CEO Moilanen Mikko 0 349
Chair of the Board Rönkä Pekka 54 50
Board member Kakkonen Kyösti 30 24
Board member Kohonen Ari 0 24
Board member Nielsen Arne Boye 27 0
Board member Sundell Ann-Christine 35 26
Board member Tammela Pekka 35 26
Board member Östman Bill 27 0
Total 544 997
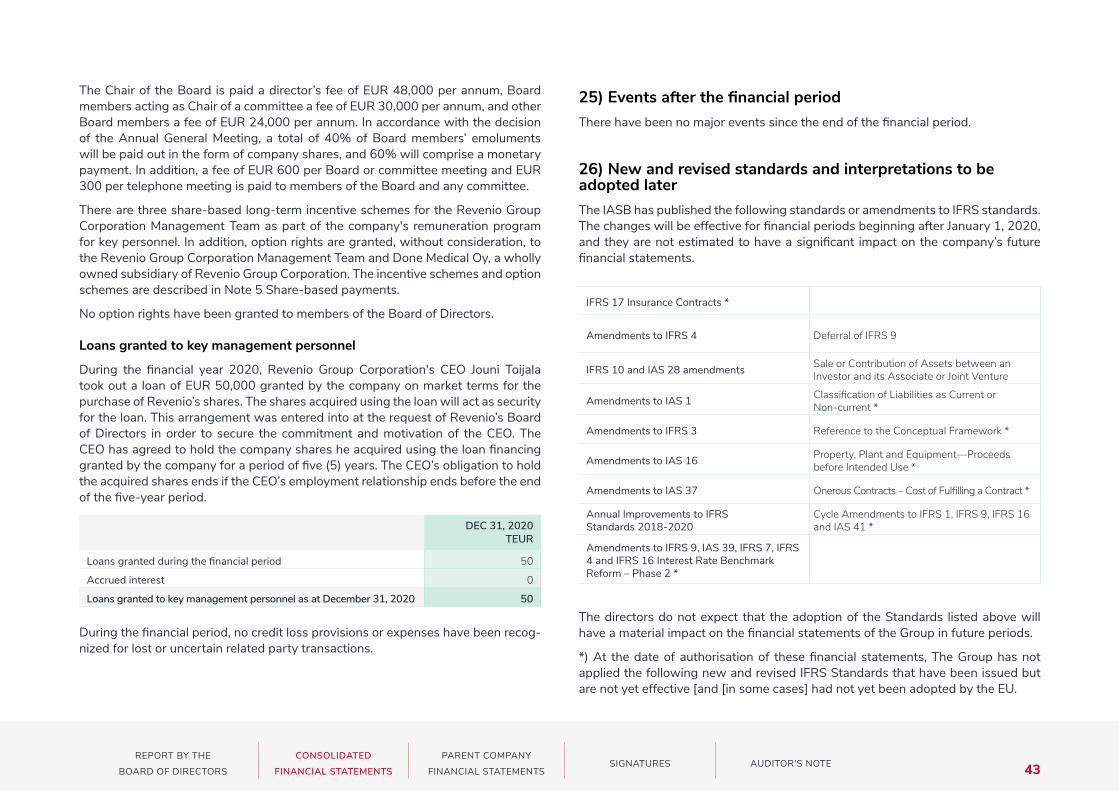
43REPORT BY THE
BOARD OF DIRECTORS
CONSOLIDATED
FINANCIAL STATEMENTS
PARENT COMPANY
FINANCIAL STATEMENTSSIGNATURES AUDITOR'S NOTE
The Chair of the Board is paid a director’s fee of EUR 48,000 per annum, Board members acting as Chair of a committee a fee of EUR 30,000 per annum, and other Board members a fee of EUR 24,000 per annum. In accordance with the decision of the Annual General Meeting, a total of 40% of Board members’ emoluments will be paid out in the form of company shares, and 60% will comprise a monetary payment. In addition, a fee of EUR 600 per Board or committee meeting and EUR 300 per telephone meeting is paid to members of the Board and any committee.
There are three share-based long-term incentive schemes for the Revenio Group Corporation Management Team as part of the company's remuneration program for key personnel. In addition, option rights are granted, without consideration, to the Revenio Group Corporation Management Team and Done Medical Oy, a wholly owned subsidiary of Revenio Group Corporation. The incentive schemes and option schemes are described in Note 5 Share-based payments.
No option rights have been granted to members of the Board of Directors.
Loans granted to key management personnel
During the financial year 2020, Revenio Group Corporation's CEO Jouni Toijala took out a loan of EUR 50,000 granted by the company on market terms for the purchase of Revenio’s shares. The shares acquired using the loan will act as security for the loan. This arrangement was entered into at the request of Revenio’s Board of Directors in order to secure the commitment and motivation of the CEO. The CEO has agreed to hold the company shares he acquired using the loan financing granted by the company for a period of five (5) years. The CEO’s obligation to hold the acquired shares ends if the CEO’s employment relationship ends before the end of the five-year period.
DEC 31, 2020TEUR
Loans granted during the financial period 50
Accrued interest 0
Loans granted to key management personnel as at December 31, 2020 50
During the financial period, no credit loss provisions or expenses have been recognized for lost or uncertain related party transactions.
25) Events after the financial periodThere have been no major events since the end of the financial period.
26) New and revised standards and interpretations to be adopted laterThe IASB has published the following standards or amendments to IFRS standards. The changes will be effective for financial periods beginning after January 1, 2020, and they are not estimated to have a significant impact on the company’s future financial statements.
The directors do not expect that the adoption of the Standards listed above will have a material impact on the financial statements of the Group in future periods.
*) At the date of authorisation of these financial statements, The Group has not applied the following new and revised IFRS Standards that have been issued but are not yet effective [and [in some cases] had not yet been adopted by the EU.
IFRS 17 Insurance Contracts *
Amendments to IFRS 4 Deferral of IFRS 9
IFRS 10 and IAS 28 amendments Sale or Contribution of Assets between an Investor and its Associate or Joint Venture
Amendments to IAS 1 Classification of Liabilities as Current or Non-current *
Amendments to IFRS 3 Reference to the Conceptual Framework *
Amendments to IAS 16 Property, Plant and Equipment—Proceeds before Intended Use *
Amendments to IAS 37 Onerous Contracts – Cost of Fulfilling a Contract *
Annual Improvements to IFRS Standards 2018-2020
Cycle Amendments to IFRS 1, IFRS 9, IFRS 16 and IAS 41 *
Amendments to IFRS 9, IAS 39, IFRS 7, IFRS 4 and IFRS 16 Interest Rate Benchmark Reform – Phase 2 *

44REPORT BY THE
BOARD OF DIRECTORS
CONSOLIDATED
FINANCIAL STATEMENTS
PARENT COMPANY
FINANCIAL STATEMENTSSIGNATURES AUDITOR'S NOTE
APPENDIXJAN 1–DEC 31,
2020JAN 1–DEC 31,
2019
Net sales 1 744,189.53 713,417.57
Personnel expenses
Salaries and fees 2 -1,049,075.43 -1,786,321.46
Indirect personnel costs
Pension costs -172,571.39 -206,433.99
Other indirect personnel expenses 26,008.13 -66,991.27
Personnel expenses total -1,195,638.69 -2,059,746.72
Depreciation, amortization, and impairment
Planned depreciation -8,979.00 -3,519.00
Depreciation and amortization total -8,979.00 -3,519.00
Other operating expenses 3 -1,599,829.14 -1,656,677.41
NET PROFIT/LOSS -2,060,257.30 -3,006,525.56
Financial income and expenses 4
Other financial income and interest receivable 1,601,697.09 4,102,193.58
Interest and other financial expenses -229,453.07 -1,347,072.44
Financial income and expenses total 1,372,244.02 2,755,121.14
PROFIT/LOSS BEFORE APPROPRIATIONAND TAXES -688,013.28 -251,404.42
Appropriation 5 17,795,543.15 14,046,656.78
Income taxes for the financial period 6 -3,452,510.64 -2,301,208.99
NET PROFIT/LOSS 13,655,019.23 11,494,043.37
Parent company profit& loss statement (FAS)
EUR

45REPORT BY THE
BOARD OF DIRECTORS
CONSOLIDATED
FINANCIAL STATEMENTS
PARENT COMPANY
FINANCIAL STATEMENTSSIGNATURES AUDITOR'S NOTE
APPENDIX DEC 31, 2020 DEC 31, 2019
NON-CURRENT ASSETS 7
Intangible assets
Other intangible assets 92,697.50 0,00
Other non-current expenses in progress 0,00 1,809.00
Intangible assets total 92,697.50 1,809.00
Tangible assets
Machinery and equipment 21,987.84 3,815.54
Tangible assets total 21,987.84 3,815.54
Investments 8
Holdings in Group companies 8,860,993.74 8,860,993.74
Holdings total 8,860,993.74 8,860,993.74
NON-CURRENT ASSETS TOTAL 8,975,679.08 8,866,618.28
CURRENT ASSETS
Non-current receivables
Receivables from Group companies 64,119,322.96 68,400,000.00
Other receivables 50,000.00 83,234.40
Non-current receivables, total 64,169,322.96 68,483,234.40
Short-term receivables
Receivables from Group companies 9 26,785,927.97 17,491,274.39
Loans receivable 0,00 12.18
Other receivables 36,088.18 22,907.98
Advances paid 10 109,893.93 95,147.74
Short-term receivables total 26,931,910.08 17,609,342.29
Bank and cash 4,495,750.73 9,132,481.54
INVENTORIES AND SHORT-TERM ASSETS TOTAL 95,596,983.77 95,225,058.23
TOTAL ASSETS 104,572,662.85 104,091,676.51
Parent company balance sheet (FAS)
APPENDIX DEC 31, 2020 DEC 31, 2019
SHAREHOLDER EQUITY 11
Share capital 5,314,918.72 5,314,918.72
Reserve for invested non-restricted equity 51,030,240.42 51,269,667.73
Retained earnings 4,137,397.35 591,569.58
Profit for the period 13,655,019.23 11,494,043.37
SHAREHOLDERS’ EQUITY TOTAL 74,137,575.72 68,670,199.40
LIABILITIES
Non-current liabilities
Loans from financial institutions 12 21,600,000.00 23,700,000.00
Accrued expenses and deferred income 435,902.00 567,038.00
Non-current liabilities total 22,035,902.00 24,267,038.00
Current liabilities
Loans from financial institutions 4,200,000.00 4,200,000.00
Accounts payable 217,832.13 159,394.64
Liabilities to Group companies 13 1,072,097.77 5,278,560.89
Other liabilities 19,023.36 88,505.43
Accrued expenses and deferred income 14 2,890,231.87 1,427,978.15
Current liabilities total 8,399,185.13 11,154,439.11
BORROWED CAPITAL TOTAL 30,435,087.13 35,421,477.11
LIABILITIES TOTAL 104,572,662.85 104,091,676.51
EUR EUR
ASSETS SHAREHOLDER EQUITY AND LIABILITIES

46REPORT BY THE
BOARD OF DIRECTORS
CONSOLIDATED
FINANCIAL STATEMENTS
PARENT COMPANY
FINANCIAL STATEMENTSSIGNATURES AUDITOR'S NOTE
JAN 1–DEC 31,2020
JAN 1–DEC 31,2019
Profit/loss before appropriations and taxes -688,013.28 -251,404.42
Adjustments
Impairments on subsidiary receivables 0,00 -2,941,566.94
Planned depreciation 8,979.00 3,519.00
Financial income and expenses -1,372,244.02 186,445.80
Other items 555,755.00 694,763.86
Change in working capital:
Change in non-interest-bearing current receivables 2,616,442.93 -1,646,192.93
Change in non-interest-bearing current liabilities -1,274,118.52 -55,836.99
Interest and payments paid from operations -193,731.51 -1,347,144.56
Interest and payments received from operations 1,565,975.53 1,160,698.76
Direct taxes paid -1,352,380.08 -1,636,073.83
Cash flow from operations -133,334.95 -5,832,792.25
CASH FLOW FROM INVESTMENT ACTIVITIESJAN 1–DEC 31,
2020JAN 1–DEC 31,
2019
Investment in tangible and intangible assets -118,039.80 -1,809.00
Loans granted -50,000.00 -68,200,000.00
Repayments of loan receivables 4,280,677.04 0,00
Purchased subsidiary shares 0,00 -2,010,000.00
Cash flow from investing activities 4,112,637.24 -70,211,809.00
JAN 1–DEC 31,2020
JAN 1–DEC 31,2019
Rights issue 0,00 42,300,000.00
Share subscription through exercised options 1,304,426.70 1,857,187.80
Acquisition of own shares -1,613,454.01 0.00
Withdrawals and repayments of short-term borrowings 0,00 4,200,000.00
Withdrawals and repayments of long-term borrowings -2,100,000.00 23,700,000.00
Dividends paid and other distribution of profits -7,948,215.60 -6,708,873.64
Group account liabilities -4,206,057.02 1,512,177.64
Group contributions received and paid 5,947,266.83 11,990,607.13
Cash flow from financing activities -8,616,033.10 78,851,098.93
CHANGE IN CASH AND CASH EQUIVALENTS -4,636,730.81 2,806,497.68
Cash and cash equivalents at beginning of period 9,132,481.54 6,325,983.86
Cash and cash equivalents at end of period 4,495,750.73 9,132,481.54
Change in cash and cash equivalents -4,636,730.81 2,806,497.68
EUR
EUR EUR
CASH FLOW FROM OPERATING ACTIVITIES CASH FLOW FROM FINANCING ACTIVITIES
Parent company cash flow statement (FAS)

47REPORT BY THE
BOARD OF DIRECTORS
CONSOLIDATED
FINANCIAL STATEMENTS
PARENT COMPANY
FINANCIAL STATEMENTSSIGNATURES AUDITOR'S NOTE
Notes to parent companyfinancial statements Dec 31, 2020
Accounting principles for the parent company financial statements
Basis of preparation
The financial statements of the parent company Revenio Group Corporation have been prepared in accordance with the Finnish Accounting Act, Limited Liability Companies Act, and the Finnish Accounting Standards (FAS).
Valuation and depreciation principles
Valuation of non-current assets
The company’s non-current assets are stated at acquisition cost less planned depreciation. The depreciation plan is defined based on experiences. Value adjustments are made based on the difference between the acquisition cost and the residual value and estimated useful life.
The bases for planned depreciation are as follows:
Notes to the income statement
Intangible rights 3 years straight-line depreciation
Other non-current expenses 3 years straight-line depreciation
Machinery and equipment 3 years straight-line depreciation
Subsidiaries
Direct expenses from the acquisition of subsidiary companies are recognized in the acquisition cost of subsidiary company holdings. The Group management continuously reviews Group items for any indication of impairment. If there are such indications, the amount recoverable from the said asset item is assessed.
Employee benefits
Personnel pension security is handled by external pension insurance companies. Pension costs are recorded as expenses in the year in which they are incurred.
JAN 1–DEC 31, 2020 EUR
JAN 1–DEC 31, 2019 EUR
Administrative services to subsidiaries 744,189.53 713,417.57
Net sales total 744,189.53 713,417.57
JAN 1–DEC 31, 2020 EUR
JAN 1–DEC 31, 2019 EUR
CEO -468,146.97 -602,901.00
Board Members -174,000.00 -144,000.00
Other salaries and remunerations -597,102.07 -1,006,997.10
Total -1,239,249.04 -1,753,898.10
Accrued salaries and remunerations total -1,049,075.43 -1,786,321.46
AVERAGE NUMBER OF PERSONNELDURING PERIOD JAN 1–DEC 31, 2020 JAN 1–DEC 31, 2019
Management 3 3
Others 3 3
Total 6 6
1) Distribution of net sales
2) Salaries and remunerations
The company's Management Team participates in a long-term share plan, within which programs are valid for the earning years 2018–2020, 2019–2021 and 2020-2022. The minimum, target and maximum bonus of each participant shall be decided separate, as well as performance criteria and the related targets.
Benefits obtained under the share plan are recognized with caution as expenses in the income statement on a straight-line basis up until payout.
§

48REPORT BY THE
BOARD OF DIRECTORS
CONSOLIDATED
FINANCIAL STATEMENTS
PARENT COMPANY
FINANCIAL STATEMENTSSIGNATURES AUDITOR'S NOTE
3) Other operating expenses 4) Financial income and expenses
6) Income taxes
5) Appropriation
JAN 1–DEC 31, 2020 EUR
JAN 1–DEC 31, 2019 EUR
Rent of business premises -79,007.38 -71,053.01
Vehicle and travel expenses -111,659.34 -206,710.11
Machinery and equipment expenses -110,640.44 -86,928.81
Marketing and entertainment -104,282.05 -92,984.46
Expert services purchased -1,017,393.57 -988,837.43
Administrative expenses -92,461.37 -47,861.77
Other operating expenses -84,384.99 -162,301.82
Total -1,599,829.14 -1,656,677.41
Auditor’s fees
Deloitte Oy
Auditing fees -40,000.00 -40,000.00
Certificates and statements -16,000.00 -17,000.00
Total -56,000.00 -57,000.00
FINANCIAL INCOME AND EXPENSES FROM GROUP COMPANIES
JAN 1–DEC 31, 2020 EUR
JAN 1–DEC 31, 2019 EUR
Interest income from Group companies 1,594,820.79 1,160,525.25
Returned impairments on consolidated loans 0,00 2,941,566.94
Total 1,594,820.79 4,102,092.19
FINANCIAL INCOME AND EXPENSES FROM OTHERS
JAN 1–DEC 31, 2020 EUR
JAN 1–DEC 31, 2019 EUR
Interest income from others 650.42 173.51
Other financial income 6,225.88 0,00
Interest expenses from loans from financial institutions -193,731.51 -192,652.34
Interest payable to others -10,678.86 -746.39
Loan management expenses 0,00 -71,200.00
Other financial expenses -25,042.70 -1,082,545.83
Total -222,576.77 -1,346,971.05
JAN 1–DEC 31, 2020 EUR
JAN 1–DEC 31, 2019 EUR
Income tax for appropriation -3,559,108.63 -2,809,331,36
Income tax for actual operations 109,597.99 510,071.24
Income tax for previous fiscal years -3,000.00 -1,948.87
Total -3,452,510.64 -2,301,208.99
JAN 1–DEC 31, 2020 EUR
JAN 1–DEC 31, 2019 EUR
Group contributions received 20,600,000.00 15,200,000.00
Group contributions paid -2,804,456.85 -1,153,343.22
Total 17,795,543.15 14,046,656.78
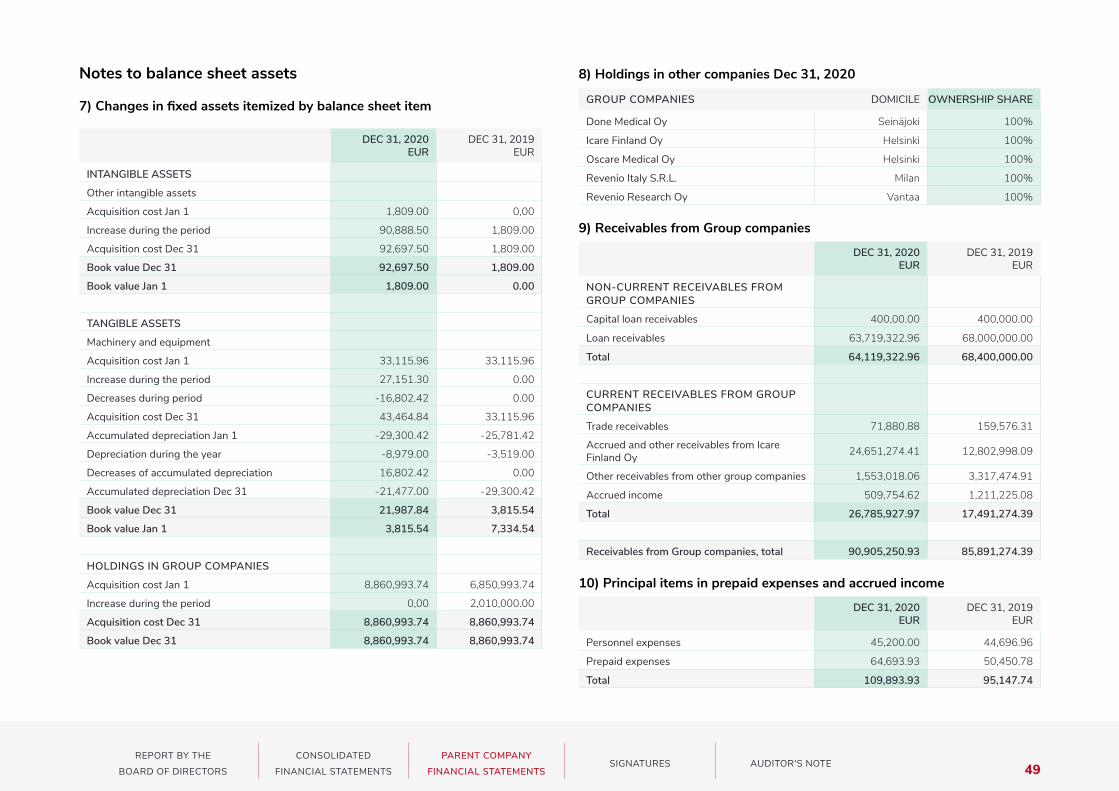
49REPORT BY THE
BOARD OF DIRECTORS
CONSOLIDATED
FINANCIAL STATEMENTS
PARENT COMPANY
FINANCIAL STATEMENTSSIGNATURES AUDITOR'S NOTE
Notes to balance sheet assets
7) Changes in fixed assets itemized by balance sheet item
DEC 31, 2020EUR
DEC 31, 2019EUR
INTANGIBLE ASSETS
Other intangible assets
Acquisition cost Jan 1 1,809.00 0,00
Increase during the period 90,888.50 1,809.00
Acquisition cost Dec 31 92,697.50 1,809.00
Book value Dec 31 92,697.50 1,809.00
Book value Jan 1 1,809.00 0.00
TANGIBLE ASSETS
Machinery and equipment
Acquisition cost Jan 1 33,115.96 33,115.96
Increase during the period 27,151.30 0.00
Decreases during period -16,802.42 0.00
Acquisition cost Dec 31 43,464.84 33,115.96
Accumulated depreciation Jan 1 -29,300.42 -25,781.42
Depreciation during the year -8,979.00 -3,519.00
Decreases of accumulated depreciation 16,802.42 0.00
Accumulated depreciation Dec 31 -21,477.00 -29,300.42
Book value Dec 31 21,987.84 3,815.54
Book value Jan 1 3,815.54 7,334.54
HOLDINGS IN GROUP COMPANIES
Acquisition cost Jan 1 8,860,993.74 6,850,993.74
Increase during the period 0,00 2,010,000.00
Acquisition cost Dec 31 8,860,993.74 8,860,993.74
Book value Dec 31 8,860,993.74 8,860,993.74
8) Holdings in other companies Dec 31, 2020
GROUP COMPANIES DOMICILE OWNERSHIP SHARE
Done Medical Oy Seinäjoki 100%
Icare Finland Oy Helsinki 100%
Oscare Medical Oy Helsinki 100%
Revenio Italy S.R.L. Milan 100%
Revenio Research Oy Vantaa 100%
9) Receivables from Group companies
10) Principal items in prepaid expenses and accrued income
DEC 31, 2020 EUR
DEC 31, 2019 EUR
NON-CURRENT RECEIVABLES FROMGROUP COMPANIES
Capital loan receivables 400,00.00 400,000.00
Loan receivables 63,719,322.96 68,000,000.00
Total 64,119,322.96 68,400,000.00
CURRENT RECEIVABLES FROM GROUPCOMPANIES
Trade receivables 71,880.88 159,576.31
Accrued and other receivables from Icare Finland Oy 24,651,274.41 12,802,998.09
Other receivables from other group companies 1,553,018.06 3,317,474.91
Accrued income 509,754.62 1,211,225.08
Total 26,785,927.97 17,491,274.39
Receivables from Group companies, total 90,905,250.93 85,891,274.39
DEC 31, 2020 EUR
DEC 31, 2019 EUR
Personnel expenses 45,200.00 44,696.96
Prepaid expenses 64,693.93 50,450.78
Total 109,893.93 95,147.74

50REPORT BY THE
BOARD OF DIRECTORS
CONSOLIDATED
FINANCIAL STATEMENTS
PARENT COMPANY
FINANCIAL STATEMENTSSIGNATURES AUDITOR'S NOTE
Notes to balance sheet liabilities
11) Changes in equity
DEC 31, 2020 EUR
DEC 31, 2019 EUR
Share capital
Share capital Jan 1 5,314,918.72 5,314,918.72
Share capital Dec 31 5,314,918.72 5,314,918.72
Restricted equity total Dec 31 5,314,918.72 5,314,918.72
Reserve for invested non-restricted equity
Reserve for invested non-restricted equity Jan 1 51,269,667.73 7,054,879.93
Right issue 0,00 42,300,000.00
Share subscriptions with stock options 1,304,426.70 1,857,187.80
Purchase of own shares -1,613,454.01 0.00
Transferred shares 69,600.00 57,600.00
Reserve for invested non-restricted equity Dec 31 51,030,240.42 51,269,667.73
DEC 31, 2020 EUR
DEC 31, 2019 EUR
Profit/loss from previous financial periods
Profit/loss from previous financial periods Jan 1 12,085,612.95 7,300,443.22
Dividends -7,948,215.60 -6,708,873.64
Profit/loss from previous financial periods Dec 31 4,137,397.35 591,569.58
Profit/loss for the period Dec 31 13,655,019.23 11,494,043.37
Non-restricted equity total Dec 31 68,822,657.00 63,355,280.68
Equity total Dec 31 74,137,575.72 68,670,199.41
Calculation of the amount of distributable unrestricted equity on 31 Dec
Invested unrestricted capital reserve 51,030,240.42 51,269,667.74
Retained earnings 4,137,397.35 591,569.58
Profit for the period 13,655,019.23 11,494,043.37
Distributable unrestricted equity Dec 31 68,822,657.00 63,355,280.69
The share capital of Revenio Group Corporation on December 31, 2020 was EUR 5,314,918.72, and the number of shares was 26,658,952. There is one class of shares. All shares confer an equal right to dividends and the company’s funds.
On the closing date, the company held 131,058 of its own shares (REG1V).

51REPORT BY THE
BOARD OF DIRECTORS
CONSOLIDATED
FINANCIAL STATEMENTS
PARENT COMPANY
FINANCIAL STATEMENTSSIGNATURES AUDITOR'S NOTE
13) Intra-group liabilities
14) Principal items of accrued liabilities and deferred income
15) Notes to collateral and commitments
DEC 31, 2020EUR
DEC 31, 2019 EUR
Current intra-group liabilities
Intra-group bank account 226,885.61 4,432,942.63
Other liabilities 845,212.16 845,618.26
Total 1,072,097.77 5,278,560.89
DEC 31, 2020EUR
DEC 31, 2019 EUR
Personnel expenses 697,543.31 651,951.13
Income taxes 2,100,130.56 665,135.16
Other accruals and deferred income 92,558.00 110,891.86
Total 2,890,231.87 1,427,978.15
LEASE COMMITMENTSDEC 31, 2020
EURDEC 31, 2019
EUR
Lease commitments maturing next year 7,557.97 31,371.60
Lease commitments maturing later than next year 3,108.00 45,270.82
Total 10,665.97 76,642.42
RENT LIABILITIESDEC 31, 2020
EURDEC 31, 2019
EUR
Rent liabilities for office premises, maturing next year 390,547.74 387,023.40
Rent liabilities for office premises, maturing later than next year 162,728.23 161,259.75
Total 553,275.97 548,283.15
Banks and financial institutions have granted Revenio Group Corporation mortgages on company assets worth EUR 91,000.000, and these are used as collateral for the loan.
Lease agreements run for 2–5 years and do not include special notice or purchase option clauses.
12) Non-current liabilities
Loans from financial institutions
As at December 31, 2020, the parent company had interest-bearing non-current liabilities amounting to EUR 21.6 million. The company does not have any loans falling due later than within five years. At the end of 2019, the company had interest-bearing non-current liabilities totaling EUR 23.7 million.
The breakdown includes both long-term and short-term accrued liabilities.

52REPORT BY THE
BOARD OF DIRECTORS
CONSOLIDATED
FINANCIAL STATEMENTS
PARENT COMPANY
FINANCIAL STATEMENTSSIGNATURES AUDITOR'S NOTE
The number of shares and stock option rights held by the members of the Board of Directors, the CEO, and entities in their control on Dec 31, 2020
% NO.
Shares 0.2% 59,986
Option rights 0.0% 0
16) Other notes
STOCK OPTION RIGHTS GRANTED TO PERSONNEL AND MANAGEMENT
Option rights of personnel
Basis of preparation
The company has a stock option program decided by the Board of Directors on August 10, 2015, based on the authorization of the Annual General Meeting on March 19, 2015, comprising a maximum of 150,000 option rights. The option rights are divided into three series. One option right entitles the holder to subscribe for three Revenio Group Corporation shares. The share subscription price is the trade-weighted average price of the share on Nasdaq Helsinki Oy plus 15 per cent.
On the record date of dividend distribution, the subscription price is decreased by the amount of dividend decided between the end of the determination period and the beginning of the share subscription period. By way of deviation from the shareholders' preemptive subscription right, the option rights will be granted, without consideration, to key personnel employed or to be employed by Revenio Group, as decided by the Board of Directors. The shareholders’ preemptive subscription right is waived as the option rights are intended to constitute a part of the incentive program of Revenio Group.
To the extent that the option rights are not allocated to the Group's personnel, they will be granted to Done Medical Oy, a wholly owned subsidiary of Revenio. When option rights are exercised, the considerations received on the basis of share subscriptions are recorded in the unrestricted equity reserve under shareholders’ equity.
OPTION PROGRAM 2015
SERIESTOTAL
AMOUNTSUBSCRIPTION
PERIOD
TURNOVER PERIOD DETERMINING THE
SUBSCRIPTION PRICE
DIVIDEND- ADJUSTED
SUBSCRIPTION PRICE
A 50,000 Ended Sep 1, 2015–Oct 15, 2015 Ended
B 50,000 Ended Sep 1, 2016–Oct 15, 2016 Ended
C 50,000 May 31, 2019–May 31, 2021 Sep 1–Oct 15, 2017 12,48
§

53REPORT BY THE
BOARD OF DIRECTORS
CONSOLIDATED
FINANCIAL STATEMENTS
PARENT COMPANY
FINANCIAL STATEMENTSSIGNATURES AUDITOR'S NOTE
Management incentive scheme
Basis of preparation
The Board of Directors of Revenio Group Corporation decided on three share-based long-term incentive schemes directed towards the Management Team of Revenio Group. Long-term incentive schemes form part of the company's remuneration program for key personnel and are aimed at supporting the implementation of the company's strategy and harmonizing the objectives of key personnel and the company in order to grow the company's value.
The Board of Directors shall decide separately on the minimum, target and maximum bonus of each participant, as well as performance criteria and the related targets. The amount of bonus payable to the participants depends on the achievement of the pre-set targets. No bonus will be paid if the targets are not met, or if the participant's work or employment relationship ends before the bonus is paid. Each performance share plan shall cover a maximum of 10 persons and the objectives of the plan shall be related to the absolute total yield of the company's share and the cumulative operating result over a period of three years. If the targets of the incentive scheme are met, the bonuses will be paid in the spring of the year following the earning period. The total amount of share bonus to be paid on the basis of the program earning period is gross earnings minus the amount of cash required to cover taxes due on the share bonus and any other tax-like payments, after which the remaining net bonus shall be paid in shares. However, in certain circumstances the company has the right to pay the entire bonus in cash.
Benefits granted under the share plan are recognized with caution as expenses in the income statement on a straight-line basis during the vesting period up until payout. During the financial year 2020, the company has recognized a total of EUR 494 thousand as expense and non-current accruals under the incentive scheme. The accrued liability recognized in the balance sheet as of Dec 31, 2020 is a total of EUR 891 thousand.
EARNING YEARS TIME OF BONUS PAYMENTMAXIMUM AMOUNT
OF SHARE BONUS
2018–2020 2021 50,000
2019–2021 2022 50,000
2020–2022 2023 50,000
§

54REPORT BY THE
BOARD OF DIRECTORS
CONSOLIDATED
FINANCIAL STATEMENTS
PARENT COMPANY
FINANCIAL STATEMENTSSIGNATURES AUDITOR'S NOTE
Signatures to the financial statements and review of operationsVantaa, February 19, 2021
Board of Directors and CEO of Revenio Group Corporation
Auditor's note
We have issued an audit report today based on the audit we have performed.
Helsinki, February 19, 2021
Deloitte Oy Authorized Public Accountants
Mikko Lahtinen Authorized Public Accountant
Pekka Rönkä Chair of the Board
Ann-Christine Sundell Board member
Arne Boye Nielsen Board member
Kyösti Kakkonen Board member
Pekka Tammela Board member
Bill Östman Board member
Jouni Toijala CEO

5555REPORT BY THE
BOARD OF DIRECTORS
CONSOLIDATED
FINANCIAL STATEMENTS
PARENT COMPANY
FINANCIAL STATEMENTSSIGNATURES AUDITOR'S NOTE
Auditor’s report
Report on the Audit of the Financial Statements
OpinionWe have audited the financial statements of Revenio Group Oyj (business identity code 1700625-7) for the year ended 31 December 2020. The financial statements comprise the consolidated statement of comprehensive income, balance sheet, statement of cash flows, statement of changes in equity and notes, including a summary of significant accounting policies, as well as the parent company’s income statement, balance sheet, statement of cash flows and notes.
In our opinion
• the consolidated financial statements give a true and fair view of the group’s financial position, financial performance and cash flows in accordance with International Financial Reporting Standards (IFRS) as adopted by the EU
• the financial statements give a true and fair view of the parent company’s financial performance and financial position in accordance with the laws and regulations governing the preparation of financial statements in Finland and comply with statutory requirements.
Our opinion is consistent with the additional report submitted to the Audit Committee.
To the Annual General Meeting of Revenio Group Oyj
Basis for OpinionWe conducted our audit in accordance with good auditing practice in Finland. Our responsibilities under good auditing practice are further described in the Auditor’s Responsibilities for the Audit of the Financial Statements section of our report.
We are independent of the parent company and of the group companies in accordance with the ethical requirements that are applicable in Finland and are relevant to our audit, and we have fulfilled our other ethical responsibilities in accordance with these requirements.
In our best knowledge and understanding, the non-audit services that we have provided to the parent company and group companies are in compliance with laws and regulations applicable in Finland regarding these services, and we have not provided any prohibited non-audit services referred to in Article 5(1) of regulation (EU) 537/2014. The non-audit services that we have provided have been disclosed in note 8 to the consolidated financial statements.
We believe that the audit evidence we have obtained is sufficient and appropriate to provide a basis for our opinion.
Key Audit MattersKey audit matters are those matters that, in our professional judgment, were of most significance in our audit of the financial statements of the current period. These matters were addressed in the context of our audit of the financial statements as a whole and in forming our opinion thereon, and we do not provide a separate opinion on these matters.
We have also addressed the risk of management override of internal controls. This includes consideration of whether there was evidence of management bias that represented a risk of material misstatement due to fraud.

5656REPORT BY THE
BOARD OF DIRECTORS
CONSOLIDATED
FINANCIAL STATEMENTS
PARENT COMPANY
FINANCIAL STATEMENTSSIGNATURES AUDITOR'S NOTE
KEY AUDIT MATTER
Revenue recognition
Refer to notes 1 and 2 in the consolidated financial statements.
• Consolidated net sales of EUR 61.6 million consists of the income from the sale of health technology products and services.
• Revenue from sales is recognized when the customer gains control over the goods or services (performance obligation). As a rule, control is transferred to the customer upon delivery as per the terms and conditions of agreement.
• For audit purposes, the key is that revenue is recognized timely and in the correct amount.
• This matter is a significant risk of material misstatement referred to in EU Regulation No 537/241, point (c) of Article 10(2).
How our audit addressed the key audit matter
• We have assessed the controls relating to the sales process and the revenue recognition.
• We have reviewed the accounting principles and practices associated with revenue recognition to assess whether the recognition is in accordance with IFRS 15.
• We have tested the timing and quantitative accuracy of revenue recognition by comparing individual sales transactions to sales agreements and delivery notes.
• We have assessed the appropriateness of the presentation in the consolidated financial statements.
Valuation of goodwill and other intangible assets
Refer to accounting principles for the consolidated financial statements and note 12 in the consolidated financial statements.
• The consolidated statement of financial position includes goodwill of EUR 50.4 million and other intangible assets of EUR 16.9 million.
• Goodwill and other intangible assets mainly result from the acquisition of CenterVue S.p.A. in 2019.
• In addition, other intangible assets include capitalized development costs relating to the development of health technology products.
• The valuation and impairment testing of goodwill and other intangible assets involve management estimates of cash flow projections and trade cycle changes, and hence this matter is addressed as a key audit matter.
How our audit addressed the key audit matter
• We have reviewed and assessed the management’s methods and assumptions used in impairment testing.
• We have assessed the indications of impairment identified by the management and performed audit procedures on the impairment testing prepared by the management.
• We have tested the mathematical accuracy of the models used in impairment testing, evaluated and challenged the projections used in the calculations and related changes, and compared the prior year forecasts to the actual figures.
• We have evaluated the appropriateness of the presentation in the consolidated financial statements.
We have no key audit matters to report with respect to our audit of the parent company’s financial statements. There are no significant risks of material misstatement referred to in EU regulation No 537/241, point (c) of Article 10(2) relating to the parent company’s financial statements.
5757REPORT BY THE
BOARD OF DIRECTORS
CONSOLIDATED
FINANCIAL STATEMENTS
PARENT COMPANY
FINANCIAL STATEMENTSSIGNATURES AUDITOR'S NOTE
Responsibilities of the Board of Directors and the Managing Director for the Financial StatementsThe Board of Directors and the Chief Executive Officer The Board of Directors and the Managing Director are responsible for the preparation of consolidated financial statements that give a true and fair view in accordance with International Financial Reporting Standards (IFRS) as adopted by the EU, and of financial statements that give a true and fair view in accordance with the laws and regulations governing the preparation of financial statements in Finland and comply with statutory requirements. The Board of Directors and the Managing Director are also responsible for such internal control as they determine is necessary to enable the preparation of financial statements that are free from material misstatement, whether due to fraud or error.
In preparing the financial statements, the Board of Directors and the Managing Director are responsible for assessing the parent company’s and the group’s ability to continue as going concern, disclosing, as applicable, matters relating to going concern and using the going concern basis of accounting. The financial statements are prepared using the going concern basis of accounting unless there is an intention to liquidate the parent company or the group or cease operations, or there is no realistic alternative but to do so.
Auditor’s Responsibilities for the Audit of the Financial Statements Our objectives are to obtain reasonable assurance about whether the financial statements as a whole are free from material misstatement, whether due to fraud or error, and to issue an auditor’s report that includes our opinion. Reasonable assurance is a high
level of assurance, but is not a guarantee that an audit conducted in accordance with good auditing practice will always detect a material misstatement when it exists. Misstatements can arise from fraud or error and are considered material if, individually or in the aggregate, they could reasonably be expected to influence the economic decisions of users taken on the basis of the financial statements.
As part of an audit in accordance with good auditing practice, we exercise professional judgment and maintain professional skepticism throughout the audit. We also:
• Identify and assess the risks of material misstatement of the financial statements, whether due to fraud or error, design and perform audit procedures responsive to those risks, and obtain audit evidence that is sufficient and appropriate to provide a basis for our opinion. The risk of not detecting a material misstatement resulting from fraud is higher than for one resulting from error, as fraud may involve collusion, forgery, intentional omissions, misrepresentations, or the override of internal control.
• Obtain an understanding of internal control relevant to the audit in order to design audit procedures that are appropriate in the circumstances, but not for the purpose of expressing an opinion on the effectiveness of the parent company’s or the group’s internal control.
• Evaluate the appropriateness of accounting policies used and the reasonableness of accounting estimates and related disclosures made by management.
• Conclude on the appropriateness of the Board of Directors’ and the Managing Director’s use of the going concern basis of accounting and based on the
audit evidence obtained, whether a material uncertainty exists related to events or conditions that may cast significant doubt on the parent company’s or the group’s ability to continue as a going concern. If we conclude that a material uncertainty exists, we are required to draw attention in our auditor’s report to the related disclosures in the financial statements or, if such disclosures are inadequate, to modify our opinion. Our conclusions are based on the audit evidence obtained up to the date of our auditor’s report. However, future events or conditions may cause the parent company or the group to cease to continue as a going concern.
• Evaluate the overall presentation, structure and content of the financial statements, including the disclosures, and whether the financial statements represent the underlying transactions and events so that the financial statements give a true and fair view.
• Obtain sufficient appropriate audit evidence regarding the financial information of the entities or business activities within the group to express an opinion on the consolidated financial statements. We are responsible for the direction, supervision and performance of the group audit. We remain solely responsible for our audit opinion.

5858REPORT BY THE
BOARD OF DIRECTORS
CONSOLIDATED
FINANCIAL STATEMENTS
PARENT COMPANY
FINANCIAL STATEMENTSSIGNATURES AUDITOR'S NOTE
We communicate with those charged with governance regarding, among other matters, the planned scope and timing of the audit and significant audit findings, including any significant deficiencies in internal control that we identify during our audit.
We also provide those charged with governance with a statement that we have complied with relevant ethical requirements regarding independence, and communicate with them all relationships and other matters that may reasonably be thought to bear on our independence, and where applicable, related safeguards.
From the matters communicated with those charged with governance, we determine those matters that were of most significance in the audit of the financial statements of the current period and are therefore the key audit matters. We describe these matters in our auditor’s report unless law or regulation precludes public disclosure about the matter or when, in extremely rare circumstances, we determine that a matter should not be communicated in our report because the adverse consequences of doing so would reasonably be expected to outweigh the public interest benefits of such communication.
Other Reporting Requirements
Information on Our Audit Engagement
We were first appointed as auditors by the Annual General Meeting on 22 March 2017, and our appointment represents a total period of uninterrupted engagement of four years.
Other Information
The Board of Directors and the Managing Director are responsible for the other information. The other information comprises the report of the Board of Directors and the information included in the Annual Report, but does not include the financial statements and our auditor’s report thereon. We have obtained the report of the Board of Directors prior to the date of this auditor’s report, and the Annual Report is expected to be made available to us after that date.
Our opinion on the financial statements does not cover the other information.
In connection with our audit of the financial statements, our responsibility is to read the other information identified above and, in doing so, consider whether the other information is materially inconsistent with the financial statements or our knowledge obtained in the audit, or otherwise appears to be materially misstated. With respect to the report of the Board of Directors, our responsibility also includes considering whether the report of the Board of Directors has been prepared in accordance with the applicable laws and regulations.
In our opinion, the information in the report of the Board of Directors is consistent with the information in the financial statements and the report of the Board of Directors has been prepared in accordance with the applicable laws and regulations.
If, based on the work we have performed on the other information that we obtained prior to the date of this auditor’s report, we conclude that there is a material misstatement of this other information, we are required to report that fact. We have nothing to report in this regard.
Helsinki, 19 February 2021
Deloitte Oy Audit Firm Mikko Lahtinen Authorized Public Accountant (KHT)

W W W . R E V E N I O G R O U P . F I
The statements and estimates regarding markets and the future presented in this Annual Report are based on the best knowledge of the management of the Group and its subsidiaries at the time they were made. Due to their nature, they contain
a certain amount of uncertainty and may change in the event of developments in the general economic situation or conditions within the industry.