Embed Size (px)
Citation preview

1
S-38.3041 Slide 1Helsinki University of Technology
Networking Laboratory
Operator’s Enterprise Customers
S-38.3041 Operator Business

2
S-38.3041 Slide 2Helsinki University of Technology
Networking Laboratory
Enterprise IT in Nutshell
• The average enterprise spends
– c. 4% of its gross revenue on IT
– c. 500 EUR per month per employee on IT
– c. 5-7% of total headcount on IT headcount
– c. 60 EUR per employee per month on mobile (operator ARPU)
• Highest IT spending per employee in IT, telecom, and
financial sectors
• Global enterprise IT market
– c. 1000 BEUR in 2003
– largest part is system integration and outsourcing services
– c. 50% of global IT spending happened in the US in 2003

3
S-38.3041 Slide 3Helsinki University of Technology
Networking Laboratory
Enterprise view of IT vendors
Computers
Dell
Sun
HP
IBM
Strategic advisors
Microsoft
IBM
Cisco
Accenture
Strategic advisors
Microsoft
IBM
Cisco
Accenture
Storage
EMC
Brocade
Hitachi
Intranet
Cisco
Extreme
Enterasys
Infra
software
IBM
Oracle
Bea
Microsoft
Apps
software
SAP
Siebel
Oracle
Services
IBM
Accenture
Sapient
Point
solutions
Symbol
NCR
Nokia
Key categoryvendors
Public
Network
Global
Regional
Local
4
S-38.3041 Slide 4Helsinki University of Technology
Networking Laboratory
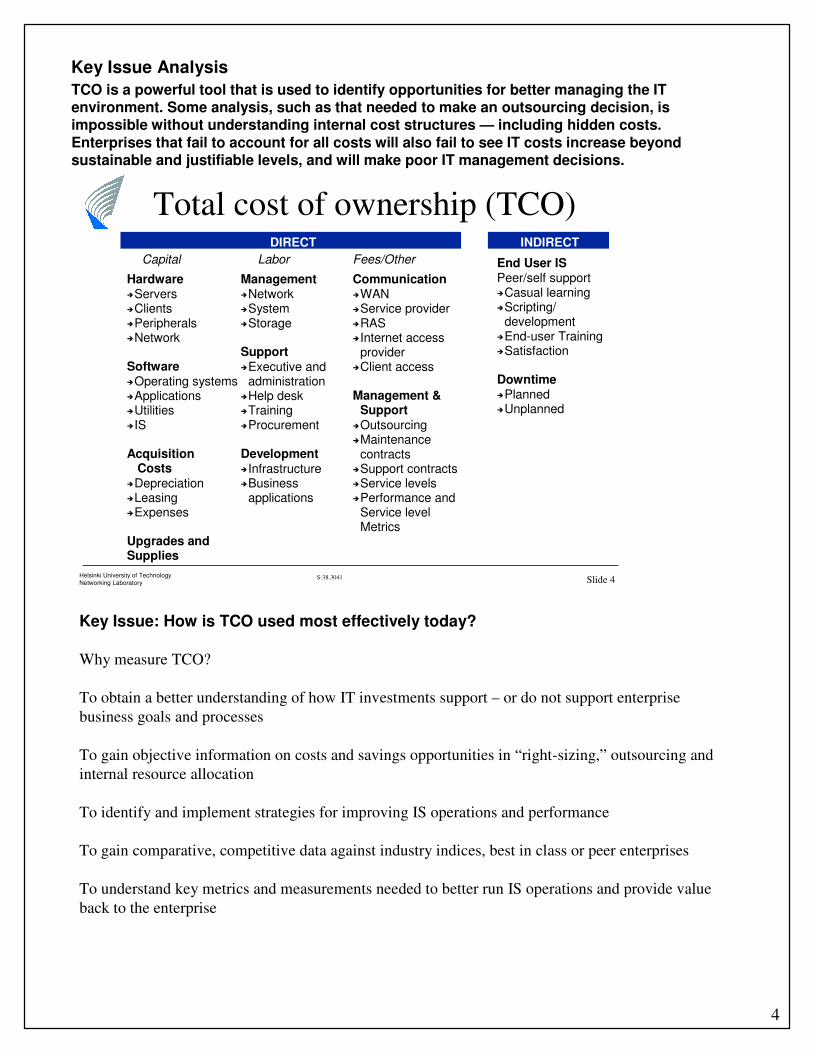
Total cost of ownership (TCO)
Management�Network�System�Storage
Support�Executive and
administration�Help desk�Training�Procurement
Development�Infrastructure�Business
applications
Hardware�Servers�Clients�Peripherals�Network
Software�Operating systems�Applications�Utilities�IS
AcquisitionCosts
�Depreciation�Leasing�Expenses
Upgrades andSupplies
Communication�WAN�Service provider�RAS�Internet access
provider�Client access
Management &Support
�Outsourcing�Maintenance
contracts�Support contracts�Service levels�Performance and
Service levelMetrics
DIRECT
End User ISPeer/self support�Casual learning�Scripting/
development�End-user Training�Satisfaction
Downtime�Planned�Unplanned
INDIRECT
Capital Labor Fees/Other
Key Issue: How is TCO used most effectively today?
Why measure TCO?
To obtain a better understanding of how IT investments support – or do not support enterprise
business goals and processes
To gain objective information on costs and savings opportunities in “right-sizing,” outsourcing and
internal resource allocation
To identify and implement strategies for improving IS operations and performance
To gain comparative, competitive data against industry indices, best in class or peer enterprises
To understand key metrics and measurements needed to better run IS operations and provide value
back to the enterprise
TCO is a powerful tool that is used to identify opportunities for better managing the IT environment. Some analysis, such as that needed to make an outsourcing decision, is impossible without understanding internal cost structures — including hidden costs.
Enterprises that fail to account for all costs will also fail to see IT costs increase beyond sustainable and justifiable levels, and will make poor IT management decisions.
Key Issue Analysis
5
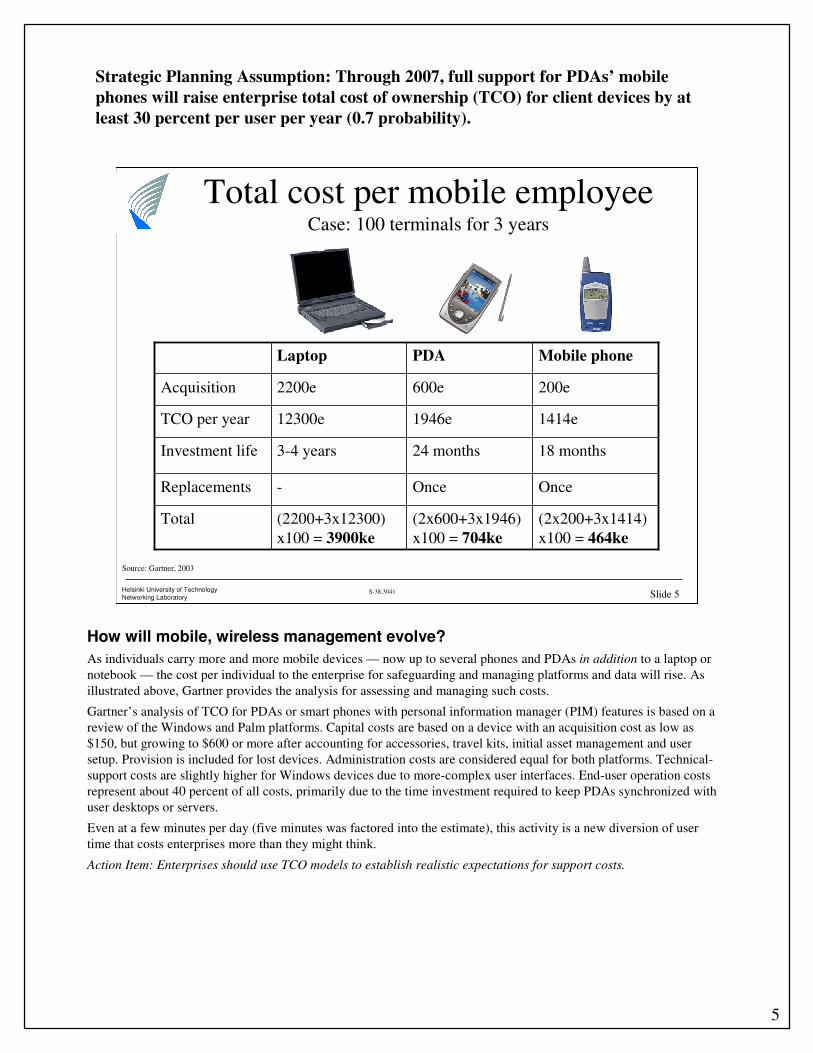
Strategic Planning Assumption: Through 2007, full support for PDAs’ mobile
phones will raise enterprise total cost of ownership (TCO) for client devices by at
least 30 percent per user per year (0.7 probability).
S-38.3041 Slide 5Helsinki University of Technology
Networking Laboratory
Total cost per mobile employeeCase: 100 terminals for 3 years
Source: Gartner, 2003
(2x200+3x1414)
x100 = 464ke
(2x600+3x1946)
x100 = 704ke
(2200+3x12300)
x100 = 3900ke
Total
OnceOnce-Replacements
18 months24 months3-4 yearsInvestment life
1414e1946e12300eTCO per year
200e600e2200eAcquisition
Mobile phonePDALaptop
How will mobile, wireless management evolve?
As individuals carry more and more mobile devices — now up to several phones and PDAs in addition to a laptop or
notebook — the cost per individual to the enterprise for safeguarding and managing platforms and data will rise. As
illustrated above, Gartner provides the analysis for assessing and managing such costs.
Gartner’s analysis of TCO for PDAs or smart phones with personal information manager (PIM) features is based on a
review of the Windows and Palm platforms. Capital costs are based on a device with an acquisition cost as low as
$150, but growing to $600 or more after accounting for accessories, travel kits, initial asset management and user
setup. Provision is included for lost devices. Administration costs are considered equal for both platforms. Technical-
support costs are slightly higher for Windows devices due to more-complex user interfaces. End-user operation costs
represent about 40 percent of all costs, primarily due to the time investment required to keep PDAs synchronized with
user desktops or servers.
Even at a few minutes per day (five minutes was factored into the estimate), this activity is a new diversion of user
time that costs enterprises more than they might think.
Action Item: Enterprises should use TCO models to establish realistic expectations for support costs.

6
S-38.3041 Slide 6Helsinki University of TechnologyNetworking Laboratory
Enterprise service usage profile
Person-to-Person
Person-to-System
Business
processes
Business
connectivity
Personal information mgt
Electronic mail
Messaging
Voice
Number of employees using the service
Employees need a multitude of services – but not everyone needs all services. Nokia takes
a holistic approach to enterprise.
Rather than horizontal:
- RIM – email
- MSFT – PIM
- SAP – business processes
We know we are not the only one looking at this holistically, but our strength in enabling
application mobility, enabling secure mobile connectivity, and enabling cost efficient
mobile voice are Nokia Competitive Advantages. Understanding the entire ecosystem here
is the key.
Email is hot item now, but will likely become a commodity like mobile voice is today, but
mobility and expertise therein is not a commodity.
Business processes
Office applications and company specific vertical applications
Business connectivity
Access to intranet from PC/laptop/ terminal
PIM
Calendar, phonebook, contacts
e-mail to PC or mobile
Messaging
Voice, SMS, MMS, instant messaging
Voice
Calls in office and on the move
7
S-38.3041 Slide 7Helsinki University of Technology
Networking Laboratory
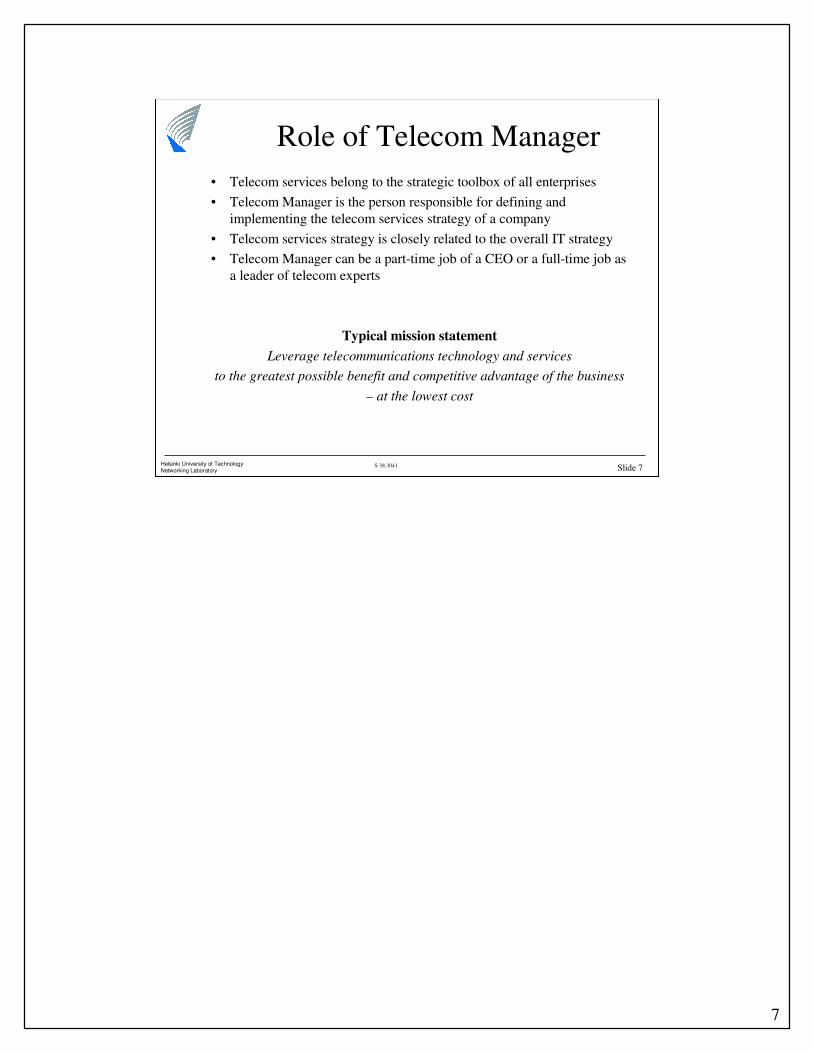
Role of Telecom Manager
• Telecom services belong to the strategic toolbox of all enterprises
• Telecom Manager is the person responsible for defining and
implementing the telecom services strategy of a company
• Telecom services strategy is closely related to the overall IT strategy
• Telecom Manager can be a part-time job of a CEO or a full-time job as
a leader of telecom experts
Typical mission statement
Leverage telecommunications technology and services
to the greatest possible benefit and competitive advantage of the business
– at the lowest cost

8
S-38.3041 Slide 8Helsinki University of Technology
Networking Laboratory
Tasks of Telecom Manager• Trouble resolution (measurable meters)
– Trouble ticket system
– Help desk system
– Training and end-user education
• Project management (measurable meters)
– Triggers for change: innovation, system life cycle, growth, financial reasons
– Identify needs, solicit proposals, select vendors, supervise implementation
• Billing audit and review (measurable meters)
– Inventory all company telecom services and equipment
– Exercise audit approval of all telecom bills
– Identify and target fraud abusers
• Strategic planning
– Help to see how telecom aids the company strategy
– Consolidate an centralize services, equipment, and billing wherever possible
– Remain forward-looking into possibly useful new technology

9
S-38.3041 Slide 9Helsinki University of Technology
Networking Laboratory
Telecom purchase process
1. Define your need (must have/nice to have)
2. Request for proposal/quotation (RFP, RFQ)
3. Select a provider (optimize the price-quality ratio)
• Prospecting (pick up max 5-10 candidates for brief interview)
• Qualification (pick up the top 3-4 for solution presentation)
• Presentation (pick up 2 for finals, visit reference customers)
• Closing (check terms and conditions, with your lawyer…)
4. Manage change successfully
• Do your part
• Keep the timeline
• Be serious about training
• Know when to cry wolf
• Tell your customers

10
S-38.3041 Slide 10Helsinki University of Technology
Networking Laboratory
Typical RFP content
• Existing environment
• Applications (service level agreements/SLA)
• Cost expectations
• Format guidelines of response
• Contact rules
• Time frames

11
S-38.3041 Slide 11Helsinki University of Technology
Networking Laboratory
Portfolio of services
Business telephone system
• Office voice switching (PBX vs Centrex, packet vs circuit)
• Office voice access (wireline vs wireless)
• Long-distance calls
• Value-added services (voice mail, call centers, …)
PC connectivity
• Internet access (fiber, ADSL)
• Intranet (leased lines … managed VPN)
• Value-added services (mailboxes, web hosting, …)
Mobile wireless services
• Cellular (GSM, WCDMA)
• Professional mobile radio (TETRA, iDEN)
• Two-way radio/walkie-talkies

12
S-38.3041 Slide 12Helsinki University of Technology
Networking Laboratory
Portfolio of service providers
Local fixed network operator
– Main asset: wireline network, subscriber base
– Trend: joining forces with other players
National cellular network operator
– Main asset: national cellular coverage, subscriber base
– Trend: expanding to full-service, and MVNO
Service operator
– Main asset: server bank, customer service
– Trend: packaging mobile and fixed services, VoIP
System integrator
– Main asset: tailored software, project mode
– Trend: exploiting the VoIP and MVNO opportunities

13
S-38.3041 Slide 13Helsinki University of Technology
Networking Laboratory
Operator’s Customer Segments
Number of employees
– Small => Price list process (cmp. consumer customers)
– Large => RFP process
Location
– Multisite => VPN issues (voice, Intranet)
– International => Multioperator issues
Ownership
– Private => Demand-driven flexible purchase process
– Government => Budget-driven regulated purchase process
Business and service duration
– Continuous => Customer retention focus
– Event (e.g. sports, conferences) => General marketing focus
Specific business domains

14
S-38.3041 Slide 14Helsinki University of Technology
Networking Laboratory
Impact of Value Nets
• ICT moves companies from value chains to value nets
• More dynamic partnerships
• Companies increasingly outsource, share, and off-shore
ICT solutions
• Extranets
– From dedicated networks to Internet
– Centralized directory and brokerage servers
• Voice-over-IP
– Trading of outsourced VoIP-PABX capacity
– Integration of business rules with VoIP

15
S-38.3041 Slide 15Helsinki University of Technology
Networking Laboratory
Managing market uncertainty
• Assess market uncertainty
• Choose your risk level
• Experiment with parallel projects
– Cut downside, “put eggs in different baskets”
– Add upside, “buy several lottery tickets”
• Keep learning
– Use incremental decision milestones for projects
– Recalculate business cases of projects
Source:M.Gaynor, 2003

16
S-38.3041 Slide 16Helsinki University of Technology
Networking Laboratory
Market uncertaintyHow to measure it?
• Ability to forecast the market
• Emergence of a dominant design
• Agreement among industry experts
• Feature convergence and commodity nature
• Changes in standards activity
17
S-38.3041 Slide 17Helsinki University of Technology
Networking Laboratory
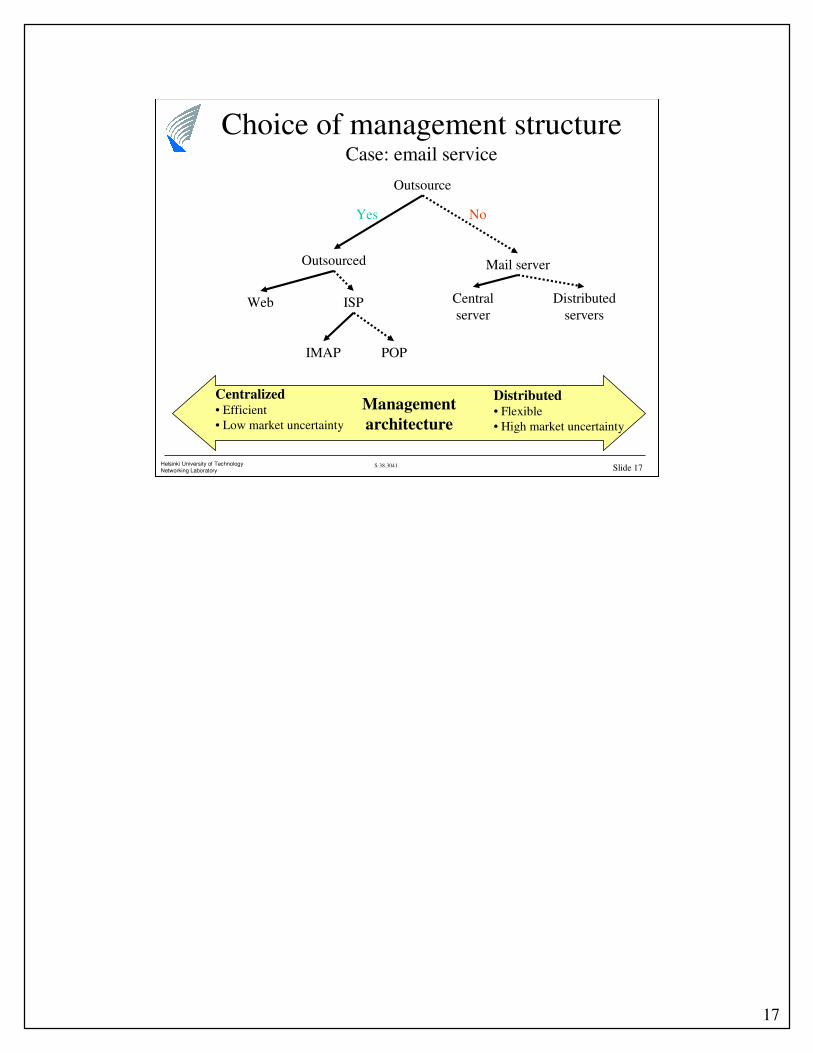
Choice of management structureCase: email service
Central
serverISPWeb
Outsourced
No
Mail server
Distributed
servers
POPIMAP
Management
architecture
Centralized• Efficient
• Low market uncertainty
Distributed• Flexible
• High market uncertainty
Outsource
Yes

18
S-38.3041 Slide 18Helsinki University of Technology
Networking Laboratory
Choice of management structure Case: office voice service
Central
PBX
Centrex
No
PBX
Distributed
PBXs
Management
architecture
Centralized• Efficient
• Low market uncertainty
Distributed• Flexible
• High market uncertainty
Outsource
Yes
VoIP
GSM

19
S-38.3041 Slide 19Helsinki University of Technology
Networking Laboratory
Choice of management structureCase: informational service (web)
Central
serverUser
manages content
Service provider
manages content
Outsourced
web-server
No
Self-managed
web-server
Distributed
servers
Management
architecture
Centralized• Efficient
• Low market uncertainty
Distributed• Flexible
• High market uncertainty
Outsource
Yes

20
S-38.3041 Slide 20Helsinki University of Technology
Networking Laboratory
Value of experimentationReal options theory
Value of experimentation
1. increases as the market uncertainty increases
2. increases (in a decreasing manner) as the number
of parallel experiments increases
3. decreases (in a decreasing manner) as the learning
develops over generations of experiments

21
S-38.3041 Slide 21Helsinki University of Technology
Networking Laboratory
Value of experimentationExamples
• Internet
• GPRS content
• NTT DoCoMo i-mode content
• Microsoft Windows applications
• Symbian OS applications
Ecosystems that exploit the value of
experimentation are more likely to match the market needs
22
S-38.3041 Slide 22Helsinki University of Technology
Networking Laboratory
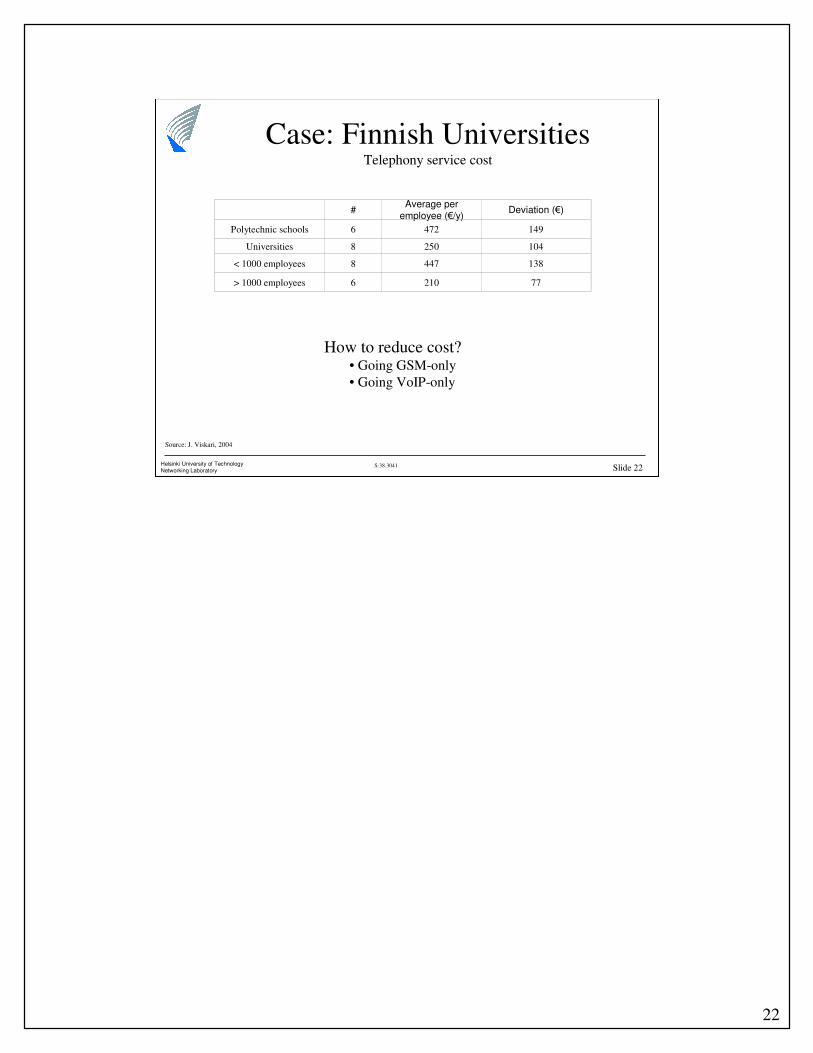
Case: Finnish UniversitiesTelephony service cost
#Average per
employee (€/y)Deviation (€)
Polytechnic schools 6 472 149
Universities 8 250 104
< 1000 employees 8 447 138
> 1000 employees 6 210 77
Source: J. Viskari, 2004
How to reduce cost?• Going GSM-only
• Going VoIP-only

23
S-38.3041 Slide 23Helsinki University of Technology
Networking Laboratory
9,5 %
10,1 %
6,5 %
73,9 %
Local calls
Long-distance calls
International calls
Calls to mobiles
Source: J Viskari, 2004
40,0 %
27,7 %
8,1 %
0,9 %
23,3 %
internal calls
local calls
long distance calls
international calls
calls to mobiles
Case: Finnish UniversitiesTelephone service cost
Highest volume
Highest cost

24
S-38.3041 Slide 24Helsinki University of Technology
Networking Laboratory
Source: J Viskari, 2004
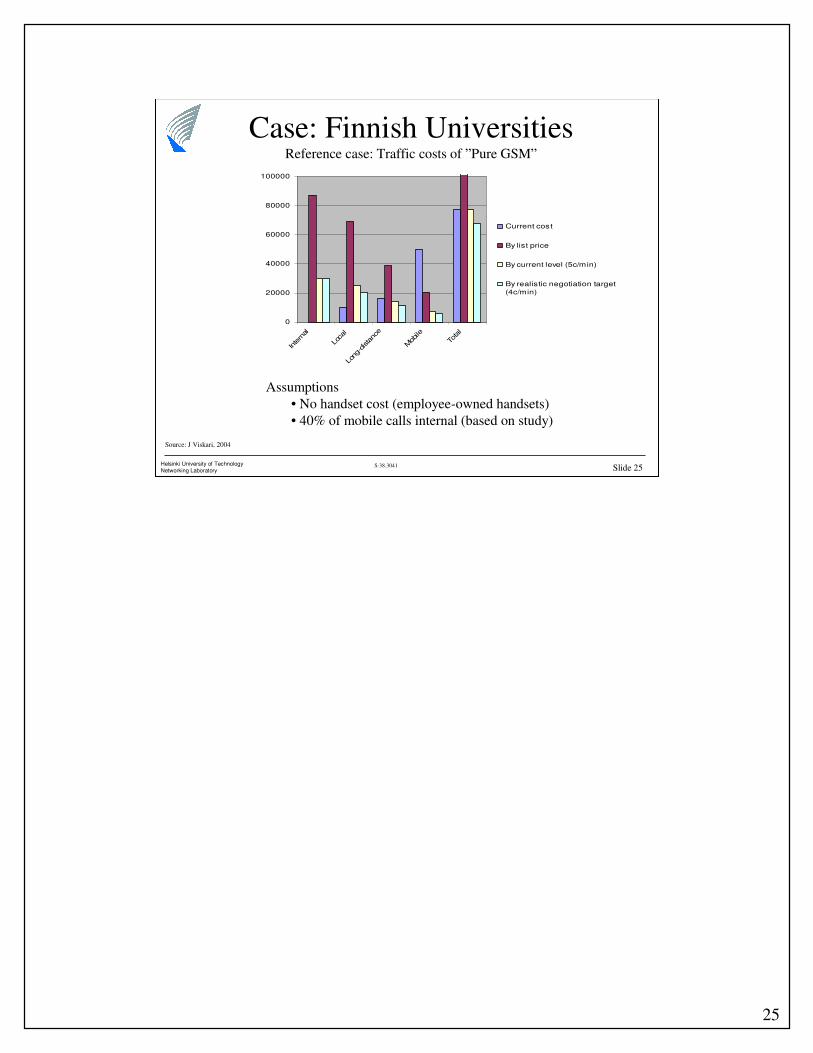
Case: Finnish UniversitiesReference case: Traffic costs of ”pure VoIP”
0
10000
20000
30000
40000
50000
60000
70000
80000
90000
sisä lähi kauko matka yhteensä
Nykyinen
Uusi
Assumptions
• 17% of calls to other universities (no long-distance charge)
• 40% of mobile calls internal (based on study)
25
S-38.3041 Slide 25Helsinki University of Technology
Networking Laboratory
Source: J Viskari, 2004
Case: Finnish UniversitiesReference case: Traffic costs of ”Pure GSM”
0
20000
40000
60000
80000
100000
Intern
al
Loca
l
Long
-distanc
e
Mob
ile
Total
Current cost
By list price
By current level (5c/min)
By realistic negotiation target
(4c/min)
Assumptions
• No handset cost (employee-owned handsets)
• 40% of mobile calls internal (based on study)

26
S-38.3041 Slide 26Helsinki University of Technology
Networking Laboratory
Case: Large eventWorld Championships in Athletics (WCA), Helsinki 2005
• Lots of temporary capacity needed
– temporary cabling (voice, data, video)
– additional radio capacity (GSM, WCDMA, TETRA, WLAN)
– several temporary Intranets
– temporary servers and terminals
• Operators have established dedicated event units
• Traffic costs small compared to fixed costs
• CAPEX is small compared to OPEX
• Wireless has better cost-benefit ratio than wireline for
temporary use, but the high risk of failures favors wireline


![Siebel Mobile Guide: Connected - Oracle Cloud · [1]Siebel CRM Siebel Mobile Guide: Connected Siebel Innovation Pack 2017, Rev. A E52426-01 November 2017](https://img.pdfslide.us/doc/110x75/5f0537077e708231d411d9c7/siebel-mobile-guide-connected-oracle-cloud-1siebel-crm-siebel-mobile-guide.jpg)
![Configuring Siebel Open UI - Oracle · 1[]Siebel CRM Configuring Siebel Open UI Siebel Innovation Pack 2015 E52417-01 May 2015](https://img.pdfslide.us/doc/110x75/5f0d0b457e708231d438667d/configuring-siebel-open-ui-oracle-1siebel-crm-configuring-siebel-open-ui-siebel.jpg)