Embed Size (px)
Citation preview
2014 Operations Statistics Report Triangle Expressway First Quarter 1 S. Wilmington Street Raleigh, NC 27601
April 22, 2014
Operations Statistics Report Triangle Expressway 2014 Fourth Quarter and Annual Report
1 S. Wilmington Street Raleigh, NC 27601
Last Updated: March 2, 2015

Table of Contents Table of Contents
Operations Statistics Report for the Triangle Expressway
2014 Fourth Quarter and Annual Report
3
Table of Contents
INTRODUCTION ..................................................................................................................... 5
Purpose ..................................................................................................................................................... 5
Project ....................................................................................................................................................... 5
TRAFFIC STATISTICS ............................................................................................................... 8
Average Weekday Traffic (AWT) ............................................................................................................... 8
Annual Average Weekday Traffic (AAWT) ................................................................................................ 8
Interchange Statistics .............................................................................................................................. 10
TOLL SYSTEM STATISTICS ..................................................................................................... 23
Weekly, Monthly and Annual Statistics .................................................................................................. 23
Transactions ........................................................................................................................................ 24
Classification ....................................................................................................................................... 26
Accounts .............................................................................................................................................. 28
Transponders ...................................................................................................................................... 30
TOLL ZONE STATISTICS ......................................................................................................... 33
ROADWAY OPERATIONS STATISTICS .................................................................................... 45
ROADWAY MAINTENANCE STATISTICS................................................................................. 50
Assessment Schedule .............................................................................................................................. 50
Assessment Results ................................................................................................................................. 51
Operations Statistics Report for the Triangle Expressway
2014 Fourth Quarter and Annual Report
4
List of Figures and Tables
Figure 1: Triangle Expressway System Map .................................................................................................. 6 Figure 2: Triangle Expressway AAWT Map ................................................................................................... 9 Figure 3: NC‐147 at I‐40 Interchange AAWT ............................................................................................... 11 Figure 4: NC‐147 at Hopson Road Interchange AAWT ............................................................................... 12 Figure 5: NC‐147 at Davis Drive Interchange AAWT ................................................................................... 13 Figure 6: NC‐540 at NC‐54 Interchange AAWT ........................................................................................... 14 Figure 7: NC‐540 at NC‐147 Interchange AAWT ......................................................................................... 15 Figure 8: NC‐540 at NC‐55 Interchange AAWT ........................................................................................... 16 Figure 9: NC‐540 at Green Level West Rd. Interchange AAWT .................................................................. 17 Figure 10: NC‐540 at US‐64 Interchange AAWT ......................................................................................... 18 Figure 11: NC‐540 at South Salem Street Interchange AAWT .................................................................... 19 Figure 12: NC‐540 at US‐1 Interchange AAWT ........................................................................................... 20 Figure 13: NC‐540 at NC‐55 Bypass Interchange AAWT ............................................................................. 21 Figure 14: 2014 Transactions ...................................................................................................................... 25 Figure 15: 2014 Classification, Class 1 Percentage ..................................................................................... 27 Figure 16: 2014 Established Accounts ........................................................................................................ 28 Figure 17: 2014 Transponders Sold ............................................................................................................ 30 Figure 18: Triangle Expressway Toll Zone Map ........................................................................................... 34 Figure 19: Hopson Road Ramp Toll Zones .................................................................................................. 35 Figure 20: NC‐147 South Ramp Toll Zones .................................................................................................. 36 Figure 21: NC‐540 Morrisville Mainline Toll Zones ..................................................................................... 37 Figure 22: NC‐147 North Ramp Toll Zones .................................................................................................. 38 Figure 23: NC‐540 Cary Mainline Toll Zones ............................................................................................... 39 Figure 24: US‐64 Ramp Toll Zones .............................................................................................................. 40 Figure 25: NC‐540 Apex Mainline Toll Zones .............................................................................................. 41 Figure 26: South Salem Street Ramp Toll Zones ......................................................................................... 42 Figure 27: NC‐540 Holly Springs Mainline Toll Zones ................................................................................. 43 Figure 28: 2014 IMAP Assistance ................................................................................................................ 47 Figure 29: Average IMAP Assistance Response and Clear Times (in Minutes) ........................................... 48
Table 1: Transactions, Fourth Quarter by Week ......................................................................................... 24 Table 2: Transactions, Fourth Quarter by Month ....................................................................................... 24 Table 3: Transactions, by Year .................................................................................................................... 25 Table 4: Classification, Fourth Quarter by Week ........................................................................................ 26 Table 5: Classification, Fourth Quarter by Month ...................................................................................... 26 Table 6: Classification, by Year .................................................................................................................... 27 Table 7: Established Accounts, Fourth Quarter by Month ......................................................................... 28 Table 8: Established Accounts, by Year ....................................................................................................... 29 Table 9: Transponders Sold, Fourth Quarter by Month ............................................................................. 30 Table 10: Transponders Sold, by Year ......................................................................................................... 31 Table 11: SHP Statistics ............................................................................................................................... 46 Table 12: IMAP Assistance .......................................................................................................................... 47 Table 13: Average IMAP Assistance Response and Clear Times (in Minutes) ............................................ 48 Table 14: MRP Assessment Results............................................................................................................. 51
Operations Statistics Report for the Triangle Expressway
2014 Fourth Quarter and Annual Report
5
INTRODUCTION
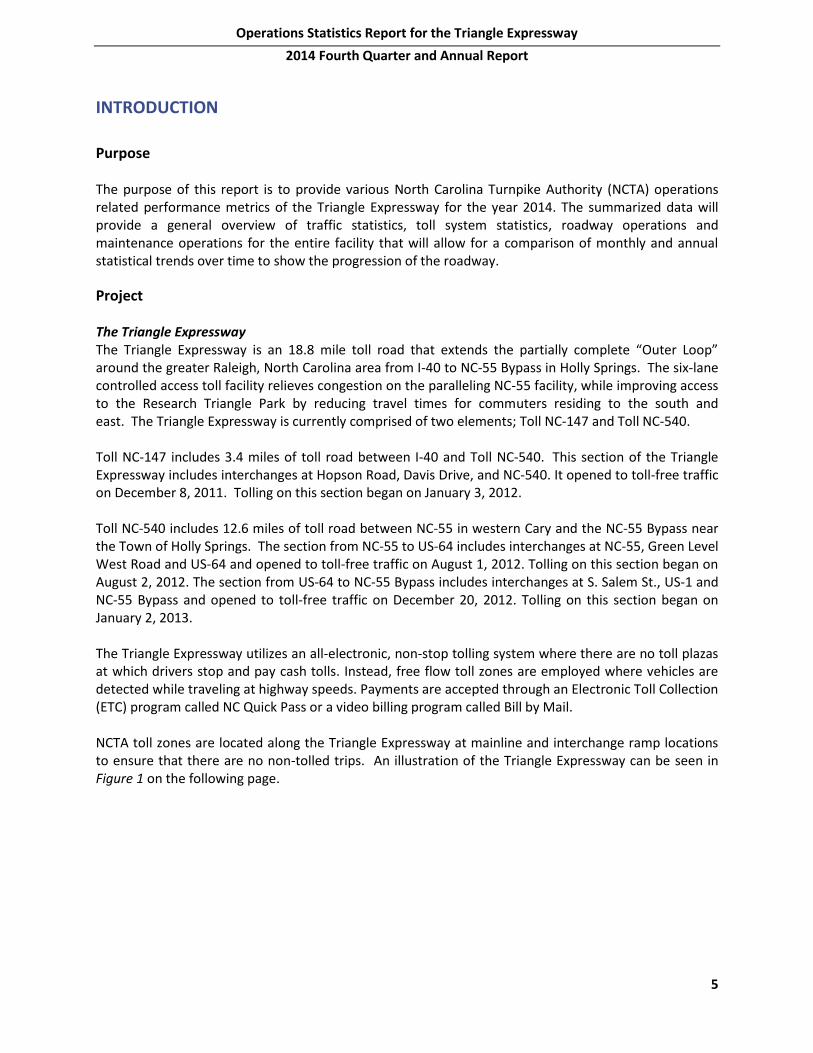
Purpose The purpose of this report is to provide various North Carolina Turnpike Authority (NCTA) operations related performance metrics of the Triangle Expressway for the year 2014. The summarized data will provide a general overview of traffic statistics, toll system statistics, roadway operations and maintenance operations for the entire facility that will allow for a comparison of monthly and annual statistical trends over time to show the progression of the roadway.
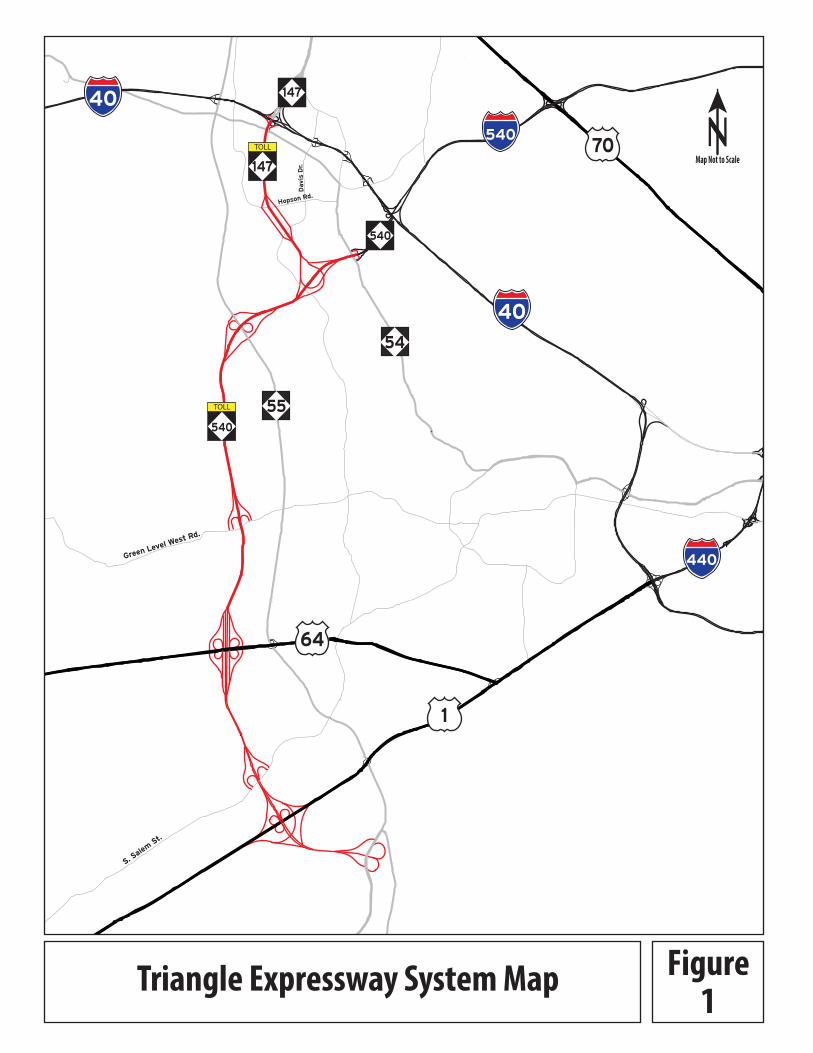
Project The Triangle Expressway The Triangle Expressway is an 18.8 mile toll road that extends the partially complete “Outer Loop” around the greater Raleigh, North Carolina area from I-40 to NC-55 Bypass in Holly Springs. The six-lane controlled access toll facility relieves congestion on the paralleling NC-55 facility, while improving access to the Research Triangle Park by reducing travel times for commuters residing to the south and east. The Triangle Expressway is currently comprised of two elements; Toll NC-147 and Toll NC-540. Toll NC-147 includes 3.4 miles of toll road between I-40 and Toll NC-540. This section of the Triangle Expressway includes interchanges at Hopson Road, Davis Drive, and NC-540. It opened to toll-free traffic on December 8, 2011. Tolling on this section began on January 3, 2012. Toll NC-540 includes 12.6 miles of toll road between NC-55 in western Cary and the NC-55 Bypass near the Town of Holly Springs. The section from NC-55 to US-64 includes interchanges at NC-55, Green Level West Road and US-64 and opened to toll-free traffic on August 1, 2012. Tolling on this section began on August 2, 2012. The section from US-64 to NC-55 Bypass includes interchanges at S. Salem St., US-1 and NC-55 Bypass and opened to toll-free traffic on December 20, 2012. Tolling on this section began on January 2, 2013. The Triangle Expressway utilizes an all-electronic, non-stop tolling system where there are no toll plazas at which drivers stop and pay cash tolls. Instead, free flow toll zones are employed where vehicles are detected while traveling at highway speeds. Payments are accepted through an Electronic Toll Collection (ETC) program called NC Quick Pass or a video billing program called Bill by Mail. NCTA toll zones are located along the Triangle Expressway at mainline and interchange ramp locations to ensure that there are no non-tolled trips. An illustration of the Triangle Expressway can be seen in Figure 1 on the following page.
70
55
40
64
1
540
54
40
540
147
440
147
TOLL
540
TOLL
Triangle Expressway System Map Figure1
NMap Not to Scale
S. Salem St.
Green Level West Rd.
Hopson Rd.
Dav
is D
r.
7
Traffic Statistics Traffic Statistics
Operations Statistics Report for the Triangle Expressway
2014 Fourth Quarter and Annual Report
8
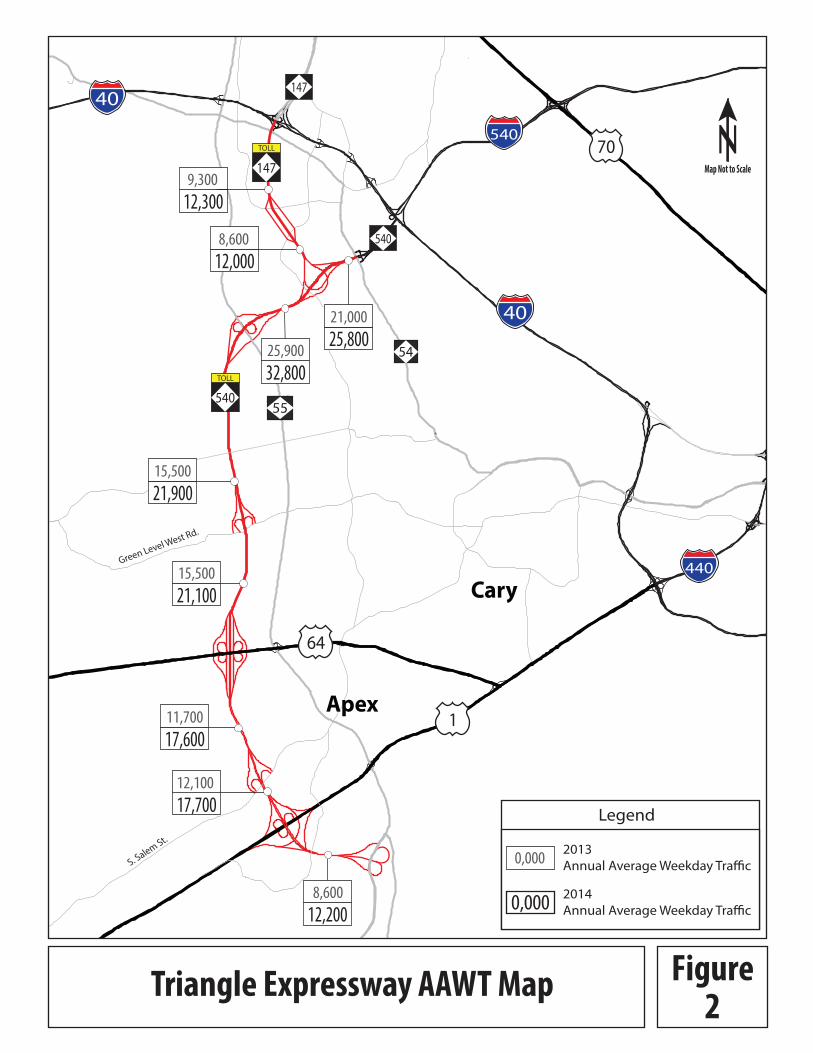
TRAFFIC STATISTICS Current and historical traffic data is collected and stored through the use of roadside microwave vehicle detectors (MVD’s) installed throughout the Triangle Expressway. The data gives an overview of the current utilization of the roadway. The data can also be analyzed to identify trends that could be used to determine a more accurate estimate of the future utilization of these facilities. It should be noted that during the year 2014 the Triangle Expressway continued to experience a traffic pattern known as “ramp-up.” During a ramp-up period, the traffic volumes on a new facility increase at a faster rate than typical growth found at an existing facility. The growth rates increase as the customers become more familiar with the facility. The ramp-up period is expected to continue through 2017.
Average Weekday Traffic (AWT) Traffic volume data is collected on all mainline segments between interchanges and on all ramp locations. Typically there is a large difference between peak and off-peak volumes, as well as between weekday and weekend volumes. However, this gap becomes significantly larger for a tolled facility. This is due to the fact that toll roads tend to have a much higher percentage of traffic occurring during peak hours when compared to a normal roadway, as there is less of a benefit for toll users during off peak hours. For these reasons, AWT is reported instead of average daily traffic (ADT). AWT is a measure of the average daily traffic collected on a typical Monday through Friday over a designated time period.
Annual Average Weekday Traffic (AAWT) AAWT is a measure of the average daily volumes collected on a typical Monday through Friday over an entire year. Adjustment factors for raw AWT data were calculated monthly, based on the ratio of weekday to weekend traffic, and applied to the monthly averages to calculate the annual average weekday traffic. It is necessary to normalize the variations in monthly traffic to allow for a valid comparison between counts taken at different times of the year. This allows the normalized monthly values to be combined together to form a single AAWT for each location. Figure 2 contains a visual representation of AAWT recorded during the years 2013 and 2014 at all mainline segments along the Triangle Expressway.
70
55
40
64
1
540
Cary
54
Apex
40
440
147
TOLL
540TOLL
NMap Not to Scale
Green Level West Rd.
S. Salem St.
540
147
Legend
0,000 2014 Annual Average Weekday Tra�c
27,10021,400
12,300 9,300
0,000 2013 Annual Average Weekday Tra�c
12,0008,600
25,80021,000
32,80025,900
21,90015,500
21,10015,500
17,60011,700
17,70012,100
12,2008,600
Triangle Expressway AAWT Map Figure2
Operations Statistics Report for the Triangle Expressway
2014 Fourth Quarter and Annual Report
10
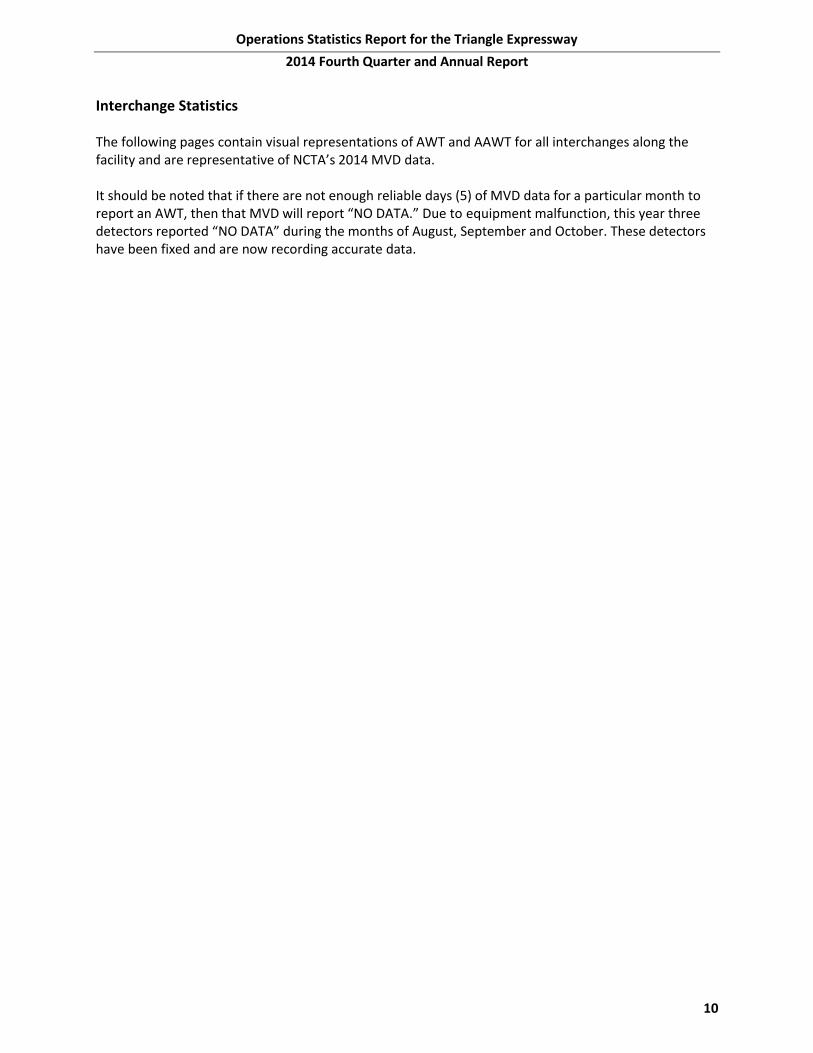
Interchange Statistics
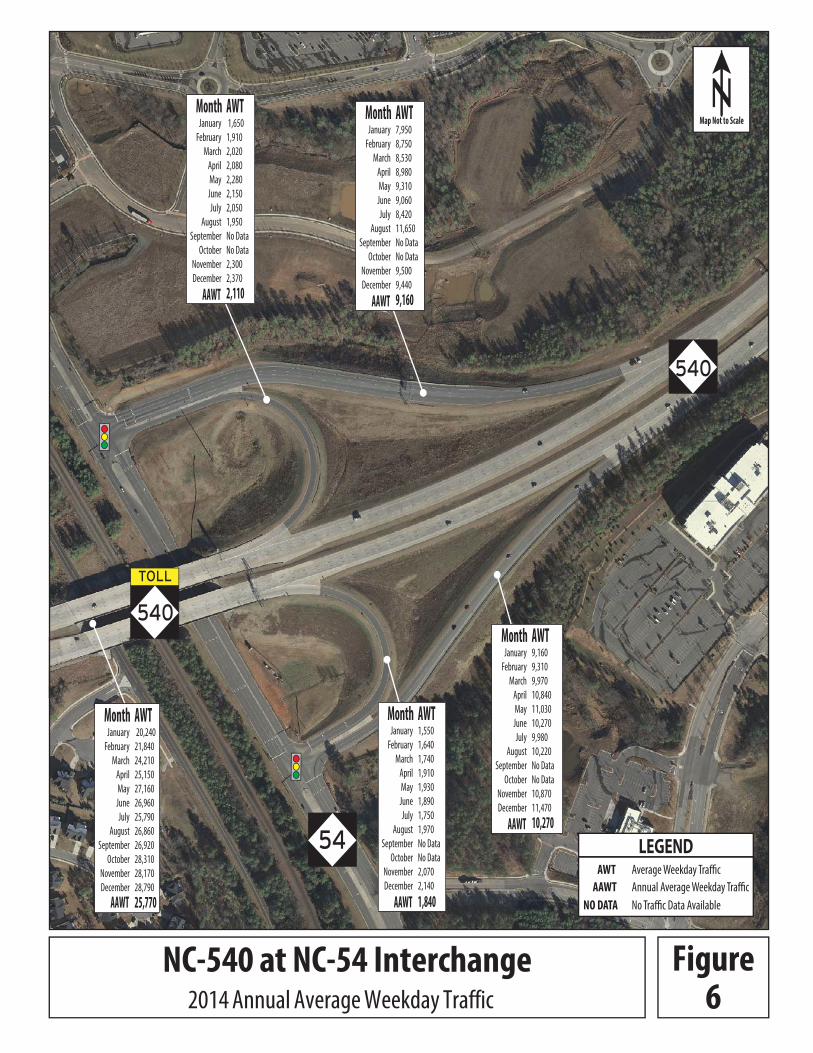
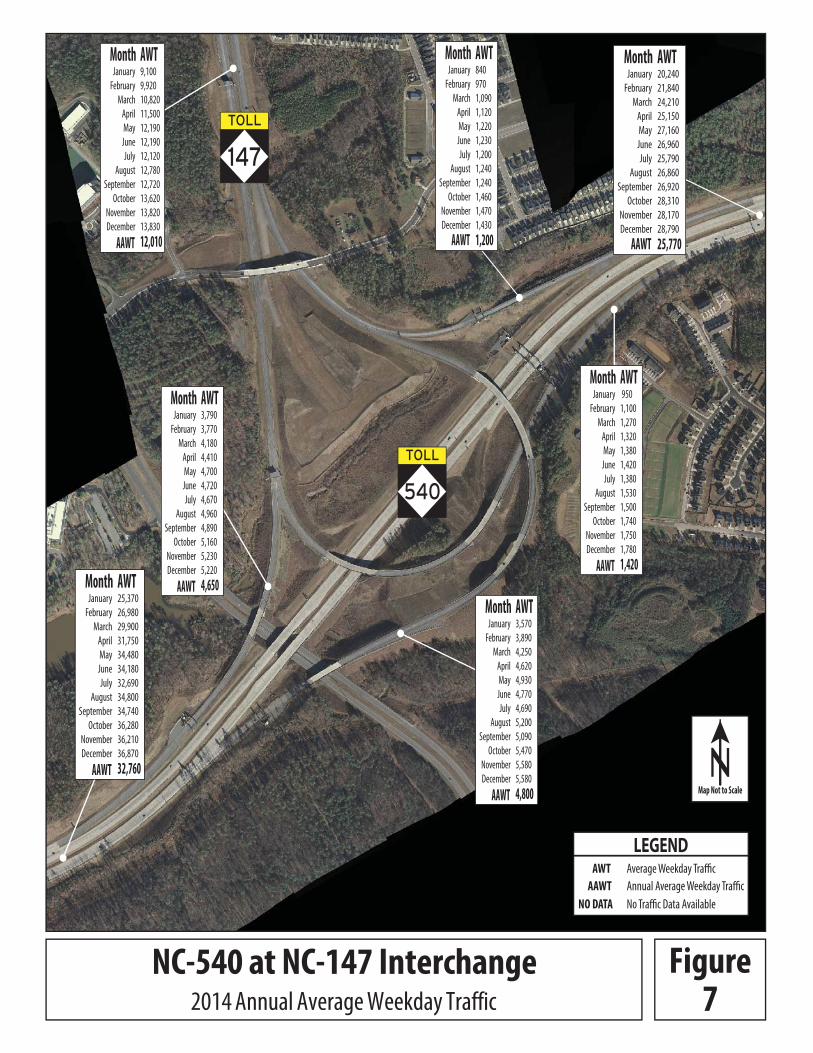
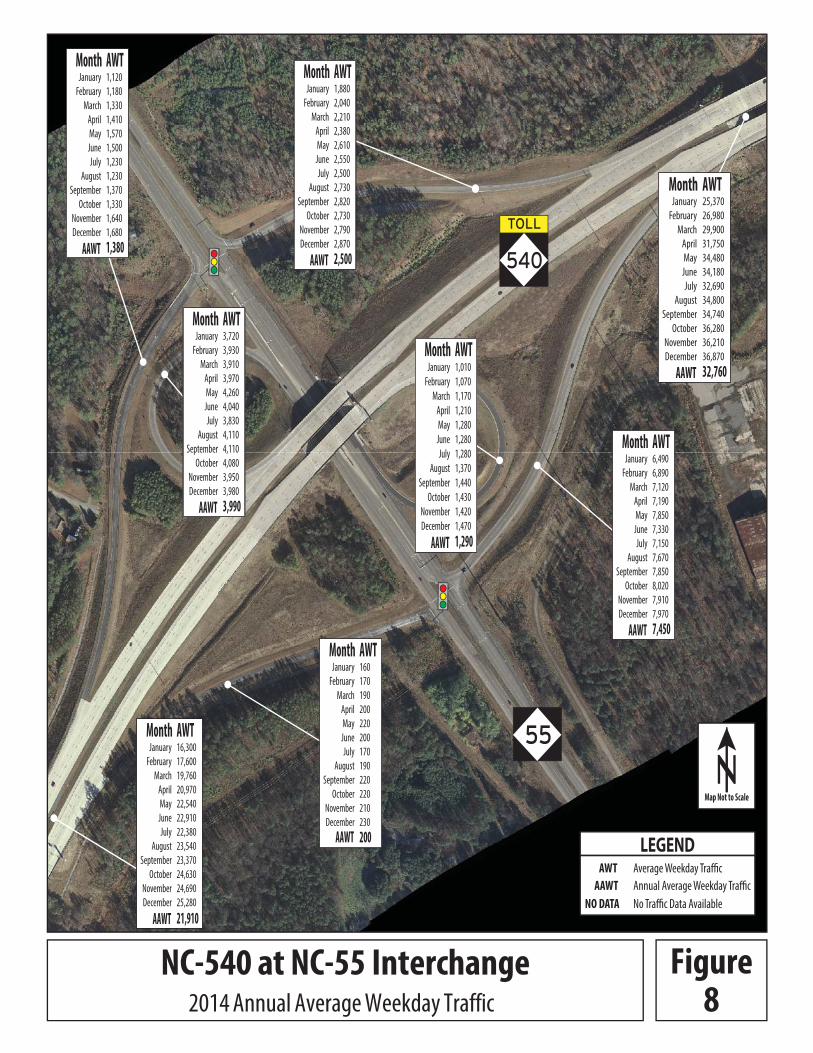
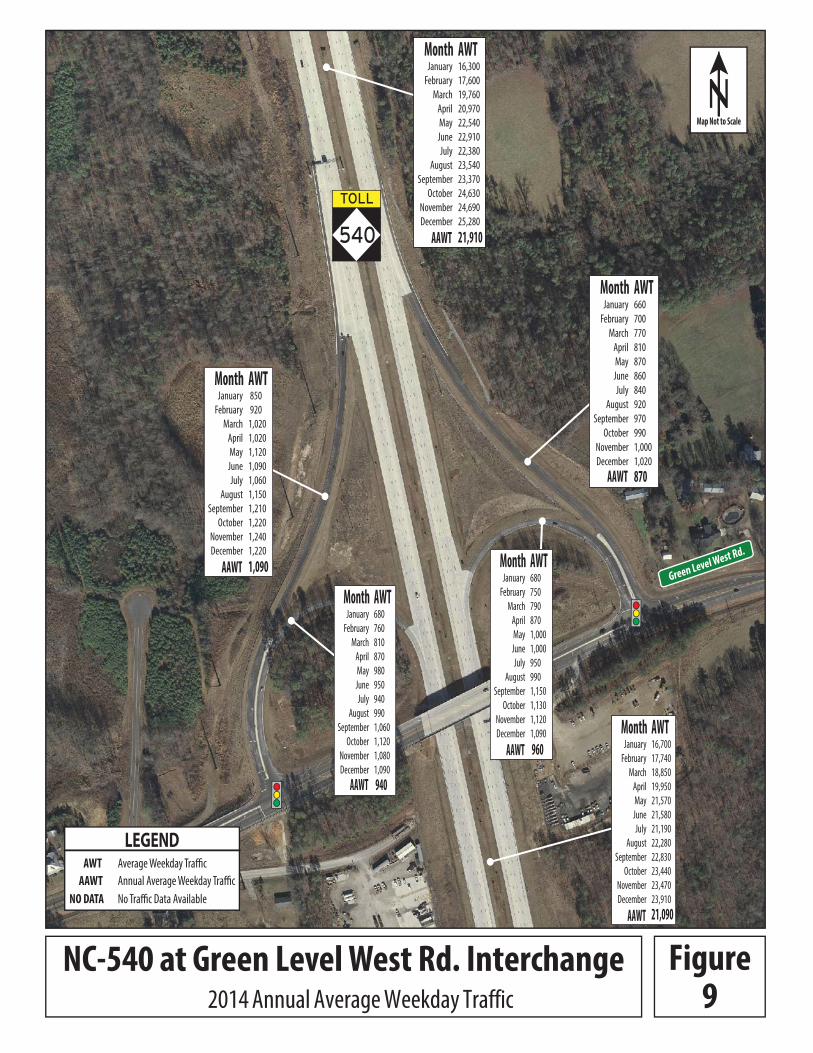
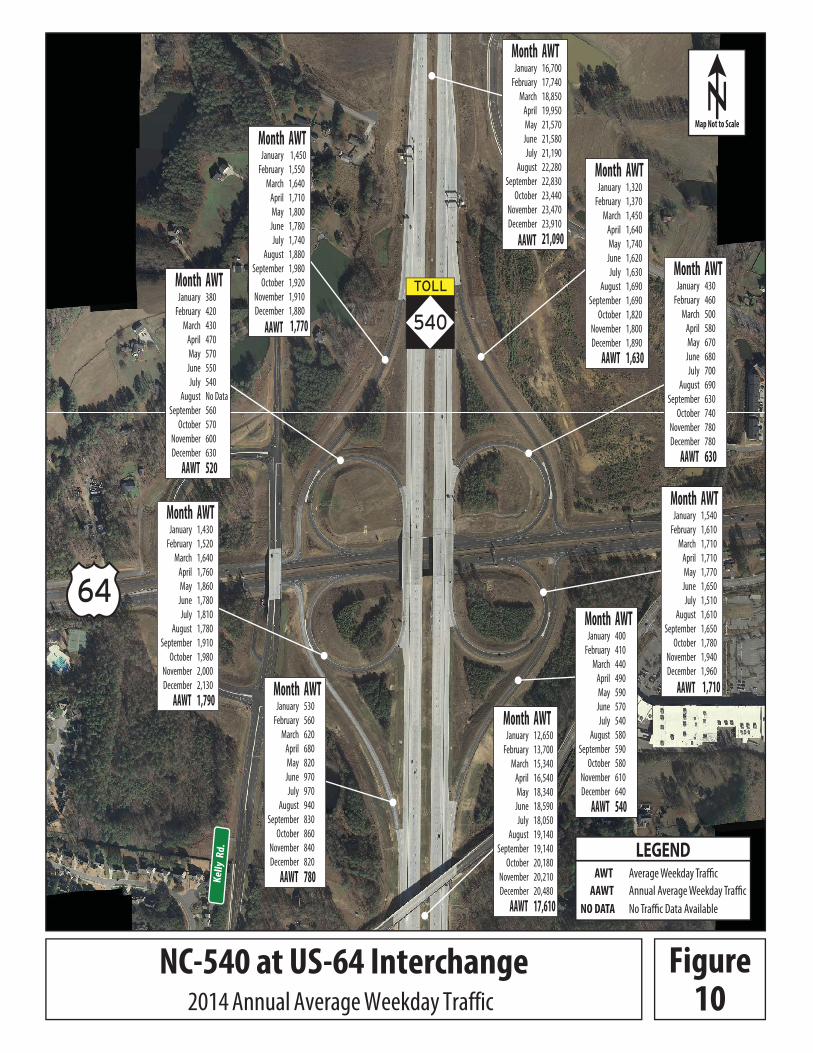
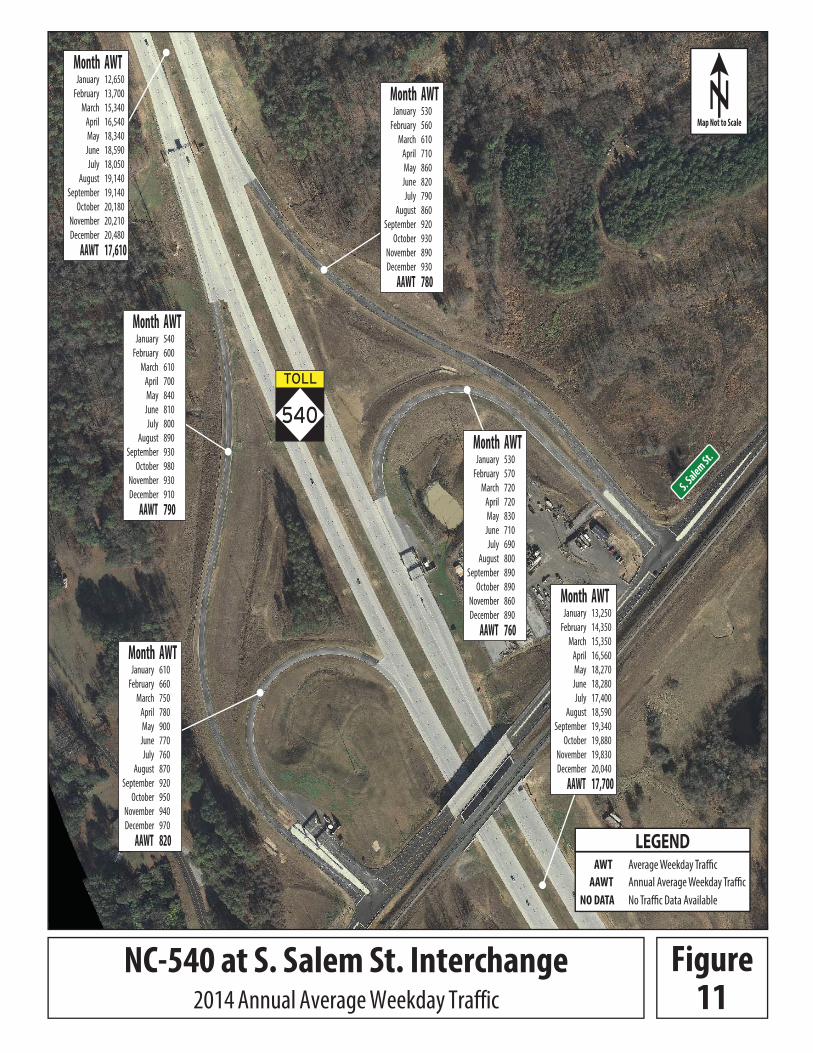
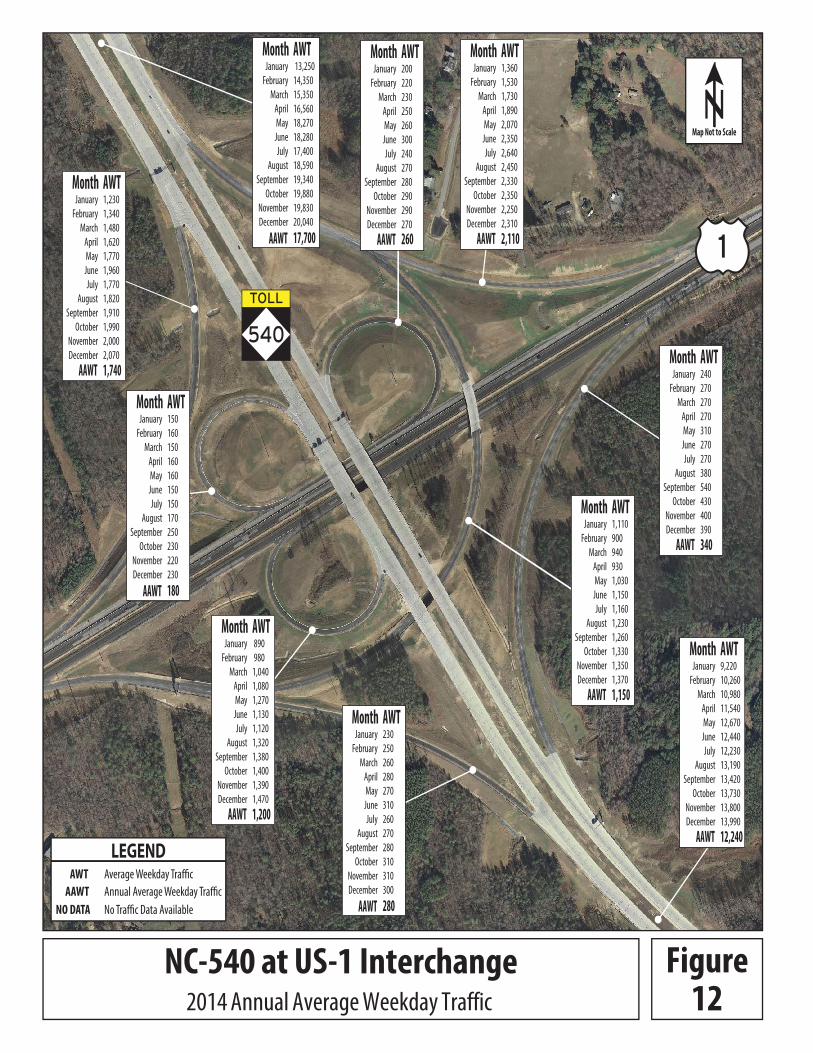
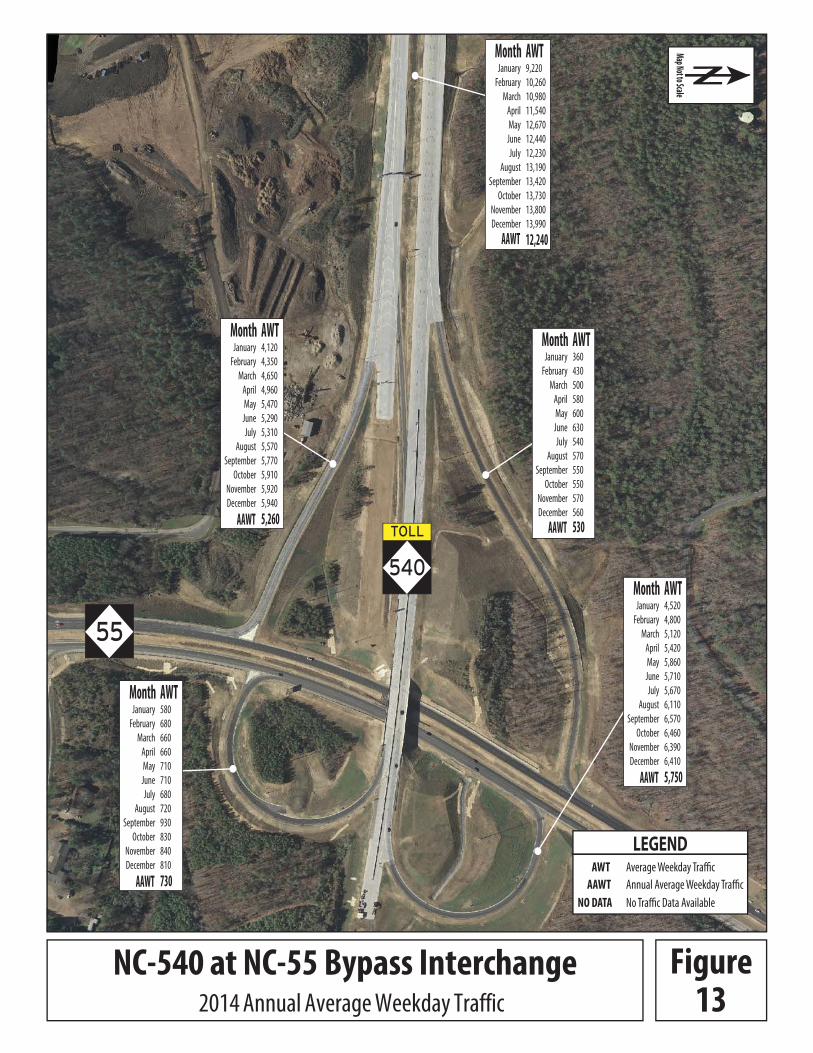
The following pages contain visual representations of AWT and AAWT for all interchanges along the facility and are representative of NCTA’s 2014 MVD data.
It should be noted that if there are not enough reliable days (5) of MVD data for a particular month to report an AWT, then that MVD will report “NO DATA.” Due to equipment malfunction, this year three detectors reported “NO DATA” during the months of August, September and October. These detectors have been fixed and are now recording accurate data.
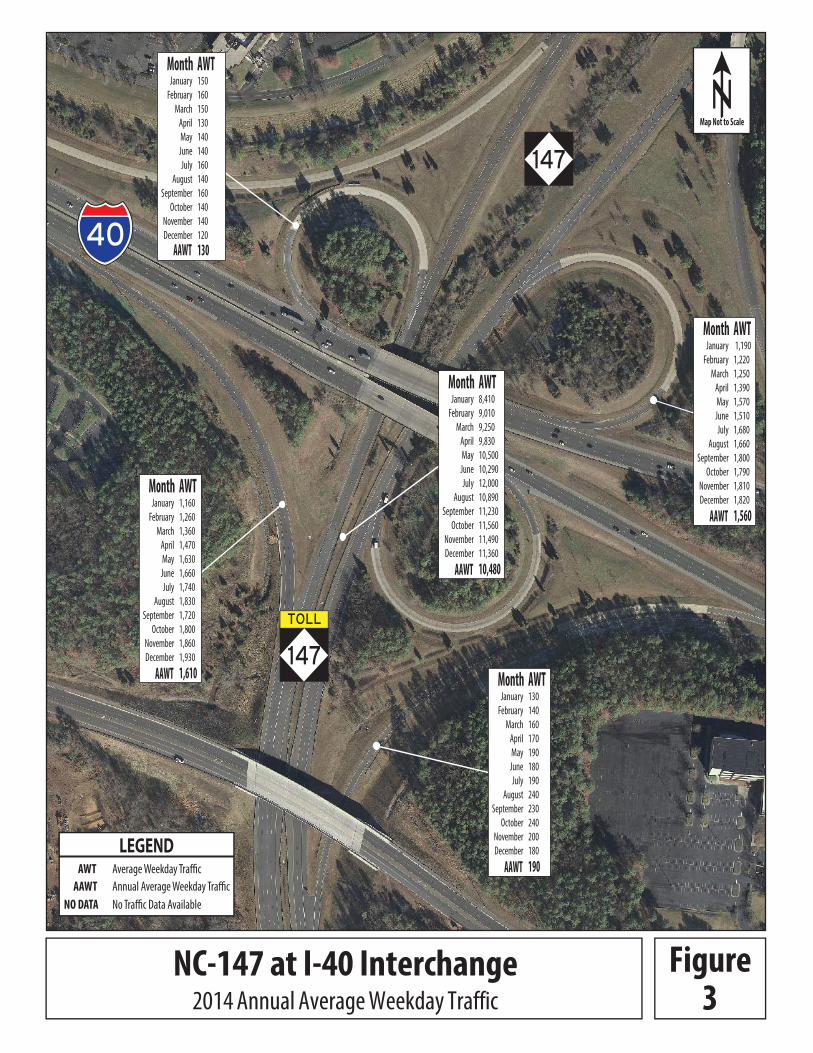
NC-147 at I-40 Interchange Figure32014 Annual Average Weekday Traffic
40
147
TOLL
147
NMap Not to Scale
LEGENDAverage Weekday TrafficAWT
AAWT
NO DATA
Annual Average Weekday Traffic
No Traffic Data Available
Month
AAWT 1,560
AWTJanuary
February
March
April
May
June
July
August
September
October
November
December
1,190
1,220
1,250
1,390
1,570
1,510
1,680
1,660
1,800
1,790
1,810
1,820
Month
AAWT 190
AWTJanuary
February
March
April
May
June
July
August
September
October
November
December
130
140
160
170
190
180
190
240
230
240
200
180
Month
AAWT 1,610
AWTJanuary
February
March
April
May
June
July
August
September
October
November
December
1,160
1,260
1,360
1,470
1,630
1,660
1,740
1,830
1,720
1,800
1,860
1,930
Month
AAWT 130
AWTJanuary
February
March
April
May
June
July
August
September
October
November
December
150
160
150
130
140
140
160
140
160
140
140
120
-
Month
AAWT 10,480
AWTJanuary
February
March
April
May
June
July
August
September
October
November
December
8,410
9,010
9,250
9,830
10,500
10,290
12,000
10,890
11,230
11,560
11,490
11,360
NMap Not to Scale
Hopson Rd.
LEGENDAverage Weekday TrafficAWT
AAWT
NO DATA
Annual Average Weekday Traffic
No Traffic Data Available
147
TOLL
Month
AAWT 12,280
AWTJanuary
February
March
April
May
June
July
August
September
October
November
December
9,700
10,410
10,770
11,470
12,320
12,130
13,930
12,960
13,180
13,600
13,550
13,470
Month
AAWT 1,860
AWTJanuary
February
March
April
May
June
July
August
September
October
November
December
1,440
1,570
1,710
1,800
1,900
1,890
1,920
2,000
1,970
2,110
2,080
2,050
Month
AAWT 1,750
AWTJanuary
February
March
April
May
June
July
August
September
October
November
December
1,380
1,490
1,620
1,700
1,790
1,770
1,790
1,840
1,820
1,940
1,930
1,920
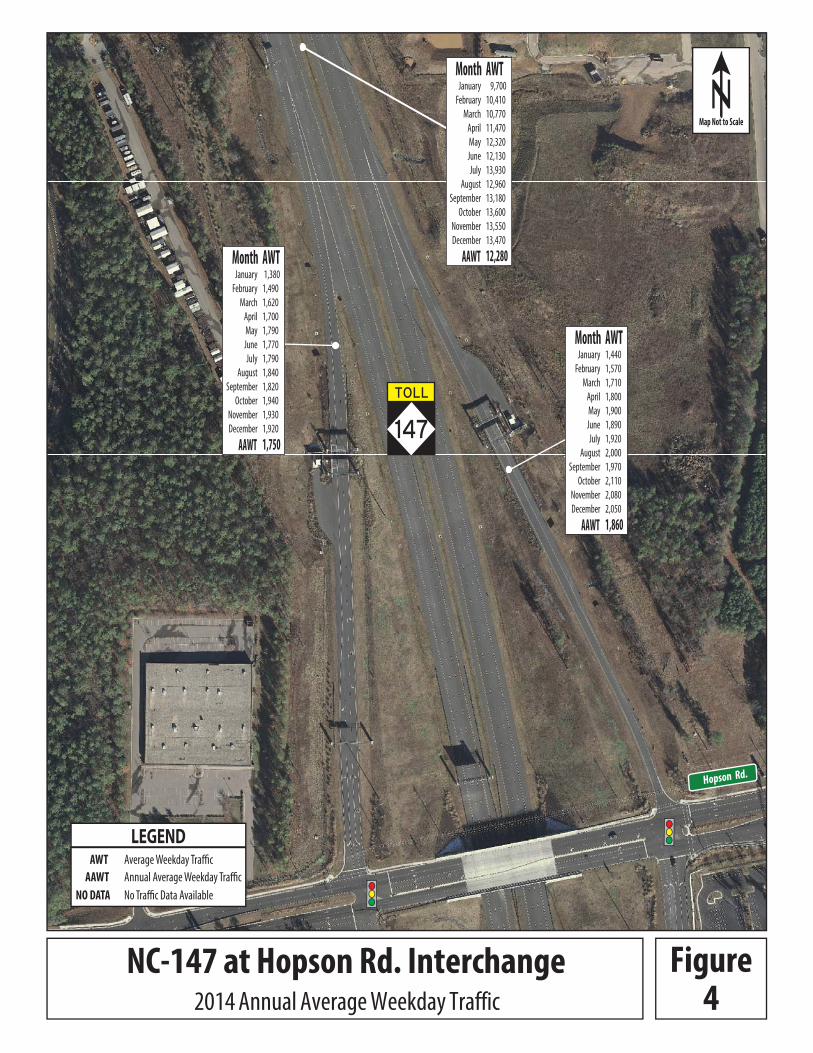
NC-147 at Hopson Rd. Interchange Figure42014 Annual Average Weekday Traffic
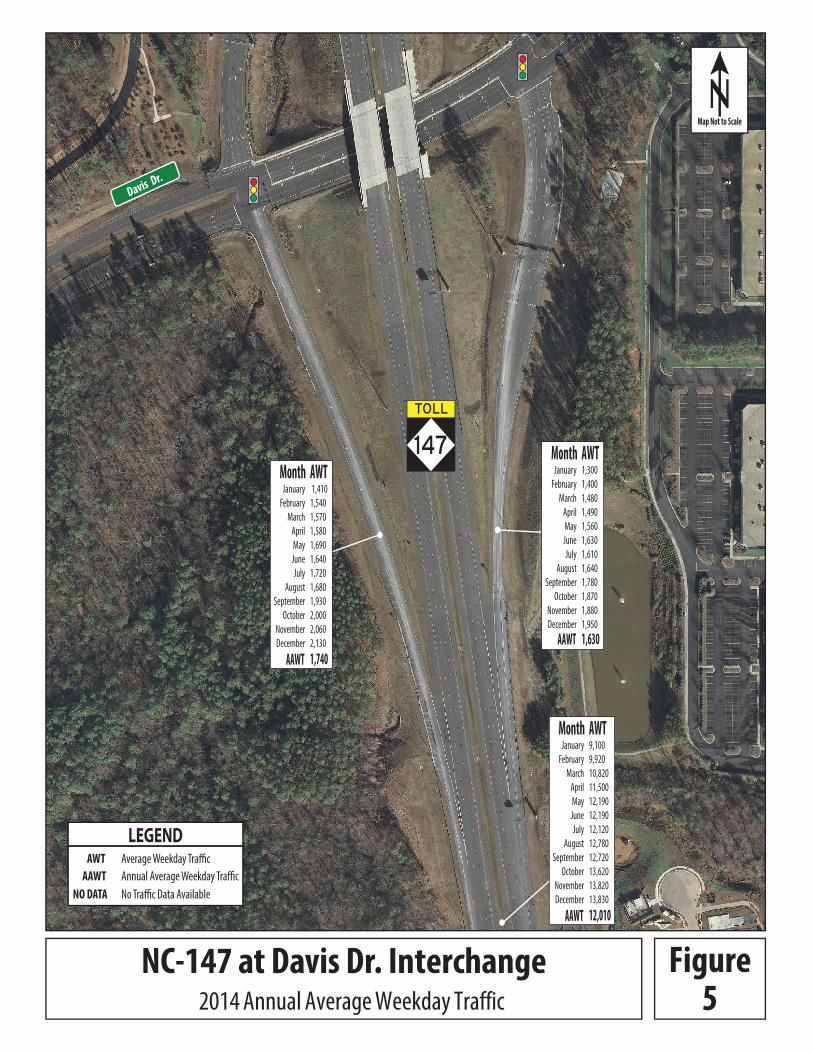
NC-147 at Davis Dr. Interchange Figure52014 Annual Average Weekday Traffic
Month
AAWT 1,740
AWTJanuary
February
March
April
May
June
July
August
September
October
November
December
1,410
1,540
1,570
1,580
1,690
1,640
1,720
1,680
1,930
2,000
2,060
2,130
Month
AAWT
AWTJanuary
February
March
April
May
June
July
August
September
October
November
December
1,300
1,400
1,480
1,490
1,560
1,630
1,610
1,640
1,780
1,870
1,880
1,950
1,630
Month
AAWT 12,010
AWTJanuary
February
March
April
May
June
July
August
September
October
November
December
9,100
9,920
10,820
11,500
12,190
12,190
12,120
12,780
12,720
13,620
13,820
13,830
Davis Dr.
147
TOLL
NMap Not to Scale
LEGENDAverage Weekday TrafficAWT
AAWT
NO DATA
Annual Average Weekday Traffic
No Traffic Data Available
540
TOLL
540
54
AWT18,140
19,330
20,110
20,450
21,220
21,420
MonthJanuary
February
March
April
May
June
AWT7,480
9,170
9,740
10,740
11,070
10,390
MonthJanuary
February
March
April
May
June
AWT1,470
1,510
1,570
1,560
1,700
1,700
MonthJanuary
February
March
April
May
June
AWT4,260
8,720
8,920
8,880
9,150
9,160
MonthJanuary
February
March
April
May
June
AWT1,180
1,330
1,430
1,530
1,550
1,580
MonthJanuary
February
March
April
May
June
NC-540 at NC-54 Interchange Figure6
NMap Not to Scale
LEGENDAverage Weekday TrafficAWT
AAWT
NO DATA
Annual Average Weekday Traffic
No Traffic Data Available
2014 Annual Average Weekday Traffic
Month
AAWT 2,110
AWTJanuary
February
March
April
May
June
July
August
September
October
November
December
1,650
1,910
2,020
2,080
2,280
2,150
2,050
1,950
No Data
No Data
2,300
2,370
Month
AAWT 9,160
AWTJanuary
February
March
April
May
June
July
August
September
October
November
December
7,950
8,750
8,530
8,980
9,310
9,060
8,420
11,650
No Data
No Data
9,500
9,440
Month
AAWT 10,270
AWTJanuary
February
March
April
May
June
July
August
September
October
November
December
9,160
9,310
9,970
10,840
11,030
10,270
9,980
10,220
No Data
No Data
10,870
11,470
Month
AAWT 1,840
AWTJanuary
February
March
April
May
June
July
August
September
October
November
December
1,550
1,640
1,740
1,910
1,930
1,890
1,750
1,970
No Data
No Data
2,070
2,140
Month
AAWT 25,770
AWTJanuary
February
March
April
May
June
July
August
September
October
November
December
20,240
21,840
24,210
25,150
27,160
26,960
25,790
26,860
26,920
28,310
28,170
28,790
540
TOLL
147
TOLL
AWT6,930
7,550
7,990
8,060
8,450
8,790
MonthJanuary
February
March
April
May
June
AWT18,140
19,330
20,110
20,450
21,220
21,420
MonthJanuary
February
March
April
May
June
AWT720
750
770
800
840
890
MonthJanuary
February
March
April
May
June
AWT710
750
790
850
870
940
MonthJanuary
February
March
April
May
June
AWT2,700
2,960
3,020
3,080
3,260
3,400
MonthJanuary
February
March
April
May
June
AWT2,920
3,250
3,500
3,570
3,460
3,650
MonthJanuary
February
March
April
May
June
AWT22,340
23,920
24,940
25,350
25,790
26,460
MonthJanuary
February
March
April
May
June
NC-540 at NC-147 Interchange Figure7
NMap Not to Scale
LEGENDAverage Weekday TrafficAWT
AAWT
NO DATA
Annual Average Weekday Traffic
No Traffic Data Available
2014 Annual Average Weekday Traffic
Month
AAWT 32,760
AWTJanuary
February
March
April
May
June
July
August
September
October
November
December
25,370
26,980
29,900
31,750
34,480
34,180
32,690
34,800
34,740
36,280
36,210
36,870
Month
AAWT 4,650
AWTJanuary
February
March
April
May
June
July
August
September
October
November
December
3,790
3,770
4,180
4,410
4,700
4,720
4,670
4,960
4,890
5,160
5,230
5,220
Month
AAWT 4,800
AWTJanuary
February
March
April
May
June
July
August
September
October
November
December
3,570
3,890
4,250
4,620
4,930
4,770
4,690
5,200
5,090
5,470
5,580
5,580
Month
AAWT 1,420
AWTJanuary
February
March
April
May
June
July
August
September
October
November
December
950
1,100
1,270
1,320
1,380
1,420
1,380
1,530
1,500
1,740
1,750
1,780
Month
AAWT 25,770
AWTJanuary
February
March
April
May
June
July
August
September
October
November
December
20,240
21,840
24,210
25,150
27,160
26,960
25,790
26,860
26,920
28,310
28,170
28,790
Month
AAWT 1,200
AWTJanuary
February
March
April
May
June
July
August
September
October
November
December
840
970
1,090
1,120
1,220
1,230
1,200
1,240
1,240
1,460
1,470
1,430
Month
AAWT 12,010
AWTJanuary
February
March
April
May
June
July
August
September
October
November
December
9,100
9,920
10,820
11,500
12,190
12,190
12,120
12,780
12,720
13,620
13,820
13,830
540
TOLL
AWTMonthJanuary
February
March
April
May
June
AWT1,800
1,910
1,960
2,020
2,120
2,120
MonthJanuary
February
March
April
May
June
AWT5,960
6,290
6,480
6,500
6,780
6,630
MonthJanuary
February
March
April
May
June
AWT720
790
850
850
890
920
MonthJanuary
February
March
April
May
June
AWT170
190
200
200
190
170
MonthJanuary
February
March
April
May
June
AWT3,360
3,640
3,710
3,640
3,820
3,680
MonthJanuary
February
March
April
May
June
AWT850
930
970
1,010
1,040
1,090
MonthJanuary
February
March
April
May
June
AWT13,130
14,090
14,370
14,930
15,520
15,710
MonthJanuary
February
March
April
May
June
22,340
23,920
24,940
25,350
25,790
26,460
55
NC-540 at NC-55 Interchange Figure8
NMap Not to Scale
LEGENDAverage Weekday TrafficAWT
AAWT
NO DATA
Annual Average Weekday Traffic
No Traffic Data Available
2014 Annual Average Weekday Traffic
Month
AAWT 1,380
AWTJanuary
February
March
April
May
June
July
August
September
October
November
December
1,120
1,180
1,330
1,410
1,570
1,500
1,230
1,230
1,370
1,330
1,640
1,680
Month
AAWT 2,500
AWTJanuary
February
March
April
May
June
July
August
September
October
November
December
1,880
2,040
2,210
2,380
2,610
2,550
2,500
2,730
2,820
2,730
2,790
2,870
Month
AAWT 3,990
AWTJanuary
February
March
April
May
June
July
August
September
October
November
December
3,720
3,930
3,910
3,970
4,260
4,040
3,830
4,110
4,110
4,080
3,950
3,980
Month
AAWT 1,290
AWTJanuary
February
March
April
May
June
July
August
September
October
November
December
1,010
1,070
1,170
1,210
1,280
1,280
1,280
1,370
1,440
1,430
1,420
1,470
Month
AAWT 32,760
AWTJanuary
February
March
April
May
June
July
August
September
October
November
December
25,370
26,980
29,900
31,750
34,480
34,180
32,690
34,800
34,740
36,280
36,210
36,870
Month
AAWT 7,450
AWTJanuary
February
March
April
May
June
July
August
September
October
November
December
6,490
6,890
7,120
7,190
7,850
7,330
7,150
7,670
7,850
8,020
7,910
7,970
Month
AAWT 200
AWTJanuary
February
March
April
May
June
July
August
September
October
November
December
160
170
190
200
220
200
170
190
220
220
210
230
Month
AAWT 21,910
AWTJanuary
February
March
April
May
June
July
August
September
October
November
December
16,300
17,600
19,760
20,970
22,540
22,910
22,380
23,540
23,370
24,630
24,690
25,280
540
TOLL
AWT660
690
730
740
800
830
MonthJanuary
February
March
April
May
June
AWT570
680
780
780
720
710
MonthJanuary
February
March
April
May
June
AWT490
530
570
590
610
660
MonthJanuary
February
March
April
May
June
AWT520
620
700
730
710
690
MonthJanuary
February
March
April
May
June
AWT12,220
13,440
14,160
14,540
14,760
15,390
MonthJanuary
February
March
April
May
June
Green Level West Rd.
NC-540 at Green Level West Rd. Interchange Figure9
NMap Not to Scale
LEGENDAverage Weekday TrafficAWT
AAWT
NO DATA
Annual Average Weekday Traffic
No Traffic Data Available
2014 Annual Average Weekday Traffic
Month
AAWT 1,090
AWTJanuary
February
March
April
May
June
July
August
September
October
November
December
850
920
1,020
1,020
1,120
1,090
1,060
1,150
1,210
1,220
1,240
1,220
Month
AAWT 21,910
AWTJanuary
February
March
April
May
June
July
August
September
October
November
December
16,300
17,600
19,760
20,970
22,540
22,910
22,380
23,540
23,370
24,630
24,690
25,280
Month
AAWT 870
AWTJanuary
February
March
April
May
June
July
August
September
October
November
December
660
700
770
810
870
860
840
920
970
990
1,000
1,020
Month
AAWT 940
AWTJanuary
February
March
April
May
June
July
August
September
October
November
December
680
760
810
870
980
950
940
990
1,060
1,120
1,080
1,090
Month
AAWT 960
AWTJanuary
February
March
April
May
June
July
August
September
October
November
December
680
750
790
870
1,000
1,000
950
990
1,150
1,130
1,120
1,090 Month
AAWT 21,090
AWTJanuary
February
March
April
May
June
July
August
September
October
November
December
16,700
17,740
18,850
19,950
21,570
21,580
21,190
22,280
22,830
23,440
23,470
23,910
540
TOLL
64
AWT12,220
13,440
14,160
14,540
14,760
15,390
MonthJanuary
February
March
April
May
June
AWT8,750
9,690
10,390
10,920
11,420
11,950
MonthJanuary
February
March
April
May
June
AWT1,270
1,360
1,410
1,430
1,450
1,460
MonthJanuary
February
March
April
May
June
AWT290
290
320
340
360
360
MonthJanuary
February
March
April
May
June
AWT1,110
1,270
1,380
1,360
1,400
1,370
MonthJanuary
February
March
April
May
June
AWT330
350
400
440
480
490
MonthJanuary
February
March
April
May
June
AWT1,160
1,230
1,260
1,320
1,370
1,320
MonthJanuary
February
March
April
May
JuneAWT200
240
270
300
300
340
MonthJanuary
February
March
April
May
June
AWT1,440
1,490
1,550
1,580
1,560
1,540
MonthJanuary
February
March
April
May
June
AWT310
330
330
350
370
380
MonthJanuary
February
March
April
May
June
Ke
lly
Rd
.
NC-540 at US-64 Interchange Figure10
NMap Not to Scale
LEGENDAverage Weekday TrafficAWT
AAWT
NO DATA
Annual Average Weekday Traffic
No Traffic Data Available
2014 Annual Average Weekday Traffic
Month
AAWT 520
AWTJanuary
February
March
April
May
June
July
August
September
October
November
December
380
420
430
470
570
550
540
No Data
560
570
600
630
Month
AAWT 1,770
AWTJanuary
February
March
April
May
June
July
August
September
October
November
December
1,450
1,550
1,640
1,710
1,800
1,780
1,740
1,880
1,980
1,920
1,910
1,880
Month
AAWT 21,090
AWTJanuary
February
March
April
May
June
July
August
September
October
November
December
16,700
17,740
18,850
19,950
21,570
21,580
21,190
22,280
22,830
23,440
23,470
23,910
Month
AAWT 1,710
AWTJanuary
February
March
April
May
June
July
August
September
October
November
December
1,540
1,610
1,710
1,710
1,770
1,650
1,510
1,610
1,650
1,780
1,940
1,960
Month
AAWT 540
AWTJanuary
February
March
April
May
June
July
August
September
October
November
December
400
410
440
490
590
570
540
580
590
580
610
640
Month
AAWT 17,610
AWTJanuary
February
March
April
May
June
July
August
September
October
November
December
12,650
13,700
15,340
16,540
18,340
18,590
18,050
19,140
19,140
20,180
20,210
20,480
Month
AAWT 780
AWTJanuary
February
March
April
May
June
July
August
September
October
November
December
530
560
620
680
820
970
970
940
830
860
840
820
Month
AAWT 1,790
AWTJanuary
February
March
April
May
June
July
August
September
October
November
December
1,430
1,520
1,640
1,760
1,860
1,780
1,810
1,780
1,910
1,980
2,000
2,130
Month
AAWT 630
AWTJanuary
February
March
April
May
June
July
August
September
October
November
December
430
460
500
580
670
680
700
690
630
740
780
780
Month
AAWT
AWTJanuary
February
March
April
May
June
July
August
September
October
November
December
1,320
1,370
1,450
1,640
1,740
1,620
1,630
1,690
1,690
1,820
1,800
1,890
1,630
540
TOLL
AWT320
380
450
490
510
510
MonthJanuary
February
March
April
May
June
AWT440
450
480
490
480
490
MonthJanuary
February
March
April
May
June
AWT8,750
9,690
10,390
10,920
11,420
11,950
MonthJanuary
February
March
April
May
June
AWT350
410
450
440
480
480
MonthJanuary
February
March
April
May
June
AWT290
350
450
480
450
430
MonthJanuary
February
March
April
May
June
AWT8,350
9,620
10,500
11,230
11,810
12,110
MonthJanuary
February
March
April
May
June
NC-540 at S. Salem St. Interchange Figure11
NMap Not to Scale
LEGENDAverage Weekday TrafficAWT
AAWT
NO DATA
Annual Average Weekday Traffic
No Traffic Data Available
S. S
alem St.
2014 Annual Average Weekday Traffic
Month
AAWT 780
AWTJanuary
February
March
April
May
June
July
August
September
October
November
December
530
560
610
710
860
820
790
860
920
930
890
930
Month
AAWT 760
AWTJanuary
February
March
April
May
June
July
August
September
October
November
December
530
570
720
720
830
710
690
800
890
890
860
890
Month
AAWT 17,700
AWTJanuary
February
March
April
May
June
July
August
September
October
November
December
13,250
14,350
15,350
16,560
18,270
18,280
17,400
18,590
19,340
19,880
19,830
20,040
Month
AAWT 820
AWTJanuary
February
March
April
May
June
July
August
September
October
November
December
610
660
750
780
900
770
760
870
920
950
940
970
Month
AAWT 790
AWTJanuary
February
March
April
May
June
July
August
September
October
November
December
540
600
610
700
840
810
800
890
930
980
930
910
Month
AAWT 17,610
AWTJanuary
February
March
April
May
June
July
August
September
October
November
December
12,650
13,700
15,340
16,540
18,340
18,590
18,050
19,140
19,140
20,180
20,210
20,480
540
TOLL
AWT8,350
9,620
10,500
11,230
11,810
12,110
MonthJanuary
February
March
April
May
June
AWT350
440
550
600
610
640
MonthJanuary
February
March
April
May
June
AWT110
140
160
170
170
180
MonthJanuary
February
March
April
May
June
AWT640
820
940
990
1,040
1,040
MonthJanuary
February
March
April
May
June
AWT70
80
90
120
110
120
MonthJanuary
February
March
April
May
June
AWT430
530
590
660
690
730
MonthJanuary
February
March
April
May
June AWT150
160
190
200
200
210
MonthJanuary
February
March
April
May
June
AWT90
100
120
120
150
160
MonthJanuary
February
March
April
May
June
AWT530
1,030
1,120
1,210
1,280
1,310
MonthJanuary
February
March
April
May
June
AWT6,450
7,040
7,660
8,040
8,450
8,730
MonthJanuary
February
March
April
May
June
NC-540 at US-1 Interchange Figure12
NMap Not to Scale
LEGENDAverage Weekday TrafficAWT
AAWT
NO DATA
Annual Average Weekday Traffic
No Traffic Data Available
1
2014 Annual Average Weekday Traffic
Month
AAWT 1,740
AWTJanuary
February
March
April
May
June
July
August
September
October
November
December
1,230
1,340
1,480
1,620
1,770
1,960
1,770
1,820
1,910
1,990
2,000
2,070
Month
AAWT 180
AWTJanuary
February
March
April
May
June
July
August
September
October
November
December
150
160
150
160
160
150
150
170
250
230
220
230
Month
AAWT 1,200
AWTJanuary
February
March
April
May
June
July
August
September
October
November
December
890
980
1,040
1,080
1,270
1,130
1,120
1,320
1,380
1,400
1,390
1,470
Month
AAWT 280
AWTJanuary
February
March
April
May
June
July
August
September
October
November
December
230
250
260
280
270
310
260
270
280
310
310
300
Month
AAWT 1,150
AWTJanuary
February
March
April
May
June
July
August
September
October
November
December
1,110
900
940
930
1,030
1,150
1,160
1,230
1,260
1,330
1,350
1,370
Month
AAWT 12,240
AWTJanuary
February
March
April
May
June
July
August
September
October
November
December
9,220
10,260
10,980
11,540
12,670
12,440
12,230
13,190
13,420
13,730
13,800
13,990
Month
AAWT 340
AWTJanuary
February
March
April
May
June
July
August
September
October
November
December
240
270
270
270
310
270
270
380
540
430
400
390
Month
AAWT 2,110
AWTJanuary
February
March
April
May
June
July
August
September
October
November
December
1,360
1,530
1,730
1,890
2,070
2,350
2,640
2,450
2,330
2,350
2,250
2,310
Month
AAWT 260
AWTJanuary
February
March
April
May
June
July
August
September
October
November
December
200
220
230
250
260
300
240
270
280
290
290
270
Month
AAWT 17,700
AWTJanuary
February
March
April
May
June
July
August
September
October
November
December
13,250
14,350
15,350
16,560
18,270
18,280
17,400
18,590
19,340
19,880
19,830
20,040
540TOLL
AWT6,450
7,040
7,660
8,040
8,450
8,730
MonthJanuary
February
March
April
May
June
AWT2,680
2,940
3,290
3,490
3,700
3,800
MonthJanuary
February
March
April
May
June
AWT450
510
530
550
470
480
MonthJanuary
February
March
April
May
June
AWT200
220
230
240
250
250
MonthJanuary
February
March
April
May
June
AWT2,840
3,310
3,580
3,760
3,990
4,070
MonthJanuary
February
March
April
May
June
NC-540 at NC-55 Bypass Interchange Figure13
NMap Not to Scale
LEGENDAverage Weekday TrafficAWT
AAWT
NO DATA
Annual Average Weekday Traffic
No Traffic Data Available
55
2014 Annual Average Weekday Traffic
Month
AAWT 5,260
AWTJanuary
February
March
April
May
June
July
August
September
October
November
December
4,120
4,350
4,650
4,960
5,470
5,290
5,310
5,570
5,770
5,910
5,920
5,940
Month
AAWT 12,240
AWTJanuary
February
March
April
May
June
July
August
September
October
November
December
9,220
10,260
10,980
11,540
12,670
12,440
12,230
13,190
13,420
13,730
13,800
13,990
Month
AAWT 530
AWTJanuary
February
March
April
May
June
July
August
September
October
November
December
360
430
500
580
600
630
540
570
550
550
570
560
Month
AAWT 5,750
AWTJanuary
February
March
April
May
June
July
August
September
October
November
December
4,520
4,800
5,120
5,420
5,860
5,710
5,670
6,110
6,570
6,460
6,390
6,410
Month
AAWT 730
AWTJanuary
February
March
April
May
June
July
August
September
October
November
December
580
680
660
660
710
710
680
720
930
830
840
810
540
TOLL
22
Toll System Statistics
Operations Statistics Report for the Triangle Expressway
2014 Fourth Quarter and Annual Report
23
TOLL SYSTEM STATISTICS Current and historical toll system data is collected and reported through the NC Quick Pass Customer Service Center (CSC). The data provides an overview of the current toll operations on the facility and identifies any utilization trends. It also allows for comparison of historical and projected data. Transaction data is collected from the toll zones placed throughout the facility using an all-electronic tolling (AET) method. Toll gantries and the roadside toll vaults house the AET equipment.
Weekly, Monthly and Annual Statistics The statistics provided in the following section combine roadway and customer service data and reflect the overall Triangle Expressway facility. Statistics have been provided for the datasets listed below:
Transactions
Classification
Accounts
Transponders
It should be noted that the percentages of total provided in this section might not sum to 100% due to
rounding.
Operations Statistics Report for the Triangle Expressway
2014 Fourth Quarter and Annual Report
24
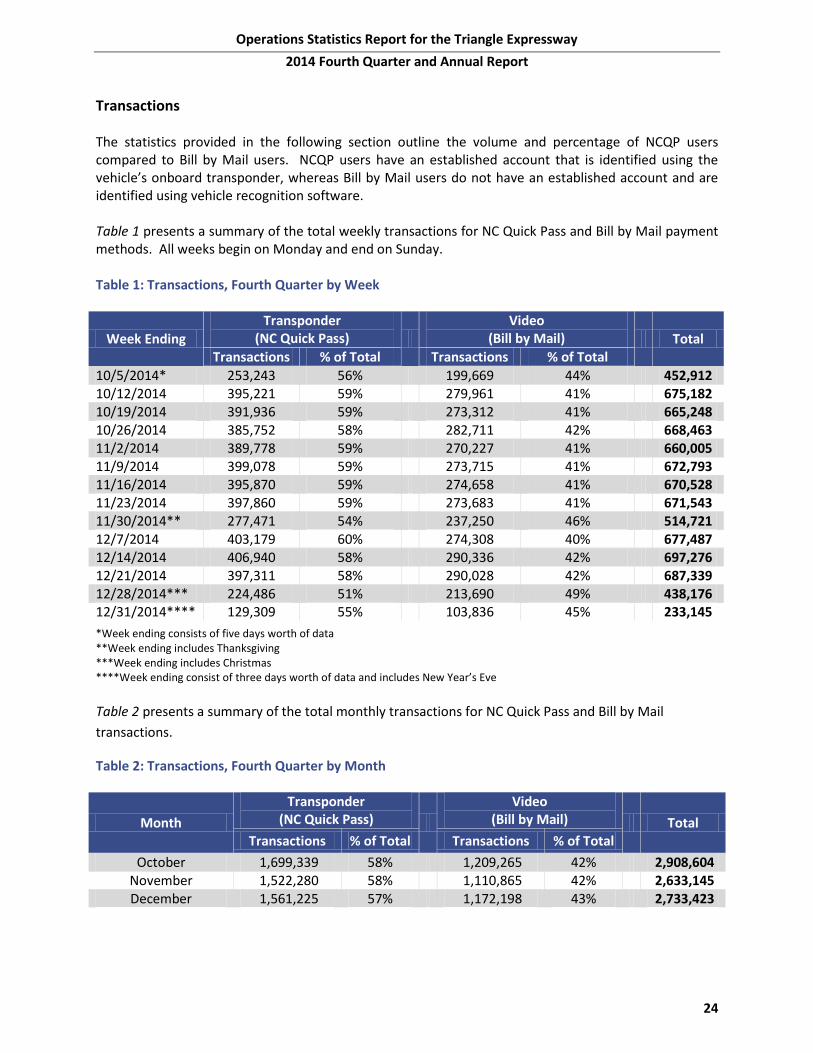
Transactions The statistics provided in the following section outline the volume and percentage of NCQP users compared to Bill by Mail users. NCQP users have an established account that is identified using the vehicle’s onboard transponder, whereas Bill by Mail users do not have an established account and are identified using vehicle recognition software. Table 1 presents a summary of the total weekly transactions for NC Quick Pass and Bill by Mail payment methods. All weeks begin on Monday and end on Sunday. Table 1: Transactions, Fourth Quarter by Week
Week Ending Transponder
(NC Quick Pass) Video
(Bill by Mail) Total Transactions % of Total Transactions % of Total
10/5/2014* 253,243 56% 199,669 44% 452,912 10/12/2014 395,221 59% 279,961 41% 675,182 10/19/2014 391,936 59% 273,312 41% 665,248 10/26/2014 385,752 58% 282,711 42% 668,463 11/2/2014 389,778 59% 270,227 41% 660,005 11/9/2014 399,078 59% 273,715 41% 672,793 11/16/2014 395,870 59% 274,658 41% 670,528 11/23/2014 397,860 59% 273,683 41% 671,543 11/30/2014** 277,471 54% 237,250 46% 514,721 12/7/2014 403,179 60% 274,308 40% 677,487 12/14/2014 406,940 58% 290,336 42% 697,276 12/21/2014 397,311 58% 290,028 42% 687,339 12/28/2014*** 224,486 51% 213,690 49% 438,176 12/31/2014**** 129,309 55% 103,836 45% 233,145
*Week ending consists of five days worth of data **Week ending includes Thanksgiving ***Week ending includes Christmas ****Week ending consist of three days worth of data and includes New Year’s Eve
Table 2 presents a summary of the total monthly transactions for NC Quick Pass and Bill by Mail
transactions.
Table 2: Transactions, Fourth Quarter by Month
Month
Transponder (NC Quick Pass)
Video (Bill by Mail) Total
Transactions % of Total Transactions % of Total
October 1,699,339 58% 1,209,265 42% 2,908,604 November 1,522,280 58% 1,110,865 42% 2,633,145 December 1,561,225 57% 1,172,198 43% 2,733,423
Operations Statistics Report for the Triangle Expressway
2014 Fourth Quarter and Annual Report
25
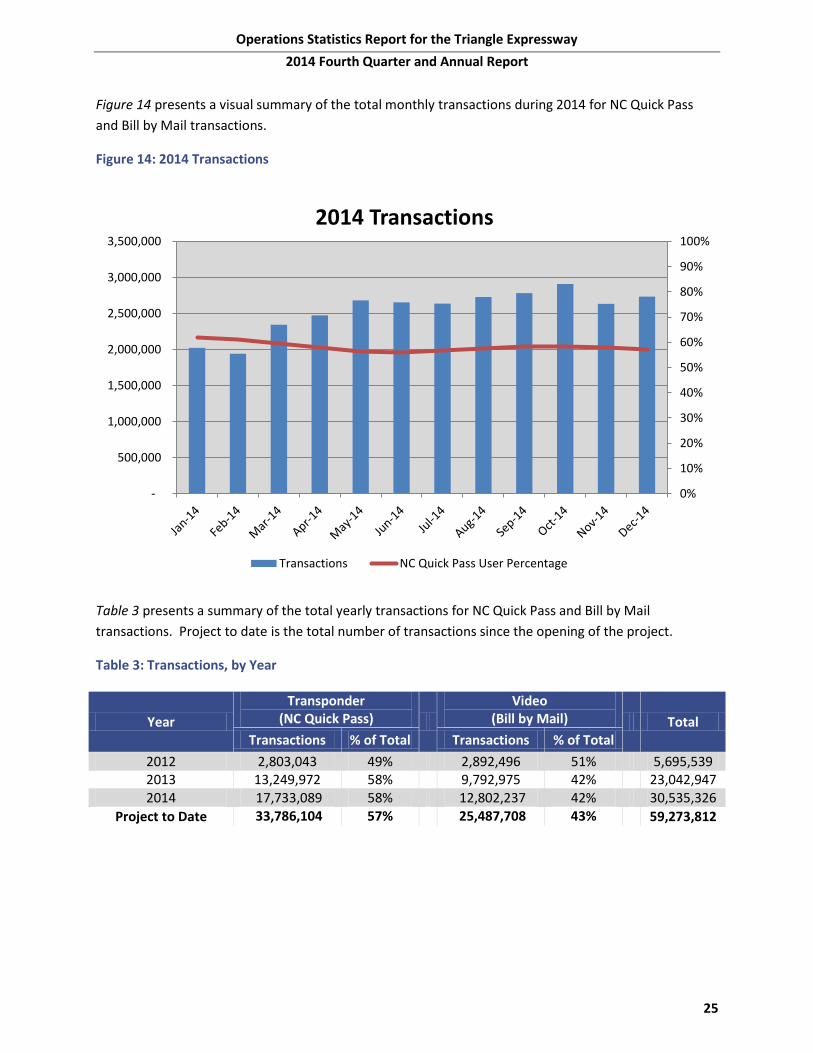
Figure 14 presents a visual summary of the total monthly transactions during 2014 for NC Quick Pass
and Bill by Mail transactions.
Figure 14: 2014 Transactions
Table 3 presents a summary of the total yearly transactions for NC Quick Pass and Bill by Mail
transactions. Project to date is the total number of transactions since the opening of the project.
Table 3: Transactions, by Year
Year
Transponder (NC Quick Pass)
Video (Bill by Mail) Total
Transactions % of Total Transactions % of Total
2012 2,803,043 49% 2,892,496 51% 5,695,539 2013 13,249,972 58% 9,792,975 42% 23,042,947 2014 17,733,089 58% 12,802,237 42% 30,535,326
Project to Date 33,786,104 57% 25,487,708 43% 59,273,812
0%
10%
20%
30%
40%
50%
60%
70%
80%
90%
100%
-
500,000
1,000,000
1,500,000
2,000,000
2,500,000
3,000,000
3,500,000
2014 Transactions
Transactions NC Quick Pass User Percentage
Operations Statistics Report for the Triangle Expressway
2014 Fourth Quarter and Annual Report
26
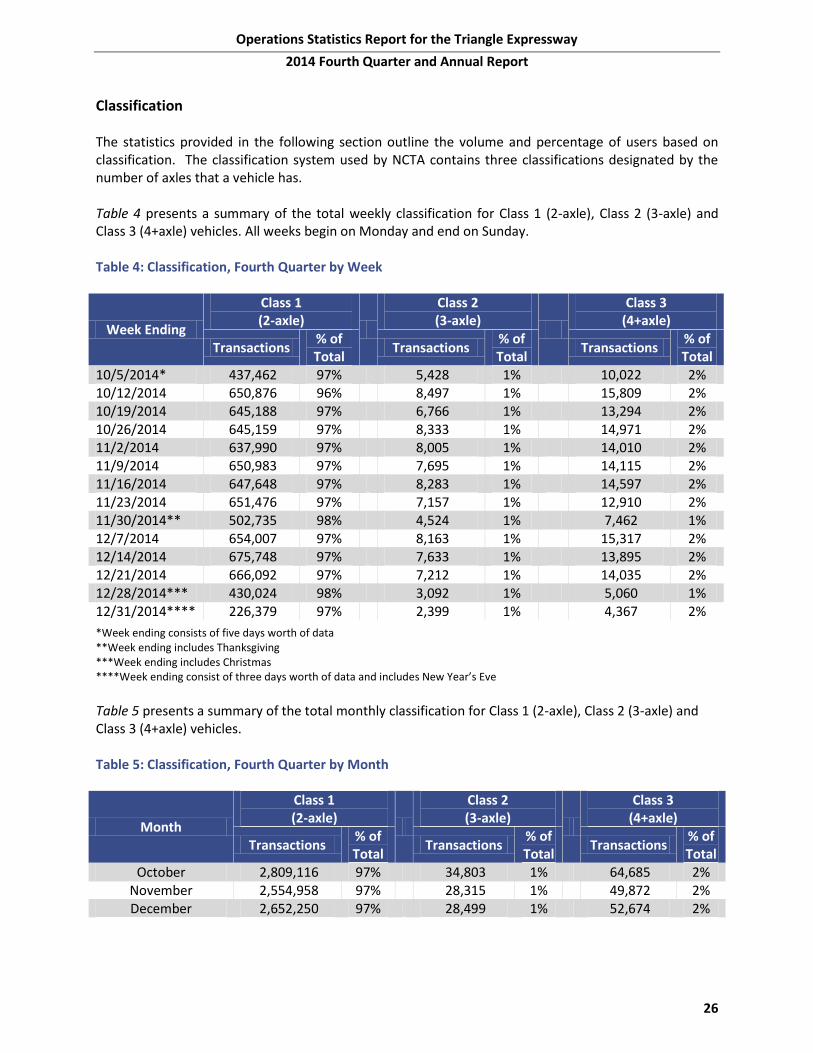
Classification The statistics provided in the following section outline the volume and percentage of users based on classification. The classification system used by NCTA contains three classifications designated by the number of axles that a vehicle has. Table 4 presents a summary of the total weekly classification for Class 1 (2-axle), Class 2 (3-axle) and Class 3 (4+axle) vehicles. All weeks begin on Monday and end on Sunday. Table 4: Classification, Fourth Quarter by Week
Week Ending
Class 1 (2-axle)
Class 2 (3-axle)
Class 3 (4+axle)
Transactions % of Total
Transactions % of Total
Transactions % of Total
10/5/2014* 437,462 97% 5,428 1% 10,022 2% 10/12/2014 650,876 96% 8,497 1% 15,809 2% 10/19/2014 645,188 97% 6,766 1% 13,294 2% 10/26/2014 645,159 97% 8,333 1% 14,971 2% 11/2/2014 637,990 97% 8,005 1% 14,010 2% 11/9/2014 650,983 97% 7,695 1% 14,115 2% 11/16/2014 647,648 97% 8,283 1% 14,597 2% 11/23/2014 651,476 97% 7,157 1% 12,910 2% 11/30/2014** 502,735 98% 4,524 1% 7,462 1% 12/7/2014 654,007 97% 8,163 1% 15,317 2% 12/14/2014 675,748 97% 7,633 1% 13,895 2% 12/21/2014 666,092 97% 7,212 1% 14,035 2% 12/28/2014*** 430,024 98% 3,092 1% 5,060 1% 12/31/2014**** 226,379 97% 2,399 1% 4,367 2%
*Week ending consists of five days worth of data **Week ending includes Thanksgiving ***Week ending includes Christmas ****Week ending consist of three days worth of data and includes New Year’s Eve
Table 5 presents a summary of the total monthly classification for Class 1 (2-axle), Class 2 (3-axle) and Class 3 (4+axle) vehicles. Table 5: Classification, Fourth Quarter by Month
Month
Class 1 (2-axle)
Class 2 (3-axle)
Class 3 (4+axle)
Transactions % of Total
Transactions % of Total
Transactions % of Total
October 2,809,116 97% 34,803 1% 64,685 2% November 2,554,958 97% 28,315 1% 49,872 2% December 2,652,250 97% 28,499 1% 52,674 2%
Operations Statistics Report for the Triangle Expressway
2014 Fourth Quarter and Annual Report
27
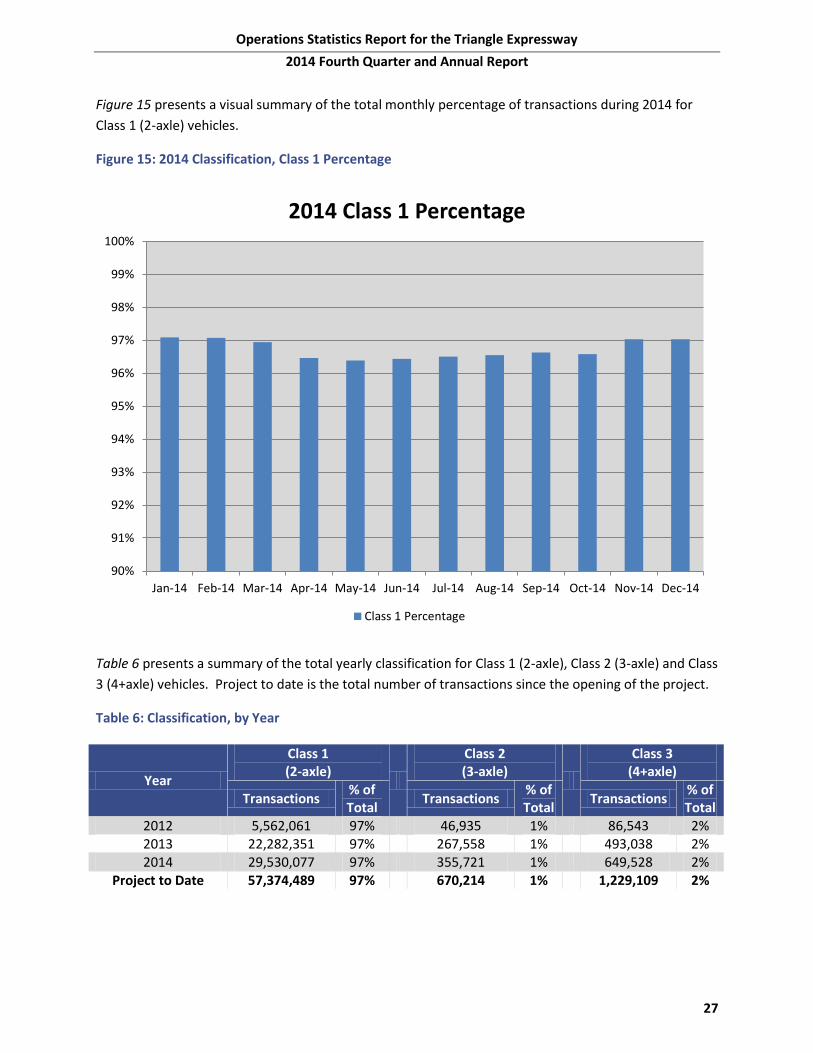
Figure 15 presents a visual summary of the total monthly percentage of transactions during 2014 for
Class 1 (2-axle) vehicles.
Figure 15: 2014 Classification, Class 1 Percentage
Table 6 presents a summary of the total yearly classification for Class 1 (2-axle), Class 2 (3-axle) and Class
3 (4+axle) vehicles. Project to date is the total number of transactions since the opening of the project.
Table 6: Classification, by Year
Year
Class 1 (2-axle)
Class 2 (3-axle)
Class 3 (4+axle)
Transactions % of Total
Transactions % of Total
Transactions % of Total
2012 5,562,061 97% 46,935 1% 86,543 2% 2013 22,282,351 97% 267,558 1% 493,038 2% 2014 29,530,077 97% 355,721 1% 649,528 2%
Project to Date 57,374,489 97% 670,214 1% 1,229,109 2%
90%
91%
92%
93%
94%
95%
96%
97%
98%
99%
100%
Jan-14 Feb-14 Mar-14 Apr-14 May-14 Jun-14 Jul-14 Aug-14 Sep-14 Oct-14 Nov-14 Dec-14
2014 Class 1 Percentage
Class 1 Percentage
Operations Statistics Report for the Triangle Expressway
2014 Fourth Quarter and Annual Report
28
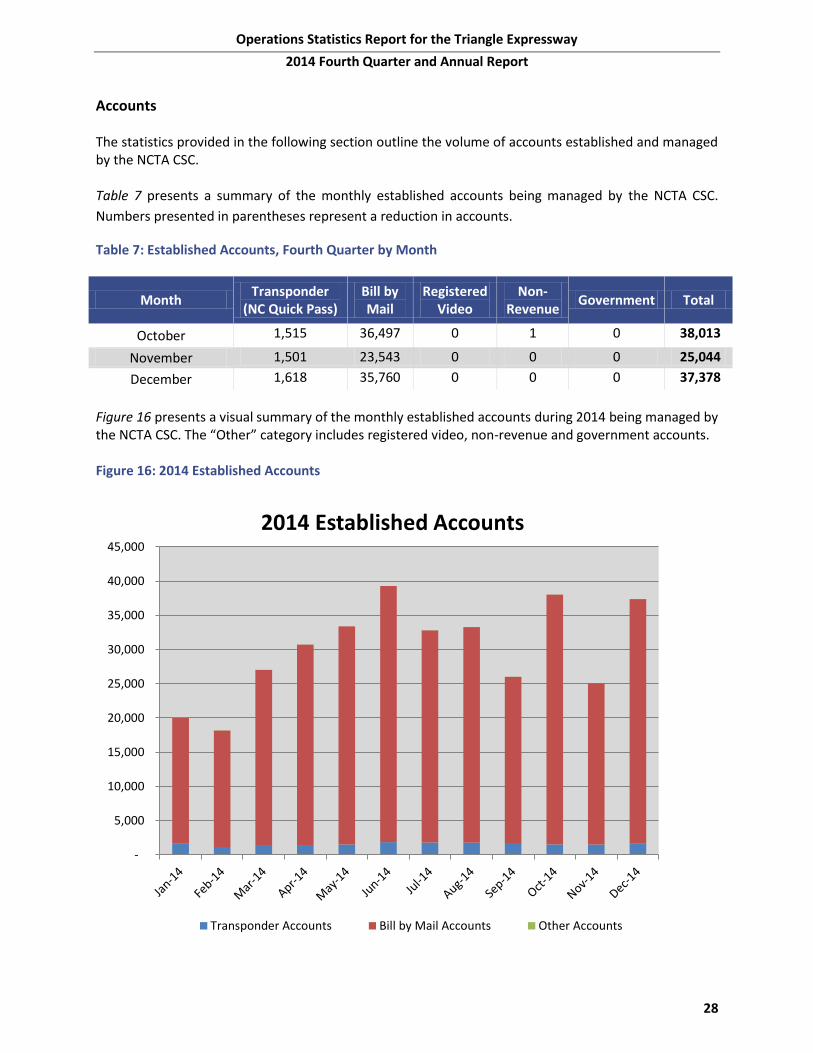
Accounts The statistics provided in the following section outline the volume of accounts established and managed by the NCTA CSC. Table 7 presents a summary of the monthly established accounts being managed by the NCTA CSC.
Numbers presented in parentheses represent a reduction in accounts.
Table 7: Established Accounts, Fourth Quarter by Month
Month Transponder
(NC Quick Pass) Bill by Mail
Registered Video
Non-Revenue
Government Total
October 1,515 36,497 0 1 0 38,013
November 1,501 23,543 0 0 0 25,044
December 1,618 35,760 0 0 0 37,378
Figure 16 presents a visual summary of the monthly established accounts during 2014 being managed by the NCTA CSC. The “Other” category includes registered video, non-revenue and government accounts. Figure 16: 2014 Established Accounts
-
5,000
10,000
15,000
20,000
25,000
30,000
35,000
40,000
45,000
2014 Established Accounts
Transponder Accounts Bill by Mail Accounts Other Accounts
Operations Statistics Report for the Triangle Expressway
2014 Fourth Quarter and Annual Report
29
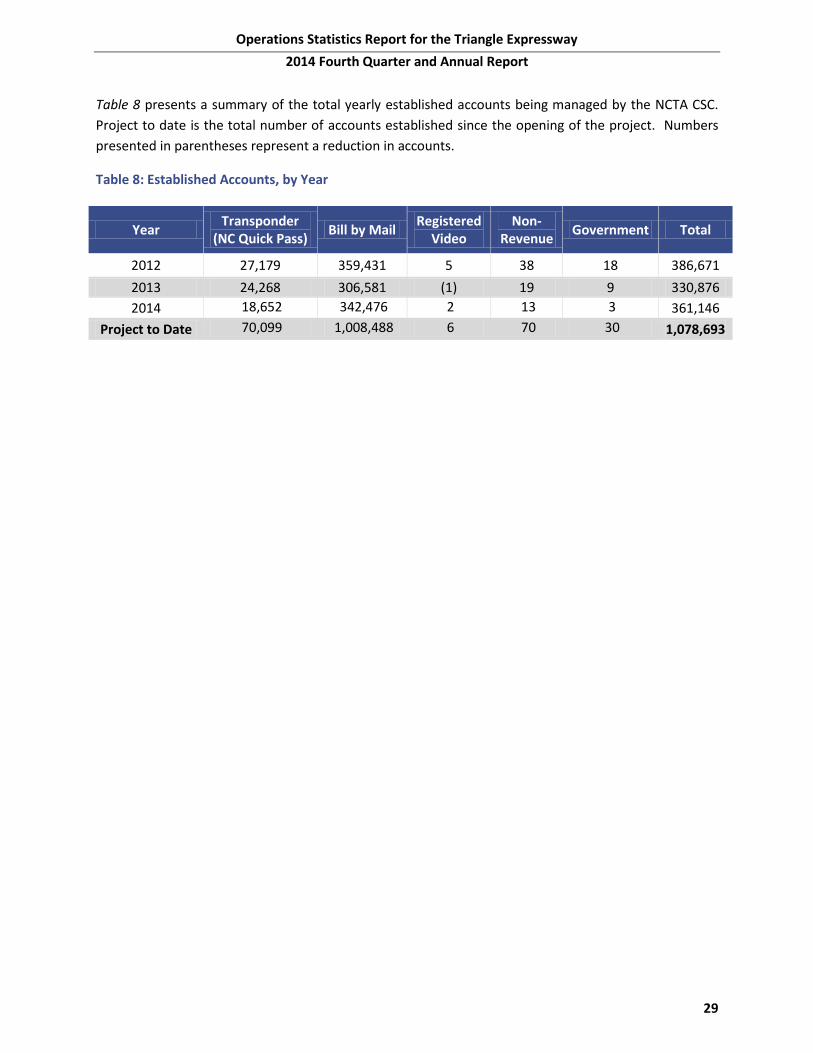
Table 8 presents a summary of the total yearly established accounts being managed by the NCTA CSC.
Project to date is the total number of accounts established since the opening of the project. Numbers
presented in parentheses represent a reduction in accounts.
Table 8: Established Accounts, by Year
Year Transponder
(NC Quick Pass) Bill by Mail
Registered Video
Non-Revenue
Government Total
2012 27,179 359,431 5 38 18 386,671
2013 24,268 306,581 (1) 19 9 330,876
2014 18,652 342,476 2 13 3 361,146
Project to Date 70,099 1,008,488 6 70 30 1,078,693
Operations Statistics Report for the Triangle Expressway
2014 Fourth Quarter and Annual Report
30
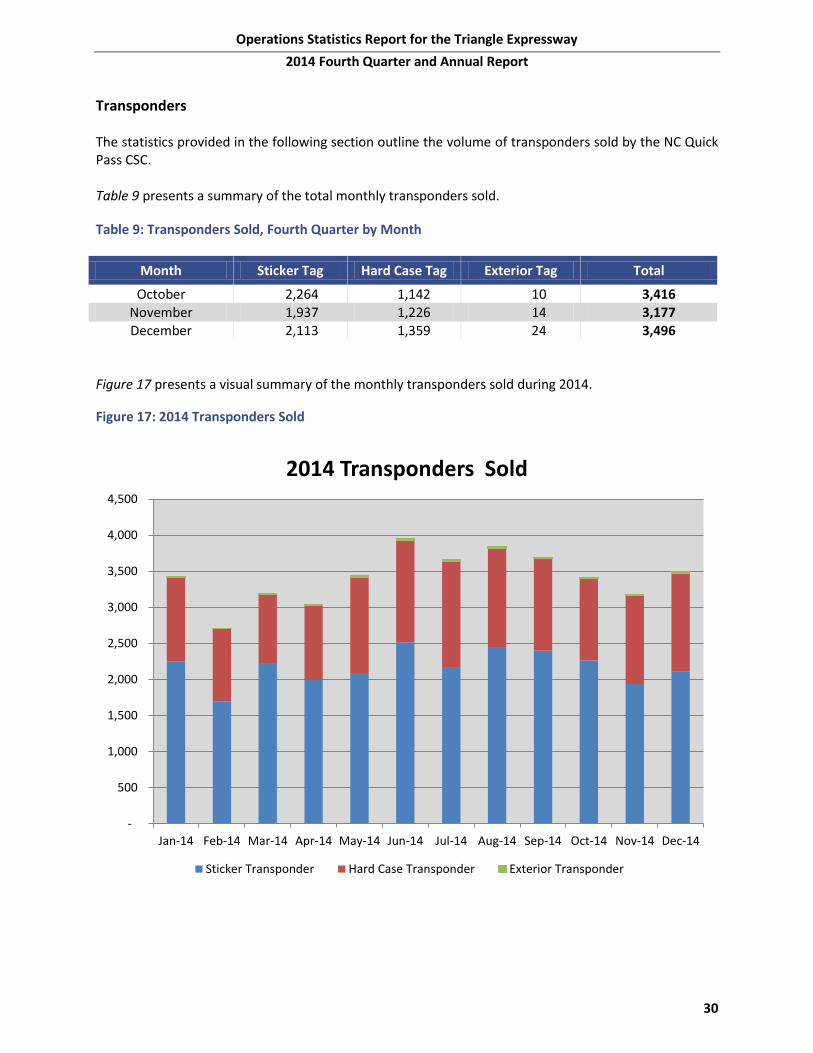
Transponders The statistics provided in the following section outline the volume of transponders sold by the NC Quick Pass CSC. Table 9 presents a summary of the total monthly transponders sold.
Table 9: Transponders Sold, Fourth Quarter by Month
Month Sticker Tag Hard Case Tag Exterior Tag Total
October 2,264 1,142 10 3,416 November 1,937 1,226 14 3,177 December 2,113 1,359 24 3,496
Figure 17 presents a visual summary of the monthly transponders sold during 2014.
Figure 17: 2014 Transponders Sold
-
500
1,000
1,500
2,000
2,500
3,000
3,500
4,000
4,500
Jan-14 Feb-14 Mar-14 Apr-14 May-14 Jun-14 Jul-14 Aug-14 Sep-14 Oct-14 Nov-14 Dec-14
2014 Transponders Sold
Sticker Transponder Hard Case Transponder Exterior Transponder
Operations Statistics Report for the Triangle Expressway
2014 Fourth Quarter and Annual Report
31
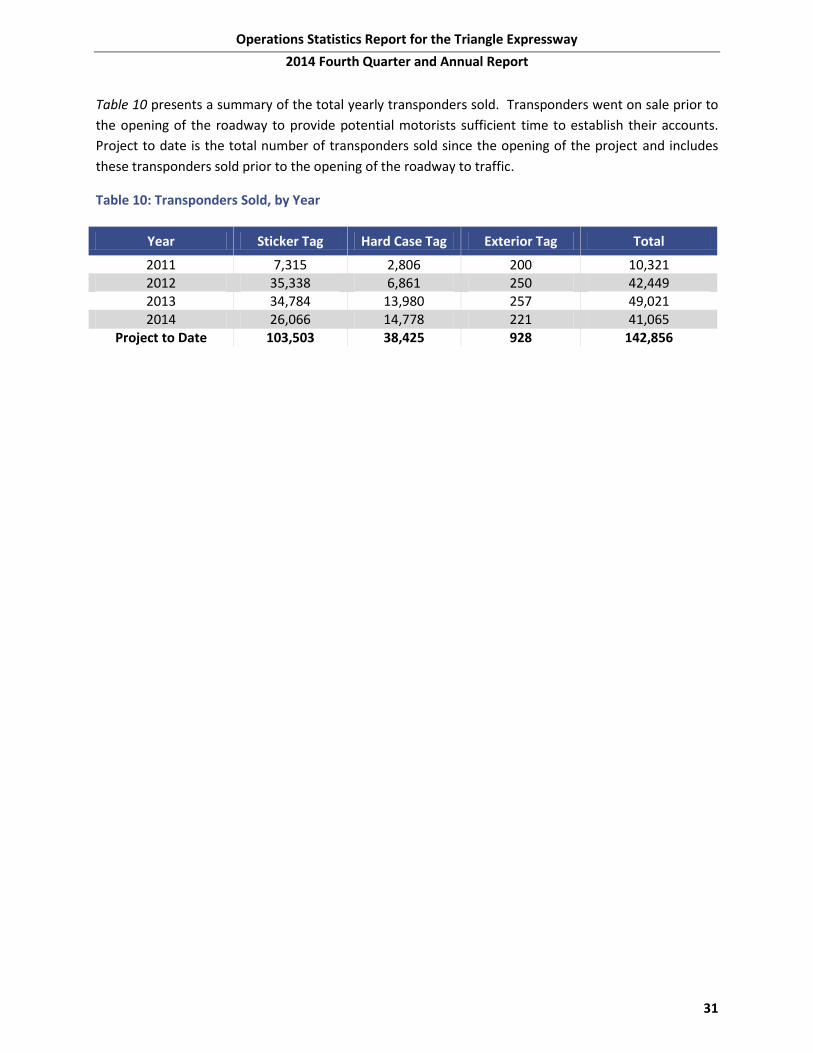
Table 10 presents a summary of the total yearly transponders sold. Transponders went on sale prior to
the opening of the roadway to provide potential motorists sufficient time to establish their accounts.
Project to date is the total number of transponders sold since the opening of the project and includes
these transponders sold prior to the opening of the roadway to traffic.
Table 10: Transponders Sold, by Year
Year Sticker Tag Hard Case Tag Exterior Tag Total
2011 7,315 2,806 200 10,321 2012 35,338 6,861 250 42,449 2013 34,784 13,980 257 49,021 2014 26,066 14,778 221 41,065
Project to Date 103,503 38,425 928 142,856
32
Toll Zone Statistics

Operations Statistics Report for the Triangle Expressway
2014 Fourth Quarter and Annual Report
33
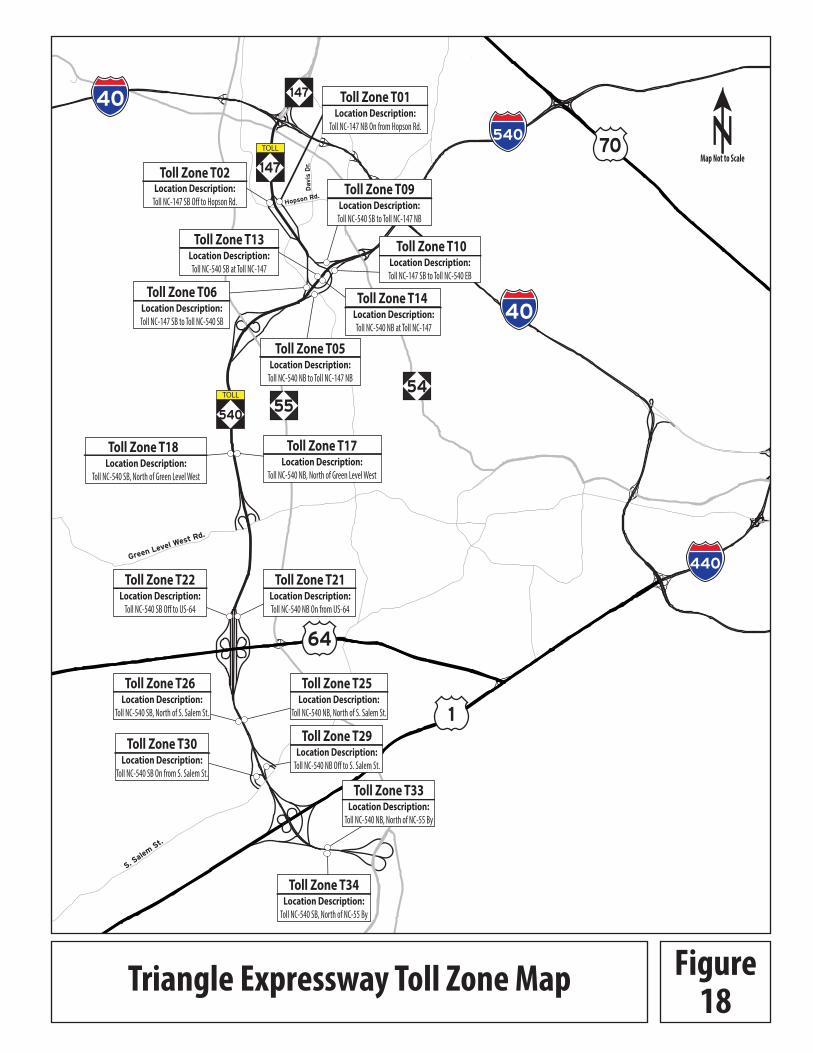
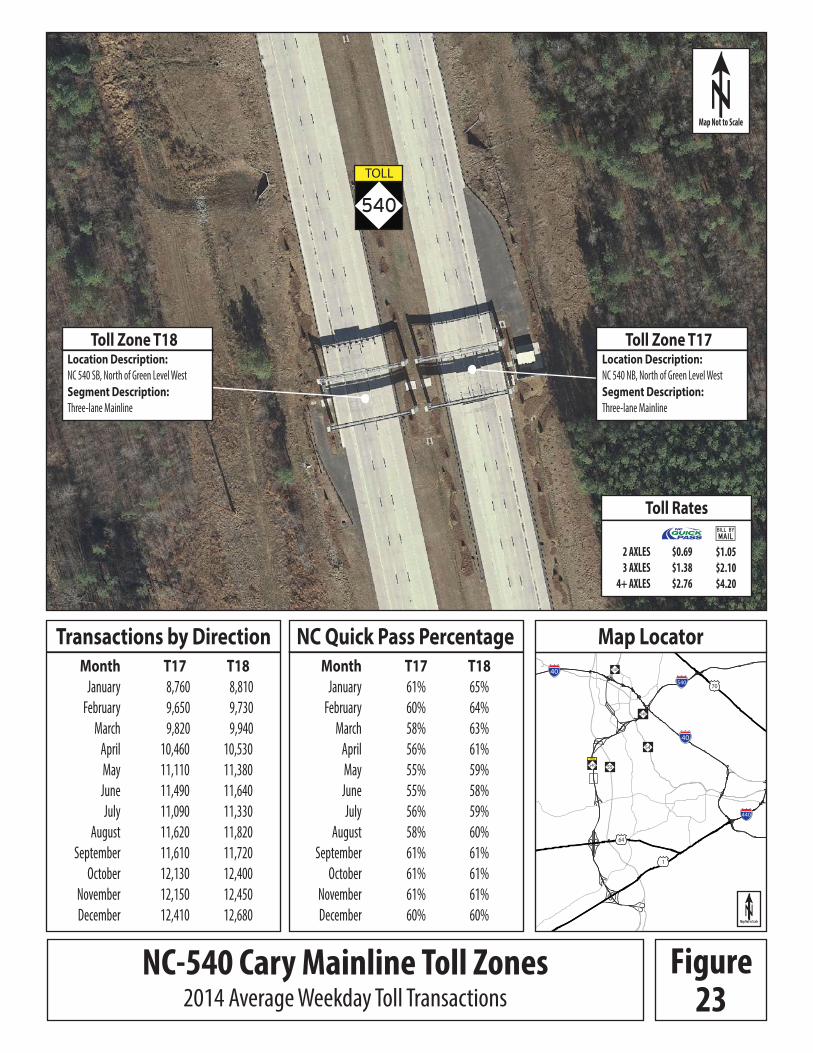
TOLL ZONE STATISTICS The following pages contain visual representations of transactions that have occurred for all toll zones along the facility. The location of the toll zones in relation to the entire Triangle Expressway can be seen on the following page in Figure 18.
70
55
40
64
1
540
54
40 147
440
Toll Zone T02Location Description:
Toll NC-147 SB Off to Hopson Rd.
Toll Zone T06Location Description:Toll NC-147 SB to Toll NC-540 SB
Toll Zone T13Location Description:
Toll NC-540 SB at Toll NC-147
Toll Zone T05Location Description:
Toll NC-540 NB to Toll NC-147 NB
Toll Zone T17Location Description:
Toll NC-540 NB, North of Green Level West
Toll Zone T18Location Description:
Toll NC-540 SB, North of Green Level West
Toll Zone T22Location Description:
Toll NC-540 SB Off to US-64
Toll Zone T21Location Description:Toll NC-540 NB On from US-64
Toll Zone T26Location Description:
Toll NC-540 SB, North of S. Salem St.
Toll Zone T25Location Description:
Toll NC-540 NB, North of S. Salem St.
Toll Zone T30Location Description:
Toll NC-540 SB On from S. Salem St.
Toll Zone T29Location Description:
Toll NC-540 NB Off to S. Salem St.
Toll Zone T34Location Description:
Toll NC-540 SB, North of NC-55 By
Toll Zone T33Location Description:
Toll NC-540 NB, North of NC-55 By
Toll Zone T14Location Description:Toll NC-540 NB at Toll NC-147
Toll Zone T09Location Description:
Toll NC-540 SB to Toll NC-147 NB
Toll Zone T10Location Description:Toll NC-147 SB to Toll NC-540 EB
Toll Zone T01Location Description:
Toll NC-147 NB On from Hopson Rd.
Triangle Expressway Toll Zone Map Figure18
147
TOLL
540
TOLL
NMap Not to Scale
S. Salem St.
Green Level West Rd.
Hopson Rd.
Dav
is D
r.
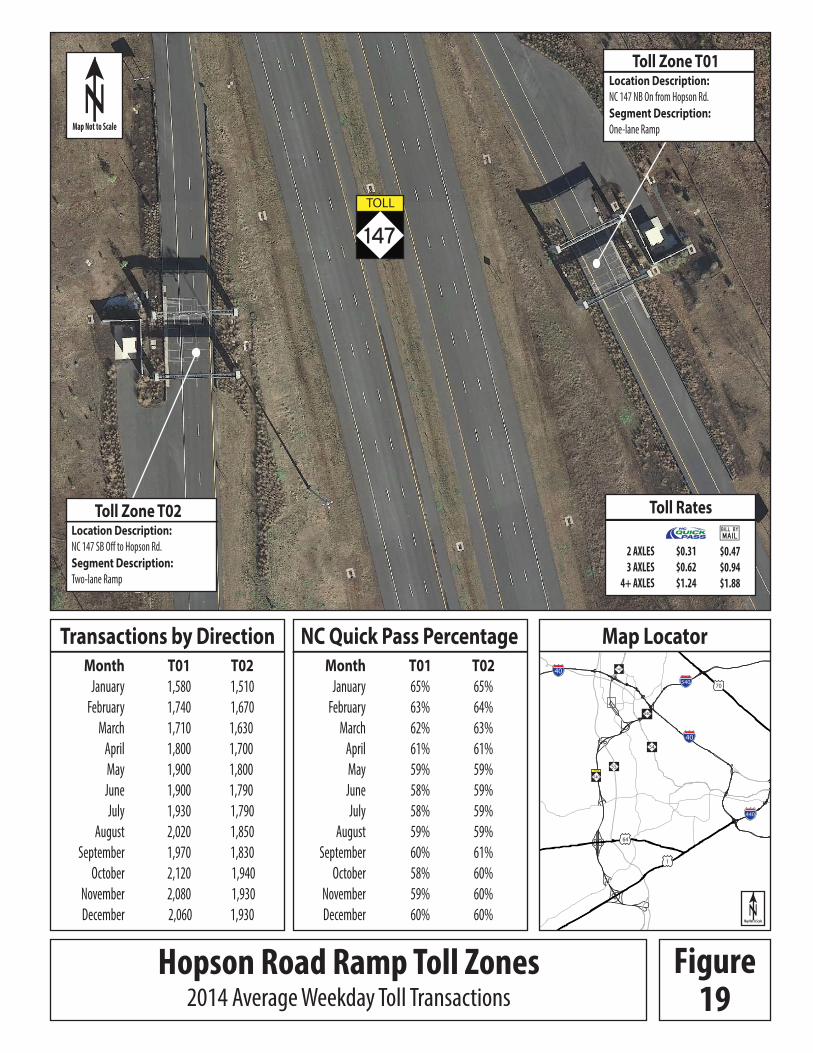
Hopson Road Ramp Toll Zones2014 Average Weekday Toll Transactions
T0165%
63%
62%
61%
59%
58%
58%
59%
60%
58%
59%
60%
MonthJanuary
February
March
April
May
June
July
August
September
October
November
December
T0265%
64%
63%
61%
59%
59%
59%
59%
61%
60%
60%
60%
NC Quick Pass PercentageTransactions by DirectionT01
1,580
1,740
1,710
1,800
1,900
1,900
1,930
2,020
1,970
2,120
2,080
2,060
MonthJanuary
February
March
April
May
June
July
August
September
October
November
December
T02 1,510
1,670
1,630
1,700
1,800
1,790
1,790
1,850
1,830
1,940
1,930
1,930
Figure19
147
TOLL
Toll Rates
2 AXLES
3 AXLES
4+ AXLES
$0.31
$0.62
$1.24
$0.47
$0.94
$1.88
Toll Zone T01Location Description:NC 147 NB On from Hopson Rd.
Segment Description:One-lane Ramp
Toll Zone T02Location Description:NC 147 SB Off to Hopson Rd.
Segment Description:Two-lane Ramp
NMap Not to Scale
Map Locator
70
55
40
64
1
540
54
40
540
147
440
540TOLL
NMap Not to Scale
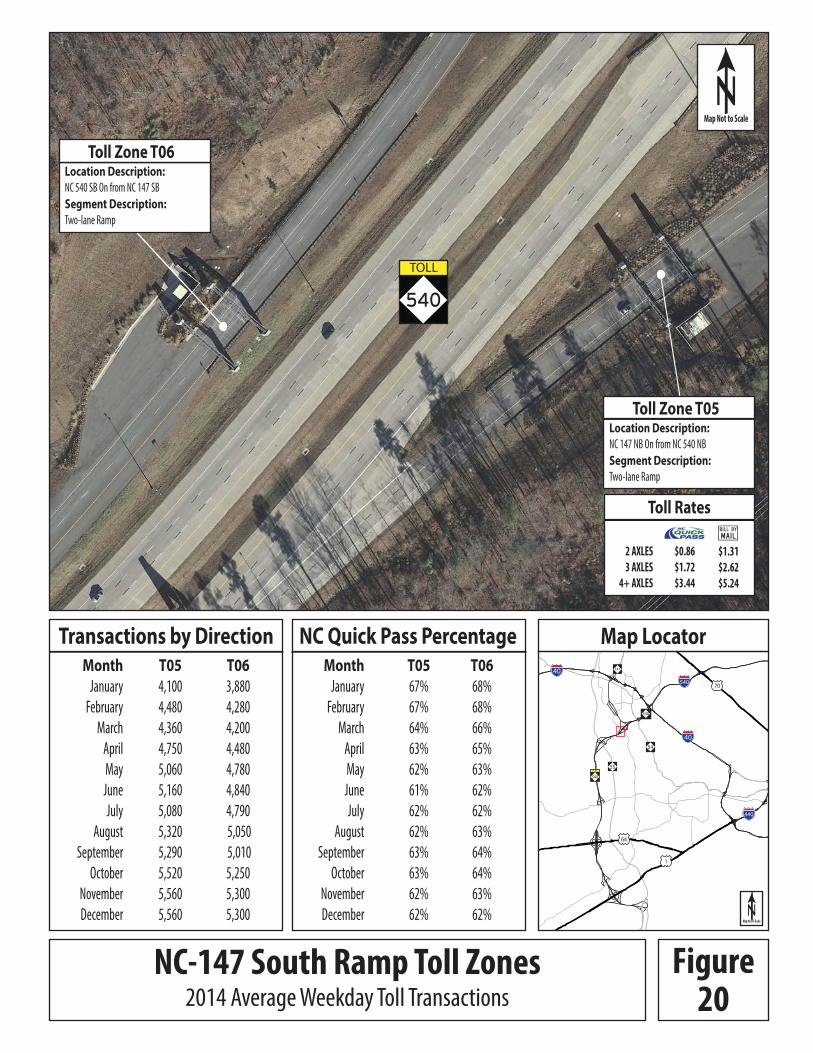
Transactions by DirectionT06
3,880
4,280
4,200
4,480
4,780
4,840
4,790
5,050
5,010
5,250
5,300
5,300
MonthJanuary
February
March
April
May
June
July
August
September
October
November
December
T05 4,100
4,480
4,360
4,750
5,060
5,160
5,080
5,320
5,290
5,520
5,560
5,560
NC Quick Pass PercentageT0668%
68%
66%
65%
63%
62%
62%
63%
64%
64%
63%
62%
MonthJanuary
February
March
April
May
June
July
August
September
October
November
December
T0567%
67%
64%
63%
62%
61%
62%
62%
63%
63%
62%
62%
Toll Zone T06Location Description:NC 540 SB On from NC 147 SB
Segment Description:Two-lane Ramp
Toll Zone T05Location Description:NC 147 NB On from NC 540 NB
Segment Description:Two-lane Ramp
Toll Rates
2 AXLES
3 AXLES
4+ AXLES
$0.86
$1.72
$3.44
$1.31
$2.62
$5.24
540
TOLL
NC-147 South Ramp Toll Zones2014 Average Weekday Toll Transactions
Figure20
NMap Not to Scale
Map Locator
70
55
40
64
1
540
54
40
540
147
440
540TOLL
NMap Not to Scale
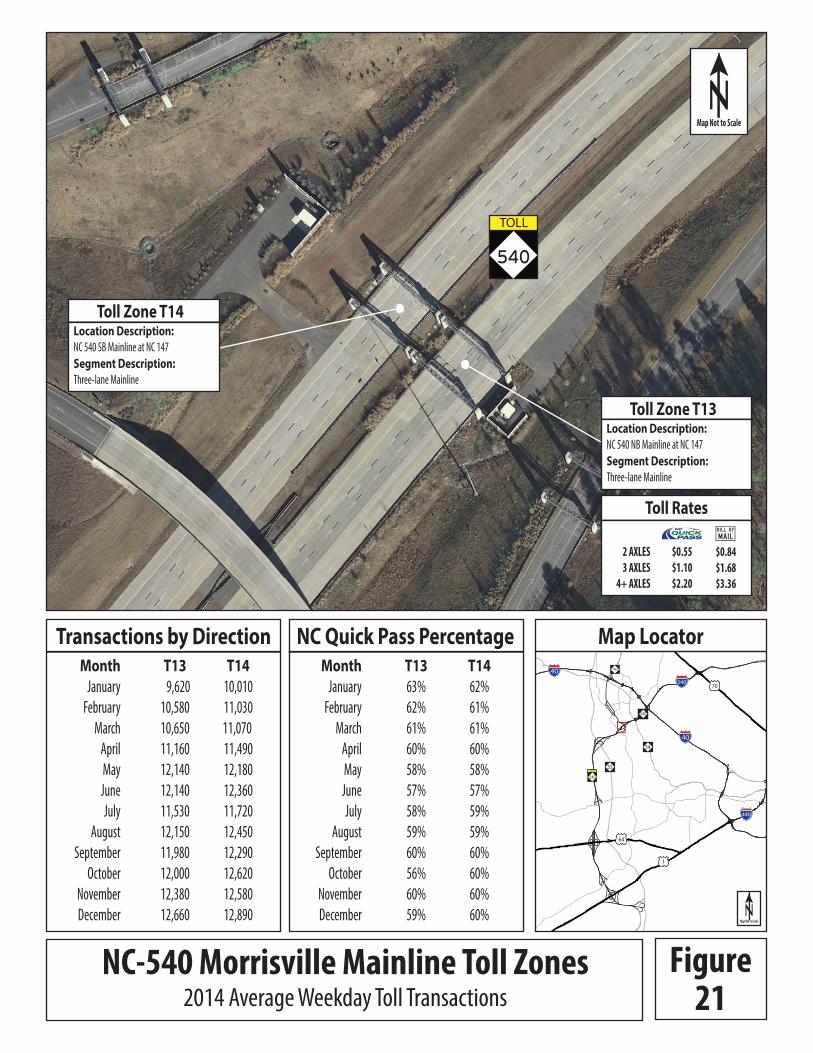
Toll Rates
2 AXLES
3 AXLES
4+ AXLES
$0.55
$1.10
$2.20
$0.84
$1.68
$3.36
540
TOLL
Toll Zone T14Location Description:NC 540 SB Mainline at NC 147
Segment Description:Three-lane Mainline
Toll Zone T13Location Description:NC 540 NB Mainline at NC 147
Segment Description:Three-lane Mainline
Transactions by DirectionT13
9,620
10,580
10,650
11,160
12,140
12,140
11,530
12,150
11,980
12,000
12,380
12,660
MonthJanuary
February
March
April
May
June
July
August
September
October
November
December
T14 10,010
11,030
11,070
11,490
12,180
12,360
11,720
12,450
12,290
12,620
12,580
12,890
T1462%
61%
61%
60%
58%
57%
59%
59%
60%
60%
60%
60%
NC Quick Pass PercentageMonth
January
February
March
April
May
June
July
August
September
October
November
December
T1363%
62%
61%
60%
58%
57%
58%
59%
60%
56%
60%
59%
NC-540 Morrisville Mainline Toll Zones2014 Average Weekday Toll Transactions
Figure21
NMap Not to Scale
Map Locator
70
55
40
64
1
540
54
40
540
147
440
540TOLL
NMap Not to Scale
540
TOLL
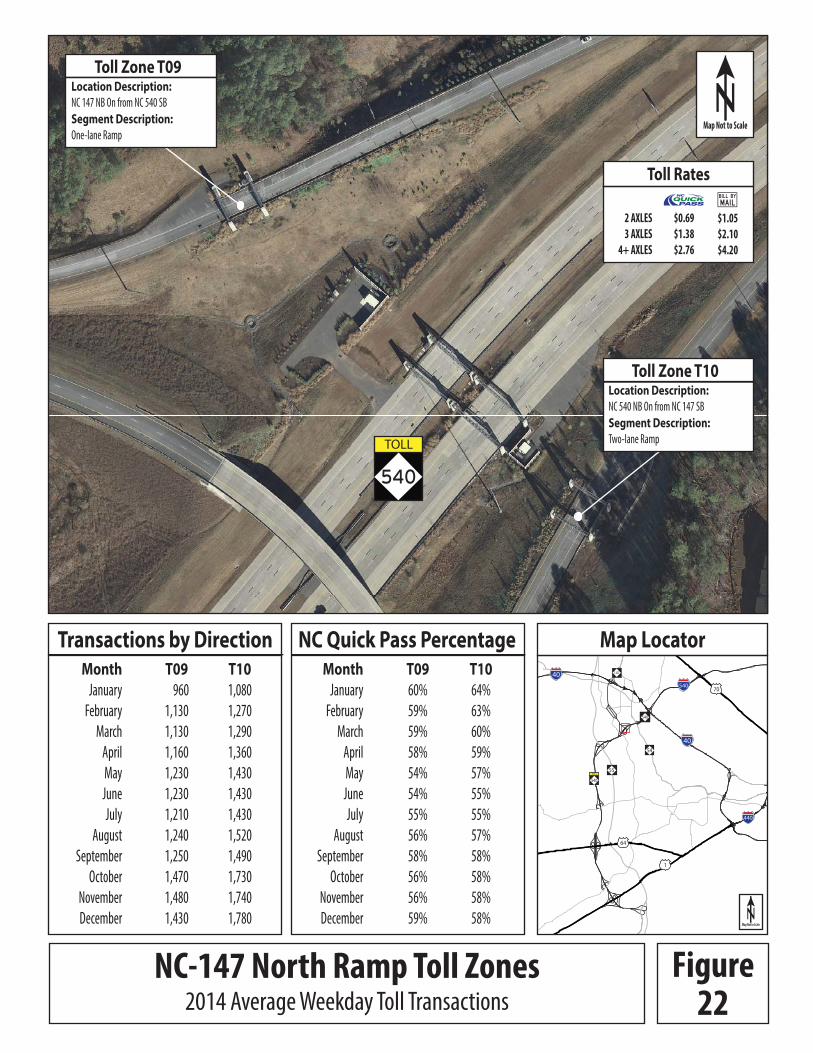
Toll Rates
2 AXLES
3 AXLES
4+ AXLES
$0.69
$1.38
$2.76
$1.05
$2.10
$4.20
Toll Zone T10Location Description:NC 540 NB On from NC 147 SB
Segment Description:Two-lane Ramp
Toll Zone T09Location Description:NC 147 NB On from NC 540 SB
Segment Description:One-lane Ramp
T0960%
59%
59%
58%
54%
54%
55%
56%
58%
56%
56%
59%
MonthJanuary
February
March
April
May
June
July
August
September
October
November
December
T1064%
63%
60%
59%
57%
55%
55%
57%
58%
58%
58%
58%
NC Quick Pass PercentageTransactions by DirectionT09
960
1,130
1,130
1,160
1,230
1,230
1,210
1,240
1,250
1,470
1,480
1,430
MonthJanuary
February
March
April
May
June
July
August
September
October
November
December
T10 1,080
1,270
1,290
1,360
1,430
1,430
1,430
1,520
1,490
1,730
1,740
1,780
NC-147 North Ramp Toll Zones2014 Average Weekday Toll Transactions
Figure22
NMap Not to Scale
Map Locator
70
55
40
64
1
540
54
40
540
147
440
540TOLL
NMap Not to Scale
540
TOLL
Toll Rates
2 AXLES
3 AXLES
4+ AXLES
$0.69
$1.38
$2.76
$1.05
$2.10
$4.20
Toll Zone T17Location Description:NC 540 NB, North of Green Level West
Segment Description:Three-lane Mainline
Toll Zone T18Location Description:NC 540 SB, North of Green Level West
Segment Description:Three-lane Mainline
T1761%
60%
58%
56%
55%
55%
56%
58%
61%
61%
61%
60%
MonthJanuary
February
March
April
May
June
July
August
September
October
November
December
T1865%
64%
63%
61%
59%
58%
59%
60%
61%
61%
61%
60%
NC Quick Pass PercentageTransactions by DirectionT17
8,760
9,650
9,820
10,460
11,110
11,490
11,090
11,620
11,610
12,130
12,150
12,410
MonthJanuary
February
March
April
May
June
July
August
September
October
November
December
T18 8,810
9,730
9,940
10,530
11,380
11,640
11,330
11,820
11,720
12,400
12,450
12,680
NC-540 Cary Mainline Toll Zones2014 Average Weekday Toll Transactions
Figure23
NMap Not to Scale
Map Locator
70
55
40
64
1
540
54
40
540
147
440
540TOLL
NMap Not to Scale
540
TOLL
Toll Rates
2 AXLES
3 AXLES
4+ AXLES
$0.38
$0.76
$1.52
$0.58
$1.16
$2.32
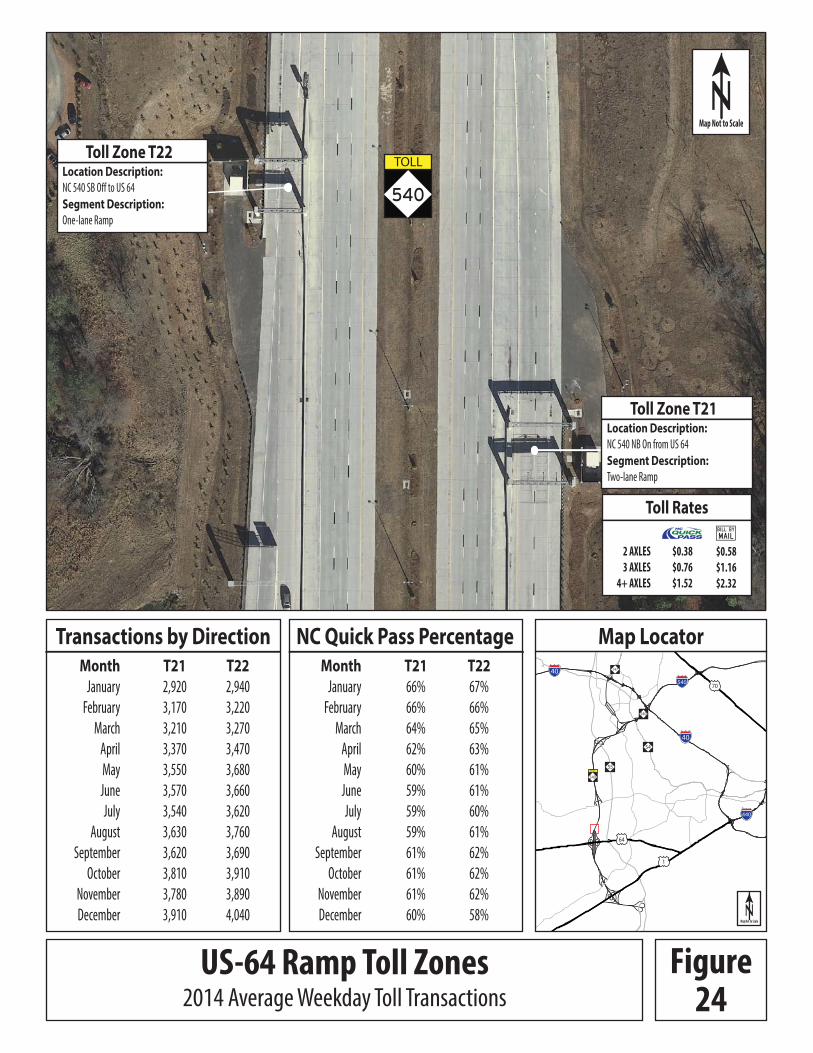
Toll Zone T21Location Description:NC 540 NB On from US 64
Segment Description:Two-lane Ramp
Toll Zone T22Location Description:NC 540 SB Off to US 64
Segment Description:One-lane Ramp
T2166%
66%
64%
62%
60%
59%
59%
59%
61%
61%
61%
60%
MonthJanuary
February
March
April
May
June
July
August
September
October
November
December
T2267%
66%
65%
63%
61%
61%
60%
61%
62%
62%
62%
58%
NC Quick Pass PercentageTransactions by DirectionT21
2,920
3,170
3,210
3,370
3,550
3,570
3,540
3,630
3,620
3,810
3,780
3,910
MonthJanuary
February
March
April
May
June
July
August
September
October
November
December
T22 2,940
3,220
3,270
3,470
3,680
3,660
3,620
3,760
3,690
3,910
3,890
4,040
US-64 Ramp Toll Zones2014 Average Weekday Toll Transactions
Figure24
NMap Not to Scale
Map Locator
70
55
40
64
1
540
54
40
540
147
440
540TOLL
NMap Not to Scale
540
TOLL
Toll Rates
2 AXLES
3 AXLES
4+ AXLES
$0.86
$1.72
$3.44
$1.32
$2.64
$5.28
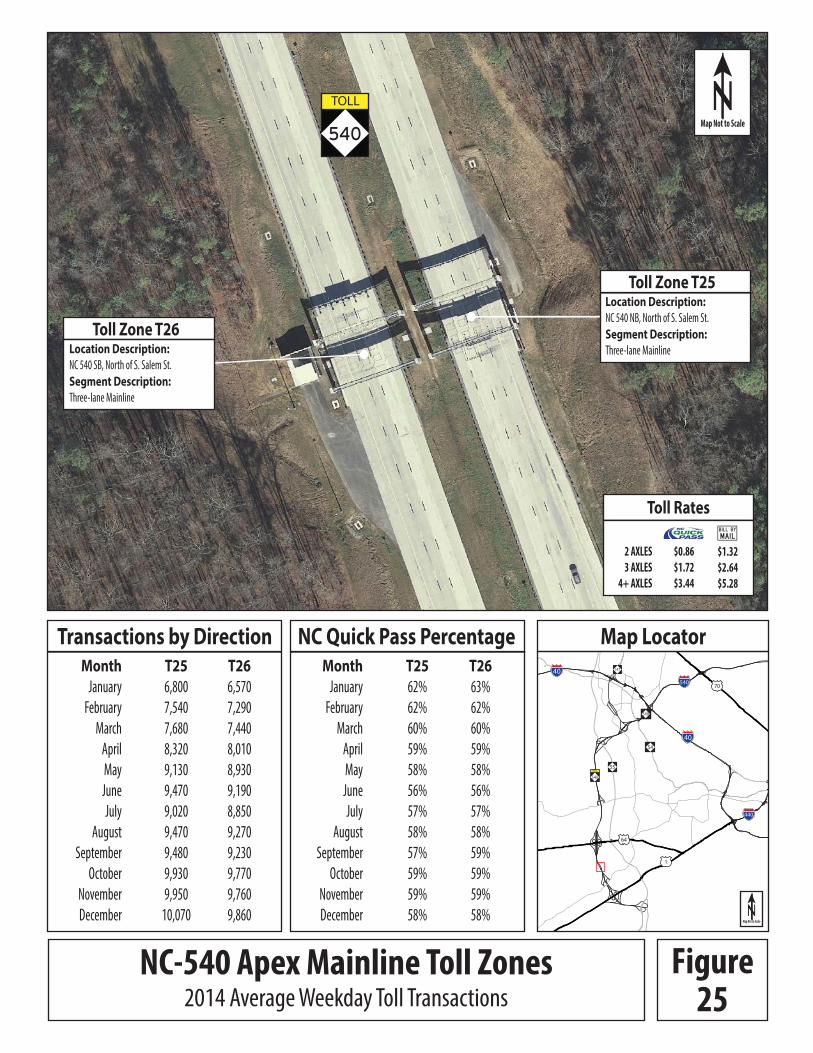
Toll Zone T25Location Description:NC 540 NB, North of S. Salem St.
Segment Description:Three-lane Mainline
Toll Zone T26Location Description:NC 540 SB, North of S. Salem St.
Segment Description:Three-lane Mainline
T2562%
62%
60%
59%
58%
56%
57%
58%
57%
59%
59%
58%
MonthJanuary
February
March
April
May
June
July
August
September
October
November
December
T2663%
62%
60%
59%
58%
56%
57%
58%
59%
59%
59%
58%
NC Quick Pass PercentageTransactions by DirectionT25
6,800
7,540
7,680
8,320
9,130
9,470
9,020
9,470
9,480
9,930
9,950
10,070
MonthJanuary
February
March
April
May
June
July
August
September
October
November
December
T26 6,570
7,290
7,440
8,010
8,930
9,190
8,850
9,270
9,230
9,770
9,760
9,860
NC-540 Apex Mainline Toll Zones2014 Average Weekday Toll Transactions
Figure25
NMap Not to Scale
Map Locator
70
55
40
64
1
540
54
40
540
147
440
540TOLL
NMap Not to Scale
540
TOLL
Toll Rates
2 AXLES
3 AXLES
4+ AXLES
$0.22
$0.44
$0.88
$0.33
$0.66
$1.32
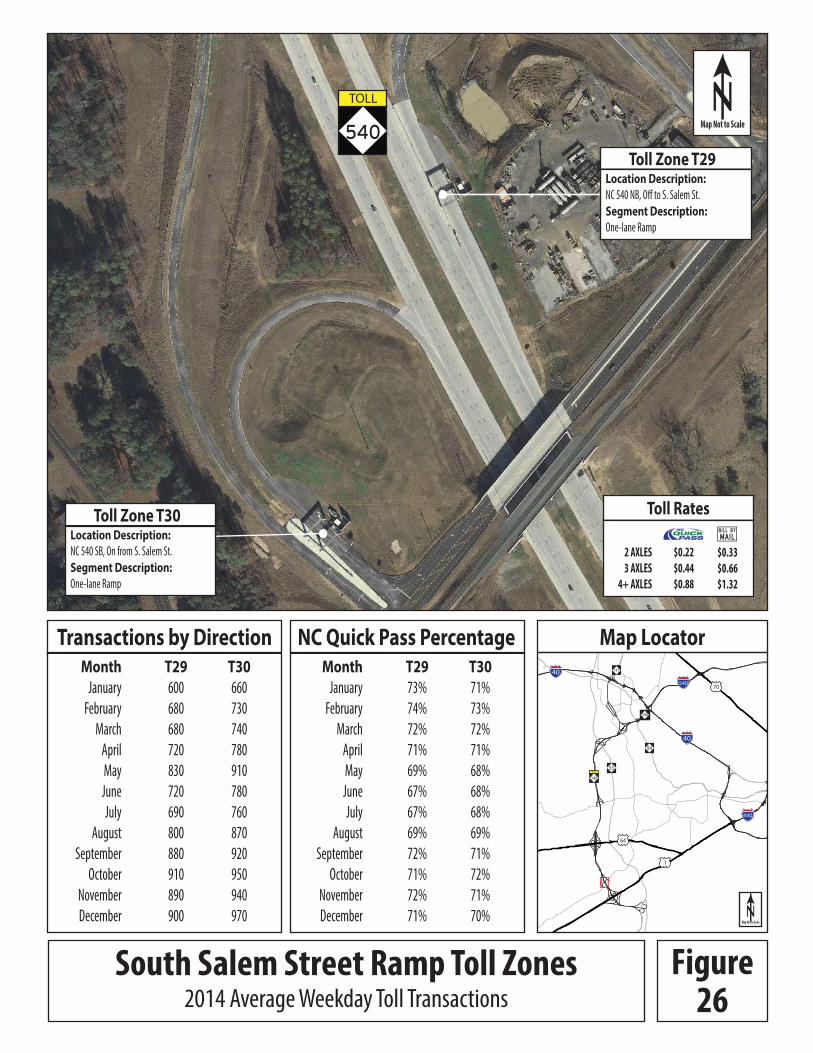
Toll Zone T29Location Description:NC 540 NB, Off to S. Salem St.
Segment Description:One-lane Ramp
Toll Zone T30Location Description:NC 540 SB, On from S. Salem St.
Segment Description:One-lane Ramp
T2973%
74%
72%
71%
69%
67%
67%
69%
72%
71%
72%
71%
MonthJanuary
February
March
April
May
June
July
August
September
October
November
December
T3071%
73%
72%
71%
68%
68%
68%
69%
71%
72%
71%
70%
NC Quick Pass PercentageTransactions by DirectionT29 600
680
680
720
830
720
690
800
880
910
890
900
MonthJanuary
February
March
April
May
June
July
August
September
October
November
December
T30 660
730
740
780
910
780
760
870
920
950
940
970
South Salem Street Ramp Toll Zones2014 Average Weekday Toll Transactions
Figure26
NMap Not to Scale
Map Locator
70
55
40
64
1
540
54
40
540
147
440
540TOLL
NMap Not to Scale
540
TOLL
Toll Rates
2 AXLES
3 AXLES
4+ AXLES
$0.36
$0.72
$1.44
$0.55
$1.10
$2.20
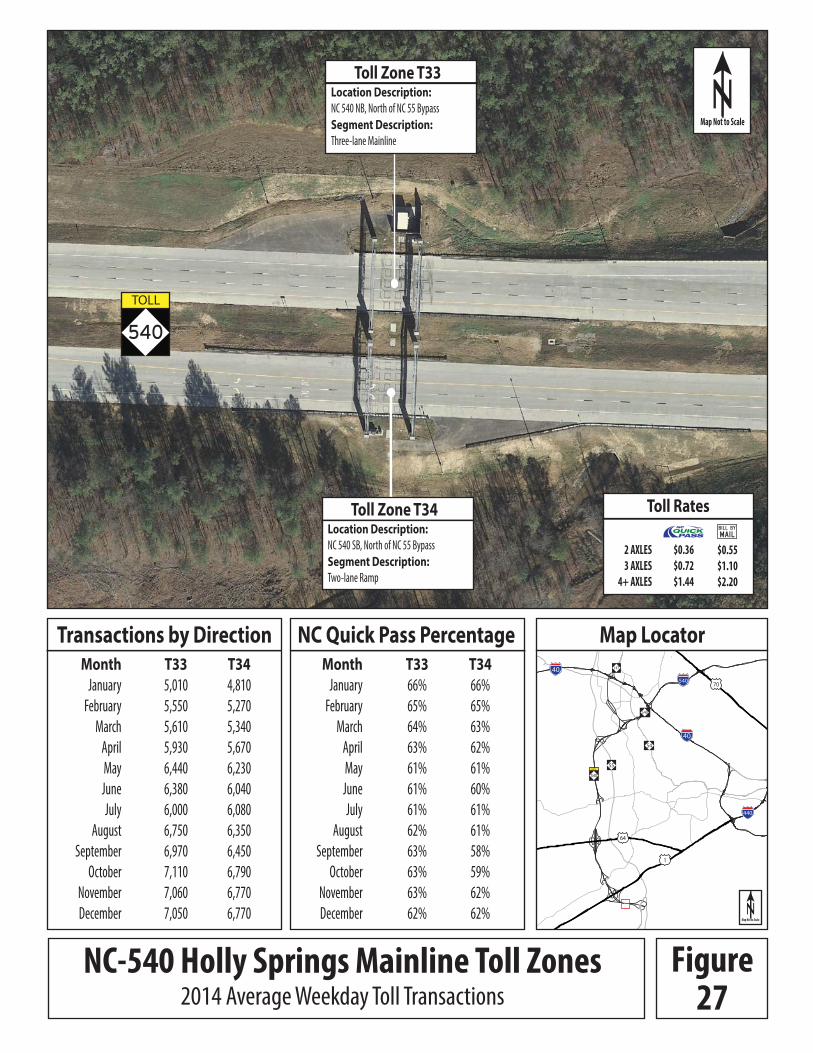
Toll Zone T34Location Description:NC 540 SB, North of NC 55 Bypass
Segment Description:Two-lane Ramp
Toll Zone T33Location Description:NC 540 NB, North of NC 55 Bypass
Segment Description:Three-lane Mainline
T3366%
65%
64%
63%
61%
61%
61%
62%
63%
63%
63%
62%
MonthJanuary
February
March
April
May
June
July
August
September
October
November
December
T3466%
65%
63%
62%
61%
60%
61%
61%
58%
59%
62%
62%
NC Quick Pass PercentageTransactions by DirectionT33
5,010
5,550
5,610
5,930
6,440
6,380
6,000
6,750
6,970
7,110
7,060
7,050
MonthJanuary
February
March
April
May
June
July
August
September
October
November
December
T34 4,810
5,270
5,340
5,670
6,230
6,040
6,080
6,350
6,450
6,790
6,770
6,770
NC-540 Holly Springs Mainline Toll Zones2014 Average Weekday Toll Transactions
Figure27
NMap Not to Scale
Map Locator
70
55
40
64
1
540
54
40
540
147
440
540TOLL
NMap Not to Scale
44
Roadway Operations Statistics
Operations Statistics Report for the Triangle Expressway
2014 Fourth Quarter and Annual Report
45
ROADWAY OPERATIONS STATISTICS Operations statistics are collected by NCTA State Highway Patrol (SHP) and Incident Management Assistance Patrol (IMAP) for the NCTA Toll Safety Patrol program. This program consists of dedicated State Highway Patrol and Incident Management Assistance Patrol, which provides one Highway Patrol officer and one IMAP responder to the facility at all times from Monday through Friday. This section also presents response and traffic information for incidents that occurred during 2014. The Turnpike Authority manages traffic and activities along the Triangle Expressway at the state-of-the-art Traffic Management Center located in the North Carolina National Guard’s Joint Force Headquarters in Raleigh. Highly trained operators monitor the entire length of the Triangle Expressway via closed-circuit TV, microwave speed detectors and interoperable 800MHz radio dispatch from local 911 and statewide Highway Patrol communications, as well as the Turnpike Authority’s security cameras and Roadway Weather Information System. More than 200 cameras are located along the Expressway to monitor traffic operations, ensure security of the toll gantries and collect license plate images used for Bill-by-Mail toll collection. Operators monitor the roadside technology and toll facilities and are able to quickly dispatch maintenance personnel to address any equipment issues or roadway traffic incidents. Roadway updates are provided to motorists via 10 full-color Dynamic Message Boards (the first full-color message boards in the state), as well as through NCDOT’s 511 system and Traveler Information Management System (TIMS) website. The Triangle Expressway also has contracted Highway Patrol officers and a dedicated Incident Management Assistance Patrol (IMAP) that can be dispatched to respond to any incidents that occur, ranging from disabled motorists and debris to major traffic wrecks that could be detrimental to both motorist safety and toll collection.
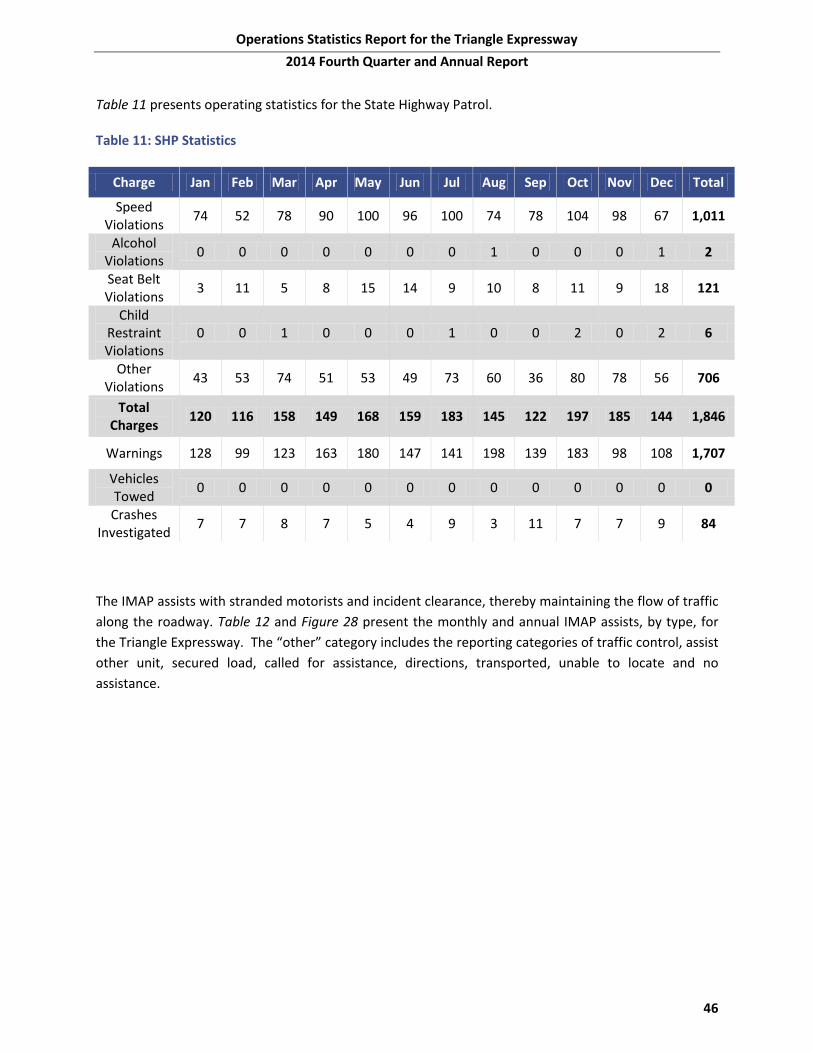
Operations Statistics Report for the Triangle Expressway
2014 Fourth Quarter and Annual Report
46
Table 11 presents operating statistics for the State Highway Patrol.
Table 11: SHP Statistics
Charge Jan Feb Mar Apr May Jun Jul Aug Sep Oct Nov Dec Total
Speed Violations
74 52 78 90 100 96 100 74 78 104 98 67 1,011
Alcohol Violations
0 0 0 0 0 0 0 1 0 0 0 1 2
Seat Belt Violations
3 11 5 8 15 14 9 10 8 11 9 18 121
Child Restraint Violations
0 0 1 0 0 0 1 0 0 2 0 2 6
Other Violations
43 53 74 51 53 49 73 60 36 80 78 56 706
Total Charges
120 116 158 149 168 159 183 145 122 197 185 144 1,846
Warnings 128 99 123 163 180 147 141 198 139 183 98 108 1,707
Vehicles Towed
0 0 0 0 0 0 0 0 0 0 0 0 0
Crashes Investigated
7 7 8 7 5 4 9 3 11 7 7 9 84
The IMAP assists with stranded motorists and incident clearance, thereby maintaining the flow of traffic
along the roadway. Table 12 and Figure 28 present the monthly and annual IMAP assists, by type, for
the Triangle Expressway. The “other” category includes the reporting categories of traffic control, assist
other unit, secured load, called for assistance, directions, transported, unable to locate and no
assistance.
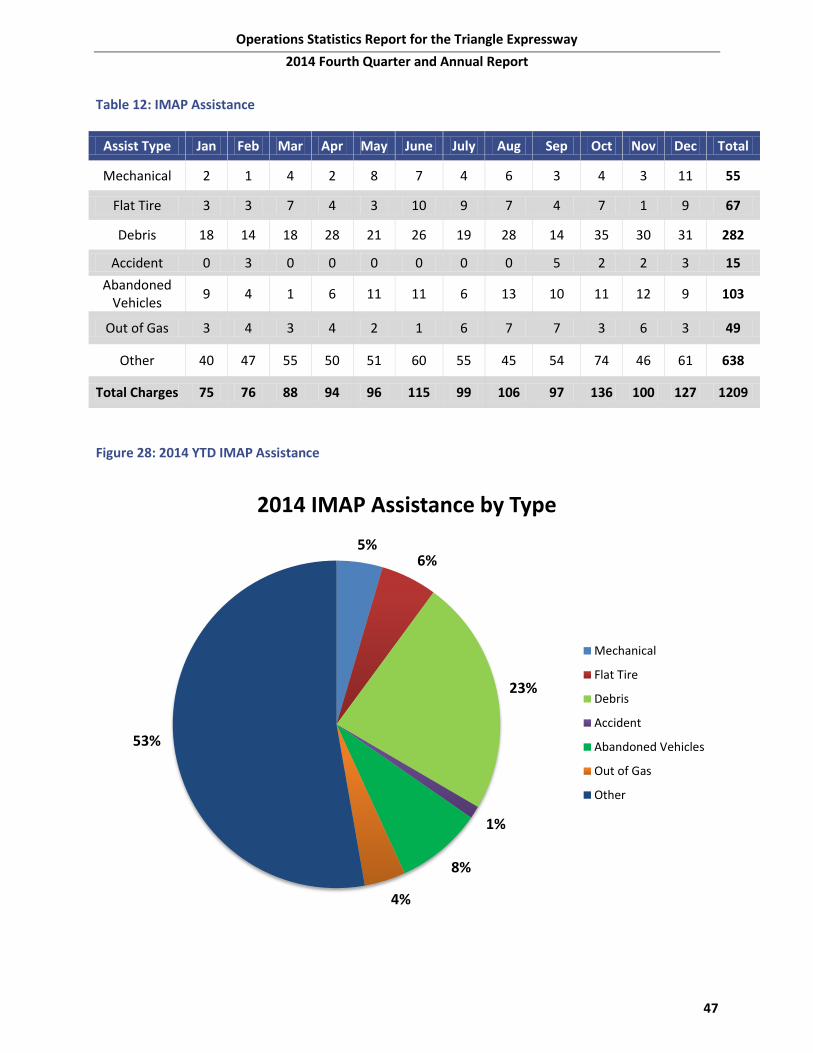
Operations Statistics Report for the Triangle Expressway
2014 Fourth Quarter and Annual Report
47
Table 12: IMAP Assistance
Assist Type Jan Feb Mar Apr May June July Aug Sep Oct Nov Dec Total
Mechanical 2 1 4 2 8 7 4 6 3 4 3 11 55
Flat Tire 3 3 7 4 3 10 9 7 4 7 1 9 67
Debris 18 14 18 28 21 26 19 28 14 35 30 31 282
Accident 0 3 0 0 0 0 0 0 5 2 2 3 15
Abandoned Vehicles
9 4 1 6 11 11 6 13 10 11 12 9 103
Out of Gas 3 4 3 4 2 1 6 7 7 3 6 3 49
Other 40 47 55 50 51 60 55 45 54 74 46 61 638
Total Charges 75 76 88 94 96 115 99 106 97 136 100 127 1209
Figure 28: 2014 YTD IMAP Assistance
5% 6%
23%
1%
8%
4%
53%
2014 IMAP Assistance by Type
Mechanical
Flat Tire
Debris
Accident
Abandoned Vehicles
Out of Gas
Other
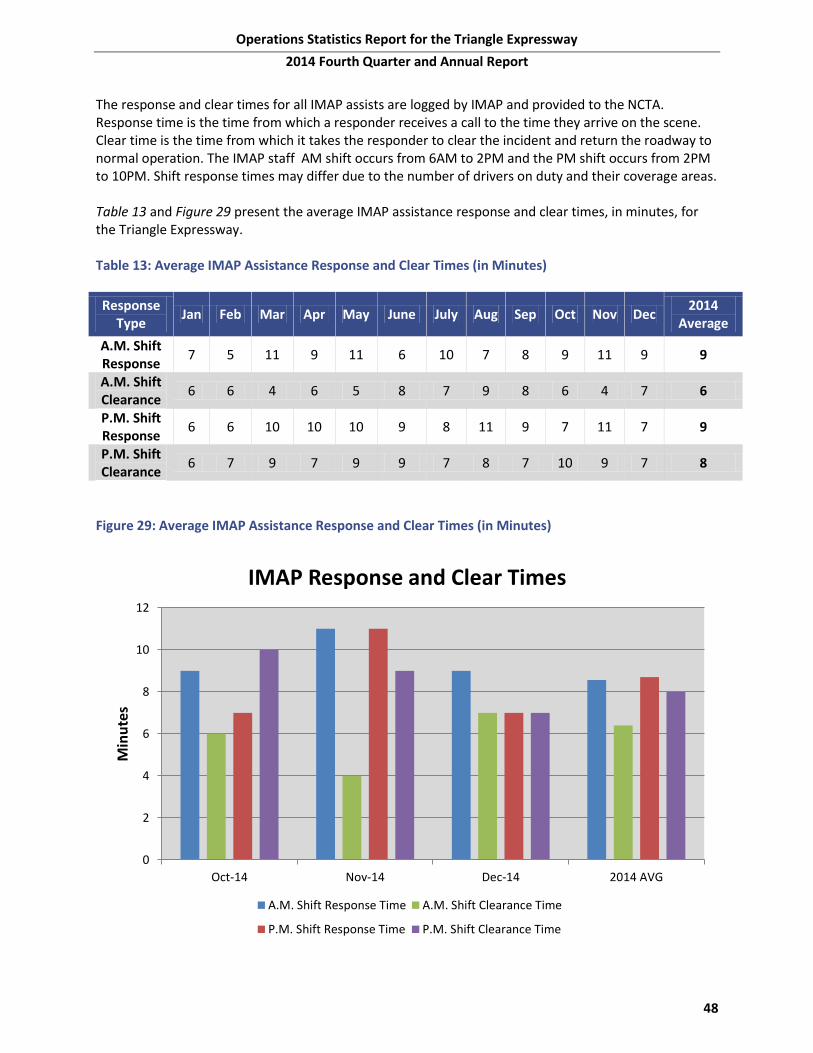
Operations Statistics Report for the Triangle Expressway
2014 Fourth Quarter and Annual Report
48
The response and clear times for all IMAP assists are logged by IMAP and provided to the NCTA. Response time is the time from which a responder receives a call to the time they arrive on the scene. Clear time is the time from which it takes the responder to clear the incident and return the roadway to normal operation. The IMAP staff AM shift occurs from 6AM to 2PM and the PM shift occurs from 2PM to 10PM. Shift response times may differ due to the number of drivers on duty and their coverage areas. Table 13 and Figure 29 present the average IMAP assistance response and clear times, in minutes, for the Triangle Expressway. Table 13: Average IMAP Assistance Response and Clear Times (in Minutes)
Response Type
Jan Feb Mar Apr May June July Aug Sep Oct Nov Dec 2014
Average
A.M. Shift Response
7 5 11 9 11 6 10 7 8 9 11 9 9
A.M. Shift Clearance
6 6 4 6 5 8 7 9 8 6 4 7 6
P.M. Shift Response
6 6 10 10 10 9 8 11 9 7 11 7 9
P.M. Shift Clearance
6 7 9 7 9 9 7 8 7 10 9 7 8
Figure 29: Average IMAP Assistance Response and Clear Times (in Minutes)
0
2
4
6
8
10
12
Oct-14 Nov-14 Dec-14 2014 AVG
Min
ute
s
IMAP Response and Clear Times
A.M. Shift Response Time A.M. Shift Clearance Time
P.M. Shift Response Time P.M. Shift Clearance Time
49
Roadway Maintenance Statistics
Operations Statistics Report for the Triangle Expressway
2014 Fourth Quarter and Annual Report
50
ROADWAY MAINTENANCE STATISTICS This section outlines the NCTA Maintenance Rating Program (MRP), which is a maintenance evaluation program for roadway features and toll facilities on the NCTA system. MRP is a comprehensive planning, measuring, and managing process that provides a means for communicating to managers, stakeholders and key customers the impacts of policy and budget decisions on program service delivery. Using outcome-based performance measures and the service level scale (0 through 100), the survey results are rated against established threshold criteria. The program analysis is accomplished through the use of sampling procedures that capture the level of service being provided for individual asset features. Over time, these ratings will then be charted to identify work needs and subsequent necessary actions. The evaluations are based on the establishment of "threshold" conditions that quantify the maximum defect allowed to exist for a characteristic before it is considered unacceptable. The NCTA performance standards, threshold criteria and maintenance rating program were developed through a collaborative effort by NCTA managers, NCDOT maintenance staff, and consultants. Using field survey information, a maintenance matrix can be developed to show the relationship between maintenance activities and the characteristics of various roadway features. The purpose of this evaluation is to provide information that will be used to schedule and prioritize routine maintenance activities and provide uniform maintenance conditions that meet established objectives.
Assessment Schedule As part of the NCTA MRP, a “baseline” assessment was scheduled to be completed for each newly opened roadway section, soon after opening to toll collection. The baseline assessments included complete inventory data collection and assessment on 100% of the roadway assets. After the initial baseline assessment was completed, future assessments for that segment switched over to a statistical sampling assessment. Inspections are performed during the months of February, May, August, and November to account for dynamic changes in assets during the various seasons. These inspections are accomplished through the use of statistically valid, random sampling procedures that capture the level of service for individual assets with a 95% confidence level in sampling.
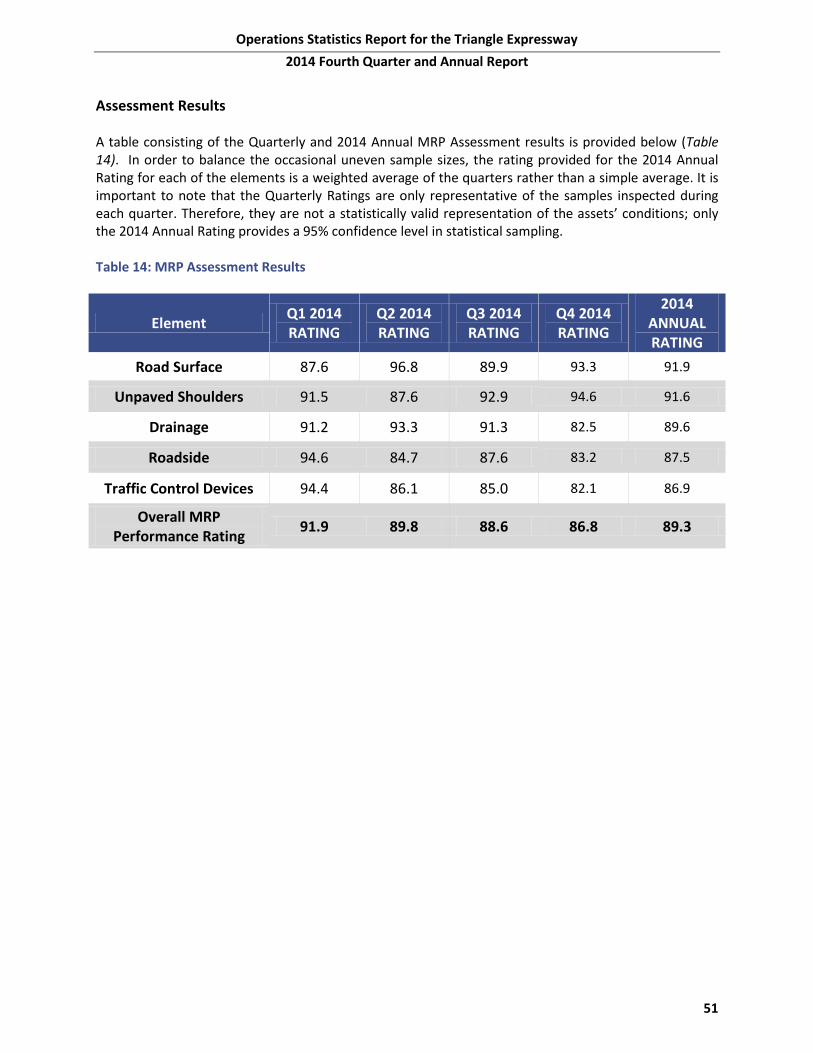
Operations Statistics Report for the Triangle Expressway
2014 Fourth Quarter and Annual Report
51
Assessment Results A table consisting of the Quarterly and 2014 Annual MRP Assessment results is provided below (Table 14). In order to balance the occasional uneven sample sizes, the rating provided for the 2014 Annual Rating for each of the elements is a weighted average of the quarters rather than a simple average. It is important to note that the Quarterly Ratings are only representative of the samples inspected during each quarter. Therefore, they are not a statistically valid representation of the assets’ conditions; only the 2014 Annual Rating provides a 95% confidence level in statistical sampling. Table 14: MRP Assessment Results
Element Q1 2014 RATING
Q2 2014 RATING
Q3 2014 RATING
Q4 2014 RATING
2014 ANNUAL RATING
Road Surface 87.6 96.8 89.9 93.3 91.9
Unpaved Shoulders 91.5 87.6 92.9 94.6 91.6
Drainage 91.2 93.3 91.3 82.5 89.6
Roadside 94.6 84.7 87.6 83.2 87.5
Traffic Control Devices 94.4 86.1 85.0 82.1 86.9
Overall MRP Performance Rating
91.9 89.8 88.6 86.8 89.3