Embed Size (px)
Citation preview

Operations & Finance

Operations
Meals Served per day
FY11 FY12 FY13 FY14
Breakfast 5608 5363 5149 5925
Lunch 18149 17219 16814 16343
Eligible Students 21840 22400 22400 22680
0
5000
10000
15000
20000
25000
78% 80% 80% 81%

Transportation
# Buses # Routes # Drivers
2011 279 241 290
2012 269 220 271
2013 272 228 266
2014 272 221 254
0
50
100
150
200
250
300
350

Transportation
Routes per bus Riders per bus Ride Time
2011 37 21.5
2012 4.3 43 22
2013 4.56 41 19
2014 4.56 41 22
0
5
10
15
20
25
30
35
40
45
50

Transportation
Students Transported Miles per Accident Fleet Miles per Bus
2011 22424 79848 101250
2012 20112 83729 116067
2013 19465 91277 112064
2014 20331 77450 118021
0
20000
40000
60000
80000
100000
120000
140000

Transportation
Total miles driven Yearly Diesel Cost
2011 4,152,088.00 $2,164,174.00
2012 3,684,075.00 $2,110,645.00
2013 3,651,085.00 $2,153,953.00
2014 3,409,088.00 $2,050,656.00
-
500,000.00
1,000,000.00
1,500,000.00
2,000,000.00
2,500,000.00
3,000,000.00
3,500,000.00
4,000,000.00
4,500,000.00

Square Footage: 4,602,338
Elementary, 1,929,943
Middle, 1,163,476
High, 1,150,552
Other, 538,367

Utilities Costs
$-
$500,000.00
$1,000,000.00
$1,500,000.00
$2,000,000.00
$2,500,000.00
$3,000,000.00
$3,500,000.00
$4,000,000.00
Natural Gas Electricity
FY10 FY11 FY12 FY13 FY14

Capital Plan Costs:School Construction
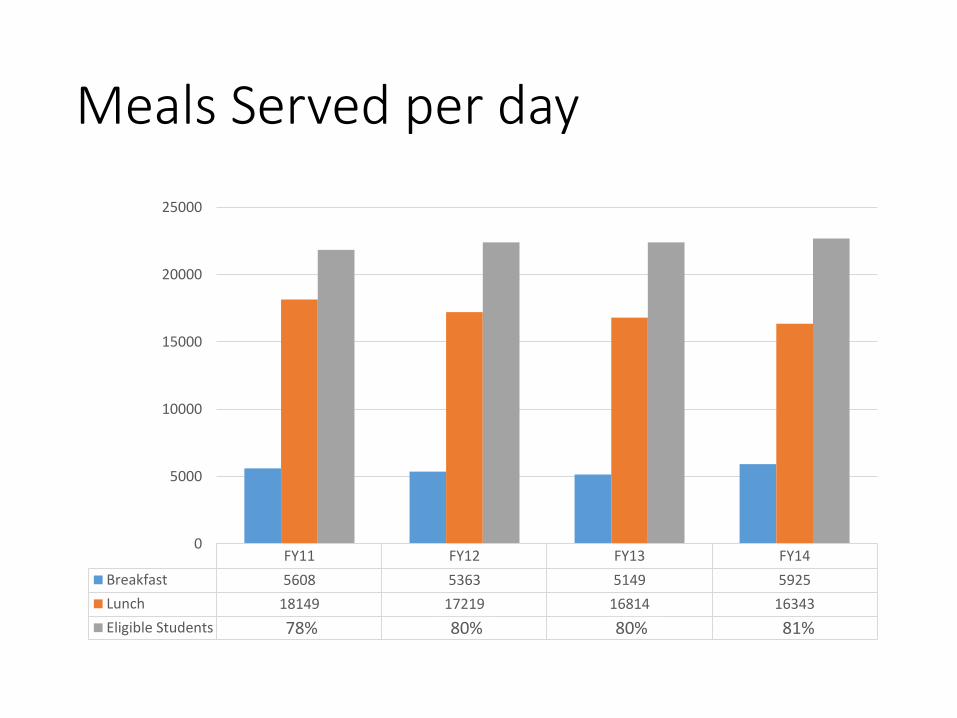
Capital Plan Costs: Additional
• Escalataion and Contingency: 17.7M
• Demolition: 4M
• Furniture: 4M
• Management, Fees: 7.4M
• Land Acquisition: 1.1M

Maintenance Work Orders Closed
-
2,000
4,000
6,000
8,000
10,000
12,000
14,000
16,000
2010 2011 2012 2013 2014

IT Network Users Accounts: 35,344
0
5,000
10,000
15,000
20,000
25,000
30,000
35,000
40,000

IT: PC Count (Spring 2014)
• Computers: 4850• 2006: 1250
• 2007: 300
• 2008: 450
• 2009: 350
• 2011: 1600
• 2013: 900
• 2014: 750
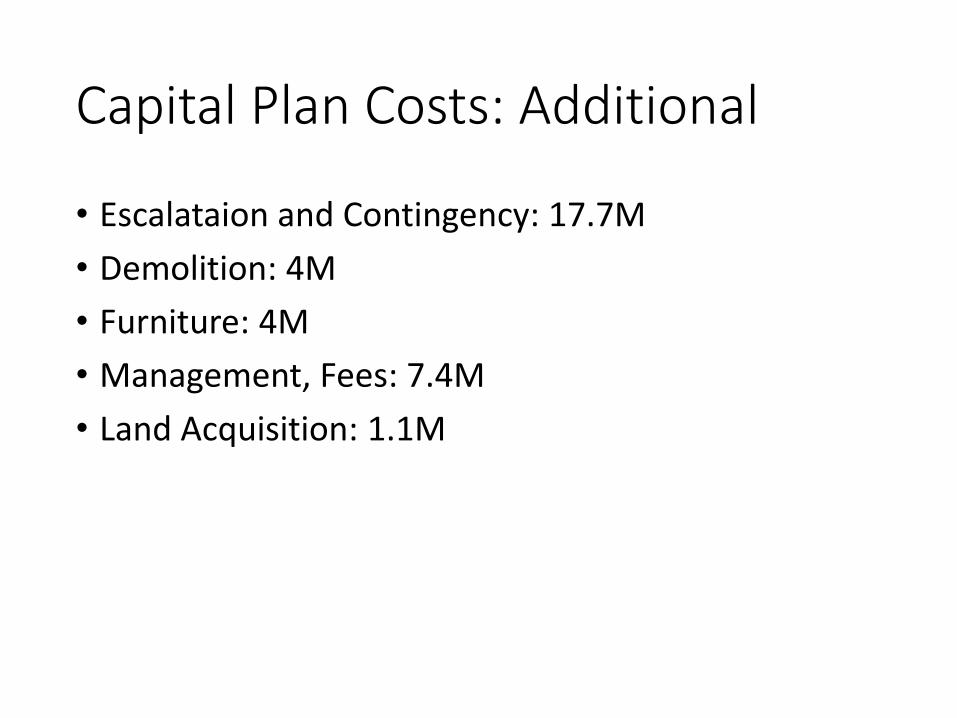
IT Major Applications
• Eschool: Student Information System
• Business Plus: Business Information System
• IEP Plus: Special Education Document System
• Performance Plus: Student Assessment Management System
• Discovery Education: Student Curriculum & Assessment
• Destiny: Library Management System
• Scholastic SAM: Student Curriculum & Assessment
• Timepiece: Employee Time Tracking
• SmartFind Express: Employee Substitute System
• Sharepoint: Website and Intranet
• Microsoft Office: Document Creation
• Office 365: Cloud Document Creation (Google Drive in testing)

IT Major Areas of Audit Findings
• 2014 Audit Suggested:
1. Utilize improved planning and collaboration for projects involving IT, including total cost of ownership (purchase, deployment, support, retirement).
2. Eliminate Single Points of Failure to increase network reliability.
3. Execute Lifecycle Management and Refresh schedule to ensure up to date technology can be utilized and support staff can be more efficiently deployed.

RPS vs. Council for Greater City Schools
Key Indicator CGCS Min CGCS Max CGCS Median RPS
Helpdeskstaffing cost per ticket
$2.44 $87.40 $14.18 $13.21
Average age of Computers (years)
1.4 5.52 3.8 4.11

Finance
Budget =
Instructional plan for
Rockford Public
Schools expressed
in dollars and cents.
Through the plan, all
stakeholders should
be able to clearly
see the district’s
priorities for
educating children.
FY 2015 has to be poised to address:
Instructional investments that lend to better
outcomes for children.
Incremental inflationary ‘cost of business’ activity.
Needed facility improvements.
Uncertainty surrounding state revenue projections.
Continued impact of the sunset of .58 Kids Win Tax.

Year Rating Issuer2011 A+ Standard & Poor's Rating Agency2012 A+ Standard & Poor's Rating Agency2013 AA- Standard & Poor's Rating Agency
S&P noted that the upgrade was the result of strong financial performance and a very strong level of reserves.
RPS205 Bond Rating- i.e. Credit Score

RPS205 Financial Profile- ISBE
1.00
1.50
2.00
2.50
3.00
3.50
4.00
4.50
2008 2009 2010 2011 2012 2013
Perfect Score RPS205
Financial ProfileISBE Perfect Score vs. RPS205
FY Perfect Score RPS205
2008 4.00 3.80
2009 4.00 3.80
2010 4.00 3.55
2011 4.00 3.90
2012 4.00 3.90
2013 4.00 3.70

RPS205- Awards & Presentations
Fiscal Year Awards & Recognition Issued By
2009 Certificate of Excellence in Financial Reporting ASBO International
2010 Certificate of Excellence in Financial Reporting ASBO International
2011 Certificate of Excellence in Financial Reporting ASBO International
2012 Certificate of Excellence in Financial Reporting ASBO International
2013 Certificate of Excellence in Financial Reporting ASBO International
2014 Meritorious Budget Award ASBO International
The awards show our continuing commitment and pursuit of
transparency. The awards create a great amount of additional work, but
also help build public trust.

RPS205- Per Pupil Spending (Multi Year)
$5,600
$5,800
$6,000
$6,200
$6,400
$6,600
$6,800
$7,000
$7,200
FY 09 FY 10 FY 11 FY 12
District
State
Instructional Expenditures- Per Pupil (RPS205 vs. State)
Instr/PupilFiscal Year FY 09 FY 10 FY 11 FY 12 FY 13 FY 14- Est. FY 15- Est.District $ 6,196 $ 6,586 $ 7,015 $ 6,249 $ 6,440 $ 7,200 $ 7,267 State $ 6,483 $ 6,773 $ 6,824 $ 6,974 Unknown Unknown Unknown
FY 12 was the year
the district braced
for major funding
reductions based on
warnings from the
ISBE.

RPS205- Per Pupil Spending (Multi Year), cont’d
OE/Pupil
Fiscal Year FY 09 FY 10 FY 11 FY 12 FY 13 FY 14- Est. FY 15- Est.
District $ 10,615 $ 11,281 $ 11,763 $ 11,046 $ 11,246 $ 12,128 $ 14,603
State $ 11,197 $ 11,537 $ 11,664 $ 11,842 Unknown Unknown Unknown
$10,000
$10,200
$10,400
$10,600
$10,800
$11,000
$11,200
$11,400
$11,600
$11,800
$12,000
FY 09 FY 10 FY 11 FY 12
District
State
Operating Expenditure- Per Pupil (RPS205 vs. State)
FY 12 was the year
the district braced
for major funding
reductions based on
warnings from the
ISBE.

RPS205- Investments in Facilities (Multi Year)
$-
$10,000,000
$20,000,000
$30,000,000
$40,000,000
$50,000,000
$60,000,000
2008 2009 2010 2011 2012 2013 2014 2015
Rockford Public School District 205Construction SpendingMulti Year Investment

Forecasting Variables

EQUALIZED ASSESSED VALUATION- HISTORY
2,068,737,323.00
2,159,780,261.00
2,258,775,651.002,296,862,824.00
2,449,817,819.00
2,602,325,876.00
2,752,038,763.00
2,848,246,719.002,834,165,355.00
2,738,980,854.00
2,589,228,659.00
2,353,996,102.00
2,145,488,420.00
2,029,041,516.00
$1,500,000,000
$2,000,000,000
$2,500,000,000
$3,000,000,000
Equalized Assessed Valuation- 12 Year History

RPS 205- TAX RATE vs. TAX RATE WITH NO ABATEMENT

$120,000,000
$130,000,000
$140,000,000
$150,000,000
$160,000,000
$170,000,000
$180,000,000
2003 2004 2005 2006 2007 2008 2009 2010 2011 2012 2013 Est.
RPS205- PROPERTY TAX REVENUE- CALENDAR YEAR
RPS205 is currently collecting property tax revenue at calendar year 2007 levels.
No other LEA in our area can make this claim.
PROPERTY TAX REVENUE- HISTORY

$-
$20,000,000
$40,000,000
$60,000,000
$80,000,000
$100,000,000
$120,000,000
$140,000,000
$160,000,000
FY 11 Actual FY12 Actual FY 13 Actual FY 14 Budget FY 15 Budget
State revenue uncertainty continues to be a major budget risk.
FY 13 simply reflects monies due in FY 12 but received in FY 13.
STATE FUNDING- MULTI YEAR

$140,000,000
$145,000,000
$150,000,000
$155,000,000
$160,000,000
$165,000,000
$170,000,000
$175,000,000
$180,000,000
$185,000,000
$190,000,000
FY 11 Actual FY 12 Actual FY 13 Actual FY 14 Actual FY 15 Budget
RPS205- Salary Trend (Multi Year)
FY 12 was the year the district braced for major
funding reductions based on warnings from the ISBE.
FY 13 was the first year for restoring the 7th period day.
RPS205- Salary Expenditure (Multi Year)

FY 15 Health care expenditures are expected to trend closely to FY 14.
$0
$10,000,000
$20,000,000
$30,000,000
$40,000,000
$50,000,000
$60,000,000
FY09 FY10 FY11 FY12 FY13 FY14 Forecast FY15 Budget
Rockford Public School District 205
Net Healthcare Costs
Includes Employee Contributions
HEALTH CARE COST- MULTI YEAR

RPS vs. Council for Greater City Schools
Key Indicator CGCS Min CGCS Max CGCS Median RPS
Cost per invoice
$1.8 $22.62 $5.59 $5.15
Cost per $1,000 payroll dollars
$.57 $2.46 $1.47 $2.06
Purchasing cost per procurement $ spent
0.08% 4.98% 0.50% 0.42%