Embed Size (px)
Citation preview

33rd International North Sea Flow Measurement Workshop 20 - 23 October 2015
Technical paper
1
Operational experiences with the
EuroLoop Liquid Hydrocarbon Flow Facility
Jos G.M. van der Grinten, NMi EuroLoop
Bart van der Stap, Flowways
Dick van Driel, Krohne
Abstract
The operational experiences obtained during the calibration of several types of liquid flow
meter clearly demonstrate EuroLoop’s ability to test the viscosity dependent performance
of these instruments. The temperature as observed during a series of successive runs
recorded at a constant flow rate, demonstrates a stability that is a factor 50 better than
originally specified.
Extension of a previous intercomparison between the EuroLoop and Trapil facilities using
an 8” 7 path ultrasonic transfer flow meter and EuroLoop’s small prover [2] was extended
using the big prover. All 19 results match a normalized deviation . For 16 results
.
Sample analysis performed at two independent laboratories as part of EuroLoop’s
metrological maintenance, reveals a significant viscosity difference for the lowest and
highest viscosity liquids. The density of the samples agrees within their mutual
uncertainties, which is important for mass flow measurements.
1. Introduction
For most types of liquid flow meters for custody transfer purposes like ultrasonic flow
meters, turbine meters and coriolis flow meters, the performance is depending on the
Reynolds number dependent velocity profile or on the liquid viscosity directly. Also the
factor of Dp devices like orifices, nozzles and Venturis, is depending on the Reynolds
number and therefore on the viscosity as well.
The EuroLoop Liquid Hydrocarbon Flow Facility operates on three different liquid
viscosities – 1, 10 and 100 mm²/s (centi-Stokes, cSt) – covering a large range of Reynolds
numbers (approximately 1·103 – 4·106). The rationale behind the construction of EuroLoop
is that calibration of a flow meter using different liquid viscosities gives the user of the
meter insight on the viscosity dependent performance of the meter. For the manufacturer
this knowledge enables him to compensate for the different flow profiles or different
viscosities in the meter electronics. In addition EuroLoop can operate at a very constant
liquid temperature which will keep the viscosity constant as well. This is extremely
important for the calibration of turbine meters, where the calibration needs to be
performed with a constant viscosity over the entire range of flow rates.

33rd International North Sea Flow Measurement Workshop 20 - 23 October 2015
Technical paper
2
NMi EuroLoop operates the facility and is responsible for the metrological performance.
The design of the facility was described earlier [2]. Accreditation is in the process of being
acquired [1] and the first round robin tests have been performed [2]. All calibration
certificates are issued by NMi EuroLoop. Maintenance is done by Krohne, the designer and
constructor of the facility. The actual specifications of the facility are shown in the table
below.
After years of construction and testing the current paper gives an anthology of operational
experiences obtained during calibrations using the EuroLoop Liquid Hydrocarbon Flow
Facility and its metrological maintenance.
Table 1: Specifications of the EuroLoop Liquid Hydrocarbon Flow Facility
Small circuits Large circuits
Flow 10 – 1 200 m3/h 30 – 5 000 m3/h
Dimensions of meters 4” – 12” (100 – 300 mm) 12” – 30” (300 – 750 mm)
Flanges and pressure classes ANSI 150, PN 10 ANSI 150, PN 10
Kinematic viscosity 1, 10, 100 mm2/s (cSt) 1, 10, 100 mm2/s (cSt)
Temperature stability Better than 0.1 °C Better than 0.1 °C
Maximum back pressure 12 bar(g) 12 bar(g)
Overall uncertainty volume by piston / master 0.02% / 0.06% 0.02% / 0.06%
Overall uncertainty mass by piston / master 0.04% / 0.07% 0.04% / 0.07%
2. Description of facility
Each circuit, schematically displayed in Fig. 1, is split between a small and a large diameter
loop. The temperature increase, resulting from the work exerted on the liquid by the
pumps, is reduced by a cooling system using water. A back pressure of 6 – 9 bar(g) avoids
cavitation in the liquid. If necessary, e.g. during the calibration of Venturi tubes, the back
pressure can increased to 12 bar(g) to avoid cavitation in the throat of the Venturi. In that
case operation has to be performed with great caution as safety valves open at 12.5 bar.
The primary references for calibration consist of a large piston prover and a small piston
prover, which are both operated on all three liquids. The secondary references are master
meters, which is a combination of an upstream monitoring full bore and downstream
reduced bore ultrasonic meter.
The temperature in each circuit is monitored by fast ultrasonic sensors that measure the
average temperature in a cross section of the pipe without disrupting the flow pattern. The
ultrasonic temperature sensor is combined with an upstream pressure transmitter and a
downstream Pt100. If the liquid properties change the readings of the ultrasonic
temperature measurement and the Pt100 will start to deviate. In this way the operator is
triggered to have the liquids analyzed again. In addition the operator has a diagnostic tool
for checking the liquid homogeneity.

33rd International North Sea Flow Measurement Workshop 20 - 23 October 2015
Technical paper
3
Fig. 1:. Schematic drawing of the EuroLoop Liquid Hydrocarbon Flow Facility. One circuit is shown, the
others are identical. The piston provers are shared by all three circuits.
Each calibration starts with the specification of the calibration set-up. For the small circuits
24 meter straight length is available, for the large circuits 28 meter is available. In each
configuration sufficient length is planned behind flow disturbances, like reducers or
expanders. Before the start of the calibration all air and vapours are eliminated from the
circuits and leak tests are performed. The liquid is homogenized, which is tested by the
ultrasonic temperature measurements in the circuits. The last step in the preparation is an
integrity check of the system. For each calibration there is a choice to use only the master
meters as reference, or to use both master meters and piston prover. The latter option
guaranties a substantially lower uncertainty, but requires more time.
The calibration itself starts with temperature equalization by circulating the liquid at a
flowrate above 0.5 . The calibration flow rates and repeats can be performed according
to API MPMS, OIML R117 or client wishes.

33rd International North Sea Flow Measurement Workshop 20 - 23 October 2015
Technical paper
4
3. Traceability
The traceability of the EuroLoop Liquid Hydrocarbon Flow Facility is schematically shown
in Fig. 2. The piston provers are directly traceable to length, the master meters are traceable
to the piston provers and the meter under test is traceable to either the master meters or
the piston provers. A more elaborate description on the traceability of EuroLoop was
discussed in an earlier paper [2].
Fig. 2: Traceability chain of the EuroLoop Liquid Hydrocarbon Flow Facility.
4. Metrological maintenance
Part of the metrological maintenance is the regular determination of the density and the
kinematic viscosity of all three liquids. The density and kinematic viscosity are obtained
from analyzing samples from the test fluids. For this purpose we use two labs. A test
laboratory is located close to EuroLoop and performs routine tests according to the
appropriate ASTM standards [3][4]. Test results are available with 24 hours. The lab has an
ISO 9001 certificate but does not hold an ISO 17025 accreditation. The calibration
laboratory holds and ISO 17025 accreditation for viscosity, however the accredited density
is outside the range we need at EuroLoop. This lab is further away and delivery times are
between one and three weeks. Both laboratories obtain their traceability from reference
liquids that are externally purchased from an ISO 17025 accredited laboratory.
EuroLoop needs results fast and also needs an ISO 17025 accredited lab. For that reason a
small proficiency test (PT) was organized between both labs to verify if they produce
equivalent results.. The liquids were circulated in the test sections in order to homogenize
them. Then samples were taken and for each liquid two bottles were filled directly after
each other. The samples were labelled and send to the labs. Lab A analyzed the sample at
10, 20 and 30°C. Due to time constraints Lab B could perform the analysis at 20 and 30°C
only. Results were returned by calibration certificates and are graphically displayed in Fig.
3. The upper graphs show the results of the analysis. In order to distinguish the results of
both labs the results of Lab A were plotted at the nominal temperature minus 0.5°C and for
Lab B at the nominal temperature plus 0.5°C. The date of the analysis is shown in the legend
of the graph. On the scale used, all results look identical.
mPiston
Prover
Master
Meter
Meter
under Test

33rd International North Sea Flow Measurement Workshop 20 - 23 October 2015
Technical paper
5
In order to compare results between laboratories the so-called normalized deviation is
used, which is defined as:
(1)
This is the ratio of the difference between two results and the uncertainty of the difference.
If the difference of two measurement results is smaller than the uncertainty of the
difference, i.e. , results are in agreement. When the uncertainties have a coverage
factor of , the confidence level of this assessment is at least 95.4%.
Fig. 3: Proficiency test results for kinematic viscosity [mm²/s] (left hand side) and density (right hand
side) of EuroLoop’s three hydrocarbon liquids. The upper graphs show the results of the analysis, where
the viscosities are plotted on a logarithmic scale. The lower graphs depict the normalized differences.
In the lower part of Fig. 3 the values are plotted. For the density all values are less
than 1, which means the labs agree. For the viscosities the results for the 10 mm²/s liquid
agree very well. The results for the other liquids differ significantly. The laboratories were
asked for clarification but have not responded so far.
1
10
100
1000
5 15 25 35
ν [m
m²/
s]
t [°C]
Viscosity
1 mm²/s Lab A
31-jul-2015
1 mm²/s Lab B
6-aug-2015
10 mm²/s Lab A
31-jul-2015
10 mm²/s Lab B6-aug-2015
100 mm²/s Lab A
31-jul-2015
100 mm²/s Lab B
6-aug-2015
720
740
760
780
800
820
840
860
880
5 15 25 35
ρ [k
g/m
³]
t [°C]
Density
1 mm²/s Lab A
31-jul-2015
1 mm²/s Lab B6-aug-2015
10 mm²/s Lab A
31-jul-2015
10 mm²/s Lab B
6-aug-2015
100 mm²/s Lab A
31-jul-2015
100 mm²/s Lab B
6-aug-2015
0.00
2.00
4.00
6.00
8.00
10.00
12.00
5 15 25 35
En [-
]
t [°C]
En of Viscosity
1 mm²/s
10 mm²/s
100 mm²/s
0.00
0.10
0.20
0.30
0.40
0.50
0.60
0.70
0.80
0.90
1.00
5 15 25 35
En [-
]
t [°C]
En of Density
1 mm²/s
10 mm²/s
100 mm²/s
33rd International North Sea Flow Measurement Workshop 20 - 23 October 2015
Technical paper
6
The agreement of the density results is important for the comparison of a mass flow meter
with a volume reference. For the uncertainty of the density the root-sum-square value of
both labs are taken, i.e. 0.025%.
In the viscosity comparisons the 10 cSt results are extremely well in agreement and for this
reason the differences observed for the other liquids are remarkable. For the 1 cSt liquid
, which means a difference in the measured viscosities of 7%, too much for
comparing facilities that operate on different liquid viscosities. The viscosity values
obtained at the accredited lab will be used for reference. EuroLoop will use a 1%
uncertainty for all liquid viscosities and corresponding Reynolds numbers.
Further steps will be taken which will include a critical evaluation of our own sampling
procedures, a repetition of the comparison to see if differences are consistent over time,
looking for laboratories that have a relevant ISO 17025 accreditation and supplier audits
that will focus on the details of the measurement processes for density and viscosity.
5. Calibration experiences
Now the facility is operational we are acquiring experience with the different types of flow
meters. The examples shown comprise two turbine meters in series, two different coriolis
meters and an ultrasonic meter. All results are anonimized unless the owner has given us
explicit consent to mention details of the meters.
5.1 Turbine meters
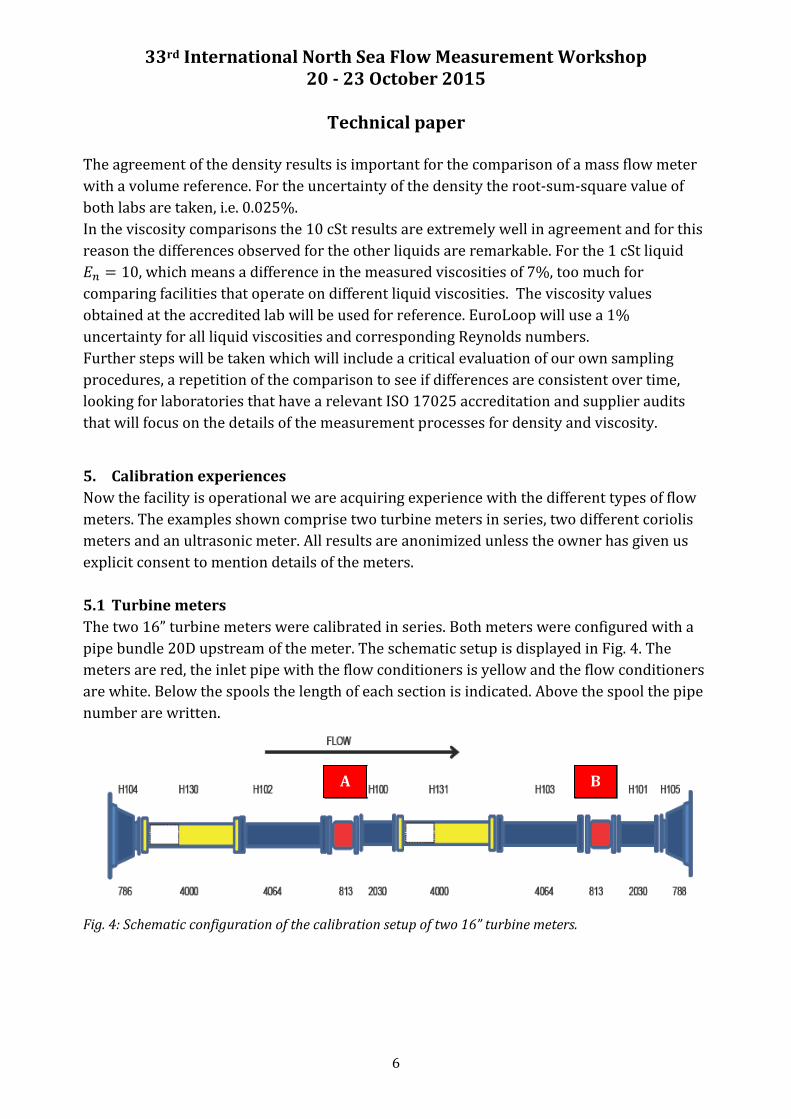
The two 16” turbine meters were calibrated in series. Both meters were configured with a
pipe bundle 20D upstream of the meter. The schematic setup is displayed in Fig. 4. The
meters are red, the inlet pipe with the flow conditioners is yellow and the flow conditioners
are white. Below the spools the length of each section is indicated. Above the spool the pipe
number are written.
Fig. 4: Schematic configuration of the calibration setup of two 16” turbine meters.
A B
33rd International North Sea Flow Measurement Workshop 20 - 23 October 2015
Technical paper
7
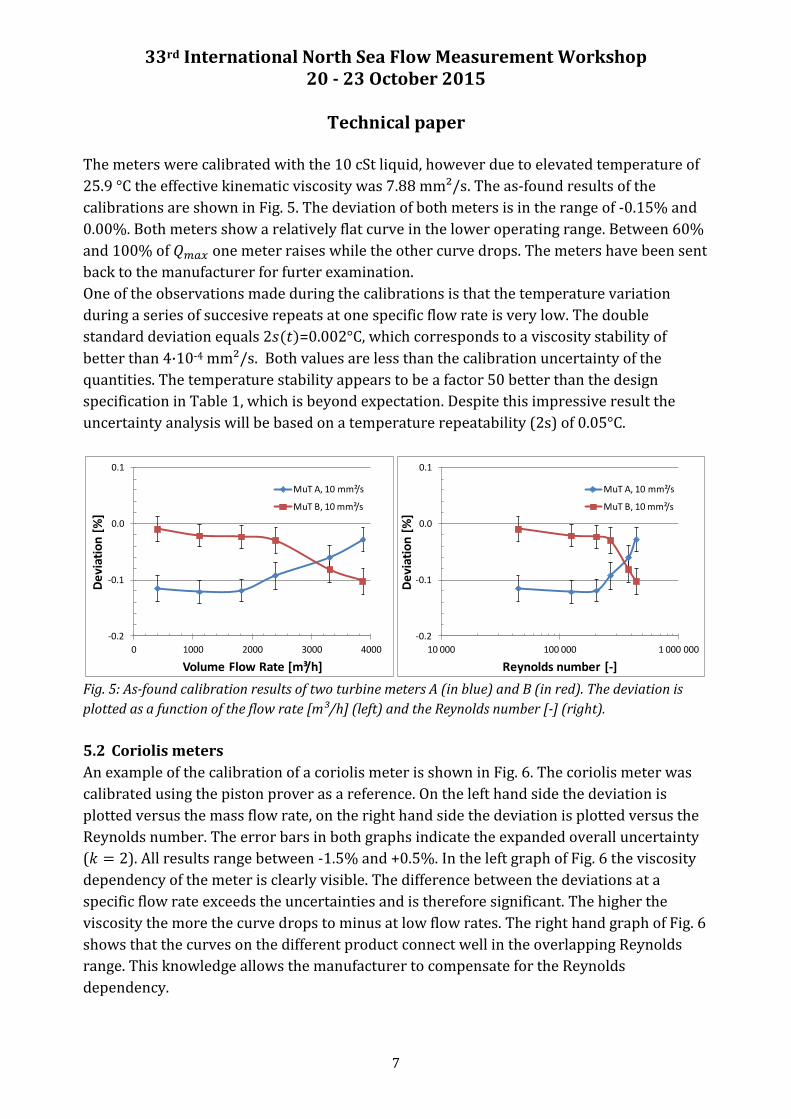
The meters were calibrated with the 10 cSt liquid, however due to elevated temperature of
25.9 °C the effective kinematic viscosity was 7.88 mm²/s. The as-found results of the
calibrations are shown in Fig. 5. The deviation of both meters is in the range of -0.15% and
0.00%. Both meters show a relatively flat curve in the lower operating range. Between 60%
and 100% of one meter raises while the other curve drops. The meters have been sent
back to the manufacturer for furter examination.
One of the observations made during the calibrations is that the temperature variation
during a series of succesive repeats at one specific flow rate is very low. The double
standard deviation equals =0.002°C, which corresponds to a viscosity stability of
better than 4·10-4 mm²/s. Both values are less than the calibration uncertainty of the
quantities. The temperature stability appears to be a factor 50 better than the design
specification in Table 1, which is beyond expectation. Despite this impressive result the
uncertainty analysis will be based on a temperature repeatability (2s) of 0.05°C.
Fig. 5: As-found calibration results of two turbine meters A (in blue) and B (in red). The deviation is
plotted as a function of the flow rate [m³/h] (left) and the Reynolds number [-] (right).
5.2 Coriolis meters
An example of the calibration of a coriolis meter is shown in Fig. 6. The coriolis meter was
calibrated using the piston prover as a reference. On the left hand side the deviation is
plotted versus the mass flow rate, on the right hand side the deviation is plotted versus the
Reynolds number. The error bars in both graphs indicate the expanded overall uncertainty
( ). All results range between -1.5% and +0.5%. In the left graph of Fig. 6 the viscosity
dependency of the meter is clearly visible. The difference between the deviations at a
specific flow rate exceeds the uncertainties and is therefore significant. The higher the
viscosity the more the curve drops to minus at low flow rates. The right hand graph of Fig. 6
shows that the curves on the different product connect well in the overlapping Reynolds
range. This knowledge allows the manufacturer to compensate for the Reynolds
dependency.
-0.2
-0.1
0.0
0.1
0 1000 2000 3000 4000
De
viat
ion
[%
]
Volume Flow Rate [m³/h]
MuT A, 10 mm²/s
MuT B, 10 mm²/s
-0.2
-0.1
0.0
0.1
10 000 100 000 1 000 000
De
viat
ion
[%
]
Reynolds number [-]
MuT A, 10 mm²/s
MuT B, 10 mm²/s

33rd International North Sea Flow Measurement Workshop 20 - 23 October 2015
Technical paper
8
For a different coriolis meter Fig. 7 shows an example what will happen if such
compensation is in place. Here calibration results are plotted using a liquid with a nominal
viscosity of 100 mm²/s. The results are cumulated from runs performed on two dates.
Where in Fig. 6 the results of a regular coriolis meter for the highest viscosity liquid range
from -1.5% to 0.0%, the deviations for the viscosity compensated meter are between -0.2%
to 0.05%. This is a reduction in the dispersion of the observed deviations with a factor six.
Before putting out the flag, some remarks are to be made here. During the measurements
the coriolis meter showed substantial variations of the viscosity indication while the actual
viscosity was constant. Unfortunately, there was no opportunity to test the meter with
other liquid viscosities. It would be interesting to test the meter with both lower and higher
viscosities. And lastly the question is whether the viscosity compensation mechanism is
influenced by other parameters or conditions.
Fig. 6: Results of the calibration of a coriolis meter with three different viscosity liquids. The deviation
[%] is plotted versus the mass flow rate [kg/h] (left graph) and versus the Reynolds number [-]. Error
bars represent the overall expanded uncertainty.
Fig. 7: Calibration results of a coriolis meter with viscosity compensation using a liquid with a nominal
viscosity of 100 mm²/s. The deviation [%] is plotted versus the mass flow rate [kg/h] (left graph) and
versus the Reynolds number [-]. Error bars represent the overall expanded uncertainty.
-2.0
-1.5
-1.0
-0.5
0.0
0.5
1.0
0 200 400 600 800 1 000
Dev
iati
on
[%
]
Mass flow rate [kg/h]
(1.161 ± 0.002) mm²/s
(11.13 ± 0.37) mm²/s
(91.6 ± 4.5) mm²/s
-2.0
-1.5
-1.0
-0.5
0.0
0.5
1.0
1 000 10 000 100 000 1 000 000 10 000 000
Dev
iati
on
[%]
Reynolds number [-]
(1.161 ± 0.002) mm²/s
(11.13 ± 0.37) mm²/s
(91.6 ± 4.5) mm²/s
-0.25
-0.2
-0.15
-0.1
-0.05
0
0.05
0.1
0.15
0 500 1000 1500 2000 2500 3000
De
vait
ion
[%
]
Mass flow rate [kg/h]
100 mm²/s, 29 Apr 2015
100 mm²/s, 24 Apr 2015
-0.25
-0.2
-0.15
-0.1
-0.05
0
0.05
0.1
0.15
1000 10000 100000
De
viat
ion
[%
]
Reynolds number [-]
100 mm²/s, 29 Apr 2015
100 mm²/s, 24 Apr 2015
33rd International North Sea Flow Measurement Workshop 20 - 23 October 2015
Technical paper
9
5.3 Ultrasonic meters
For ultrasonic meters Reynolds-based profile corrections are already common practise.
This makes the meter suitable for intercomparison exercises. In a previous paper [2] an
intercomparison was described between the Trapil and EuroLoop facilities, in which only
EurpLoop’s small piston prover was used. At EuroLoop the calibrations were repeated with
the big piston prover using a single meter (i.e. 8” Altosonic 5 NG meter s/n A14050085 –
19YA20901_2002) that was used in the previous experiment. The calibration results were
compared with the previously obtained results at Trapil [2].
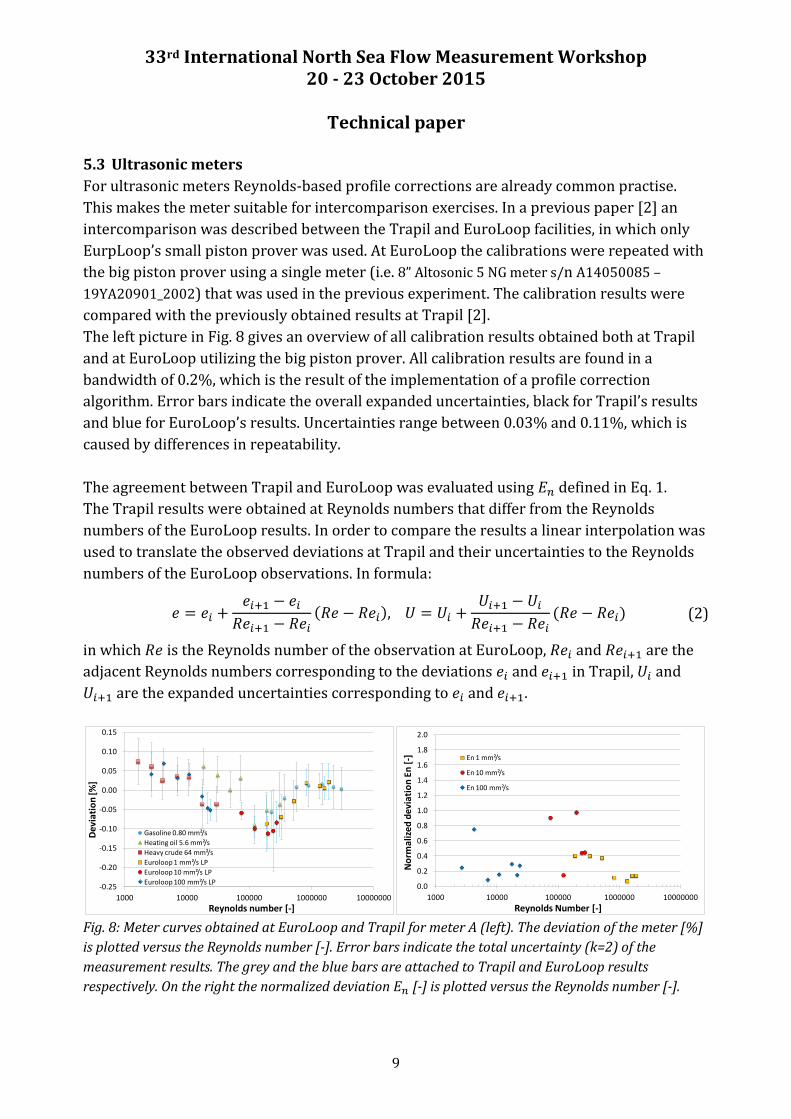
The left picture in Fig. 8 gives an overview of all calibration results obtained both at Trapil
and at EuroLoop utilizing the big piston prover. All calibration results are found in a
bandwidth of 0.2%, which is the result of the implementation of a profile correction
algorithm. Error bars indicate the overall expanded uncertainties, black for Trapil’s results
and blue for EuroLoop’s results. Uncertainties range between 0.03% and 0.11%, which is
caused by differences in repeatability.
The agreement between Trapil and EuroLoop was evaluated using defined in Eq. 1.
The Trapil results were obtained at Reynolds numbers that differ from the Reynolds
numbers of the EuroLoop results. In order to compare the results a linear interpolation was
used to translate the observed deviations at Trapil and their uncertainties to the Reynolds
numbers of the EuroLoop observations. In formula:
(2)
in which is the Reynolds number of the observation at EuroLoop, and are the
adjacent Reynolds numbers corresponding to the deviations and in Trapil, and
are the expanded uncertainties corresponding to and .
Fig. 8: Meter curves obtained at EuroLoop and Trapil for meter A (left). The deviation of the meter [%]
is plotted versus the Reynolds number [-]. Error bars indicate the total uncertainty (k=2) of the
measurement results. The grey and the blue bars are attached to Trapil and EuroLoop results
respectively. On the right the normalized deviation [-] is plotted versus the Reynolds number [-].
-0.25
-0.20
-0.15
-0.10
-0.05
0.00
0.05
0.10
0.15
1000 10000 100000 1000000 10000000
Dev
iati
on
[%]
Reynolds number [-]
Gasoline 0.80 mm²/s
Heating oil 5.6 mm²/s
Heavy crude 64 mm²/s
Euroloop 1 mm²/s LP
Euroloop 10 mm²/s LP
Euroloop 100 mm²/s LP0.0
0.2
0.4
0.6
0.8
1.0
1.2
1.4
1.6
1.8
2.0
1000 10000 100000 1000000 10000000
No
rmal
ize
d d
evi
ati
on
En
[-]
Reynolds Number [-]
En 1 mm²/s
En 10 mm²/s
En 100 mm²/s
33rd International North Sea Flow Measurement Workshop 20 - 23 October 2015
Technical paper
10
The results are depicted in the right graph of Fig. 8. All 19 values are less than 1,
16 values are less than 0.5. These results mean that all Trapil and EuroLoop results
agree with at least 95.4% confidence.
6. Conclusions
Now EuroLoop is fully operational the characteristics of the facilities can be compared with
the specifications the facility was designed to. From the operational experiences described
in the previous chapters to following conclusions can be drawn.
1. EuroLoop is very suitable to test the viscosity dependence of flow meters.
Instruments with viscosity compensation installed can be calibrated and verified at
EuroLoop leading to improved meter performance at lab conditions.
2. The temperature stability observed during a series of successive calibration runs at
one specific flow rate appears to be much more constant than originally expected.
Instead of 0.1°C double standard deviations of 0.002°C were observed. Despite this
impressive result a temperature repeatability (2s) of 0.05°C will be used in the
uncertainty analysis.
3. After earlier intercomparisons using the small piston prover [2], even better
comparison results were obtained between Trapil and EuroLoop using the big piston
prover. All observations have a normalized difference smaller than 1, which means
that the results agree with more than 95.4% confidence. From the 19 observations,
16 had a normalized difference of smaller than 0.5.
4. Point of attention for the metrological maintenance is the analysis of liquid samples.
Although traceability is in order, there is a significant difference between the two
test and calibration laboratories for the lowest and highest viscosity liquids. The
density of the samples agrees within their mutual uncertainties. Further steps will be
necessary to resolve the differences.
7. References
[1] Jos van der Grinten, Bart van der Stap and André Boer (2015): Preparing the new EuroLoop
liquid flow facility for accreditation, Lecture presented at the 3rd European Flow Measurement
Workshop, 17-19 March 2015, Noordwijk, The Netherlands
[2] Jos van der Grinten, Bart van der Stap and Pico Brand (2015): Round robin testing for the new
EuroLoop liquid flow facility, International Symposium for Fluid Flow Measurement, 14-17
April 2015, Arlington, Virginia, USA
[3] ASTM D 7042-14 (2014): Standard Test Method for Dynamic Viscosity and Density of Liquids
by Stabinger Viscometer (and the Calculation of Kinematic Viscosity), ASTM International, PA,
USA
[4] ASTM D 4052-11 (2011): Standard Test Method for Density, Relative Density, and API Gravity
of Liquids by Digital Density Meter, ASTM International, PA, USA