Embed Size (px)
Citation preview
* Corresponding author, tel: +234-803-725-2038
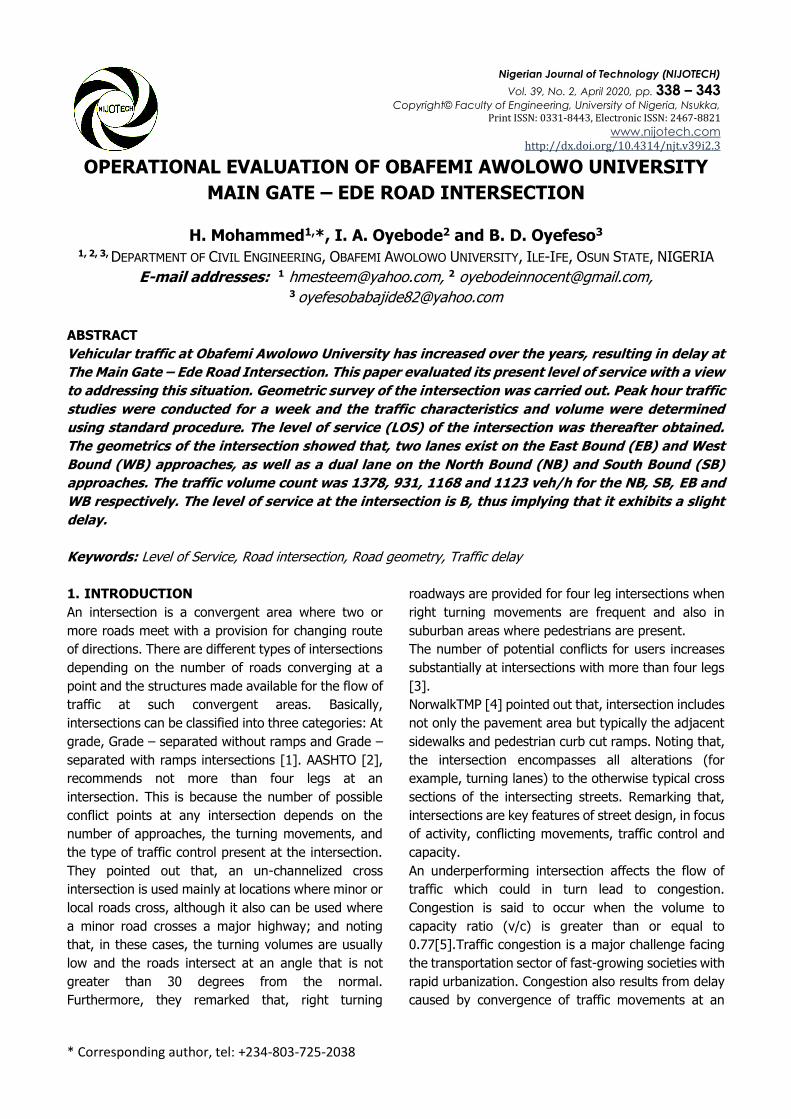
OPERATIONAL EVALUATION OF OBAFEMI AWOLOWO UNIVERSITY
MAIN GATE – EDE ROAD INTERSECTION
H. Mohammed1,*, I. A. Oyebode2 and B. D. Oyefeso3 1, 2, 3, DEPARTMENT OF CIVIL ENGINEERING, OBAFEMI AWOLOWO UNIVERSITY, ILE-IFE, OSUN STATE, NIGERIA
E-mail addresses: 1 [email protected], 2 [email protected], 3 [email protected]
ABSTRACT
Vehicular traffic at Obafemi Awolowo University has increased over the years, resulting in delay at
The Main Gate – Ede Road Intersection. This paper evaluated its present level of service with a view
to addressing this situation. Geometric survey of the intersection was carried out. Peak hour traffic
studies were conducted for a week and the traffic characteristics and volume were determined
using standard procedure. The level of service (LOS) of the intersection was thereafter obtained.
The geometrics of the intersection showed that, two lanes exist on the East Bound (EB) and West
Bound (WB) approaches, as well as a dual lane on the North Bound (NB) and South Bound (SB)
approaches. The traffic volume count was 1378, 931, 1168 and 1123 veh/h for the NB, SB, EB and
WB respectively. The level of service at the intersection is B, thus implying that it exhibits a slight
delay.
Keywords: Level of Service, Road intersection, Road geometry, Traffic delay
1. INTRODUCTION
An intersection is a convergent area where two or
more roads meet with a provision for changing route
of directions. There are different types of intersections
depending on the number of roads converging at a
point and the structures made available for the flow of
traffic at such convergent areas. Basically,
intersections can be classified into three categories: At
grade, Grade – separated without ramps and Grade –
separated with ramps intersections [1]. AASHTO [2],
recommends not more than four legs at an
intersection. This is because the number of possible
conflict points at any intersection depends on the
number of approaches, the turning movements, and
the type of traffic control present at the intersection.
They pointed out that, an un-channelized cross
intersection is used mainly at locations where minor or
local roads cross, although it also can be used where
a minor road crosses a major highway; and noting
that, in these cases, the turning volumes are usually
low and the roads intersect at an angle that is not
greater than 30 degrees from the normal.
Furthermore, they remarked that, right turning
roadways are provided for four leg intersections when
right turning movements are frequent and also in
suburban areas where pedestrians are present.
The number of potential conflicts for users increases
substantially at intersections with more than four legs
[3].
NorwalkTMP [4] pointed out that, intersection includes
not only the pavement area but typically the adjacent
sidewalks and pedestrian curb cut ramps. Noting that,
the intersection encompasses all alterations (for
example, turning lanes) to the otherwise typical cross
sections of the intersecting streets. Remarking that,
intersections are key features of street design, in focus
of activity, conflicting movements, traffic control and
capacity.
An underperforming intersection affects the flow of
traffic which could in turn lead to congestion.
Congestion is said to occur when the volume to
capacity ratio (v/c) is greater than or equal to
0.77[5].Traffic congestion is a major challenge facing
the transportation sector of fast-growing societies with
rapid urbanization. Congestion also results from delay
caused by convergence of traffic movements at an
Nigerian Journal of Technology (NIJOTECH)
Vol. 39, No. 2, April 2020, pp. 338 – 343
Copyright© Faculty of Engineering, University of Nigeria, Nsukka, Print ISSN: 0331-8443, Electronic ISSN: 2467-8821
www.nijotech.com
http://dx.doi.org/10.4314/njt.v39i2.3
OPERATIONAL EVALUATION OF OBAFEMI AWOLOWO UNIVERSITY MAIN GATE – EDE ROAD INTERSECTION, H. Mohammed, et al
Nigerian Journal of Technology, Vol. 39, No. 2, April 2020 339
intersection, thus creating conflict points. These
conflicts occur when traffic streams moving in different
directions interfere with each other. The three possible
types of conflicts are; merging, diverging, and crossing
[1]. Conflicting vehicle movements at intersections are
probably the largest cause of accidents in many
developing countries [6]. Thus intersection should be
aimed at reducing the potential conflicts of
movements of vehicles, pedestrians and facilities [7].
In order to control conflicting and merging traffic
streams to minimize delay, intersections are usually
needed. Choice of geometric parameters that control
and regulate the vehicle path through the intersection
could ensure this [8].
Geometric design of an intersection influences the
operational performance for all road users. Its
operational efficiency is improved by minimizing
impedances, eliminating the need for lane changes
and merge maneuvers and minimizing the required
distance to traverse it. Furthermore, its geometric
features influence the service volume or amount of
traffic it can process [3]. Saxena [9] pointed out that,
intersections are critical spots along a road.
Capacity is the maximum sustainable flow rate at
which vehicles or persons reasonably can be expected
to traverse a point or uniform segment of a lane or
roadway during a specified time period under given
roadway, geometric, traffic, environmental, and
control conditions; usually expressed as vehicles per
hour, passenger per hour, or persons per hour[10].
Furthermore, it is the reasonably expected maximum
sustainable flow rate under given conditions. Capacity
does not describe the maximum observed flow rate
during some short period of time. Rather, it describes
the average (expected) maximum flow rate that can
be sustained over long time periods under given
conditions [11]. Usually, analysis is based on short
time intervals, which may not be in a steady state,
because traffic conditions change frequently in real
world. In [10], the analysis interval is 15 minutes. This
is a compromise between considerations on short term
fluctuations and stability of macroscopic traffic flow
measures. Lesser interval periods allow better
adjustment for fluctuations in short traffic. When
steady state analyses are applied to finite time
intervals, the performance of the facility during these
periods will have considerable stochastic variation
around the estimated performance. Traffic conflicts
between vehicular movements are created when two
or more roads crossed each other. Such conflicts may
cause delay and traffic congestion with the possibility
of road accidents. Thus, each intersection requires
traffic control. It is regulated with stop signs, traffic
lights, and roundabout. The common type of
intersection is the un-signalized intersection, which is
used to regulate low volume of traffic flow between
the major and minor streets [12]. Slinn et al. [13]
proposed the following selection criteria for
intersections: two lightly trafficked residential roads –
priority junction: the through carriageway of a
motorway – grade separation: heavily trafficked urban
cross roads with heavy pedestrian flows – traffic
signals: and suburban dual carriageways with
substantial heavy goods traffic – conventional
roundabout.
According to the procedures outlined for two-way stop
controlled (TWSC) intersections in [10], estimating
level of service requires evaluation of critical gap,
follow-up time, and impedance and capacity
calculations.
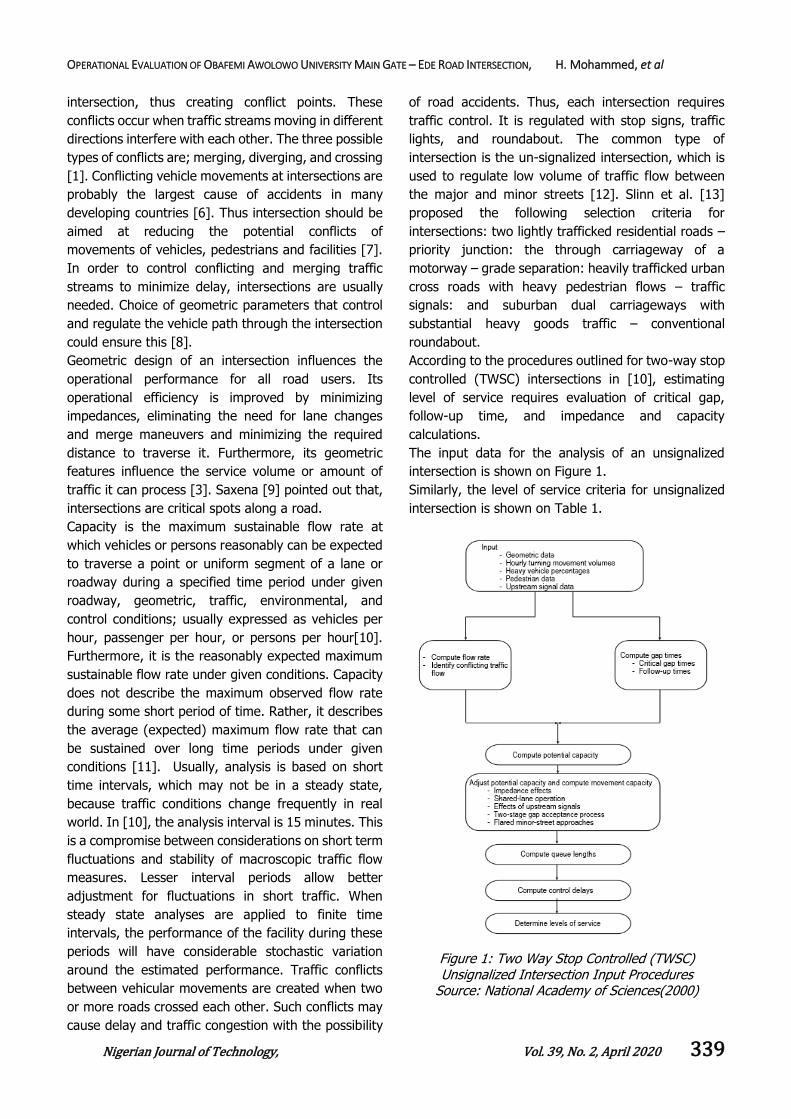
The input data for the analysis of an unsignalized
intersection is shown on Figure 1.
Similarly, the level of service criteria for unsignalized
intersection is shown on Table 1.
Figure 1: Two Way Stop Controlled (TWSC) Unsignalized Intersection Input Procedures
Source: National Academy of Sciences(2000)
OPERATIONAL EVALUATION OF OBAFEMI AWOLOWO UNIVERSITY MAIN GATE – EDE ROAD INTERSECTION, H. Mohammed, et al
Nigerian Journal of Technology, Vol. 39, No. 2, April 2020 340
Table 1: Level –of– Service Criteria for TWSC Intersections Level of Service Average Control Delay (s/veh)
A 0-10
B > 10 – 15
C > 15 – 25
D > 25 – 35
E > 35 – 50
F > 50
Source: Highway Capacity Manual (2000)
Population growth at Obafemi Awolowo University
(OAU) community has increased over the recent years
with a concomitant increase in vehicular traffic. The
result is the worsening condition of traffic congestion
and delay at The Main Gate – Ede Road Intersection
at peak periods. The need to evaluate the present level
of service with a view to addressing this situation
becomes necessary, hence this study.
2. MATERIALS AND METHODS
The Obafemi Awolowo University main gate – Ede
road intersection at Ile – Ife, in Osun State of Nigeria
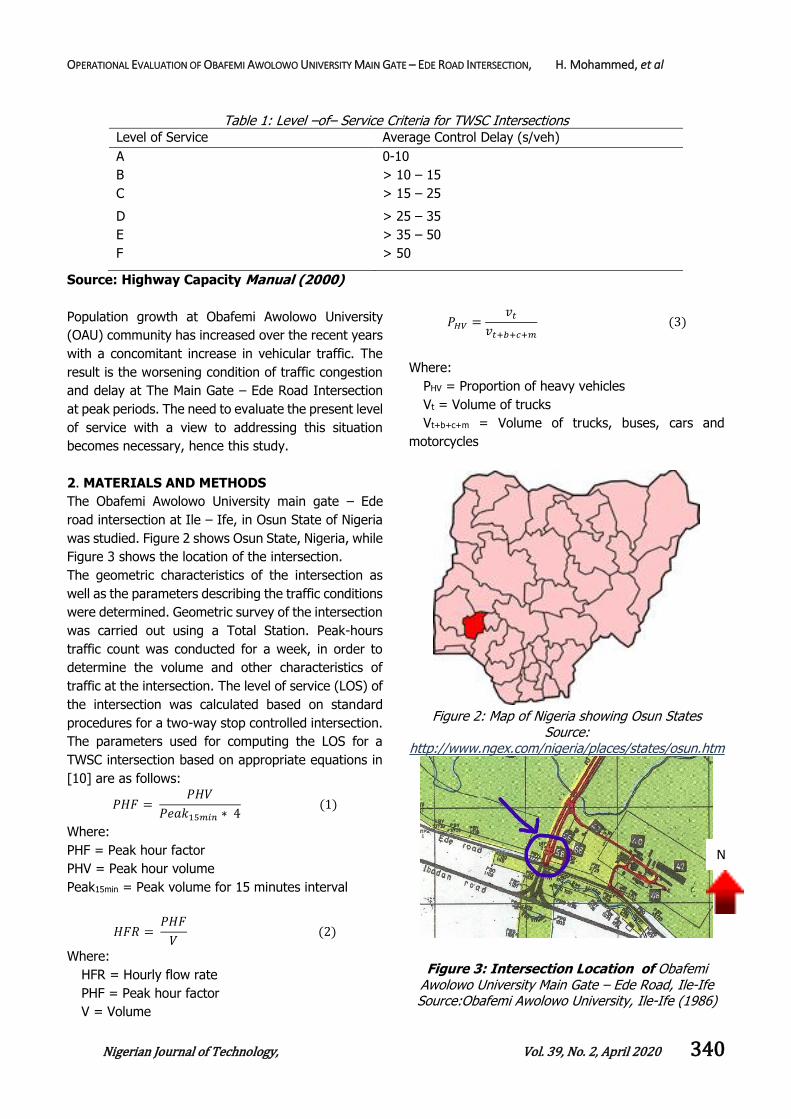
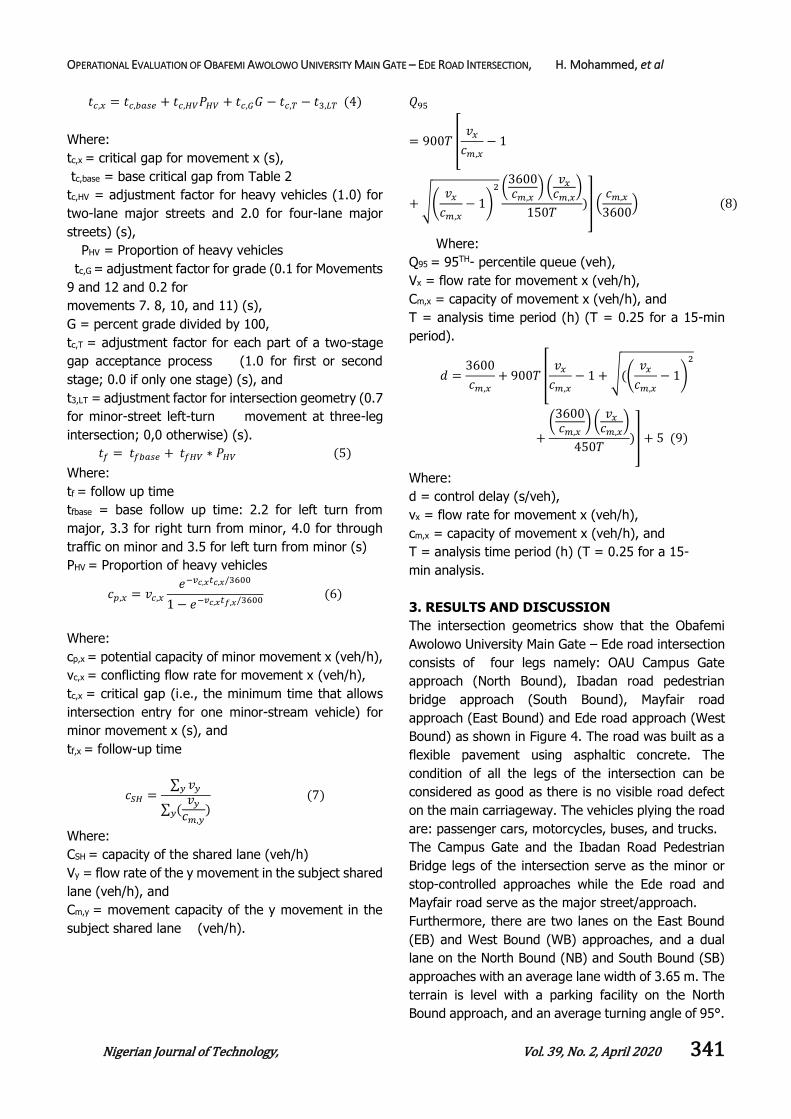
was studied. Figure 2 shows Osun State, Nigeria, while
Figure 3 shows the location of the intersection.
The geometric characteristics of the intersection as
well as the parameters describing the traffic conditions
were determined. Geometric survey of the intersection
was carried out using a Total Station. Peak-hours
traffic count was conducted for a week, in order to
determine the volume and other characteristics of
traffic at the intersection. The level of service (LOS) of
the intersection was calculated based on standard
procedures for a two-way stop controlled intersection.
The parameters used for computing the LOS for a
TWSC intersection based on appropriate equations in
[10] are as follows:
𝑃𝐻𝐹 = 𝑃𝐻𝑉
𝑃𝑒𝑎𝑘15𝑚𝑖𝑛 ∗ 4 (1)
Where:
PHF = Peak hour factor
PHV = Peak hour volume
Peak15min = Peak volume for 15 minutes interval
𝐻𝐹𝑅 = 𝑃𝐻𝐹
𝑉 (2)
Where:
HFR = Hourly flow rate
PHF = Peak hour factor
V = Volume
𝑃𝐻𝑉 =𝑣𝑡
𝑣𝑡+𝑏+𝑐+𝑚
(3)
Where:
PHV = Proportion of heavy vehicles
Vt = Volume of trucks
Vt+b+c+m = Volume of trucks, buses, cars and
motorcycles
Figure 2: Map of Nigeria showing Osun States
Source: http://www.ngex.com/nigeria/places/states/osun.htm
Figure 3: Intersection Location of Obafemi Awolowo University Main Gate – Ede Road, Ile-Ife Source:Obafemi Awolowo University, Ile-Ife (1986)
N
OPERATIONAL EVALUATION OF OBAFEMI AWOLOWO UNIVERSITY MAIN GATE – EDE ROAD INTERSECTION, H. Mohammed, et al
Nigerian Journal of Technology, Vol. 39, No. 2, April 2020 341
𝑡𝑐,𝑥 = 𝑡𝑐,𝑏𝑎𝑠𝑒 + 𝑡𝑐,𝐻𝑉𝑃𝐻𝑉 + 𝑡𝑐,𝐺𝐺 − 𝑡𝑐,𝑇 − 𝑡3,𝐿𝑇 (4)
Where:
tc,x = critical gap for movement x (s),
tc,base = base critical gap from Table 2
tc,HV = adjustment factor for heavy vehicles (1.0) for
two-lane major streets and 2.0 for four-lane major
streets) (s),
PHV = Proportion of heavy vehicles
tc,G = adjustment factor for grade (0.1 for Movements
9 and 12 and 0.2 for
movements 7. 8, 10, and 11) (s),
G = percent grade divided by 100,
tc,T = adjustment factor for each part of a two-stage
gap acceptance process (1.0 for first or second
stage; 0.0 if only one stage) (s), and
t3,LT = adjustment factor for intersection geometry (0.7
for minor-street left-turn movement at three-leg
intersection; 0,0 otherwise) (s).
𝑡𝑓 = 𝑡𝑓𝑏𝑎𝑠𝑒 + 𝑡𝑓𝐻𝑉 ∗ 𝑃𝐻𝑉 (5)
Where:
tf = follow up time
tfbase = base follow up time: 2.2 for left turn from
major, 3.3 for right turn from minor, 4.0 for through
traffic on minor and 3.5 for left turn from minor (s)
PHV = Proportion of heavy vehicles
𝑐𝑝,𝑥 = 𝑣𝑐,𝑥
𝑒−𝑣𝑐,𝑥𝑡𝑐,𝑥/3600
1 − 𝑒−𝑣𝑐,𝑥𝑡𝑓,𝑥/3600 (6)
Where:
cp,x = potential capacity of minor movement x (veh/h),
vc,x = conflicting flow rate for movement x (veh/h),
tc,x = critical gap (i.e., the minimum time that allows
intersection entry for one minor-stream vehicle) for
minor movement x (s), and
tf,x = follow-up time
𝑐𝑆𝐻 =∑ 𝑣𝑦𝑦
∑ (𝑣𝑦
𝑐𝑚,𝑦)𝑦
(7)
Where:
CSH = capacity of the shared lane (veh/h)
Vy = flow rate of the y movement in the subject shared
lane (veh/h), and
Cm,y = movement capacity of the y movement in the
subject shared lane (veh/h).
𝑄95
= 900𝑇 [𝑣𝑥
𝑐𝑚,𝑥
− 1
+ √(𝑣𝑥
𝑐𝑚,𝑥
− 1)
2 (3600𝑐𝑚,𝑥
) (𝑣𝑥
𝑐𝑚,𝑥)
150𝑇)] (
𝑐𝑚,𝑥
3600) (8)
Where:
Q95 = 95TH- percentile queue (veh),
Vx = flow rate for movement x (veh/h),
Cm,x = capacity of movement x (veh/h), and
T = analysis time period (h) (T = 0.25 for a 15-min
period).
𝑑 =3600
𝑐𝑚,𝑥
+ 900𝑇 [𝑣𝑥
𝑐𝑚,𝑥
− 1 + √((𝑣𝑥
𝑐𝑚,𝑥
− 1)
2
+
(3600𝑐𝑚,𝑥
) (𝑣𝑥
𝑐𝑚,𝑥)
450𝑇)] + 5 (9)
Where:
d = control delay (s/veh),
vx = flow rate for movement x (veh/h),
cm,x = capacity of movement x (veh/h), and
T = analysis time period (h) (T = 0.25 for a 15-
min analysis.
3. RESULTS AND DISCUSSION
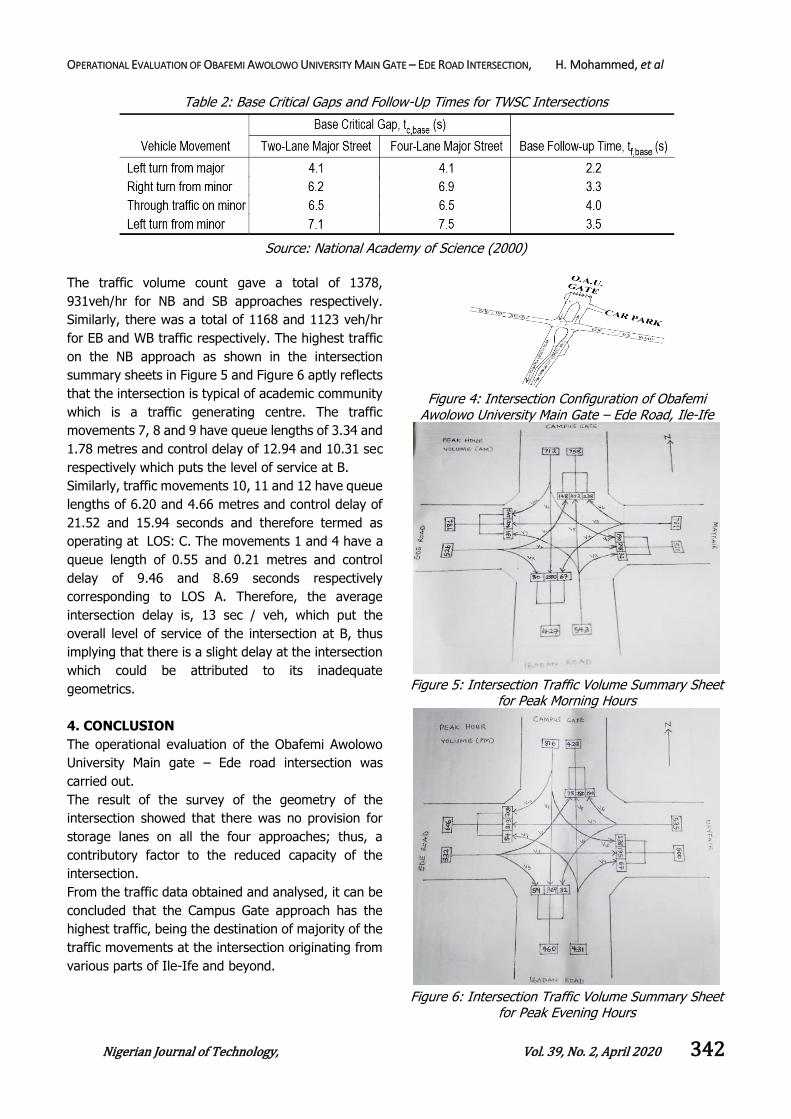
The intersection geometrics show that the Obafemi
Awolowo University Main Gate – Ede road intersection
consists of four legs namely: OAU Campus Gate
approach (North Bound), Ibadan road pedestrian
bridge approach (South Bound), Mayfair road
approach (East Bound) and Ede road approach (West
Bound) as shown in Figure 4. The road was built as a
flexible pavement using asphaltic concrete. The
condition of all the legs of the intersection can be
considered as good as there is no visible road defect
on the main carriageway. The vehicles plying the road
are: passenger cars, motorcycles, buses, and trucks.
The Campus Gate and the Ibadan Road Pedestrian
Bridge legs of the intersection serve as the minor or
stop-controlled approaches while the Ede road and
Mayfair road serve as the major street/approach.
Furthermore, there are two lanes on the East Bound
(EB) and West Bound (WB) approaches, and a dual
lane on the North Bound (NB) and South Bound (SB)
approaches with an average lane width of 3.65 m. The
terrain is level with a parking facility on the North
Bound approach, and an average turning angle of 95°.
OPERATIONAL EVALUATION OF OBAFEMI AWOLOWO UNIVERSITY MAIN GATE – EDE ROAD INTERSECTION, H. Mohammed, et al
Nigerian Journal of Technology, Vol. 39, No. 2, April 2020 342
Table 2: Base Critical Gaps and Follow-Up Times for TWSC Intersections
Source: National Academy of Science (2000)
The traffic volume count gave a total of 1378,
931veh/hr for NB and SB approaches respectively.
Similarly, there was a total of 1168 and 1123 veh/hr
for EB and WB traffic respectively. The highest traffic
on the NB approach as shown in the intersection
summary sheets in Figure 5 and Figure 6 aptly reflects
that the intersection is typical of academic community
which is a traffic generating centre. The traffic
movements 7, 8 and 9 have queue lengths of 3.34 and
1.78 metres and control delay of 12.94 and 10.31 sec
respectively which puts the level of service at B.
Similarly, traffic movements 10, 11 and 12 have queue
lengths of 6.20 and 4.66 metres and control delay of
21.52 and 15.94 seconds and therefore termed as
operating at LOS: C. The movements 1 and 4 have a
queue length of 0.55 and 0.21 metres and control
delay of 9.46 and 8.69 seconds respectively
corresponding to LOS A. Therefore, the average
intersection delay is, 13 sec / veh, which put the
overall level of service of the intersection at B, thus
implying that there is a slight delay at the intersection
which could be attributed to its inadequate
geometrics.
4. CONCLUSION
The operational evaluation of the Obafemi Awolowo
University Main gate – Ede road intersection was
carried out.
The result of the survey of the geometry of the
intersection showed that there was no provision for
storage lanes on all the four approaches; thus, a
contributory factor to the reduced capacity of the
intersection.
From the traffic data obtained and analysed, it can be
concluded that the Campus Gate approach has the
highest traffic, being the destination of majority of the
traffic movements at the intersection originating from
various parts of Ile-Ife and beyond.
Figure 4: Intersection Configuration of Obafemi
Awolowo University Main Gate – Ede Road, Ile-Ife
Figure 5: Intersection Traffic Volume Summary Sheet
for Peak Morning Hours
Figure 6: Intersection Traffic Volume Summary Sheet
for Peak Evening Hours
OPERATIONAL EVALUATION OF OBAFEMI AWOLOWO UNIVERSITY MAIN GATE – EDE ROAD INTERSECTION, H. Mohammed, et al
Nigerian Journal of Technology, Vol. 39, No. 2, April 2020 343
The overall Level of Service (L.O.S.) for the
intersection is B. This implies that there is a slight
delay at the intersection.
The provision of right turn lanes is recommended for
channelizing movements on the right turn so as to
reduce the delay experienced by other movements
accessing the intersection. This will help in relieving
the traffic congestion at the intersection.
5. REFERENCES
[1]Garber, N. J.and Hoel, N. A. Traffic and Highway Engineering. Cengage Learning, Stamford, USA,
2015.
[2] AASHTO (2001). “A Policy on Geometric Design of Highways and Streets” www.transportation.org.
Accessed on August 28, 2019.
[3] Rodegerdts, L. A., Nevers, B., Robinson, B.,
Ringert, J., Koonce, P., Bansen, J., Ngugen, I., McGrill, J., Neuman, T., Antonucci, N., Hardy, K.
and Courage, K. Signalized Intersections:
Information Guide. Federal Highway Administration, USA, 2004.
[4] NorwalkTMP.” Intersection Design” www.scribd.com/doc/315558580/Norwalk-Tmp-
Chapter-1-4-Intersection-Design. Accessed on November 29, 2019.
[5] Ajibade, M.and Mohammed, H. “Operational
Performance Evaluation of Post Office – Teaching Hospital road, Ile - Ife, Nigeria”, Civil and Environmental Research, Vol. 8 Number 7, 2016, pp 18–27.
[6] Thagesen, B. Highway and Traffic Engineering in Developing Countries, London: E and FN Spon,
1996.
[7] Oguara, T. M. Highway Engineering, Lagos; Malthouse Press Limited, 2006.
[8] Roger, M. Highway Engineering (1st ed.), USA: Blackwell Publishing, 2003.
[9] Saxena, S. C. Highway and Traffic Engineering.
New Delhi, India: CBS Publishers and Distributors, 2014.
[10] National Academy of Sciences. Highway Capacity Manual, Transportation Research Board, 2000.
[11] Luttimen, R. T. Capacity and Level of Service at
Finnish Unsignalized Intersections, Helsinki: Finnra Reports, 2004.
[12] Prasetijoa, J. and Ahmadb, H.” Capacity Analysis of Unsignalized Intersection Under Mixed Traffic
Conditions”, Procedia - Social and Behavioral Sciences, Vol.43, 2012, pp 135–147.
[13] Slinn, M., Matthews, P.and Guest, P. Traffic
Engineering Design, and New Delhi, India: Elsevier, 2006.