Embed Size (px)
Citation preview

Operating System-Level
On-Chip Resource Management in
The Multicore Era
by
Xiao Zhang
Submitted in Partial Fulfillment
of the
Requirements for the Degree
Doctor of Philosophy
Supervised by
Professor Sandhya Dwarkadas
Department of Computer ScienceArts, Sciences, and Engineering
Edmund A. Hajim School of Engineering and Applied Sciences
University of RochesterRochester, New York
2010

ii
Curriculum Vitae
Xiao Zhang was born in Jishou, a beautiful county-level city in Hunan province
of the People’s Republic of China on September 2nd, 1982. In 2000, he entered
the University of Science and Technology of China and graduated in 2004 with a
Bachelor of Science degree in Computer Science. From 2005 to 2010, he attended
the University of Rochester where he pursued a Doctor of Philosophy in Computer
Science under the direction of Professor Sandhya Dwarkadas. He received the
Master of Science degree in Computer Science from the University of Rochester
in 2008. During the the summer of 2008 and 2009, he interned at VMware Inc,
performing collaborative research with Richard West, Puneet Zaroo, and Carl
Waldspurger.

iii
Acknowledgments
This dissertation could not have been possible without Dr. Sandhya
Dwarkadas who not only serves as my advisor but also motivates and challenges
me throughout my academic program at the University of Rochester. I am heartily
thankful for your encouragement, guidance, and support.
I am also grateful to Dr. Kai Shen who unreservedly offered helpful and
insightful suggestions and taught me how to tackle system problems. I greatly
appreciate your advice and guidance.
It is an honor for me to thank my committee members Chen Ding and Michael
Huang, my thesis defense chair Paul Ampadu, and the other faculty in the systems
group Michael Scott and Engin Ipek, for introducing me to systems research and
shaping my sense of research.
During my internship at VMware, I had the privilege of working with Carl
Waldspurger, Puneet Zaroo, Richard West, and Haoqiang Zheng. Their help and
encouragement built up my confidence during my stays at VMware.
I am also indebted to my friends and colleagues at the University of Rochester:
Arrvindh Shriraman, Tongxin Bai, Girts Folkmanis (now at Google), Rongrong
Zhong, Xiaoming Gu, and Qi Ge.
I would like to thank my parents, Ping Zhang and Lijuan Yang. They were
always supporting me and helped me make the right decision to come to the
Univeristy of Rochester.
iv
Lastly, but most importantly, I would like to thank my wife, Yang Gao. She
has always been there cheering me on and standing by me through the good and
bad times.
This material is based upon research supported by the National Science Foun-
dation (grants numbers: CNS-0411127, CAREER Award CCF-0448413, CNS-
0509270, CNS-0615045, CNS-0615139, CCF-0621472, CCF-0702505, ITR/IIS-
0312925, CCR-0306473, and CNS-0834451), the National Institutes of Health (5
R21 GM079259-02 and 1 R21 HG004648-01), IBM Faculty Partnership Awards,
and the University of Rochester. Any opinions, findings, and conclusions or rec-
ommendations expressed in this material are those of the author(s) and do not
necessarily reflect the views of the above named organizations.

v
Abstract
CPU manufactures are trending toward designs with multiple cores on a chip in
order to continue to scale with technology. One common feature of these multicore
chips is resource sharing among sibling cores that sit on the same chip, such as
shared last level cache and memory bandwidth. Without careful management,
such sharing could open a loophole in terms of performance, fairness, and security
concerns.
My dissertation addresses resource management issues on multicore chips at
the operating system level. Specifically, I introduce three techniques to control
resource usage and study a variety of resource management policies that consider
fairness, quality of service, performance, or power.
First, I propose a hot-page coloring approach that enforces cache partitioning
on only a small set of frequently accessed (or hot) pages to segregate most inter-
thread cache conflicts. Cache colors are allocated using miss ratio curves. The
cost of identifying hot pages online is reduced by leveraging knowledge of spatial
locality during a page table scan of access bits. Hotness-based page coloring
greatly alleviates the disadvantages of naive page coloring (memory allocation
constraint and recoloring overhead) in practice.
Second, I demonstrate that resource-aware scheduling on multicore-based SMP
platforms can mitigate resource contention. Resource-aware scheduling employs a
simple heuristic that can be easily derived from hardware performance counters.

vi
By grouping applications with similar memory access behaviors, resource con-
tention can be reduced and better overall system performance can be achieved.
Aside from the benefits of reduced hardware resource contention, it also provides
opportunities for CPU power savings and thermal reduction.
Finally, I show how to reuse existing hardware features to control resource
usage. I demonstrate it online a hardware execution throttling (e.g., volt-
age/frequency scaling, duty-cycle modulation, and cache prefetcher adjustment)
based framework to effectively control shared resource usage (regardless of resource
type) on multicore chips.

vii
Table of Contents
Curriculum Vitae ii
Acknowledgments iii
Abstract v
List of Tables x
List of Figures xi
Foreword 1
1 Motivation and Introduction 2
1.1 Multicore Resource Management Concerns . . . . . . . . . . . . . 2
1.2 Challenges to Addressing Multicore Resource Management . . . . 5
1.3 Dissertation Statement . . . . . . . . . . . . . . . . . . . . . . . . 6
1.4 Contributions . . . . . . . . . . . . . . . . . . . . . . . . . . . . . 6
1.5 Dissertation Organization . . . . . . . . . . . . . . . . . . . . . . 7
2 Background and Related Work 9
2.1 Hardware Performance Counters . . . . . . . . . . . . . . . . . . . 9

viii
2.2 Resource-aware Scheduling . . . . . . . . . . . . . . . . . . . . . . 13
2.3 Power Management . . . . . . . . . . . . . . . . . . . . . . . . . . 16
2.4 Cache Partitioning . . . . . . . . . . . . . . . . . . . . . . . . . . 18
2.5 Hardware Execution Throttling . . . . . . . . . . . . . . . . . . . 21
3 Toward Practical Page Coloring 23
3.1 Issues of Page Coloring in Practice . . . . . . . . . . . . . . . . . 24
3.2 Page Hotness Identification . . . . . . . . . . . . . . . . . . . . . 25
3.2.1 Sequential Page Table Scan . . . . . . . . . . . . . . . . . 25
3.2.2 Acceleration for Non-Accessed Pages . . . . . . . . . . . . 29
3.3 Hot Page Coloring . . . . . . . . . . . . . . . . . . . . . . . . . . 32
3.3.1 MRC-Driven Partition Policy . . . . . . . . . . . . . . . . 32
3.3.2 Hotness-Driven Page Recoloring . . . . . . . . . . . . . . . 33
3.4 Relief of Memory Allocation Constraints . . . . . . . . . . . . . . 34
3.5 Evaluation Results . . . . . . . . . . . . . . . . . . . . . . . . . . 36
3.6 Related Work and Summary . . . . . . . . . . . . . . . . . . . . . 49
4 Resource-aware Scheduling on Multi-chip Multicore Machines 53
4.1 Resource Contention on Multi-chip Multicore Machines . . . . . . 54
4.1.1 Mitigating Memory Bandwidth Contention . . . . . . . . . 54
4.1.2 Efficient Cache Sharing . . . . . . . . . . . . . . . . . . . . 57
4.2 Additional Benefits on CPU Power Savings . . . . . . . . . . . . . 59
4.2.1 Constraint of DVFS on Multicore Chips . . . . . . . . . . 59
4.2.2 Model-Driven Frequency Setting . . . . . . . . . . . . . . . 60
4.3 Evaluation Results . . . . . . . . . . . . . . . . . . . . . . . . . . 62
4.4 Discussion and Summary . . . . . . . . . . . . . . . . . . . . . . . 70

ix
5 Hardware Execution Throttling 72
5.1 Comparisons of Existing Multicore Management Mechanisms . . . 72
5.1.1 Effectiveness . . . . . . . . . . . . . . . . . . . . . . . . . . 73
5.1.2 Overhead . . . . . . . . . . . . . . . . . . . . . . . . . . . 75
5.2 Hardware Throttling Based Multicore Management . . . . . . . . 77
5.2.1 Throttling Mechanisms in Consideration . . . . . . . . . . 77
5.2.2 Resource Management Policies . . . . . . . . . . . . . . . . 78
5.2.3 A Simple Heuristic-Based Greedy Solution . . . . . . . . . 79
5.3 A Flexible Model-Driven Iterative Refinement Framework . . . . . 81
5.3.1 Performance Prediction Models . . . . . . . . . . . . . . . 82
5.3.2 Online Deployment Issues . . . . . . . . . . . . . . . . . . 86
5.4 Evaluation Results . . . . . . . . . . . . . . . . . . . . . . . . . . 87
5.4.1 Offline Evaluation . . . . . . . . . . . . . . . . . . . . . . . 89
5.4.2 Online Evaluation . . . . . . . . . . . . . . . . . . . . . . . 96
5.5 Related Work and Summary . . . . . . . . . . . . . . . . . . . . . 100
6 A Unified Middleware 103
6.1 Design and Implementation . . . . . . . . . . . . . . . . . . . . . 103
6.2 Evaluation Results . . . . . . . . . . . . . . . . . . . . . . . . . . 106
6.3 Summary . . . . . . . . . . . . . . . . . . . . . . . . . . . . . . . 110
7 Conclusions and Future Directions 112
Bibliography 115
x
List of Tables
2.1 Brief description of four L1/L2 cache prefetchers on Intel Core 2
Duo processors [Intel Corporation, 2006]. . . . . . . . . . . . . . 22
3.1 Memory footprint sizes and numbers of excess page table entries
for 12 SPECCPU2000 benchmarks. The excess page table entries
are those that do not correspond to physically allocated pages. . . 28
4.1 Benchmark suites and scheduling partitions of 5 tests. Comple-
mentary mixing mingles high-low miss-ratio applications such that
two chips are equally pressured in memory bandwidth. Similarity
grouping separates high and low miss-ratio applications on different
chips (Chip-0 hosts high miss-ratio ones in these partitions). . . . 63
5.1 Summary of the comparison among methods. . . . . . . . . . . . 95
5.2 Average runtime overhead in milliseconds of calculating best duty
cycle configuration. Before each round of sampling, Exhaus-
tive searches and compares all possible configurations while Hill-
Climbing limits calculation to a small portion. . . . . . . . . . . . 97

xi
List of Figures
1.1 Performance comparison between cache sharing and partitioning.
We run three pairs of SPECCPU2000 benchmarks on a 3 GHz Intel
Woodcrest dual-core chip (two cores share a 4 MB L2 cache). Ideal
represents the application running alone and serves as a baseline
performance. Cache partitioning applies page coloring to partition
the 4 MB cache among two applications. Default cache sharing is
the hardware default cache sharing without any control. . . . . . . 4
2.1 An illustration of the page coloring technique. . . . . . . . . . . . 19
3.1 Unused bits of page table entry (PTE) for 4K page on 64-bit and
32-bit x86 platforms. Bits 11-9 are hardware defined unused bits for
both platforms [Intel Corporation, 2006; AMD Corporation, 2008].
Bits 62-48 on the 64-bit platform are reserved but not used by
hardware right now. Our current implementation utilizes 8 bits in
this range for maintaining the page hotness counter. . . . . . . . 27

xii
3.2 Illustration of a page non-access correlation as a function of the
spatial page distance. Results are for 12 SPECCPU2000 bench-
marks with 2-millisecond sampled access time windows. For each
distance value D, the non-access correlation is defined as the prob-
ability that the next D pages are not accessed in a time window if
the current page is not accessed. We take snapshots of each bench-
mark’s page table every 5 seconds and present average non-access
correlation results here. . . . . . . . . . . . . . . . . . . . . . . . . 30
3.3 Illustration of sequential page table scan with locality jumping. . 31
3.4 An example of our cache partitioning policy between swim and
mcf. The cache miss ratio curve for each application is constructed
(offline or during an online learning phase) by measuring the miss
ratio at a wide range of possible cache partition sizes. Given the
estimation of application performance at each cache partitioning
point, we determine that the best partition point for the two ap-
plications is if 1 MB cache is allocated to swim and 3 MB cache to
mcf. . . . . . . . . . . . . . . . . . . . . . . . . . . . . . . . . . . 33
3.5 Procedure for hotness-based page recoloring. A key goal is that hot
pages are distributed to all assigned colors in a balanced way. . . 35
3.6 Overhead comparisons under different page hotness identification
methods. . . . . . . . . . . . . . . . . . . . . . . . . . . . . . . . . 37
3.7 Proportion of skipped page table entries (PTEs) due to our locality-
jumping approach in page hotness identification. . . . . . . . . . . 39
3.8 Jeffrey divergence on identified page hotness between various ap-
proaches and the baseline (an approximation of “true page hotness”). 40
3.9 Rank error rate on identified page hotness between various ap-
proaches and the baseline (an approximation of “true page hotness”). 41

xiii
3.10 All-page comparison of page hotness identification results for sequential
table scan with locality-jumping approach (at once-per-100-millisecond
sampling frequency) and the baseline page hotness. Pages are sorted by
their baseline hotness. The hotness is normalized so that the hotness of
all pages in an application sum up to 1. . . . . . . . . . . . . . . . . 42
3.11 Normalized execution time of different victim applications under
different cache pollution schemes. The polluting application is
swim. . . . . . . . . . . . . . . . . . . . . . . . . . . . . . . . . . 43
3.12 Contention relations of two groups of SPECCPU2000 benchmarks.
If A points to B, that means B has more than 50% performance
degradation when running together with A on a shared cache, com-
pared to running alone when B can monopolize the whole cache. . 44
3.13 Performance comparisons under different cache management poli-
cies for 6 multi-programmed tests (four applications each) on a
dual-core platform. . . . . . . . . . . . . . . . . . . . . . . . . . . 46
3.14 Unfairness comparisons (the lower the better) under different cache
management policies for 6 multi-programmed tests (four applica-
tions each) on a dual-core platform. . . . . . . . . . . . . . . . . . 48
4.1 Cache miss-ratio (L2 cache misses per kilo data references )and
cache miss-rate (L2 misses per kilo instructions) of 12 SPEC-
CPU2000 benchmarks. In general, these two metrics show high
correlation. We label the first six benchmarks (mcf, swim, equake,
applu, wupwise, and mgrid) as high miss-ratio applications and
the later six ones (parser, bzip, gzip, mesa, twolf, and art) as low
miss-ratio applications. . . . . . . . . . . . . . . . . . . . . . . . . 56

xiv
4.2 Normalized miss ratios of 12 SPECCPU2000 benchmarks at differ-
ent cache sizes. The normalization base for each application is its
miss ratio at 512 KB cache space. Cache size allocation is enforced
using page coloring [Zhang et al., 2009b]. Solid lines mark the six
applications with the highest miss ratios while dotted lines mark
the six applications with the lowest miss ratios. Threshold of label-
ing high/low miss-ratio is based on their miss-ratio values shown in
Figure 4.1. . . . . . . . . . . . . . . . . . . . . . . . . . . . . . . . 57
4.3 The accuracy of our variable-frequency performance model. Fig-
ure (A) shows the measured normalized performance (to that of
running at the full CPU speed of 3 GHz). Figure (B) shows our
model’s prediction error (defined as prediction−measurementmeasurement
). . . . . . 62
4.4 Performance (higher is better) of the different scheduling policies
at full CPU speed. . . . . . . . . . . . . . . . . . . . . . . . . . . 64
4.5 Performance comparisons of different scheduling policies when
Chip-0 is scaled to 2 GHz. In subfigure (A), the performance nor-
malization base is the default scheduling without frequency scaling
in all cases. In subfigure (B), the performance loss is calculated
relative to the same scheduling policy without frequency scaling in
each case. . . . . . . . . . . . . . . . . . . . . . . . . . . . . . . . 65
4.6 Performance and power consumption for per-chip frequency scaling
under the similarity grouping schedule. Figure (B) only shows the
range of active power (from idle power at around 224 watts), which
is mostly consumed by the CPU and memory in our platform. . . 66
4.7 Power efficiency for per-chip frequency scaling under the similarity
grouping schedule. Figure (A) uses whole system power while (B)
uses active power in the efficiency calculation. . . . . . . . . . . . 67

xv
4.8 Performance and power consumption for baseline and fair per-chip
frequency scaling under the similarity grouping scheduling. . . . . 68
4.9 On-chip temperature changes in Celsius degree for the per-chip fre-
quency scaling under the similarity grouping scheduling. In each
case, we present a relative number beyond(+) or below(-) the tem-
perature measured under the default scheduling. . . . . . . . . . . 69
5.1 SPECJbb’s performance when its co-runner swim is regulated using
two different approaches: scheduling quantum adjustment (default
100-millisecond quantum) and hardware throttling. Each point
in the plot represents performance measured over a 50-millisecond
window. . . . . . . . . . . . . . . . . . . . . . . . . . . . . . . . . 73
5.2 We co-schedule swim and SPECWeb on an Intel Woodcrest chip
where two sibling cores share a 4MB L2 cache. Here we compare
the effectiveness of different mechanisms in reducing unfairness. . 74
5.3 Accuracy comparison of our model and a naive method. Performance
prediction error is defined as |prediction−measurement|measurement . The average predic-
tion error of each application in each set is reported here. Solid lines
represent prediction by our model and dashed lines represent prediction
by a naive method. . . . . . . . . . . . . . . . . . . . . . . . . . . . 90

xvi
5.4 Examples of our iterative model for some real tests. X-axis shows the
N -th sample. For the top half of the figure, the Y-axis is the L1 dis-
tance (or Manhattan distance) from the current sample to optimal (best
configuration as chosen by the Oracle). Configuration is represented as
a quad-tuple (u, v, w, z) with each dimension indicating the duty cycle
level of the corresponding core. For the bottom half of the figure, Y-axis
is the average performance prediction error of all considered points over
applications in the set. Here considered points are selected according to
the hill climbing algorithm in Section 5.3.2. . . . . . . . . . . . . . . 91
5.5 Comparison of methods with unfairness ≤ 0.10. In (a), the unfair-
ness target threshold is indicated by a solid horizontal line (lower
is good). In (b), performance is normalized to that of Oracle. In
(c), Oracle require zero samples. . . . . . . . . . . . . . . . . . . . 93
5.6 Comparison of methods for high-priority thread QoS ≥ 0.60. In (a),
the QoS target is indicated by a horizontal line (higher is good).
In (b), performance is normalized to that of Oracle. In (c), Oracle
require zero samples. . . . . . . . . . . . . . . . . . . . . . . . . . 94
5.7 Online test results of 5 SPECCPU2000 sets. Default is the default
system running without any throttling. Only duty cycle modula-
tion is used by Model as the throttling mechanism. . . . . . . . . 96
5.8 Online unfairness test of four server applications on platform
“Woodcrest” and “Nehalem”. Default is the default system running
without any throttling. Model here only uses duty cycle modula-
tion as throttling mechanism. . . . . . . . . . . . . . . . . . . . . 98

xvii
5.9 Online QoS test of four server applications on “Woodcrest” and
“Nehalem”. (a) shows results of 4 different tests with each selecting
a different server application as the high-priority QoS one. Same
applies to (b). Default refers to the default system running without
any throttling. Model only uses duty cycle modulation as throttling
mechanism. . . . . . . . . . . . . . . . . . . . . . . . . . . . . . . 99
5.10 Online test of power efficiency (performance per watt). Default
is the default system running without any throttling. Model w.o.
DVFS only uses duty cycle modulation as throttling mechanism.
Model w. DVFS combines two throttling mechanisms (duty cycle
modulation and dynamic voltage/frequency scaling). . . . . . . . 100
6.1 Comparison results of experiment where CPUs are not over-
committed (number of concurrently running applications equals
number of cores). . . . . . . . . . . . . . . . . . . . . . . . . . . . 107
6.2 Sensitivity tests with varing sampling interval (10 milliseconds, 100
milliseconds, and 1 second) and restart frequency (5, 10, 20, and
30 samples). . . . . . . . . . . . . . . . . . . . . . . . . . . . . . . 108
6.3 Comparison results of experiment where CPUs are over-committed
(number of concurrently running applications is larger than number
of cores). . . . . . . . . . . . . . . . . . . . . . . . . . . . . . . . . 110

1
Foreword
I am very fortunate and honored to collaborate with professors and students
at the University of Rochester. Chapter 3 is based on work published at Eu-
roSys’09 [Zhang et al., 2009b], in collaboration with Sandhya Dwarkadas and
Kai Shen. I initiated and implemented the hotness-based page coloring project.
Chapter 4 is based on work published at USENIX ATC’10 [Zhang et al., 2010b],
in collaboration with Kai Shen, Sandhya Dwarkadas, and Rongrong Zhong. I
revealed the opportunity and challenge of voltage/frequency scaling on existing
multichip multicore machines and came up with the idea of similarity grouping.
Rongrong Zhong helped set up the MySQL benchmark for this project. Chapter 5
is based on work published at USENIX ATC’09 [Zhang et al., 2009a], in collabora-
tion with Sandhya Dwarkadas and Kai Shen; and work under submission [Zhang
et al., 2010c], in collaboration with Rongrong Zhong, Sandhya Dwarkadas, and
Kai Shen. I described a new hardware throttling mechanism for multicore resource
management and developed an iterative refinement framework to automatically
configure its settings. Rongrong Zhong contributed to the core performance pre-
diction model and proposed the hill-climbing search algorithm in this project. I
was the principal developer for this project. Needless to say, Professor Dwarkadas
and Professor Shen provided valuable suggestions and guidance for all projects. I
could not accomplish these projects without their tremendous support.

2
1 Motivation and Introduction
Multicore chips, for instance, Intel’s Nehalem, AMD’s Opteron, IBM’s Cell,
NVIDIA’s GPGPU, and ARM’s Cortex-A9, are dominant on today’s market.
These vendors largely cover server, PC, home entertainment, and mobile device
markets. One of the common features of the multicore architecture is that all
cores on a single chip share some cache (usually the last level cache) and off-chip
memory bandwidth. Such sharing presents new challenges due to the uncontrolled
resource competition from simultaneously executing processes. However, today’s
operating systems manage multicore processors in a time-shared manner similar to
traditional single-core uniprocessor systems and are oblivious to on-chip resource
contention. Some attention is paid to cache locality among the multiple cores by
a hierarchical load balancing, which preferentially migrates processes to sibling
cores. The additional challenges due to the subtle interactions of simultaneously
executing processes sharing on-chip resources have not been addressed in main-
stream operating systems, largely due to the complex nature of the interactions.
1.1 Multicore Resource Management Concerns
The major issue with multicore resource management is uncontrolled resource
contention. For example, processes that are simultaneously accessing the shared

3
cache can conflict with each other and result in skewed performance. The perfor-
mance of a process that would normally have been high due to the cache being
large enough to fit its working set could be severely impacted by a simultane-
ously executing process with aggressive and massive cache demand, resulting in
the first process’s cache lines being evicted by the second process. Figure 1.1
shows examples of pair-wise running a set of SPECCPU2000 benchmarks on an
Intel Woodcrest dual-core chip with two cores sharing a 4 MB L2 cache. Here Ideal
means without resource contention (i.e., application runs alone). Cache partition-
ing applies page coloring to partition the shared cache among two applications 1.
Default cache sharing is the hardware default cache sharing without any control.
From this figure we can see that careful cache space management like cache parti-
tioning can achieve significant overall performance and fairness improvement over
default cache sharing.
The contention resulting from uncontrolled resource utilization raises the con-
cern of performance isolation on multicore chips. On one hand, performance can
fluctuate and is hard to predict. In Figure 1.1, for example, swim has a relative
performance (normalized to ideal) of about 0.9 when run together with twolf, and
its performance drops to around 0.7 when it is co-scheduled with equake. On
the other hand, fairness is not well maintained since aggressive threads tend to
occupy more resources and therefore make more progress, while victim threads ex-
hibit poor performance even given equal amount of CPU time. Figure 1.1 shows
that art achieves a relative performance (normalized to ideal) of 0.3 while its
co-runner swim can sustain performance above 0.7.
Uncontrolled resource usage also triggers possible security loopholes. A mali-
cious thread can take advantage of this loophole to launch a denial of service (DoS)
attack at the chip level [Moscibroda and Mutlu, 2007] and make a service hosted in
a cloud computing facility (e.g., Amazon [Amazon] and GoGRID [GoGrid, 2008])
1Details on how we actually partition the cache can be found in Chapter 3.

4
swim art
0.2
0.4
0.6
0.8
1
Applications
No
rma
lize
d p
erf
orm
an
ce
swim equake
0.2
0.4
0.6
0.8
1
ApplicationsN
orm
aliz
ed
pe
rfo
rma
nce
swim twolf
0.2
0.4
0.6
0.8
1
Applications
No
rma
lize
d p
erf
orm
an
ce
Ideal Cache Partitioning Default Cache Sharing
Figure 1.1: Performance comparison between cache sharing and partitioning. We
run three pairs of SPECCPU2000 benchmarks on a 3 GHz Intel Woodcrest dual-
core chip (two cores share a 4 MB L2 cache). Ideal represents the application
running alone and serves as a baseline performance. Cache partitioning applies
page coloring to partition the 4 MB cache among two applications. Default cache
sharing is the hardware default cache sharing without any control.
totally inaccessible. In addition to DoS attacks, multicore chips are also prone to
information leakage. Malicious hackers can infer other applications’ cache miss
patterns on a shared cache and hence their execution behaviors. Previous work
[Percival, 2005; Zhang et al., 2007] shows that it is possible to steal the private
RSA key in OpenSSL [OpenSSL, 2007] by a sibling thread/core eavesdropping
RSA encryption/decryption execution patterns2.
2Security is imperative to multicore resource management but this dissertation does not
explore security implications directly.

5
1.2 Challenges to Addressing Multicore Re-
source Management
The first challenge is that commodity operating systems such as Linux lack ca-
pabilities to learn applications’ chip level resource consumption and competition.
Unlike other system resources such as memory and disk, operating systems basi-
cally treat processors as black boxes and have no knowledge of how chip resources
are allocated among competing threads. For example, commodity operating sys-
tems can not determine how much cache space a running thread actually occupies
due to lack of low-level hardware resource accounting.
The second challenge is limited available mechanisms for operating systems to
enforce a thread’s chip level resource allocation/usage. The state of the art ex-
isting mechanism to partition shared cache space is page coloring. This technique
itself exerts adverse effects in practice: expensive overhead during re-partitioning
and memory allocation constraints. Another studied mechanism is to adjust a
thread’s CPU time-slice to compensate or penalize threads for under-utilization
or over-utilization of shared resources. Modern operating systems schedule threads
in a round robin fashion: a CPU runs a thread for a time-slice defined by its pri-
ority and then performs a context switch to run the next available thread. By
modifying its time-slice, operating systems can effectively control threads’ resource
usage. However, this mechanism complicates CPU scheduling and works at coarse
granularity since a typical time-slice is tens to hundreds of milliseconds.
The last but not least challenge is the absence of appropriate management
policies for a selected management mechanism. A good policy should address
practical concerns (e.g., fairness) and be easy to adopt. Since multicore resource
contention is a complicated issue, a well-designed policy should be flexible to a set
of conditions (e.g., varying architecture parameters) and different management
objectives (e.g., performance vs. power).
6
1.3 Dissertation Statement
This dissertation addresses multicore resource management with a focus on fair-
ness, performance, and power. We present three novel system-level approaches to
tackle this problem: resource-aware scheduling, hotness-based page coloring, and
hardware execution throttling. We demonstrate that our approaches achieve bet-
ter or competitive performance over the default system and provide capabilities
to satisfy a variety of other management objectives such as fairness, quality of
service (QoS), and power savings.
1.4 Contributions
The approaches described in this dissertation utilize a series of system-level tools
and mechanisms, such as performance counters, page coloring, duty cycle modula-
tion, and frequency/voltage scaling, to address resource management on multicore
chips.
• We devise and implement an efficient way to track memory page access
frequency (i.e., page hotness). The cost of identifying hot pages online is
reduced by leveraging knowledge of spatial locality during a page table scan
of access bits. Based on this, we propose hot-page-based page coloring, which
enforces coloring on only a small set of frequently accessed (or hot) pages for
each process. Guided by a miss-ratio-curve driven partitioning policy, hot-
page-based selective coloring can significantly alleviate the coloring-induced
adverse effects in practice and considerably improve performance over naive
page coloring.
• We present a simple yet efficient resource-aware scheduling on multicore-
based symmetric multiprocessors. The scheduling policy considers both

7
memory bandwidth congestion and cache space interference, and has ad-
ditional benefits in the ability to engage chip-wide CPU power savings.
• We advocate hardware execution throttling as an effective tool to support
fair use of shared resources on multicore chips. We also propose a flexi-
ble framework to automatically find a proper hardware execution throttling
configuration for a user-specified objective. A variety of resource manage-
ment objectives, such as fairness, QoS, performance, and power efficiency
can be targeted. The essence of our framework is an iterative prediction
refinement procedure and a customizable model that currently incorporates
both duty cycle modulation and voltage/frequency scaling effects. Our ex-
perimental results show that our approach quickly arrives at the exact or
close to optimal configuration.
1.5 Dissertation Organization
Chapter 2 discusses background and related work, including hardware perfor-
mance counters, CPU scheduling, hardware cache partitioning, page coloring,
power management, and hardware execution throttling.
Chapter 3 elaborates our contribution of making page coloring more prac-
tical [Zhang et al., 2009b] in general systems. Page coloring is the only pure
software solution to partition a cache without any hardware support. However,
traditional page coloring places additional constraints on memory space alloca-
tion and incurs substantial overhead for page recoloring. We propose a hot-page
coloring approach enforcing coloring on only a small set of frequently accessed
(or hot) pages to segregate most inter-thread cache conflicts. We also designed
an efficient online hot-page-identifying implementation by leveraging knowledge
of spatial locality during a page table scan of access bits. Our results demonstrate

8
that hot page identification and selective coloring can significantly alleviate the
coloring-induced adverse effects in practice.
Chapter 4 draws attention to resource-aware scheduling on multicore-based
SMP platforms. Specifically, our scheduling policy (similarity grouping) groups
applications with different cache miss ratios on different chips. On one hand, it
avoids memory bandwidth over-saturation since no memory intensive applications
will run concurrently on all chips. On the other hand, it helps separate low miss
ratio applications that may be more sensitive to cache pressure from high miss
ratio applications that will aggressively occupy the cache space but with less
benefits. Such scheduling also creates the opportunity for non-uniform per-chip
voltage/frequency settings.
In Chapter 5, we describe hardware execution throttling that can effectively
control both cache space and memory bandwidth resource usage. By throttling
down the execution speed of some of the cores, we can control an application’s
relative resource utilization to achieve desired management objectives. In addi-
tion, we introduce a model-based iterative refinement framework to automatically
and quickly determine an optimal (or close to optimal) hardware execution throt-
tling configuration for a given user-specified optimization target. The capability
of fast-searching makes such an approach particularly useful on platforms with
hundreds or thousands of possible configurations.
The three multicore resource management solutions described above are or-
thogonal yet complementary to each other. Chapter 6 will show a unified pro-
totype middleware combining both similarity grouping scheduling and hardware
execution throttling. We will conclude and discuss future research directions in
Chapter 7.

9
2 Background and Related
Work
In this Chapter, we provide some necessary background on system techniques
described in this dissertation and discuss related work in those areas.
2.1 Hardware Performance Counters
Hardware performance counters are a set of registers sitting on chip and they can
be programmed to count various hardware events. These counters increase mono-
tonically and can be initialized with arbitrary starting value. Counter overflow
can be captured by hardware triggered interrupts but it seldom happens since
counter bit length is sufficient (usually between 40 and 64 bits).
Architected performance counters were introduced on modern processors in
the early 1990s, and have since provided a rich source of architectural statistical
information about program execution characteristics. Nowadays major processor
vendors such as Intel, IBM, AMD, and Sun are all equipped with performance
counters although the number of counters may vary. For example, Intel Pentium
4 processor with hyper-threading has 18 general purpose counters shared by two
sibling hardware threads [Intel Corporation, 2006]. Sun UltraSPARC series has
2 performance counters in each virtual processor [Sun Microsystems, Inc, 2005].

10
IBM PowerPC 64-bit processors usually contain of 6 to 8 counters depending on
different models [Oprofile].
Configuring performance counters only requires writing platform-specific regis-
ters, which typically takes about hundreds of cycles. This extremely low overhead
property makes it broadly used in systems research for a variety of purposes. Early
utilization of performance counters was mainly focused on workload profiling, de-
bugging, and modeling. Sweeney et al. [Sweeney et al., 2004] utilized performance
counters to monitor program behavior. On a multiprocessor platform, they mod-
ified Jikes Java research virtual machine (RVM) to correctly attribute counter
values to each Java thread in multithreaded applications. Relying on the traced
counter statistics, they filtered out hardware events with low correlation to per-
formance (they used instructions per cycle as their performance metric) and made
some interesting observations on pseudojbb (a variant of SPECJbb2000) bench-
mark. One interesting “anomaly” they found was that application’s performance
improves automatically over time in Jikes. The reason for that was Jikes RVM had
an adaptive optimization system (AOS) which behaved conservatively at the be-
ginning of application execution. During execution, it gradually learned to choose
more advanced optimization levels for certain code segments based on the runtime
feedback. Luo et al. [Luo and John, 2001] and Seshadri et al. [Seshadri and Meri-
cas, 2001] also conducted research on performance issues of server applications by
leveraging performance counters. Luo’s work was focused on scalability of Java
applications such as SPECJbb2000 and VolanoMark. Their finding indicated that
with increasing number of threads, applications could exhibit better instruction
locality while the resource stalls also increase and eventually dwarfed the bene-
fits from instruction locality. Seshadri’s study suggests instruction cache and L2
cache are two primary hotspots highly relevant to application’s performance on
PowerPC Processors. Eeckhout et al. [Eeckhout et al., 2002] used a time series of
counter statistics to compare the mutual behavioral differences among different

11
program inputs and help to select representative input data sets. In the work
of Sherwood [Sherwood et al., 2003], Balasubramonian [Balasubramonian et al.,
2000], and Shen [Shen et al., 2004], performance counters were used to determine
program phases. The rationale was that program phases were the execution dura-
tion over which the behavior remained more or less stable, and phase transitions
could be detected using changes in hardware event counts.
Performance counters have also been widely used in power and thermal man-
agement. Bellosa et al. [Bellosa, 2000; Bellosa et al., 2003] first proposed pro-
cessor counter-based power consumption modeling, namely event-driven energy
accounting. They pre-calculated/calibrated energy consumption base units for
a variety of hardware events such as cache references, cache misses, and branch
instructions, and converted each observed event into the corresponding energy
consumption. Such event-driven energy accounting method made it possible to
accurately predict processor power consumption and greatly facilitated operat-
ing systems’ support for fine-grained power management. Later on, Heath et
al. [Heath et al., 2006] incorporated this counter-based energy accounting in their
Mercury project to manage thermal emergencies in server clusters. The basic idea
was that when estimated servers’ temperatures went beyond a red-flag threshold,
a load adjustment would take place to mitigate this thermal emergency. Some
other studies [Weissel and Bellosa, 2002; Isci et al., 2006; Kotla et al., 2004] used
performance counters as guidance to tune voltage/frequency scaling for power
savings. We will discuss them in Section 2.3.
Most counter-based work was evaluated on single thread/process or multipro-
grammed workloads. When a single server application (consisting of many concur-
rent requests) runs on a machine, it is beneficial to analyze application behavior
at request granularity. A server request usually goes through multiple components
during its execution. For example, it may first be handled by a front-end server
layer at the beginning, then handed to a decision-making layer, and eventually
12
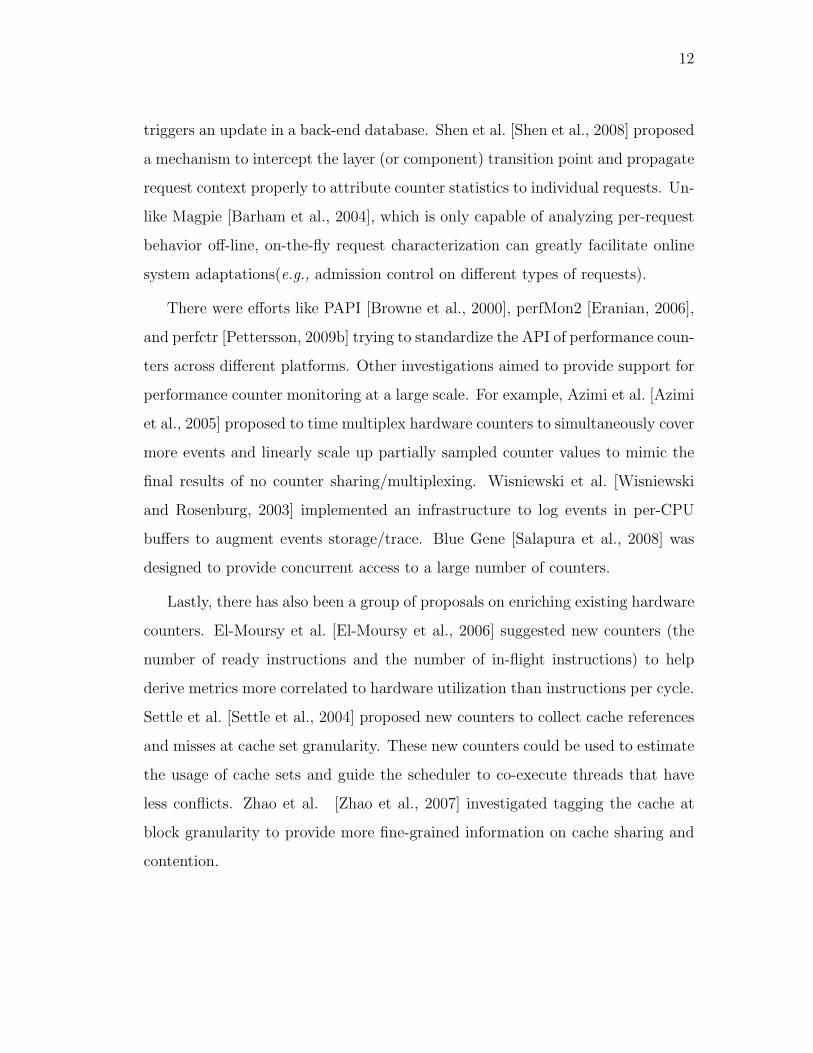
triggers an update in a back-end database. Shen et al. [Shen et al., 2008] proposed
a mechanism to intercept the layer (or component) transition point and propagate
request context properly to attribute counter statistics to individual requests. Un-
like Magpie [Barham et al., 2004], which is only capable of analyzing per-request
behavior off-line, on-the-fly request characterization can greatly facilitate online
system adaptations(e.g., admission control on different types of requests).
There were efforts like PAPI [Browne et al., 2000], perfMon2 [Eranian, 2006],
and perfctr [Pettersson, 2009b] trying to standardize the API of performance coun-
ters across different platforms. Other investigations aimed to provide support for
performance counter monitoring at a large scale. For example, Azimi et al. [Azimi
et al., 2005] proposed to time multiplex hardware counters to simultaneously cover
more events and linearly scale up partially sampled counter values to mimic the
final results of no counter sharing/multiplexing. Wisniewski et al. [Wisniewski
and Rosenburg, 2003] implemented an infrastructure to log events in per-CPU
buffers to augment events storage/trace. Blue Gene [Salapura et al., 2008] was
designed to provide concurrent access to a large number of counters.
Lastly, there has also been a group of proposals on enriching existing hardware
counters. El-Moursy et al. [El-Moursy et al., 2006] suggested new counters (the
number of ready instructions and the number of in-flight instructions) to help
derive metrics more correlated to hardware utilization than instructions per cycle.
Settle et al. [Settle et al., 2004] proposed new counters to collect cache references
and misses at cache set granularity. These new counters could be used to estimate
the usage of cache sets and guide the scheduler to co-execute threads that have
less conflicts. Zhao et al. [Zhao et al., 2007] investigated tagging the cache at
block granularity to provide more fine-grained information on cache sharing and
contention.

13
2.2 Resource-aware Scheduling
Multiprocessor systems such as simultaneous multithreading (SMT), chip multi-
processing (CMP, or more often referred to as a multicore processor), and sym-
metric multiprocessing (SMP) are commonplace nowadays. Commodity oper-
ating systems like Linux kernel [Linux Open Source Community, 2010] mainly
deal with two problems on multiprocessor scheduling: load-balancing and cache-
affinity. Load-balancing attempts to assign each processor a roughly equal amount
of work. If the workload is unbalanced, the scheduler migrates some tasks from
the heavily burdened processor to other less loaded processors to re-balance them.
However, task migration has its associated costs: when a task migrates to a re-
mote processor, it can no longer take advantage of a warmed up cache. Newer
versions of the Linux kernel scheduler mitigate such cache-affinity issues by pref-
erentially migrating a task within a processor domain, in which the source and
target processors share some levels of cache. This is achieved by a hierarchi-
cal load balancing starting from a basic scheduling domain. For example, for a
multicore-based SMP platform, all sibling cores on a chip form the basic domain
and all chips assemble a higher domain. Load balancing starts within each basic
domain and then moves to the higher domain. By doing so, scheduling first tries
to eliminate load imbalance by moving tasks within a chip. If further imbalance
still exists, it will perform inter-chip task migration.
Resource sharing further complicates the OS scheduler, mainly due to extensive
contention for shared resources. A number of studies explored resource-aware
CPU scheduling to improve system performance and fairness. Most work along
this direction is trying to find simple yet effective heuristics to guide workload
co-scheduling that mitigates resource contention.
Parekh et al. [Parekh et al., 2000] and Snavely et al. [Snavely and Tullsen,
2000] first studied scheduling on SMT processors. Parekh found that the best
14
overall system instruction throughput happened when they co-scheduled threads
with highest instruction rates (instructions per cycle, or IPC) together. Their ex-
planation for that was, in the case of shared instruction queue on SMT processors,
low-IPC threads tended to hold buffers longer and might slow down the instruc-
tion flow of other high-IPC threads. Snavely used the term ”symbiosis” to refer
to co-scheduling of threads that share resources in a harmonious fashion. Their
symbiotic scheduler had to permute threads periodically for some time (so called
sampling phase). After the sampling, the scheduler would pick a best co-schedule
permutation according to certain metrics (whole system’s instruction throughput,
cache hit rate etc.) measured during the sampling phase. Their work confirmed
Parekh’s IPC-based heuristic on SMT scheduling. In contrast to the previous
similar IPC grouping heuristic, Fedorova et al. [Fedorova et al., 2004] suggested
co-scheduling a low-IPC thread together with a high-IPC thread. They argued
that low-IPC threads usually had low pipeline resource requirements due to ex-
tensive memory accesses and long-latency instructions and thus were more likely
to leave function units idle. Threads with high IPCs had high pipeline resource
requirements as they spent much less time stalled.
SMT processors implement resource sharing to an extreme end, with almost
all resources like pipeline, function units, and all levels of cache being shared
among sibling hardware threads. As a contrast, SMP processors typically only
share off-chip memory bandwidth1. Since there is only one bottleneck shared
resource, resource management is relatively straightforward. Antonopoulos et
al. [Antonopoulos et al., 2003] and Zhang et al. [Zhang et al., 2007] advocated
bandwidth-aware scheduling to mitigate memory bus congestion on SMP plat-
forms. The idea was to co-schedule memory-intensive and non-memory-intensive
applications on different chips and avoid memory bus being either underutilized or
1Of course, a SMP processor itself could implement SMT, but we do not attribute SMT-
sharing to SMP-sharing.

15
over-saturated. Such guidance not only eliminated severe bottleneck resource con-
tention but also made efficient use of available bandwidth resource. Antonopou-
los’s work was based on the assumption of a constant peak bandwidth limit and
use that to guide co-scheduling of jobs whose total bandwidth will not exceed the
saturation limit. Zhang’s work measured applications’ memory bandwidth usage
at runtime.
On multicore processors, last level cache and memory bus are typically shared
by sibling cores. Chandra et al. [Chandra et al., 2005] and Zhuravlev et al. [Zhu-
ravlev et al., 2010] proposed predicting inter-thread cache space contention based
on applications’ reuse distance profiles. A reuse distance profile was a histogram
with individual buckets corresponding to different reuse distances in a LRU-like
stack. Given reuse distance profiles of multiple threads, Chandra’s stack distance
competition model would merge them into a single profile and simulate how they
would compete for cache space. Zhuravlev’s Pain model introduced two concepts:
cache sensitivity and cache intensity. Sensitivity indicates how many cache hits
from a thread running alone could turn into cache misses when multiple threads
are running concurrently. To simplify the computation burden, they assumed that
a cache line with position i in a stack had probability of 1i
to be evicted by the
next distinct data access. Intuitively speaking, a cache line at position 1 means
it is least recently used and is very likely to be replaced. The intensity indicates
how aggressively an application occupies cache and it is measured by application’s
cache misses per instruction. They defined the performance penalty (or pain in
their term) as the product of one’s sensitivity and its co-runner’s intensity. The
absolute value of such metric was meaningless, but the relative order of multiple
pain values could be used to predict which co-schedule was better. Besides the
computation overhead, their model inputs — reuse distance profiles, were also
very expensive to obtain.
Instead of using reuse distance profiles, Merkel et al. [Merkel and Bellosa,

16
2008a] and Zhuravlev et al. [Zhuravlev et al., 2010] suggested using miss rate
(misses per instruction) as a simple heuristic to guide co-scheduling on multicore
processors. Specifically, they suggested co-scheduling a high miss rate thread with
a low miss rate thread within a multicore processor.
Fedorova et al. [Fedorova et al., 2007] adjusted thread’s CPU time-slice as
a way to control resource sharing. The policy would increase the time-slice of
threads with under-fair cache usage, and shorten the time-slice of threads with
over-fair cache usage. Guan et al. [Guan et al., 2009b,a] did some theoretical
analysis on the schedulability of deadline-driven real-time applications on mul-
tiprocessors. Jiang et al. [Jiang et al., 2008] proved that optimal co-scheduling
on a multicore is an NP-complete problem when the number of cores is larger
than 2 and provided a divide-and-conquer approximation algorithm that tries to
solve this problem in polynomial time. Ghoting et al. and Zhang et al. [Ghoting
et al., 2007; Zhang et al., 2010a] observed the need to match the development and
compilation of multithreaded applications to the underlying platform in order to
exploit the shared cache between cores.
2.3 Power Management
Power and energy consumption are prominent resource concerns in large data
centers. Bianchini and Rajamony [Bianchini and Rajamony, 2004] presented a
good survey of research efforts on power management strategies.
Usually power management employs hardware mechanisms such as volt-
age/frequency scaling and sleeping to transition machine from high to low power
modes for power savings. There are two directions of power management in re-
search community. The first is power/energy management of large scale systems
such as data centers or server clusters. A typical server consumes a quite consider-
able amount of power (e.g., hundreds of watts) even when the system is idling. In

17
large data centers, server machines are over-provisioned for peak workload and for
most of the time they are idling or underutilized. Pinheiro et al. [Pinheiro et al.,
2001] and Chase et al. [Chase et al., 2001] suggested workload concentration on
a few machines when systems were off peak time and to keep other idle machines
in low power modes or even shut them down. Elnozahy et al. [Elnozahy et al.,
2003] further introduced a request batching technique that could accumulate in-
coming requests in memory while CPUs were kept in a low-power state during
periods of sporadic workload. Weissel et al. [Weissel and Bellosa, 2004] and Wang
et al. [Wang et al., 2005] advocated throttling processors to keep systems within
a certain power/thermal budget envelope.
The other direction is to optimize active power on relatively small scale ma-
chines. Many researchers targeted on CPU since it has a wide range of active power
consumption. Specifically, they used dynamic voltage/frequency scaling (DVFS)
to control CPU power consumption. DVFS is a hardware mechanism on modern
processors that trades processing speed for power savings. Typically, each CPU
frequency level is paired with a minimum operating voltage so that a frequency
reduction lowers both power and energy consumption. Frequency scaling-based
CPU power/energy optimization has been studied for over a decade. Weiser et
al. [Weiser et al., 1994] first proposed adjusting the CPU speed according to its
utilization. Pillai and Shin [Pillai and Shin, 2001] applied DVFS to deadline-
driven embedded operating systems. The basic principle was that when CPU
was not fully utilized, the processing capability could be lowered to improve the
power efficiency. When the CPU was already fully utilized, DVFS might still be
applied without hurting much performance, especially for memory intensive ap-
plications. The rationale was that memory-bound applications did not have suffi-
cient instruction-level parallelism to keep the CPU busy while waiting for memory
accesses to complete, and therefore decreasing their CPU frequency would not re-
sult in a significant performance penalty. Some other previous studies focused on

18
modeling the DVFS effects on performance. A couple of studies [Weissel and Bel-
losa, 2002; Isci et al., 2006] utilized offline constructed frequency selection lookup
tables. Such an approach required a large amount of offline profiling. Merkel
and Bellosa employed a linear model based on memory bus utilization [Merkel
and Bellosa, 2008a] but it could only support a single frequency adjustment level.
Kotla et al. [Kotla et al., 2004] constructed a performance model for variable CPU
frequency levels. Specifically, they assumed that all cache and memory stalls were
not affected by the CPU frequency scaling while other delays were scaled in a lin-
ear fashion. Their model was not evaluated on real frequency scaling platforms.
Barroso and Holzle [Barroso and Hlzle, 2007] advocated that hardware design
would trend towards energy-proportional computing. That is, hardware power
consumption would be proportional to its computing workload on future comput-
ing platforms. They showed that right now CPU is the most energy-proportional
component and urged other storage (memory and disk) manufacturers to catch
up.
2.4 Cache Partitioning
On multicore processors, the cache size is designed to be large enough (e.g., Intel
Xeon-5160 CPU has 4 MB L2 cache, Nehalem processor has 8 MB L3 cache) to
accommodate multiple concurrently executing threads. The trend toward larger
and larger caches strongly motivates research on how to allocate/partition cache
space among multiple competing threads.
Most hardware-based cache partitioning schemes require modifying the cache
block replacement policy. Usually it tags each cache block with a thread ID and
replaces blocks according to threads’ shares rather than least recently used (LRU)
principle. Assuming that such block replacement mechanism was available, Suh
et al. [Suh et al., 2001a] proposed an analytical cache model to estimate the miss

19
rate of applications for any cache size at a given time quantum. They demonstrate
that estimated utility functions could be applied to cache partitioning to achieve
better system instruction throughput. A coarser granularity scheme is column
caching/partitioning [Chiou et al., 2000]. Basically column caching treats each
way in a n-way associative cache as a column and cache block replacement is
restricted within columns. Therefore, it partitions the cache at way-granularity.
Figure 2.1: An illustration of the page coloring technique.
Systems without special hardware support can also partition the cache in a
pure software way by page coloring technique. The basic idea of page coloring is to
control the mapping of physical memory pages to a processor’s cache blocks since
the last level cache is typically indexed by physical address. Memory pages that
are mapped to the same cache blocks are assigned the same color (as illustrated
by Figure 2.1). By controlling the color of pages assigned to an application,
operating systems can manipulate cache blocks at page granularity (more strictly
speaking, the granularity is the product of page size and cache associativity). This
granularity is the unit of cache space that can be allocated to an application.

20
Page coloring was first implemented on MIPS operating system in 1980s [Tay-
lor et al., 1990]. The problem at that time was the unstable performance due to
random virtual to physical page mapping. The solution was that engineers created
page coloring to enforce a constant offset in page mappings. Kessler et al. [Kessler
and Hill, 1992] made a good survey on several static page mapping/placement poli-
cies. They defined page coloring and bin hopping as two different techniques: page
coloring maps pages close in virtual address (spatial locality) to different cache
blocks while bin hopping maps pages close in access time (temporal locality) to
different cache blocks. Today page coloring has been generalized to include bin
hopping. Bershad et al. and Romer et al. [Bershad et al., 1994; Romer et al., 1994]
examined dynamic page replacement in hardware and software respectively. Ber-
shad et al. proposed a novel hardware component: cache miss lookaside (CML)
buffer. Upon a cache miss to a physical page, operating systems looked up the
CML and incremented the miss counter of the corresponding entry. If a page had
lots of misses, it was better to remap/recolor it to different cache blocks. Romer’s
work relied on software and existing hardware (TLB, cache miss counter) to detect
conflicts: when the miss counter for the whole cache reached a certain threshold,
the operating systems would take a snapshot of the TLB and recolor one from the
set of pages that appear to have most conflicts. Bugnion et al. [Bugnion et al.,
1996] utilized the hints generated at compilation time to guide page allocation.
Sherwood et al. [Sherwood et al., 1999] summarized the previous work and also
proposed his own software and hardware page placements. His software method
was based on profiling: given page reference sequences, a greedy algorithm was
used to calculate good page colors so that conflicts are minimal. His hardware
method was similar to the CML buffer in Bershad’s work but with a modified
hardware TLB that did not need to copy memory pages in recoloring.
A few recent studies introduced the use of page coloring to control multicore
cache partitioning in the operating system [Tam et al., 2007a; Lin et al., 2008].

21
Guided by information on application data access pattern (such as the miss ratio
curve or stall rate curve), page coloring has the potential to reduce inter-thread
cache conflicts and improve fairness. In Tam’s work [Tam et al., 2007a], the parti-
tion point was fixed and there was no dynamic repartitioning/recoloring involved.
Lin et al. [Lin et al., 2008] extended that by implementing dynamic page coloring.
2.5 Hardware Execution Throttling
Recent studies [Herdrich et al., 2009; Zhang et al., 2009a] advocate using exist-
ing hardware throttling mechanisms for multicore resource management. Specifi-
cally, there are three available mechanisms on Intel x86 platforms: dynamic volt-
age/frequency scaling (DVFS), duty cycle modulation, and hardware prefetching.
We have discussed DVFS in Section 2.3 and will focus on duty cycle modulation
and hardware prefetching in the following paragraphs.
Duty cycle modulation [Intel Corporation, 2006] is a hardware feature intro-
duced by Intel. It allows the operating systems to specify a portion (e.g., multiplier
of 1/8) of regular CPU cycles as duty cycles by writing to the logical processor’s
IA32 CLOCK MODULATION register. The processor will be effectively halted
during non-duty cycles for a duration of ∼3 microseconds [Intel Corporation,
2009a]. Different duty cycle ratios are achieved by keeping the time for which the
processor is halted at a constant duration of ∼3 microseconds and adjusting the
time period for which the processor is enabled. Duty cycle modulation is per-core
controllable and originally designed for thermal management. Systems can simply
throttle any over heated core without affecting other sibling cores.
Hardware prefetching is a widely used technique to hide memory latency by
taking advantage of bandwidth not being used. There are multiple hardware
prefetchers on a single chip and they are usually configurable by writing to
platform-specific registers (e.g., IA32 MISC ENABLE register on Intel proces-

22
Prefetchers Description
L1 IP Keeps track of instruction pointer and looks for
sequential load history.
L1 DCU When detecting multiple loads from the same line
within a time limit, prefetches the next line.
L2 Adjacent Line Prefetches the adjacent line of required data.
L2 Stream Looks at streams of data for regular patterns.
Table 2.1: Brief description of four L1/L2 cache prefetchers on Intel Core 2 Duo
processors [Intel Corporation, 2006].
sors). Table 2.1 gives an example of 4 prefetchers on Intel Core 2 Duo processors.
There are two L1 cache prefetchers (DCU and IP prefetchers) and two L2 cache
prefetchers (adjacent line and stream prefetchers) [Intel Corporation, 2006]. Each
can be selectively turned on/off, providing partial control over application’s band-
width utilization.
Hardware execution throttling does not require significant modifications to
operating systems, and incurs little overhead in configuration (hundreds or thou-
sands of cycles). These properties make it a good choice for multicore resource
management.
23
3 Toward Practical Page
Coloring
The shared last level cache is a critical resource on multicore chip that can result in
performance anomalies due to contention or unfair allocation. The performance of
a process that would normally have been high due to the cache being large enough
to fit its working set could be severely impacted by a simultaneously executing
process with high cache demand, resulting in the first process’s cache lines being
evicted.
Without specific hardware support to control cache sharing, the operating
system’s only recourse in a physically addressed cache is to control the virtual
to physical mappings used by individual processes. Traditional page coloring at-
tempts to ensure that contiguous pages in virtual memory are allocated to physical
pages that will be spread across the cache [Kessler and Hill, 1992; Romer et al.,
1994; Bugnion et al., 1996; Sherwood et al., 1999]. In order to accomplish this,
contiguous pages of physical memory are allocated different colors, with the max-
imum number of colors being a function of the size and associativity of the cache
relative to the page size. Free page lists are organized to differentiate these colors,
and contiguous virtual pages are guaranteed to be assigned distinct colors.
Recently, several studies have recognized the potential of utilizing page coloring
to manage the shared cache space on multicore platforms [Tam et al., 2007a; Lin
24
et al., 2008; Soares et al., 2008]. However, several challenges remain to make page
coloring practical for resource partitioning purpose.
3.1 Issues of Page Coloring in Practice
The first issue is the high overhead of online recoloring in a dynamic, multi-
programmed execution environment. An adaptive system may require online ad-
justments of the cache partitioning policy (e.g., context switch at one of the cores
brings in a new program with different allocation and requirements from the pro-
gram that was switched out). Such an adjustment requires a change of color for
some application pages. Without special hardware support, recoloring a page im-
plies memory copying, which takes several microseconds on commodity platforms.
Frequent recoloring of a large number of application pages may incur excessive
overhead that more than negates the benefit of page coloring.
The second issue is that of constraining the allocated memory space. Imposing
page color restrictions on an application implies that only a portion of the memory
can be allocated to this application. When the system runs out of pages of a
certain color, the application is under memory pressure while there still may be
abundant memory in other colors. This application can either evict some of its
own pages to secondary storage or steal pages from other page colors. The former
can result in dramatic slowdown due to page swapping while the latter may yield
negative performance effects on other applications due to cache conflicts.
We proposes a hot-page coloring approach [Zhang et al., 2009b] in which cache
mapping colors are only enforced on a small set of frequently accessed (or hot)
pages for each process. Hot-page coloring may realize much of the benefit of all-
page coloring, but with reduced memory space allocation constraint and much
less online recoloring overhead in an adaptive and dynamic environment.

25
3.2 Page Hotness Identification
Our hot-page coloring approach builds atop effective identification of frequently
accessed pages for each application. Its overhead must be kept low for online
continuous identification during dynamic application execution.
3.2.1 Sequential Page Table Scan
The operating system (OS) has two main mechanisms for monitoring access to
individual pages. First, on most hardware-implemented TLB platforms (e.g., Intel
processors), each page table entry has an access bit, which is automatically set by
hardware when the page is accessed [Intel Corporation, 2008b]. By periodically
checking and clearing this access bit, one can estimate each page’s access frequency
(or hotness). The second mechanism is via page read/write protection so that
accesses to one page will be caught by page faults. One drawback for the page
protection approach is the high page fault overhead. On the other hand, it has the
advantage (in comparison to the access bit checking) that overhead is only incurred
when pages are indeed accessed. Given this tradeoff, Zhou et al. [Zhou et al.,
2004] proposed a combined method to track page accesses for an application—
link together frequently accessed pages and periodically check their access bits;
invalidate those infrequently accessed pages and catch accesses to them by page
faults.
However, traversing the list of frequently accessed pages involves pointer chas-
ing, which exhibits poor locality efficiency on modern processor architectures. In
contrast, a sequential scan of the application’s page table can be much faster on
platforms with high peak memory bandwidth and hardware prefetching. For a set
of 12 SPECCPU2000 applications, our experiments on a dual-core Intel Xeon 5160
3.0 GHz “Woodcrest” processor shows that the sequential table scan takes tens of
cycles (36 cycles on average) per page entry while the list traversal takes hundreds
26
of cycles (258 cycles on average) per entry. Given the trend that memory latency
improvement lags memory bandwidth improvement [Patterson, 2004], sequential
table scan is favored over random pointer chasing in our design.
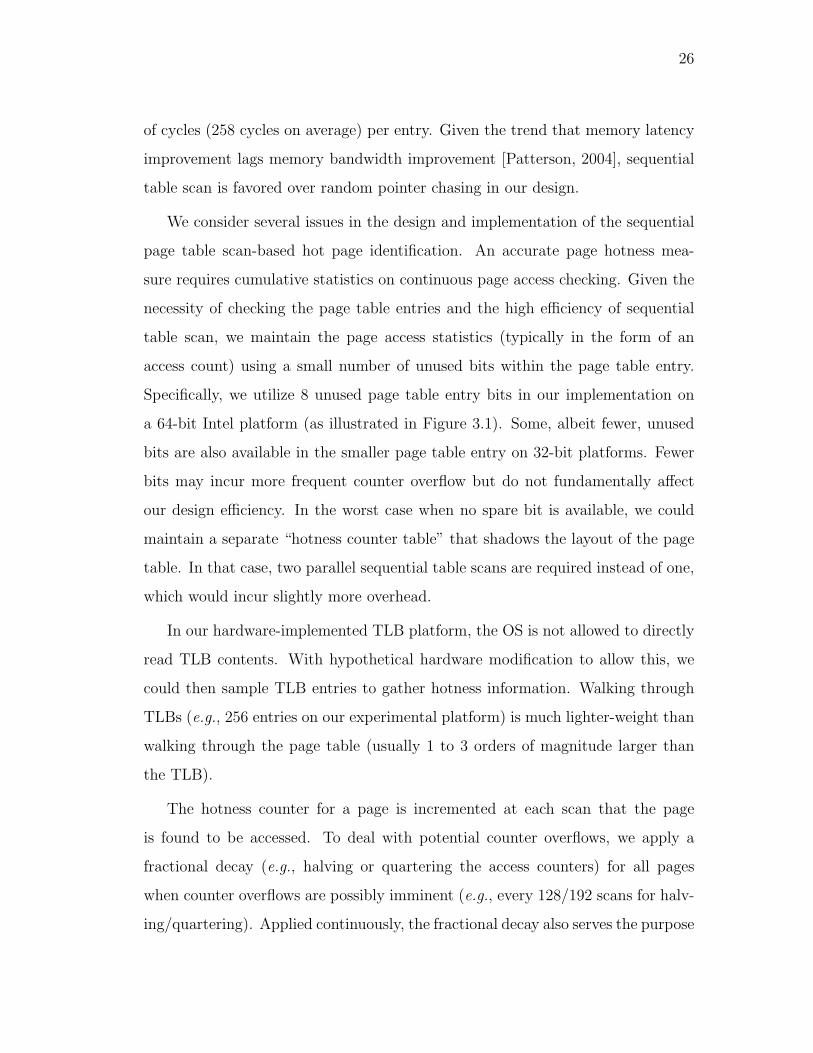
We consider several issues in the design and implementation of the sequential
page table scan-based hot page identification. An accurate page hotness mea-
sure requires cumulative statistics on continuous page access checking. Given the
necessity of checking the page table entries and the high efficiency of sequential
table scan, we maintain the page access statistics (typically in the form of an
access count) using a small number of unused bits within the page table entry.
Specifically, we utilize 8 unused page table entry bits in our implementation on
a 64-bit Intel platform (as illustrated in Figure 3.1). Some, albeit fewer, unused
bits are also available in the smaller page table entry on 32-bit platforms. Fewer
bits may incur more frequent counter overflow but do not fundamentally affect
our design efficiency. In the worst case when no spare bit is available, we could
maintain a separate “hotness counter table” that shadows the layout of the page
table. In that case, two parallel sequential table scans are required instead of one,
which would incur slightly more overhead.
In our hardware-implemented TLB platform, the OS is not allowed to directly
read TLB contents. With hypothetical hardware modification to allow this, we
could then sample TLB entries to gather hotness information. Walking through
TLBs (e.g., 256 entries on our experimental platform) is much lighter-weight than
walking through the page table (usually 1 to 3 orders of magnitude larger than
the TLB).
The hotness counter for a page is incremented at each scan that the page
is found to be accessed. To deal with potential counter overflows, we apply a
fractional decay (e.g., halving or quartering the access counters) for all pages
when counter overflows are possibly imminent (e.g., every 128/192 scans for halv-
ing/quartering). Applied continuously, the fractional decay also serves the purpose

27
Figure 3.1: Unused bits of page table entry (PTE) for 4K page on 64-bit and 32-bit
x86 platforms. Bits 11-9 are hardware defined unused bits for both platforms [Intel
Corporation, 2006; AMD Corporation, 2008]. Bits 62-48 on the 64-bit platform
are reserved but not used by hardware right now. Our current implementation
utilizes 8 bits in this range for maintaining the page hotness counter.
of gradually screening out stale statistics, as in the widely used exponentially-
weighted moving average (EWMA) filters.
We decouple the frequency at which the hotness sampling is performed from
the time window during which the access bits are sampled (by clearing the access
bits at the beginning and reading them at the end of the access time window).
We call the former sampling frequency and latter sampled access time window. In
practice, one may want to enforce an infrequent page table scan for low overhead
while at the same time collecting access information over a much smaller time
window to avoid hotness information loss. The latter allows distinguishing the
relative hotness across different pages accessed in the recent past. Consider a
concrete example in which the sampling frequency is once per 100 milliseconds
and the sampled access time window is 2 milliseconds. In the first sampling, we
clear all page access bits at time 0-millisecond and then check the bits at time
2-millisecond. In the next sampling, the clearing and checking occur at time
100-millisecond and 102-millisecond respectively.

28
Benchmark # of physically # of excess page
allocated pages table entries
gzip 46181 1141
wupwise 45008 1617
swim 48737 1617
mgrid 14185 1582
applu 45981 4135
mesa 2117 1255
art 903 1028
mcf 21952 1334
equake 12413 1057
parser 10183 699
bzip 47471 954
twolf 1393 88
Table 3.1: Memory footprint sizes and numbers of excess page table entries for 12
SPECCPU2000 benchmarks. The excess page table entries are those that do not
correspond to physically allocated pages.
A page table scan is expensive since there is no a priori knowledge of whether
each page has been accessed, let alone allocated. There may be invalid page table
entries that are not yet mapped and mapped virtual pages that are not yet physi-
cally substantiated (some heap management systems may only commit a physical
page when it is first accessed). As shown in Table 3.1, however, such excess page
table entries are usually few in practice (particularly for applications with larger
memory footprints). We believe the excess checking of non-substantiated page
table entries does not constitute a serious overhead.

29
3.2.2 Acceleration for Non-Accessed Pages
A conventional page table scan checks every entry regardless of whether the corre-
sponding page was accessed in the last time window. Given that a page list traver-
sal approach [Zhou et al., 2004] only requires continuous checking of frequently
accessed pages, the checking of non-accessed page table entries may significantly
offset the sequential scan’s performance advantage on per-entry checking cost.
We propose an accelerated page table scan that skips the checking of many
non-accessed pages. Our acceleration is based on the widely observed data access
spatial locality—i.e., if a page was not accessed in a short time window, then
pages spatially close to it were probably not accessed either. Intuitively, the
non-access correlation of two nearby pages degrades when the spatial distance
between them increases. To quantitatively understand this trend, we calculate
such non-access correlation as a function of the spatial page distance. Figure 3.2
illustrates that in most cases (except mcf), the correlation is quite high (around
0.9) for a spatial distance as far as 64 pages. Beyond that, the correlation starts
dropping, sometimes precipitously. Further investigation of mcf shows that such
correlation changes significantly as time goes by probably due to major phase
changes (suggested by sizable changes in its memory-related performance counter
statistics).
Driven by such page non-access correlation, we propose to quickly bypass cold
regions of the page table through an approach we call locality jumping. Specifically,
when encountering a non-accessed page table entry during the sequential scan,
we jump page table entries while assuming that the intermediate pages were not
accessed (thus requiring no increment of their hotness counters). To minimize false
jumps, we gradually increase the jump distance in an exponential fashion until we
reach a maximum distance (empirically determined to be 64 in our case) or touch
an accessed page table entry. In the former case, we will continue jumping at the

30
1 2 4 8 16 32 64 128 256 512 1024 20480
0.1
0.2
0.3
0.4
0.5
0.6
0.7
0.8
0.9
1
Spatial page distance
Page n
on−
assess c
orr
ela
tion
gzipwupwiseswimmgridapplumesaartmcfequakeparserbziptwolf
Figure 3.2: Illustration of a page non-access correlation as a function of the spatial
page distance. Results are for 12 SPECCPU2000 benchmarks with 2-millisecond
sampled access time windows. For each distance value D, the non-access correla-
tion is defined as the probability that the next D pages are not accessed in a time
window if the current page is not accessed. We take snapshots of each benchmark’s
page table every 5 seconds and present average non-access correlation results here.
maximum distance without further increasing it. In the latter case, we jump back
to the last seen non-accessed entry and restart the sequential scan. Figure 3.3
provides a simple illustration of our approach.
Locality jumping that follows a deterministic pattern (e.g., doubling the dis-
tance after each jump) runs the risk of synchronizing with a worst-case appli-
cation access pattern to incur abnormally high false jump rates. To avoid such
unwanted correlation with application access patterns, we randomly adjust the
jump distance by a small amount at each step. Note, for instance, that the fourth
jump in Figure 3.3 has a distance of 6 (as opposed to 8 in a perfectly exponential

31
Figure 3.3: Illustration of sequential page table scan with locality jumping.
pattern).
It is important to note that by breaking the sequential scan pattern, we may
sacrifice the per-entry checking cost (particularly by degrading the effectiveness
of hardware prefetching). Quantitatively, we observe that the per-entry overhead
increases from 36 cycles to 56 cycles on average. Such an increase of per-entry cost
is substantially outweighed by the significant reduction of page entry checking.
Finally, it is worth pointing out that spatial locality also applies to accessed
pages. However, jumping over accessed page table entries is not useful in our case
for at least two reasons. First, in the short time window for fine-grained hotness

32
checking (e.g., 2 milliseconds), the number of non-accessed pages far exceeds that
of accessed pages. Second, a jump over an accessed page table entry would leave
no chance to increment its hotness counter.
3.3 Hot Page Coloring
In this section, we utilize hotness-based partial page coloring to alleviate the online
recoloring overhead in an adaptive and dynamic environment.
3.3.1 MRC-Driven Partition Policy
For a given set of co-running applications, the goal of our cache partition pol-
icy is to improve overall system performance (defined as the geometric mean of
co-running applications’ performance relative to running independently). The re-
alization of this goal depends on an estimation of the optimization target at each
candidate partitioning point. Given the dominance of data access time on mod-
ern processors, we estimate that the application execution time is proportional
to the combined memory and cache access latency, i.e., roughly hit + r · miss,
where hit/miss is the cache hit/miss ratio and r indicates the ratio between cache
and memory access latency. For a given application, the cache miss ratio under
a specific cache allocation size can be estimated from a cache miss ratio curve
(or MRC). Note that while the cache MRC generation requires profiling, the cost
per application is independent of the number of processes running in the system.
An on-the-fly mechanism to learn the cache MRC is possible [Tam et al., 2009].
Figure 3.4 illustrates a simple example of our cache partitioning policy.

33
Figure 3.4: An example of our cache partitioning policy between swim and mcf.
The cache miss ratio curve for each application is constructed (offline or during
an online learning phase) by measuring the miss ratio at a wide range of possible
cache partition sizes. Given the estimation of application performance at each
cache partitioning point, we determine that the best partition point for the two
applications is if 1 MB cache is allocated to swim and 3 MB cache to mcf.
3.3.2 Hotness-Driven Page Recoloring
In a multi-programmed system where context switches occur fairly often, an adap-
tive cache partitioning policy may need to recolor pages to reflect the dynamically
changing co-running applications. Frequent page recoloring may incur substantial
page copying overhead, in some cases more than negating the benefit of adaptive
cache partitioning. Our approach is to recolor a subset of hot (or frequently ac-
cessed) pages, which may realize much of the benefit of all-page coloring at much
reduced cost. Specifically, we specify an overhead budget as the maximum number
of recolored pages (or page copying operations) allowed at each recoloring. Given
this budget, we attempt to recolor the hottest (most frequently accessed) pages

34
to reach the maximal recoloring effect.
Given a budget K, we want to find the hottest K pages for recoloring. This
can be achieved by locating the hotness threshold value of the K-th hottest page.
One fast, constant-space approach is to maintain a hotness page count array to
record the number of pages at each possible hotness value. We can scan from the
highest hotness value downward until we have an accumulative of K pages, at
which point we find the hotness threshold. In our implementation, we maintain
the hotness page count array in each task (process or thread)’s control structure
in the operating system. To better control its space usage, we group multiple,
similar hotness values into one bin so that we only need to record the number of
pages at each possible bin. With 8 bins and a 4-byte page counter at each bin,
we incur a space cost of 32 bytes per task.
Given the set of hot pages to be recolored, we try to uniformly assign these
pages to the new colors. This uniform recoloring helps to achieve low intra-
application cache conflicts. Pseudocode for our recoloring approach is shown in
Figure 3.5.
3.4 Relief of Memory Allocation Constraints
Page coloring introduces new constraints on the memory space allocation. When
a system has plenty of free memory but is short of pages in certain colors, an
otherwise avoidable memory pressure may arise. As a concrete example, two ap-
plications on a dual-core platform would like to equally partition the cache by
page coloring (to follow the simple fairness goal of equal resource usage). Conse-
quently each can only use up to half of the total memory space. However, one of
the applications is an aggressive memory user and would benefit from more than
its memory share. At the same time, the other application needs much less mem-
ory than its entitled half. The system faces two imperfect choices—to enforce

35
procedure Recolor
budget (recoloring budget)
old-colors (thread’s color set under old partition)
new-colors (thread’s color set under new partition)
if new-colors is a subset of old-colors then
subtract-colors = old-colors − new-colors.
Find the hot pages in subtract-colors within the budget limit, and then round-
robin new-colors to recolor them.
end if
if old-colors is a subset of new-colors then
addition-colors = new-colors − old-colors.
Find the hot pages in old-colors within the
|new-colors||addition-colors|
∗ budget limit, and then move at most budget (i.e., |addition-colors||new-colors|
proportion of them) to addition-colors.
end if
Figure 3.5: Procedure for hotness-based page recoloring. A key goal is that hot
pages are distributed to all assigned colors in a balanced way.

36
the equal cache use (and thus force expensive disk swapping for the aggressive
memory user); or to allow an efficient memory sharing (and consequently let the
aggressive memory user pollute the other’s cache share).
In the latter case of memory sharing, a naive approach that colors some ran-
dom pages from the aggressive application to the victim’s cache partition may
result in unnecessary contention. Since a page’s cache occupancy is directly re-
lated to its access frequency, preferentially coloring cold pages to the victim’s
cache partition would mitigate the effect of cache pollution. Our page hotness
identification can be naturally employed to support such an approach. Note that
the resulting reduction of cache pollution can benefit adaptive as well as static
cache partitioning policies (like the example given above).
3.5 Evaluation Results
We implemented the proposed page hotness identification approach and used
it to drive hot page coloring (including adaptive recoloring in dynamic, multi-
programmed environments) in the Linux 2.6.18 kernel. We have also implemented
lazy page copying (proposed earlier by Lin et al. [Lin et al., 2008]), which delays
the copying to the time of first access, to further reduce the coloring overhead.
Specifically, each to-be-recolored page is set invalid in page table entry, and the
actual page copying is performed within the page fault handler triggered by the
next access to the page.
We performed experiments on the dual-core Intel Xeon 5160 3.0GHz “Wood-
crest” platform. The two cores share a single 4 MB L2 cache (16-way set-
associative, 64-byte cache line, 14 cycles latency, writeback). Our evaluation
benchmarks are a set of 12 programs from SPECCPU2000.

37
0%
10%
20%
30%
40%
50%
60%
70%
Ove
rhe
ad
10 milliseconds sampling frequency
gzipwupwise
swimmgrid
applumesa
art mcfequake
parser
bziptwolf
Average
list traversal
sequential table scan
plus locality−jump
0%
2%
4%
6%
8%
10%
12%
Ove
rhe
ad
100 milliseconds sampling frequency
gzipwupwise
swimmgrid
applumesa
art mcfequake
parser
bziptwolf
Average
list traversal
sequential table scan
plus locality−jump
Figure 3.6: Overhead comparisons under different page hotness identification
methods.
Overhead of Page Hotness Identification We compare the page hotness
identification overheads of three methods—page linked list traversal [Zhou et al.,
2004] and our proposed sequential table scan with and without locality-jumping.
In our approach, the page table is traversed twice per scan: once to clear the
access bits at the beginning of the sampled access time window and once to check
them at the end of the window. We set the access time window to 2 milliseconds
in our experiments.
The list traversal approach [Zhou et al., 2004] maintains a linked list of fre-

38
quently accessed pages while the remaining pages are invalidated and monitored
through page faults. The size of the frequently accessed page linked list is an
important parameter that requires careful attention. If the size is too large, list
traversal overhead dominates; if the size is too small, page fault overhead can be
prohibitively high. Raghuraman [Raghuraman, 2003; Zhou et al., 2004] suggests
that a good list size is 30 K pages. Our evaluation revealed that even a value
of 30 K was insufficient to keep the page fault rate low in some instances. We
therefore measured performance using both the 30 K list size and no limit for the
linked list size (meaning all accessed pages are included into the list), and present
the better of the two as a comparison point.
The overhead results at two different sampling frequencies (once per 10 mil-
liseconds and once per 100 milliseconds) are shown in Figure 3.6. When the
memory footprint is small, the linked list of pages can be cached and the over-
head is close to that of a sequential table scan. As the memory footprint becomes
larger, the advantage of spatial locality with a sequential table scan becomes more
apparent. On average, sequential table scan with locality jumping involves mod-
est (7.1%, 1.9%) overhead at 10 and 100 millisecond sampling frequencies. It
improves over list traversal by 71.7% and 47.2%, and over sequential table scan
without locality jumping by 58.1% and 19.6%, at 10 and 100 milliseconds sam-
pling frequencies. To understand the direct effect of locality jumping, Figure 3.7
shows the percentage of page table entries skipped during the scan. On average
we save checking on 63.3% of all page table entries.
Accuracy of Page Hotness Identification We measure the accuracy of our
page hotness identification methods. We are also interested in knowing whether
the locality jumping technique (which saves overhead) would lead to less accurate
identification. The ideal measurement goal is to tell how close our identified page
hotness is to the ”true page hotness”. Acquiring the true page hotness, however,

39
0%
10%
20%
30%
40%
50%
60%
70%
80%
90%
100%
Skip
pe
d e
ntr
ies (
in p
rop
ort
ion
to
all
PT
Es)
gzipwupwise
swimmgrid
applumesa
art mcfequake
parser
bziptwolf
Average
Figure 3.7: Proportion of skipped page table entries (PTEs) due to our locality-
jumping approach in page hotness identification.
is challenging. We approximate it by scanning the page table entries at high
frequency without any locality jumping. Specifically, we employ a high sampling
frequency of once per 2 milliseconds in this approximation and we call its identified
page hotness the baseline.
For a given hotness identification approach, we measure its accuracy by cal-
culating the difference between its identified page hotness and the baseline. To
mitigate the potential weakness of using a single difference metric, we use two
difference metrics in our evaluation. This first is the Jeffrey-divergence, which is
a numerically robust variant of Kullback-Liebler divergence. More precisely, the
Jeffrey-divergence of two probability distributions p and q is defined as:
JD(p, q) =∑
i
(
p(i) log2p(i)
p(i) + q(i)+ q(i) log
2q(i)
p(i) + q(i)
)
.
JD(p, q) measures the divergence in terms of relative entropy from p and q to

40
0
0.2
0.4
0.6
0.8
1
1.2
Jeffre
y d
iverg
ence to b
aselin
e
gzipwupwise
swimmgrid
applumesa
art mcfequake
parser
bziptwolf
Average
sequential table scan
plus locality−jump
naive method
Figure 3.8: Jeffrey divergence on identified page hotness between various ap-
proaches and the baseline (an approximation of “true page hotness”).
p+q
2and it is in the range of [0, 2]. In order to calculate Jeffrey-divergence, page
hotness is normalized such that hotness sums up to 1. Here p(i) and q(i) represent
page i’s measured hotness from the two methods being compared.
The second difference metric we utilize is the rank error rate. Specifically, we
rank pages in hotness order (pages of the same hotness are ranked equally at the
highest rank available) and sum up the absolute rank difference between the two
methods being compared. The rank error rate is the average rank difference per
page divided by the total number of pages.
We measure the page hotness identification of our sequential table scan ap-
proach and its enhancement with locality-jumping. These approaches employ a
sampling frequency of once per 100 milliseconds. As a point of comparison, we
also measure the accuracy of a naive page hotness identification approach which
considers all pages to be equally hot. Note that under our rank order definition,
all pages under the naive method have the highest rank.
Figure 3.10 visually presents the deviation between our identified page hotness
to the baseline for all 12 applications. Results suggest that our hotness identifi-

41
0%
10%
20%
30%
40%
50%R
an
k e
rro
r ra
te t
o b
ase
line
gzipwupwise
swimmgrid
applumesa
art mcfequake
parser
bziptwolf
Average
sequential table scan
plus locality−jump
naive method
Figure 3.9: Rank error rate on identified page hotness between various approaches
and the baseline (an approximation of “true page hotness”).
cation results are fairly accurate overall.
Relieving Memory Allocation Constraints As explained in Section 3.4,
page coloring introduces new memory allocation constraints that may cause oth-
erwise avoidable memory pressure or cache pollution. We examine the effective-
ness of hot-page coloring in reducing the negative effect of such coloring-induced
memory allocation constraints. In this experiment, two applications on a dual
core platform would like to equally partition the cache by page coloring (to follow
the simple fairness goal of equal resource usage). Consequently each can only use
up to half of the total memory space. However, one of the applications uses more
memory than its entitled half. Without resorting to expensive disk swapping, this
application would have to use some memory pages beyond its allocated colors and
therefore pollute the other application’s cache partition.
Specifically, we consider a system with 256 MB memory1. We pick swim as
1The relatively small system memory size is chosen to match the small memory usage in our
SPECCPU benchmarks. We expect that the results of our experiment should also reflect the
behaviors of larger-memory-footprint applications in larger systems.

42
0 1 2 3 4 5
x 104
0
5
10
15
x 10−3
Pages sorted on baseline hotness
Norm
aliz
ed h
otn
ess
gzip
baseline
our result
0 1 2 3 4 5
x 104
0
0.2
0.4
0.6
0.8
1
x 10−4
Pages sorted on baseline hotness
Norm
aliz
ed h
otn
ess
wupwise
baseline
our result
0 1 2 3 4 5
x 104
0
0.2
0.4
0.6
0.8
1
x 10−4
Pages sorted on baseline hotness
Norm
aliz
ed h
otn
ess
swim
baseline
our result
0 5000 10000 150000
1
2
x 10−4
Pages sorted on baseline hotness
Norm
aliz
ed h
otn
ess
mgrid
baseline
our result
0 1 2 3 4 5
x 104
0
5
10
15
x 10−4
Pages sorted on baseline hotnessN
orm
aliz
ed h
otn
ess
applu
baseline
our result
0 500 1000 1500 2000 25000
0.5
1
1.5
2
x 10−3
Pages sorted on baseline hotness
Norm
aliz
ed h
otn
ess
mesa
baseline
our result
0 200 400 600 800 10000
0.5
1
1.5
x 10−3
Pages sorted on baseline hotness
Norm
aliz
ed h
otn
ess
art
baseline
our result
0 0.5 1 1.5 2 2.5
x 104
0
2
4
6
x 10−4
Pages sorted on baseline hotness
Norm
aliz
ed h
otn
ess
mcf
baseline
our result
0 2000 4000 6000 8000 10000 12000 140000
1
2
3
4
x 10−4
Pages sorted on baseline hotness
Norm
aliz
ed h
otn
ess
equake
baseline
our result
0 2000 4000 6000 8000 10000 120000
0.5
1
1.5
x 10−3
Pages sorted on baseline hotness
Norm
aliz
ed h
otn
ess
parser
baseline
our result
0 1 2 3 4 5
x 104
0
5
10
15
20
x 10−4
Pages sorted on baseline hotness
Norm
aliz
ed h
otn
ess
bzip
baseline
our result
0 200 400 600 800 1000 1200 1400
0
1
2
3
x 10−3
Pages sorted on baseline hotness
Norm
aliz
ed h
otn
ess
twolf
baseline
our result
Figure 3.10: All-page comparison of page hotness identification results for sequential
table scan with locality-jumping approach (at once-per-100-millisecond sampling fre-
quency) and the baseline page hotness. Pages are sorted by their baseline hotness. The
hotness is normalized so that the hotness of all pages in an application sum up to 1.
the polluting application with a 190 MB memory footprint. When only half of the
total 256 MB memory is available, swim has to steal about 62 MB from the victim
application’s page colors. Figure 3.10 showed that in swim, 20% of the pages
are exceptionally hotter than the other 80% of the pages, which provides a good
opportunity for our hot-page coloring. We choose six victim applications with
small memory footprints that, without the coloring-induced allocation constraint,
would fit well into the system memory together with swim. They are mesa, mgrid,
equake, parser, art, and twolf.

43
mesa mgrid equake parser art twolf
1
1.2
1.4
1.6
1.8
2
2.2
2.4
Victim applications
No
rma
lize
d e
xe
cu
tio
n t
ime
Random pollutionHotness−aware pollutionNo pollution
Figure 3.11: Normalized execution time of different victim applications under
different cache pollution schemes. The polluting application is swim.
We evaluate three policies: random, in which the polluting application ran-
domly picks the pages to move to the victim application’s entitled colors; hot-page
coloring, which uses the page hotness information to pollute the victim applica-
tion’s colors with the coldest (least frequently used) pages; and no pollution, a
hypothetical comparison base that is only possible with expensive disk swapping.
Figure 3.11 shows the victim applications’ slowdowns under different cache pollu-
tion policies. Compared to random pollution, the hotness-aware policy reduces the
slowdown for applications with high cache space sensitivity. Specifically, for the
two most sensitive victims (art and twolf), the random cache pollution yields 55%
and 124% execution time increases (from no pollution) while the hotness-aware
pollution causes 36% and 86% execution time increases.
Alleviating Page Recoloring Cost In a multi-programmed system where
context switches occur fairly often, an adaptive cache partitioning policy may

44
Figure 3.12: Contention relations of two groups of SPECCPU2000 benchmarks.
If A points to B, that means B has more than 50% performance degradation when
running together with A on a shared cache, compared to running alone when B
can monopolize the whole cache.
need to recolor pages to reflect the dynamically changing co-running applications.
Each of our multi-programmed experiments runs four applications on a dual-
core processor. Specifically, we employ two such four-application groups with
significant intra-group cache contentions. These two groups are {swim, mgrid,
bzip, mcf} and {art, mcf, equake, twolf}, and their contention relations are shown
in Figure 3.12. Within each group, we assign two applications to each sibling core
on a dual-core processor and run all possible combinations. In total, there are 6
tests:
test1 = {swim, mgrid} vs. {mcf, bzip};
test2 = {swim, mcf} vs. {mgrid, bzip};
test3 = {swim, bzip} vs. {mgrid, mcf};
test4 = {art, mcf} vs. {equake, twolf};
test5 = {art, equake} vs. {mcf, twolf};
test6 = {art, twolf} vs. {mcf, equake}.
We compare system performance under several static cache management poli-
cies.

45
• In default sharing, applications freely compete for the shared cache space.
• In equal partition, the two cores statically partition the cache evenly and
applications can only use their cores’ entitled cache space. Under such
equal partition, there is no need for recoloring when co-running applications
change in a dynamic execution environment.
We then consider several adaptive page coloring schemes. As described in Sec-
tion 3.3.2, adaptive schemes utilize the miss-ratio-curve (MRC) to determine a
desired cache partition between co-running applications. Whenever an applica-
tion’s co-runner changes, the application re-calculates an optimal partition point
and recolors pages.
• In all-page coloring, we recolor all pages necessary to achieve the new desired
cache partition after a change of co-running applications. This is the obvious
alternative without the guidance of our hot-page identification.
• The ideal page coloring is a hypothetical approach that models the all-page
coloring but without incurring any recoloring overhead. Specifically, con-
sider the test of {A,B} vs. {C,D}. We run each possible pairing (A-C,
A-D, B-C, and B-D) on two dedicated cores (without context switches) and
assume that the resulting average performance for each application would
match its performance in the multi-programmed setting.
• In hot page coloring, we utilize our page hotness identification to only recolor
hot pages within a target recoloring budget that limits its overhead. The
recoloring budget is defined as an estimated relative slowdown of the appli-
cation (specifically as the cost of each recoloring divided by the time interval
between adjacent recoloring events, which is estimated as the CPU schedul-
ing quantum length). Our experiments consider two recoloring-caused ap-
plication slowdown budgets—5% (conservative) and 20% (aggressive). In

46
100 200 500 8000.9
1
1.1
scheduling time quantum in milliseconds
Avera
ge s
yste
m n
orm
aliz
ed p
erf
orm
ance
test1: {swim, mgrid} vs. {mcf, bzip}
Default Equal Hot (5% budget) Hot (20% budget) All−page Ideal
100 200 500 800
0.6
0.8
1
test2: {swim, mcf} vs. {mgrid, bzip}
100 200 500 800
0.6
0.8
1
test3: {swim, bzip} vs. {mgrid, mcf}
100 200 500 8000.95
1
1.05
1.1
1.15test4: {art, mcf} vs. {equake, twolf}
100 200 500 8000.7
0.8
0.9
1
1.1test5: {art, equake} vs. {mcf, twolf}
100 200 500 800
0.8
0.9
1
1.1
test6: {art, twolf} vs. {mcf, equake}
Figure 3.13: Performance comparisons under different cache management policies
for 6 multi-programmed tests (four applications each) on a dual-core platform.
our implementation, a given recoloring budget is translated into a cap on
the number of recolored pages according to the page copying cost. Copying
one page takes roughly 3 microseconds on our experimental platform.
The recoloring overhead in the adaptive schemes depends on the change fre-
quency of co-running applications, and therefore it is directly affected by the
CPU scheduling quantum. We evaluate this effect by experimenting with a range
of scheduling quantum lengths (100–800 milliseconds). Figure 3.13 presents the
system performance of the 6 tests under different cache management policies. Our
performance metric is defined as the geometric mean of individual applications’
relative performance compared to when running alone and utilizing the whole
cache. All performance numbers are normalized to that of the equal partition
policy.
Our first observation is that the simple policy of equal cache partition achieves
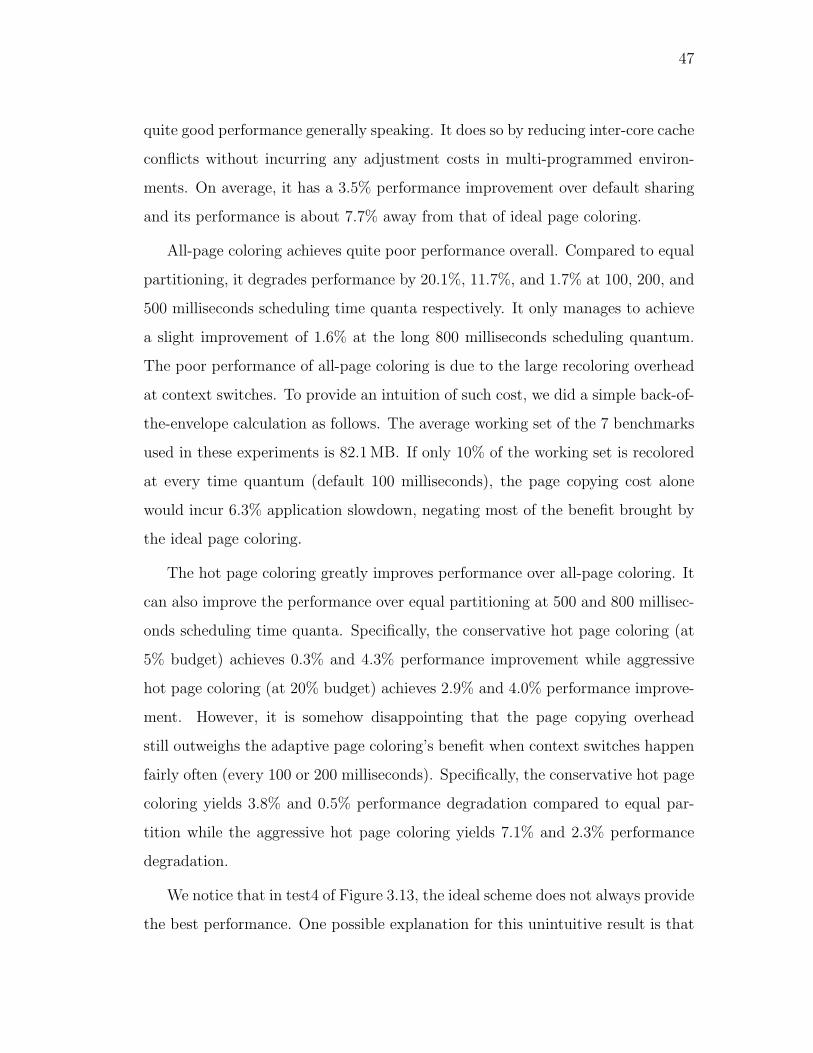
47
quite good performance generally speaking. It does so by reducing inter-core cache
conflicts without incurring any adjustment costs in multi-programmed environ-
ments. On average, it has a 3.5% performance improvement over default sharing
and its performance is about 7.7% away from that of ideal page coloring.
All-page coloring achieves quite poor performance overall. Compared to equal
partitioning, it degrades performance by 20.1%, 11.7%, and 1.7% at 100, 200, and
500 milliseconds scheduling time quanta respectively. It only manages to achieve
a slight improvement of 1.6% at the long 800 milliseconds scheduling quantum.
The poor performance of all-page coloring is due to the large recoloring overhead
at context switches. To provide an intuition of such cost, we did a simple back-of-
the-envelope calculation as follows. The average working set of the 7 benchmarks
used in these experiments is 82.1 MB. If only 10% of the working set is recolored
at every time quantum (default 100 milliseconds), the page copying cost alone
would incur 6.3% application slowdown, negating most of the benefit brought by
the ideal page coloring.
The hot page coloring greatly improves performance over all-page coloring. It
can also improve the performance over equal partitioning at 500 and 800 millisec-
onds scheduling time quanta. Specifically, the conservative hot page coloring (at
5% budget) achieves 0.3% and 4.3% performance improvement while aggressive
hot page coloring (at 20% budget) achieves 2.9% and 4.0% performance improve-
ment. However, it is somehow disappointing that the page copying overhead
still outweighs the adaptive page coloring’s benefit when context switches happen
fairly often (every 100 or 200 milliseconds). Specifically, the conservative hot page
coloring yields 3.8% and 0.5% performance degradation compared to equal par-
tition while the aggressive hot page coloring yields 7.1% and 2.3% performance
degradation.
We notice that in test4 of Figure 3.13, the ideal scheme does not always provide
the best performance. One possible explanation for this unintuitive result is that

48
100 200 500 800
0.1
0.2
0.3
scheduling time quantum in milliseconds
Ave
rag
e u
nfa
irn
ess
test1: {swim, mgrid} vs. {mcf, bzip}
Default Equal Hot (5% budget) Hot (20% budget) All−page Ideal
100 200 500 8000
0.1
0.2
0.3
0.4test2: {swim, mcf} vs. {mgrid, bzip}
100 200 500 800
0.1
0.2
0.3
0.4test3: {swim, bzip} vs. {mgrid, mcf}
100 200 500 800
0.1
0.2
test4: {art, mcf} vs. {equake, twolf}
100 200 500 8000.15
0.2
0.25
0.3
0.35
test5: {art, equake} vs. {mcf, twolf}
100 200 500 8000.15
0.2
0.25
0.3
test6: {art, twolf} vs. {mcf, equake}
Figure 3.14: Unfairness comparisons (the lower the better) under different cache
management policies for 6 multi-programmed tests (four applications each) on a
dual-core platform.
our page recoloring algorithm (described in Section 3.3.2) also considers intra-
thread cache conflicts by distributing pages to all assigned colors in a balanced
way. Such intra-thread cache conflicts are not considered in our ideal scheme.
An Evaluation of Fairness We also study how these cache management poli-
cies affect the system fairness. We use an unfairness metric, defined as the coef-
ficient of variation (standard deviation divided by the mean) of all applications’
normalized performance. Here, each application’s performance is normalized to its
execution time when it monopolizes the whole cache resource. If normalized per-
formance is fluctuating across different applications, unfairness tends to be large;
if every application has a uniform speedup/slowdown, then unfairness tends to
be small.

49
We evaluate the execution unfairness of the 6 tests we examined in Section 3.5.
Figure 3.14 shows the results under different cache management policies. Results
show that equal partition performs poorly, simply because it allocates cache space
without knowledge of how individual applications’ performance will be affected.
The unfairness of default sharing is not as high as one may expect, because this
set of benchmarks exhibits contention in both directions for most pairs, resulting
in relatively uniform poor performance for individual ones. Ideal page coloring
is generally better (lower unfairness metric value) than default sharing and equal
partition. Hot and all-page coloring perform similarly to what they did in the
performance results: they gradually approach the fairness of ideal page coloring
as the page copying cost becomes amortized by longer scheduling time quanta. It
also suggests that expensive page coloring may be worthwhile in cases where the
quality-of-service (like those in service level agreements) is the first priority and
customized resource allocation is needed. Note that our cache partition policy
does not directly take fairness into consideration. It should be possible to derive
other metrics to optimize fairness and to use other metric for fairness.
3.6 Related Work and Summary
Hardware-based cache partitioning schemes mainly focus on modifying cache
replacement policies and can be categorized by partition granularity: way-
partitioning [Chiou et al., 2000; Qureshi and Patt, 2006] and block-
partitioning [Suh et al., 2001b; Zhao et al., 2007; Rafique et al., 2006]. Way-
partitioning (also called column partitioning in [Chiou et al., 2000]) restricts cache
block replacement for a process to within a certain way, resulting in a maximum
of n slices or partitions with an n-way associative cache. Block-partitioning allows
partitioning blocks within a set, but is more expensive to implement. It usually
requires hardware support to track cache line ownership. When a cache miss

50
occurs, a cache line belonging to an over-allocated owner is preferentially evicted.
Cho and Jin [Cho and Jin, 2006] first proposed the use of page coloring to
manage data placement in a tiled CMP architecture. Their goal was to reduce
a single application’s cache miss and access latency. Tam et al. [Tam et al.,
2007a] first implemented page coloring in the Linux kernel for cache partitioning
purposes, but restrict their implementation and analysis to static partitioning
of the cache among two competing threads. Lin et al. [Lin et al., 2008] further
extended the above to dynamic page coloring. They admitted that recoloring a
page is clearly an expensive operation and should be attempted rarely in order
to make page coloring beneficial. Soares et al. [Soares et al., 2008] remap high
cache miss pages to dedicated cache sets to avoid polluting pages with low cache
misses. These previous works either only consider a single application or two co-
running competing threads, where frequent page recoloring is not incurred. Also,
they mainly target one beneficial aspect of page coloring, rather than developing a
practical and viable solution within the operating system. Our approach alleviates
two important obstacles: memory pressure and frequent recoloring when using the
page coloring technique.
Kim et al. [Kim et al., 2004] proposed 5 different metrics for L2 cache fairness.
They use cache miss or cache miss ratio as performance (or normalized perfor-
mance) and define fairness as the difference between the maximum and minimum
performance of all applications. Our fairness metric in Section 3.5 takes all appli-
cations’ performance into consideration and tends to be more numerically robust
than only considering max and min. Iyer et al. [Iyer et al., 2007] proposed 3
types of quality-of-service metrics (resource oriented, individual, or overall perfor-
mance oriented) and statically/dynamically allocated cache/memory resources to
meet these QoS goals. Hsu et al. [Hsu et al., 2006] studied various performance
metrics under communist, utilitarian, and capitalist cache polices and made the
conclusion that thread-aware cache resource allocation is required to achieve good

51
performance and fairness. All these studies focus on resource management in the
space domain. Another piece of work by Fedorova et al. [Fedorova et al., 2007]
proposed to compensate/penalize threads that went under/over their fair cache
share by modifying their CPU time quanta.
We present an efficient approach to tracking application page hotness on-the-
fly. Beyond supporting hot-page coloring in this work, the page hotness identifica-
tion has a range of additional utilization in operating systems. We provide some
examples here. The page hotness information we acquire is an approximation of
page access frequency. Therefore our approach can support the implementation
of LFU (Least-Frequently-Used) memory page replacement. As far as we know,
existing LFU systems [Lee et al., 2001; Sokolinsky, 2004] are in the areas of storage
buffers, database caches, and web caches where each data access is a heavy-duty
operation and precise data access tracking does not bring significant additional
cost. In comparison, it is challenging to efficiently track memory page access fre-
quency for LFU replacement and our page hotness identification helps tackle this
problem. In service hosting platforms, multiple services (often running inside vir-
tual machines) may share a single physical machine. It is desirable to allocate the
shared memory resource among the services according to their needs. The page
hotness identification may help such adaptive allocation by estimating the service
memory needs at a given hotness threshold. This is a valuable addition to ex-
isting methods. For instance, it provides more fine-grained, accurate information
than sampling-based working set estimation [Waldspurger, 2002]. Additionally,
it incurs much less runtime overhead than tracking exact page accesses through
minor page faults [Lu and Shen, 2007].
Driven by the page hotness information, we propose new approaches to mit-
igate practical obstacles faced by current page coloring-based cache partitioning
on multicore platforms. The results of our work make page coloring-based cache
management a more viable option for general-purpose systems, although with

52
cost amortization time-frames that are still higher than typical operating system
time-slice. In parallel, computer architecture researchers are also investigating
new address translation hardware to make page coloring extremely lightweight.
We expect features provided by new hardware in the near future to allow more
efficient operating system control. In the meanwhile, we hope our proposed ap-
proach could aid performance isolation in existing multicore processors on today’s
market.

53
4 Resource-aware Scheduling on
Multi-chip Multicore
Machines
In the previous Chapter, we show that hot-page coloring can alleviate the adverse
effects of naive page coloring. However, its effectiveness is somewhat constrained
by the frequency of expensive page recoloring. Therefore, we explore in this Chap-
ter a more flexible solution— resource-aware scheduling.
It is well known that different pairings of applications on resource-sharing mul-
tiprocessors may result in different levels of resource contention and thus differ-
ences in performance. Resource-aware scheduling tries to co-schedule applications
in a way such that performance penalty due to contention on shared resources is
minimized. We propose a simple resource-aware scheduling heuristic which groups
applications with similar cache miss ratios on the same multicore chip on multi-
chip multicore machines. Our experimental results show that it not only improves
performance but also creates more opportunities for power savings.

54
4.1 Resource Contention on Multi-chip Multi-
core Machines
Due to the scalability limitations of today’s multicore microarchitectures, multi-
chip multicore machines are commonplace. These machines can be organized
either as symmetric multiprocessors (SMP) or as non-uniform memory accessing
(NUMA) architectures.
On a SMP machine, there is typically a shared memory bus directly connected
to all chips. This shared memory bus has the key advantage of deterministic mem-
ory access. Its disadvantage is limited bus bandwidth and contention as more cores
are added into the system. For machines based on a NUMA architecture, each chip
has its dedicated memory controller to its local memory. Remote memory accesses
are completed by inter-chip communication through a point-to-point interconnect
such as the HyperTransport in AMD technology or the QuickPath Interconnect
in Intel technology. The key advantage of this design is that the aggregated bus
bandwidth scales with the number of chips. The cost is a loss of uniform memory
access.
In this work, we focus on SMP-based multi-chip multicore machines since
the memory bandwidth contention is more severe. We are going to show how a
simple yet efficient scheduling policy can help mitigate contention on both memory
bandwidth and cache space.
4.1.1 Mitigating Memory Bandwidth Contention
Merkel et al. [Merkel and Bellosa, 2008a] profiled a set of SPECCPU benchmarks
and found that memory bus bandwidth is a critical resource on multicore chips.
Based on this observation, they advocated mixing memory-bound (indicated by
high cache misses per instruction) and CPU-bound applications (indicated by

55
low cache misses per instruction) on sibling cores of the same chip to mitigate
bandwidth contention. Such a mixing approach mitigates memory bandwidth
contention within a multicore chip and we refer to this method as complementary
mixing scheduling. A natural extension is to apply the same method for each
multicore chip on a multi-chip machine.
As an alternative, we propose a similarity grouping method to tackle band-
width contention on SMP-based multi-chip platforms. Specifically, we group ap-
plications with similar cache miss ratios on the same multicore chip. For example,
on a two-chip machine, one chip hosts high miss ratio applications while the other
chip only hosts low miss ratio applications. Since cache miss ratio is significantly
correlated with the memory intensity as shown in Figure 4.1, our approach avoids
saturating memory bandwidth (both chips are running memory hungry appli-
cations) or under-utilizing memory bandwidth (both chips are running memory
non-intensive applications).
Although our similarity grouping appears to contradict complementary mix-
ing, in reality, they both accomplish mitigating memory bandwidth congestion
by avoiding simultaneously running memory intensive applications on all cores.
Complementary mixing focuses on temporal scheduling of applications on a single
chip, while similarity grouping focuses on spatial partitioning of applications over
multiple chips.
There does exist a subtle difference between the two methods with respect to
reducing memory bandwidth contention. Suppose we have two memory inten-
sive and two non-intensive applications running on a two-chip dual-core machine.
Complementary mixing will place two memory intensive applications on two dif-
ferent chips and such placement will likely consume more bandwidth than that of
putting the two on the same chip (which is what similarity grouping will do). If
the co-scheduled other two non-intensive applications have no memory access at
all, then complementary mixing has the advantage of using up available memory

56
0
20
40
60
80
100
mcfswim
equakeapplu
wupwise
mgridparser
bzipgzip
mesatwolf
art
Miss−ratio(L2 misses per kilo data references)
Miss−rate(L2 misses per kilo instructions)
Figure 4.1: Cache miss-ratio (L2 cache misses per kilo data references )and cache
miss-rate (L2 misses per kilo instructions) of 12 SPECCPU2000 benchmarks. In
general, these two metrics show high correlation. We label the first six benchmarks
(mcf, swim, equake, applu, wupwise, and mgrid) as high miss-ratio applications
and the later six ones (parser, bzip, gzip, mesa, twolf, and art) as low miss-ratio
applications.
bandwidth. However, this extreme of memory access assumption is not true for
most commodity applications. Furthermore, Moscibroda and Mutlu [Moscibroda
and Mutlu, 2007] pointed out that current memory access scheduling algorithms
favor streaming applications because they usually have good DRAM row buffer lo-
cality. It also implies that non-intensive applications’ memory accesses will likely
experience longer delays when they compete against memory intensive applica-
tions. As a contrast, similarity grouping throttles memory intensive applications’
bandwidth consumption by putting them on the same chip and makes room for
other applications to get their share of limited memory bandwidth.

57
512 1024 2048 40960
0.1
0.2
0.3
0.4
0.5
0.6
0.7
0.8
0.9
1
Cache size in kilobytes
Norm
aliz
ed c
ache m
iss r
atios
applu, equake, mgrid
mcfswimequakeappluwupwisemgridparserbzipgzipmesatwolfart
Figure 4.2: Normalized miss ratios of 12 SPECCPU2000 benchmarks at different
cache sizes. The normalization base for each application is its miss ratio at 512 KB
cache space. Cache size allocation is enforced using page coloring [Zhang et al.,
2009b]. Solid lines mark the six applications with the highest miss ratios while
dotted lines mark the six applications with the lowest miss ratios. Threshold of
labeling high/low miss-ratio is based on their miss-ratio values shown in Figure 4.1.
4.1.2 Efficient Cache Sharing
In practice, memory intensive applications not necessarily benefit much from large
cache capacity. For example, streaming applications do not need much cache
space. Applications typically exhibit high miss ratios because their working sets
do not fit in the cache. Increasing available cache space is not likely to improve
performance until the cache size exceeds its total working set, which is typically
at least one order of magnitude larger than current cache size (typically 4∼16

58
MB). This can be observed from the normalized L2 cache miss ratio curves of
12 SPECCPU2000 benchmarks, shown in Figure 4.2. With the exception of mcf,
most high miss ratio applications (applu, equake, mgrid, swim, and wupwise) show
small or no benefits with additional cache space beyond 512 KB. As a contrast,
low miss ratio applications (twolf, art, bzip, and mesa) are more sensitive to cache
space. Interestingly, we also see two low miss ratio applications (parser and gzip)
are not that sensitive to cache space. These two applications take large input files
and temporally work on a small part of the files before moving to next part. Their
temporal working set can fit in cache and they do not need large cache space even
though their total memory footprint is huge (hundreds of MB).
While they do not benefit from larger cache capacity, memory intensive ap-
plications will more aggressively occupy cache space than memory non-intensive
applications and result in adverse cache thrashing effects on memory non-intensive
applications. Recall in Figure 1.1, when low miss ratio applications art and twolf
run together with high miss ratio application swim, it is always the low miss ratio
applications that suffer more severe performance degradation. When another high
miss ratio application equake runs together with swim, equake exhibits less perfor-
mance degradation than art and twolf do. This cache thrashing effect on memory
non-intensive applications will increase their cache misses and make them gradu-
ally become memory intensive, which in turn results in more bandwidth pressure
as a return. Similarity grouping helps reduce these adverse effects by separat-
ing low and high miss ratio applications on different chips. When low miss ratio
applications run together, they can hold more cache space than when they co-
run with high miss ratio applications, simply because their co-runners are less
aggressive. Therefore, in addition to mitigating memory bandwidth contention,
similarity grouping can lead to more efficient cache sharing on multicore chips.

59
4.2 Additional Benefits on CPU Power Savings
Besides effective hardware resource sharing, power is another important factor
in systems. Our similarity grouping achieves additional benefits on CPU power
savings by engaging chip-wide voltage/frequency scaling opportunities.
4.2.1 Constraint of DVFS on Multicore Chips
Dynamic voltage/frequency scaling (DVFS) has been studied for more than ten
years, but most previous work is focused on uniprocessors. On multicore chips,
voltage/frequency scaling is subject to an important constraint. Most current
processors use off-chip voltage regulators (some use on-chip regulators but on a
per-chip rather than per-core basis), they require that all sibling cores be set to
the same voltage level. For example, a single voltage/frequency setting applies
to the entire multicore chip on Intel processors [Naveh et al., 2006]. AMD family
10h processors do support per-core frequency selection, but they still maintain
the highest voltage level required for all cores [AMD Corporation, 2009], which
limits power savings. Per-core on-chip voltage regulators add design complexity
and die real estate cost and are a subject of ongoing architecture research [Kim
et al., 2008].
Voltage/frequency scaling is most efficient for memory intensive applications
since their performance is largely dependent on the memory component rather
than CPUs. To maximize power savings from per-chip frequency scaling while
minimizing performance loss, it is essential to group applications with similar
memory intensities to sibling cores on a processor chip. A simple metric that
indicates such behavior is the application’s on-chip cache miss ratio—a higher
miss ratio indicates a larger delay due to off-chip resource (typically memory)
accesses that are not subject to frequency scaling-based speed reduction. This

60
property makes our similarity grouping a good scheduling policy in such problem
context.
4.2.2 Model-Driven Frequency Setting
It is desirable to trade performance in a controlled fashion (e.g., bounded per-
formance loss) for power savings. For that purpose, we need an estimation of
the target metrics at candidate CPU frequency levels. Several previous stud-
ies [Weissel and Bellosa, 2002; Isci et al., 2006] utilized offline constructed fre-
quency selection lookup tables. Such an approach requires a large amount of
offline profiling. Merkel and Bellosa employed a linear model based on memory
bus utilization [Merkel and Bellosa, 2008a] but it only supports a single frequency
adjustment level. Kotla et al. [Kotla et al., 2004] constructed a performance model
for variable CPU frequency levels. Specifically, they assume that all cache and
memory stalls are not affected by the CPU frequency scaling while other delays
are scaled in a linear fashion. However, their model was not evaluated on real
frequency scaling platforms.
In practice, on-chip cache accesses are also affected by frequency scaling, which
typically applies to the entire chip. We corrected this aspect of Kotla’s model.
Specifically, our variable-frequency performance model assumes that the execution
time is dominated by memory and cache access latencies, and that the execution
of all other instructions can be overlapped with these accesses. Accesses to off-chip
memory are not affected by frequency scaling while on-chip cache access latencies
are linearly scaled with the CPU frequency. Let T (f) be the average execution
time of an application when the CPU runs at frequency f . Then:
T (f) ∝F
f· (1 − RCacheMiss) · LHit + RCacheMiss · LMiss,
where F is the maximum CPU frequency. LHit and LMiss are access latencies of
cache hit and miss respectively measured at full speed. We assume that these

61
access latencies are platform-specific constants that apply to all applications. Us-
ing a micro-benchmark, we measured that the cache hit and miss latencies are
around 3 and 121 nanoseconds respectively on our experimental platform. Strictly
speaking, the cache miss latency also spends cycles on cache, but that portion is
relatively small as compared to cycles spent on memory and it does not change our
model’s accuracy qualitatively. For simplicity, we assume cache miss latency does
not vary as frequency changes. The miss ratio RCacheMiss represents the propor-
tion of data accesses that go to memory. Specifically, it is measured as the ratio
between the L2 cache misses (L2 LINES IN with hardware prefetch also included)
and data references (L1D ALL REF) performance counters on our processors [In-
tel Corporation, 2006].
With the definition of T (·), the normalized performance (as compared to run-
ning at the full CPU speed) at a throttled frequency f is T (F )T (f)
. To calculate it
online, we also need to estimate the application’s cache miss ratio when it runs at
the full CPU speed. Fortunately Rcachemiss does not change across different CPU
frequency settings so we can simply use the online measured cache miss ratio. Fig-
ure 4.3 shows the accuracy of our model when predicting the performance of 12
SPECCPU2000 benchmarks and two server benchmarks (TPC-H and SPECJbb)
at different frequencies. Results show that our model achieves a prediction accu-
racy of no more than 6% error for the 14 applications.
The variable-frequency performance model allows us to set the per-chip CPU
frequencies according to specific performance objectives. For instance, we can
bound the slowdown of any application while achieving the maximal power saving
possible. The online adaptive frequency setting must react to dynamic execution
behavior changes. Specifically, we monitor our model parameter Rcachemiss and
make changes to the CPU frequency setting when necessary.

62
0
0.25
0.5
0.75
1
Norm
aliz
ed p
erf
orm
ance
(A) Measured performance at throttled CPU frequencies
mcf
swim
equake
applu
wupw
ise
mgrid
parser
bzipgzip
mesa
twolf
artTPC
H
SPECjbb
[email protected] [email protected] [email protected]
−6%
−3%
0%
3%
6%
mcf
swim
equake
applu
wupw
ise
mgrid
parser
bzipgzip
mesa
twolf
artTPC
H
SPECjbb
Model err
or
(B) Model prediction error at throttled CPU frequencies
Figure 4.3: The accuracy of our variable-frequency performance model. Figure
(A) shows the measured normalized performance (to that of running at the full
CPU speed of 3 GHz). Figure (B) shows our model’s prediction error (defined as
prediction−measurementmeasurement
).
4.3 Evaluation Results
Our experimental platform is a 2-chip SMP running Linux 2.6.18 kernel. Each
chip is an Intel 3 GHz mutlicore processor with two cores sharing a 4 MB L2 cache.
We modified the kernel to support per-chip DVFS at 3, 2.67, 2.33, and 2 GHz
on our platform. Configuring the CPU frequency on a chip requires writing to
platform-specific IA32 PERF CTL registers, which takes around 300 cycles on our
processor. Because the off-chip voltage switching regulators operate at a relatively

63
low speed, it may require some additional delay (typically at tens of microsecond
timescales [Kim et al., 2008]) for a new frequency and voltage configuration to
take effect.
Test Chip Similarity grouping Complementary mixing
#1 0 {equake, swim} {swim, parser}
1 {parser, bzip} {equake, bzip}
#2 0 {mcf, applu} {mcf, art}
1 {art, twolf} {applu, twolf}
#3 0 {wupwise, mgrid} {wupwise, mesa}
1 {mesa, gzip} {mgrid, gzip}
#4 0 {mcf, swim, equake, {swim, equake, applu,
applu, wupwise, mgrid} wupwise, gzip, twolf}
1 {parser, bzip, gzip, {mcf, mgrid, parser,
mesa, twolf, art} bzip, mesa, art}
#5 0 2 SPECJbb threads 1 SPECJbb thread and
1 TPC-H thread
1 2 TPC-H threads 1 SPECJbb thread and
1 TPC-H thread
Table 4.1: Benchmark suites and scheduling partitions of 5 tests. Complementary
mixing mingles high-low miss-ratio applications such that two chips are equally
pressured in memory bandwidth. Similarity grouping separates high and low miss-
ratio applications on different chips (Chip-0 hosts high miss-ratio ones in these
partitions).
Our experiments employ 12 SPECCPU2000 benchmarks (applu, art, bzip,
equake, gzip, mcf, mesa, mgrid, parser, swim, twolf, wupwise) and two server-
style applications (TPC-H and SPECJbb2005). We design five multi-program
test scenarios using our suite of applications. Each test includes both memory
intensive and non-intensive benchmarks. Benchmarks and scheduling partitions
are detailed in Table 4.1.

64
Test−1 Test−2 Test−3 Test−4 Test−5 Average0
0.2
0.4
0.6
0.8
1
1.2
Norm
aliz
ed p
erf
orm
ance
Default
Similarity grouping
Complementary mixing
Figure 4.4: Performance (higher is better) of the different scheduling policies at
full CPU speed.
Scheduling Comparison First, we compare the overall performance of the de-
fault Linux (version 2.6.18) scheduler, complementary mixing (within each chip),
and similarity grouping (across chips) scheduling policies.
Figure 4.4 compares the performance of the different scheduling policies when
both chips are running at full CPU speed. For each test, the geometric mean of
the applications’ performance normalized to the default scheduler is reported. On
average, similarity grouping is about 4% and 8% better than default and comple-
mentary mixing respectively. Test-2 shows particularly encouraging performance
improvement with similarity grouping, about 12.8% and 19% respectively over the
default system and complementary mixing. We also observe 25% and 30% respec-
tively average cache miss (average over the four applications in this test) reduction
over default and complementary mixing in this test. This result demonstrates that
similarity grouping can help reduce cache space interference and memory band-
width contention to achieve better performance. We also measure the power con-
sumption of these policies using a WattsUpPro meter [Watts Up] which measures
whole system power at a 1 Hz frequency. Our test platform consumes 224 watts
when idle and 322 watts when running our highest power-consuming workload.
We notice that similarity grouping consumes slightly more power, up to 3 watts

65
as compared to the default Linux scheduler. However, the small power increase is
offset by its superior performance, leading to improved power efficiency.
Test−1 Test−2 Test−3 Test−4 Test−5 Average0
0.2
0.4
0.6
0.8
1
Norm
aliz
ed p
erf
orm
ance
(A) Performance comparison
Default (chip−0@2Ghz)
Similarity grouping (chip−0@2Ghz)
Complementary mixing (chip−0@2Ghz)
Test−1 Test−2 Test−3 Test−4 Test−5 Average0
0.05
0.1
0.15
Perf
orm
ance loss
(B) Performance loss due to frequency scaling
Figure 4.5: Performance comparisons of different scheduling policies when Chip-
0 is scaled to 2 GHz. In subfigure (A), the performance normalization base is
the default scheduling without frequency scaling in all cases. In subfigure (B),
the performance loss is calculated relative to the same scheduling policy without
frequency scaling in each case.
Next, we examine how performance degrades when the frequency of one of the
two chips is scaled down. Default scheduling does not employ CPU binding and
applications have equal chances of running on any chip, so deploying frequency
scaling on either Chip-0 or Chip-1 has the same results. We only scale Chip-0 for
similarity grouping scheduling since it hosts the high miss-ratio applications. For
complementary mixing, scaling Chip-0 shows slightly better results than scaling
Chip-1. Hence, we report results for all three scheduling policies with Chip-

66
0 scaled to 2 GHz. Figure 4.5 shows that similarity grouping still achieves the
best overall performance (shown by subfigure (A)) and the lowest self-relative
performance loss under frequency scaling (shown by subfigure (B)).
Test−1 Test−2 Test−3 Test−4 Test−5 Average0
0.2
0.4
0.6
0.8
1
No
rma
lize
d p
erf
orm
an
ce
(A) Performance comparison
Default
Similarity grouping
Similarity grouping (chip−[email protected])
Similarity grouping (chip−[email protected])
Similarity grouping (chip−0@2Ghz)
Test−1 Test−2 Test−3 Test−4 Test−5 Average220
240
260
280
300
320
340
Po
we
r in
Wa
tts
(B) Power consumption comparison
Figure 4.6: Performance and power consumption for per-chip frequency scaling
under the similarity grouping schedule. Figure (B) only shows the range of active
power (from idle power at around 224 watts), which is mostly consumed by the
CPU and memory in our platform.
Nonuniform Frequency Scaling We then evaluate the performance and
power consumption of per-chip nonuniform frequency scaling under similarity
grouping. We keep Chip-1 at 3 GHz and only vary the frequency on Chip-0 where
high miss-ratio applications are hosted. Figure 4.6(B) shows significant power

67
saving due to frequency scaling—specifically, 8.4, 15.8, and 23.6 watts power sav-
ings on average for throttling Chip-0 to 2.67, 2.33, and 2 GHz respectively. At the
same time, Figure 4.6(A) shows that the performance when throttling Chip-0 is
still quite comparable to that with the default scheduler.
Test−1 Test−2 Test−3 Test−4 Test−5 Average0
0.2
0.4
0.6
0.8
1
Norm
aliz
ed p
erf
. per
watt
(A) Whole system power efficiency comparison
Test−1 Test−2 Test−3 Test−4 Test−5 Average0
0.5
1
1.5
Norm
aliz
ed p
erf
. per
watt
(B) Active power efficiency comparison
Default
Similarity grouping
Similarity grouping (chip−[email protected])
Similarity grouping (chip−[email protected])
Similarity grouping (chip−0@2Ghz)
Figure 4.7: Power efficiency for per-chip frequency scaling under the similarity
grouping schedule. Figure (A) uses whole system power while (B) uses active
power in the efficiency calculation.
We next evaluate the power efficiency of our system. We use performance
per watt as our metric of power efficiency. Figure 4.7(A) shows that, on aver-
age, per-chip nonuniform frequency scaling achieves a modest (4–6%) increase in
power efficiency over default scheduling. The idle power on our platform is sub-
stantial (224 watts). Considering a hypothetical energy-proportional computing
platform [Barroso and Hlzle, 2007] on which the idle power is negligible, we use
the active power (full operating power minus idle power) to estimate the power

68
efficiency improvement. In this case, Figure 4.7(B), scaling Chip-0 at 2.67, 2.33,
and 2 GHz achieves 13%, 21%, and 32% better active power efficiency respectively.
Test−1 Test−2 Test−3 Test−4 Test−5
0.5
0.7
0.91
1.1N
orm
aliz
ed p
erf
orm
ance
(A) Performance of most degraded application in each test
Similarity grouping
Similarity grouping (baseline, chip−0@2Ghz)
Similarity grouping (fairness with 10% perf. thrhold)
Test−1 Test−2 Test−3 Test−4 Test−5220
240
260
280
300
320
340
Pow
er
in W
atts
(B) System power consumption comparison
Figure 4.8: Performance and power consumption for baseline and fair per-chip
frequency scaling under the similarity grouping scheduling.
Application Fairness While it shows encouraging overall performance, the
baseline per-chip nonuniform frequency scaling does not provide any performance
guarantee for individual applications. For example, setting Chip-0 to 2 GHz causes
a 26% performance loss for mgrid as compared to the same schedule without
frequency scaling.
To be fair to all applications, we want to achieve power savings with bounded
individual performance loss. Based on the frequency-performance model men-
tioned in Section 4.2.2, our system will dynamically configure frequency setting
to control the performance degradation of running applications within a certain

69
threshold (e.g., 10% in this experiment). Note that in this case the system may
scale down any processor chip as long as the performance degradation threshold
is not exceeded.
Figure 4.8(A) shows the normalized performance of the most degraded appli-
cation in each test. We observe that fairness-controlled frequency scaling is closer
(than the baseline scaling) to the 90% performance threshold line. It completely
satisfies the threshold for three tests while it exhibits slight violations in test-3 and
test-4. The most degraded application in these cases is mgrid, whose performance
is 6% and 3% away from the 90% threshold in test-3 and test-4 respectively. Sec-
tion 4.2.2, Figure 4.3 shows that our model over-estimates mgrid’s performance
by up to 6%. This inaccuracy causes the fairness violation in test-3 and test-
4. Figure 4.8(B) shows power savings for both baseline and fairness-controlled
frequency scaling. Fairness-controlled frequency scaling provides better quality-
of-service while achieving comparable power savings to the baseline scheme.
Test−1 Test−2 Test−3 Test−4 Test−5−6
−4
−2
0
2
4
6
Tem
pera
ture
changes
Similarity grouping
Similarity grouping (chip−[email protected])
Similarity grouping (chip−[email protected])
Similarity grouping (chip−0@2Ghz)
Similarity grouping (dynamic scaling w. 10% performance tradeoff)
Figure 4.9: On-chip temperature changes in Celsius degree for the per-chip fre-
quency scaling under the similarity grouping scheduling. In each case, we present
a relative number beyond(+) or below(-) the temperature measured under the
default scheduling.

70
Thermal Reduction A by-product of power savings is the reduction of CPU
heat dissipation. We can observe this by reading the CPU temperature from the
on-chip digital thermal meter on our Intel processor [Intel Corporation, 2006].
The output of such digital meter has a resolution of 1◦ Celsius and is a relative
value below a hardware specific temperature threshold (typically ranging from
85◦ to 105◦ Celsius). A recently published data sheet [Intel Corporation, 2009b]
suggests such threshold on our platform is 105◦ Celsius, which translates to 59◦
Celsius average CPU working temperature in the original system.
Figure 4.9 shows that per-chip nonuniform frequency scaling can reduce the
average CPU temperature (averaged over four cores) by up to 5◦ Celsius. This
could gain additional power savings due to a reduction in the cooling needs. Note
that we see throttled cores usually have lower temperature than unthrottled ones.
One may be concerned that unbalanced heat dissipation can adversely affect the
hardware reliability and lifetime. A possible solution to alleviate such concern
is to periodically migrate or swap workloads across different chips [Merkel and
Bellosa, 2008b].
4.4 Discussion and Summary
A number of previous studies have explored adaptive CPU scheduling to im-
prove system performance. We refer readers to section 2.2 for more complete
elaboration. As a matter of SMP platforms, Antonopoulos et al. [Antonopoulos
et al., 2003] are the first to demonstrate performance benefits of bandwidth-aware
scheduling on a real SMP machine. We believe memory bandwidth is a critical
issue on future machines and make a further step to target multicore-based sym-
metric multiprocessors. We have seen a slow but stable trend of increasing core
numbers on a single chip, which will exacerbate the contention for memory band-
width. Fortunately, memory technology advancement offers significant help to
71
tackle this problem. Measured using the STREAM benchmark [McCalpin, 1995],
our testbed with Intel Woodcrest 3 GHz CPUs (two dual-core chips) and 2GB
DDR2 533 MHz memory achieves 2.6 GB/sec memory bandwidth. In comparison,
a newer Intel Nehalem machine with 2.27 GHz CPUs (one quad-core chip) and
6GB DDR3 1,066 MHz memory achieves an 8.6 GB/sec memory bandwidth.
The idle power constitutes a substantial part (about 70%) of the full system
power consumption on our testbed, which questions the practical benefits of opti-
mizations on active power consumption. However, we are optimistic about future
hardware designs toward more energy-proportional platforms [Barroso and Hlzle,
2007]. We have already observed this trend—the idle power constitutes a smaller
part (about 60%) of the full power on the newer Nehalem machine. In addition,
our measurement shows that per-chip nonuniform frequency scaling can reduce
the average CPU temperature (by up to 5 degrees Celsius, averaged over four
cores), which may lead to additional power savings on cooling.
To summarize, we advocate a simple scheduling policy that groups applica-
tions with similar cache miss ratios on the same multicore chip. On one hand,
such scheduling improves the performance due to reduced cache interference and
memory contention. On the other hand, it facilitates per-chip frequency scaling
to save CPU power and reduce heat dissipation.
Guided by a variable-frequency performance model, our CPU frequency scal-
ing can save about 20 watts of CPU power and reduce up to 5◦ Celsius of CPU
temperature on average on our multicore platform. These benefits were realized
without exceeding the performance degradation bound for almost all applications.
This result demonstrates the strong benefits possible from per-chip adaptive fre-
quency scaling on multi-chip, multicore platforms.

72
5 Hardware Execution
Throttling
Modern processors provide hardware mechanisms, such as duty-cycle modulation,
voltage/frequency scaling, and cache prefetcher adjustment, to control the execu-
tion speed or resource access latency for an application. Although these mecha-
nisms were originally designed for other purposes, we argue that they can be an
effective tool to support resource management of shared resources on multicores.
We refer to these hardware features as hardware execution throttling mecha-
nisms. Compared to other software-based resource management mechanisms, we
find that hardware execution throttling is very flexible and lightweight in providing
resource usage control. We further propose a flexible framework to automatically
find an optimal (or close to optimal) hardware execution throttling configuration
for a user-specified management objective.
5.1 Comparisons of Existing Multicore Manage-
ment Mechanisms
We first compare the effectiveness and overhead of three existing multicore re-
source management mechanisms: CPU scheduling quantum adjustment, page col-
oring, and hardware execution throttling.

73
0 1000 2000 3000 4000 50000.1
0.2
0.3
0.4
0.5
0.6
Time order in milliseconds
Instr
uctio
n t
hro
ug
hp
ut
(IP
C)
of
SP
EC
jbb
Sched. quantum adjustment Hardware throttling
Figure 5.1: SPECJbb’s performance when its co-runner swim is regulated us-
ing two different approaches: scheduling quantum adjustment (default 100-
millisecond quantum) and hardware throttling. Each point in the plot represents
performance measured over a 50-millisecond window.
5.1.1 Effectiveness
CPU scheduling quantum adjustment is a mechanism proposed by Fedorova et
al. [Fedorova et al., 2007] to maintain fair resource usage on multicores. They
advocate adjusting the CPU scheduling time quantum to increase or decrease an
application’s relative CPU share. By compensating/penalizing applications un-
der/over fair cache usage, the system tries to maintain equal cache miss rates
across all applications (which is considered fair). It does not work for real time
applications where there is no concept of scheduling quantum. It works best when
CPUs are over-committed, in another word, the number of threads is larger than
number of CPUs. When CPUs are under-committed modifying threads’ time
quantum would not change their resource usage since each CPU hosts no more

74
0
0.05
0.1
0.15
0.2
0.25
Unfa
irness facto
r
default hardware sharing
page coloring partitioning
time quantum adjustment
hardware execution throttling
Co−schedule swim and SPECWeb on two sibling cores sharing a 4MB L2 cache
Figure 5.2: We co-schedule swim and SPECWeb on an Intel Woodcrest chip
where two sibling cores share a 4MB L2 cache. Here we compare the effectiveness
of different mechanisms in reducing unfairness.
than one thread. De-scheduling is a possible extension of it in this case. How-
ever, the key disadvantage of this kind mechanism is that it manages resource
at a coarse grain comparable to the scheduling quantum size, which may cause
fluctuating performance when scrutinized at finer granularity. As a demonstra-
tion, we run SPECJbb and swim on a dual-core chip. Consider a hypothetical
resource management scenario where we need to slow down swim by a factor of
two. We compare two approaches—the first adds an equal-priority idle process
on swim’s core; the second throttles the duty cycle at swim’s core to half the
full speed. Figure 5.1 illustrates SPECJbb’s performance over time under these
two approaches. For scheduling quantum adjustment, SPECJbb’s performance
fluctuates dramatically because it highly depends on whether its co-runner is the
idle process or swim. In comparison, hardware throttling leads to more stable

75
performance behaviors due to its fine-grained execution speed regulation.
Page coloring only controls cache space allocation and has no direct control
over memory bandwidth. Also its effectiveness is curbed by the memory alloca-
tion constraint. For example, Figure 5.2 shows the unfairness comparison of those
mechanisms when applied to co-scheduling of swim and SPECWeb. Although
all three mechanisms are all able to reduce unfairness factor as compared to de-
fault hardware sharing, page coloring shows comparatively higher unfairness than
the other two alternatives. Under page coloring, if swim was entitled to a very
small portion of the cache space, its mapped memory pages might be less than
its required memory footprint, resulting in thrashing (page swapping to disk).
If swim’s cache usage is not curtailed, SPECWeb’s performance is significantly
affected. These two competing constraints result in page coloring not achieving
good enough fairness in this case. As a contrast, scheduling quantum adjustment
and hardware execution throttling are more flexible in controlling individual appli-
cations’ resource usage. In addition, hardware execution throttling can effectively
throttle both cache space and bandwidth usage by controlling a thread’s running
speed.
5.1.2 Overhead
CPU scheduling quantum adjustment needs to modify the existing kernel schedul-
ing module to reflect the compensation or penalty, which requires a modest
amount of efforts.
The overhead of page coloring mainly comes from the expensive overhead of
recoloring. Without extra hardware support, recoloring a page means copying
a memory page and it usually takes several microseconds on typical commodity
platforms (3 microseconds on our test platform). In addition to runtime overhead,
its implementation requires significant modification on existing kernel memory

76
management (our implementation involves more than 700 lines of Linux source
code changes in more than 10 files).
Hardware execution throttling uses existing hardware features and incurs very
little overhead. On a 3.0 GHz machine, configuring the duty cycle takes 265+350
(read plus write register) cycles; configuring the prefetchers takes 298+2065 (read
plus write register) cycles; configuring voltage/frequency scaling takes 240 + 310
(read plus write register) cycles. The control registers also specify other fea-
tures in addition to our control targets, so we need to read their values before
writing. The longer time for a new prefetching configuration to take effect is
possibly due to clearing obsolete prefetch requests in queues. Voltage/frequency
changes usually happen after some additional delay (typically at tens of microsec-
ond timescales [Kim et al., 2008]) because the off-chip voltage switching regulators
operate at a relatively low speed. Enabling these hardware features requires very
little kernel modification. Our changes to the Linux kernel source are ∼50 lines
of code in a single file.
We have focused on the comparisons of the various existing resource control
mechanisms. Built on a good mechanism, it may still be challenging to identify
the best control policy during online execution and exhaustive search of all possi-
ble control policies may be very expensive. In such cases, our hardware execution
throttling approaches are far more appealing than page coloring due to our sub-
stantially cheaper re-configuration costs. Nevertheless, more efficient techniques
to identify the best control policy are desirable.

77
5.2 Hardware Throttling Based Multicore Man-
agement
In the previous section, we have shown the advantages of hardware execution
throttling mechanisms. In following paragraphs, we are going to show how one
can build management infrastructure based on hardware execution throttling.
We first describe the actual throttling mechanisms used in our framework and
management objectives we focus on. We then present a simple heuristic-based
solution and point out its limitation. A more advanced approach is described in
Section 5.3.
5.2.1 Throttling Mechanisms in Consideration
We mainly consider duty cycle modulation and dynamic voltage/frequency scaling
(DVFS) as throttling mechanisms due to their relatively predictable effects on
application’s running.
On our experimental platform, the operating system can specify a fraction
(e.g., multiplier of 1/8) of total CPU cycles during which the CPU is on duty.
The processor is effectively halted during non-duty cycles for a duration of ∼3
microseconds [Intel Corporation, 2009a]. Different duty cycle ratios are achieved
by keeping the time for which the processor is halted at a constant duration of
∼3 microseconds (for all ratios other than 1 when the processor is operating at
full speed) and adjusting the time period for which the processor is enabled.
DVFS has a relatively smaller range of throttling effectiveness with a maximal
scaling factor 2/3 on our platforms (e.g., scale from 3 GHz to 2 GHz). DVFS is
often deployed to achieve good active power efficiency (performance divided by
active power), since it not only throttles hardware activities but also the voltage
level at which hardware is running. In contrast, duty cycle modulation does not

78
reduce the voltage level and is less efficient in terms of power usage. Support for
DVFS on Intel processors [Naveh et al., 2006; Intel Corporation, 2008a] applies to
the entire chip rather than to individual cores, however.
These two mechanisms also differ in their throttling effectiveness on memory
intensive applications. The effect of DVFS is that throttled cores slow their rate of
computation at a fine per-cycle granularity, although outstanding memory accesses
continue to be processed at regular speed. On applications with high demand for
memory bandwidth, the resulting effect may be that of matching processor speed
to memory bandwidth rather than that of throttling memory bandwidth utiliza-
tion. In contrast, the microsecond granularity of duty cycle modulation ensures
that memory bandwidth utilization is reduced, since any back-log of requests is
drained quickly, so that no memory and cache requests are made for most of the
3 microsecond non-duty cycle duration. Thus, duty cycle modulation has a more
direct influence on memory bandwidth consumption [Herdrich et al., 2009].
5.2.2 Resource Management Policies
Our goal is to find an n-core hardware throttling configuration that best satisfies
a service-level agreement. Our targeted service-level agreement is performance
oriented rather than resource-allocation oriented [Hsu et al., 2006; Waldspurger
and Weihl, 1994]. This is more challenging because predicting an application’s
performance in the presence of competition for shared resources is difficult.
We consider two kinds of constraints in service-level agreements:
• The fairness-centric constraint enforces roughly equal performance progress
among multiple applications. We are aware that there are several possible
definitions of fair use of shared resources [Hsu et al., 2006]. The particular
choice of fairness measure should not affect the main purpose of our evalu-
ation. In our evaluation, we use communist fairness, or equal performance

79
degradation compared to a standalone run for the application. Based on
this fairness goal, we define an unfairness factor metric as the coefficient
of variation (standard deviation divided by the mean) of all applications’
performance normalized to that of their individual standalone run.
• The QoS-centric constraint provides a guarantee of a certain level of perfor-
mance to a high priority application. In this case, we call this application
the QoS application and we call the core that the QoS application runs on
the QoS core.
Given a service-level agreement with one such constraint, the best configuration
should maximize performance (or power efficiency in case of DVFS) while meet-
ing the constraint. In the rare case that no possible configuration can meet the
agreement constraint, we deem the closest one as the best. For example, for con-
figurations C1 and C2, if both C1 and C2 meet the agreement constraint, but C1 has
better performance than C2 does, then we say C1 is a better configuration than
C2. Also, if neither of the two configurations meet the constraint but C1 is closer
to the target constraint than C2, then we say C1 is better than C2.
5.2.3 A Simple Heuristic-Based Greedy Solution
Previous research has shown that heuristic-based approaches can be effective mul-
ticore resource management policies, particularly in the case of partitioning the
shared cache space [Suh et al., 2004]. Therefore we first consider a heuristic-driven
greedy approach for our problem of determining a desirable execution throttling
configuration. Our algorithm begins by sampling the configuration with every
CPU running at full speed. At each step of the greedy process, we lower one
core’s duty cycle level by one. To guide such a greedy move, we use a perfor-
mance metric that correlates with our constraint optimization to estimate the
effect of lowering each core’s duty cycle level.

80
This simple solution is driven by hardware performance counters on modern
processors. After investigating the relationships between counter metrics such
as last level cache references, last level cache misses, CPU cycles, and retired
instructions, we found a cycles-per-instruction (CPI) ratio metric to be a useful
guide to the greedy exploration. Specifically, the metric is the ratio between the
CPI when the application runs alone (without resource contention) and the CPI
when it runs along with other applications. Intuitively, this ratio provides direct
information on how an application’s performance is affected by contention.
For resource management with a fairness-centric constraint, we start from
the configuration that every CPU runs at full speed and then slow down one
core’s running speed by one level (could be either duty cycle or DVFS) at each
greedy step. The chosen core at each step is the one with the the highest CPI
ratio. The rationale is that this core contributes to the most unfairness in the
system and therefore slowing it down would most likely lead to the largest fairness
improvement. The greedy moves stop when the fairness constraint is met. We
also stop when the last configuration results in worse fairness than the previous
one. In this case, we return to the previous configuration, which has the best
fairness among those examined. Note that at each step of the greedy approach,
we need to measure the performance and fairness of the current configuration.
For resource management with a QoS-centric constraint, we again start from
the configuration with every CPU running at the full speed. At each greedy step,
we decrease one level of the core with the highest CPI ratio among the non-QoS
cores. This heuristic is based on the assumption that the higher the CPI ratio is,
the more aggressive the application tends to be in competition for shared cache
and memory bandwidth resources. By slowing down this core, a higher-priority
core has a better chance of meeting its QoS target with fewer duty cycle downward
adjustments.
By nature, a greedy approach may not settle on the globally optimal solution.

81
Further, since our heuristic only serves as a hint of the performance effect of
throttling adjustment, it may also lead to non-optimal configurations. Another
problem is that since each greedy step makes a small configuration adjustment,
the algorithm often requires many steps to arrive at its chosen configuration and
consequently requires a large number of measurements at sample configurations.
Finally, in a dynamic online environment, when a system condition change or
application phase change calls for a new configuration, the greedy exploration-
based approach needs to redo the sample-based search. With this realization, we
propose a more advanced solution in Section 5.3.
5.3 A Flexible Model-Driven Iterative Refine-
ment Framework
In light of the weaknesses of the heuristic-based greedy exploration approach, we
propose a more advanced approach that uses model-driven iterative refinement.
The approach maintains a set of system throttling configurations that have been
executed before and records interested metrics at these configurations. We call
each such previously executed configuration a reference configuration and we call
the whole set the reference set. The heart of this approach is a customizable model
that estimates the per-core performance using collected metrics at the reference
configurations. The predicted per-core performance can then be used to predict
the whole system performance and unfairness metrics. In each iteration, the model
will pick a predicted “best” configuration and configure the system to execute at
this configuration, which then becomes a new reference.
If the model can reflect the trend of performance changes across different con-
figurations, after each iteration, the predicted “best” configuration is more likely
to be better than existing references. As we get more reference configurations in

82
an area, the model’s accuracy in that area tends to improve. Therefore it is more
likely to make better predictions and increase the chance of finding the optimal
configuration in the area.
This is an iterative refinement process. The refinement ends when a predicted
best configuration is already a previously executed reference configuration (and
therefore would not lead to a growth of the reference set or better modeling). In
some cases, such an ending condition may lead to too many configuration samples
with associated cost and little benefit. Therefore, we introduce an early ending
condition so that refinement stops when no better configurations (as defined in
Section 5.2.2) are identified after several steps.
The new approach addresses some of the weaknesses of the heuristic-based
greedy exploration approach. Unlike the small configuration adjustment at each
greedy step, the model predicts performance for all candidate configurations and
picks the “best” one. This allows a faster convergence than the greedy approach.
Further, the iterative refinement nature of this approach makes it better suited
to a dynamic online environment. New performance measurements (potentially
replacing older samples at the same configuration) can be added to the reference
set, allowing the model to gradually adapt its predictions based on the new data.
5.3.1 Performance Prediction Models
To include a throttling mechanism in our framework, we need to construct a model
to predict the performance of possible throttling configurations using collected
metrics at previously executed references. Next we present such performance
models for two throttling mechanisms, as well as an approach to predict the
performance of a hybrid configuration involving both mechanisms.
Duty Cycle Modulation Suppose we have an n-core system and each core
hosts a CPU intensive application. Our model utilizes a set of reference configu-

83
rations whose performance is already known through past measurements. At the
minimum, the sample reference set contains n + 1 configurations: n single-core
running-alone configurations (i.e., ideal runs) and a configuration of all cores run-
ning at full speed (i.e., default). Note that the running-alone performance can
be measured offline. Also note that more reference sample configurations may
become available as the iterative refinement progresses.
We represent a throttling configuration as s = (s1, s2, ..., sn) where si’s corre-
spond to individual cores’ duty cycle levels. We collect the CPI of each running
application using performance counters and calculate appi’s normalized perfor-
mance, P si . Specifically, P s
i is the ratio between the CPI when appi runs alone
(without resource contention) and its CPI when running at configuration s.
Generally speaking, an application will suffer more resource contention if its
sibling cores run at higher speed. To quantify that, we define the sibling pressure
of application appi under configuration s = (s1, s2, ..., sn) as:
(5.1) Bsi =
n∑
j=1,j 6=i
sj.
We first assume application’s performance degrades linearly to its sibling pres-
sure, and the linear coefficient k can be approximated as:
(5.2) k =P ideal
i − Pdefaulti
Bideali − Bdefault
i
,
where P ideali and P
defaulti are appi’s performance under ideal and default config-
urations respectively.
For a given target configuration t = (t1, t2, ..., tn), we need to choose a reference
configuration r = (r1, r2, ..., rn) which is the closest to t in our reference set. We
introduce sibling Manhattan distance between configuration r and t w.r.t appi as:
(5.3) Di(r, t) =n
∑
j=1,j 6=i
|rj − tj|.
84
The closest reference r would be one with minimum such distance.
If r and t have the same duty cycle level on appi (i.e., ri = ti), we simply apply
the linear coefficient k to them. If not, we assume application’s performance is
linear to its duty cycle level as long as its sibling pressure does not change. So
appi’s performance under configuration t can be estimated as:
(5.4) E(P ti ) = P r
i ·ti
ri
+ k · (Bti − Br
i ).
Equation (5.4) says that an application’s performance is affected by two main
factors: the duty cycle level of the application itself and sibling pressure from its
sibling cores. The first part of the equation assumes a linear relationship between
the application’s performance to its duty cycle level. The second part assumes
performance degradation caused by inter-core resource contention is linear to the
sum of duty cycle levels of sibling cores.
The first assumption is largely true through our experience of dealing with
duty cycle modulation and it is usually a major factor in deciding application’s
performance. The second assumption is a simplified approximation. Admittedly,
different cores may exert different amount of resource contention at different re-
source components even if they are set to the same duty cycle level. It is even
possible to consider individual cores’ resource usage heuristics (e.g., cache miss
rate) as weight to enhance our sibling pressure calculation. We address this over-
simplification by searching a closest reference configuration to proximate similar
resource contention from all sibling cores. Besides that, we argue the model im-
perfection can be mitigated by the iterative refinement nature of our framework.
Voltage/Frequency Scaling We borrow a simple frequency-to-performance
model from Section 4.2.2. Specifically, it assumes that the execution time is dom-
inated by memory and cache access latencies, and accesses to off-chip memory are
not affected by frequency scaling while on-chip cache access latencies are linearly

85
scaled with the CPU frequency. Let F be the maximal frequency and f a scaled
frequency, T (F ) and T (f) be execution times of an application when the CPU
runs at frequency F and f . Then we have the performance at f (normalized to
running at the full frequency F ):
(5.5)T (F )
T (f)=
(1 − RF) · LCacheHit + RF · LCacheMiss
Ff· (1 − Rf) · LCacheHit + Rf · LCacheMiss
LCacheHit and LCacheMiss are access latencies of cache hit and miss respectively
measured at full speed, which we assume are platform-specific constants. Rf and
RF are run-time cache miss ratios measured by performance counters at frequency
f and F . Since DVFS is applied to the whole chip, it barely or modestly changes
shared cache space competition among sibling cores on the same chip. We assume
RF equals Rf as long as all cores’ duty cycle configurations are the same for two
different runs.
A Hybrid Model Recall that in Section 5.3.1 we need to find a reference duty
cycle configuration to estimate the normalized performance of a target configu-
ration. After adding DVFS, we have two components (duty cycle and DVFS) in
a configuration setting. Thus, when we pick a closest reference configuration, we
first find the set of samples with the closest DVFS configuration on appi, then we
pick the one with minimum sibling Manhattan distance as we did in Section 5.3.1.
When we estimate the performance of the target, if the reference has the same
DVFS settings as the target, the estimation is exactly the same as Equation (5.4).
Otherwise, we first estimate the reference’s performance at the target’s DVFS set-
tings using the Equation (5.5), and then use the estimated reference performance
to predict the performance at the target configuration.

86
5.3.2 Online Deployment Issues
In an online system, we continuously monitor applications’ behavior and adapt
system-wide throttling accordingly. The online system uses cycles-per-instruction
(CPI, captured by hardware performance counters) as run-time performance guid-
ance and only requires baseline performance (running each application alone) and
SLA targets as inputs. We discuss some important design issues below.
Accelerating Duty Cycle Search Since our model can estimate the perfor-
mance at any duty cycle configuration, we can simply apply the model to all
possible configurations and choose the best. Given an n-core system with a maxi-
mum of m modulation levels, we would need to apply the model computation mn
times, one for each possible configuration.
On our test platform (a quad-core 2.27 GHz Nehalem chip), it takes about 10
microseconds to estimate a configuration. If we calculate all 84 (4-core system
with 8 modulation levels) configurations each round, that would incur consider-
able overhead. To reduce computation overhead, we introduce a hill climbing
algorithm to prune the mn search space. Using our Nehalem platform as an ex-
ample, suppose we are currently at a configuration {x, y, z, u}, then we calculate
(or fork) 4 children configurations: {x− 1, y, z, u}, {x, y− 1, z, u}, {x, y, z − 1, u},
and {x, y, z, u−1}. The best one of the 4 configurations will be chosen as the next
fork position. Note that the sum of the modulation-level of the next fork position
{x′, y′, z′, u′} is 1 less than the sum of the current fork position {x, y, z, u}:
x′ + y′ + z′ + u′ = x + y + z + u − 1.
In our example, the first fork position is {8, 8, 8, 8} (default configuration that
every core runs at full speed). The end condition is that we either cannot fork
any more or find a configuration that meets our unfairness or QoS constraint.
The rationale for ending at the first satisfying configuration is that we assume an

87
ancestor with configuration {x, y, z, u} has no worse overall performance than its
descendant configuration {x′, y′, z′, u′} (here x′ ≤ x, y′ ≤ y, z′ ≤ z, u′ ≤ u).
Under this hill climbing algorithm, the worst-case search cost for a system
with n cores and m modulation levels occurs when forking from {m,m, ...,m} to
{1, 1, ..., 1}. Since the difference between the sum of the modulation-levels of two
consecutive forking positions is 1, and the first fork position has a configuration
sum of m ·n while the last one has a configuration sum of n, the total possible fork
positions is m · n − n. Each of these fork positions will probe at most n children.
So, we examine (m− 1)n2 configurations in the worst case, which is substantially
cheaper than enumerating all mn configurations.
Robustness to Behavior Changes A robust system needs to be adaptive to
behavior changes and we consider this aspect in our design. Our online system
continuously monitors applications’ behavior and overwrites old samples to new
samples with the same configuration to reflect recency. By doing so, our iterative
framework takes a phase-change as a mistaken prediction and automatically in-
corporates the behavior at the current configuration into the model to correct the
next round prediction.
A long sampling interval increases the time required to determine the appro-
priate configuration, while a short sampling interval can result in instability due to
frequent changes in behavior. We use a sampling frequency of once every second,
which was empirically determined to avoid instability due to fine-grained behavior
variation.
5.4 Evaluation Results
Experimental Setup Our evaluation is conducted on two platforms: the first
is an Intel Xeon E5520 2.27 GHz “Nehalem” quad-core processor running a Linux
88
2.6.30 kernel. Each core has a 32 KB L1 data and instruction cache and a 256 KB
unified L2 cache. The four cores share a 16-way 8 MB L3 cache. We disable
hyper-threading on this platform. The other is a 2-chip SMP running a Linux
2.6.18 kernel. Each chip is an Intel “Woodcrest” dual-core with a 32 KB per-core
L1 data cache and a 4 MB L2 cache shared by two sibling cores. We implemented
necessary kernel support for performance counter, duty cycle modulation, and
DVFS on our platforms.
Each of our experiments runs four different applications with each one pinned
to a specific core. We picked 5 combinations (out of 8 SPECCPU2000 benchmarks)
of quad-applications that showed severe resource contention when run together.
set-1 = {mesa, art, mcf, equake},
set-2 = {swim, mgrid, mcf, equake},
set-3 = {swim, art, equake, twolf},
set-4 = {swim, applu, equake, twolf},
set-5 = {swim, mgrid, art, equake}.
We also include 4 server-style applications:
{TPC-H, WebClip, SPECWeb, SPECJbb}.
TPC-H runs on the MySQL 5.1.30 database. Both WebClip and SPECWeb
use independent copies of the Apache 2.0.63 web server. WebClip hosts a set of
video clips, synthetically generated following the file size and access popularity
distribution of the 1998 World Cup workload [Arlitt and Jin, 1999]. SPECWeb
hosts a set of static web content following a Zipf distribution. SPECJbb runs on
IBM 1.6.0 Java. All applications are configured with 300∼400 MB footprints so
that they can fit into the memory we have on our test platforms.

89
5.4.1 Offline Evaluation
We first populate possible configurations of 5 SPECCPU2000 sets on the Nehalem
platform. Since DVFS is only applied on a per-chip basis, we only consider duty
cycle modulation in this first experiment. Our Nehalem platform supports 8 duty-
cycle levels for each individual core, resulting in a total of 84 possibilities. Since
the configurations with lower duty-cycles will have very long execution times, we
only populate duty-cycle levels from 8 (full speed) to 4 (half speed) to limit our
experimental time for the exhaustive search. We also avoid configurations in which
all cores are throttled (i.e., we want at least one core to run at full speed). So in
total we try 54 − 44 = 369 configurations for each set. Each configuration runs
for tens of minutes and the average execution times are used as stable results. In
total, it took us two weeks to populate the configuration space for 5 test sets. In
the following sections we present the offline evaluation on these populated sets.
Evaluation Methodology Our examined service level agreements (SLAs) are
the two discussed in Section 5.2.2. For fairness-centric tests, we consider unfair-
ness 0.05, 0.10, 0.15, and 0.20 as thresholds. For QoS-centric tests, we consider
normalized performance 0.50, 0.55, 0.60, and 0.65 as targets for a selected applica-
tion in each set. Here, we pick mcf in set-1 and set-2, twolf in set-3 and set-4, art in
set-5 as the high-priority QoS applications, because they are the most negatively
affected applications in the default co-running (i.e. no throttling at all).
There may be multiple configurations satisfying an agreement target, so we
also calculate an overall performance metric to compare their quality. For a set
of applications, their overall performance is defined as the geometric mean of
their normalized performance. We use execution time as the performance met-
ric for SPECCPU2000 applications, and throughput for server applications. For
the fairness-centric test, the overall performance includes all co-running appli-
cations. For the QoS-centric test, the overall performance only includes those

90
non-prioritized applications (e.g., no QoS guarantee). Our goal is therefore to
find a configuration that maximize overall performance while satisfy SLA targets.
We also compare the convergence speed of different methods, i.e., the number
of configurations sampled before selecting a configuration that meets the con-
straints. We assume that we have the performance samples of the applications’
standalone runs beforehand, so they are not counted in the number of samples.
2 4 6 8 100
0.1
0.2
0.3
0.4
0.5
0.6
Avg. P
erf
. P
redic
tion E
rror
Number of Sample
(a) Set−1
2 4 6 8 100
0.1
0.2
0.3
0.4
0.5
0.6
Avg. P
erf
. P
redic
tion E
rror
Number of Sample
(b) Set−2
2 4 6 8 100
0.1
0.2
0.3
0.4
0.5
0.6
Avg. P
erf
. P
redic
tion E
rror
Number of Sample
(c) Set−3
2 4 6 8 100
0.1
0.2
0.3
0.4
0.5
0.6
Avg. P
erf
. P
redic
tion E
rror
Number of Sample
(d) Set−4
2 4 6 8 100
0.1
0.2
0.3
0.4
0.5
0.6
Number of Sample
Avg. P
erf
. P
redic
tion E
rror
(e) Set−5
swim (model)
mgrid (model)
art (model)
equake (model)
mesa (model)
mcf (model)
twolf (model)
applu (model)
swim (naive)
mgrid (naive)
art (naive)
equake (naive)
mesa (naive)
mcf (naive)
twolf (naive)
applu (naive)
Figure 5.3: Accuracy comparison of our model and a naive method. Performance
prediction error is defined as |prediction−measurement|measurement . The average prediction error of
each application in each set is reported here. Solid lines represent prediction by our
model and dashed lines represent prediction by a naive method.

91
1 2 3 40
1
2
3
4
5
6
(8,8,8,8)
(6,7,8,7)
(5,8,8,6)
(6,7,8,6)
optimal config (6,7,8,6) by Oracle
L1
Dis
. to
Op
tim
al
N−th Sample
1 2 30
5
10
15
(8,8,8,8)
(4,6,8,6)
(4,5,8,4)
optimal config (4,5,8,4) by Oracle
L1
Dis
. to
Op
tim
al
N−th Sample
1 2 3 4 5 6 70
1
2
3
4
5
6
(8,8,8,8)
(6,5,8,6)
(6,6,8,8)
(6,6,8,6)
(7,5,8,7)
(8,6,8,7)
(7,5,8,7)
optimal config (7,5,8,7) by Oracle
L1
Dis
. to
Op
tim
al
N−th Sample
1 2 30
1
2
3
4
5
6
(8,8,8,8)
(6,6,8,6)
(6,5,8,6)
optimal config (7,5,8,7) by Oracle
L1
Dis
. to
Op
tim
al
N−th Sample
1 2 3 40
0.02
0.04
0.06
0.08
0.1
Avg
. P
red
ictio
n E
rro
r
N−th Sample
(a) Set−1 w. unfairness 0.10
1 2 30
0.02
0.04
0.06
0.08
0.1
Avg
. P
red
ictio
n E
rro
r
N−th Sample
(b) Set−2 w. QoS 0.60
1 2 3 4 5 6 70
0.02
0.04
0.06
0.08
0.1
Avg
. P
red
ictio
n E
rro
rN−th Sample
(c) Set−5 w. unfairness 0.05
1 2 30
0.02
0.04
0.06
0.08
0.1
Avg
. P
red
ictio
n E
rro
r
N−th Sample
(d) Set−2 w. unfairness 0.10
Figure 5.4: Examples of our iterative model for some real tests. X-axis shows the N -th
sample. For the top half of the figure, the Y-axis is the L1 distance (or Manhattan dis-
tance) from the current sample to optimal (best configuration as chosen by the Oracle).
Configuration is represented as a quad-tuple (u, v, w, z) with each dimension indicating
the duty cycle level of the corresponding core. For the bottom half of the figure, Y-axis
is the average performance prediction error of all considered points over applications in
the set. Here considered points are selected according to the hill climbing algorithm in
Section 5.3.2.
Accuracy of Iterative Model We first evaluate the accuracy of our model
in predicting the performance of arbitrary duty-cycle configurations. Here we
randomly sample x configurations and our model will use them as a reference pool
to calculate the performance of other unobserved configurations. As a comparison,
we also consider a naive method that uses the average performance of sampled
configurations to estimate other configurations.
Figure 5.3 shows that our method achieves reasonable accuracy (≤0.17 error
rate after 5 samples). It also consistently beats the naive method across all tests.

92
This is because the performance variation of an application is large in our cases
(even though we only profile from full to half duty cycle level) and the average
value cannot be used to make an acceptable prediction. The accuracy of our model
remains stable (and in some cases improves) as more configurations are sampled,
converging quickly to a stable value after at most 5 samples. The naive method
on the other hand is sensitive to the specific samples across which averaging is
performed at these small sample numbers.
While these experiments demonstrate that our model is reasonably accurate
when using random sampling, in reality, we do not randomly sample configura-
tions. Given a service level target, our model tends to sample a region where the
optimal configuration resides. We show four examples of real tests on the Nehalem
platform in Figure 5.4. In all cases, average accuracy of the considered points is
improved relative to random sampling, demonstrating that adding samples close
to the configuration points of interest does improve accuracy. We present con-
figurations as a quad-tuple (u, v, w, z) with each letter indicating the duty cycle
level of the corresponding core (as shown in top half of Figure 5.4). The first
sample (8, 8, 8, 8) (i.e. default configuration where every core runs at full speed)
is usually not close to the optimal configuration (measured by the L1 distance
from the best configuration as chosen by the Oracle), but our model automat-
ically adjusts subsequent samples toward the optimal region (represented by a
smaller L1 distance). The iterative procedure terminates when the predicted best
configuration is the same as the current configuration, which is the configuration
picked by the Oracle in Figures 5.4 (a) and (b). It is possible that our model will
terminate at a different configuration from that chosen by the Oracle (as in Fig-
ure 5.4 (d), where the L1 distance is not zero when the algorithm terminates) by
discovering a local minimum, although the SLA is satisfied. The model may also
continue sampling even after discovering a satisfying configuration in the hopes of
discovering a better configuration: in Figure 5.4 (c), it finds the Oracle-predicted

93
set−1 set−2 set−3 set−4 set−50
0.05
0.1
0.15
0.2
0.25
Unfa
irness
(a) Unfairness comparison
Oracle Model Search Non−iterative Model Search Greedy Explore Random
set−1 set−2 set−3 set−4 set−50.5
0.6
0.7
0.8
0.9
1
1.1
Norm
aliz
ed P
erf
orm
ance
(b) Overall system performance comparisonset−1 set−2 set−3 set−4 set−5
0
5
10
15
Sam
ple
Num
ber
(c) Sample number comparison
Figure 5.5: Comparison of methods with unfairness ≤ 0.10. In (a), the unfairness
target threshold is indicated by a solid horizontal line (lower is good). In (b),
performance is normalized to that of Oracle. In (c), Oracle require zero samples.
configuration (7, 5, 8, 7) at the 5th sample, but continues to explore (8, 6, 8, 7). If
the next prediction is within the set of sampled configurations ((7, 5, 8, 7) in this
case), the algorithm concludes that a better configuration will not be found and
stops exploration.
Comparison of Different Methods We compare the results of several meth-
ods: Oracle is the optimal baseline that always automatically selects the op-
timal configuration — the configuration with the best overall performance (as
defined in Section 5.4.1) while satisfying the unfairness or QoS constraint. Model
Search is the model-driven iterative refinement approach we propose in this work.
Non-iterative Model Search is the same as Model Search but without iterative
refinement. Greedy Explore is the heuristic-based greedy exploration approach as
described in Section 5.2.3. Random Search randomly samples 15 configurations
and picks the best one.
Figure 5.5 shows the results using a 0.10 unfairness threshold. From Figure 5.5
a), we can see that only Oracle and Model Search satisfy the constraints for each
experiment (indicated by unfairness below the horizontal solid line). Figure 5.5

94
set−1 set−2 set−3 set−4 set−50
0.2
0.4
0.6
Hig
h−
priority
App P
erf
.
(a) QoS Comparison of high−priority app
Oracle Model Search Non−iterative Model Search Greedy Explore Random
set−1 set−2 set−3 set−4 set−5
0.6
0.8
1
1.2
Norm
. Low
−priority
Apps P
erf
.
(b) Overall performance of other three low−priority appsset−1 set−2 set−3 set−4 set−5
0
5
10
15
Sam
ple
Num
ber
(c) Sample number comparison
Figure 5.6: Comparison of methods for high-priority thread QoS ≥ 0.60. In
(a), the QoS target is indicated by a horizontal line (higher is good). In (b),
performance is normalized to that of Oracle. In (c), Oracle require zero samples.
b) shows the corresponding overall performance normalized to the performance of
Oracle. In some tests, Non-iterative Model Search, Greedy Explore and Random
Search show better performance than Oracle, but in each case, they fail to meet
the unfairness target. Only Model Search meets all unfairness requirements and
is very close to (less than 2%) the performance of Oracle. Figure 5.5 c) shows the
number of samples before a method settles on a configuration. We see that Model
Search and Greedy Explore are comparable in terms of convergence speed in this
test.
Figure 5.6 shows results of QoS tests with 0.60 performance target for a selected
high-priority application. From Figure 5.6 a), we can see that Oracle, Model
Search, and Greedy Explore all meet the QoS target (equal or higher than the 0.6
horizontal line). However, Model Search consistently achieves better performance
than Greedy Explore: Model Search is only within 7% below Oracle while Greedy
Explore could be 30% lower than that. The tests (e.g., set-2) where Non-iterative
Model Search and Random Search show better performance than Oracle fail to
meet the QoS target. In set-1, Random Search gets lower performance while fails
the QoS test. Figure 5.5 c) shows that Model Search has more stable convergence

95
Method Num of times Avg. num Avg. Norm. Avg. Norm.
pass targets of sample performance performance
(of 18 common (of any test
tests) passing target)
Oracle 39/40 0 100% 100%
Model 39/40 4.1 99.6% 99.4%
Non-iterative Model 23/40 1 94.1% 95.0%
Greedy explore 33/40 4.2 98.1% 96.8%
Random 25/40 15 90.9% 91.1%
Table 5.1: Summary of the comparison among methods.
speed (3∼5 samples) than Greedy Explore (2∼13 samples) across different tests.
The convergence speed of Greedy Explore is largely determined by how far away
the satisfying configuration is from the starting point since it only moves one level
of duty cycle at each step. This could be a serious limitation for for systems with
many cores and more configurations. Model Search converges quickly because it
has the ability to estimate the whole search space at each step.
In total, we have 8 tests (4 parameters for both unfairness and QoS) for 5 sets
and we summarize the 40 tests in Table 5.1. Model Search meets SLA targets in
almost all cases except in one (set-2 with QoS target ≥ 0.65) where there is no
configuration in the populated range we explore (duty cycle levels from 4 to 8)
that can meet the target (i.e., even Oracle failed on this one). We compare overall
performance in 2 ways: 1) we pick 18 common tests for which all methods meet
the SLA targets in order to provide a fair comparison; 2) we include any passing
test of any method in the performance calculation for that method. Performance
is normalized to Oracle’s. In both cases, Model Search shows the best results,
achieving 99% of Oracle’s performance.
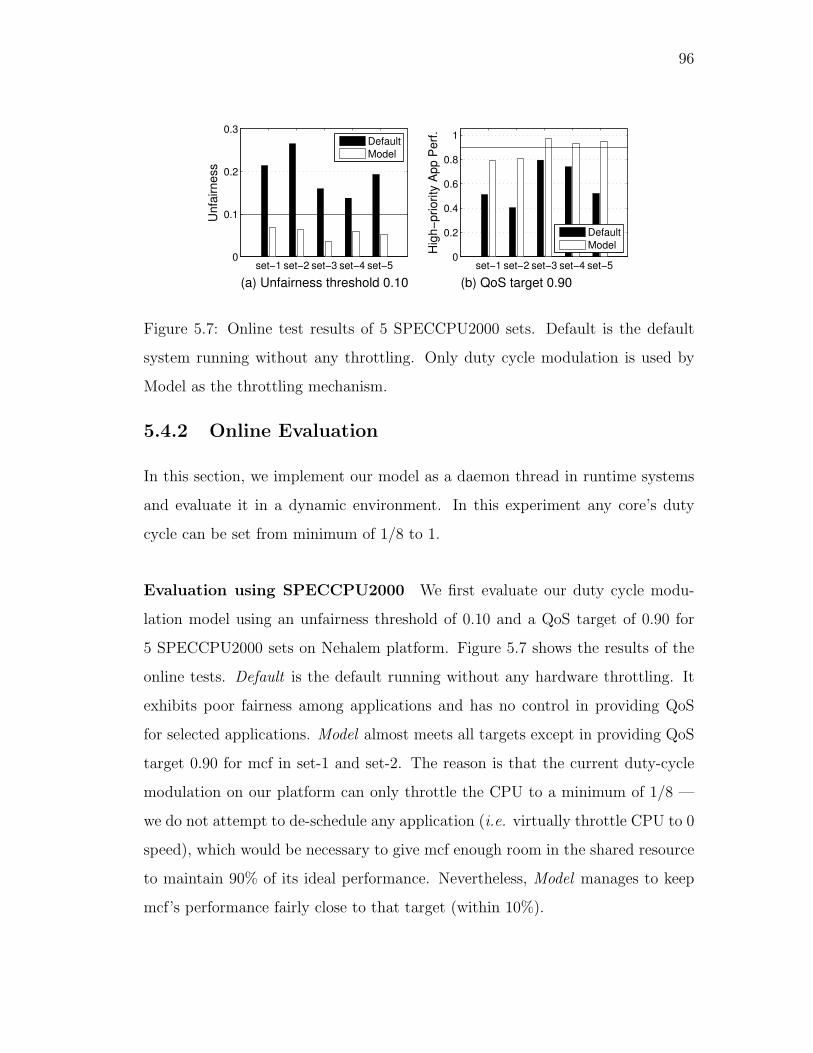
96
set−1 set−2 set−3 set−4 set−50
0.1
0.2
0.3
Un
fairn
ess
(a) Unfairness threshold 0.10
Default
Model
set−1 set−2 set−3 set−4 set−50
0.2
0.4
0.6
0.8
1
Hig
h−
prio
rity
Ap
p P
erf
.
(b) QoS target 0.90
Default
Model
Figure 5.7: Online test results of 5 SPECCPU2000 sets. Default is the default
system running without any throttling. Only duty cycle modulation is used by
Model as the throttling mechanism.
5.4.2 Online Evaluation
In this section, we implement our model as a daemon thread in runtime systems
and evaluate it in a dynamic environment. In this experiment any core’s duty
cycle can be set from minimum of 1/8 to 1.
Evaluation using SPECCPU2000 We first evaluate our duty cycle modu-
lation model using an unfairness threshold of 0.10 and a QoS target of 0.90 for
5 SPECCPU2000 sets on Nehalem platform. Figure 5.7 shows the results of the
online tests. Default is the default running without any hardware throttling. It
exhibits poor fairness among applications and has no control in providing QoS
for selected applications. Model almost meets all targets except in providing QoS
target 0.90 for mcf in set-1 and set-2. The reason is that the current duty-cycle
modulation on our platform can only throttle the CPU to a minimum of 1/8 —
we do not attempt to de-schedule any application (i.e. virtually throttle CPU to 0
speed), which would be necessary to give mcf enough room in the shared resource
to maintain 90% of its ideal performance. Nevertheless, Model manages to keep
mcf’s performance fairly close to that target (within 10%).

97
Set Target Hill-Climbing Exhaustive
#1 Unfairness ≤ 0.1 0.32 15.94
QoS ≥ 0.9 1.06 27.48
#2 Unfairness ≤ 0.1 0.49 31.64
QoS ≥ 0.9 1.28 66.14
#3 Unfairness ≤ 0.1 0.18 9.93
QoS ≥ 0.9 0.88 21.92
#4 Unfairness ≤ 0.1 0.21 6.54
QoS ≥ 0.9 1.81 35.03
#5 Unfairness ≤ 0.1 0.19 10.04
QoS ≥ 0.9 1.33 28.82
Table 5.2: Average runtime overhead in milliseconds of calculating best duty cycle
configuration. Before each round of sampling, Exhaustive searches and compares
all possible configurations while Hill-Climbing limits calculation to a small portion.
The runtime overhead of our approach mainly comes from the computation
load of predicting best configuration based on existing reference pool (reading per-
formance counters and setting modulation only take several microseconds). Recall
that we introduce a hill climbing algorithm in Section 5.3.2, which significantly
reduces the number of evaluated configurations from mn to (m − 1)n2 for an n
core system with a maximum of m modulation levels. As shown in Table 5.2,
the hill climbing optimization reduces computation overhead by 20x ∼ 60x and
mostly incurs less than 1 millisecond overhead in our tests. Such optimization
makes our approach affordable in cases where frequent (e.g., tens of milliseconds)
sampling is desirable.
Tests of Server benchmarks Our iterative framework does not make any
assumption about the particular bottleneck resource and is applicable to different

98
Nehalem Woodcrest 0
0.05
0.1
0.15
0.2
0.25
Un
fairn
ess
Unfairness threshold 0.10
Default
Model
Figure 5.8: Online unfairness test of four server applications on platform “Wood-
crest” and “Nehalem”. Default is the default system running without any throt-
tling. Model here only uses duty cycle modulation as throttling mechanism.
resource management scenarios. We test server benchmarks on both Nehalem
and Woodcrest platforms with different models and management objectives to
demonstrate this.
First we only consider duty cycle modulation as the throttling mechanism.
There are 4 cores on each platform and we bind each server application to one core.
On the “Woodcrest” platform, TPC-H and WebClip run on a chip, and SPECWeb
and SPECJbb run on the other chip. We choose an unfairness threshold of 0.10
and QoS target of 0.90. For the QoS-centric tests, we rotate high priority among
the 4 server applications in each test. The final performance is calculated in term
of throughput though our run-time daemon uses IPC as guidance. This might be
problematic for applications whose instructions mutate during different runs, but
this is not the case in our experiments.
In Figure 5.8, our model significantly reduces unfairness although the target
is not met for the test on the Woodcrest platform. Figure 5.9 shows our model

99
0
0.2
0.4
0.6
0.8
1
Hig
h−
priority
App P
erf
.
(a) QoS target 0.90 on Nehalem
TPC−H
WeClip
SPECWeb
SPECJbb
0
0.2
0.4
0.6
0.8
1
Hig
h−
priority
App P
erf
.
(b) QoS target 0.90 on Woodcrest
TPC−H
WeClip
SPECWeb
SPECJbb
Default
Model
Default
Model
Figure 5.9: Online QoS test of four server applications on “Woodcrest” and “Ne-
halem”. (a) shows results of 4 different tests with each selecting a different server
application as the high-priority QoS one. Same applies to (b). Default refers to
the default system running without any throttling. Model only uses duty cycle
modulation as throttling mechanism.
provides good performance isolation of the high-priority application on both plat-
forms, providing performance above or close to the 0.9 performance target.
In order to demonstrate the more general applicability of our approach, we
add DVFS as another source of throttling, and change the management objective
from overall performance to power efficiency. We use performance per watt as
our metric of power efficiency. We are mainly interested in active power (whole
system operating power minus idle power) in this work. We empirically model
active power to be quadratic to frequency and linear to duty cycle levels. Since
DVFS is applied to the whole chip and not per-core on our Intel processors, we
only test this new model on the 2-chip SMP Woodcrest platform. Figure 5.10
shows that this new model achieves much better power efficiency while providing
good fairness.

100
0
0.05
0.1
0.15
0.2
0.25
Un
fairn
ess
(a) Unfairness
Default
Model w.o. DVFS
Model w. DVFS0
0.5
1
1.5
No
rm.
Active
Po
we
r E
ffic
ien
cy
(b) Active Power Efficiency
Default
Model w.o. DVFS
Model w. DVFS
Figure 5.10: Online test of power efficiency (performance per watt). Default is
the default system running without any throttling. Model w.o. DVFS only uses
duty cycle modulation as throttling mechanism. Model w. DVFS combines two
throttling mechanisms (duty cycle modulation and dynamic voltage/frequency
scaling).
5.5 Related Work and Summary
There has been considerable focus on the issue of quality of service for appli-
cations executing on multicore processors. Several new hardware mechanisms
have been proposed in order to collect statistics at the last-level cache or at the
memory [Suh et al., 2001b, 2004; Zhao et al., 2007; Awasthi et al., 2009; Nesbit
et al., 2006; Qureshi and Patt, 2006]. Suh et al. [Suh et al., 2001b, 2004] use
hardware counters to estimate marginal gains from increasing cache allocations to
individual processes, along with a greedy exploration algorithm, in order to find
a cache partition that minimizes overall miss rate. Zhao et al. [Zhao et al., 2007]
propose the CacheScouts architecture to determine cache occupancy, interference,
and sharing of concurrently running applications, and used this information to
determine which applications to co-schedule. Tam et al. [Tam et al., 2007b] use
the data sampling feature available in the Power5 performance monitoring unit
in order to sample accesses. The resulting access signature is used to deter-
mine similar information to CacheScouts, but in software, which is then used for

101
clustering/co-scheduling. Awasthi et al. [Awasthi et al., 2009] use an additional
layer of translation to control the placement of pages in a multicore shared cache.
Mutlu et al. [Mutlu and Moscibroda, 2008] propose parallelism-aware batch
scheduling at the DRAM level in order to reduce inter-thread interference at the
memory level. These techniques are orthogonal and complementary to controlling
the amount of a resource utilized by individual threads.
Alternatively, without extra hardware support, software techniques such as
page coloring to achieve cache partitioning [Cho and Jin, 2006; Tam et al., 2007a;
Lin et al., 2008; Soares et al., 2008; Zhang et al., 2009b] and CPU scheduling
quantum adjustment to achieve fair resource utilization [Fedorova et al., 2007]
have been explored. However, page coloring requires significant changes in the
operating system memory management, places artificial constraints on system
memory allocation policies, and incurs expensive re-coloring (page copying) costs
in dynamic execution environments. CPU scheduling quantum adjustment suffers
from its inability to provide fine-grained quality of service guarantees [Zhang et al.,
2009a].
Iyer et al. [Iyer et al., 2007] show how priority can be taken into account when
defining quality of service policies on either a resource or performance basis. Hsu
et al. [Hsu et al., 2006] demonstrate the importance of the objective function in
guiding QoS policy decisions. Nathuji et al. [Nathuji et al., 2010] apply a multi-
input multi-output model to allocate surplus CPU resources among applications
for QoS purposes. In all cases, the cost of making the policy decision and the
amount of time needed to arrive at the correct configuration are not discussed.
Ebrahimi et al. [Ebrahimi et al., 2010] propose a new hardware design to
track contention at different cache/memory levels and throttle ones causing unfair
resource usage or disproportionate progress. We address the same problem but
without requiring special hardware support.
In our work, we propose an iterative framework to enforce SLAs by controlling

102
multicore resource through two hardware execution throttling mechanisms: duty
cycle modulation and voltage/frequency scaling. Besides the iterative refinement
property, the essence of our framework is a customizable prediction model that
determines the effect of a configuration change on the metric of interest. We
devise a hill climbing algorithm to make the prediction model computationally
efficient for online deployment. We analyze our approach using 8 SPECCPU2000
benchmarks (mesa, art, mcf, equake, swim, mgrid, applu, and mgrid) and 4 server-
style applications (TPC-H, WebClip, SPECWeb and SPECJbb). We test our
approach on a variety of resource management objectives such as fairness, QoS,
performance, and power efficiency using two different multicore platforms. Our
results suggest that CPU execution speed throttling coupled with our iterative
framework effectively supports multiple forms of service level agreements (SLAs)
for multicore platforms in an efficient and flexible manner.

103
6 A Unified Middleware
In previous chapters we describe various multicore resource management mech-
anisms and show how they can be applied to manage shared resources. These
approaches are orthogonal yet complementary to each other. For example, the
similarity grouping described in Chapter 4 affects performance and fairness across
groups of applications while the hardware throttling utilized in Chapter 5 affects
performance and fairness for concurrently running applications. In this chapter,
we present a prototype middleware that unifies similarity grouping and hardware
execution throttling to realize multiple benefits simultaneously.
6.1 Design and Implementation
Our prototype middleware consists of kernel and user parts. The kernel part
implements necessary driver support for hardware execution throttling (duty cy-
cle modulation and voltage/frequency scaling) and performance counter profiling.
We apply Mikael Pettersson’s perfctr patch [Pettersson, 2009a] to a recent Linux
2.6.30 kernel. On our Intel dual-core platform, there are two general-purpose per-
formance counters and three additional fixed performance counters. The general-
purpose counters can be programmed to measure hundreds of hardware events.
Each of the fixed counters is dedicated to a pre-defined hardware event: number

104
of retired instructions, unhalted CPU cycles, and unhalted CPU reference cycles
1. These counters are 40 bits wide on the Intel Dual-Core processor or 48 bits
on the Nehalem platform and can be read by either rdpmc or rdmsr instructions.
The difference between the two instructions is rdmsr always executes at privilege
level 0 (highest) while the rdpmc privilege level can be relaxed by a performance-
monitoring counters enabled (PCE) flag in register CR4 [Intel Corporation, 2006].
In rare cases, the system enables the rdpmc instruction to be executed at any priv-
ilege level by setting the PCE to the appropriate protection mode.
We also developed a user-level tool to facilitate configuring various hardware
event counters. Monitoring a hardware event involves a pair of registers: a select
register and its corresponding counter. One can modify the “Unit Mask” (bits 15-
8) and “Event Select” (bits 7-0) fields of the select register to specify a particular
performance event, and read out the event value from the associated counter. Our
tool takes names of desirable hardware events from the command line (needing
root privilege to run) and evokes the perfctr driver via the ioctl interface. Right
now our tool supports a selected set of most frequently used hardware events for
two popular Intel multicore processors (Dual-core and Nehalem). Other events
can be added as needed.
Setting duty cycle modulation is relatively easy: the Intel manual [Intel
Corporation, 2006] specifies the layout and functionality of each bit in the
IA32 CLOCK MODULATION register. Configuring DVFS is a bit more com-
plex since it is not well documented in the Intel manual. Basically, there is
a IA32 PERF CTL register to control the CPU’s performance state (i.e., fre-
1Unhalted CPU cycles (CPU CLK UNHALTED.CORE) may change over
time due to hardware frequency change, but unhalted CPU reference cycles
(CPU CLK UNHALTED.REF) does not change. For example, suppose a 3 GHz CPU
scales to 2 GHz, CPU CLK UNHALTED.CORE reports 2,000,000,000 cycles for 1 second while
CPU CLK UNHALTED.REF remains 3,000,000,000 cycles for 1 second, assuming the CPU
does not enter the halt state.

105
quency/voltage operating point), but the document does not specify values to be
written to this register. By reading Intel’s cpufreq device driver code in Linux,
we find that IA32 PERF CTL uses bits 7-0 to encode the voltage level and bits
15-8 to encode the frequency level. We modified the cpufreq driver to get these
codes and wrote our own DVFS support. On the Intel chip, each core has its
own register to specify a desired operating point, but the highest operating point
among all sibling cores is what is in effect. To effectively scale a particular core’s
frequency, we have to set IA32 PERF CTL registers on all sibling cores of the
same chip.
Our user level part is a daemon process that takes management policies as in-
put to guide resource-aware scheduling and hardware execution throttling. Upon
starting execution, a job will first register its signature information (e.g., ideal
IPC and cache miss ratio when it runs alone) by evoking a certain system call.
These signatures can be learned in profiling runs and we assume they are available
before hand. The kernel scheduler signals the daemon process at context switch
to update its information of currently running jobs. Based on the signature infor-
mation, the daemon process will determine how to group running jobs according
to similarity grouping as described in Chapter 4. Specifically, it will modify a
thread’s CPU affinity to bind it to a particular core. For this reason, the daemon
thread runs under root privilege. It also keeps monitoring applications’ perfor-
mance (instructions per cycle, or IPC) and adjusts hardware execution throttling
correspondingly for a given management objective. Once a new job begins run-
ning, the daemon process will erase records of previous runs and restart a sampling
from the default system throttling settings (full duty cycle and highest frequency).
Commodity operating systems implement asynchronous scheduling, which
means CPUs do not synchronize their job dispatch. The expected frequency of
context switch would be the number of CPUs per scheduling quantum. In re-
ality, context switches occur more frequently due to applications’ sporadic I/O
106
operations. This affects the choice of sampling duration. By default, we choose
a 1 second sampling interval (for batch scheduling) and can go as low as 10 mil-
liseconds (for frequent context switches). A long sampling interval provides more
stable results although it increases the time required to determine the appropriate
configuration.
Old samples are replaced by new samples if measured at the same configuration
to reflect recency. By doing so, our iterative framework takes a phase-change as
a mistaken prediction and automatically incorporates the behavior at the current
configuration into the model to correct the next round of prediction.
6.2 Evaluation Results
Our evaluation is conducted on a 2-chip SMP machine running our modified Linux
2.6.30 kernel. Each chip is an Intel “Woodcrest”dual-core with a 32 KB per-core
L1 data cache and a 4 MB L2 cache shared by the two sibling cores.
Our benchmarks are 12 SPECCPU2000 benchmarks and we first divide them
into four groups based on their memory intensities with group-0 most intensive
and group-3 least intensive:
group-0 = {swim, mcf, equake},
group-1 = {applu, wupwise, mgrid},
group-2 = {art, bzip, twolf},
group-3 = {gzip, mesa, parser},
Each group will issue one job (i.e., start a benchmark) at a time and await the
last job’s termination to issue the next one. We have four groups and four cores
on our platform, so exactly one job is running on each core at any time. Jobs
are bound at random initially by the default scheduler. They are subsequently
bound based on similarity grouping by the daemon after they make the system

107
call to specify their signatures. We continuously run our experiments for a suffi-
cient amount of time and use the average execution time (not response time) of
individual benchmarks as their performance.
0
0.1
0.2
0.3
0.4
0.5
0.6
0.7
0.8
0.9
1
1.1
No
rma
lize
d p
erf
orm
an
ce
Default System
Similarity Grouping
Unified Middleware
(a) Overall System Performance (higher is better)
0
0.05
0.1
0.15
0.2
0.25
Un
fairn
ess f
acto
r
Default System
Similarity Grouping
Unified Middleware
(b) System Unfairness (lower is better)
0
10
20
30
40
50
60
70
80
90
100
Po
we
r in
wa
tts
Default System
Similarity Grouping
Unified Middleware
(c) Active System Power (lower is better)
0
0.2
0.4
0.6
0.8
1
1.2
1.4N
orm
aliz
ed
pe
rf.
pe
r w
att
Default System
Similarity Grouping
Unified Middleware
(d) Active Power Efficiency (higher is better)
Figure 6.1: Comparison results of experiment where CPUs are not over-committed
(number of concurrently running applications equals number of cores).
We compare a system with our middleware support against the default Linux
system with respect to performance, fairness, and active power efficiency. We first
only enable similarity grouping scheduling and see how much overall system per-
formance improvement it can gain over the default system. Figure 6.1 (a) shows
similarity grouping achieves 7% performance improvement over default. We then
enable hardware execution throttling with a 0.10 unfairness control threshold.
Meanwhile we also try to optimize active power efficiency (performance per watt,
calculated as normalized performance divided by active power in watts) under

108
0 5 10 15 20 25 300.05
0.1
0.15
0.2
0.25
restart frequency in # of samples
Un
fairn
ess
1 second
100 milliseconds
10 milliseconds
Figure 6.2: Sensitivity tests with varing sampling interval (10 milliseconds, 100
milliseconds, and 1 second) and restart frequency (5, 10, 20, and 30 samples).
the constrained unfairness threshold. Figure 6.1 (b) shows that our policy man-
ages to achieve unfairness of 0.107, a 45% and 35% reduction respectively from
the default system and resource-aware scheduling. However, we also notice its
performance drops by 15% as compared against the default system. The reason
for this is that we sometimes have to throttle applications that can aggressively
occupy shared resources and make relatively fast progress in order to make more
resources available for other co-running applications. While reducing unfairness,
our middleware process also cuts active power consumption by almost 30 watts,
or 31% reduction from the default system as shown in Figure 6.1 (c). We can
see from Figure 6.1 (d) that our power savings offset the performance loss and
translate to a 21% improvement of power efficiency over the default system.
In the previous test, context switches occur fairly infrequently (30 samples

109
between context switches on average). In order to determine sensitivity to con-
text switch frequency and sampling interval (time slice), we repeat the test to
enforce a restart (restart sampling from default throttling settings) in the dae-
mon periodically to emulate context switch effects. We tried 5, 10, 20, and 30
samples as restart frequency with 10 milliseconds, 100 milliseconds, and 1 second
sampling intervals. The unfairness curves for the different parameters are plotted
in Figure 6.2.
The general trend is that unfairness curves get closer to the target guidance
(0.10) as the restart is less frequent. Another interesting observation is that long
sampling intervals generally work better than short sampling intervals. This is
because we implement the hardware throttling setting in an asynchronous manner.
When a new throttling configuration needs to be set, we write it to a per-cpu
kernel data structure. The scheduler reads it at the next tick (1 millisecond by
default), at which time the actual setting is changed. The time tick is triggered
asynchronously on each CPU, so we may get a couple of milliseconds skew.
Next we perform an experiment where all 12 benchmarks are concurrently run-
ning (i.e., cores are over-committed). Commodity operating systems implement
asynchronous scheduling, which means CPUs do not synchronize their scheduling
quantum. Our middleware process has to restart a sampling with default system
settings (full duty cycle and highest frequency) upon every context switch. On
average, it will occur 4 times per scheduling quantum on a 4-core system. To
alleviate the inefficiency due to frequent context switches, we set the scheduling
time quantum to be 10 seconds in this experiment. Figure 6.3 (a) shows similarity
grouping exhibits a 5% performance gain over the default while unified middle-
ware is 5% worse than the default. For fairness, the unified middleware reduces
the unfairness factor by 35% and 25% respectively compared to the default and
to similarity grouping, although its absolute value of 0.169 is higher than our ex-
pected 0.1 unfairness target. The effectiveness of the unified middleware’s ability

110
0
0.1
0.2
0.3
0.4
0.5
0.6
0.7
0.8
0.9
1
1.1
No
rma
lize
d p
erf
orm
an
ce
Default System
Similarity Grouping
Unified Middleware
(a) Overall System Performance (higher is better)
0
0.05
0.1
0.15
0.2
0.25
0.3
Un
fairn
ess f
acto
r
Default System
Similarity Grouping
Unified Middleware
(b) System Unfairness (lower is better)
0
10
20
30
40
50
60
70
80
90
100
Po
we
r in
wa
tts
Default System
Similarity Grouping
Unified Middleware
(c) Active System Power (lower is better)
0
0.1
0.2
0.3
0.4
0.5
0.6
0.7
0.8
0.9
1
1.1
No
rma
lize
d p
erf
. p
er
wa
tt
Default System
Similarity Grouping
Unified Middleware
(d) Active Power Efficiency (higher is better)
Figure 6.3: Comparison results of experiment where CPUs are over-committed
(number of concurrently running applications is larger than number of cores).
to save power is limited by frequent context switches and it only shows about 7
watts in savings. Nevertheless, the unified middleware is still 3.6% better than
the default in power efficiency as shown in Figure 6.3 (d).
6.3 Summary
In this chapter, we present a prototype middleware that combines similarity group-
ing and hardware execution throttling to realize multiple benefits (fairness, perfor-
mance, and power savings) simultaneously. We demonstrate its benefits through
two different multi-programmed execution environments. In order to share our
valuable experience of dealing with hardware features (performance counters, duty

111
cycle modulation, and voltage/frequency scaling), we plan to make our prototype
implementation publicly accessible. We hope it will inspire more research in this
area.

112
7 Conclusions and Future
Directions
In this dissertation, we focus on multicore resource management with respect to
performance, fairness, and power efficiency. In particular, we:
• devise and implement an efficient way to track memory page access frequency
(i.e., page hotness). The cost of identifying hot pages online is reduced by
leveraging knowledge of spatial locality during a page table scan of access
bits. Based on this, we propose hot-page-based page coloring, which enforces
coloring on only a small set of frequently accessed (or hot) pages for each
process. Hot-page-based selective coloring can significantly alleviate mem-
ory allocation constraints and recoloring overhead induced by naive page
coloring.
• present a simple yet efficient similarity grouping scheduling on SMP-based
multi-chip multicore machines. This scheduling policy mitigates cache space
and memory bandwidth contention and achieves up to 12% performance
improvement for a set of SPECCPU2000 benchmarks and two server ap-
plications on a 2-chip dual-core machine. In addition, similarity grouping
presents the ability to engage chip-wide DVFS-based CPU power savings.
Guided by a frequency-to-performance model, it achieves about 20 watts

113
power savings and 3 Celsius degrees CPU thermal reduction on average
with competitive performance to the default system.
• advocate hardware execution throttling as an effective tool to support fair
use of shared resources on multicores. We also propose a flexible framework
to automatically find a proper hardware execution throttling configuration
for a user-specified objective. A variety of resource management objectives,
such as fairness, QoS, performance, and power efficiency are targeted and
evaluated in our experiments. The essence of our framework is an iterative
prediction refinement procedure and a customizable model that currently
incorporates both duty cycle modulation and voltage/frequency scaling ef-
fects. Our experimental results on a quad-core Intel Nehalem machine show
that our approach can quickly arrive at the exact or close to optimal con-
figuration.
• present a prototype middleware that combines similarity grouping and hard-
ware execution throttling to realize multiple benefits (fairness, performance,
and power savings) simultaneously.
Throughout this dissertation, we have focused on single chip or SMP-based
multi-chip multicore machines. We are also interested in other platforms such as
NUMA machines and mobile devices. Due to the memory bandwidth limitation in
SMP machines, NUMA architectures have been deployed for high-end multi-chip
multicore machines. On NUMA-based machines, each chip/node has a dedicated
memory controller to its local memory. Remote memory accesses are completed
via inter-chip communication through a point-to-point interconnect (e.g., Hyper-
Transport in AMD technology or QuickPath Interconnect in Intel technology).
By doing so, the aggregated memory bandwidth scales with the number of chips.
However, the cost is a loss of uniform memory access. Depending on the num-
ber of hops and the capacity of the links, the latency of remote memory accesses

114
varies dramatically. Consequently, an application’s execution time may fluctuate
because its memory pages are allocated in different nodes during different runs.
Existing solutions to mitigate this effect is to interleave memory pages among all
nodes to get more stable performance. This solves the non-uniform problem but
does not necessarily achieve optimal performance. Another more desirable yet
challenging solution is migrating an application to different nodes according to its
memory access patterns. When migrating an application is expensive, we can also
consider migrating hot (frequently accessed) pages to local memory and swapping
cold pages to remote memory. This approach tries to maximize performance by
making most memory accesses local.
We are also interested in applying our techniques to multithreaded parallel
applications. For example, resource-aware scheduling can take advantage of data
communication information available at the programming language level to dy-
namically co-schedule threads on the same chip to reduce communication over-
head. Our hardware throttling technique can be applied to prioritize a thread
during its critical phase of execution by throttling other competing sibling cores’
speed. Additional challenges will be faced to ensure that the resource control tech-
niques transparently handle both multiprogram and multithreaded workloads.
A further place to employ our techniques is virtual machine-driven shared ser-
vice hosting platforms. In particular, cloud computing platform providers (e.g.,
Amazon [Amazon] and GoGRID [GoGrid, 2008]) charge customers typically in a
pay-as-you-go manner. However, these systems are oblivious to the actual amount
of resource used by individual virtual machines when they share a physical ma-
chine. Using our techniques, we can augment existing cloud computing billing
systems with performance counter-based more fine-grained resource metering. We
can apply our techniques to carefully manage various resource conflicts (especially
those at the chip level) and provide better performance guarantees as desired by
customers.
115
Bibliography
Amazon. 2008. Amazon elastic compute cloud. Http://aws.amazon.com/ec2/.
AMD Corporation. 2008. AMD-64 architecture programmer’s manual.
AMD Corporation. 2009. BIOS and kernel developer’s guide (BKDG) for AMD
family 10h processors.
Antonopoulos, Christos, Dimitrios Nikolopoulos, and Theodore Papatheodorou.
2003. Scheduling algorithms with bus bandwidth considerations for SMPs. In
Proc. of the 32nd Int’l Conf. on Parallel Processing.
Arlitt, Martin and Tai Jin. 1999. Workload Characterization of the 1998 World
Cup Web Site. Technical Report HPL-1999-35, HP Laboratories Palo Alto.
Awasthi, Manu, Kshitij Sudan, Rajeev Balasubramonian, and John Carter. 2009.
Dynamic hardware-assisted software-controlled page placement to manage ca-
pacity allocation and sharing within large caches. In 15th Int’l Symp. on High-
Performance Computer Architecture. Raleigh, NC.
Azimi, Reza, Michael Stumm, and Robert Wisniewski. 2005. Online performance
analysis by statistical sampling of microprocessor performance counters. In The
19th ACM International Conference on Supercomputing. Boston MA.

116
Balasubramonian, Rajeev, David Albonesi, Alper Buyuktosunoglu, and Sandhya
Dwarkadas. 2000. Memory hierarchy reconfiguration for energy and perfor-
mance in general-purpose processor architectures. In International Symposium
on Microarchitecture. Monterey, CA.
Barham, Paul, Austin Donnelly, Rebecca Isaacs, and Richard Mortier. 2004. Using
Magpie for request extraction and workload modeling. In Proc. of the 6th
USENIX Symp. on Operating Systems Design and Implementation, pages 259–
272. San Francisco, CA.
Barroso, Luiz Andr and Urs Hlzle. 2007. The case for energy-proportional com-
puting. In IEEE Computer Society Press, pages 33–37.
Bellosa, Frank. 2000. The benefits of event-driven energy accounting in power-
sensitive systems. In SIGOPS European Workshop. Kolding, Denmark.
Bellosa, Frank, Andreas WeiBel, Martin Waitz, and Simon Kellner. 2003. Event-
driven energy accounting for dynamic thermal management. In Workshop on
Compilers and Operating Systems for Low Power. New Orleans, Louisiana.
Bershad, Brian, Dennis Lee, Theodore Romer, and Bradley Chen. 1994. Avoiding
conflict misses dynamically in large direct-mapped caches. In Proc. of the 6th
Int’l Conf. on Architectural Support for Programming Languages and Operating
Systems, pages 158–170. San Jose, CA.
Bianchini, Ricardo and Ram Rajamony. 2004. Power and energy management for
server systems. In IEEE Computer, volume 37.
Browne, S., J. Dongarra, N. Garner, K. London, and P. Mucci. 2000. A scalable
cross-platform infrastructure for application performance tuning using hardware
counters. In Proc. of the IEEE/ACM SC2000 Conf. Dallas, TX.

117
Bugnion, Edouard, Jennifer M. Anderson, Todd C. Mowry, Mendel Rosenblum,
and Monica S. Lam. 1996. Compiler-directed page coloring for multiproces-
sors. In Proc. of the 7th Int’l Conf. on Architectural Support for Programming
Languages and Operating Systems, pages 244–255. Cambridge, MA.
Chandra, Dhruba, Fei Guo, Seongbeom Kim, and Yan Solihin. 2005. Predicting
inter-thread cache contention on a chip multi-processor architecture. In Pro-
ceedings of the 11th International Symposium on High-Performance Computer
Architecture, pages 340–351.
Chase, Jeffrey, Darrell Anderson, Prachi Thakar, and Amin Vahdat. 2001. Man-
aging energy and server resources in hosting centers. In Proc. of the 18th ACM
Symp. on Operating Systems Principles. Banff, Canada.
Chiou, Derek, Prabhat Jain, Larry Rudolph, and Srini Devadas. 2000. Dynamic
cache partitioning for simultaneous multithreading systems. In Proceedings of
the ASP-DAC 2000. Asia and South Pacific.
Cho, Sangyeun and Lei Jin. 2006. Managing distributed, shared L2 caches through
OS-level page allocation. In Proc. of the 39th Int’l Symp. on Microarchitecture,
pages 455–468. Orlando, FL.
Ebrahimi, Eiman, Chang Joo Lee, Onur Mutlu, and Yale Patt. 2010. Fairness via
source throttling: A configurable and high-performance fairness substrate for
multi-core memory systems. In Proc. of the 15th Int’l Conf. on Architectural
Support for Programming Languages and Operating Systems, pages 335–346.
Pittsburgh, PA.
Eeckhout, Lieven, Hans V. Koen, and De Bosschere. 2002. Workload design:
Selecting representative program-input pairs. In Int’l Conf. on Parallel Archi-
tectures and Compilation Techniques. Charlottesville, Virginia.

118
El-Moursy, Ali, Rajeev Garg, David Albonesi, and Sandhya Dwarkadas. 2006.
Compatible phase co-scheduling on a cmp of multi-threaded processors. In Pro-
ceedings of 20th International Parallel and Distributed Processing Symposium.
Rhodes Island, Greece.
Elnozahy, Mootaz, Michael Kistler, and Ramakrishnan Rajamony. 2003. Energy
conservation policies for web servers. In Proc. of the 4th USENIX Symposium
on Internet Technologies and Systems.
Eranian, Stephane. 2006. perfmon2: A flexible performance monitoring interface
for Linux. In Proc. of the Linux Symposium, pages 269–288.
Fedorova, Alexandra, Margo Seltzer, and Michael D. Smith. 2007. Improving
performance isolation on chip multiprocessors via an operating system sched-
uler. In Proc. of the 16th Int’l Conf. on Parallel Architecture and Compilation
Techniques, pages 25–36. Brasov, Romania.
Fedorova, Alexandra, Christopher Small, Daniel Nussbaum, and Margo Seltzer.
2004. Chip multithreading systems need a new operating system scheduler. In
Proc. of the SIGOPS European Workshop. Leuven, Belgium.
Ghoting, Amol, Gregory Buehrer, Srinivasan Parthasarathy, Daehyun Kim, An-
thony Nguyen, Yen-Kuang Chen, and Pradeep Dubey. 2007. Cache-conscious
frequent pattern mining on modern and emerging processors. In Int’l Journal
of Very Large Data Bases (VLDB). Vienna, Austria.
GoGrid. 2008. Http://www.gogrid.com.
Guan, Nan, Martin Stigge, Wang Yi, and Ge Yu. 2009a. Cache-aware scheduling
and analysis for multicores. In International Conference on Embedded Software.
Grenoble, France.

119
Guan, Nan, Martin Stigge, Wang Yi, and Ge Yu. 2009b. New response time
bounds for fixed priority multiprocessor scheduling. In The 30th IEEE Real-
Time Systems Symposium. Washington, D.C.
Heath, Taliver, Ana Paula Centeno, Pradeep George, Luiz Ramos, Yogesh Jaluria,
and Ricardo Bianchini. 2006. Mercury and freon: Temperature emulation and
management for server systems. In Architectural Support for Programming Lan-
guages and Operating Systems. San Jose, CA.
Herdrich, Andrew, Ramesh Illikkal, Ravi Iyer, Don Newell, Vineet Chadha, and
Jaideep Moses. 2009. Rate-based qos techniques for cache/memory in cmp plat-
forms. In 23rd International Conference on Supercomputing (ICS). Yorktown
Heights, NY.
Hsu, Lisa R., Steven K. Reinhardt, Ravishankar Iyer, and Srihari Makineni. 2006.
Communist, utilitarian, and capitalist cache policies on cmps: Caches as a
shared resource. In Int’l Conf. on Parallel Architectures and Compilation Tech-
niques.
Intel Corporation. 2006. IA-32 Intel architecture software developer’s manual,
volume 3: System programming guide.
Intel Corporation. 2008a. Intel turbo boost technology in intel core microarchi-
tecture (Nehalem) based processors.
Intel Corporation. 2008b. TLBs, paging-structure caches, and their invalidation.
Http://www.intel.com/design/processor/applnots/317080.pdf.
Intel Corporation. 2009a. Intel core2 duo and dual-
core thermal and mechanical design guidelines.
Http://www.intel.com/design/core2duo/documentation.htm.

120
Intel Corporation. 2009b. Intel core2 duo mobile processor, intel core2 solo mo-
bile processor and intel core2 extreme mobile processor on 45-nm process -
datasheet.
Isci, Canturk, Gilberto Contreras, and Margaret Martonosi. 2006. Live, runtime
phase monitoring and prediction on real systems with application to dynamic
power management. In International Symposium on Microarchitecture. Orlando,
FL.
Iyer, Ravi, Li Zhao, Fei Guo, Ramesh Illikkal, Srihari Makineni, Don Newell, Yan
Solihin, Lisa Hsu, and Steve Reinhardt. 2007. QoS policies and architecture for
cache/memory in CMP platforms. In ACM SIGMETRICS, pages 25–36. San
Diego.
Jiang, Yunlian, Xipeng Shen, Jie Chen, , and Rahul Tripathi. 2008. Analysis
and approximation of optimal co-scheduling on cmp. In Int’l Conf. on Parallel
Architecture and Compilation Techniques (PACT). Toronto, Canada.
Kessler, R.E. and Mark D. Hill. 1992. Page placement algorithms for large real-
indexed caches. ACM Trans. on Computer Systems, 10(4):338–359.
Kim, Seongbeom, Dhruba Chandra, and Yan Solihin. 2004. Fair cache sharing
and partitioning in a chip multiprocessor architecture. In Int’l Conf. on Parallel
Architectures and Compilation Techniques.
Kim, Wonyoung, Meeta S. Gupta, Gu-Yeon Wei, and David Brooks. 2008. Sys-
tem level analysis of fast, per-core dvfs using on-chip swithing regulators. In
HPCA’08. Salt Lake City, UT.
Kotla, Ramakrishna, Anirudh Devgan, Soraya Ghiasi, Tom Keller, and Freeman
Rawson. 2004. Characterizing the impact of different memory-intensity levels.
In IEEE 7th Annual Workshop on Workload Characterization. Austin, Texas.

121
Lee, Donghee, Jongmoo Choi, JongHun Kim, Sam H. Noh, Sang Lyul Min,
Yookun Cho, and Chong Sang Kim. 2001. LRFU: A spectrum of policies that
subsumes the least recently used and least frequently used policies. IEEE Trans.
on Computers, 50(12):1352–1361.
Lin, Jiang, Qingda Lu, Xiaoming Ding, Zhao Zhang, Xiaodong Zhang, and P. Sa-
dayappan. 2008. Gaining insights into multicore cache partitioning: Bridging
the gap between simulation and real systems. In Proc. of the 14th Int’l Symp.
on High-Performance Computer Architecture. Salt Lake City, UT.
Linux Open Source Community. 2010. Linux kernel archives.
Http://www.kernel.org.
Lu, Pin and Kai Shen. 2007. Virtual machine memory access tracing with hyper-
visor exclusive cache. In Proc. of the USENIX Annual Technical Conf., pages
29–43. Santa Clara, CA.
Luo, Yue and Lizy Kurian John. 2001. Workload characterization of multithreaded
java severs. In IEEE International Symposium on Performance Analysis of
Systems and Software. Tuscon, Arizona.
McCalpin, John. 1995. Memory bandwidth and machine balance in current high
performance computers. In IEEE Technical Committee on Computer Architec-
ture newsletter.
Merkel, Andreas and Frank Bellosa. 2008a. Memory-aware scheduling for energy
efficiency on multicore processors. In Workshop on Power Aware Computing
and Systems, HotPower’08. San Diego, CA.
Merkel, Andreas and Frank Bellosa. 2008b. Task activity vectors: A new metric
for temperature-aware scheduling. In 3rd European Conf. on Computer systems.
Glasgow, Scotland.

122
Moscibroda, Thomas and Onur Mutlu. 2007. Memory performance attacks: De-
nial of memory service in multi-core systems. In USENIX Security Symp., pages
257–274. Boston, MA.
Mutlu, Onur and Thomas Moscibroda. 2008. Parallelism-aware batch scheduling:
Enhancing both performance and fairness of shared dram systems. In Inter-
national Symposium on Computer Architecture (ISCA), pages 63–74. Beijing,
China.
Nathuji, Ripal, Aman Kansal, and Alireza Ghaffarkhah. 2010. Q-clouds: Manag-
ing performance interference effects for qos-aware clouds. In Proceedings of the
Fifth EuroSys Conference. Paris, France.
Naveh, Alon, Efraim Rotem, Avi Mendelson, Simcha Gochman, Rajshree Chabuk-
swar, Karthik Krishnan, and Arun Kumar. 2006. Power and thermal manage-
ment in the Intel Core Duo processor. Intel Technology Journal, 10(2):109–122.
Nesbit, Kyle, Nidhi Aggarwal, James Laudon, and James Smith. 2006. Fair queu-
ing memory systems. In 39th Int’l Symp. on Microarchitecture (Micro), pages
208–222. Orlando, FL.
OpenSSL. 2007. OpenSSL: The open source toolkit for SSL/TLS.
Http://www.openssl.org.
Oprofile. 2009. Oprofile project. Http://oprofile.sourceforge.net.
Parekh, Sujay, Susan Eggers, Henry Levy, and Jack Lo. 2000. Thread-sensitive
scheduling for SMT processors. Technical report, Department of Computer
Science and Engineering, University of Washington.
Patterson, David A. 2004. Latency lags bandwidth. Communications of the ACM,
47(10):71–75.

123
Percival, Colin. 2005. Cache missing for fun and profit. In BSDCan 2005. Ottawa,
Canada. Http://www.daemonology.net/papers/htt.pdf.
Pettersson, Mikael. 2009a. Linux performance counters driver.
Http://sourceforge.net/projects/perfctr/.
Pettersson, Mikael. 2009b. Perfctr. Http://user.it.uu.se/ mikpe/linux/perfctr/.
Pillai, Padmanabhan and Kang G. Shin. 2001. Realtime dynamic voltage scaling
for lowpower embedded operating systems. In Proc. of the 18th ACM Symp.
on Operating Systems Principles. Banff, Canada.
Pinheiro, Eduardo, Ricardo Bianchini, Enrique V. Carrera, and Taliver Heath.
2001. Load balancing and unbalancing for for power and performance in cluster-
based systems. In Proc. of the Workshop on Compilers and Operating Systems
for Low Power.
Qureshi, Moinuddin and Yale Patt. 2006. Utility-based cache partitioning: A low-
overhead, hight-performance, runtime mechanism to partition shared caches. In
39th Int’l Symp. on Microarchitecture (Micro), pages 423–432. Orlando, FL.
Rafique, Nauman, Wontaek Lim, and Mithuna Thottethodi. 2006. Architectural
support for operating system-driven CMP cache management. In Int’l Conf.
on Parallel Architectures and Compilation Techniques (PACT), pages 2–12.
Raghuraman, Anand. 2003. Miss-ratio curve directed memory management for
high performance and low energy. Master’s thesis, Dept. of Computer Science,
UIUC.
Romer, Theodore, Dennis Lee, Brian Bershad, and Bradley Chen. 1994. Dynamic
page mapping policies for cache conflict resolution on standard hardware. In
Proc. of the First USENIX Symp. on Operating Systems Design and Implemen-
tation, pages 255–266. Monterey, CA.

124
Salapura, Valentina, Karthik Ganesan, Alan Gara, Michael Gschwind, James Sex-
ton, and Robert Walkup. 2008. Next-generation performance counters: towards
monitoring over thousand concurrent events. In IEEE International symposium
on performance analysis of systems and software. Austin TX.
Seshadri, Pattabi and Alex Mericas. 2001. Workload characterization of multi-
threaded java severs on two powerpc processors. In IEEE 4th Workshop on
Workload Characterization. Austin, Texas.
Settle, Alex, Joshua Kihm, and Andrew Janiszewski. 2004. Architectural support
for enhanced smt job scheduling. In Int’l Conf. on Parallel Architectures and
Compilation Techniques.
Shen, Kai, Ming Zhong, Chuanpeng Li, Sandhya Dwarkadas, Chris Stewart, and
Xiao Zhang. 2008. Hardware counter driven on-the-fly request signatures. In
Thirteenth International Conference on Architectural Support for Programming
Languages and Operating Systems. Seattle.
Shen, Xipeng, Yutao Zhong, and Chen Ding. 2004. Locality phase prediction.
In 11th Int’l Conf. on Architectural Support for Programming Languages and
Operating Systems (ASPLOS), pages 165–176. Boston, MA.
Sherwood, Timothy, Brad Calder, and Joel Emer. 1999. Reducing cache misses
using hardware and software page replacement. In Proc. of the 13th Int’l Conf.
on Supercomputing, pages 155–164. Rhodes, Greece.
Sherwood, Timothy, Suleyman Sair, and Brad Calder. 2003. Phase tracking and
predication. In International Symposium on Computer Architecture. San Diego,
CA.
Snavely, Allan and Dean M. Tullsen. 2000. Symbiotic job scheduling for a simulta-
neous multithreading processor. In Proc. of the 9th Int’l Conf. on Architectural

125
Support for Programming Languages and Operating Systems, pages 234–244.
Cambridge, MA.
Soares, Livio, David Tam, and Michael Stumm. 2008. Reducing the harmful
effects of last-level cache polluters with an OS-level, software-only pollute buffer.
In 41th Int’l Symp. on Microarchitecture (Micro), pages 258–269. Lake Como,
ITALY.
Sokolinsky, Leonid B. 2004. LFU-K: An effective buffer management replacement
algorithm. In 9th Int’l Conf. on Database Systems for Advanced Applications,
pages 670–681.
Suh, G. Edward, Srinivas Devadas, and Larry Rudolph. 2001a. Analytical cache
models with applications to cache partitioning. In Proc. of the 15th Int’l Conf.
on Supercomputing, pages 1–12. Sorrento, Italy.
Suh, G. Edward, Larry Rudolph, and Srini Devadas. 2001b. Dynamic cache par-
titioning for simultaneous multithreading systems. In Proc. of the IASTED
International Conference on Parallel and Distributed Computing and Systems.
Anaheim, USA.
Suh, G. Edward, Larry Rudolph, and Srini Devadas. 2004. Dynamic partitioning
of shared cache memory. In The Journal of Supercomputing 28, pages 7–26.
Sun Microsystems, Inc. 2005. UltraSPARC IV+ Processor Manual.
Http://www.sun.com/processors/documentation.html.
Sweeney, Peter, Matthias Hauswirth, Brendon Cahoon, Perry Cheng, Amer Di-
wan, David Grove, and Michael Hind. 2004. Using hardware performance mon-
itors to understand the behaviors of java applications. In Proc. of the Third
USENIX Virtual Machine Research and Technology Symp., pages 57–72. San
Jose, CA.

126
Tam, David, Reza Azimi, Livio Soares, and Michael Stumm. 2007a. Managing
shared L2 caches on multicore systems in software. In Workshop on the In-
teraction between Operating Systems and Computer Architecture. San Diego,
CA.
Tam, David, Reza Azimi, Livio Soares, and Michael Stumm. 2007b. Thread
clustering: sharing-aware scheduling on smp-cmp-smt multiprocessors. In Pro-
ceedings of the 2nd ACM SIGOPS/Eurosys European Conference on Computer
Systems. Lisbon, Portugal.
Tam, David, Reza Azimi, Livio Soares, and Michael Stumm. 2009. RapidMRC:
Approximating l2 miss rate curves on commodity systems for online optimiza-
tions. In 14th Int’l Conf. on Architectural Support for Programming Languages
and Operating Systems (ASPLOS). Washington, DC.
Taylor, George, Peter Davies, and Michael Farmwald. 1990. The tlb slicea low-cost
high-speed address translation mechanism. In Proceedings of the 17th annual
international symposium on Computer Architecture, pages 355 – 363.
Waldspurger, Carl. 2002. Memory resource management in vmware ESX server. In
5th USENIX Symp. on Operating Systems Design and Implementation (OSDI),
pages 181–194. Boston, MA.
Waldspurger, Carl and William Weihl. 1994. Lottery scheduling: Flexible
proportional-share resource management. In Proc. of the First USENIX Symp.
on Operating Systems Design and Implementation, pages 1–11. Monterey, CA.
Wang, Xiaorui, Charles Lefurgy, and Malcolm Ware. 2005. Managing peak system-
leavel power with feedback control. Technical report, IBM Research Tech Report
RC23835.
Watts Up. 2009. Watts up power meter. Https://www.wattsupmeters.com.

127
Weiser, Mark, Brent Welch, Alan Demers, and Scott Shenker. 1994. Scheduling
for reduced cpu energy. In 1st USENIX Symp. on Operating Systems Design
and Implementation (OSDI), pages 13–23.
Weissel, Andreas and Frank Bellosa. 2002. Process cruise control: Event-driven
clock scaling for dynamic power management. In International Conference
on Compilers, Architecture, and Synthesis for Embedded Systems. Grenoble,
France.
Weissel, Andreas and Frank Bellosa. 2004. Dynamic thermal management for dis-
tributed systems. In Proc. of the 1st Workshop on Temperature-aware Computer
Systems. Munich, Germany.
Wisniewski, Robert and Bryan Rosenburg. 2003. Efficient, unified, and scalable
performance monitoring for multiprocessor operating system. In 2003 Super-
computing Conference. Phoenix AZ.
Zhang, Eddy Z., Yunlian Jiang, and Xipeng Shen. 2010a. Does cache sharing on
modern cmp matter to the performance of contemporary multithreaded pro-
grams? In 15th ACM SIGPLAN Symposium on Principles and Practice of
Parallel Programming (PPoPP). Bangalore, India.
Zhang, Xiao, Sandhya Dwarkadas, Girts Folkmanis, and Kai Shen. 2007. Processor
hardware counter statistics as a first-class system resource. In HotOS XI. San
Diego, CA.
Zhang, Xiao, Sandhya Dwarkadas, and Kai Shen. 2009a. Hardware execution
throttling for multi-core resource management. In USENIX Annual Technical
Conf. (USENIX). Santa Diego, CA.
Zhang, Xiao, Sandhya Dwarkadas, and Kai Shen. 2009b. Towards practical page
coloring-based multicore cache management. In 4th European Conf. on Com-
puter systems. Nuremberg, Germany.

128
Zhang, Xiao, Kai Shen, Sandhya Dwarkadas, and Rongrong Zhong. 2010b. An
evaluation of per-chip nonuniform frequency scaling on multicores. In USENIX
Annual Technical Conf. (USENIX). Boston, MA.
Zhang, Xiao, Rongrong Zhong, Sandhya Dwarkadas, and Kai Shen. 2010c. Flexi-
ble hardware throttling based multicore management. In Under Submission.
Zhao, Li, Ravi Iyer, Ramesh Illikkal, Jaideep Moses, Don Newell, and Srihari
Makineni. 2007. Cachescouts: Fine-grain monitoring of shared caches in cmp
platforms. In Proc. of the 16th Int’l Conf. on Parallel Architecture and Compi-
lation Techniques, pages 339–352. Brasov, Romania.
Zhou, Pin, Vivek Pandey, Jagadeesan Sundaresan, Anand Raghuraman,
Yuanyuan Zhou, and Sanjeev Kumar. 2004. Dynamic tracking of page miss
ratio curve for memory management. In Proc. of the 11th Int’l Conf. on Ar-
chitectural Support for Programming Languages and Operating Systems, pages
177–188. Boston, MA.
Zhuravlev, Sergey, Sergey Blagodurov, and Alexandra Fedorova. 2010. Managing
contention for shared resources on multicore processors. In Proc. of the 15th
Int’l Conf. on Architectural Support for Programming Languages and Operating
Systems, pages 129–142. Pittsburgh, PA.