Embed Size (px)
Citation preview
Applied Energy 164 (2016) 245–257
Contents lists available at ScienceDirect
Applied Energy
journal homepage: www.elsevier .com/locate /apenergy
Operating principle of Soft Open Points for electrical distributionnetwork operation
http://dx.doi.org/10.1016/j.apenergy.2015.12.0050306-2619/� 2015 The Authors. Published by Elsevier Ltd.This is an open access article under the CC BY license (http://creativecommons.org/licenses/by/4.0/).
⇑ Corresponding author.E-mail addresses: [email protected] (W. Cao), [email protected] (J. Wu),
[email protected] (N. Jenkins), [email protected] (C. Wang), [email protected] (T. Green).
Wanyu Cao a, Jianzhong Wu a,⇑, Nick Jenkins a, Chengshan Wang b, Timothy Green c
a Institute of Energy, School of Engineering, Cardiff University, Cardiff CF24 3AA, UKbKey Laboratory of Smart Grid of Ministry of Education, Tianjin University, Tianjin 300072, ChinacDepartment of Electrical and Electronic Engineering, Imperial College London, London, UK
h i g h l i g h t s
� Two control modes were developed for a B2B VSCs based SOP.� The SOP operating principle was investigated under various network conditions.� The performance of the SOP using two control modes was analyzed.
a r t i c l e i n f o
Article history:Received 31 August 2015Received in revised form 19 November 2015Accepted 3 December 2015Available online 21 December 2015
Keywords:Soft Open PointBack-to-back converterDistribution networkNetwork operation
a b s t r a c t
Soft Open Points (SOPs) are power electronic devices installed in place of normally-open points in elec-trical power distribution networks. They are able to provide active power flow control, reactive powercompensation and voltage regulation under normal network operating conditions, as well as fast faultisolation and supply restoration under abnormal conditions. Two control modes were developed forthe operation of an SOP, using back-to-back voltage-source converters (VSCs). A power flow control modewith current control provides independent control of real and reactive power. A supply restoration modewith a voltage controller enables power supply to isolated loads due to network faults. The operatingprinciple of the back-to-back VSCs based SOP was investigated under both normal and abnormal networkoperating conditions. Studies on a two-feeder medium-voltage distribution network showed the perfor-mance of the SOP under different network-operating conditions: normal, during a fault and post-faultsupply restoration. During the change of network operating conditions, a mode switch method basedon the phase locked loop controller was used to achieve the transitions between the two control modes.Hard transitions by a direct mode switching were noticed unfavourable, but seamless transitions wereobtained by deploying a soft cold load pickup and voltage synchronization process.� 2015 The Authors. Published by Elsevier Ltd. This is an openaccess article under the CCBY license (http://
creativecommons.org/licenses/by/4.0/).
1. Introduction
The widespread use of distributed energy resources, e.g., dis-tributed generations (DG), energy storage and controllable loads,is anticipated in many countries but this can lead to operationproblems including excessive fault level as well as violations ofthermal and voltage limits [1,2]. In the UK, with the liberalizationof the electricity market and the drive to reduce the number oflong term interruptions of electricity supply, reliable and highquality power supply is becoming more vital than ever [3]. These
drivers inevitably lead to new challenges in the operation of elec-trical power distribution networks.
Medium voltage (MV) distribution networks are usually oper-ated in a radial configuration. Normally open points (NOPs) arebuilt, connecting adjacent feeders, to provide alternative routesof electricity supply in case of planned or unplanned poweroutages [4]. Such network configuration allows the use of simpleand inexpensive protection schemes as well as providing fast faultisolation to limit the propagation of network faults. However, thereis a possibility of power flow being unbalanced between radialfeeders due to different loading conditions, especially when a highpenetration of intermittent DG and flexible demand presents in thedistribution networks. This, in turn, leads to high power losses,increased peak currents and undesirable voltage excursions [5].Moreover, even though there are many supply restoration
246 W. Cao et al. / Applied Energy 164 (2016) 245–257
approaches proposed to increase the reliability of existing radiallyoperated networks, momentary interruptions still exist when afault occurs [6].
Upgrading of distribution networks from their original radialstructure to a normally closed loop configuration is attractingattentions [7,8]. A closed loop configuration is advantageous overa radial one because the load can be balanced between feedersresulting in better voltage profiles and improved reliability ofpower supply [7]. However, such loop configuration increases therisk of wide area failures because any single network fault can bepropagated quickly over a wide area. Thus, more complicatedand expensive protection schemes are required for an intercon-nected network configuration [8,9].
Power electronic devices installed in place of NOPs in a distribu-tion network, namely ‘Soft’ Open Points (SOPs) have been proposedto combine the benefits of both radial and loop (mesh) operatednetwork while avoiding the drawbacks of each [9]. Instead of sim-ply opening/closing NOPs, SOPs control load transfer and regulatenetwork voltage profile by flexibly controlling active/reactivepower flow between adjacent feeders. Immediate fault isolationbetween interconnected feeders as well as fast supply restorationis also enabled using these devices. Therefore SOPs are able toimprove distribution network operation as well as facilitate a largepenetration of low carbon technologies into the distributionnetwork.
Previous studies have advocated the benefits of SOPs for distri-bution network operation [9–11]. It has been shown in [9,10] thatSOP is a desirable alternative to other voltage control strategies forsupporting DG growth. The coordination of SOP with local energystorage to damp the transients caused by the large-capacity dis-tributed photovoltaic installations was presented in [11]. Thesestudies mainly focused on normal network-operating conditions.
The behavior of an SOP device – back-to-back VSCs – underabnormal network-operating conditions was analyzed in [12].However, only the condition during a fault was considered. Thecontrol philosophy and performance of the SOP to support post-fault supply restoration have not been explored.
To fill this gap, two control modes were developed for the oper-ation of a back-to-back VSCs based SOP. The operating principle ofa back-to-back VSCs based SOP was investigated under both nor-mal and abnormal network operating conditions. The performanceof the SOP using the two control modes was analyzed under vari-ous network operating conditions. The importance of the soft coldload pickup and voltage synchronization process, which are essen-tial for a smooth transition between control modes during thechange of network operating conditions, was also investigated.
2. Back-to-back VSCs based Soft Open Point
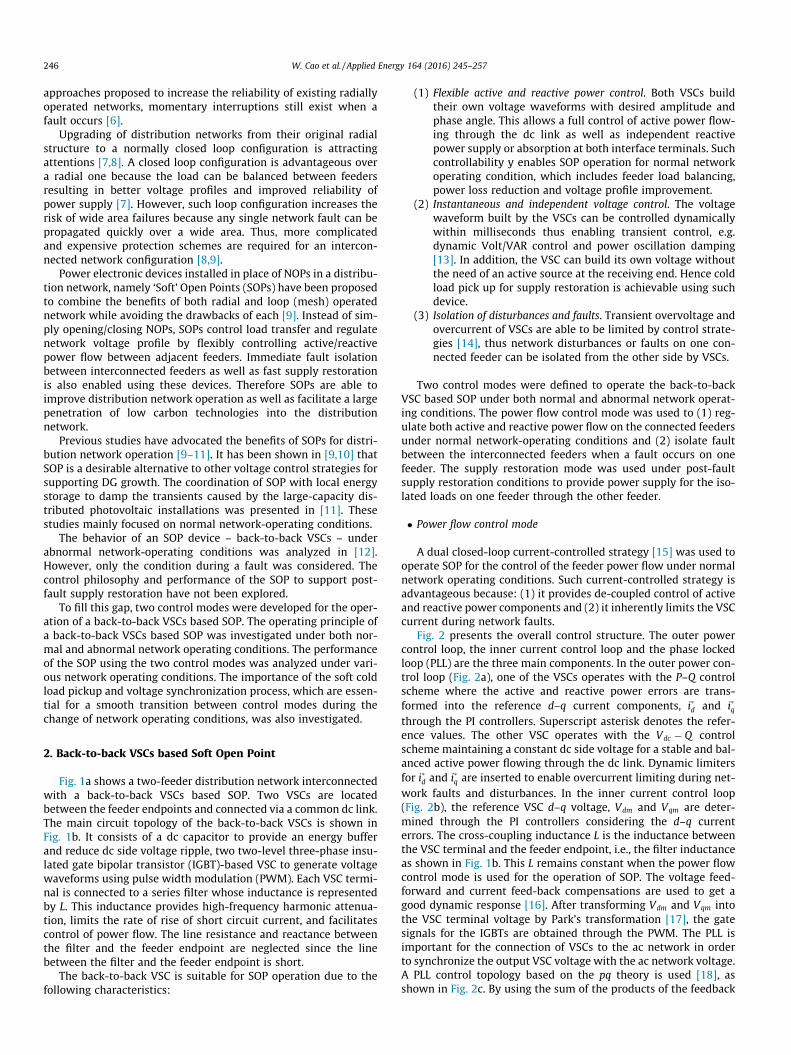
Fig. 1a shows a two-feeder distribution network interconnectedwith a back-to-back VSCs based SOP. Two VSCs are locatedbetween the feeder endpoints and connected via a common dc link.The main circuit topology of the back-to-back VSCs is shown inFig. 1b. It consists of a dc capacitor to provide an energy bufferand reduce dc side voltage ripple, two two-level three-phase insu-lated gate bipolar transistor (IGBT)-based VSC to generate voltagewaveforms using pulse width modulation (PWM). Each VSC termi-nal is connected to a series filter whose inductance is representedby L. This inductance provides high-frequency harmonic attenua-tion, limits the rate of rise of short circuit current, and facilitatescontrol of power flow. The line resistance and reactance betweenthe filter and the feeder endpoint are neglected since the linebetween the filter and the feeder endpoint is short.
The back-to-back VSC is suitable for SOP operation due to thefollowing characteristics:
(1) Flexible active and reactive power control. Both VSCs buildtheir own voltage waveforms with desired amplitude andphase angle. This allows a full control of active power flow-ing through the dc link as well as independent reactivepower supply or absorption at both interface terminals. Suchcontrollability y enables SOP operation for normal networkoperating condition, which includes feeder load balancing,power loss reduction and voltage profile improvement.
(2) Instantaneous and independent voltage control. The voltagewaveform built by the VSCs can be controlled dynamicallywithin milliseconds thus enabling transient control, e.g.dynamic Volt/VAR control and power oscillation damping[13]. In addition, the VSC can build its own voltage withoutthe need of an active source at the receiving end. Hence coldload pick up for supply restoration is achievable using suchdevice.
(3) Isolation of disturbances and faults. Transient overvoltage andovercurrent of VSCs are able to be limited by control strate-gies [14], thus network disturbances or faults on one con-nected feeder can be isolated from the other side by VSCs.
Two control modes were defined to operate the back-to-backVSC based SOP under both normal and abnormal network operat-ing conditions. The power flow control mode was used to (1) reg-ulate both active and reactive power flow on the connected feedersunder normal network-operating conditions and (2) isolate faultbetween the interconnected feeders when a fault occurs on onefeeder. The supply restoration mode was used under post-faultsupply restoration conditions to provide power supply for the iso-lated loads on one feeder through the other feeder.
� Power flow control mode
A dual closed-loop current-controlled strategy [15] was used tooperate SOP for the control of the feeder power flow under normalnetwork operating conditions. Such current-controlled strategy isadvantageous because: (1) it provides de-coupled control of activeand reactive power components and (2) it inherently limits the VSCcurrent during network faults.
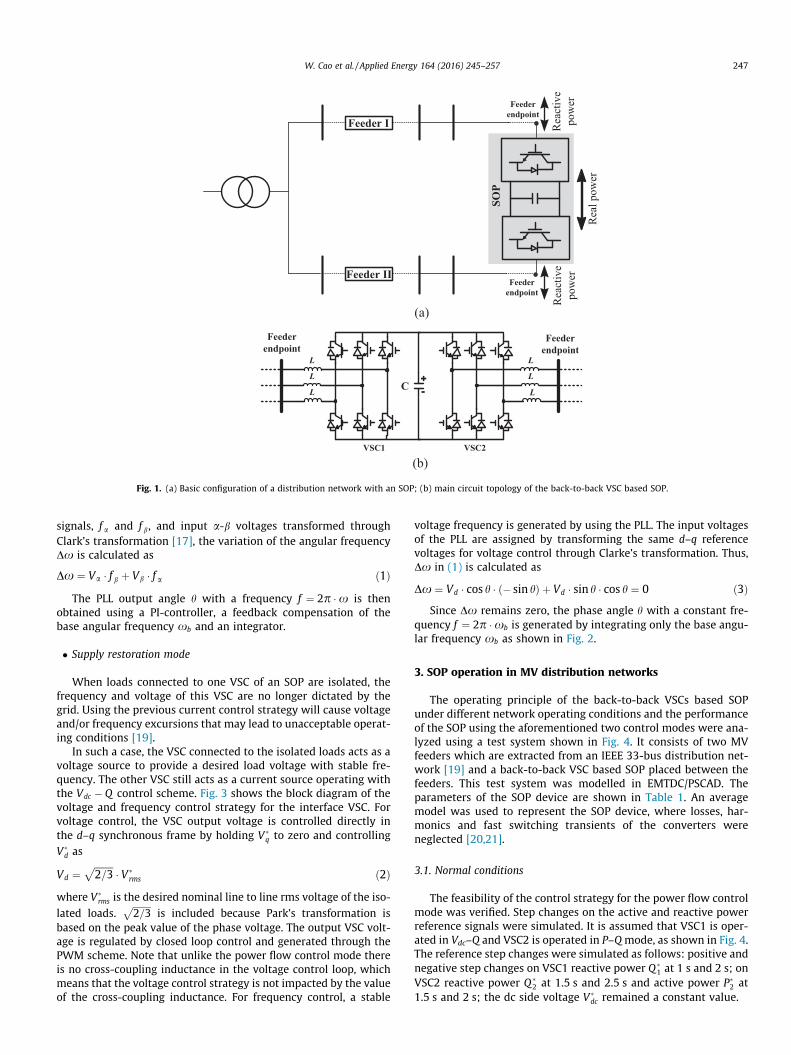
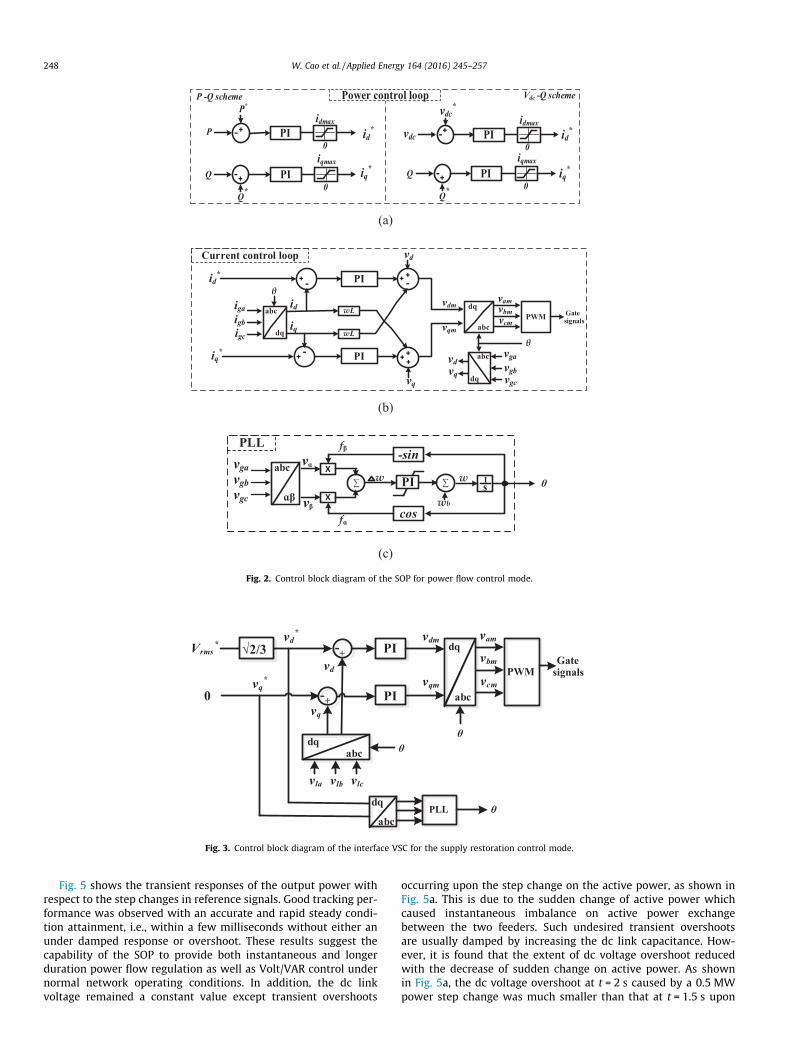
Fig. 2 presents the overall control structure. The outer powercontrol loop, the inner current control loop and the phase lockedloop (PLL) are the three main components. In the outer power con-trol loop (Fig. 2a), one of the VSCs operates with the P–Q controlscheme where the active and reactive power errors are trans-formed into the reference d–q current components, i�d and i�qthrough the PI controllers. Superscript asterisk denotes the refer-ence values. The other VSC operates with the Vdc � Q controlscheme maintaining a constant dc side voltage for a stable and bal-anced active power flowing through the dc link. Dynamic limitersfor i�d and i�q are inserted to enable overcurrent limiting during net-work faults and disturbances. In the inner current control loop(Fig. 2b), the reference VSC d–q voltage, Vdm and Vqm are deter-mined through the PI controllers considering the d–q currenterrors. The cross-coupling inductance L is the inductance betweenthe VSC terminal and the feeder endpoint, i.e., the filter inductanceas shown in Fig. 1b. This L remains constant when the power flowcontrol mode is used for the operation of SOP. The voltage feed-forward and current feed-back compensations are used to get agood dynamic response [16]. After transforming Vdm and Vqm intothe VSC terminal voltage by Park’s transformation [17], the gatesignals for the IGBTs are obtained through the PWM. The PLL isimportant for the connection of VSCs to the ac network in orderto synchronize the output VSC voltage with the ac network voltage.A PLL control topology based on the pq theory is used [18], asshown in Fig. 2c. By using the sum of the products of the feedback
Feeder I
Feeder II
Rea
l pow
er
Rea
ctiv
e po
wer
Rea
ctiv
e po
wer
SOP
Feeder endpoint
Feeder endpoint
(a)
+-
L
VSC2
CL
L
L
VSC1
L
L
Feeder endpoint
Feeder endpoint
(b)
Fig. 1. (a) Basic configuration of a distribution network with an SOP; (b) main circuit topology of the back-to-back VSC based SOP.
W. Cao et al. / Applied Energy 164 (2016) 245–257 247
signals, f a and f b, and input a-b voltages transformed throughClark’s transformation [17], the variation of the angular frequencyDx is calculated as
Dx ¼ Va � f b þ Vb � f a ð1ÞThe PLL output angle h with a frequency f ¼ 2p �x is then
obtained using a PI-controller, a feedback compensation of thebase angular frequency xb and an integrator.
� Supply restoration mode
When loads connected to one VSC of an SOP are isolated, thefrequency and voltage of this VSC are no longer dictated by thegrid. Using the previous current control strategy will cause voltageand/or frequency excursions that may lead to unacceptable operat-ing conditions [19].
In such a case, the VSC connected to the isolated loads acts as avoltage source to provide a desired load voltage with stable fre-quency. The other VSC still acts as a current source operating withthe Vdc � Q control scheme. Fig. 3 shows the block diagram of thevoltage and frequency control strategy for the interface VSC. Forvoltage control, the VSC output voltage is controlled directly inthe d–q synchronous frame by holding V�
q to zero and controllingV�
d as
Vd ¼ffiffiffiffiffiffiffiffi2=3
p� V�
rms ð2Þwhere V�
rms is the desired nominal line to line rms voltage of the iso-lated loads.
ffiffiffiffiffiffiffiffi2=3
pis included because Park’s transformation is
based on the peak value of the phase voltage. The output VSC volt-age is regulated by closed loop control and generated through thePWM scheme. Note that unlike the power flow control mode thereis no cross-coupling inductance in the voltage control loop, whichmeans that the voltage control strategy is not impacted by the valueof the cross-coupling inductance. For frequency control, a stable
voltage frequency is generated by using the PLL. The input voltagesof the PLL are assigned by transforming the same d–q referencevoltages for voltage control through Clarke’s transformation. Thus,Dx in (1) is calculated as
Dx ¼ Vd � cos h � ð� sin hÞ þ Vd � sin h � cos h ¼ 0 ð3ÞSince Dx remains zero, the phase angle h with a constant fre-
quency f ¼ 2p �xb is generated by integrating only the base angu-lar frequency xb as shown in Fig. 2.
3. SOP operation in MV distribution networks
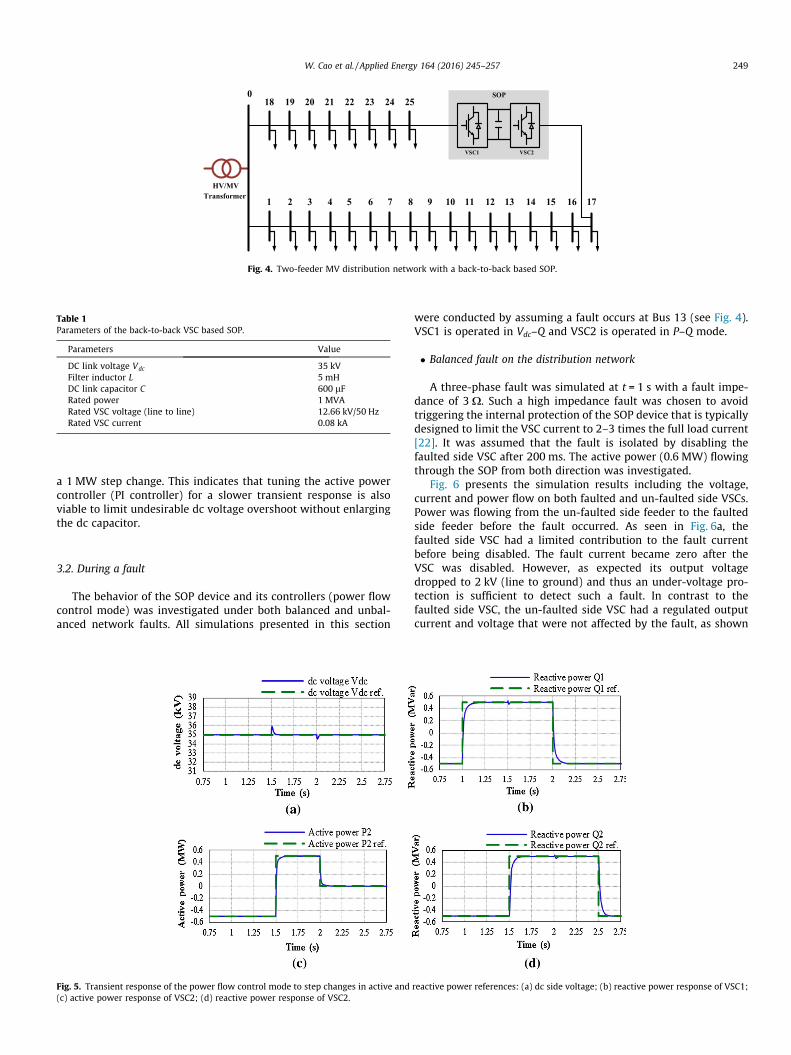
The operating principle of the back-to-back VSCs based SOPunder different network operating conditions and the performanceof the SOP using the aforementioned two control modes were ana-lyzed using a test system shown in Fig. 4. It consists of two MVfeeders which are extracted from an IEEE 33-bus distribution net-work [19] and a back-to-back VSC based SOP placed between thefeeders. This test system was modelled in EMTDC/PSCAD. Theparameters of the SOP device are shown in Table 1. An averagemodel was used to represent the SOP device, where losses, har-monics and fast switching transients of the converters wereneglected [20,21].
3.1. Normal conditions
The feasibility of the control strategy for the power flow controlmode was verified. Step changes on the active and reactive powerreference signals were simulated. It is assumed that VSC1 is oper-ated in Vdc–Q and VSC2 is operated in P–Qmode, as shown in Fig. 4.The reference step changes were simulated as follows: positive andnegative step changes on VSC1 reactive power Q �
1 at 1 s and 2 s; onVSC2 reactive power Q �
2 at 1.5 s and 2.5 s and active power P�2 at
1.5 s and 2 s; the dc side voltage V�dc remained a constant value.
+- PI
+- PI+- PIP
P*
Q
vdc
vdc*
iqmax
0
idmax
0
idmax
0
+- PI
Q*
Qiqmax
0
id*
iq*
id*
iq*
Q*
Vdc -Q schemeP -Q scheme Power control loop
(a)
+PI+ - +
+ -+-+PI
wL
wLabc
dqPWM
id
iq
vq
vd
id*
iq*
vqm
vdmvamvbmvcm
+
Gate signals
abc
dq
θ
θabc
dq
vdvq
Current control loop
vgavgbvgc
igaigbigc
(b)
X
X
-sin
cos
θabc
ɑβ
PLL
w PI 1s
fɑ
fβ
∑ ∑
wb
wvgavgbvgc
vɑ
vβ
(c)
Fig. 2. Control block diagram of the SOP for power flow control mode.
+- abc
dq
PWM
Vrms*
PI
PIvam
vbm
vcm
+-
0
√2/3
abc
dq
abcPLL
vla vlb vlc
θ
dq
vd*
vq*
vq
vd
vdm
vqm
Gate signals
θθ
Fig. 3. Control block diagram of the interface VSC for the supply restoration control mode.
248 W. Cao et al. / Applied Energy 164 (2016) 245–257
Fig. 5 shows the transient responses of the output power withrespect to the step changes in reference signals. Good tracking per-formance was observed with an accurate and rapid steady condi-tion attainment, i.e., within a few milliseconds without either anunder damped response or overshoot. These results suggest thecapability of the SOP to provide both instantaneous and longerduration power flow regulation as well as Volt/VAR control undernormal network operating conditions. In addition, the dc linkvoltage remained a constant value except transient overshoots
occurring upon the step change on the active power, as shown inFig. 5a. This is due to the sudden change of active power whichcaused instantaneous imbalance on active power exchangebetween the two feeders. Such undesired transient overshootsare usually damped by increasing the dc link capacitance. How-ever, it is found that the extent of dc voltage overshoot reducedwith the decrease of sudden change on active power. As shownin Fig. 5a, the dc voltage overshoot at t = 2 s caused by a 0.5 MWpower step change was much smaller than that at t = 1.5 s upon
SOP
VSC1 VSC2
0
1 2 3 4 5 6 7 8 9 10 11 12 13 14 15 16 17
18 19 20 21 22 23 24 25
HV/MVTransformer
Fig. 4. Two-feeder MV distribution network with a back-to-back based SOP.
Table 1Parameters of the back-to-back VSC based SOP.
Parameters Value
DC link voltage Vdc 35 kVFilter inductor L 5 mHDC link capacitor C 600 lFRated power 1 MVARated VSC voltage (line to line) 12.66 kV/50 HzRated VSC current 0.08 kA
W. Cao et al. / Applied Energy 164 (2016) 245–257 249
a 1 MW step change. This indicates that tuning the active powercontroller (PI controller) for a slower transient response is alsoviable to limit undesirable dc voltage overshoot without enlargingthe dc capacitor.
3.2. During a fault
The behavior of the SOP device and its controllers (power flowcontrol mode) was investigated under both balanced and unbal-anced network faults. All simulations presented in this section
Fig. 5. Transient response of the power flow control mode to step changes in active and(c) active power response of VSC2; (d) reactive power response of VSC2.
were conducted by assuming a fault occurs at Bus 13 (see Fig. 4).VSC1 is operated in Vdc–Q and VSC2 is operated in P–Q mode.
� Balanced fault on the distribution network
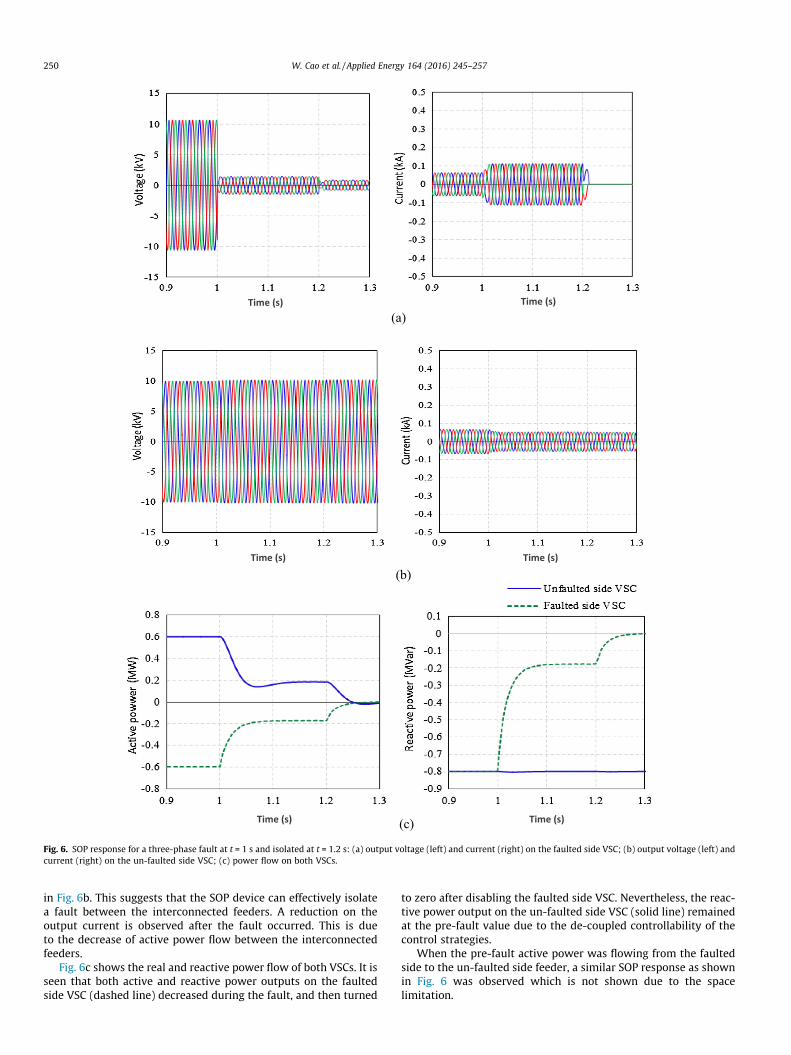
A three-phase fault was simulated at t = 1 s with a fault impe-dance of 3X. Such a high impedance fault was chosen to avoidtriggering the internal protection of the SOP device that is typicallydesigned to limit the VSC current to 2–3 times the full load current[22]. It was assumed that the fault is isolated by disabling thefaulted side VSC after 200 ms. The active power (0.6 MW) flowingthrough the SOP from both direction was investigated.
Fig. 6 presents the simulation results including the voltage,current and power flow on both faulted and un-faulted side VSCs.Power was flowing from the un-faulted side feeder to the faultedside feeder before the fault occurred. As seen in Fig. 6a, thefaulted side VSC had a limited contribution to the fault currentbefore being disabled. The fault current became zero after theVSC was disabled. However, as expected its output voltagedropped to 2 kV (line to ground) and thus an under-voltage pro-tection is sufficient to detect such a fault. In contrast to thefaulted side VSC, the un-faulted side VSC had a regulated outputcurrent and voltage that were not affected by the fault, as shown
reactive power references: (a) dc side voltage; (b) reactive power response of VSC1;
(b)
(c)
(a)Time (s) Time (s)
Time (s) Time (s)
Time (s) Time (s)
Fig. 6. SOP response for a three-phase fault at t = 1 s and isolated at t = 1.2 s: (a) output voltage (left) and current (right) on the faulted side VSC; (b) output voltage (left) andcurrent (right) on the un-faulted side VSC; (c) power flow on both VSCs.
250 W. Cao et al. / Applied Energy 164 (2016) 245–257
in Fig. 6b. This suggests that the SOP device can effectively isolatea fault between the interconnected feeders. A reduction on theoutput current is observed after the fault occurred. This is dueto the decrease of active power flow between the interconnectedfeeders.
Fig. 6c shows the real and reactive power flow of both VSCs. It isseen that both active and reactive power outputs on the faultedside VSC (dashed line) decreased during the fault, and then turned
to zero after disabling the faulted side VSC. Nevertheless, the reac-tive power output on the un-faulted side VSC (solid line) remainedat the pre-fault value due to the de-coupled controllability of thecontrol strategies.
When the pre-fault active power was flowing from the faultedside to the un-faulted side feeder, a similar SOP response as shownin Fig. 6 was observed which is not shown due to the spacelimitation.
(b)
(c)
(a)Time (s) Time (s)
Time (s) Time (s)
Time (s) Time (s)
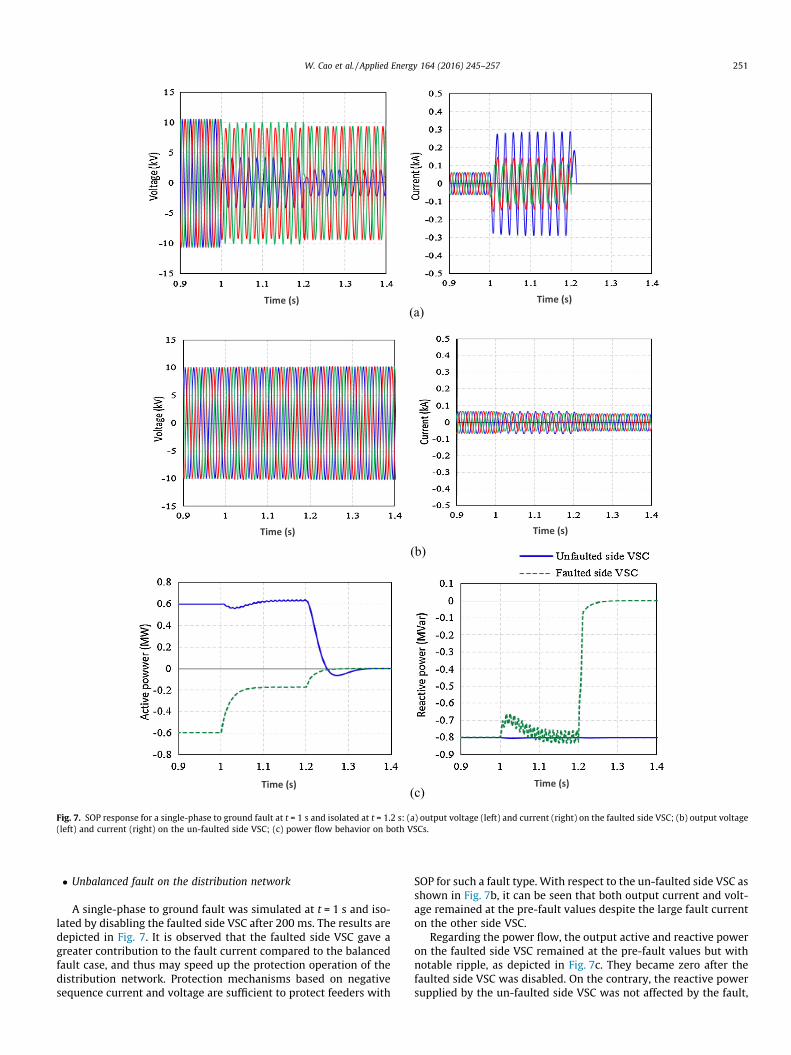
Fig. 7. SOP response for a single-phase to ground fault at t = 1 s and isolated at t = 1.2 s: (a) output voltage (left) and current (right) on the faulted side VSC; (b) output voltage(left) and current (right) on the un-faulted side VSC; (c) power flow behavior on both VSCs.
W. Cao et al. / Applied Energy 164 (2016) 245–257 251
� Unbalanced fault on the distribution network
A single-phase to ground fault was simulated at t = 1 s and iso-lated by disabling the faulted side VSC after 200 ms. The results aredepicted in Fig. 7. It is observed that the faulted side VSC gave agreater contribution to the fault current compared to the balancedfault case, and thus may speed up the protection operation of thedistribution network. Protection mechanisms based on negativesequence current and voltage are sufficient to protect feeders with
SOP for such a fault type. With respect to the un-faulted side VSC asshown in Fig. 7b, it can be seen that both output current and volt-age remained at the pre-fault values despite the large fault currenton the other side VSC.
Regarding the power flow, the output active and reactive poweron the faulted side VSC remained at the pre-fault values but withnotable ripple, as depicted in Fig. 7c. They became zero after thefaulted side VSC was disabled. On the contrary, the reactive powersupplied by the un-faulted side VSC was not affected by the fault,
252 W. Cao et al. / Applied Energy 164 (2016) 245–257
which remained at the pre-fault value. When the pre-fault activepower flows from the faulted side to the un-faulted side feeder,the SOP performance is similar to those shown in Fig. 7.
Simulations have also been conducted when the faulted sideVSC operates using the Vdc–Q scheme. Similar SOP performancewas obtained to that shown in Figs. 6 and 7. From the resultsobtained, it is concluded that the SOP device and its controllersare effective in isolating fault between the connected feeders, thuslimit the fault propagation on the network and the increase ofshort-circuit current. In addition, despite the occurrence of a fault,the reactive power controllability on the un-faulted side VSCremains.
3.3. Post-fault supply restoration conditions
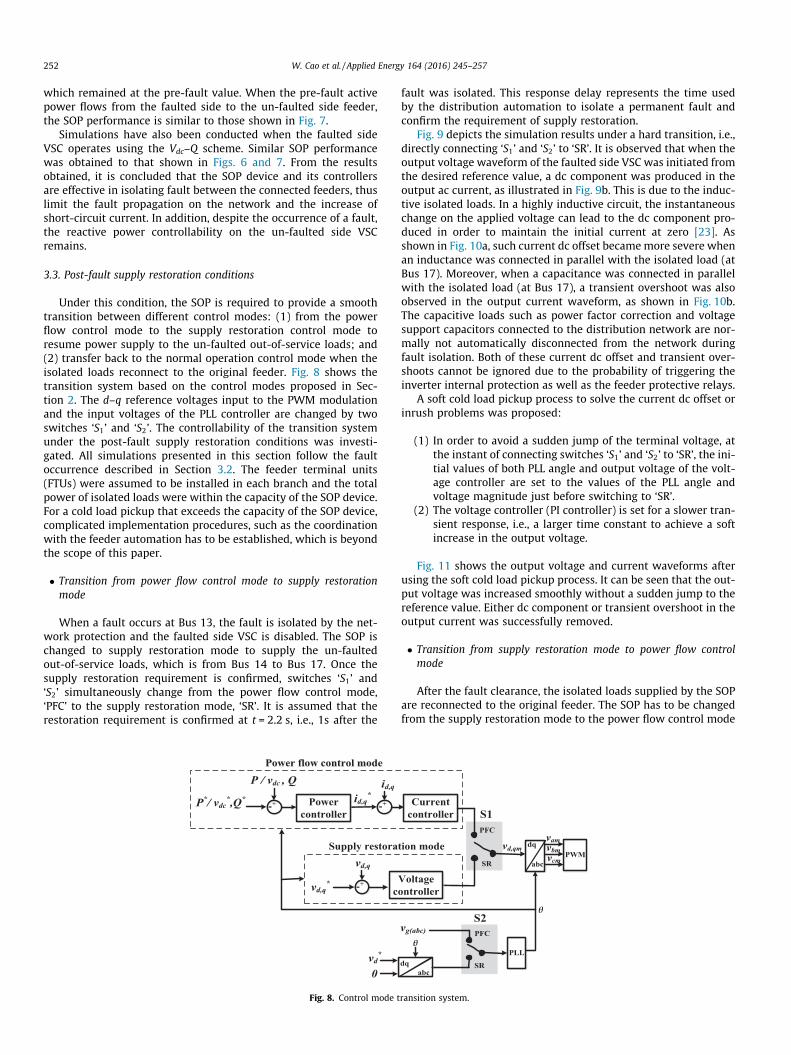
Under this condition, the SOP is required to provide a smoothtransition between different control modes: (1) from the powerflow control mode to the supply restoration control mode toresume power supply to the un-faulted out-of-service loads; and(2) transfer back to the normal operation control mode when theisolated loads reconnect to the original feeder. Fig. 8 shows thetransition system based on the control modes proposed in Sec-tion 2. The d–q reference voltages input to the PWM modulationand the input voltages of the PLL controller are changed by twoswitches ‘S1’ and ‘S2’. The controllability of the transition systemunder the post-fault supply restoration conditions was investi-gated. All simulations presented in this section follow the faultoccurrence described in Section 3.2. The feeder terminal units(FTUs) were assumed to be installed in each branch and the totalpower of isolated loads were within the capacity of the SOP device.For a cold load pickup that exceeds the capacity of the SOP device,complicated implementation procedures, such as the coordinationwith the feeder automation has to be established, which is beyondthe scope of this paper.
� Transition from power flow control mode to supply restorationmode
When a fault occurs at Bus 13, the fault is isolated by the net-work protection and the faulted side VSC is disabled. The SOP ischanged to supply restoration mode to supply the un-faultedout-of-service loads, which is from Bus 14 to Bus 17. Once thesupply restoration requirement is confirmed, switches ‘S1’ and‘S2’ simultaneously change from the power flow control mode,‘PFC’ to the supply restoration mode, ‘SR’. It is assumed that therestoration requirement is confirmed at t = 2.2 s, i.e., 1s after the
+-
+-
+- Powercontroller
vd,q*
vd,q
id,q
id,q*
P*/ vdc*,Q*
P / vdc , Q
c
Power flow control modePower flow control mode
Supply restora
vd*
0
Fig. 8. Control mode t
fault was isolated. This response delay represents the time usedby the distribution automation to isolate a permanent fault andconfirm the requirement of supply restoration.
Fig. 9 depicts the simulation results under a hard transition, i.e.,directly connecting ‘S1’ and ‘S2’ to ‘SR’. It is observed that when theoutput voltage waveform of the faulted side VSC was initiated fromthe desired reference value, a dc component was produced in theoutput ac current, as illustrated in Fig. 9b. This is due to the induc-tive isolated loads. In a highly inductive circuit, the instantaneouschange on the applied voltage can lead to the dc component pro-duced in order to maintain the initial current at zero [23]. Asshown in Fig. 10a, such current dc offset becamemore severe whenan inductance was connected in parallel with the isolated load (atBus 17). Moreover, when a capacitance was connected in parallelwith the isolated load (at Bus 17), a transient overshoot was alsoobserved in the output current waveform, as shown in Fig. 10b.The capacitive loads such as power factor correction and voltagesupport capacitors connected to the distribution network are nor-mally not automatically disconnected from the network duringfault isolation. Both of these current dc offset and transient over-shoots cannot be ignored due to the probability of triggering theinverter internal protection as well as the feeder protective relays.
A soft cold load pickup process to solve the current dc offset orinrush problems was proposed:
(1) In order to avoid a sudden jump of the terminal voltage, atthe instant of connecting switches ‘S1’ and ‘S2’ to ‘SR’, the ini-tial values of both PLL angle and output voltage of the volt-age controller are set to the values of the PLL angle andvoltage magnitude just before switching to ‘SR’.
(2) The voltage controller (PI controller) is set for a slower tran-sient response, i.e., a larger time constant to achieve a softincrease in the output voltage.
Fig. 11 shows the output voltage and current waveforms afterusing the soft cold load pickup process. It can be seen that the out-put voltage was increased smoothly without a sudden jump to thereference value. Either dc component or transient overshoot in theoutput current was successfully removed.
� Transition from supply restoration mode to power flow controlmode
After the fault clearance, the isolated loads supplied by the SOPare reconnected to the original feeder. The SOP has to be changedfrom the supply restoration mode to the power flow control mode
PWMabc
dqvd,qmvamvbmvcm
Currentcontroller
Voltageontroller
tion modeSR
PFC
PLL
θ
vg(abc)
θ
dqabc
SR
PFC
S1
S2
ransition system.
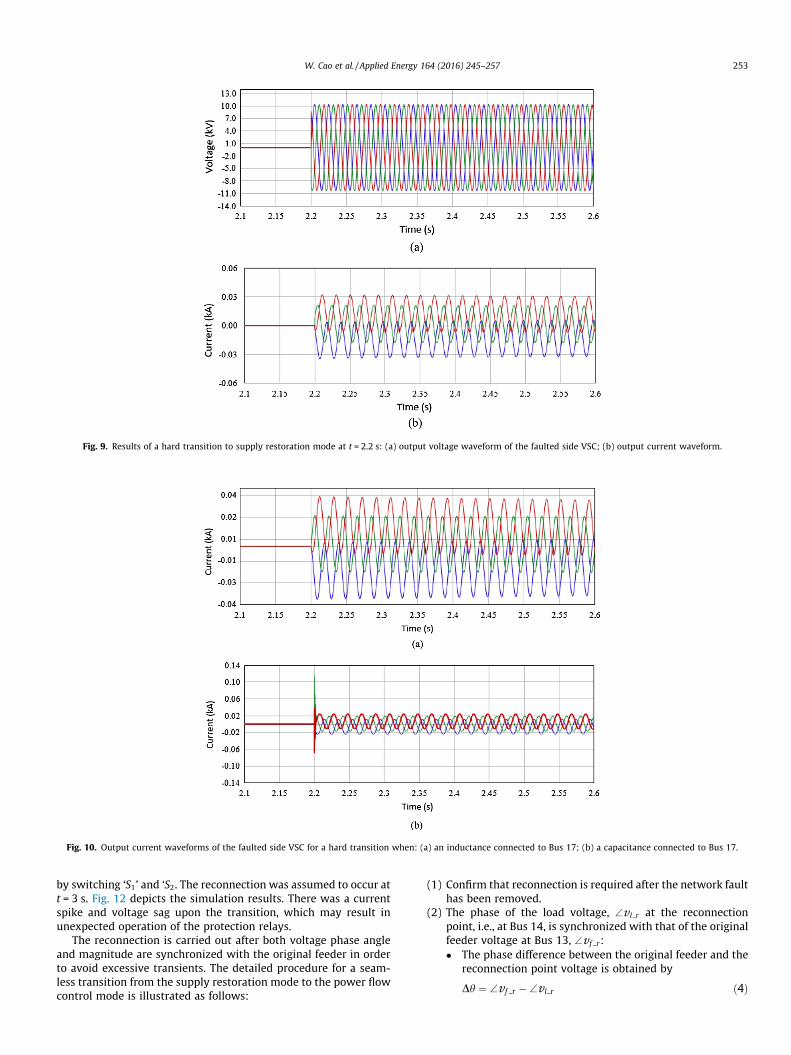
Fig. 9. Results of a hard transition to supply restoration mode at t = 2.2 s: (a) output voltage waveform of the faulted side VSC; (b) output current waveform.
Fig. 10. Output current waveforms of the faulted side VSC for a hard transition when: (a) an inductance connected to Bus 17; (b) a capacitance connected to Bus 17.
W. Cao et al. / Applied Energy 164 (2016) 245–257 253
by switching ‘S1’ and ‘S2. The reconnection was assumed to occur att = 3 s. Fig. 12 depicts the simulation results. There was a currentspike and voltage sag upon the transition, which may result inunexpected operation of the protection relays.
The reconnection is carried out after both voltage phase angleand magnitude are synchronized with the original feeder in orderto avoid excessive transients. The detailed procedure for a seam-less transition from the supply restoration mode to the power flowcontrol mode is illustrated as follows:
(1) Confirm that reconnection is required after the network faulthas been removed.
(2) The phase of the load voltage, \v l r at the reconnectionpoint, i.e., at Bus 14, is synchronized with that of the originalfeeder voltage at Bus 13, \v f r:
� The phase difference between the original feeder and thereconnection point voltage is obtained by
Dh ¼ \v f r � \v l r ð4Þ
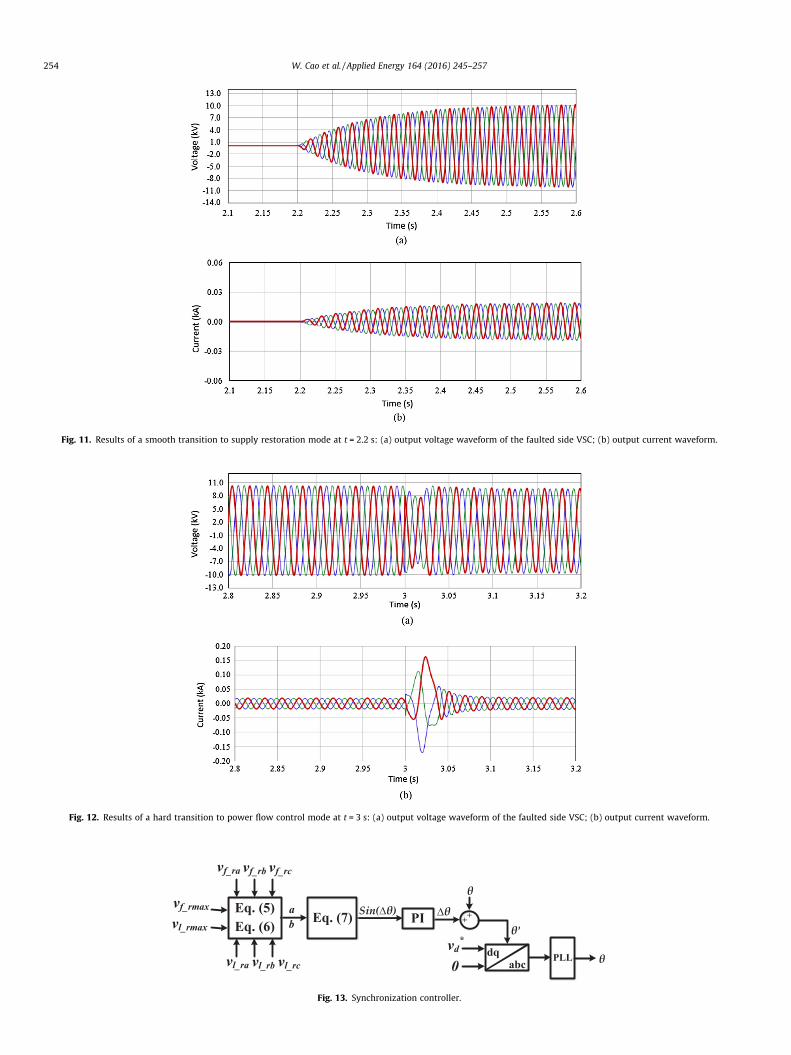
Fig. 11. Results of a smooth transition to supply restoration mode at t = 2.2 s: (a) output voltage waveform of the faulted side VSC; (b) output current waveform.
Fig. 12. Results of a hard transition to power flow control mode at t = 3 s: (a) output voltage waveform of the faulted side VSC; (b) output current waveform.
θ'
dqabc
vd*
0PLL θ
++∆θPIEq. (7) Sin(∆θ)a
bEq. (5)Eq. (6)
vf_ra vf_rb vf_rc
vl_ra vl_rb vl_rc
vl_rmax
vf_rmaxθ
Fig. 13. Synchronization controller.
254 W. Cao et al. / Applied Energy 164 (2016) 245–257
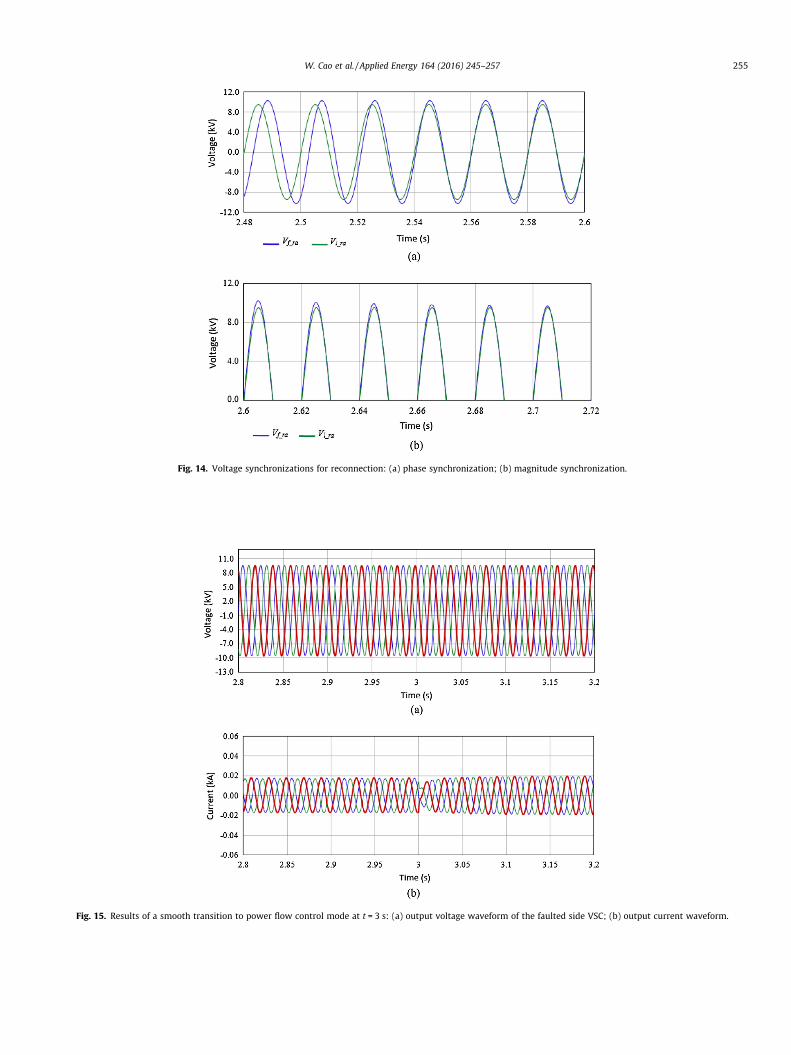
Fig. 14. Voltage synchronizations for reconnection: (a) phase synchronization; (b) magnitude synchronization.
Fig. 15. Results of a smooth transition to power flow control mode at t = 3 s: (a) output voltage waveform of the faulted side VSC; (b) output current waveform.
W. Cao et al. / Applied Energy 164 (2016) 245–257 255
256 W. Cao et al. / Applied Energy 164 (2016) 245–257
� Two sets of voltage values are used to obtain the informa-tion of Dh
a ¼ v f ra � v l ra þ v f rb � v l rb þ v f rc � v l rc
¼ 32� v f max � v l max cosDh ð5Þ
b ¼ v l ra � v f rb þ v l rb � v f rc þ v l rc � v f ra
¼ 34� v f max � v l max½� cosDhþ
ffiffiffi3
psinDh� ð6Þ
where v f ra, v f rb, v f rc and v l ra, v l rb, v l rc are the instanta-neous phase voltages at Bus 14 and Bus 13, v f max andv l max are the maximum values of the instantaneous phasevoltages at Bus 14 and Bus 13. More details for the deduc-tion of Eqs. (5) and (6) are provided in Appendix A.
� Combining (5) and (6), sinðDhÞ is found as
sinDh ¼ffiffiffi3
p
3 � v f max � v l max� 4
3bþ 2
3a
� �ð7Þ
Fig. 13 shows an overview of the phase synchronization pro-cess. ‘S2’ is switched to ‘PFC’ after the phase synchronization iscompleted.
(3) The d–q feeder voltages are assigned as the d–q voltage ref-erences of the voltage controller in order to adjust the mag-nitude of the load voltage to that of the grid voltage.
(4) When both phase and magnitude of the output voltagematch the original feeder voltage, ‘S1’ is switched to ‘PFC’,and the isolated loads are reconnected to the original feeder.In order to prevent large transient flows of real and reactivepower, the integrals of both power and current PI controllersare reset to zero and the reference values of real and reactivepower are set as the value before transfer to the power flowcontrol mode.
Fig. 14 shows the synchronization of the voltages when the syn-chronization algorithm started to work in the supply restorationmode. As can be seen, the synchronization process successfullyforced the voltage at the end of the isolated area to track the volt-age at the original feeder. Fig. 15 depicts the output voltage andcurrent waveforms of the faulted side VSC after using the synchro-nization process. The current spike and voltage sag were success-fully reduced.
A practical application of SOP in selected power distributionnetworks in the UK has been launched through the low carbon net-work fund (LCNF) [24]. The assessment on the performance of theback-to-back VSCs based SOP installed in Briton and London net-works is being undertaken.
4. Conclusion
Two control modes were developed for the operation of a back-to-back VSCs based SOP. For the power flow control mode, a dualclosed-loop current-controlled strategy was used to regulate bothactive and reactive power on the connected feeders. For the supplyrestoration mode, a voltage and frequency control strategy wasproposed to provide fast power supply restoration when the loadsconnected to one side of SOP are isolated due to network faults.The operational principle of the back-to-back VSCs based SOPwas analyzed under both normal and abnormal network operatingconditions. Case studies based on a two-feeder MV distributionnetwork evaluated the performance of the SOP device using the
two control modes under normal, during a fault and post-fault sup-ply restoration conditions.
Under normal conditions, the proposed SOP controller providesboth instantaneous and longer duration power flow regulationbetween the interconnected feeders and the Volt/VAR support onboth terminals. During fault conditions, the SOP controller (powerflow control mode) is able to isolate either balanced or unbalancednetwork faults between interconnected feeders, and thus limit thefault propagation on the network and the increase of the short-circuit current.
Under post-fault supply restoration conditions, the SOP devicewas demonstrated to be effective in providing fast supply restora-tion through a seamless transition between the normal operationand the supply restoration modes. For the transition from thepower flow control mode to the supply restoration mode, a softcold load pickup process was preferred than the hard transitionin order to remove the current dc offset and inrush problems whichmay trigger unexpected protection operations. For the transitionfrom the supply restoration mode to the power flow control mode,the undesirable current overshoot and voltage lag were reducedafter the use of the voltage synchronization procedure and theresets of current and power controllers.
Acknowledgements
This work was supported in part by the UK-China NSFC/EPSRCOPEN project (Grant No. EP/K006274/1 and 51261130473) andthe UK/India HEAPD project (Grant No. EP/K036211/1).
Appendix A. Deduction of Eqs. (5) and (6)
A balanced three-phase system is assumed and the instanta-neous phase voltages at Bus 14 and Bus 13 are given by:
v f ra ¼ v f max � sinð\v f rÞv f rb ¼ v f max � sinð\v f r � 120�Þv f rc ¼ v f max � sinð\v f r þ 120�Þ
8><>: ðA:1Þ
v l ra ¼ v l max � sinð\v l rÞv l rb ¼ v l max � sinð\v l r � 120�Þv l rc ¼ v l max � sinð\v l r þ 120�Þ
8><>: ðA:2Þ
Substitute (A.1) and (A.2) into Eq. (5), thus
a¼v f ra �v l raþv f rb �v l rb þv f rc �v l rc
¼v f max �v l max �sinð\v f rÞ �sinðxtþ\v l rÞþv f max �v l max �sinð\v f r
�120�Þ �sinð\v l r �120�Þþv f max �v l max �sinð\Vf r þ120�Þ �sinð\v l r þ120�Þ
¼v f max �v l max � 32�sinð\v f rÞ � sinð\v l rÞþ3
2�cosð\v f rÞ �cosð\v l rÞ
� �
¼32�v f max �v l max �cosð\v f r �\v l rÞ
¼32�v f max �v l max �cosDh
Eq. (6) is able to be deduced in a similar way.
References
[1] Hung DQ, Mithulananthan N, Bansal RC. Integration of PV and BES units incommercial distribution systems considering energy loss and voltage stability.Appl Energy 2014;113:1162–70.
[2] Mu Y, Wu J, Jenkins N, Jia H, Wang C. A spatial–temporal model for grid impactanalysis of plug-in electric vehicles. Appl Energy 2014;114:456–65.
[3] Abdullah MA, Agalgaonkar AP, Muttaqi KM. Assessment of energy supply andcontinuity of service in distribution network with renewable distributedgeneration. Appl Energy 2014;113:1015–26.
[4] Fotouhi Ghazvini MA, Morais H, Vale Z. Coordination between mid-termmaintenance outage decisions and short-term security-constrained schedulingin smart distribution systems. Appl Energy 2012;96:281–91.
W. Cao et al. / Applied Energy 164 (2016) 245–257 257
[5] Savic A, Ðurišic Z. Optimal sizing and location of SVC devices for improvementof voltage profile in distribution network with dispersed photovoltaic andwind power plants. Appl Energy 2014;134:114–24.
[6] Lakervi E, Holmes EJ. Electricity distribution network design. 2nd ed. London(UK): Peregrinus; 1995.
[7] Chen TH, Wei-Tzer H, Jyh-Cherng G, Guan-Chih P, Yen-Feng H, Tzong-YihG. Feasibility study of upgrading primary feeders from radial andopen-loop to normally closed-loop arrangement. IEEE Trans Power Syst2004;19:1308–16.
[8] Okada N, Kobayashi H, Takigawa K, Ichikawa M, Kurokawa K. Loop power flowcontrol and voltage characteristics of distribution system for distributedgeneration including PV system. In: Proceedings of 3rd world conference onphotovoltaic energy conversion, vol. 3; 2003. p. 2284–87.
[9] Bloemink JM, Green TC. Increasing distributed generation penetration usingsoft normally-open points. In: IEEE power and energy society general meeting;2010. p. 1-8.
[10] Bloemink JM, Green TC. Benefits of distribution-level power electronics forsupporting distributed generation growth. IEEE Trans Power Del2013;28:911–9.
[11] Bloemink JM, Green TC. Increasing photovoltaic penetration with local energystorage and soft normally-open points. In: IEEE power and energy societygeneral meeting; 2011. p. 1–8.
[12] Simanjorang R, Miura Y, Ise T, Sugimoto S, Fujita H. Application of series typeBTB converter for minimizing circulating current and balancing powertransformers in loop distribution lines. In: IEEE conference on powerconversion. Nagoya; 2007. p. 997–1004.
[13] Trujillo CL, Velasco D, Guarnizo JG, Díaz N. Design and implementation of aVSC for interconnection with power grids, using the method of identificationthe system through state space for the calculation of controllers. Appl Energy2011;88(9):3169–75.
[14] Jacobson B, Jiang-Hafner Y, P. Rey GA, Jeroense M, Gustafsson A, Bergkvist M.HVDC with voltage source converters and extruded cables for up to ±300 kVand 1000 MW. Cigre, Paris, France; 2006. p. B4–105 [1–8].
[15] Chaudhuri NR, Majumder R, Chaudhuri B, Jiuping P. Stability analysis of VSCMTDC grids connected to multimachine AC systems. IEEE Trans Power Del2011;26:2774–84.
[16] Espi Huerta JM, Castello-Moreno J, Fischer JR, Garcia-Gil R. A synchronousreference frame robust predictive current control for three-phase grid-connected inverters. IEEE Trans Ind Electron 2010;57:954–62.
[17] Balaguer IJ, Qin L, Shuitao Y, Supatti U, Fang Zheng P. Control for grid-connected and intentional islanding operations of distributed powergeneration. IEEE Trans Ind Electron 2011;58:147–57.
[18] Rolim LGB, da Costa DR, Aredes M. Analysis and software implementation of arobust synchronizing PLL circuit based on the pq theory. IEEE Trans IndElectron 2006;53:1919–26.
[19] Fang G, Iravani MR. A control strategy for a distributed generation unit in grid-connected and autonomous modes of operation. IEEE Trans Power Del2008;23:850–9.
[20] Cole S, Beerten J, Belmans R. Generalized dynamic VSC MTDC model for powersystem stability studies. IEEE Trans Power Syst 2010;25:1655–62.
[21] Silva B,Moreira CL, Leite H, Lopes JA. Control strategies for AC fault ride throughin multiterminal HVDC Grids. IEEE Trans Power Del 2014;29:395–405.
[22] Nikkhajoei H, Lasseter RH. Microgrid protection. IEEE conference on powerengineering society general meeting; 2007. p. 1-6.
[23] Stringer NT. The effect of DC offset on current-operated relays. IEEE Trans IndAppl 1998;34:30–4.
[24] UK Power Networks. Ofgem – LCNF Tier 2 project: Flexible Urban NetworksLow Voltage. Available: <http://innovation.ukpowernetworks.co.uk/innovation/en/Projects/tier-2-projects/Flexible-Urban-Networks-Low-Voltage/Project-Documents/Overview+Flexible+Urban+Networks+Low+Voltage-+Jan+2014.pdf>.