Embed Size (px)
Citation preview
2014
Operating Executive Compensation Report
Survey Analysis
4030481 - 2014 Operating Executive Compensation - Draft 11.indd 1 02/05/2014 17:57
Heidrick & Struggles 2
2014 Operating Executive Compensation Report
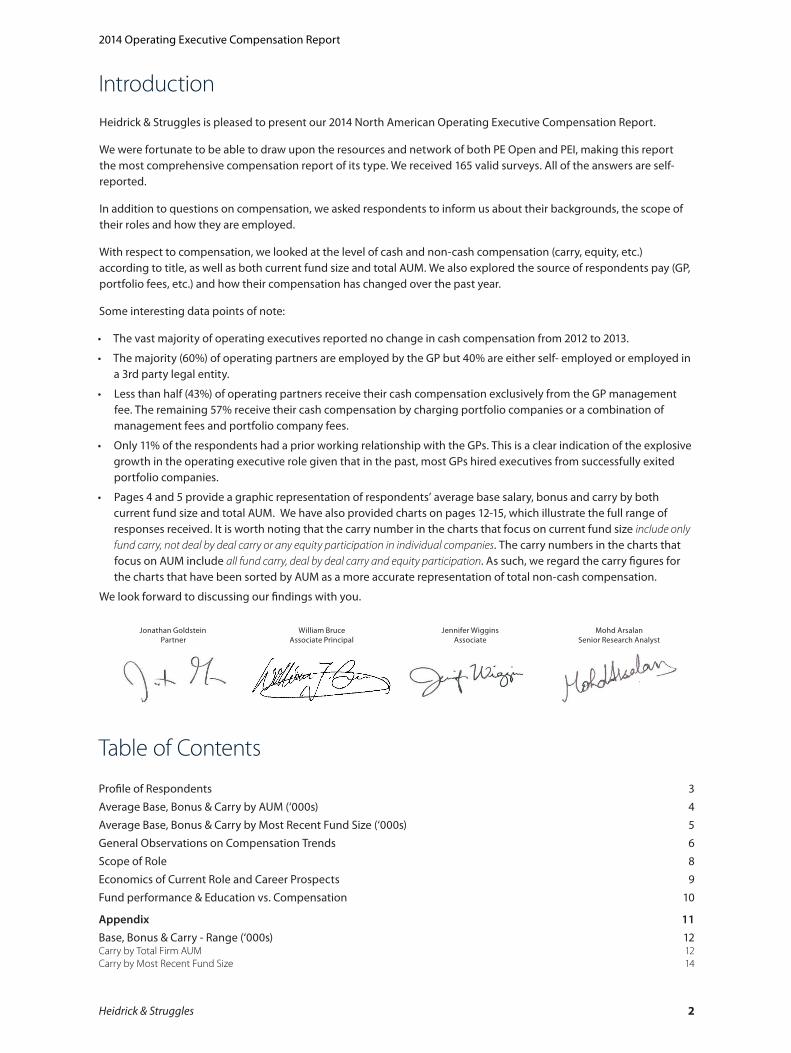
IntroductionHeidrick & Struggles is pleased to present our 2014 North American Operating Executive Compensation Report.
We were fortunate to be able to draw upon the resources and network of both PE Open and PEI, making this report the most comprehensive compensation report of its type. We received 165 valid surveys. All of the answers are self-reported.
In addition to questions on compensation, we asked respondents to inform us about their backgrounds, the scope of their roles and how they are employed.
With respect to compensation, we looked at the level of cash and non-cash compensation (carry, equity, etc.) according to title, as well as both current fund size and total AUM. We also explored the source of respondents pay (GP, portfolio fees, etc.) and how their compensation has changed over the past year.
Some interesting data points of note:
• The vast majority of operating executives reported no change in cash compensation from 2012 to 2013.
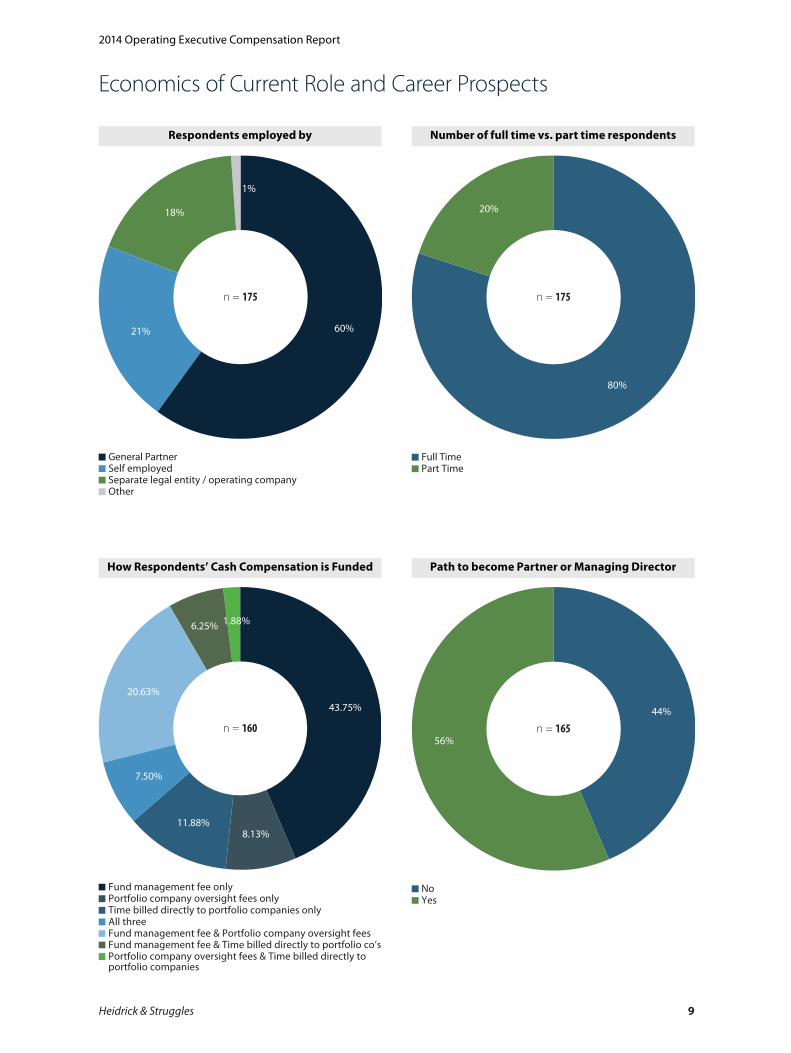
• The majority (60%) of operating partners are employed by the GP but 40% are either self- employed or employed in a 3rd party legal entity.
• Less than half (43%) of operating partners receive their cash compensation exclusively from the GP management fee. The remaining 57% receive their cash compensation by charging portfolio companies or a combination of management fees and portfolio company fees.
• Only 11% of the respondents had a prior working relationship with the GPs. This is a clear indication of the explosive growth in the operating executive role given that in the past, most GPs hired executives from successfully exited portfolio companies.
• Pages 4 and 5 provide a graphic representation of respondents’ average base salary, bonus and carry by both current fund size and total AUM. We have also provided charts on pages 12-15, which illustrate the full range of responses received. It is worth noting that the carry number in the charts that focus on current fund size include only fund carry, not deal by deal carry or any equity participation in individual companies. The carry numbers in the charts that focus on AUM include all fund carry, deal by deal carry and equity participation. As such, we regard the carry figures for the charts that have been sorted by AUM as a more accurate representation of total non-cash compensation.
We look forward to discussing our findings with you.
Jonathan GoldsteinPartner
William BruceAssociate Principal
Jennifer WigginsAssociate
Mohd ArsalanSenior Research Analyst
Table of Contents
Profile of Respondents 3
Average Base, Bonus & Carry by AUM (‘000s) 4
Average Base, Bonus & Carry by Most Recent Fund Size (‘000s) 5
General Observations on Compensation Trends 6
Scope of Role 8
Economics of Current Role and Career Prospects 9
Fund performance & Education vs. Compensation 10
Appendix 11Base, Bonus & Carry - Range (‘000s) 12Carry by Total Firm AUM 12Carry by Most Recent Fund Size 14
4030481 - 2014 Operating Executive Compensation - Draft 11.indd 2 02/05/2014 17:57
Heidrick & Struggles 3
2014 Operating Executive Compensation Report
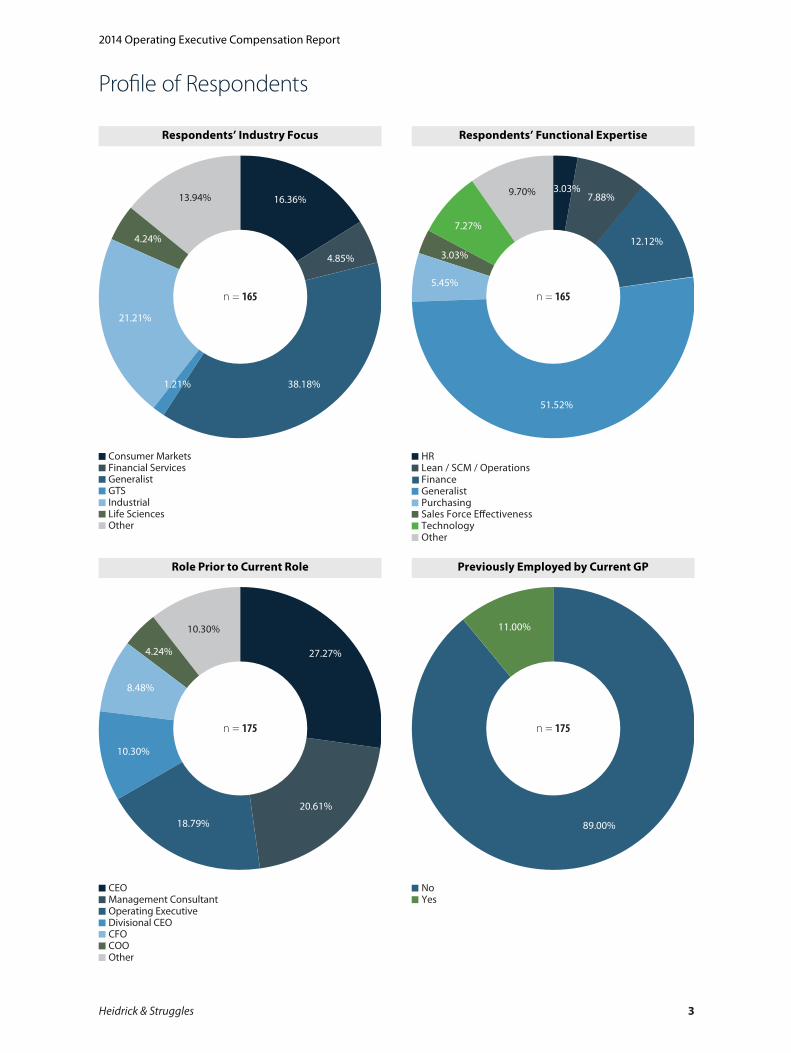
Profile of Respondents
Respondents’ Industry Focus
16.36%
4.85%
38.18%1.21%
21.21%
4.24%
13.94%
Consumer MarketsFinancial ServicesGeneralistGTSIndustrialLife SciencesOther
n = 165
Respondents’ Functional Expertise
HRLean / SCM / OperationsFinanceGeneralist
Other
PurchasingSales Force E�ectivenessTechnology
3.03%7.88%
12.12%
51.52%
9.70%
5.45%
3.03%
7.27%
n = 165
Role Prior to Current Role
27.27%
20.61%
18.79%
10.30%
10.30%
8.48%
4.24%
CEOManagement ConsultantOperating Executive
Other
Divisional CEOCFOCOO
n = 175
Previously Employed by Current GP
89.00%
11.00%
NoYes
n = 175
4030481 - 2014 Operating Executive Compensation - Draft 11.indd 3 02/05/2014 17:57
Heidrick & Struggles 4
2014 Operating Executive Compensation Report
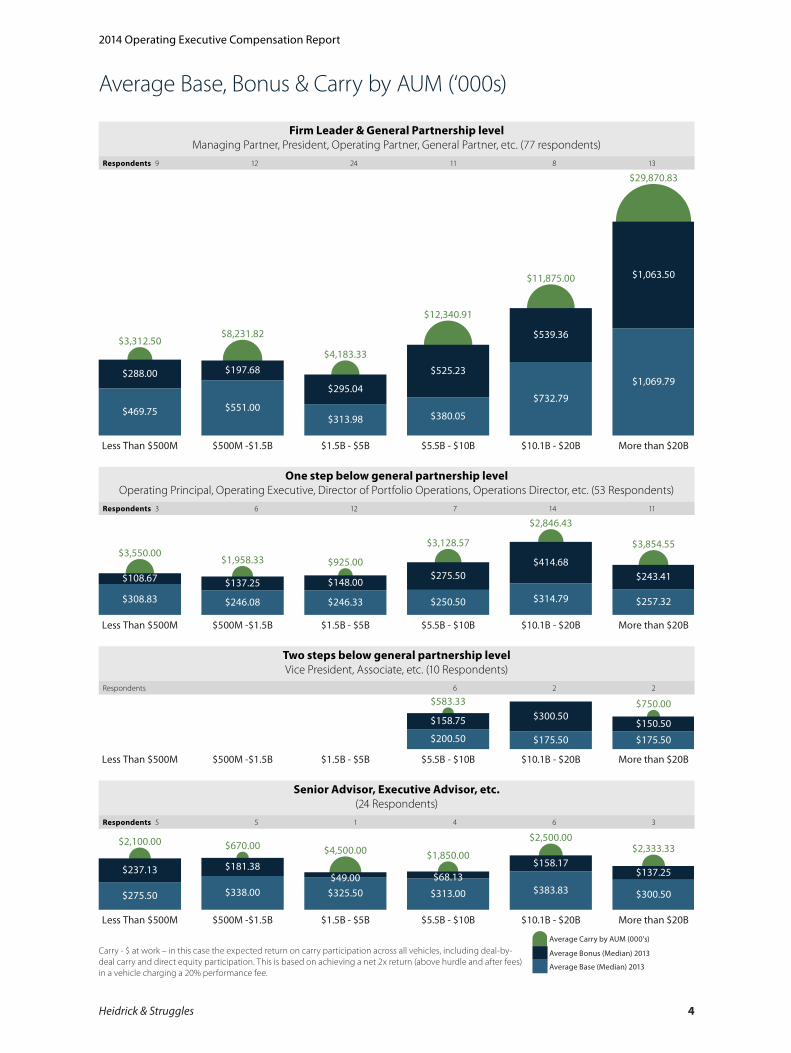
Average Base, Bonus & Carry by AUM (‘000s)
Firm Leader & General Partnership levelManaging Partner, President, Operating Partner, General Partner, etc. (77 respondents)
Respondents 9 12 24 11 8 13
$469.75 $551.00 $313.98 $380.05
$732.79
$1,069.79 $288.00 $197.68
$295.04
$525.23
$539.36
$1,063.50
$3,312.50$8,231.82
$4,183.33
$12,340.91
$11,875.00
$29,870.83
Less Than $500M $500M -$1.5B $1.5B - $5B $5.5B - $10B $10.1B - $20B More than $20B
One step below general partnership levelOperating Principal, Operating Executive, Director of Portfolio Operations, Operations Director, etc. (53 Respondents)
Respondents 3 6 12 7 14 11
$308.83 $246.08 $246.33 $250.50 $314.79 $257.32
$108.67 $137.25 $148.00 $275.50
$414.68 $243.41
$3,550.00$1,958.33 $925.00
$3,128.57
$2,846.43
$3,854.55
Less Than $500M $500M -$1.5B $1.5B - $5B $5.5B - $10B $10.1B - $20B More than $20B
Two steps below general partnership levelVice President, Associate, etc. (10 Respondents)
Respondents 6 2 2
$200.50 $175.50 $175.50
$158.75 $300.50 $150.50
$583.33 $750.00
Less Than $500M $500M -$1.5B $1.5B - $5B $5.5B - $10B $10.1B - $20B More than $20B
Senior Advisor, Executive Advisor, etc.(24 Respondents)
Respondents 5 5 1 4 6 3
$275.50 $338.00 $325.50 $313.00 $383.83 $300.50
$237.13 $181.38 $49.00 $68.13
$158.17 $137.25
$2,100.00 $670.00 $4,500.00 $1,850.00
$2,500.00$2,333.33
Less Than $500M $500M -$1.5B $1.5B - $5B $5.5B - $10B $10.1B - $20B More than $20B
Average Carry by AUM (000’s)
Average Bonus (Median) 2013
Average Base (Median) 2013
Carry - $ at work – in this case the expected return on carry participation across all vehicles, including deal-by-deal carry and direct equity participation. This is based on achieving a net 2x return (above hurdle and after fees) in a vehicle charging a 20% performance fee.
4030481 - 2014 Operating Executive Compensation - Draft 11.indd 4 02/05/2014 17:57
Heidrick & Struggles 5
2014 Operating Executive Compensation Report
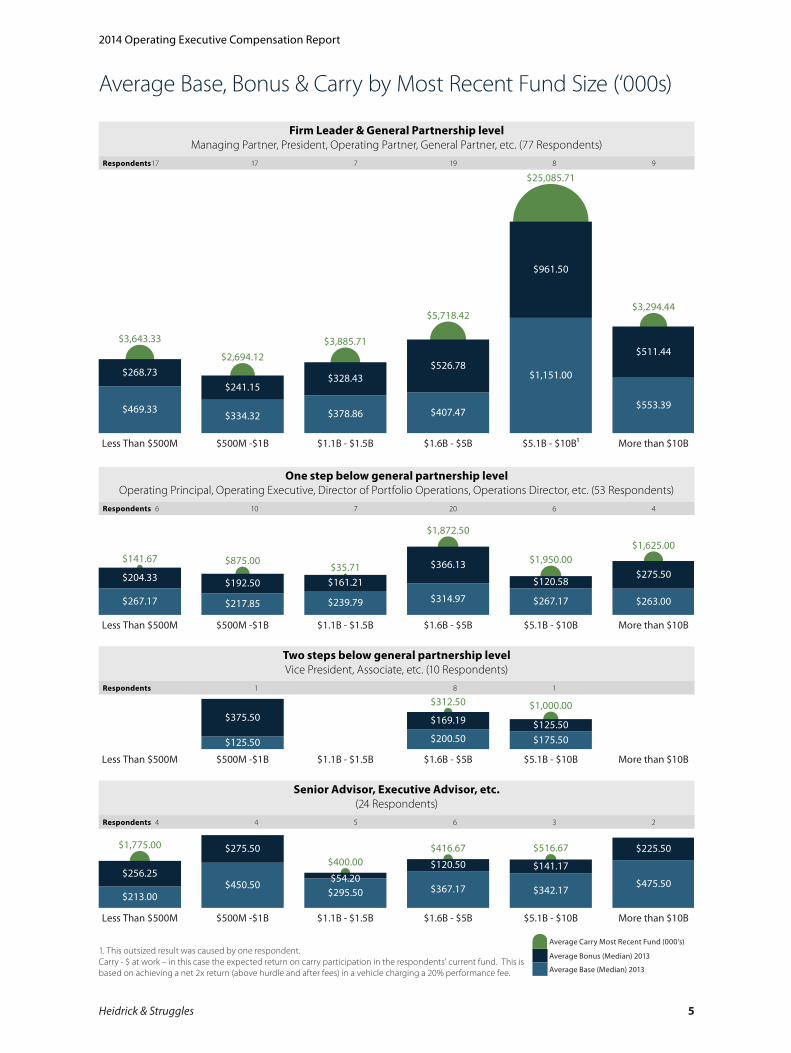
Average Base, Bonus & Carry by Most Recent Fund Size (‘000s)
Firm Leader & General Partnership levelManaging Partner, President, Operating Partner, General Partner, etc. (77 Respondents)
Respondents 17 17 7 19 8 9
$469.33 $334.32 $378.86 $407.47
$1,151.00
$553.39
$268.73$241.15
$328.43 $526.78
$961.50
$511.44
Less Than $500M $500M -$1B $1.1B - $1.5B $1.6B - $5B $5.1B - $10B1 More than $10B
$3,643.33
$2,694.12$3,885.71
$5,718.42
$25,085.71
$3,294.44
One step below general partnership levelOperating Principal, Operating Executive, Director of Portfolio Operations, Operations Director, etc. (53 Respondents)
Respondents 6 10 7 20 6 4
$267.17 $217.85 $239.79 $314.97 $267.17 $263.00
$204.33 $192.50 $161.21
$366.13
$120.58 $275.50
$141.67 $875.00$35.71
$1,872.50
$1,950.00$1,625.00
Less Than $500M $500M -$1B $1.1B - $1.5B $1.6B - $5B $5.1B - $10B More than $10B
Two steps below general partnership levelVice President, Associate, etc. (10 Respondents)
Respondents 1 8 1
$125.50 $200.50 $175.50
$375.50 $169.19 $125.50
$312.50 $1,000.00
Less Than $500M $500M -$1B $1.1B - $1.5B $1.6B - $5B $5.1B - $10B More than $10B
Senior Advisor, Executive Advisor, etc.(24 Respondents)
Respondents 4 4 5 6 3 2
$213.00 $450.50
$295.50 $367.17 $342.17 $475.50
$256.25
$275.50
$54.20 $120.50 $141.17
$225.50 $1,775.00
$400.00$416.67 $516.67
Less Than $500M $500M -$1B $1.1B - $1.5B $1.6B - $5B $5.1B - $10B More than $10B
Average Carry Most Recent Fund (000’s)
Average Bonus (Median) 2013
Average Base (Median) 2013
1. This outsized result was caused by one respondent.Carry - $ at work – in this case the expected return on carry participation in the respondents’ current fund. This is based on achieving a net 2x return (above hurdle and after fees) in a vehicle charging a 20% performance fee.
4030481 - 2014 Operating Executive Compensation - Draft 11.indd 5 02/05/2014 17:57
Heidrick & Struggles 6
2014 Operating Executive Compensation Report
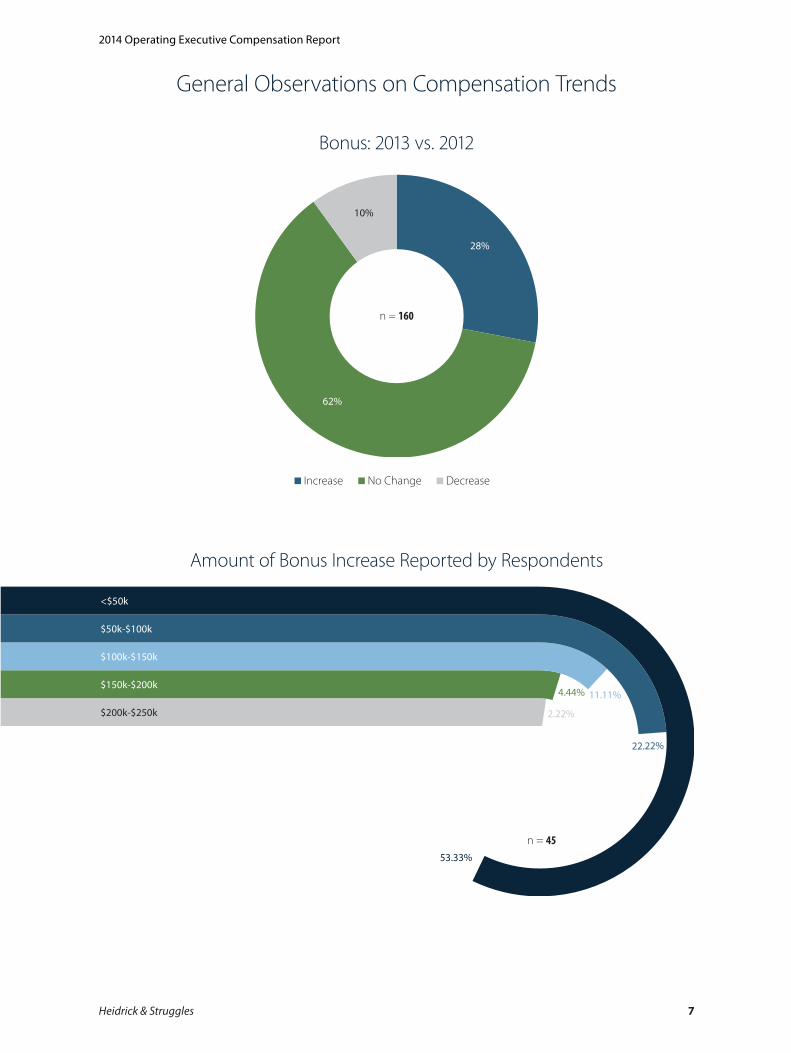
53.33%
22.22%
11.11%4.44%
2.22%
<$50k
$50k-$100k
$100k-$150k
$150k-$200k
$200k-$250k
n = 45
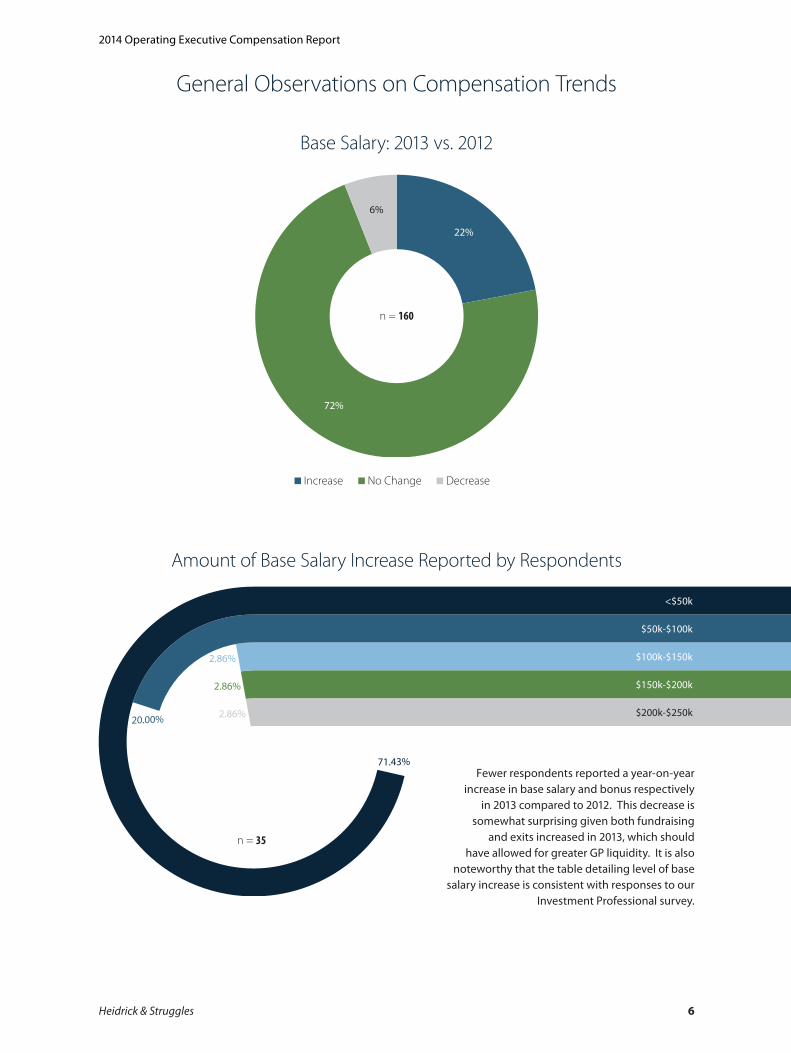
71.43%
20.00%
2.86%
2.86%
2.86%
<$50k
$50k-$100k
$100k-$150k
$150k-$200k
$200k-$250k
n = 35
General Observations on Compensation Trends
Base Salary: 2013 vs. 2012
Amount of Base Salary Increase Reported by Respondents
22%
72%
6%
n = 160
Fewer respondents reported a year-on-year increase in base salary and bonus respectively
in 2013 compared to 2012. This decrease is somewhat surprising given both fundraising
and exits increased in 2013, which should have allowed for greater GP liquidity. It is also
noteworthy that the table detailing level of base salary increase is consistent with responses to our
Investment Professional survey.
Increase No Change Decrease
4030481 - 2014 Operating Executive Compensation - Draft 11.indd 6 02/05/2014 17:57
Heidrick & Struggles 7
2014 Operating Executive Compensation Report
53.33%
22.22%
11.11%4.44%
2.22%
<$50k
$50k-$100k
$100k-$150k
$150k-$200k
$200k-$250k
n = 45
71.43%
20.00%
2.86%
2.86%
2.86%
<$50k
$50k-$100k
$100k-$150k
$150k-$200k
$200k-$250k
n = 35
General Observations on Compensation Trends
Bonus: 2013 vs. 2012
Amount of Bonus Increase Reported by Respondents
28%
62%
10%
n = 160
Increase No Change Decrease
4030481 - 2014 Operating Executive Compensation - Draft 11.indd 7 02/05/2014 17:57
Heidrick & Struggles 8
2014 Operating Executive Compensation Report
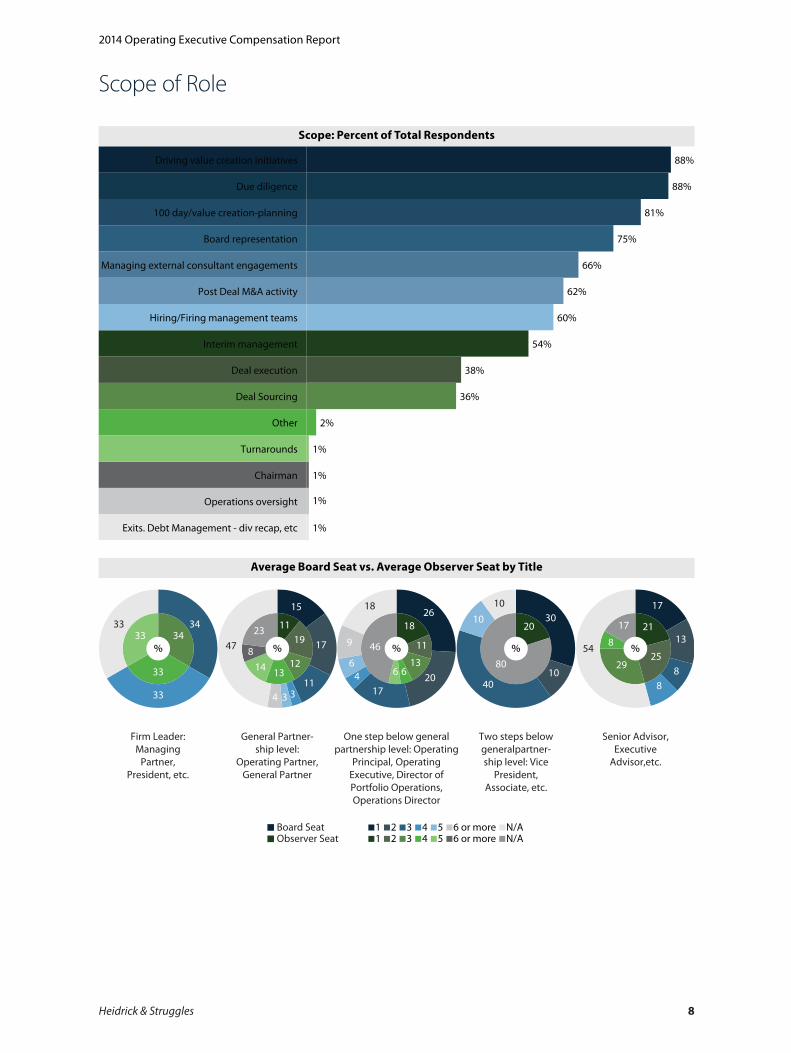
Scope: Percent of Total Respondents
Exits. Debt Management - div recap, etc
Operations oversight
Chairman
Turnarounds
Other
Deal Sourcing
Deal execution
Interim management
Hiring/Firing management teams
Post Deal M&A activity
Managing external consultant engagements
Board representation
100 day/value creation-planning
Due diligence
Driving value creation initiatives
1%
1%
1%
2%
36%
38%
54%
60%
62%
66%
75%
81%
88%
88%
1%
Scope of Role
Average Board Seat vs. Average Observer Seat by Title
%
Firm Leader: Managing
Partner, President, etc.
General Partner-ship level:
Operating Partner, General Partner
One step below general partnership level: Operating
Principal, Operating Executive, Director of Portfolio Operations, Operations Director
Senior Advisor, Executive
Advisor,etc.
Two steps below generalpartner-ship level: Vice
President, Associate, etc.
% % % %
1 2 3 4 5 6 or more N/A Board SeatObserver Seat 1 2 3 4 5 6 or more N/A
34
33
33
3333
34
15
17
11334
47
1119
121314
8
23
26
2017
46
9
18
18
11
1366
46
30
1040
1010
20
80
17
13
88
54
21
2529
8
17
4030481 - 2014 Operating Executive Compensation - Draft 11.indd 8 02/05/2014 17:57
Heidrick & Struggles 9
2014 Operating Executive Compensation Report
Economics of Current Role and Career Prospects
Respondents employed by
1%
21%
18%
60%
General Partner
Other
Self employedSeparate legal entity / operating company
n = 175
Number of full time vs. part time respondents
20%
80%
Full TimePart Time
n = 175
How Respondents’ Cash Compensation is Funded
43.75%
Fund management fee onlyPortfolio company oversight fees onlyTime billed directly to portfolio companies onlyAll threeFund management fee & Portfolio company oversight feesFund management fee & Time billed directly to portfolio co’sPortfolio company oversight fees & Time billed directly toportfolio companies
8.13%11.88%
7.50%
20.63%
6.25% 1.88%
n = 160
Path to become Partner or Managing Director
56%
44%
NoYes
n = 165
4030481 - 2014 Operating Executive Compensation - Draft 11.indd 9 02/05/2014 17:57
Heidrick & Struggles 10
2014 Operating Executive Compensation Report
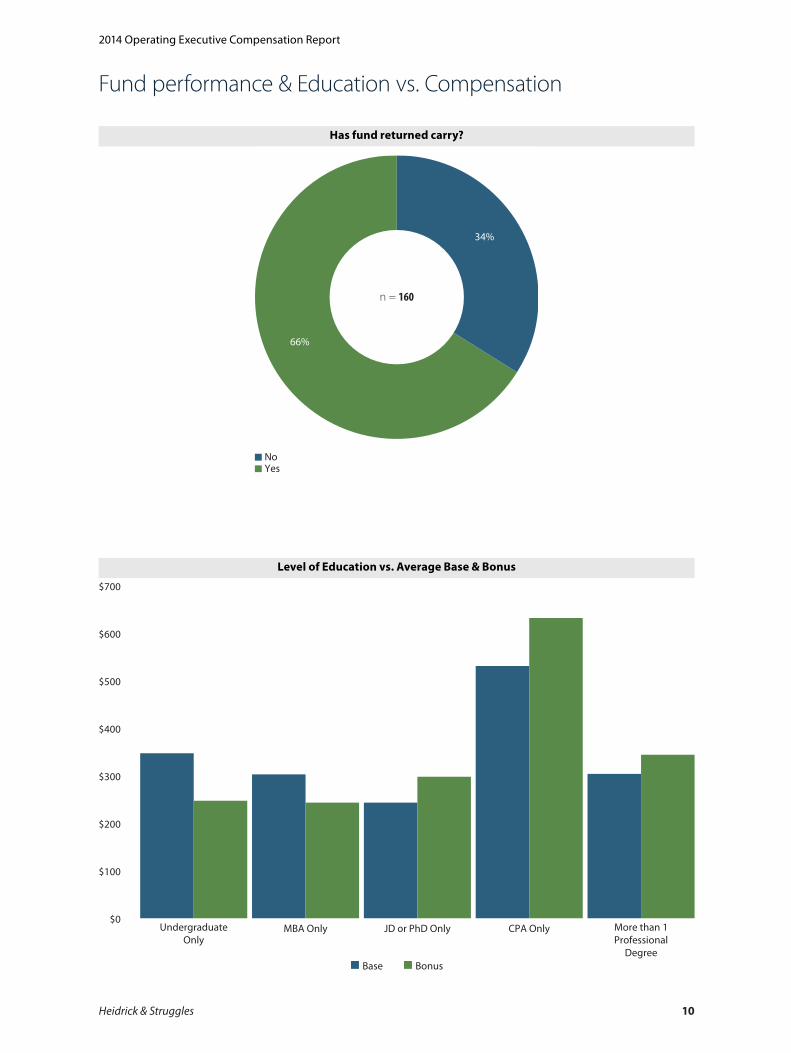
Fund performance & Education vs. Compensation
Has fund returned carry?
34%
66%
NoYes
n = 160
Level of Education vs. Average Base & Bonus
$0
$100
$200
$300
$400
$500
$600
$700
MBA Only JD or PhD Only CPA Only
Base Bonus
Undergraduate Only
More than 1 Professional
Degree
4030481 - 2014 Operating Executive Compensation - Draft 11.indd 10 02/05/2014 17:57
Heidrick & Struggles 11
2014 Operating Executive Compensation Report
Appendix
4030481 - 2014 Operating Executive Compensation - Draft 11.indd 11 02/05/2014 17:57
Heidrick & Struggles 12
2014 Operating Executive Compensation Report
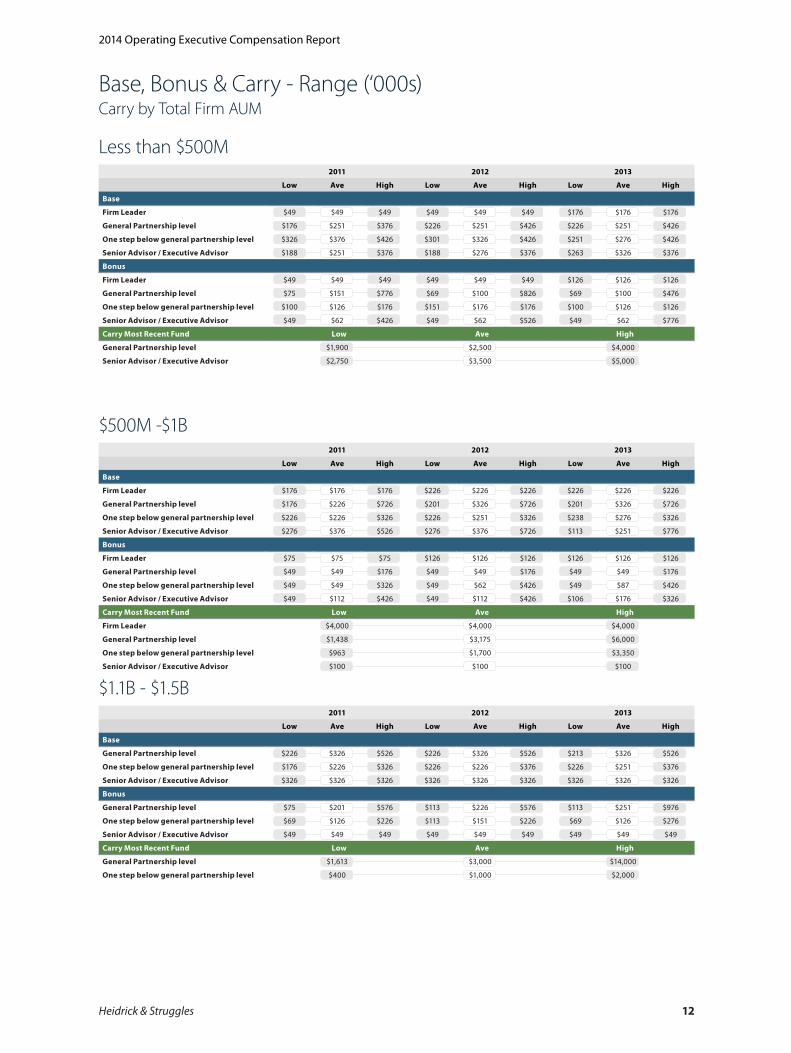
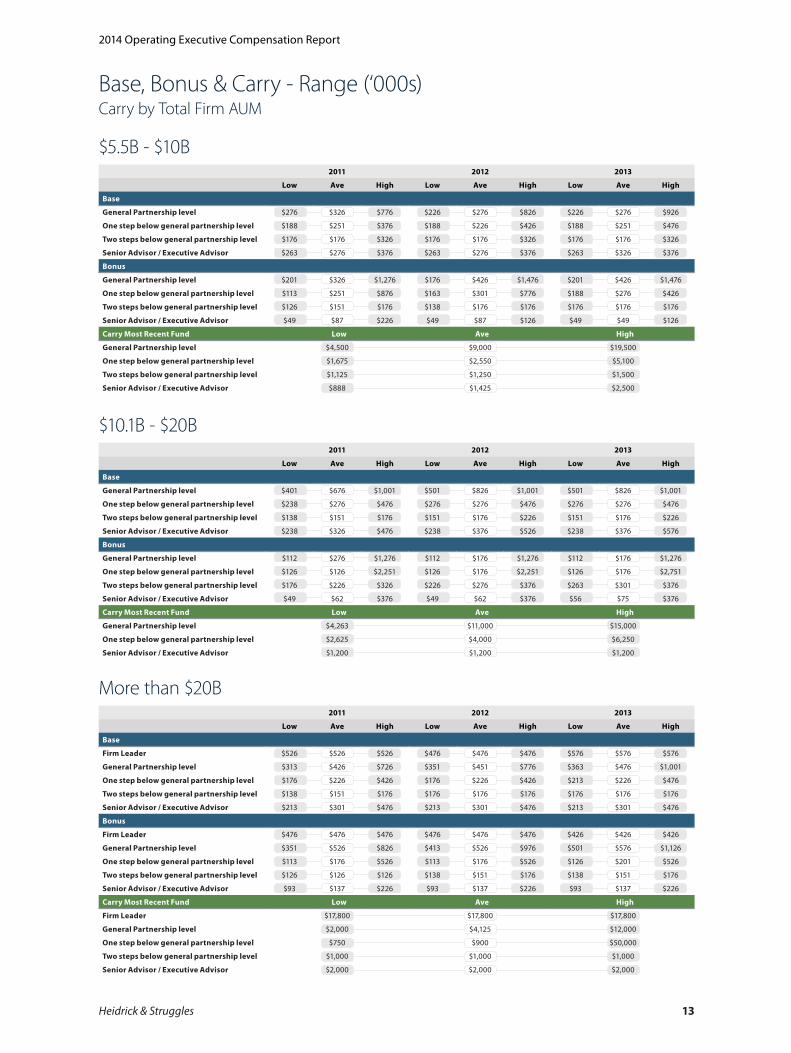
Base, Bonus & Carry - Range (‘000s) Carry by Total Firm AUM
Less than $500M2011 2012 2013
Low Ave High Low Ave High Low Ave High
Base
Firm Leader $49 $49 $49 $49 $49 $49 $176 $176 $176
General Partnership level $176 $251 $376 $226 $251 $426 $226 $251 $426
One step below general partnership level $326 $376 $426 $301 $326 $426 $251 $276 $426
Senior Advisor / Executive Advisor $188 $251 $376 $188 $276 $376 $263 $326 $376
Bonus
Firm Leader $49 $49 $49 $49 $49 $49 $126 $126 $126
General Partnership level $75 $151 $776 $69 $100 $826 $69 $100 $476
One step below general partnership level $100 $126 $176 $151 $176 $176 $100 $126 $126
Senior Advisor / Executive Advisor $49 $62 $426 $49 $62 $526 $49 $62 $776
Carry Most Recent Fund Low Ave High
General Partnership level $1,900 $2,500 $4,000
Senior Advisor / Executive Advisor $2,750 $3,500 $5,000
$500M -$1B2011 2012 2013
Low Ave High Low Ave High Low Ave High
Base
Firm Leader $176 $176 $176 $226 $226 $226 $226 $226 $226
General Partnership level $176 $226 $726 $201 $326 $726 $201 $326 $726
One step below general partnership level $226 $226 $326 $226 $251 $326 $238 $276 $326
Senior Advisor / Executive Advisor $276 $376 $526 $276 $376 $726 $113 $251 $776
Bonus
Firm Leader $75 $75 $75 $126 $126 $126 $126 $126 $126
General Partnership level $49 $49 $176 $49 $49 $176 $49 $49 $176
One step below general partnership level $49 $49 $326 $49 $62 $426 $49 $87 $426
Senior Advisor / Executive Advisor $49 $112 $426 $49 $112 $426 $106 $176 $326
Carry Most Recent Fund Low Ave High
Firm Leader $4,000 $4,000 $4,000
General Partnership level $1,438 $3,175 $6,000
One step below general partnership level $963 $1,700 $3,350
Senior Advisor / Executive Advisor $100 $100 $100
$1.1B - $1.5B2011 2012 2013
Low Ave High Low Ave High Low Ave High
Base
General Partnership level $226 $326 $526 $226 $326 $526 $213 $326 $526
One step below general partnership level $176 $226 $326 $226 $226 $376 $226 $251 $376
Senior Advisor / Executive Advisor $326 $326 $326 $326 $326 $326 $326 $326 $326
Bonus
General Partnership level $75 $201 $576 $113 $226 $576 $113 $251 $976
One step below general partnership level $69 $126 $226 $113 $151 $226 $69 $126 $276
Senior Advisor / Executive Advisor $49 $49 $49 $49 $49 $49 $49 $49 $49
Carry Most Recent Fund Low Ave High
General Partnership level $1,613 $3,000 $14,000
One step below general partnership level $400 $1,000 $2,000
4030481 - 2014 Operating Executive Compensation - Draft 11.indd 12 02/05/2014 17:57
Heidrick & Struggles 13
2014 Operating Executive Compensation Report
$10.1B - $20B2011 2012 2013
Low Ave High Low Ave High Low Ave High
Base
General Partnership level $401 $676 $1,001 $501 $826 $1,001 $501 $826 $1,001
One step below general partnership level $238 $276 $476 $276 $276 $476 $276 $276 $476
Two steps below general partnership level $138 $151 $176 $151 $176 $226 $151 $176 $226
Senior Advisor / Executive Advisor $238 $326 $476 $238 $376 $526 $238 $376 $576
Bonus
General Partnership level $112 $276 $1,276 $112 $176 $1,276 $112 $176 $1,276
One step below general partnership level $126 $126 $2,251 $126 $176 $2,251 $126 $176 $2,751
Two steps below general partnership level $176 $226 $326 $226 $276 $376 $263 $301 $376
Senior Advisor / Executive Advisor $49 $62 $376 $49 $62 $376 $56 $75 $376
Carry Most Recent Fund Low Ave High
General Partnership level $4,263 $11,000 $15,000
One step below general partnership level $2,625 $4,000 $6,250
Senior Advisor / Executive Advisor $1,200 $1,200 $1,200
More than $20B2011 2012 2013
Low Ave High Low Ave High Low Ave High
Base
Firm Leader $526 $526 $526 $476 $476 $476 $576 $576 $576
General Partnership level $313 $426 $726 $351 $451 $776 $363 $476 $1,001
One step below general partnership level $176 $226 $426 $176 $226 $426 $213 $226 $476
Two steps below general partnership level $138 $151 $176 $176 $176 $176 $176 $176 $176
Senior Advisor / Executive Advisor $213 $301 $476 $213 $301 $476 $213 $301 $476
Bonus
Firm Leader $476 $476 $476 $476 $476 $476 $426 $426 $426
General Partnership level $351 $526 $826 $413 $526 $976 $501 $576 $1,126
One step below general partnership level $113 $176 $526 $113 $176 $526 $126 $201 $526
Two steps below general partnership level $126 $126 $126 $138 $151 $176 $138 $151 $176
Senior Advisor / Executive Advisor $93 $137 $226 $93 $137 $226 $93 $137 $226
Carry Most Recent Fund Low Ave High
Firm Leader $17,800 $17,800 $17,800
General Partnership level $2,000 $4,125 $12,000
One step below general partnership level $750 $900 $50,000
Two steps below general partnership level $1,000 $1,000 $1,000
Senior Advisor / Executive Advisor $2,000 $2,000 $2,000
Base, Bonus & Carry - Range (‘000s) Carry by Total Firm AUM
$5.5B - $10B2011 2012 2013
Low Ave High Low Ave High Low Ave High
Base
General Partnership level $276 $326 $776 $226 $276 $826 $226 $276 $926
One step below general partnership level $188 $251 $376 $188 $226 $426 $188 $251 $476
Two steps below general partnership level $176 $176 $326 $176 $176 $326 $176 $176 $326
Senior Advisor / Executive Advisor $263 $276 $376 $263 $276 $376 $263 $326 $376
Bonus
General Partnership level $201 $326 $1,276 $176 $426 $1,476 $201 $426 $1,476
One step below general partnership level $113 $251 $876 $163 $301 $776 $188 $276 $426
Two steps below general partnership level $126 $151 $176 $138 $176 $176 $176 $176 $176
Senior Advisor / Executive Advisor $49 $87 $226 $49 $87 $126 $49 $49 $126
Carry Most Recent Fund Low Ave High
General Partnership level $4,500 $9,000 $19,500
One step below general partnership level $1,675 $2,550 $5,100
Two steps below general partnership level $1,125 $1,250 $1,500
Senior Advisor / Executive Advisor $888 $1,425 $2,500
4030481 - 2014 Operating Executive Compensation - Draft 11.indd 13 02/05/2014 17:57
Heidrick & Struggles 14
2014 Operating Executive Compensation Report
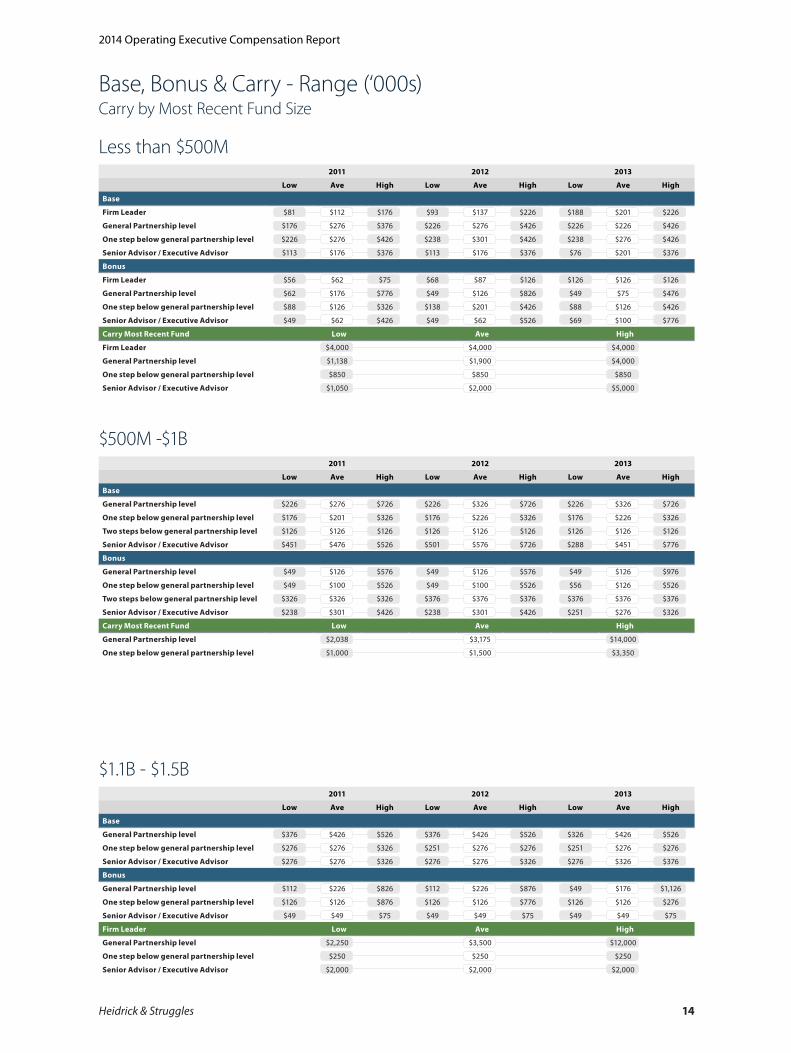
Base, Bonus & Carry - Range (‘000s)Carry by Most Recent Fund Size
Less than $500M2011 2012 2013
Low Ave High Low Ave High Low Ave High
Base
Firm Leader $81 $112 $176 $93 $137 $226 $188 $201 $226
General Partnership level $176 $276 $376 $226 $276 $426 $226 $226 $426
One step below general partnership level $226 $276 $426 $238 $301 $426 $238 $276 $426
Senior Advisor / Executive Advisor $113 $176 $376 $113 $176 $376 $76 $201 $376
Bonus
Firm Leader $56 $62 $75 $68 $87 $126 $126 $126 $126
General Partnership level $62 $176 $776 $49 $126 $826 $49 $75 $476
One step below general partnership level $88 $126 $326 $138 $201 $426 $88 $126 $426
Senior Advisor / Executive Advisor $49 $62 $426 $49 $62 $526 $69 $100 $776
Carry Most Recent Fund Low Ave High
Firm Leader $4,000 $4,000 $4,000
General Partnership level $1,138 $1,900 $4,000
One step below general partnership level $850 $850 $850
Senior Advisor / Executive Advisor $1,050 $2,000 $5,000
$1.1B - $1.5B2011 2012 2013
Low Ave High Low Ave High Low Ave High
Base
General Partnership level $376 $426 $526 $376 $426 $526 $326 $426 $526
One step below general partnership level $276 $276 $326 $251 $276 $276 $251 $276 $276
Senior Advisor / Executive Advisor $276 $276 $326 $276 $276 $326 $276 $326 $376
Bonus
General Partnership level $112 $226 $826 $112 $226 $876 $49 $176 $1,126
One step below general partnership level $126 $126 $876 $126 $126 $776 $126 $126 $276
Senior Advisor / Executive Advisor $49 $49 $75 $49 $49 $75 $49 $49 $75
Firm Leader Low Ave High
General Partnership level $2,250 $3,500 $12,000
One step below general partnership level $250 $250 $250
Senior Advisor / Executive Advisor $2,000 $2,000 $2,000
$500M -$1B2011 2012 2013
Low Ave High Low Ave High Low Ave High
Base
General Partnership level $226 $276 $726 $226 $326 $726 $226 $326 $726
One step below general partnership level $176 $201 $326 $176 $226 $326 $176 $226 $326
Two steps below general partnership level $126 $126 $126 $126 $126 $126 $126 $126 $126
Senior Advisor / Executive Advisor $451 $476 $526 $501 $576 $726 $288 $451 $776
Bonus
General Partnership level $49 $126 $576 $49 $126 $576 $49 $126 $976
One step below general partnership level $49 $100 $526 $49 $100 $526 $56 $126 $526
Two steps below general partnership level $326 $326 $326 $376 $376 $376 $376 $376 $376
Senior Advisor / Executive Advisor $238 $301 $426 $238 $301 $426 $251 $276 $326
Carry Most Recent Fund Low Ave High
General Partnership level $2,038 $3,175 $14,000
One step below general partnership level $1,000 $1,500 $3,350
4030481 - 2014 Operating Executive Compensation - Draft 11.indd 14 02/05/2014 17:57
Heidrick & Struggles 15
2014 Operating Executive Compensation Report
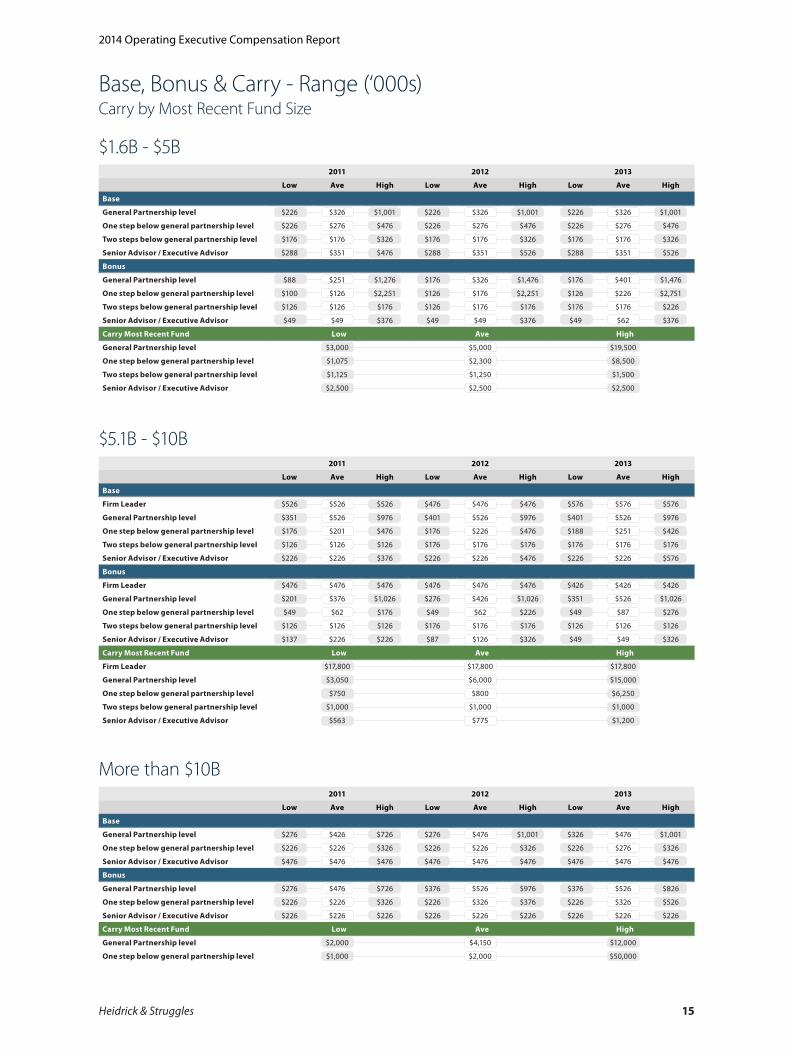
$5.1B - $10B2011 2012 2013
Low Ave High Low Ave High Low Ave High
Base
Firm Leader $526 $526 $526 $476 $476 $476 $576 $576 $576
General Partnership level $351 $526 $976 $401 $526 $976 $401 $526 $976
One step below general partnership level $176 $201 $476 $176 $226 $476 $188 $251 $426
Two steps below general partnership level $126 $126 $126 $176 $176 $176 $176 $176 $176
Senior Advisor / Executive Advisor $226 $226 $376 $226 $226 $476 $226 $226 $576
Bonus
Firm Leader $476 $476 $476 $476 $476 $476 $426 $426 $426
General Partnership level $201 $376 $1,026 $276 $426 $1,026 $351 $526 $1,026
One step below general partnership level $49 $62 $176 $49 $62 $226 $49 $87 $276
Two steps below general partnership level $126 $126 $126 $176 $176 $176 $126 $126 $126
Senior Advisor / Executive Advisor $137 $226 $226 $87 $126 $326 $49 $49 $326
Carry Most Recent Fund Low Ave High
Firm Leader $17,800 $17,800 $17,800
General Partnership level $3,050 $6,000 $15,000
One step below general partnership level $750 $800 $6,250
Two steps below general partnership level $1,000 $1,000 $1,000
Senior Advisor / Executive Advisor $563 $775 $1,200
Base, Bonus & Carry - Range (‘000s) Carry by Most Recent Fund Size
$1.6B - $5B2011 2012 2013
Low Ave High Low Ave High Low Ave High
Base
General Partnership level $226 $326 $1,001 $226 $326 $1,001 $226 $326 $1,001
One step below general partnership level $226 $276 $476 $226 $276 $476 $226 $276 $476
Two steps below general partnership level $176 $176 $326 $176 $176 $326 $176 $176 $326
Senior Advisor / Executive Advisor $288 $351 $476 $288 $351 $526 $288 $351 $526
Bonus
General Partnership level $88 $251 $1,276 $176 $326 $1,476 $176 $401 $1,476
One step below general partnership level $100 $126 $2,251 $126 $176 $2,251 $126 $226 $2,751
Two steps below general partnership level $126 $126 $176 $126 $176 $176 $176 $176 $226
Senior Advisor / Executive Advisor $49 $49 $376 $49 $49 $376 $49 $62 $376
Carry Most Recent Fund Low Ave High
General Partnership level $3,000 $5,000 $19,500
One step below general partnership level $1,075 $2,300 $8,500
Two steps below general partnership level $1,125 $1,250 $1,500
Senior Advisor / Executive Advisor $2,500 $2,500 $2,500
More than $10B2011 2012 2013
Low Ave High Low Ave High Low Ave High
Base
General Partnership level $276 $426 $726 $276 $476 $1,001 $326 $476 $1,001
One step below general partnership level $226 $226 $326 $226 $226 $326 $226 $276 $326
Senior Advisor / Executive Advisor $476 $476 $476 $476 $476 $476 $476 $476 $476
Bonus
General Partnership level $276 $476 $726 $376 $526 $976 $376 $526 $826
One step below general partnership level $226 $226 $326 $226 $326 $376 $226 $326 $526
Senior Advisor / Executive Advisor $226 $226 $226 $226 $226 $226 $226 $226 $226
Carry Most Recent Fund Low Ave High
General Partnership level $2,000 $4,150 $12,000
One step below general partnership level $1,000 $2,000 $50,000
4030481 - 2014 Operating Executive Compensation - Draft 11.indd 15 02/05/2014 17:57
Heidrick & Struggles is the premier provider of senior-level Executive Search and Leadership Consulting services, including culture shaping, executive assessment, succession planning, board effectiveness, leadership development and leadership strategy. For 60 years, we have focused on quality service and built strong leadership teams through our relationships with clients and individuals worldwide. Today, Heidrick & Struggles leadership experts operate from principal business centers in North America, Latin America, Europe and Asia Pacific. For more information about Heidrick & Struggles, please visit www.heidrick.com.
4030481
4030481 - 2014 Operating Executive Compensation - Draft 11.indd 16 02/05/2014 17:57