Embed Size (px)
Citation preview
> REPLACE THIS LINE WITH YOUR PAPER IDENTIFICATION NUMBER (DOUBLE-CLICK HERE TO EDIT) <
1
Abstract— High Voltage Direct Current (HVDC) grids may be
protected from dc faults through the application of HVDC circuit
breakers. Recent advances in dc circuit breaker technologies may
allow faults in the dc grid to be cleared without a permanent loss
of power to the connected ac grids. The requirements for the
protection have yet to be fully defined; especially where half
bridge modular multi-level converter controls are concerned.
This paper investigates integrating dc circuit breakers with half
bridge MMC converters, specifically looking to at how to recover
from a pole-to-pole fault. The fault response of the converter to a
fault is analyzed in depth. This analysis highlights key stages in
the converter response to a dc fault, allowing the MMC fault
currents to be predicted. This analysis is then verified in PSCAD
simulations and the power flow recovery is shown. The converter
controls are investigated, improvements made to the power flow
recovery, and the need for arm current controllers highlighted.
Index Terms— HVDC, Grid, Protection, dc, Circuit breaker
VSC, MMC, Control.
I. INTRODUCTION
IGH Voltage Direct Current (HVDC) circuit breakers are
being considered as a potential method of providing short
circuit protection in future HVDC grids [1]. Presently, only
two voltage source converter (VSC) HVDC grids exist in the
world [2, 3]. The power rating of these grids is low enough,
relative to the maximum infeed loss limitations, to allow dc
faults to be cleared through a philosophy of current diversion
and ac side isolation, which is the traditional choice for VSC
HVDC transmission.
In future grids, if the infeed loss requirements of the ac
grids cannot be met with the traditional protection, new
technologies will be needed. Two new technologies being
considered are: Fault Blocking Converters (FBCs) and HVDC
circuit breakers.
Recent advances in HVDC circuit breakers show short
interruption times (<5 ms) can be achieved with novel
topologies [4-6]. Many topologies have been proposed and
This paper was submitted for review on the 29/06/2016. This work was
supported in part by the Engineering and Physical Sciences Research Council
and National Grid under projects EP/L021552/1 and TAO/22360. Special thanks to Dr Paul Coventry, Dr Antony Beddard, and Prof Jan Evans-freeman
for their support in this project.
O. Cwikowski, M. Barnes, R. Shuttleworth are with the University of Manchester, Manchester, M139PL UK (e-mail:
[email protected], [email protected]). A. Wood and A. Miller are with the University of Canterbury,
Christchurch, 8041, New Zealand, (e-mail: [email protected],
industrial prototypes have been developed.
Several FBC architectures have been proposed, along with
associated novel control schemes [7-10]. These converters
may be used in conjunction with HVDC circuit breakers to
reduce equipment requirements and minimize the disturbance
that is caused to the ac grid by a dc fault [11, 12].
However, HVDC breaker interactions with the control of
Half Bridge (HB) Modular Multi-level Converters (MMCs),
the presently preferred topology, have received little attention.
The impact fault clearing will have on the HB-MMC’s
operation and the disturbance seen by the ac grid, are
important areas of study in order to assess the suitability of
future HVDC connections and protection requirements.
The impact that dc protection systems have on the operation
of the ac and dc grids has been investigated previously [13].
However, such analysis looks at the impact of the HVDC
circuit breakers on voltage stability, and not when faults occur.
System integration aspects are discussed in [14], but they do
not look at the converter fault response or recovery in depth.
Fault currents have been investigated in [15], but assume
that the dc fault current is significantly larger than the ac side
fault currents and that the converter takes no preventative
action against dc faults.
Controls have been investigated for the HB MMC when the
converter is not blocked during a dc fault, implying a high dc
side impedance [16]. Such control is excellent for the
converters in the grid which are not exposed to a significant
over current.
This paper investigates how the HB MMC responds and
recovers from a pole-to-pole fault. PSCAD simulation results
are used to verify the fault analysis and it is shown that
additional converter controls can be used to prevent
unnecessary blocking of the converter, improving the power
flow recovery with respect to the ac grid.
The paper’s main contribution is detailed analysis of a
terminal pole-to-pole fault. The fault analysis can be used to
predict fault currents and if modified can be used to solve for
the converter’s arm currents. This work will also allow the
initial conditions relevant to controller design to be predicted,
which will be useful for the designs of more suitable
controllers. This paper discusses some of the challenges in
developing a robust controller and in predicting the state the
converter will be in during the recovery process.
II. OPEN GRID PROTECTION
Open Grid dc protection was first proposed by GE/Alstom
in [17], and is an alternate way to operate dc circuit breakers,
Operating DC Circuit Breakers with MMC
Oliver Cwikowski, Alan Wood, Member, IEEE, Allan Miller, Senior Member, IEEE, Mike Barnes,
Senior Member, Roger Shuttleworth
H
> REPLACE THIS LINE WITH YOUR PAPER IDENTIFICATION NUMBER (DOUBLE-CLICK HERE TO EDIT) <
2
and was chosen for this work as it allowed the protection
sequence of Fault-Isolation-Reclose-Recovery (which is the
basic duty for a circuit breaker) to be investigated for a single
converter easily. This protection philosophy was developed to
reduce the number of dc circuit breakers, component ratings,
and reduce operating time of the dc protection system.
When operating the circuit breakers with an Open Grid
philosophy, when any circuit breaker detects a fault on the
system, it first opens, even before it has been confirmed that
the fault is within its protective zone. As all circuit breakers in
the dc system have been opened, the fault is definitely cleared.
A method of establishing which circuit breakers to reclose
is required, and will be performed by dc relays; for this paper
it is assumed that the breakers always reclose for the converter
under investigation, however significant developments are
being made in the area of dc relays [18].
This circuit breaker operation allows the protection
sequence for a single converter to be analyzed irrespective of
grid topology or circuit breaker relaying method.
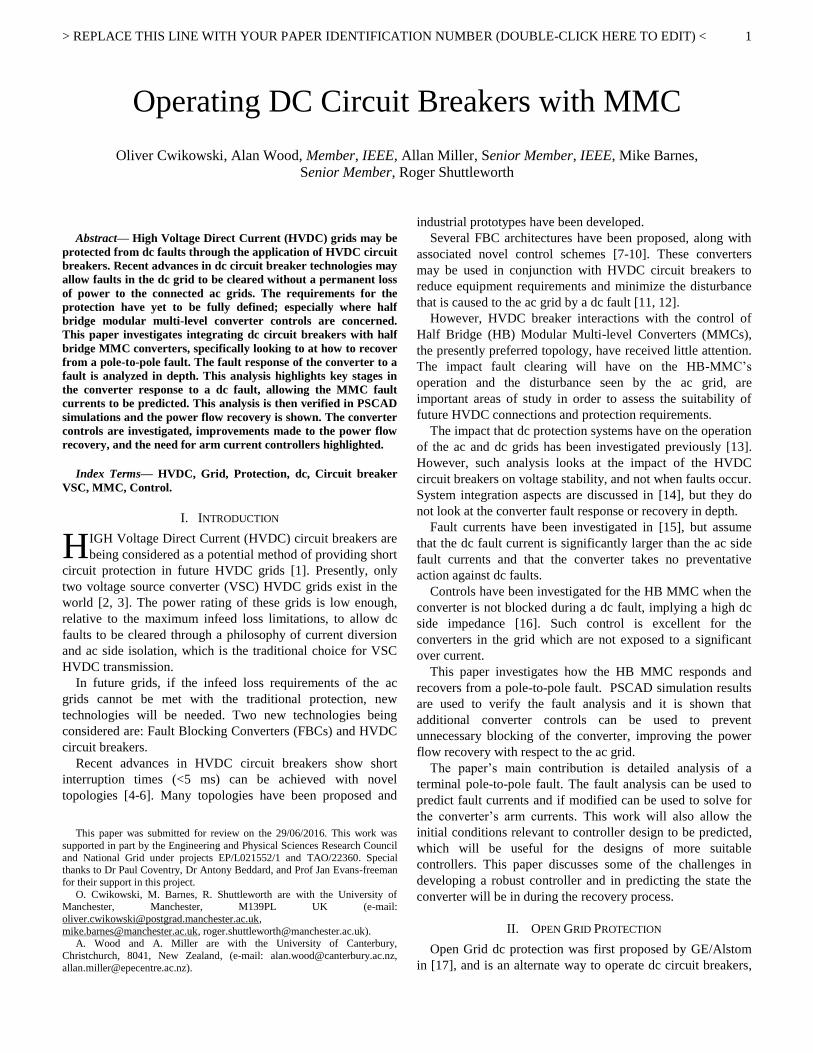
The system under investigation in this paper is shown in
Fig. 1. First, a pole-to-pole fault is applied to the MMC
converter. The fault is cleared by a HVDC circuit breaker,
reducing the over currents. The converter is then able to
unblock and attempt to reestablish power flow to the ac grid.
This paper describes and improves this process. The pole-to-
pole analysis is general enough to be applied to any HB
MMC, however for different protection system designs the
timing of key transitions will change.
III. HVDC CIRCUIT BREAKERS
HVDC circuit breakers are required to generate their own
zero crossings. This has led to a number of topologies being
developed that contain large power electronic elements. Out of
these designs has come a standard type known as Hybrid
breakers. Hybrid breakers attempt to combine the benefits of
mechanical circuit breakers and power electronic switches, to
form high speed, low loss dc circuit breakers. Several
manufacturers have developed industrial prototypes that are of
the hybrid form [5, 19]. Plans exist for a full scale HVDC
circuit breaker to be installed [6].
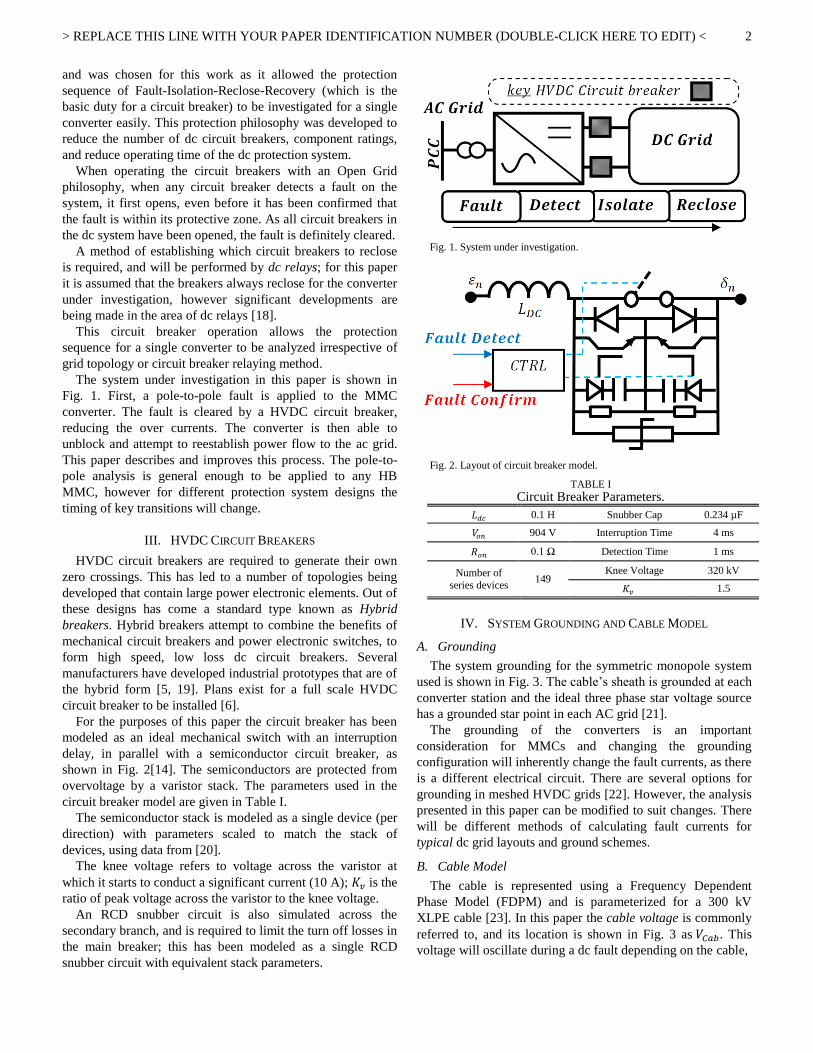
For the purposes of this paper the circuit breaker has been
modeled as an ideal mechanical switch with an interruption
delay, in parallel with a semiconductor circuit breaker, as
shown in Fig. 2[14]. The semiconductors are protected from
overvoltage by a varistor stack. The parameters used in the
circuit breaker model are given in Table I.
The semiconductor stack is modeled as a single device (per
direction) with parameters scaled to match the stack of
devices, using data from [20].
The knee voltage refers to voltage across the varistor at
which it starts to conduct a significant current (10 A); is the
ratio of peak voltage across the varistor to the knee voltage.
An RCD snubber circuit is also simulated across the
secondary branch, and is required to limit the turn off losses in
the main breaker; this has been modeled as a single RCD
snubber circuit with equivalent stack parameters.
Fig. 1. System under investigation.
Fig. 2. Layout of circuit breaker model.
TABLE I
Circuit Breaker Parameters.
0.1 H Snubber Cap 0.234 µF
904 V Interruption Time 4 ms
0.1 Ω Detection Time 1 ms
Number of
series devices 149
Knee Voltage 320 kV
1.5
IV. SYSTEM GROUNDING AND CABLE MODEL
A. Grounding
The system grounding for the symmetric monopole system
used is shown in Fig. 3. The cable’s sheath is grounded at each
converter station and the ideal three phase star voltage source
has a grounded star point in each AC grid [21].
The grounding of the converters is an important
consideration for MMCs and changing the grounding
configuration will inherently change the fault currents, as there
is a different electrical circuit. There are several options for
grounding in meshed HVDC grids [22]. However, the analysis
presented in this paper can be modified to suit changes. There
will be different methods of calculating fault currents for
typical dc grid layouts and ground schemes.
B. Cable Model
The cable is represented using a Frequency Dependent
Phase Model (FDPM) and is parameterized for a 300 kV
XLPE cable [23]. In this paper the cable voltage is commonly
referred to, and its location is shown in Fig. 3 as . This
voltage will oscillate during a dc fault depending on the cable,
> REPLACE THIS LINE WITH YOUR PAPER IDENTIFICATION NUMBER (DOUBLE-CLICK HERE TO EDIT) <
3
Fig. 3. System grounding and cable voltage.
cable joints, fault location, and impedance of the fault.
Changes in grid structure would also influence this voltage,
such as lines being out of service or additions to the DC
network. No attempt is made to make exact predictions of the
cable’s influence over the fault currents in this paper as
detailed knowledge of what transients would exist on the line
would be required to understand its full impact. All such
discussion surrounding the potential impact this could have on
the system is therefore qualitative.
V. HB-MMC POLE-TO-POLE FAULT ANALYSIS
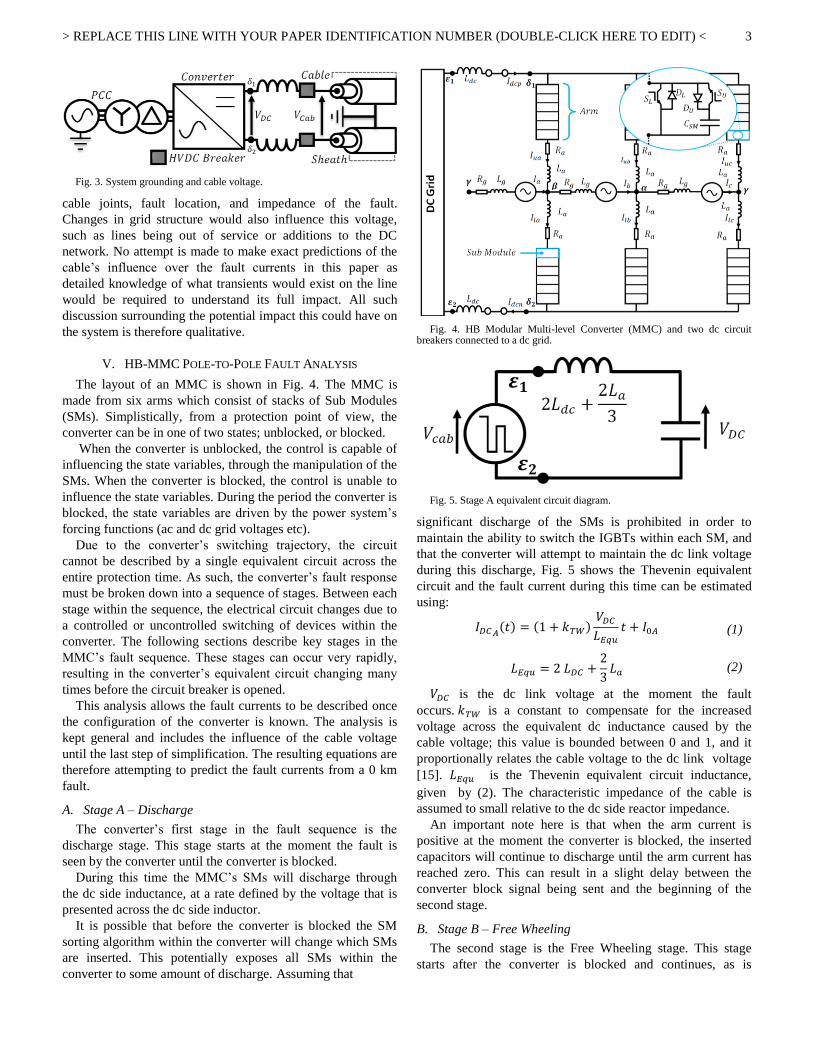
The layout of an MMC is shown in Fig. 4. The MMC is
made from six arms which consist of stacks of Sub Modules
(SMs). Simplistically, from a protection point of view, the
converter can be in one of two states; unblocked, or blocked.
When the converter is unblocked, the control is capable of
influencing the state variables, through the manipulation of the
SMs. When the converter is blocked, the control is unable to
influence the state variables. During the period the converter is
blocked, the state variables are driven by the power system’s
forcing functions (ac and dc grid voltages etc).
Due to the converter’s switching trajectory, the circuit
cannot be described by a single equivalent circuit across the
entire protection time. As such, the converter’s fault response
must be broken down into a sequence of stages. Between each
stage within the sequence, the electrical circuit changes due to
a controlled or uncontrolled switching of devices within the
converter. The following sections describe key stages in the
MMC’s fault sequence. These stages can occur very rapidly,
resulting in the converter’s equivalent circuit changing many
times before the circuit breaker is opened.
This analysis allows the fault currents to be described once
the configuration of the converter is known. The analysis is
kept general and includes the influence of the cable voltage
until the last step of simplification. The resulting equations are
therefore attempting to predict the fault currents from a 0 km
fault.
A. Stage A – Discharge
The converter’s first stage in the fault sequence is the
discharge stage. This stage starts at the moment the fault is
seen by the converter until the converter is blocked.
During this time the MMC’s SMs will discharge through
the dc side inductance, at a rate defined by the voltage that is
presented across the dc side inductor.
It is possible that before the converter is blocked the SM
sorting algorithm within the converter will change which SMs
are inserted. This potentially exposes all SMs within the
converter to some amount of discharge. Assuming that
Fig. 4. HB Modular Multi-level Converter (MMC) and two dc circuit breakers connected to a dc grid.
Fig. 5. Stage A equivalent circuit diagram.
significant discharge of the SMs is prohibited in order to
maintain the ability to switch the IGBTs within each SM, and
that the converter will attempt to maintain the dc link voltage
during this discharge, Fig. 5 shows the Thevenin equivalent
circuit and the fault current during this time can be estimated
using:
(1)
(2)
is the dc link voltage at the moment the fault
occurs. is a constant to compensate for the increased
voltage across the equivalent dc inductance caused by the
cable voltage; this value is bounded between 0 and 1, and it
proportionally relates the cable voltage to the dc link voltage
[15]. is the Thevenin equivalent circuit inductance,
given by (2). The characteristic impedance of the cable is
assumed to small relative to the dc side reactor impedance.
An important note here is that when the arm current is
positive at the moment the converter is blocked, the inserted
capacitors will continue to discharge until the arm current has
reached zero. This can result in a slight delay between the
converter block signal being sent and the beginning of the
second stage.
B. Stage B – Free Wheeling
The second stage is the Free Wheeling stage. This stage
starts after the converter is blocked and continues, as is
> REPLACE THIS LINE WITH YOUR PAPER IDENTIFICATION NUMBER (DOUBLE-CLICK HERE TO EDIT) <
4
explained in this section, until the moment a current zero
crossing(s) occurs in a converter arm. The moment a zero
crossing occurs in any of the converter’s arms, the equivalent
circuit changes and another set of equations must be
developed.
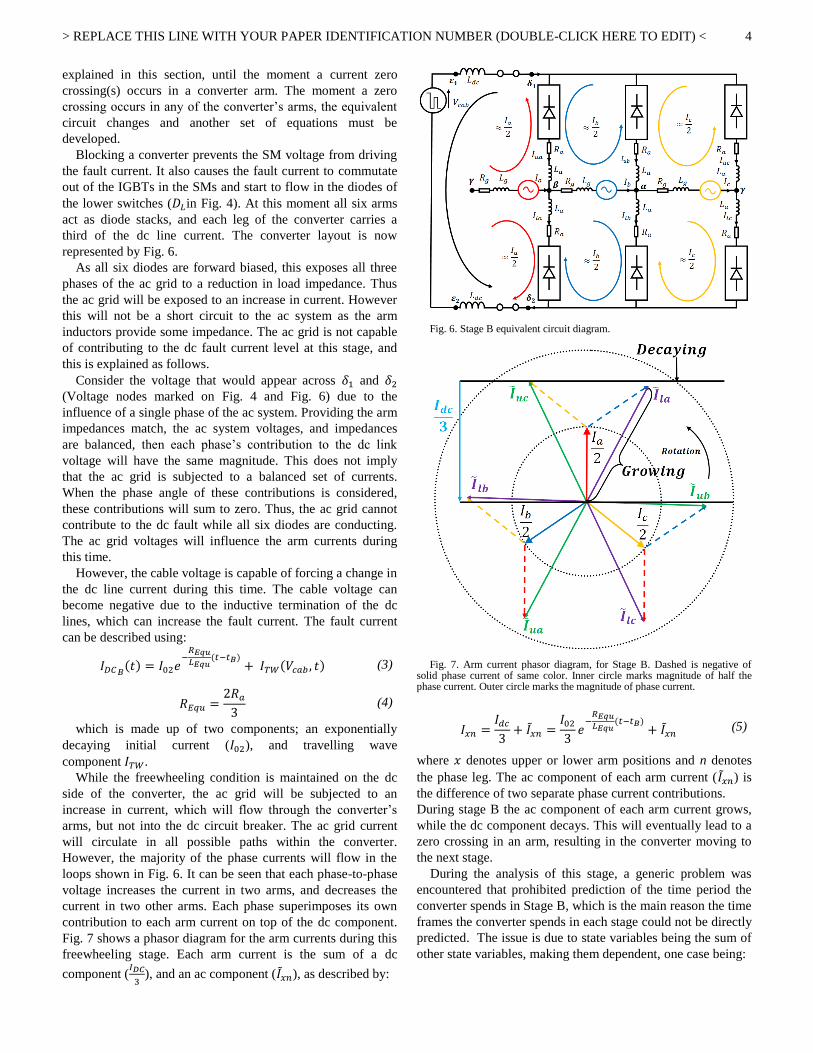
Blocking a converter prevents the SM voltage from driving
the fault current. It also causes the fault current to commutate
out of the IGBTs in the SMs and start to flow in the diodes of
the lower switches ( in Fig. 4). At this moment all six arms
act as diode stacks, and each leg of the converter carries a
third of the dc line current. The converter layout is now
represented by Fig. 6.
As all six diodes are forward biased, this exposes all three
phases of the ac grid to a reduction in load impedance. Thus
the ac grid will be exposed to an increase in current. However
this will not be a short circuit to the ac system as the arm
inductors provide some impedance. The ac grid is not capable
of contributing to the dc fault current level at this stage, and
this is explained as follows.
Consider the voltage that would appear across and
(Voltage nodes marked on Fig. 4 and Fig. 6) due to the
influence of a single phase of the ac system. Providing the arm
impedances match, the ac system voltages, and impedances
are balanced, then each phase’s contribution to the dc link
voltage will have the same magnitude. This does not imply
that the ac grid is subjected to a balanced set of currents.
When the phase angle of these contributions is considered,
these contributions will sum to zero. Thus, the ac grid cannot
contribute to the dc fault while all six diodes are conducting.
The ac grid voltages will influence the arm currents during
this time.
However, the cable voltage is capable of forcing a change in
the dc line current during this time. The cable voltage can
become negative due to the inductive termination of the dc
lines, which can increase the fault current. The fault current
can be described using:
(3)
(4)
which is made up of two components; an exponentially
decaying initial current ( ), and travelling wave
component .
While the freewheeling condition is maintained on the dc
side of the converter, the ac grid will be subjected to an
increase in current, which will flow through the converter’s
arms, but not into the dc circuit breaker. The ac grid current
will circulate in all possible paths within the converter.
However, the majority of the phase currents will flow in the
loops shown in Fig. 6. It can be seen that each phase-to-phase
voltage increases the current in two arms, and decreases the
current in two other arms. Each phase superimposes its own
contribution to each arm current on top of the dc component.
Fig. 7 shows a phasor diagram for the arm currents during this
freewheeling stage. Each arm current is the sum of a dc
component (
), and an ac component ( ), as described by:
Fig. 6. Stage B equivalent circuit diagram.
Fig. 7. Arm current phasor diagram, for Stage B. Dashed is negative of solid phase current of same color. Inner circle marks magnitude of half the phase current. Outer circle marks the magnitude of phase current.
(5)
where denotes upper or lower arm positions and n denotes
the phase leg. The ac component of each arm current ( ) is
the difference of two separate phase current contributions.
During stage B the ac component of each arm current grows,
while the dc component decays. This will eventually lead to a
zero crossing in an arm, resulting in the converter moving to
the next stage.
During the analysis of this stage, a generic problem was
encountered that prohibited prediction of the time period the
converter spends in Stage B, which is the main reason the time
frames the converter spends in each stage could not be directly
predicted. The issue is due to state variables being the sum of
other state variables, making them dependent, one case being:
> REPLACE THIS LINE WITH YOUR PAPER IDENTIFICATION NUMBER (DOUBLE-CLICK HERE TO EDIT) <
5
(6)
This results in a singular matrix being formed during the
state space anlaysis, which cannot be inverted. This prevents a
prediction of the first zero crossing being made. If this
problem can be overcome, then predictions for the time frame
spent in each stage can be made, without the need for
simulation. The other stages of the converter response do not
encounter this issue. This is known as a cut-set problem.
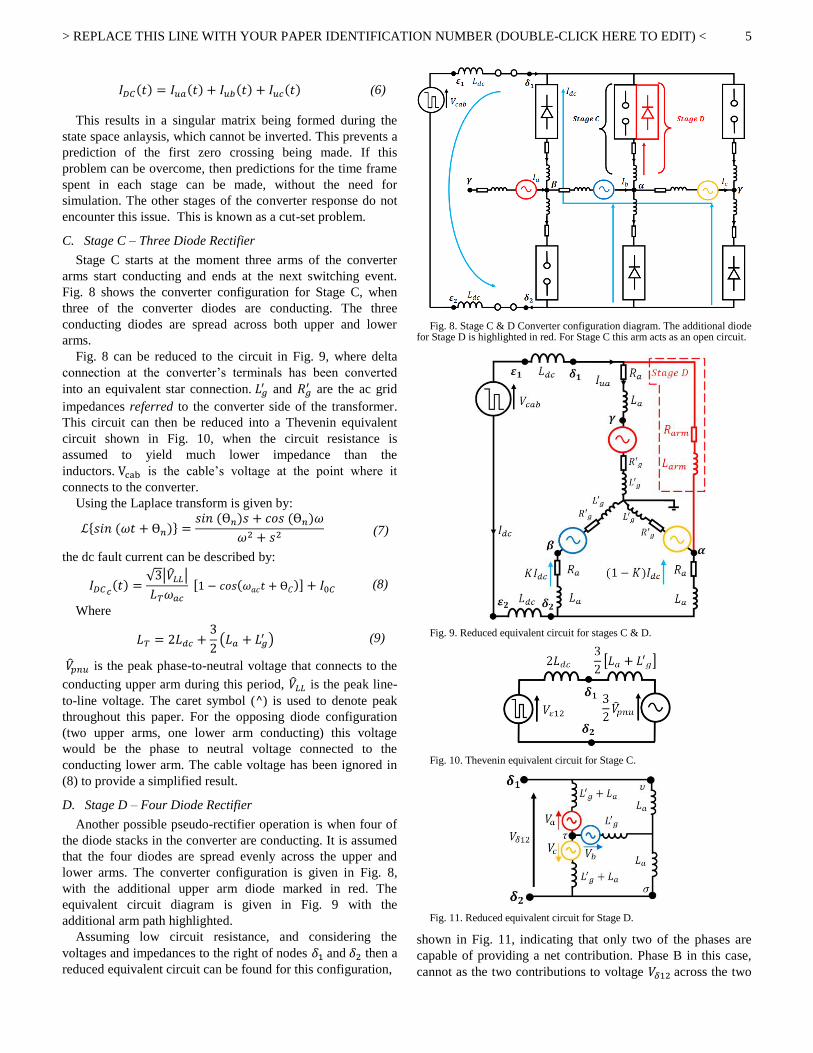
C. Stage C – Three Diode Rectifier
Stage C starts at the moment three arms of the converter
arms start conducting and ends at the next switching event.
Fig. 8 shows the converter configuration for Stage C, when
three of the converter diodes are conducting. The three
conducting diodes are spread across both upper and lower
arms.
Fig. 8 can be reduced to the circuit in Fig. 9, where delta
connection at the converter’s terminals has been converted
into an equivalent star connection. and
are the ac grid
impedances referred to the converter side of the transformer.
This circuit can then be reduced into a Thevenin equivalent
circuit shown in Fig. 10, when the circuit resistance is
assumed to yield much lower impedance than the
inductors. is the cable’s voltage at the point where it
connects to the converter.
Using the Laplace transform is given by:
(7)
the dc fault current can be described by:
(8)
Where
(9)
is the peak phase-to-neutral voltage that connects to the
conducting upper arm during this period, is the peak line-
to-line voltage. The caret symbol ( ) is used to denote peak
throughout this paper. For the opposing diode configuration
(two upper arms, one lower arm conducting) this voltage
would be the phase to neutral voltage connected to the
conducting lower arm. The cable voltage has been ignored in
(8) to provide a simplified result.
D. Stage D – Four Diode Rectifier
Another possible pseudo-rectifier operation is when four of
the diode stacks in the converter are conducting. It is assumed
that the four diodes are spread evenly across the upper and
lower arms. The converter configuration is given in Fig. 8,
with the additional upper arm diode marked in red. The
equivalent circuit diagram is given in Fig. 9 with the
additional arm path highlighted.
Assuming low circuit resistance, and considering the
voltages and impedances to the right of nodes and then a
reduced equivalent circuit can be found for this configuration,
Fig. 8. Stage C & D Converter configuration diagram. The additional diode for Stage D is highlighted in red. For Stage C this arm acts as an open circuit.
Fig. 9. Reduced equivalent circuit for stages C & D.
Fig. 10. Thevenin equivalent circuit for Stage C.
Fig. 11. Reduced equivalent circuit for Stage D.
shown in Fig. 11, indicating that only two of the phases are
capable of providing a net contribution. Phase B in this case,
cannot as the two contributions to voltage across the two
> REPLACE THIS LINE WITH YOUR PAPER IDENTIFICATION NUMBER (DOUBLE-CLICK HERE TO EDIT) <
6
impedances sum to zero, as they act in opposing
directions and have the same magnitude. This will hold true
providing that the converter arm and ac system impedances
are balanced.
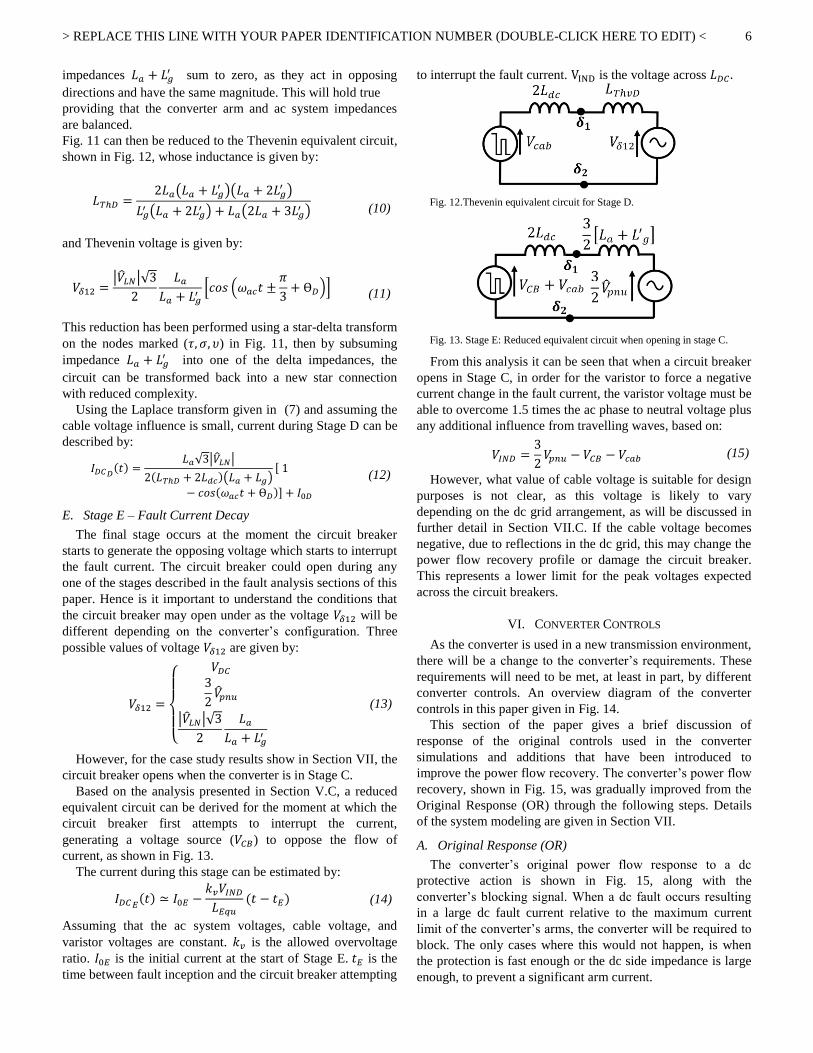
Fig. 11 can then be reduced to the Thevenin equivalent circuit,
shown in Fig. 12, whose inductance is given by:
(10)
and Thevenin voltage is given by:
(11)
This reduction has been performed using a star-delta transform
on the nodes marked ( ) in Fig. 11, then by subsuming
impedance into one of the delta impedances, the
circuit can be transformed back into a new star connection
with reduced complexity.
Using the Laplace transform given in (7) and assuming the
cable voltage influence is small, current during Stage D can be
described by:
(12)
E. Stage E – Fault Current Decay
The final stage occurs at the moment the circuit breaker
starts to generate the opposing voltage which starts to interrupt
the fault current. The circuit breaker could open during any
one of the stages described in the fault analysis sections of this
paper. Hence is it important to understand the conditions that
the circuit breaker may open under as the voltage will be
different depending on the converter’s configuration. Three
possible values of voltage are given by:
(13)
However, for the case study results show in Section VII, the
circuit breaker opens when the converter is in Stage C.
Based on the analysis presented in Section V.C, a reduced
equivalent circuit can be derived for the moment at which the
circuit breaker first attempts to interrupt the current,
generating a voltage source ( ) to oppose the flow of
current, as shown in Fig. 13.
The current during this stage can be estimated by:
(14)
Assuming that the ac system voltages, cable voltage, and
varistor voltages are constant. is the allowed overvoltage
ratio. is the initial current at the start of Stage E. is the
time between fault inception and the circuit breaker attempting
to interrupt the fault current. is the voltage across
Fig. 12.Thevenin equivalent circuit for Stage D.
Fig. 13. Stage E: Reduced equivalent circuit when opening in stage C.
From this analysis it can be seen that when a circuit breaker
opens in Stage C, in order for the varistor to force a negative
current change in the fault current, the varistor voltage must be
able to overcome 1.5 times the ac phase to neutral voltage plus
any additional influence from travelling waves, based on:
(15)
However, what value of cable voltage is suitable for design
purposes is not clear, as this voltage is likely to vary
depending on the dc grid arrangement, as will be discussed in
further detail in Section VII.C. If the cable voltage becomes
negative, due to reflections in the dc grid, this may change the
power flow recovery profile or damage the circuit breaker.
This represents a lower limit for the peak voltages expected
across the circuit breakers.
VI. CONVERTER CONTROLS
As the converter is used in a new transmission environment,
there will be a change to the converter’s requirements. These
requirements will need to be met, at least in part, by different
converter controls. An overview diagram of the converter
controls in this paper given in Fig. 14.
This section of the paper gives a brief discussion of
response of the original controls used in the converter
simulations and additions that have been introduced to
improve the power flow recovery. The converter’s power flow
recovery, shown in Fig. 15, was gradually improved from the
Original Response (OR) through the following steps. Details
of the system modeling are given in Section VII.
A. Original Response (OR)
The converter’s original power flow response to a dc
protective action is shown in Fig. 15, along with the
converter’s blocking signal. When a dc fault occurs resulting
in a large dc fault current relative to the maximum current
limit of the converter’s arms, the converter will be required to
block. The only cases where this would not happen, is when
the protection is fast enough or the dc side impedance is large
enough, to prevent a significant arm current.
> REPLACE THIS LINE WITH YOUR PAPER IDENTIFICATION NUMBER (DOUBLE-CLICK HERE TO EDIT) <
7
The converter remains blocked until the circuit breaker
Fig. 14. Control system layout for power and current loops.
Fig. 15. PCC power flow recovery and blocking signals for a range of control strategies when subjected to a 0 km fault.
Fig. 16. DQ circulating current controller with two degrees of freedom.
recloses and the arm currents have decayed to a reasonable
value to allow the converter to continue operating. It can be
seen in the original response, additional blocking occurs after
the protection has reclosed. This is causes unnecessary
disturbance to the ac system.
B. Circulating Current Suppressing Control
In order to totally remove the unnecessary tripping of the
converter, a Circulating Current Suppression Controller
(CCSC) was added in the PSCAD simulations, the structure of
which is shown in Fig. 16. This allows the converter to have
control over the arm currents. The controller was designed
based around [21, 24]. The original transfer function was
based on [21] and the transfer function for the CCSC given in
(16). is the controller integral term, is the proportional
term. The CCSC’s PI controller was modified to (17) using
the structure outlined in Fig. 16. The modified controller
response does not contain overshoots in arm current recovery
response, shown in Fig. 17. The improvement in the power
flow recovery can be seen in traces marked as “CCSC” in Fig.
15.
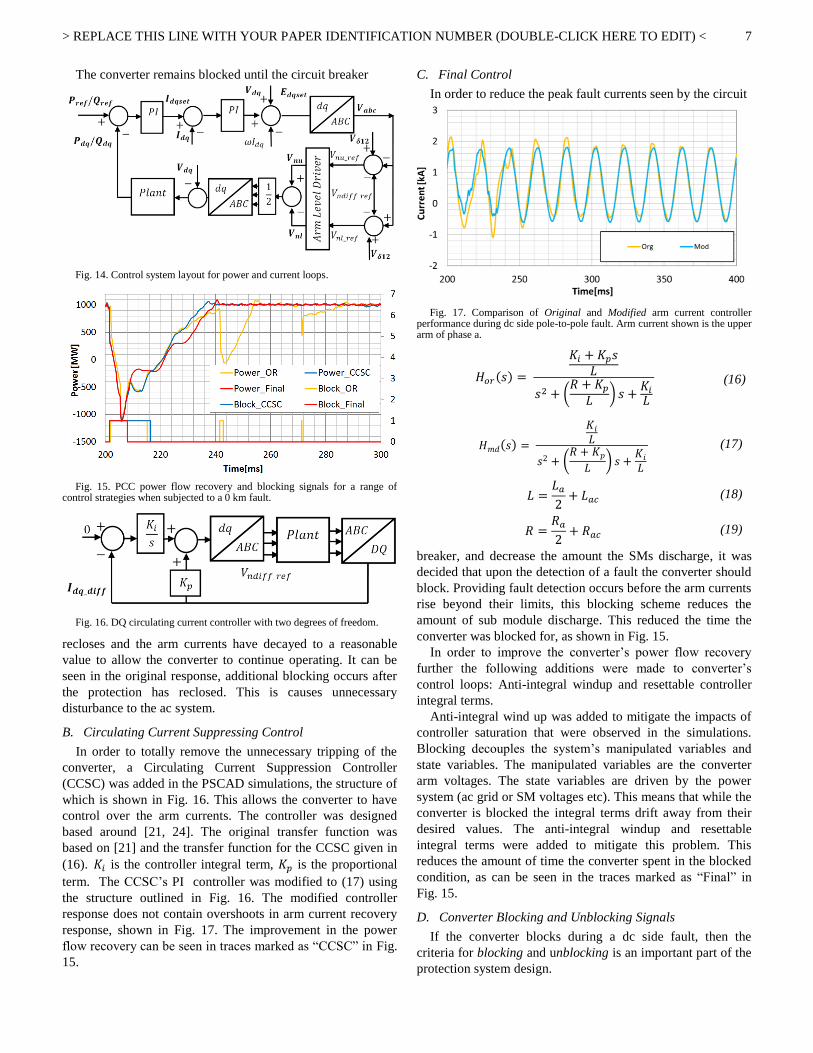
C. Final Control
In order to reduce the peak fault currents seen by the circuit
Fig. 17. Comparison of Original and Modified arm current controller performance during dc side pole-to-pole fault. Arm current shown is the upper arm of phase a.
(16)
(17)
(18)
(19)
breaker, and decrease the amount the SMs discharge, it was
decided that upon the detection of a fault the converter should
block. Providing fault detection occurs before the arm currents
rise beyond their limits, this blocking scheme reduces the
amount of sub module discharge. This reduced the time the
converter was blocked for, as shown in Fig. 15.
In order to improve the converter’s power flow recovery
further the following additions were made to converter’s
control loops: Anti-integral windup and resettable controller
integral terms.
Anti-integral wind up was added to mitigate the impacts of
controller saturation that were observed in the simulations.
Blocking decouples the system’s manipulated variables and
state variables. The manipulated variables are the converter
arm voltages. The state variables are driven by the power
system (ac grid or SM voltages etc). This means that while the
converter is blocked the integral terms drift away from their
desired values. The anti-integral windup and resettable
integral terms were added to mitigate this problem. This
reduces the amount of time the converter spent in the blocked
condition, as can be seen in the traces marked as “Final” in
Fig. 15.
D. Converter Blocking and Unblocking Signals
If the converter blocks during a dc side fault, then the
criteria for blocking and unblocking is an important part of the
protection system design.
> REPLACE THIS LINE WITH YOUR PAPER IDENTIFICATION NUMBER (DOUBLE-CLICK HERE TO EDIT) <
8
The criteria for unblocking a converter after a dc side fault
when circuit breakers are used has yet to be established, as this
has not been required in point-to-point systems, as fast (<10
ms) recovery is not required.
Unblocking quickly causes the submodules to discharge
into the dc line, as the dc grid voltage will be lower than the
normal dc voltage, post fault isolation.
Delaying unblocking, allows the ac grid to recharge the line.
Thus, when the converter unblocks, the discharge current
experienced by the submodules is lower, as the dc voltage is
higher, reducing the current in the IGBTs. Finding the right
conditions to unblock is an interesting and necessary area of
future research and influences the recovery of the converter.
For this paper the converter blocks once any of the arm
currents exceeds an internal maximum of 3.5 kA or if the fault
detection system confirms the presence of a fault, and will
remain blocked until the unblock criteria are met. The
converter will unblock when DC side current has reduced
below 0.1 kA and all the arm currents are below 2.5 kA. For
the parameters used in these cases studies, the fault detection
system is able to block the converter before the arm current
levels are violated.
VII. CASE STUDIES
The MMC converter was modeled using a Detailed
Equivalent Model (DEM). The converter parameters are given
in Table II. The converter arrangement is shown in Fig. 3. The
power traces are measured on the ac grid side of the
transformer at the PCC. The time period that the converter
spends in each stage is determined through simulation. The
terminal fault simulations provide verification that the above
analysis is correct for the terminal fault case.
The faults are detected by measuring the cable voltage and
generating a signal when this collapses below 80% of its
nominal value. A 1 ms delay is then added to this signal to
replicate the performance of a real fault detection system.
In each simulation the converter is subjected to a dc fault at
200 ms and the fault is detected 1 millisecond after fault
inception. The circuit breaker imposes a counter voltage 5
millisecond after fault inception. Then the circuit breaker
recloses once the dc fault current reaches zero. The converter
unblocks once all arm currents are less than 2.5 kA and the dc
line current is less than 100 A, at which point the converter
attempts to reestablish power flow. It is assumed that the
faulted section of the grid is isolated by other circuit breakers
in the dc grid, through the open grid philosophy.
The first simulations were performed to verify the pole-to-
pole fault analysis performed in Section V. The second set of
results show the control prevents unnecessary blocking of the
converter when it is subjected to a range of pole-to-pole fault
conditions. In each simulation the converter is delivering or
absorbing 1 GW from the ac grid it is connected to and power
is monitored at the Point of Common Coupling (PCC) in the
ac network.
A. Analysis Verification Study
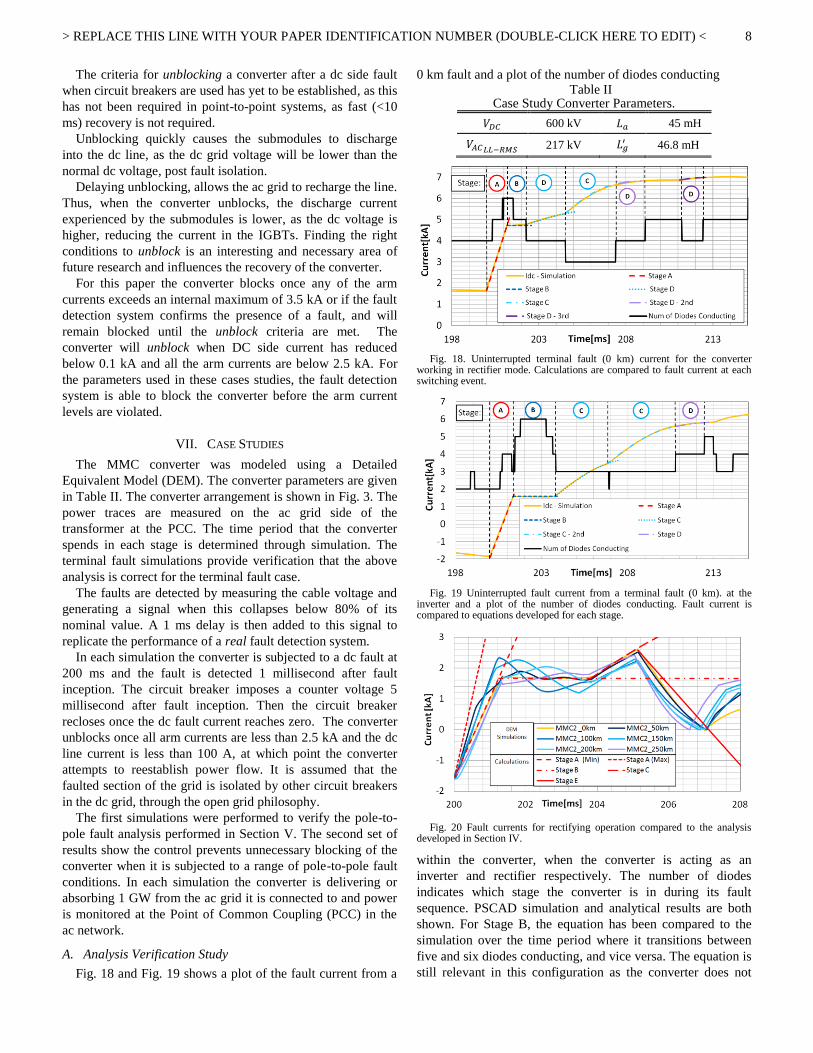
Fig. 18 and Fig. 19 shows a plot of the fault current from a
0 km fault and a plot of the number of diodes conducting Table II
Case Study Converter Parameters.
600 kV 45 mH
217 kV
46.8 mH
Fig. 18. Uninterrupted terminal fault (0 km) current for the converter working in rectifier mode. Calculations are compared to fault current at each switching event.
Fig. 19 Uninterrupted fault current from a terminal fault (0 km). at the inverter and a plot of the number of diodes conducting. Fault current is compared to equations developed for each stage.
Fig. 20 Fault currents for rectifying operation compared to the analysis developed in Section IV.
within the converter, when the converter is acting as an
inverter and rectifier respectively. The number of diodes
indicates which stage the converter is in during its fault
sequence. PSCAD simulation and analytical results are both
shown. For Stage B, the equation has been compared to the
simulation over the time period where it transitions between
five and six diodes conducting, and vice versa. The equation is
still relevant in this configuration as the converter does not
> REPLACE THIS LINE WITH YOUR PAPER IDENTIFICATION NUMBER (DOUBLE-CLICK HERE TO EDIT) <
9
significantly influence the fault current when five diodes are
conducting. This may not hold true for all parameter ranges.
The results show a strong agreement between the simulation
and the analysis (when the analysis is evaluated assuming the
cable voltage is zero). The analysis for the case when five
diodes are conducting has not been included in this paper.
However, the amount the current changes during this stage is
minimal for the parameters in these simulations.
Fig. 20 shows that the predictions provide a strong guide -
line for estimating the fault currents which occur at a distance
from the converter. The traveling waves can increase the fault
currents above those in a 0 km fault; due to the negative cable
voltage increasing the rate-of-change of current. The
maximum and minimum currents expected during stage A are
shown. The maximum Stage A case is a theoretical limit, based
on a complete reversal of the cable voltage ( =- )[15].
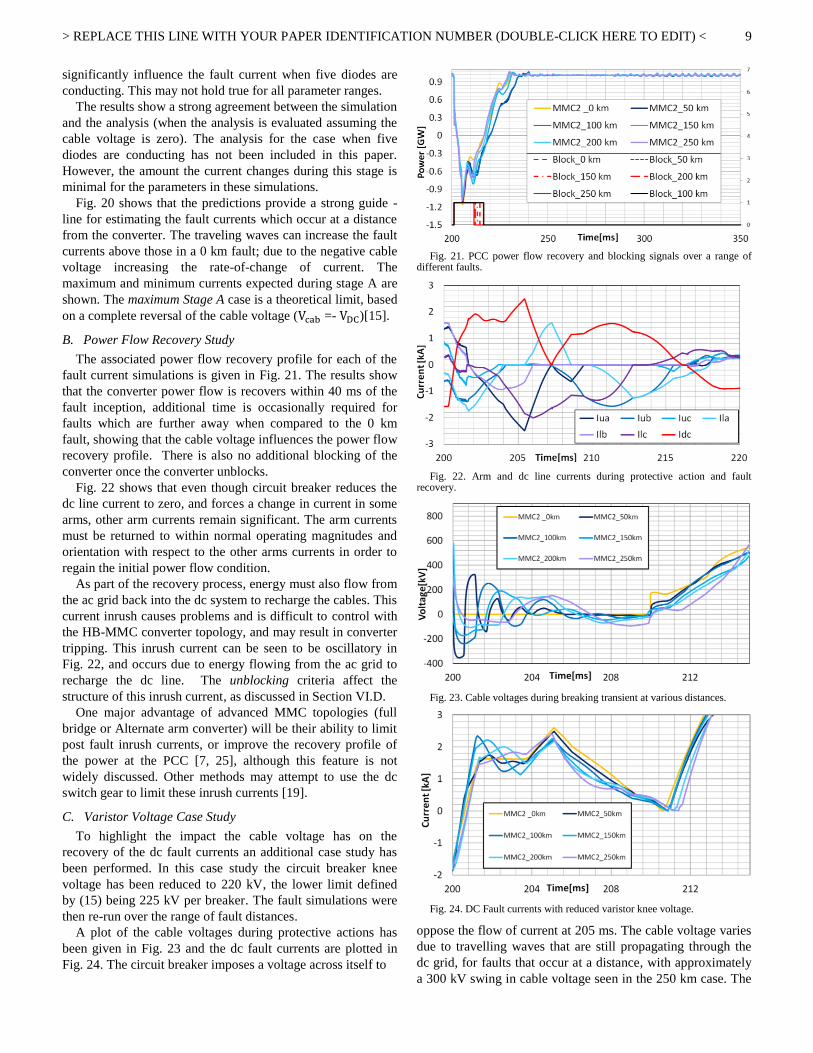
B. Power Flow Recovery Study
The associated power flow recovery profile for each of the
fault current simulations is given in Fig. 21. The results show
that the converter power flow is recovers within 40 ms of the
fault inception, additional time is occasionally required for
faults which are further away when compared to the 0 km
fault, showing that the cable voltage influences the power flow
recovery profile. There is also no additional blocking of the
converter once the converter unblocks.
Fig. 22 shows that even though circuit breaker reduces the
dc line current to zero, and forces a change in current in some
arms, other arm currents remain significant. The arm currents
must be returned to within normal operating magnitudes and
orientation with respect to the other arms currents in order to
regain the initial power flow condition.
As part of the recovery process, energy must also flow from
the ac grid back into the dc system to recharge the cables. This
current inrush causes problems and is difficult to control with
the HB-MMC converter topology, and may result in converter
tripping. This inrush current can be seen to be oscillatory in
Fig. 22, and occurs due to energy flowing from the ac grid to
recharge the dc line. The unblocking criteria affect the
structure of this inrush current, as discussed in Section VI.D.
One major advantage of advanced MMC topologies (full
bridge or Alternate arm converter) will be their ability to limit
post fault inrush currents, or improve the recovery profile of
the power at the PCC [7, 25], although this feature is not
widely discussed. Other methods may attempt to use the dc
switch gear to limit these inrush currents [19].
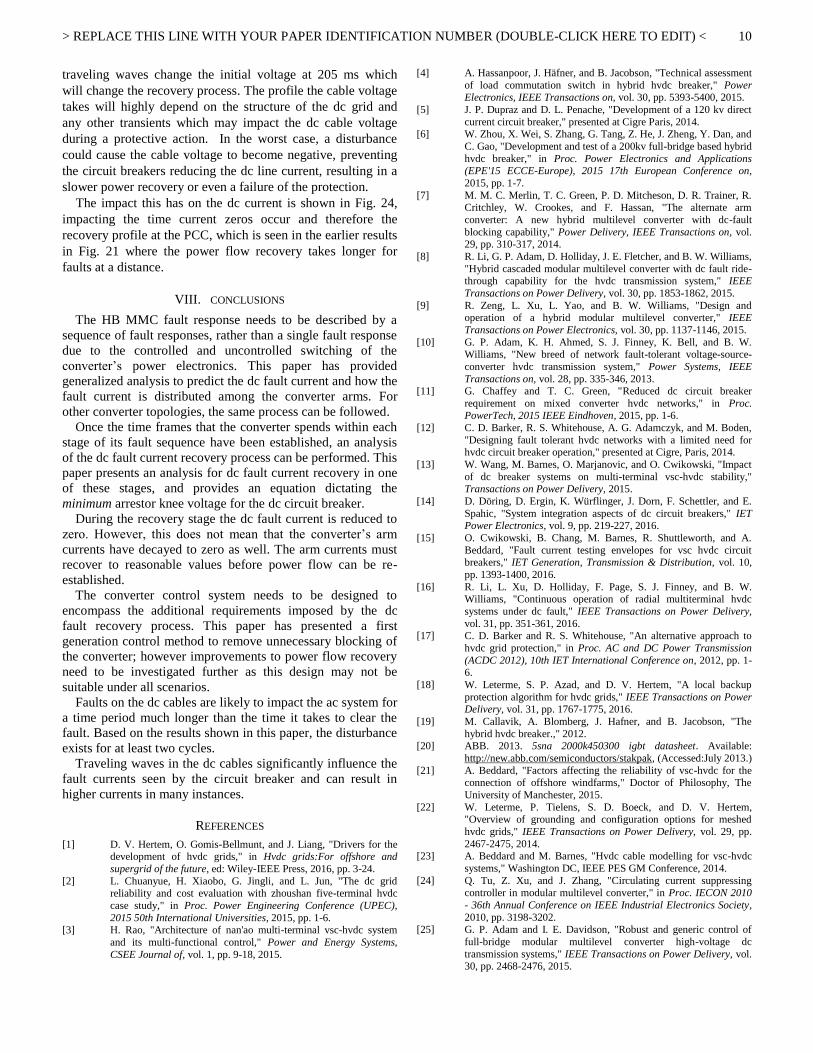
C. Varistor Voltage Case Study
To highlight the impact the cable voltage has on the
recovery of the dc fault currents an additional case study has
been performed. In this case study the circuit breaker knee
voltage has been reduced to 220 kV, the lower limit defined
by (15) being 225 kV per breaker. The fault simulations were
then re-run over the range of fault distances.
A plot of the cable voltages during protective actions has
been given in Fig. 23 and the dc fault currents are plotted in
Fig. 24. The circuit breaker imposes a voltage across itself to
Fig. 21. PCC power flow recovery and blocking signals over a range of different faults.
Fig. 22. Arm and dc line currents during protective action and fault recovery.
Fig. 23. Cable voltages during breaking transient at various distances.
Fig. 24. DC Fault currents with reduced varistor knee voltage.
oppose the flow of current at 205 ms. The cable voltage varies
due to travelling waves that are still propagating through the
dc grid, for faults that occur at a distance, with approximately
a 300 kV swing in cable voltage seen in the 250 km case. The
> REPLACE THIS LINE WITH YOUR PAPER IDENTIFICATION NUMBER (DOUBLE-CLICK HERE TO EDIT) <
10
traveling waves change the initial voltage at 205 ms which
will change the recovery process. The profile the cable voltage
takes will highly depend on the structure of the dc grid and
any other transients which may impact the dc cable voltage
during a protective action. In the worst case, a disturbance
could cause the cable voltage to become negative, preventing
the circuit breakers reducing the dc line current, resulting in a
slower power recovery or even a failure of the protection.
The impact this has on the dc current is shown in Fig. 24,
impacting the time current zeros occur and therefore the
recovery profile at the PCC, which is seen in the earlier results
in Fig. 21 where the power flow recovery takes longer for
faults at a distance.
VIII. CONCLUSIONS
The HB MMC fault response needs to be described by a
sequence of fault responses, rather than a single fault response
due to the controlled and uncontrolled switching of the
converter’s power electronics. This paper has provided
generalized analysis to predict the dc fault current and how the
fault current is distributed among the converter arms. For
other converter topologies, the same process can be followed.
Once the time frames that the converter spends within each
stage of its fault sequence have been established, an analysis
of the dc fault current recovery process can be performed. This
paper presents an analysis for dc fault current recovery in one
of these stages, and provides an equation dictating the
minimum arrestor knee voltage for the dc circuit breaker.
During the recovery stage the dc fault current is reduced to
zero. However, this does not mean that the converter’s arm
currents have decayed to zero as well. The arm currents must
recover to reasonable values before power flow can be re-
established.
The converter control system needs to be designed to
encompass the additional requirements imposed by the dc
fault recovery process. This paper has presented a first
generation control method to remove unnecessary blocking of
the converter; however improvements to power flow recovery
need to be investigated further as this design may not be
suitable under all scenarios.
Faults on the dc cables are likely to impact the ac system for
a time period much longer than the time it takes to clear the
fault. Based on the results shown in this paper, the disturbance
exists for at least two cycles.
Traveling waves in the dc cables significantly influence the
fault currents seen by the circuit breaker and can result in
higher currents in many instances.
REFERENCES
[1] D. V. Hertem, O. Gomis-Bellmunt, and J. Liang, "Drivers for the development of hvdc grids," in Hvdc grids:For offshore and
supergrid of the future, ed: Wiley-IEEE Press, 2016, pp. 3-24.
[2] L. Chuanyue, H. Xiaobo, G. Jingli, and L. Jun, "The dc grid
reliability and cost evaluation with zhoushan five-terminal hvdc
case study," in Proc. Power Engineering Conference (UPEC),
2015 50th International Universities, 2015, pp. 1-6. [3] H. Rao, "Architecture of nan'ao multi-terminal vsc-hvdc system
and its multi-functional control," Power and Energy Systems,
CSEE Journal of, vol. 1, pp. 9-18, 2015.
[4] A. Hassanpoor, J. Häfner, and B. Jacobson, "Technical assessment
of load commutation switch in hybrid hvdc breaker," Power Electronics, IEEE Transactions on, vol. 30, pp. 5393-5400, 2015.
[5] J. P. Dupraz and D. L. Penache, "Development of a 120 kv direct
current circuit breaker," presented at Cigre Paris, 2014. [6] W. Zhou, X. Wei, S. Zhang, G. Tang, Z. He, J. Zheng, Y. Dan, and
C. Gao, "Development and test of a 200kv full-bridge based hybrid
hvdc breaker," in Proc. Power Electronics and Applications (EPE'15 ECCE-Europe), 2015 17th European Conference on,
2015, pp. 1-7.
[7] M. M. C. Merlin, T. C. Green, P. D. Mitcheson, D. R. Trainer, R. Critchley, W. Crookes, and F. Hassan, "The alternate arm
converter: A new hybrid multilevel converter with dc-fault
blocking capability," Power Delivery, IEEE Transactions on, vol. 29, pp. 310-317, 2014.
[8] R. Li, G. P. Adam, D. Holliday, J. E. Fletcher, and B. W. Williams,
"Hybrid cascaded modular multilevel converter with dc fault ride-through capability for the hvdc transmission system," IEEE
Transactions on Power Delivery, vol. 30, pp. 1853-1862, 2015.
[9] R. Zeng, L. Xu, L. Yao, and B. W. Williams, "Design and operation of a hybrid modular multilevel converter," IEEE
Transactions on Power Electronics, vol. 30, pp. 1137-1146, 2015.
[10] G. P. Adam, K. H. Ahmed, S. J. Finney, K. Bell, and B. W. Williams, "New breed of network fault-tolerant voltage-source-
converter hvdc transmission system," Power Systems, IEEE
Transactions on, vol. 28, pp. 335-346, 2013. [11] G. Chaffey and T. C. Green, "Reduced dc circuit breaker
requirement on mixed converter hvdc networks," in Proc. PowerTech, 2015 IEEE Eindhoven, 2015, pp. 1-6.
[12] C. D. Barker, R. S. Whitehouse, A. G. Adamczyk, and M. Boden,
"Designing fault tolerant hvdc networks with a limited need for hvdc circuit breaker operation," presented at Cigre, Paris, 2014.
[13] W. Wang, M. Barnes, O. Marjanovic, and O. Cwikowski, "Impact
of dc breaker systems on multi-terminal vsc-hvdc stability," Transactions on Power Delivery, 2015.
[14] D. Döring, D. Ergin, K. Würflinger, J. Dorn, F. Schettler, and E.
Spahic, "System integration aspects of dc circuit breakers," IET Power Electronics, vol. 9, pp. 219-227, 2016.
[15] O. Cwikowski, B. Chang, M. Barnes, R. Shuttleworth, and A.
Beddard, "Fault current testing envelopes for vsc hvdc circuit breakers," IET Generation, Transmission & Distribution, vol. 10,
pp. 1393-1400, 2016.
[16] R. Li, L. Xu, D. Holliday, F. Page, S. J. Finney, and B. W. Williams, "Continuous operation of radial multiterminal hvdc
systems under dc fault," IEEE Transactions on Power Delivery,
vol. 31, pp. 351-361, 2016. [17] C. D. Barker and R. S. Whitehouse, "An alternative approach to
hvdc grid protection," in Proc. AC and DC Power Transmission
(ACDC 2012), 10th IET International Conference on, 2012, pp. 1-6.
[18] W. Leterme, S. P. Azad, and D. V. Hertem, "A local backup
protection algorithm for hvdc grids," IEEE Transactions on Power Delivery, vol. 31, pp. 1767-1775, 2016.
[19] M. Callavik, A. Blomberg, J. Hafner, and B. Jacobson, "The
hybrid hvdc breaker.," 2012. [20] ABB. 2013. 5sna 2000k450300 igbt datasheet. Available:
http://new.abb.com/semiconductors/stakpak, (Accessed:July 2013.)
[21] A. Beddard, "Factors affecting the reliability of vsc-hvdc for the connection of offshore windfarms," Doctor of Philosophy, The
University of Manchester, 2015.
[22] W. Leterme, P. Tielens, S. D. Boeck, and D. V. Hertem, "Overview of grounding and configuration options for meshed
hvdc grids," IEEE Transactions on Power Delivery, vol. 29, pp.
2467-2475, 2014. [23] A. Beddard and M. Barnes, "Hvdc cable modelling for vsc-hvdc
systems," Washington DC, IEEE PES GM Conference, 2014.
[24] Q. Tu, Z. Xu, and J. Zhang, "Circulating current suppressing
controller in modular multilevel converter," in Proc. IECON 2010
- 36th Annual Conference on IEEE Industrial Electronics Society,
2010, pp. 3198-3202. [25] G. P. Adam and I. E. Davidson, "Robust and generic control of
full-bridge modular multilevel converter high-voltage dc
transmission systems," IEEE Transactions on Power Delivery, vol. 30, pp. 2468-2476, 2015.


![Protection for Submodule Overvoltage caused byorca.cf.ac.uk/129648/1/Li G - Protection for Submodule...HVDC circuit breakers (DCCBs) [10] and MMC topologies with dc fault blocking](https://img.pdfslide.us/doc/110x75/5faf9bfb1fcc5938ec4c6cf1/protection-for-submodule-overvoltage-caused-g-protection-for-submodule-hvdc.jpg)