Embed Size (px)
Citation preview

Press Release 2Q 2017 July 24, 2017
Page 1
2017 SECOND QUARTER AND FIRST SIX MONTHS RESULTS Mexico City, July 24, 2017, Coca-Cola FEMSA, S.A.B. de C.V. (BMV: KOFL, NYSE: KOF) (“Coca-Cola FEMSA” or the “Company”),
the largest franchise bottler in the world by sales volume, announces results for the second quarter of 2017.
Operational and Financial Highlights
Revenues grew 25.5%, while comparable revenues grew 1.9% for the second quarter of 2017.
Operating income grew 8.1%, while comparable operating income remained flat during the second quarter of 2017.
Operating cash flow increased 20.7%, while comparable operating cash flow grew 1.3% for the second quarter of 2017.
Majority net income increased 11.4% in the second quarter of 2017.
Results Summary
Message from the Chief Executive Officer
“In the second quarter, we navigated the market challenges and opportunities of our geographically diversified footprint—delivering
revenue and operating income growth of 25.5% and 8.1%, respectively, resulting in majority net income growth of 11.4%.
During the quarter, our Mexico and Central America division faced a complex environment of increased inflation and raw material
volatility. Nevertheless, this division was able to build on last year’s growth thanks to the deployment of our commercial, distribution,
and supply-chain transformational initiatives. These initiatives are already contributing to better route planning, improved point-of-sale
execution, and operating expense savings, mitigating pressure on margins. In the face of a complicated consumer environment, our
South America division mainly driven by an encouraging Brazil, expanded margins thanks to our relentless focus on efficiency and the
outstanding results of our commercial and affordability initiatives. Moreover, our recent consolidation of our operation in the Philippines
contributed positively to our consolidated results.
For the second half of the year, we will continue leveraging our disciplined approach to capital deployment, while working intensively to
expand our portfolio and capitalize on our transformational initiatives to further our goal of becoming a global multi-category beverage
leader.” said John Santa Maria Otazua, Chief Executive Officer of the Company.
.
Comparable (1)
2017 D% D% 2017 D% D%
Total revenues 50,108 25.5% 1.9% 99,849 30.3% 2.3%
Gross profit 22,825 23.8% 3.8% 44,674 26.9% 4.2%
Operating income 6,491 8.1% 0.0% 12,775 17.5% 3.4%
Operating cash flow (2) 9,770 20.7% 1.3% 19,000 26.3% 2.6%
Net income attributable to equity holders of the company 2,229 11.4% 8,413 91.6%
Earnings per share (3) 1.07 4.04
Expressed in millions of Mexican pesos.
(2) Operating cash flow = operating income + depreciation + amortization & other operative non-cash charges.
(3) 2Q EPS calculated with 2,090.4 million shares, the weighted average of the Company’s outstanding shares over the period. YTD EPS calculated with 2,081.7 million shares, the
weighted average of the Company's outstanding shares over the period. At the end of June 2017, total outstanding shares were 2,100.8 million shares.
(1) Comparable means, with respect to a year-over-year comparison, the change in a given measure excluding the effects of (i) mergers, acquisitions and divestitures, (ii) translation
effects resulting from exchange rate movements (iii) the results of hyperinflationary economies in both periods, and (iv) includes the results of Coca-Cola FEMSA Philippines Inc., as if the
consolidation had taken place at the beginning of first quarter 2016. From our operations, only Venezuela qualifies as a hyperinflationary economy.
Second Quarter Year to Date
as Reported Comparable (1) as Reported

Press Release 2Q 2017 July 24, 2017
Page 2
Consolidated Results Comparable means, with respect to a year-over-year comparison, the change in a given measure excluding the effects of (i) mergers, acquisitions and divestitures, (ii)
translation effects resulting from exchange rate movements (iii) the results of hyperinflationary economies in both periods; and (iv) includes the results of Coca-Cola FEMSA
Philippines Inc., as if the consolidation had taken place at the beginning of first quarter 2016. From our operations, only Venezuela qualifies as a hyperinflationary economy. In
our “as reported” figures, our Venezuelan operation’s results were translated into Mexican pesos using the DICOM exchange rate published on June 30, 2017 of 2,640.00
bolivars per US dollar.
Comparable figures:
Revenues: Comparable total revenues grew 1.9% in the second quarter of 2017 as compared to the same period of 2016 driven by
average price per unit case growth across most of our operations and volume growth in Mexico, offset by volume declines in the
rest of our operations.
Transactions: The comparable number of transactions declined 3.9%. The sparkling beverage portfolio’s transactions contracted
4.1% driven by most operations, which were partially offset by growth in Argentina. The still beverage category’s transactions
decreased by 5.2%, driven mainly by South America, partially offset by growth in the Philippines and Mexico. Water transactions,
including bulk water, decreased 7.6% driven by contractions across most operations, which offset growth in Mexico and the
Philippines.
Volume: Comparable sales volume declined 2.4% in the second quarter of 2017 as compared to the same period in 2016. The
sparkling beverage portfolio’s volume contracted 2.5% driven mainly by Brazil, Colombia, Philippines and Central America which
offset flat performance in Mexico and Argentina. Still beverage category’s volume decreased 4.3%, driven by Brazil, Colombia, the
Philippines and Central America partially offset by growth in Mexico and Argentina. Personal water portfolio’s volume grew 4.3%
driven by Mexico and the Philippines, partially offset by declines in South America. Bulk water portfolio’s volume contracted 2.8%
driven by South America, offset by flat performance in Mexico and growth in the Philippines.
Gross profit: Comparable gross profit grew 3.8%. Our pricing initiatives coupled with lower PET prices offset higher sweetener
prices and the depreciation in the average exchange rate of the Mexican Peso, the Argentine Peso, and the Philippine Peso, as
applied to our U.S. dollar-denominated raw material costs.
Operating Income: Comparable operating income remained flat for the second quarter of 2017 as compared to the same period of
2016.
Operating cash flow: Comparable operating cash flow increased 1.3% in the second quarter of 2017.
As reported figures
Revenues: Total revenues increased 25.5% to Ps. 50,108 million in the second quarter of 2017 driven by the acquisition of Vonpar
in Brazil and the consolidation of our operation in the Philippines, combined with price increases in line or above inflation in key
territories such as Mexico, Brazil, Colombia and Argentina and supported by the positive translation effect resulting from the
appreciation of the Brazilian Real and the Colombian Peso, despite the depreciation of the Argentine Peso, the Philippine Peso and
the Venezuelan Bolivar; all as compared to the Mexican Peso.
Transactions: Reported total number of transactions increased 33.5% to 6,690.2 million in the second quarter of 2017 as
compared to the same period in 2016.
Volume: Reported total sales volume increased 18.0% to 995.0 million unit cases in the second quarter of 2017 as compared to the
same period in 2016.
Gross profit: Gross profit grew 23.8% to Ps. 22,825 million and gross margin declined 60 basis points to 45.6%.
Equity method: The reported share of the profits of associates and joint ventures recorded a loss of Ps. 35 million in the second
quarter of 2017, compared to a gain of Ps. 211 million recorded in the second quarter of 2016, due mainly to the consolidation of
Coca-Cola FEMSA Philippines, Inc., which is no longer included in the equity method beginning February of this year, coupled with
a loss in our dairy joint venture in Panama. (Continued on next page)

Press Release 2Q 2017 July 24, 2017
Page 3
Operating Income: Operating income increased 8.1% to Ps. 6,491 million and operating margin contracted 200 basis points to
13.0%, mainly driven by higher freight expenses, labor costs and diesel and gasoline prices. Due to the consolidation of Coca-Cola
FEMSA Philippines in February 2017, the results of this operation are not included in our share of the profit of associates for 2017,
as compared to 2016. We also recorded an additional extraordinary provision related to a settlement agreement reached in
Colombia with the Water and Sewerage Company of Bogotá, for an administrative proceeding related to the calculation of public
sewer service charges. These effects were partially offset by an operative foreign exchange gain.
Other non-operative expenses, net: Other non-operative expenses, net recorded an expense of Ps. 1,330 million, compared to
Ps. 492 million during the second quarter of 2016, mainly due to negative currency fluctuation effects in our operation in Venezuela.
Comprehensive financing result: Comprehensive financing result in the second quarter of 2017 recorded an expense of Ps.
1,711 million, compared to an expense of Ps. 2,651 million in the same period of 2016.
During the second quarter of 2017, we recorded an interest expense of Ps. 2,128 million, compared to Ps. 1,826 million in the
second quarter of 2016. This increase was driven by i) the interest rate increase from swapping U.S. dollar denominated debt to
Brazilian Real and Mexican Peso denominated debt, as part of our strategy to eliminate our U.S. dollar net debt exposure ii)
additional debt related to the acquisition of Vonpar, iii) the average exchange rate appreciation of the Brazilian Real compared to
the Mexican Peso as applied to the existing Brazilian Real denominated interest expense, and iv) interest rate increase in Mexico.
These effects were partially offset by the decrease of interest rates in Brazil and the reduction of debt in Argentina.
In addition, for the second quarter we recorded a foreign exchange gain of Ps. 139 million as compared to a loss of Ps. 1,241
million in 2016, which was generated as a result of the quarterly depreciation of the Mexican peso as applied to our U.S. dollar-
denominated net debt position in 2016.
Due to Venezuela, during the second quarter of 2017 we recorded a gain on monetary position in inflationary subsidiaries of Ps.
178 million as compared to Ps. 158 million during the same period of 2016.
Market value on financial instruments recorded a loss of Ps. 82 million as compared to a gain of Ps. 115 million in the second
quarter of 2016.
Income tax: During the second quarter of 2017, reported income tax as a percentage of income before taxes was 24.7%,
compared to 26.0% in the same period of 2016. The reduction of tax rate in 2017 resulted from certain tax efficiencies across our
operations.
Net income: Reported consolidated net controlling interest income increased 11.4% to Ps. 2,229 million in the second quarter of
2017, resulting in reported earnings per share (EPS) of Ps. 1.07 (Ps. 10.68 per ADS).
Operating cash flow: Operating cash flow grew 20.7% to Ps. 9,770 million and operating cash flow margin contracted 80 basis
points to 19.5%.

Press Release 2Q 2017 July 24, 2017
Page 4
Balance Sheet (1)
As of June 30, 2017, we had a cash balance of Ps. 24,155 million, including US$ 143 million denominated in U.S. dollars, an
increase of Ps. 13,679 million as compared to December 31, 2016. This difference was mainly driven by the proceeds from the
issuance of Mexican Peso denominated bonds, the cash obtained from the issuance of shares to former Vonpar shareholders, the
consolidation of the Philippines, the payment of the first installment of dividends corresponding to fiscal year 2016, and the net cash
flow generation across our territories.
As of June 30, 2017, total short-term debt was Ps. 2,050 million and long-term debt was Ps. 85,545 million. Total debt decreased by
Ps. 1,314 million, compared to year end 2016 mainly due to the positive translation effect resulting from the appreciation of the end
of period exchange rate of the Mexican Peso as applied to our U.S. dollar denominated debt position. Net debt decreased by Ps.
14,993 million compared to year end 2016.
The weighted average cost of debt for the quarter, including the effect of debt swapped to Brazilian Reals and Mexican Pesos was
8.97%, a decrease as compared to the first quarter 2017 mainly due to the reduction of interest rates in Brazil. The following charts
set forth the Company’s debt profile by currency and interest rate type and by maturity date as of June 30, 2017.
Currency % Total Debt(2) % Interest Rate Floating(2)(3)
Mexican pesos 50.1% 7.0% U.S. dollars 1.2% 0.0% Colombian pesos 2.6% 72.8% Brazilian reals 46.0% 97.1% Argentine pesos 0.1% 0.0%
Debt Maturity Profile
Maturity Date 2017 2018 2019 2020 2021 2022+
% of Total Debt 0.3% 23.8% 7.4% 10.6% 7.2% 50.6%
(1) See page 18 for detailed information. (2) After giving effect to cross currency swaps. (3) Calculated by weighting each year’s outstanding debt balance mix.
Selected Financial Ratios
LTM 2017 FY 2016 D %
Net debt including effect of hedges (1)(3)
67,214
80,043 -16.0% Net debt including effect of hedges / Operating cash flow (1)(3) 1.75
2.26
Operating cash flow/ Interest expense, net (1)
4.44
5.25 Capitalization (2) 41.1% 41.3%
(1) Net debt = total debt - cash (2) Total debt / (long-term debt + shareholders' equity) (3) After giving effect to cross currency swaps.
Press Release 2Q 2017 July 24, 2017
Page 5
Mexico & Central America Division
(Mexico, Guatemala, Nicaragua, Costa Rica and Panama) Comparable means, with respect to a year-over-year comparison, the change in a given measure excluding the effects of (i) mergers, acquisitions and divestitures, (ii)
translation effects resulting from exchange rate movements (iii) the results of hyperinflationary economies in both periods; and (iv) includes the results of Coca-Cola FEMSA
Philippines Inc., as if the consolidation had taken place at the beginning of first quarter 2016. From our operations, only Venezuela qualifies as a hyperinflationary economy. In
our “as reported” figures, our Venezuelan operation’s results were translated into Mexican pesos using the DICOM exchange rate published on June 30, 2017 of 2,640.00
bolivars per US dollar.
Comparable figures:
Revenues: Comparable total revenues from the Mexico and Central America division increased 5.6% in the second quarter of
2017, compared to the same period in 2016, driven by an increase in average price per unit case and volume growth in Mexico,
offset by volume declines in Central America.
Transactions: Total transactions in the Mexico and Central America division declined 1.2% in the second quarter of 2017.
Sparkling beverage portfolio’s transactions contracted 1.8%. Still beverage category’s transactions increased by 0.9%, driven
mainly by Mexico which grew 2.6%, offset by a reduction in Central America. Water transactions, including bulk water, increased
2.3% driven mainly by growth in Mexico, offset by flat performance in Central America.
Volume: Total sales volume for the division increased 0.4% in the second quarter of 2017, compared to the same period of 2016.
In Mexico, volume increased 0.8%, over a year-over-year comparable of 2016 where volume increased 7.3%, while volume in
Central America decreased 3.6%. Sparkling beverage category’s volume remained flat, driven by contractions in Colas in Central
America offset by growth of the flavored sparkling portfolio in Mexico.
Still beverage category’s volume grew 1.6%, driven mainly by the performance of Vallefrut, the del Valle juice portfolio, Santa Clara
dairy products, and Powerade in Mexico, offset by declines in del Valle in Central America. Personal water portfolio’s volume grew
5.5%, driven by growth in both Mexico and Central America. Bulk water portfolio’s volume remained flat in the division driven by flat
performance in Mexico, which was not fully offset by a contraction in Central America.
Gross profit: Comparable gross profit grew 3.2% in the second quarter of 2017 as compared to the same period in 2016. Our
pricing initiatives and lower PET prices were offset by higher prices of sweeteners, an unfavorable currency hedging position and
the depreciation of the average exchange rate of the Mexican Peso as applied to U.S. dollar-denominated raw material costs.
Operating income: Comparable operating income in the division decreased 1.6% in the second quarter of 2017 as compared to
the same period in 2016.
Operating cash flow: Comparable operating cash flow decreased 0.6% in the second quarter of 2017 as compared to the same
period in 2016.
As reported figures
Revenues: Reported total revenues increased 5.8% in the second quarter of 2017, driven by a combination of volume growth and
price increase in Mexico, offset by volume declines in Central America.
Gross profit: Reported gross profit increased 3.4% in the second quarter of 2017 and gross profit margin reached 49.5%, a gross
margin contraction of 120 basis points.
Operating income: Reported operating income decreased 5.7% in the second quarter of 2017 and the operating income margin
reached 17.3%, contracting 210 basis points during the period, due to an increase in freight expenses and higher diesel and
gasoline prices. Due to the consolidation of Coca-Cola FEMSA Philippines, the results of this operation are not included in the
share of the profit of associates for 2017, as compared to 2016. These effects were partially offset by an operative foreign
exchange gain.
Operating cash flow: Reported operating cash flow decreased 0.4% in the second quarter of 2017, resulting in a margin
contraction of 140 basis points, reaching 23.0%.

Press Release 2Q 2017 July 24, 2017
Page 6
South America Division
(Colombia, Venezuela, Brazil and Argentina) Comparable means, with respect to a year-over-year comparison, the change in a given measure excluding the effects of (i) mergers, acquisitions and divestitures, (ii)
translation effects resulting from exchange rate movements (iii) the results of hyperinflationary economies in both periods; and (iv) includes the results of Coca-Cola FEMSA
Philippines Inc., as if the consolidation had taken place at the beginning of first quarter 2016. From our operations, only Venezuela qualifies as a hyperinflationary economy. In
our “as reported” figures, our Venezuelan operation’s results were translated into Mexican pesos using the DICOM exchange rate published on June 30, 2017 of 2,640.00
bolivars per US dollar.
Comparable figures:
Revenues: Comparable total revenues decreased 1.0%, driven mainly by volume declines across our operations, which were not
fully offset by an average price per unit case increase across our territories.
Transactions: Comparable transactions in the division declined 9.5% during the second quarter of 2017. The sparkling beverage
portfolio’s transactions decreased 6.7%, driven by contractions in Colombia and Brazil, which were not fully offset by growth in
Argentina. Still beverage category’s transactions decreased by 21.0% driven by reductions across our operations. Water
transactions, including bulk water, decreased 19.0%, driven by declines in all of our countries.
Volume: Comparable total sales volume in South America contracted 9.0% during the second quarter of 2017 as compared to the
same period of 2016. The sparkling beverage category’s volume decreased 7.2%, driven by declines in Brazil and Colombia, which
was partially offset by flat performance in Argentina. The still beverage category’s volume decreased 16.3%, driven by Colombia
and Brazil, which offset growth in Argentina. Personal water category’s volume declined 8.5%, driven by Argentina and Brazil,
which were not fully offset by growth in Colombia. Bulk water business’s volume declined 37.2%, driven by contractions in all
territories.
Gross profit: Comparable gross profit increased 7.4% as a result of our pricing initiatives, the benefit of lower PET and sweetener
prices and the appreciation of the Brazilian Real and the Colombian Peso as applied to U.S. dollar-denominated raw material costs
which offset the depreciation of the average exchange rate of the Argentine Peso as applied to U.S. dollar-denominated raw
material costs.
Operating income: Comparable operating income decreased 1.0% as compared to the same period of the previous year.
Operating cash flow: Comparable operating cash flow increased 3.9% as compared to the same period of 2016.
As reported figures
Revenues: Reported total revenues grew 17.3% to Ps. 19,643 million in the second quarter of 2017 driven by the integration of
Vonpar in Brazil coupled with the positive translation effect of the Brazilian real and the Colombian peso, as compared to the
Mexican Peso.
Transactions: Reported total number of transactions declined 3.2% to 1,912.2 million in the second quarter of 2017 as compared
to the same period in 2016.
Volume: Reported total sales volume declined 3.7% to 290.8 million unit cases in the second quarter of 2017 as compared to the
same period in 2016.
Gross profit: Reported gross profit increased 23.9% to Ps. 8,274 million in the second quarter of 2017 and gross profit margin
expanded 220 basis points to 42.1%.
Operating income: Reported operating income grew 13.4% to Ps. 1,712 million in the second quarter of 2017, resulting in a
margin of 8.7%, a contraction of 30 basis points, mainly driven by an additional extraordinary provision related to a settlement
agreement reached in Colombia with the Water and Sewerage Company of Bogotá, for an administrative proceeding related to the
calculation of public sewer service charges.
Operating cash flow: Reported operating cash flow grew 26.5% to reach Ps. 3,076 million in the second quarter of 2017, resulting
in a margin of 15.7%, an expansion of 120 basis points.

Press Release 2Q 2017 July 24, 2017
Page 7
Asia Division
(The Philippines) Comparable means, with respect to a year-over-year comparison, the change in a given measure excluding the effects of (i) mergers, acquisitions and divestitures, (ii)
translation effects resulting from exchange rate movements (iii) the results of hyperinflationary economies in both periods; and (iv) includes the results of Coca-Cola FEMSA
Philippines Inc., as if the consolidation had taken place at the beginning of first quarter 2016. From our operations, only Venezuela qualifies as a hyperinflationary economy. In
our “as reported” figures, our Venezuelan operation’s results were translated into Mexican pesos using the DICOM exchange rate published on June 30, 2017 of 2,640.00
bolivars per US dollar.
Comparable figures:
Revenues: Comparable total revenues declined 3.9% during the second quarter of 2017, driven by a volume contraction.
Transactions: Comparable transactions in the division reduced 2.7% in the second quarter of 2017. The sparkling beverage
portfolio’s transactions decreased 5.4%, mainly driven by flavors. Still beverage category’s transactions increased by 5.5% driven
mainly by Minute Maid Fresh. Water transactions, including bulk water, increased 63.4% driven by Wilkins.
Volume: Comparable total sales volume in the division decreased 1.1% in the second quarter of 2017, facing a tough comparable
year over year growth of 10.1% in 2016. Sparkling beverage category’s volume decreased 1.8% driven mainly by Royal and Sprite
offsetting a 1.2% growth in brand Coca-Cola. Still beverage category’s volume, excluding powders grew 11.3% driven by Minute
Maid Fresh. Personal water category’s volume increased 47.3%, driven by Wilkins Pure. Bulk water business volume grew 0.8%,
driven by growth in Wilkins.
Gross profit: Comparable gross profit declined 2.7% as compared to the same period of 2016, mainly driven by a volume and
revenue contraction coupled with the devaluation of the Philippine Peso as applied to our U.S. dollar-denominated raw material
costs, partially offset by lower prices of sweeteners and PET resin.
Operating income: Comparable operating income increased 18.7% as compared to the same period of the previous year as a
result of initiatives to control costs and expenses.
Operating cash flow: Comparable operating cash flow increased 5.1% as compared to the same period of 2016.

Press Release 2Q 2017 July 24, 2017
Page 8
YTD Consolidated Results Comparable means, with respect to a year-over-year comparison, the change in a given measure excluding the effects of (i) mergers, acquisitions and divestitures, (ii)
translation effects resulting from exchange rate movements (iii) the results of hyperinflationary economies in both periods; and (iv) includes the results of Coca-Cola FEMSA
Philippines Inc., as if the consolidation had taken place at the beginning of first quarter 2016. From our operations, only Venezuela qualifies as a hyperinflationary economy. In
our “as reported” figures, our Venezuelan operation’s results were translated into Mexican pesos using the DICOM exchange rate published on June 30, 2017 of 2,640.00
bolivars per US dollar.
Comparable figures:
Revenues: Comparable total revenues grew 2.3% driven by average price per unit case growth across most of our operations and
volume growth in Mexico.
Transactions: The comparable number of transactions declined 4.4%. The sparkling beverage portfolio’s transactions declined
4.6% driven mainly by Brazil, Colombia and the Philippines, which offset flat performance in Mexico. Still beverage category’s
transactions decreased by 3.7%, driven mainly by declines in Colombia and Brazil, which offset increases in Mexico, Argentina and
the Philippines. Water transactions, including bulk water, decreased 9.0% driven by declines across most of our operations, which
offset growth in Mexico and the Philippines.
Volume: Comparable sales volume contracted 3.1% in the first six months of 2017 as compared to the same period in 2016.
Sparkling beverage portfolio’s volume declined 3.5% driven mainly by Brazil, Colombia, Argentina and the Philippines; which offset
growth in Mexico. Still beverage category’s volume grew 25.5%, driven by growth in Mexico and Argentina, partially offset by
declines in Brazil, Colombia, Central America, and the Philippines. Personal water portfolio’s volume decreased 4.3% driven mainly
by South America and Central America, which offset growth in Mexico and the Philippines. Bulk water portfolio’s volume declined
2.4% driven by South America, partially offset by growth in Mexico and the Philippines.
Gross profit: Comparable gross profit grew 4.2%. Our pricing initiatives, coupled with our currency and raw material hedging
strategies offset higher sweetener prices and the depreciation in the average exchange rate of the Mexican Peso, the Argentine
Peso and the Philippine Peso, as applied to U.S dollar-denominated raw material costs.
Operating Income: Comparable operating income grew 3.4% in the first six months of 2017.
Operating cash flow: Comparable operating cash flow increased 2.6% in the first six months of 2017.
As reported figures
Revenues: Total revenues increased 30.3% to Ps. 99,849 million in the first six months of 2017 driven by the results of the Vonpar
acquisition in Brazil and the consolidation of our operation in the Philippines beginning in February. Total revenues were also driven
by price increases in line or above inflation in key territories, supported by the positive translation effect resulting from the
appreciation of the Brazilian Real and the Colombian Peso; despite the depreciation of the Venezuelan Bolivar; all as compared to
the Mexican Peso.
Transactions: Reported total number of transactions increased 25.8% to 12,431.9 million in the first six months of 2017 as
compared to the same period in 2016.
Volume: Reported total sales volume increased 13.1% to 1,876.3 million unit cases in the first six months of 2017 as compared to
the same period in 2016.
Gross profit: Gross profit grew 26.9% to Ps. 44,674 million and gross margin declined 120 basis points to 44.7%.
Equity method: The reported share of the profits of associates and joint ventures recorded a gain of Ps. 11 million in the first six
months of 2017, compared to a gain of Ps. 271 million recorded in the first six months of 2016, due mainly to the consolidation of
Coca-Cola FEMSA Philippines, Inc., which is no longer included in the equity method beginning February of this year.
(Continued on next page)
Press Release 2Q 2017 July 24, 2017
Page 9
Operating Income: Operating income increased 17.5% to Ps. 12,775 million and operating margin contracted 140 basis points to
12.8% due mainly to an increase in operating expenses. We also recorded an additional extraordinary provision related to a
settlement agreement reached in Colombia with the Water and Sewerage Company of Bogotá, for an administrative proceeding
related to the calculation of public sewer service charges. These effects were partially offset by an operative foreign exchange gain.
Other non-operative expenses, net: Other non-operative expenses, net recorded income of Ps. 1,335 million, compared to
expenses of Ps. 768 million during the first six months of 2016, due mainly to income related to the consolidation of Coca-Cola
FEMSA Philippines, which was partially offset by the negative currency fluctuation effects in our operation in Venezuela.
Comprehensive financing result: Our comprehensive financing result in the first six months of 2017 recorded an expense of Ps.
3,310 million, compared to an expense of Ps. 3,933 million in the same period of 2016.
During the first six months of 2017, we recorded an interest expense of Ps. 4,641 million, compared to Ps. 3,402 million in the first
six months of 2016. This increase was driven by i) the interest rate increase from swapping U.S. dollar denominated debt to
Brazilian Real and Mexican Peso denominated debt, as part of our strategy to eliminate our U.S dollar net debt exposure ii)
additional debt related to the acquisition of Vonpar, iii) the average exchange rate appreciation of the Brazilian Real compared to
the Mexican Peso as applied to our existing Brazilian Real denominated interest expense iv) the interest rate increase in Mexico.
These effects were partially offset by the decrease of interest rates in Brazil and the reduction of debt in Argentina.
In addition, for the first six months we recorded a foreign exchange gain of Ps. 193 million as compared to a loss of Ps. 1,401
million in 2016, which was generated as a result of the depreciation of the Mexican peso as applied to our U.S. dollar-denominated
net debt position in 2016.
Due to Venezuela, during the first semester of 2017 we recorded a gain on monetary position in inflationary subsidiaries of Ps. 424
million as compared to Ps. 215 million during the same period of 2016.
Market value on financial instruments recorded a gain of Ps. 352 million due to the recent decrease of interest rates in Brazil as
applied to our floating rate cross currency swaps.
Income tax: During the first six months of 2017, reported income tax as a percentage of income before taxes was 17.4%,
compared to 26.0% in the same period of 2016. This reduction was driven mainly by the one-time non-operative income recorded in
connection with the consolidation of Coca-Cola FEMSA Philippines, Inc.
Net income: Reported consolidated net controlling interest income increased 91.6% to Ps. 8,413 million in the first six months of
2017, resulting in reported earnings per share (EPS) of Ps. 4.04 (Ps. 40.41 per ADS).
Operating cash flow: Operating cash flow grew 26.3% to Ps. 19,000 million and operating cash flow margin contracted 60 basis
points to 19.0%.
Press Release 2Q 2017 July 24, 2017
Page 10
Recent Developments
As announced on May 4th 2017, Coca-Cola FEMSA merged with POA Eagle S.A. de C.V., a Mexican company owned by the
sellers of Vonpar. As a result of this merger, POA Eagle shareholders received approximately 27.9 million newly issued KOF
series L shares. After this transaction, total outstanding shares are 2,100.8 million.
The Venezuelan Central Bank announced on May 23rd changes to the exchange rate system known as DICOM. Due to these
changes, we translated into Mexican pesos our Venezuelan results using the DICOM exchange rate published on June 30th,
2017 of 2,640.00 Bolivars per US dollar.
As described in Item 4, information on the company - Regulation section of our 2016 Form 20-F Annual Report, our
Colombian subsidiary was holding conciliatory hearings with the Water and Sewerage Company of the City of Bogota
(“WSC”), seeking to reach an agreement to settle an administrative proceeding related to the calculation of public sewer
service charges. On June 6th 2017, our subsidiary in Colombia, agreed to execute a settlement agreement with WSC,
committing to pay to this entity an approximate amount of USD$11 million, including interest. This payment is subject to the
approval of the settlement agreement by the Highest Administrative Tribunal. Meanwhile, we have been registering a provision
in the other operative expenses line.
On June 29th, Coca-Cola FEMSA issued two tranches of Mexican peso-denominated bonds or “Certificados Bursátiles” in the
Mexican market. The tranches were Ps. 8.5 billion in a 10 year bond at a fixed rate of 7.87% and Ps. 1.5 billion in a 5 year
bond at a variable rate of TIIE+0.25%. Proceeds of this issuance will be used to partially refinance its 2.375% USD Notes due
in 2018.
Heineken, through a letter dated July 3rd, 2017, informed its decision to terminate, effective October 31, 2017, the commercial
relationship for the distribution of its products, with the bottlers of the Coca-Cola system in Brazil. We are currently studying
the implementation of possible actions; and in the meantime we are looking for a constructive dialogue with Heineken.
Conference Call Information
Our second quarter 2017 conference call will be held on July 24, 2017, at 12:00 P.M. Eastern Time (11:00 A.M. Mexico City Time). To
participate in the conference call, please dial: Domestic U.S.: 888-397-5338 or International: 719-325-2123. Participant code: 1479969.
We invite investors to listen to the live audio cast of the conference call on the Company’s website, www.coca-colafemsa.com. If you
are unable to participate live, the conference call audio will be available at www.coca-colafemsa.com.
Mexican Stock Exchange Quarterly Filing
Coca-Cola FEMSA encourages the reader to refer to our quarterly filing to the Mexican Stock Exchange (Bolsa Mexicana de Valores or
BMV) for more detailed information. This filing contains a detailed cash flow statement and selected notes to the financial statements,
including segment information. This filing is available at www.bmv.com.mx in the Información Financiera section for Coca-Cola FEMSA
(KOF) and in our corporate website at www.coca-colafemsa.com/inversionistas/registros-bmv.

Press Release 2Q 2017 July 24, 2017
Page 11
Additional Information
This news release may contain forward-looking statements concerning Coca-Cola FEMSA’s future performance, which should be
considered as good faith estimates by Coca-Cola FEMSA. These forward-looking statements reflect management’s expectations and
are based upon currently available data. Actual results are subject to future events and uncertainties, many of which are outside Coca-
Cola FEMSA’s control, which could materially impact the Company’s actual performance. References herein to “US$” are to United
States dollars. This news release contains translations of certain Mexican peso amounts into U.S. dollars for the convenience of the
reader. These translations should not be construed as representations that Mexican peso amounts actually represent such U.S. dollar
amounts or could be converted into U.S. dollars at the rate indicated.
All the financial information presented in this report was prepared under International Financial Reporting Standards (IFRS).
In an effort to provide our readers with a more useful representation of our company's underlying financial and operating performance
we are including the term “Comparable”. This means, with respect to a year-over-year comparison, the change in a given measure
excluding the effects of (i) mergers, acquisitions and divestitures, (ii) translation effects resulting from exchange rate movements, (iii)
the results of hyperinflationary economies in both periods, and (iv) includes the results of Coca-Cola FEMSA Philippines Inc., as if the
consolidation had taken place at the beginning of first quarter 2016. Currently, the only operation that qualifies as a hyperinflationary
economy is Venezuela. In preparing this measure, management has used its best judgment, estimates and assumptions in order to
maintain comparability.
As a result of newly issued KOF L shares, Earnings per share for the quarter were computed based on 2,090.4 million shares as the
weighted average of the Company’s outstanding shares over the period. For year to date, weighted average outstanding shares were
2,081.7 million. At the end of June, total outstanding shares are 2,100.8 million shares (each ADS represents 10 local shares).
For reporting purposes, all corporate expenses, including the equity method recorded from our stake of the results of Coca-Cola
FEMSA Philippines, Inc., were included in the results of the Mexico and Central America division. Starting on February 2013 and
ending on January 2017 we incorporated our stake of the results of Coca-Cola FEMSA Philippines, Inc. through the equity method.
About the Company
Stock listing information: Mexican Stock Exchange, Ticker: KOFL | NYSE (ADR), Ticker: KOF | Ratio of KOF L to KOF = 10:1
Coca-Cola FEMSA, S.A.B. de C.V. is the largest franchise bottler in the world by sales volume. The company produces and distributes
trademark beverages of The Coca-Cola Company, offering a wide portfolio of 154 brands to more than 375 million consumers daily.
With over 100 thousand employees, the company markets and sells approximately 4 billion unit cases through 2.8 million points of sale
a year. Operating 66 manufacturing plants and 328 distribution centers, Coca-Cola FEMSA is committed to generating economic,
social, and environmental value for all of its stakeholders across the value chain. The company is a member of the Dow Jones
Sustainability Emerging Markets Index, FTSE4Good Emerging Index, and the Mexican Stock Exchange’s IPC and Social
Responsibility and Sustainability Indices, among other indexes. Its operations encompass franchise territories in Mexico, Brazil,
Colombia, Argentina, and Guatemala and, nationwide, in the Philippines, Venezuela, Nicaragua, Costa Rica, and Panama. For more
information, please visit www.coca-colafemsa.com.
For additional information or inquiries contact the Investor Relations team:
Maria Dyla Castro | [email protected] | (5255) 1519-5186
Jorge Collazo | [email protected] | (5255) 1519-5218
Tania Ramírez | [email protected] | (5255) 1519-5013
(7 pages of tables to follow)

Press Release 2Q 2017 July 24, 2017
Page 12
Quarter - Consolidated Income StatementExpressed in millions of Mexican pesos
(1)
2Q 17 % Rev 2Q 16 % RevD %
Reported
D %
Comparable (8)
Transactions (million transactions) 6,690.2 5,010.2 33.5% -3.9%
Volume (million unit cases) (2) 995.0 843.3 18.0% -2.4%
Average price per unit case (2) 47.89 45.45 5.4%
Net revenues 50,049 39,843 25.6%
Other operating revenues 59 96 -38.7%
Total revenues (3) 50,108 100.0% 39,939 100.0% 25.5% 1.9%
Cost of goods sold 27,282 54.4% 21,495 53.8% 26.9%
Gross profit 22,825 45.6% 18,444 46.2% 23.8% 3.8%
Operating expenses 16,168 32.3% 12,629 31.6% 28.0%
Other operative expenses, net 132 0.3% 21 0.1% 527.1%
Operative equity method (gain) loss in associates(4) 35 0.1% (211) -0.5% -116.4%
Operating income (5) 6,491 13.0% 6,004 15.0% 8.1% 0.0%
Other non operative expenses, net 1,330 2.7% 492 1.2% 170.3%
Non Operative equity method (gain) loss in associates(6) 11 0.0% (34) -0.1% -131.6%
Interest expense 2,128 1,826 16.5%
Interest income 182 144 26.4%
Interest expense, net 1,946 1,683 15.6%
Foreign exchange loss (gain) (139) 1,241 -111.2%
Loss (gain) on monetary position in inflationary subsidiries (178) (158) 12.7%
Market value (gain) loss on financial instruments 82 (115) -171.5%
Comprehensive financing result 1,711 2,651 -35.5%
Income before taxes 3,439 2,894 18.8%
Income taxes 850 752 13.0%
Consolidated net income 2,589 2,142 20.9%
Net income attributable to equity holders of the company 2,229 4.4% 2,001 5.0% 11.4%
Non-controlling interest 360 141 155.3%
Operating income (5) 6,491 13.0% 6,004 15.0% 8.1%
Depreciation 2,477 1,718 44.2%
Amortization and other operative non-cash charges 802 369 117.2%
Operating cash flow (5)(7) 9,770 19.5% 8,091 20.3% 20.7% 1.3%
CAPEX 2,539 2,555
(1) Except volume and average price per unit case figures.
(2) Sales volume and average price per unit case exclude beer results.
(4) Includes equity method in Jugos del Valle, Leao Alimentos, Estrella Azul, among others. For the 2Q16 includes Coca-Cola FEMSA Philippines, Inc.
(5) The operating income and operative cash flow lines are presented as non-gaap measures for the convenience of the reader.
(6) Includes equity method in PIASA, IEQSA, Beta San Miguel, IMER and KSP Participacoes among others.
(7) Operative cash flow = operating income + depreciation, amortization & other operative non-cash charges.
(3) Includes total revenues of Ps. 21,419 million from our Mexican operation, Ps. 12,237 million from our Brazilian operation, Ps. 3,462 million from our Colombian operation, and Ps. 3,022 million from our Argentine
operation for the second quarter of 2017; and Ps. 19,899 million from our Mexican operation, Ps. 9,264 million from our Brazilian operation, Ps. 3,522 from our Colombian operation, and Ps. 2,551 million from our
Argentine operation for the same period of the previous year. Total Revenues includes Beer revenues in Brazil of Ps. 2,402.1 million for the first quarter of 2017 and Ps. 1,513 million for the same period of the previous year.
(8) Comparable means, with respect to a year-over-year comparison, the change in a given measure excluding the effects of (i) mergers, acquisitions and divestitures, (ii) translation effects resulting from exchange rate
movements (iii) the results of hyperinflationary economies in both periods, and (iv) includes the results of Coca-Cola FEMSA Philippines Inc, as if the consolidation had taken place at the beginning of first quarter 2016. From
our operations, only Venezuela qualifies as a hyperinflationary economy.
Press Release 2Q 2017 July 24, 2017
Page 13
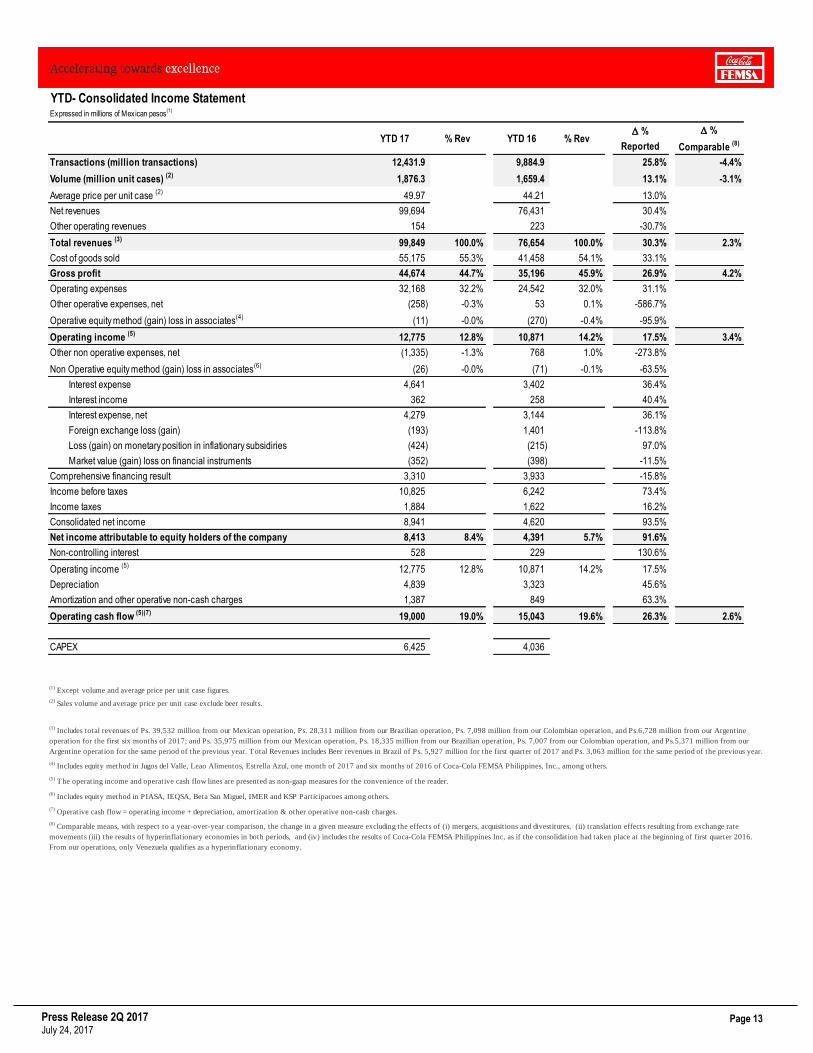
YTD- Consolidated Income StatementExpressed in millions of Mexican pesos
(1)
YTD 17 % Rev YTD 16 % RevD %
Reported
D %
Comparable (8)
Transactions (million transactions) 12,431.9 9,884.9 25.8% -4.4%
Volume (million unit cases) (2) 1,876.3 1,659.4 13.1% -3.1%
Average price per unit case (2) 49.97 44.21 13.0%
Net revenues 99,694 76,431 30.4%
Other operating revenues 154 223 -30.7%
Total revenues (3) 99,849 100.0% 76,654 100.0% 30.3% 2.3%
Cost of goods sold 55,175 55.3% 41,458 54.1% 33.1%
Gross profit 44,674 44.7% 35,196 45.9% 26.9% 4.2%
Operating expenses 32,168 32.2% 24,542 32.0% 31.1%
Other operative expenses, net (258) -0.3% 53 0.1% -586.7%
Operative equity method (gain) loss in associates(4) (11) -0.0% (270) -0.4% -95.9%
Operating income (5) 12,775 12.8% 10,871 14.2% 17.5% 3.4%
Other non operative expenses, net (1,335) -1.3% 768 1.0% -273.8%
Non Operative equity method (gain) loss in associates(6) (26) -0.0% (71) -0.1% -63.5%
Interest expense 4,641 3,402 36.4%
Interest income 362 258 40.4%
Interest expense, net 4,279 3,144 36.1%
Foreign exchange loss (gain) (193) 1,401 -113.8%
Loss (gain) on monetary position in inflationary subsidiries (424) (215) 97.0%
Market value (gain) loss on financial instruments (352) (398) -11.5%
Comprehensive financing result 3,310 3,933 -15.8%
Income before taxes 10,825 6,242 73.4%
Income taxes 1,884 1,622 16.2%
Consolidated net income 8,941 4,620 93.5%
Net income attributable to equity holders of the company 8,413 8.4% 4,391 5.7% 91.6%
Non-controlling interest 528 229 130.6%
Operating income (5) 12,775 12.8% 10,871 14.2% 17.5%
Depreciation 4,839 3,323 45.6%
Amortization and other operative non-cash charges 1,387 849 63.3%
Operating cash flow (5)(7) 19,000 19.0% 15,043 19.6% 26.3% 2.6%
CAPEX 6,425 4,036
(1) Except volume and average price per unit case figures.
(2) Sales volume and average price per unit case exclude beer results.
(4) Includes equity method in Jugos del Valle, Leao Alimentos, Estrella Azul, one month of 2017 and six months of 2016 of Coca-Cola FEMSA Philippines, Inc., among others.
(5) The operating income and operative cash flow lines are presented as non-gaap measures for the convenience of the reader.
(6) Includes equity method in PIASA, IEQSA, Beta San Miguel, IMER and KSP Participacoes among others.
(7) Operative cash flow = operating income + depreciation, amortization & other operative non-cash charges.
(3) Includes total revenues of Ps. 39,532 million from our Mexican operation, Ps. 28,311 million from our Brazilian operation, Ps. 7,098 million from our Colombian operation, and Ps.6,728 million from our Argentine
operation for the first six months of 2017; and Ps. 35,975 million from our Mexican operation, Ps. 18,335 million from our Brazilian operation, Ps. 7,007 from our Colombian operation, and Ps.5,371 million from our
Argentine operation for the same period of the previous year. Total Revenues includes Beer revenues in Brazil of Ps. 5,927 million for the first quarter of 2017 and Ps. 3,063 million for the same period of the previous year.
(8) Comparable means, with respect to a year-over-year comparison, the change in a given measure excluding the effects of (i) mergers, acquisitions and divestitures, (ii) translation effects resulting from exchange rate
movements (iii) the results of hyperinflationary economies in both periods, and (iv) includes the results of Coca-Cola FEMSA Philippines Inc, as if the consolidation had taken place at the beginning of first quarter 2016.
From our operations, only Venezuela qualifies as a hyperinflationary economy.
Press Release 2Q 2017 July 24, 2017
Page 14
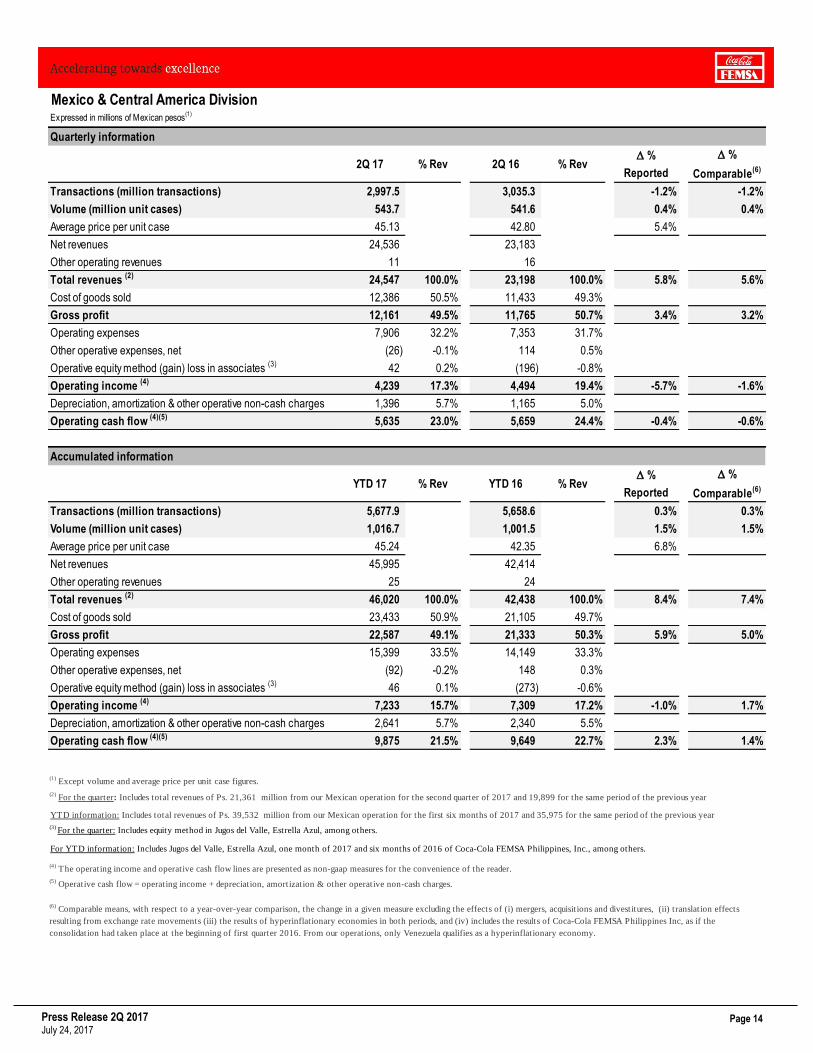
Mexico & Central America DivisionExpressed in millions of Mexican pesos
(1)
Quarterly information
2Q 17 % Rev 2Q 16 % RevD %
Reported
D %
Comparable(6)
Transactions (million transactions) 2,997.5 3,035.3 -1.2% -1.2%
Volume (million unit cases) 543.7 541.6 0.4% 0.4%
Average price per unit case 45.13 42.80 5.4%
Net revenues 24,536 23,183
Other operating revenues 11 16
Total revenues (2) 24,547 100.0% 23,198 100.0% 5.8% 5.6%
Cost of goods sold 12,386 50.5% 11,433 49.3%
Gross profit 12,161 49.5% 11,765 50.7% 3.4% 3.2%
Operating expenses 7,906 32.2% 7,353 31.7%
Other operative expenses, net (26) -0.1% 114 0.5%
Operative equity method (gain) loss in associates (3) 42 0.2% (196) -0.8%
Operating income (4)
4,239 17.3% 4,494 19.4% -5.7% -1.6%
Depreciation, amortization & other operative non-cash charges 1,396 5.7% 1,165 5.0%
Operating cash flow (4)(5) 5,635 23.0% 5,659 24.4% -0.4% -0.6%
Accumulated information
YTD 17 % Rev YTD 16 % RevD %
Reported
D %
Comparable(6)
Transactions (million transactions) 5,677.9 5,658.6 0.3% 0.3%
Volume (million unit cases) 1,016.7 1,001.5 1.5% 1.5%
Average price per unit case 45.24 42.35 6.8%
Net revenues 45,995 42,414
Other operating revenues 25 24
Total revenues (2) 46,020 100.0% 42,438 100.0% 8.4% 7.4%
Cost of goods sold 23,433 50.9% 21,105 49.7%
Gross profit 22,587 49.1% 21,333 50.3% 5.9% 5.0%
Operating expenses 15,399 33.5% 14,149 33.3%
Other operative expenses, net (92) -0.2% 148 0.3%
Operative equity method (gain) loss in associates (3) 46 0.1% (273) -0.6%
Operating income (4) 7,233 15.7% 7,309 17.2% -1.0% 1.7%
Depreciation, amortization & other operative non-cash charges 2,641 5.7% 2,340 5.5%
Operating cash flow (4)(5) 9,875 21.5% 9,649 22.7% 2.3% 1.4%
(1) Except volume and average price per unit case figures.
(2) For the quarter: Includes total revenues of Ps. 21,361 million from our Mexican operation for the second quarter of 2017 and 19,899 for the same period of the previous year
YTD information: Includes total revenues of Ps. 39,532 million from our Mexican operation for the first six months of 2017 and 35,975 for the same period of the previous year
(4) The operating income and operative cash flow lines are presented as non-gaap measures for the convenience of the reader.
(5) Operative cash flow = operating income + depreciation, amortization & other operative non-cash charges.
(6) Comparable means, with respect to a year-over-year comparison, the change in a given measure excluding the effects of (i) mergers, acquisitions and divestitures, (ii) translation effects
resulting from exchange rate movements (iii) the results of hyperinflationary economies in both periods, and (iv) includes the results of Coca-Cola FEMSA Philippines Inc, as if the
consolidation had taken place at the beginning of first quarter 2016. From our operations, only Venezuela qualifies as a hyperinflationary economy.
(3) For the quarter: Includes equity method in Jugos del Valle, Estrella Azul, among others.
For YTD information: Includes Jugos del Valle, Estrella Azul, one month of 2017 and six months of 2016 of Coca-Cola FEMSA Philippines, Inc., among others.

Press Release 2Q 2017 July 24, 2017
Page 15
South America DivisionExpressed in millions of Mexican pesos
(1)
Quarterly information
2Q 17 % Rev 2Q 16 % RevD %
Reported
D %
Comparable(7)
Transactions (million transactions) 1,912.2 1,974.8 -3.2% -9.5%
Volume (million unit cases) (2) 290.8 301.7 -3.7% -9.0%
Average price per unit case (2)
59.12 50.20 17.8%
Net revenues 19,595 16,660
Other operating revenues 48 80
Total revenues (3) 19,643 100.0% 16,740 100.0% 17.3% -1.0%
Cost of goods sold 11,369 57.9% 10,061 60.1%
Gross profit 8,274 42.1% 6,679 39.9% 23.9% 7.4%
Operating expenses 6,415 32.7% 5,276 31.5%
Other operative expenses, net 154 0.8% (93) -0.6%
Operative equity method (gain) loss in associates (4) (8) -0.0% (15) -0.1%
Operating income (5) 1,712 8.7% 1,510 9.0% 13.4% -1.0%
Depreciation, amortization & other operative non-cash charges 1,363 6.9% 922 5.5%
Operating cash flow (5)(6) 3,076 15.7% 2,432 14.5% 26.5% 3.9%
Accumulated information
YTD 2017 % Ing YTD 16 % RevD %
Reported
D %
Comparable(7)
Transactions (million transactions) 3,929.0 4,226.3 -7.0% -12.3%
Volume (million unit cases) (2) 606.7 657.8 -7.8% -12.0%
Average price per unit case (2) 63.05 47.05 34.0%
Net revenues 44,181 34,017
Other operating revenues 129 199
Total revenues (3)
44,311 100.0% 34,216 100.0% 29.5% -1.3%
Cost of goods sold 26,057 58.8% 20,352 59.5%
Gross profit 18,254 41.2% 13,864 40.5% 31.7% 4.8%
Operating expenses 13,719 31.0% 10,393 30.4%
Other operative expenses, net (181) -0.4% (95) -0.3%
Operative equity method (gain) loss in associates (4) (57) -0.1% 3 0.0%
Operating income (5) 4,773 10.8% 3,562 10.4% 34.0% 3.2%
Depreciation, amortization & other operative non-cash charges 2,694 6.1% 1,832 5.4%
Operating cash flow (5)(6) 7,467 16.9% 5,394 15.8% 38.4% 3.0%
(1) Except volume and average price per unit case figures.
(2) Sales volume and average price per unit case exclude beer results.
(4) Includes equity method in Leao Alimentos, among others.
(5) The operating income and operative cash flow lines are presented as non-gaap measures for the convenience of the reader.
(6) Operative cash flow = operating income + depreciation, amortization & other operative non-cash charges.
(7) Comparable means, with respect to a year-over-year comparison, the change in a given measure excluding the effects of (i) mergers, acquisitions and divestitures, (ii) translation effects resulting from
exchange rate movements (iii) the results of hyperinflationary economies in both periods, and (iv) includes the results of Coca-Cola FEMSA Philippines Inc, as if the consolidation had taken place at the
beginning of first quarter 2016. From our operations, only Venezuela qualifies as a hyperinflationary economy.
YTD information: Includes total revenues of Ps. 28,311 million from our Brazilian operation, Ps. 7,098 million from our Colombian operation, and Ps. 6,728 million from our Argentine operation for the first
six months of 2017; and Ps. 18,335 million from our Brazilian operation, Ps. 7,007 from our Colombian operation, and Ps. 5,371 million from our Argentine operation for the same period of the previous
year. Total Revenues includes Beer revenues in Brazil of Ps. 5,927 million for the second quarter of 2017 and Ps. 3,063 million for the same period of the previous year.
(3) Quarter information: Includes total revenues of Ps. 12,237 million from our Brazilian operation, Ps. 3,463 million from our Colombian operation, and Ps. 3,022 million from our Argentine operation for the
second quarter of 2017; and Ps. 9,264 million from our Brazilian operation, Ps. 3,522 from our Colombian operation, and Ps. 2,551 million from our Argentine operation for the same period of the previous
year. Total Revenues includes Beer revenues in Brazil of Ps. 2,402 million for the second quarter of 2017 and Ps. 1,514 million for the same period of the previous year.

Press Release 2Q 2017 July 24, 2017
Page 16
Venezuela OperationExpressed in millions of Mexican pesos
(1)
Quarterly information
2Q 17 % Rev 2Q 16 % RevD %
Reported
Transactions (million transactions) 98.8 174.7 -43.4%
Volume (million unit cases) 13.3 33.6 -60.4%
Average price per unit case 69.22 41.77 65.7%
Net revenues 921 1,403
Other operating revenues 0 0
Total revenues 921 100.0% 1,403 100.0% -34.4%
Cost of goods sold 783 85.0% 996 71.0%
Gross profit 138 15.0% 407 29.0% -66.1%
Operating expenses 508 55.2% 529 37.7%
Other operative expenses, net (20) -2.2% (28) -2.0%
Operating income (350) -38.0% (94) -6.7% 272.1%
Depreciation, amortization & other operative non-cash charges 424 46.0% 197 14.0%
Operating cash flow (2) 74 8.1% 103 7.3% -28.0%
Accumulated information
Acumulado
2017% Rev YTD 16 % Rev
D %
Reported
Transactions (million transactions) 188.8 440.2 -57.1%
Volume (million unit cases) 25.9 84.3 -69.3%
Average price per unit case 83.91 41.55 101.9%
Net revenues 2,173 3,503
Other operating revenues 0 0
Total revenues 2,173 100.0% 3,503 100.0% -38.0%
Cost of goods sold 1,687 77.6% 2,199 62.8%
Gross profit 486 22.4% 1,305 37.3% -62.8%
Operating expenses 1,008 46.4% 1,195 34.1%
Other operative expenses, net (21) -1.0% (22) -0.6%
Operating income (501) -23.0% 132 3.8% -479.3%
Depreciation, amortization & other operative non-cash charges 825 38.0% 407 11.6%
Operating cash flow (2) 324 14.9% 538 15.4% -39.7%
(1) Except volume and average price per unit case figures.
(2) Operative cash flow = operating income + depreciation, amortization & other operative non-cash charges.

Press Release 2Q 2017 July 24, 2017
Page 17
Asia DivisionExpressed in millions of Mexican pesos
(1)
Quarterly information
2Q 17 % RevD %
Comparable (4)
Transactions (million transactions) 1,780.5 -2.7%
Volume (million unit cases) 160.5 -1.1%
Average price per unit case 36.87
Net revenues 5,917
Other operating revenues 0
Total revenues 5,917 100.0% -3.9%
Cost of goods sold 3,527 59.6%
Gross profit 2,390 40.4% -2.7%
Operating expenses 1,847 31.2%
Other operative expenses, net 3 0.1%
Operating income 540 9.1% 18.7%
Depreciation, amortization & other operative non-cash charges 519 8.8%
Operating cash flow (3) 1,059 17.9% 5.1%
Accumulated information
YTD 2017 (2) % RevD %
Comparable (4)
Transactions (million transactions) 2,825.1 -3.6%
Volume (million unit cases) 252.8 -1.8%
Average price per unit case 37.65
Net revenues 9,518
Other operating revenues 0
Total revenues 9,518 100.0% -5.1%
Cost of goods sold 5,685 59.7%
Gross profit 3,833 40.3% -1.6%
Operating expenses 3,050 32.0%
Other operative expenses, net 15 0.2%
Operating income 768 8.1% 23.1%
Depreciation, amortization & other operative non-cash charges 890 9.4%
Operating cash flow (3) 1,658 17.4% 7.8%
(1) Except volume and average price per unit case figures.
(2) YTD Includes the results of February to June
(3) Operative cash flow = operating income + depreciation, amortization & other operative non-cash charges.
(4) Comparable means, with respect to a year-over-year comparison, the change in a given measure excluding the effects of (i) mergers, acquisitions and
divestitures, (ii) translation effects resulting from exchange rate movements (iii) the results of hyperinflationary economies in both periods, and (iv)
includes the results of Coca-Cola FEMSA Philippines Inc, as if the consolidation had taken place at the beginning of first quarter 2016. From our
operations, only Venezuela qualifies as a hyperinflationary economy.

Press Release 2Q 2017 July 24, 2017
Page 18
Consolidated Balance SheetExpressed in millions of Mexican pesos.
Jun-17 Dec-16
Assets
Current Assets
Cash, cash equivalents and marketable securities Ps. 24,155 Ps. 10,476
Total accounts receivable 10,444 15,005
Inventories 10,962 10,744
Other current assets 9,536 9,229
Total current assets 55,097 45,454
Property, plant and equipment
Property, plant and equipment 116,179 106,696
Accumulated depreciation (44,750) (41,408)
Total property, plant and equipment, net 71,429 65,288
Investment in shares 10,989 22,357
Intangibles assets and other assets 119,298 123,964
Other non-current assets 18,381 22,194
Total Assets Ps. 275,194 Ps. 279,256
Liabilities and Equity
Current Liabilities
Short-term bank loans and notes payable Ps. 2,050 Ps. 3,052
Suppliers 18,223 21,489
Other current liabilities 18,694 15,327
Total current liabilities 38,968 39,868
Long-term bank loans and notes payable 85,545 85,857
Other long-term liabilities 22,951 24,298
Total liabilities 147,464 150,023
Equity
Non-controlling interest 15,742 7,096
Total controlling interest 111,988 122,137
Total equity 127,730 129,233
Total Liabilities and Equity Ps. 275,194 Ps. 279,256
Press Release 2Q 2017 July 24, 2017
Page 19
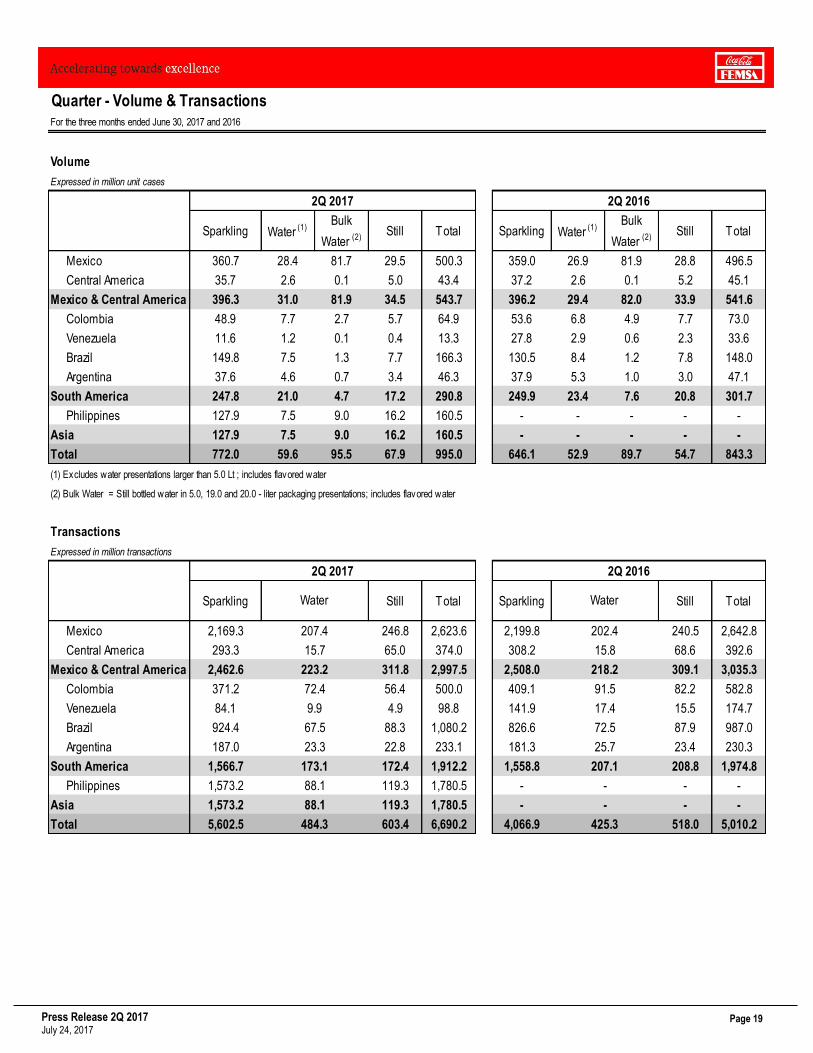
Quarter - Volume & TransactionsFor the three months ended June 30, 2017 and 2016
Volume
Expressed in million unit cases
Sparkling Water (1)Bulk
Water (2)Still Total Sparkling Water (1)
Bulk
Water (2)Still Total
Mexico 360.7 28.4 81.7 29.5 500.3 359.0 26.9 81.9 28.8 496.5
Central America 35.7 2.6 0.1 5.0 43.4 37.2 2.6 0.1 5.2 45.1
Mexico & Central America 396.3 31.0 81.9 34.5 543.7 396.2 29.4 82.0 33.9 541.6
Colombia 48.9 7.7 2.7 5.7 64.9 53.6 6.8 4.9 7.7 73.0
Venezuela 11.6 1.2 0.1 0.4 13.3 27.8 2.9 0.6 2.3 33.6
Brazil 149.8 7.5 1.3 7.7 166.3 130.5 8.4 1.2 7.8 148.0
Argentina 37.6 4.6 0.7 3.4 46.3 37.9 5.3 1.0 3.0 47.1
South America 247.8 21.0 4.7 17.2 290.8 249.9 23.4 7.6 20.8 301.7
Philippines 127.9 7.5 9.0 16.2 160.5 - - - - -
Asia 127.9 7.5 9.0 16.2 160.5 - - - - -
Total 772.0 59.6 95.5 67.9 995.0 646.1 52.9 89.7 54.7 843.3
(1) Excludes water presentations larger than 5.0 Lt ; includes flavored water
(2) Bulk Water = Still bottled water in 5.0, 19.0 and 20.0 - liter packaging presentations; includes flavored water
Transactions
Expressed in million transactions
Sparkling Still Total Sparkling Still Total
Mexico 2,169.3 246.8 2,623.6 2,199.8 240.5 2,642.8
Central America 293.3 65.0 374.0 308.2 68.6 392.6
Mexico & Central America 2,462.6 311.8 2,997.5 2,508.0 309.1 3,035.3
Colombia 371.2 56.4 500.0 409.1 82.2 582.8
Venezuela 84.1 4.9 98.8 141.9 15.5 174.7
Brazil 924.4 88.3 1,080.2 826.6 87.9 987.0
Argentina 187.0 22.8 233.1 181.3 23.4 230.3
South America 1,566.7 172.4 1,912.2 1,558.8 208.8 1,974.8
Philippines 1,573.2 119.3 1,780.5 - - -
Asia 1,573.2 119.3 1,780.5 - - -
Total 5,602.5 603.4 6,690.2 4,066.9 518.0 5,010.2
23.3 25.7
173.1 207.1
484.3 425.3
88.1 -
88.1 -
72.4 91.5
9.9 17.4
67.5 72.5
207.4 202.4
15.7 15.8
223.2 218.2
2Q 2017 2Q 2016
2Q 2017 2Q 2016
Water Water
Press Release 2Q 2017 July 24, 2017
Page 20
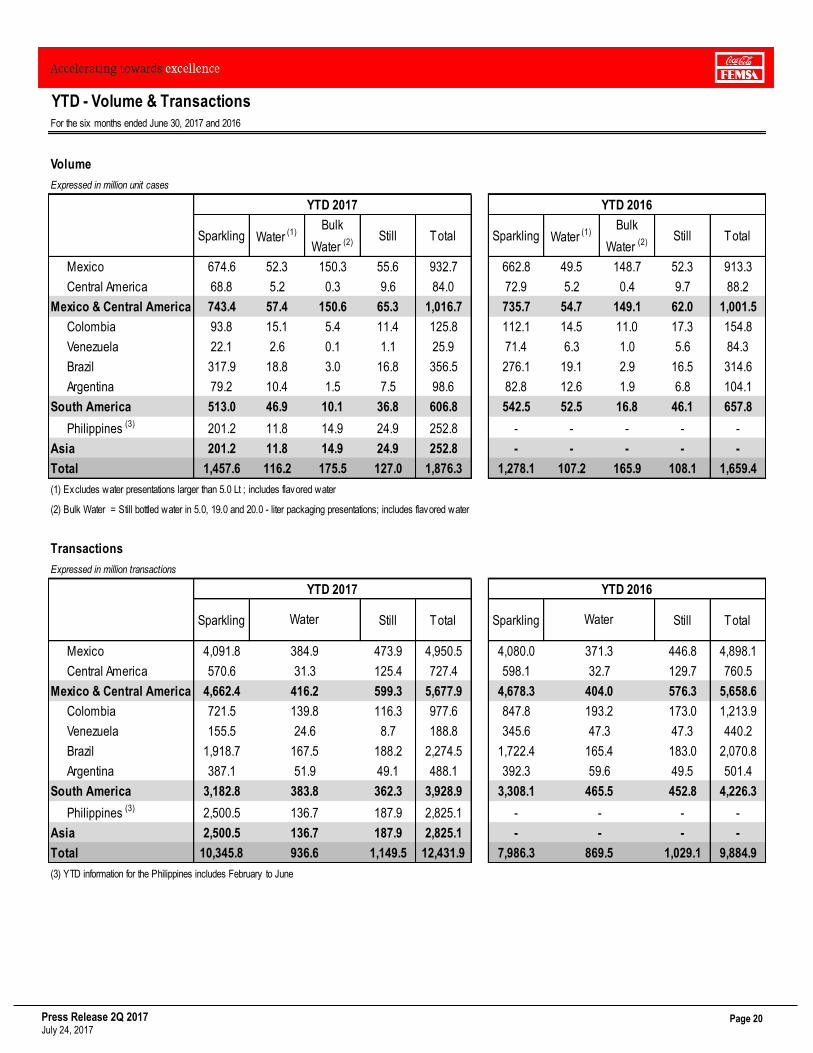
YTD - Volume & TransactionsFor the six months ended June 30, 2017 and 2016
Volume
Expressed in million unit cases
Sparkling Water (1)Bulk
Water (2)Still Total Sparkling Water (1)
Bulk
Water (2)Still Total
Mexico 674.6 52.3 150.3 55.6 932.7 662.8 49.5 148.7 52.3 913.3
Central America 68.8 5.2 0.3 9.6 84.0 72.9 5.2 0.4 9.7 88.2
Mexico & Central America 743.4 57.4 150.6 65.3 1,016.7 735.7 54.7 149.1 62.0 1,001.5
Colombia 93.8 15.1 5.4 11.4 125.8 112.1 14.5 11.0 17.3 154.8
Venezuela 22.1 2.6 0.1 1.1 25.9 71.4 6.3 1.0 5.6 84.3
Brazil 317.9 18.8 3.0 16.8 356.5 276.1 19.1 2.9 16.5 314.6
Argentina 79.2 10.4 1.5 7.5 98.6 82.8 12.6 1.9 6.8 104.1
South America 513.0 46.9 10.1 36.8 606.8 542.5 52.5 16.8 46.1 657.8
Philippines (3) 201.2 11.8 14.9 24.9 252.8 - - - - -
Asia 201.2 11.8 14.9 24.9 252.8 - - - - -
Total 1,457.6 116.2 175.5 127.0 1,876.3 1,278.1 107.2 165.9 108.1 1,659.4
(1) Excludes water presentations larger than 5.0 Lt ; includes flavored water
(2) Bulk Water = Still bottled water in 5.0, 19.0 and 20.0 - liter packaging presentations; includes flavored water
Transactions
Expressed in million transactions
Sparkling Still Total Sparkling Still Total
Mexico 4,091.8 473.9 4,950.5 4,080.0 446.8 4,898.1
Central America 570.6 125.4 727.4 598.1 129.7 760.5
Mexico & Central America 4,662.4 599.3 5,677.9 4,678.3 576.3 5,658.6
Colombia 721.5 116.3 977.6 847.8 173.0 1,213.9
Venezuela 155.5 8.7 188.8 345.6 47.3 440.2
Brazil 1,918.7 188.2 2,274.5 1,722.4 183.0 2,070.8
Argentina 387.1 49.1 488.1 392.3 49.5 501.4
South America 3,182.8 362.3 3,928.9 3,308.1 452.8 4,226.3
Philippines (3) 2,500.5 187.9 2,825.1 - - -
Asia 2,500.5 187.9 2,825.1 - - -
Total 10,345.8 1,149.5 12,431.9 7,986.3 1,029.1 9,884.9
(3) YTD information for the Philippines includes February to June
YTD 2017 YTD 2016
YTD 2017 YTD 2016
Water Water
384.9 371.3
31.3 32.7
416.2 404.0
139.8 193.2
24.6 47.3
167.5 165.4
51.9 59.6
383.8 465.5
936.6 869.5
136.7 -
136.7 -
Press Release 2Q 2017 July 24, 2017
Page 21
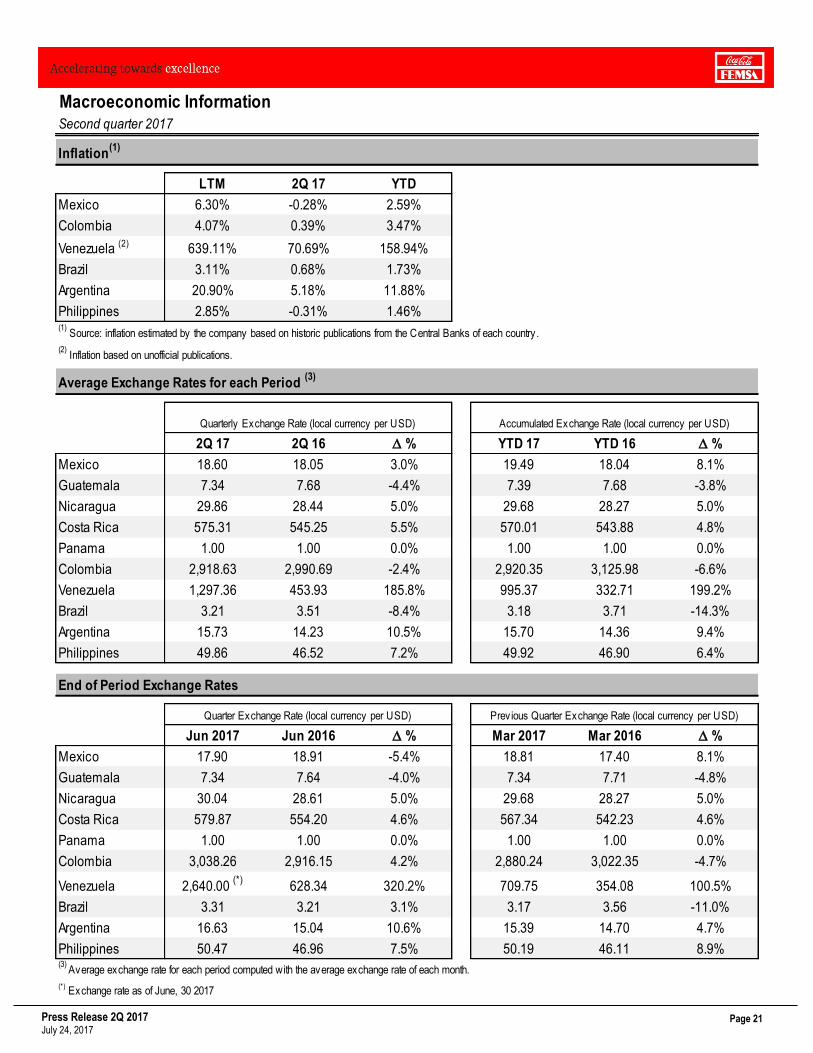
Macroeconomic Information Second quarter 2017
Inflation(1)
LTM 2Q 17 YTD
Mexico 6.30% -0.28% 2.59%
Colombia 4.07% 0.39% 3.47%
Venezuela (2) 639.11% 70.69% 158.94%
Brazil 3.11% 0.68% 1.73%
Argentina 20.90% 5.18% 11.88%
Philippines 2.85% -0.31% 1.46%(1)
Source: inflation estimated by the company based on historic publications from the Central Banks of each country .
(2) Inflation based on unofficial publications.
Average Exchange Rates for each Period (3)
2Q 17 2Q 16 D % YTD 17 YTD 16 D %
Mexico 18.60 18.05 3.0% 19.49 18.04 8.1%
Guatemala 7.34 7.68 -4.4% 7.39 7.68 -3.8%
Nicaragua 29.86 28.44 5.0% 29.68 28.27 5.0%
Costa Rica 575.31 545.25 5.5% 570.01 543.88 4.8%
Panama 1.00 1.00 0.0% 1.00 1.00 0.0%
Colombia 2,918.63 2,990.69 -2.4% 2,920.35 3,125.98 -6.6%
Venezuela 1,297.36 453.93 185.8% 995.37 332.71 199.2%
Brazil 3.21 3.51 -8.4% 3.18 3.71 -14.3%
Argentina 15.73 14.23 10.5% 15.70 14.36 9.4%
Philippines 49.86 46.52 7.2% 49.92 46.90 6.4%
End of Period Exchange Rates
Jun 2017 Jun 2016 D % Mar 2017 Mar 2016 D %
Mexico 17.90 18.91 -5.4% 18.81 17.40 8.1%
Guatemala 7.34 7.64 -4.0% 7.34 7.71 -4.8%
Nicaragua 30.04 28.61 5.0% 29.68 28.27 5.0%
Costa Rica 579.87 554.20 4.6% 567.34 542.23 4.6%
Panama 1.00 1.00 0.0% 1.00 1.00 0.0%
Colombia 3,038.26 2,916.15 4.2% 2,880.24 3,022.35 -4.7%
Venezuela 2,640.00 (*)
628.34 320.2% 709.75 354.08 100.5%
Brazil 3.31 3.21 3.1% 3.17 3.56 -11.0%
Argentina 16.63 15.04 10.6% 15.39 14.70 4.7%
Philippines 50.47 46.96 7.5% 50.19 46.11 8.9%(3)
Average exchange rate for each period computed with the average exchange rate of each month.
(*) Exchange rate as of June, 30 2017
Quarterly Exchange Rate (local currency per USD) Accumulated Exchange Rate (local currency per USD)
Quarter Exchange Rate (local currency per USD) Previous Quarter Exchange Rate (local currency per USD)