Embed Size (px)
Citation preview
Operating and
Financial Results
for the six months
ended 30 June 2016
25 August 2016
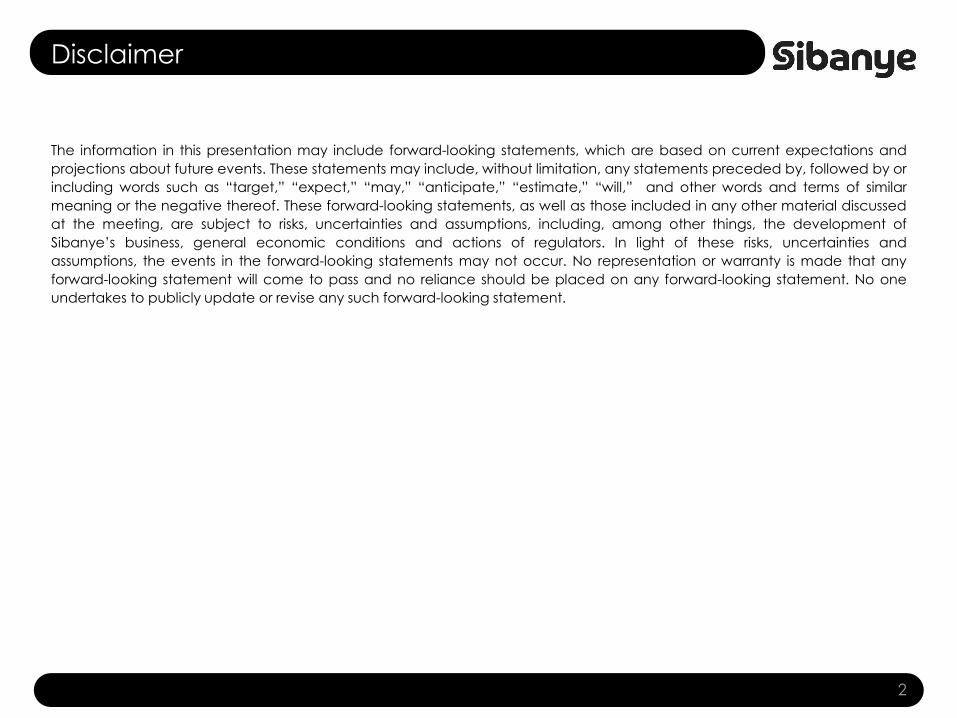
Disclaimer
The information in this presentation may include forward-looking statements, which are based on current expectations and
projections about future events. These statements may include, without limitation, any statements preceded by, followed by or
including words such as “target,” “expect,” “may,” “anticipate,” “estimate,” “will,” and other words and terms of similar
meaning or the negative thereof. These forward-looking statements, as well as those included in any other material discussed
at the meeting, are subject to risks, uncertainties and assumptions, including, among other things, the development of
Sibanye’s business, general economic conditions and actions of regulators. In light of these risks, uncertainties and
assumptions, the events in the forward-looking statements may not occur. No representation or warranty is made that any
forward-looking statement will come to pass and no reliance should be placed on any forward-looking statement. No one
undertakes to publicly update or revise any such forward-looking statement.
2

Agenda
1. Group Overview
2. Operational Review - Gold and Platinum Divisions
3. Financial Review
4. Conclusion
5. Questions
3

Group
Overview
4

Safety remains our number one priority
• Disappointing regression in the safety performance of the Gold Division requires
decisive action and has resulted in a review of Sibanye’s safety strategy
• Peter Turner has been appointed SVP: Safety, Health and Environment for the
group
• Sibanye is engaging with all stakeholders to jointly address the regression in
safety
• The regression in the safety performance of the Gold Division impacted
negatively on its potential
5Taking decisive action to improve safety

Section 54’s
• SA mining sector safety performance has regressed YoY and must improve
• Where necessary, management will, and does, stop unsafe working places, without
intervention from DMR
• Use of S54 stoppages where appropriate are respected
• However S54 stoppages are not always administered consistently, or in a manner
which will result in improved safety towards the goal of zero harm
• Industry, CoM and Sibanye are engaging with the DMR on the matter - a resolution
will require special leadership from industry, DMR and all other stakeholders
• What is required is to implement safety stoppages such that safety continues to
improve, while also reducing impact on operations
• Recent engagement with Minister of Mineral Resources constructive but greater
alignment across the board is required
6

Salient features*
7Solid operational performance supports increased dividend
• Operational performance:
– Gold production 5% higher to 23 229kg (746 800oz)
– Record attributable PGM (4E) production of 92 773oz for the June quarter
• Costs well managed
– AISC of R448 922/kg increased by 3%
• Operating profit 128% higher at R5.4 billion (US$350 million)
15
20
25
30
35
40
45
2 000
4 000
6 000
H1 2013 H2 2013 H1 2014 H2 2014 H1 2015 H2 2015 H1 2016
%
R m
illio
n
Sibanye operating profit and margin
Gold operating profit (Rm) Platinum operating profit (Rm) Group operating margin (%)
*for the six months ended 30 June 2016 relative to six months ended 30 June 2015

Maintaining operational efficiency and focus
• Risk of operational complacency
– Increased commodity prices and margins
– Significant phantom share scheme payouts to middle management
• Renewed focus on efficiencies and cost management
– Further Gold Division mining unit consolidation
– Capitalising on the higher than expected gold price through incremental mining initiatives
– Continuously driving productivity and efficiency improvements
– Closure of loss making production business units that are being cross-subsidised
– Ensuring platinum synergies are being realised
8
*30 June 2015 to 30 June 2016
Not falling prey to the “Eldorado syndrome”

Relative metal price performance
9Dollar prices improving – strong rand a headwind
Source: iNet as at 11 August 2016
-40
-30
-20
-10
0
10
20
30
40
50
60
Re
lative
pric
e p
erf
orm
an
ce
(%
)
Gold (US$/oz) Gold (R/kg) PGM (R/oz) PGM (US$/oz)

1 2831 205 1 222
1 1931 126 1 106
1 182
1 260
600
700
800
900
1 000
1 100
1 200
1 300
1 400
US$
/oz
Sibanye costs and revenue (US$/oz)
Total cash cost - US$/oz Sustaining capital - US$/oz Gold price - US$/oz
1 116
1 014
1 242
1 0541 007
882 895922
Operationally leveraged to US$ gold price and rand
10Gold division operating margins maintained
* 2016 exchange rate of R15.00:US$
442 255 433 973
459 564462 891
470 349
505 094
600 267 606 379
250 000
350 000
450 000
550 000
650 000
R/k
g
Sibanye costs and revenue (R/kg)
Total cash cost - R/kg Sustaining capital - R/kg Gold price - R/kg
384 877365 076
467 302 409 027 420 811 402 797
454 282 443 912
AISC margin

Competitive global cost position maintained
11• Favourably positioned on the cost curveFavourably positioned on the cost curve
650
700
750
800
850
900
950
1000
1050
1100
1150
US$/o
z
H1 2016 reported AISC
Source: Company releases, Qinisele Resources Research

Salient features* continued
12Robust and flexible financial position
• Strong Balance Sheet despite net debt increasing to R4.4bn due to the
Aquarius acquisition, with Net Debt:EBITDA of 0.41x
• Stability agreement with unions – 3 year 2015 wage agreement secured
• Interim dividend for 2016 of 85 cps – R785 million
*For the six months ended 30 June 2016 relative to six months ended 30 June 2015
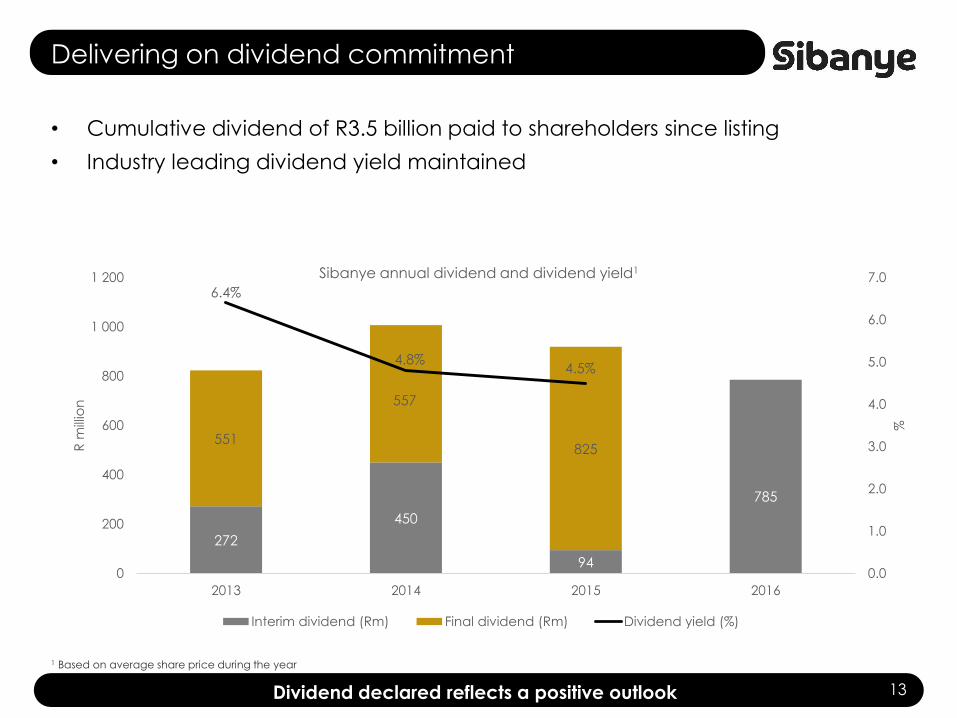
Delivering on dividend commitment
• Cumulative dividend of R3.5 billion paid to shareholders since listing
• Industry leading dividend yield maintained
Dividend declared reflects a positive outlook
1 Based on average share price during the year
13
272
450
94
785
551
557
825
6.4%
4.8%4.5%
0.0
1.0
2.0
3.0
4.0
5.0
6.0
7.0
0
200
400
600
800
1 000
1 200
2013 2014 2015 2016
%
R m
illio
n
Sibanye annual dividend and dividend yield1
Interim dividend (Rm) Final dividend (Rm) Dividend yield (%)
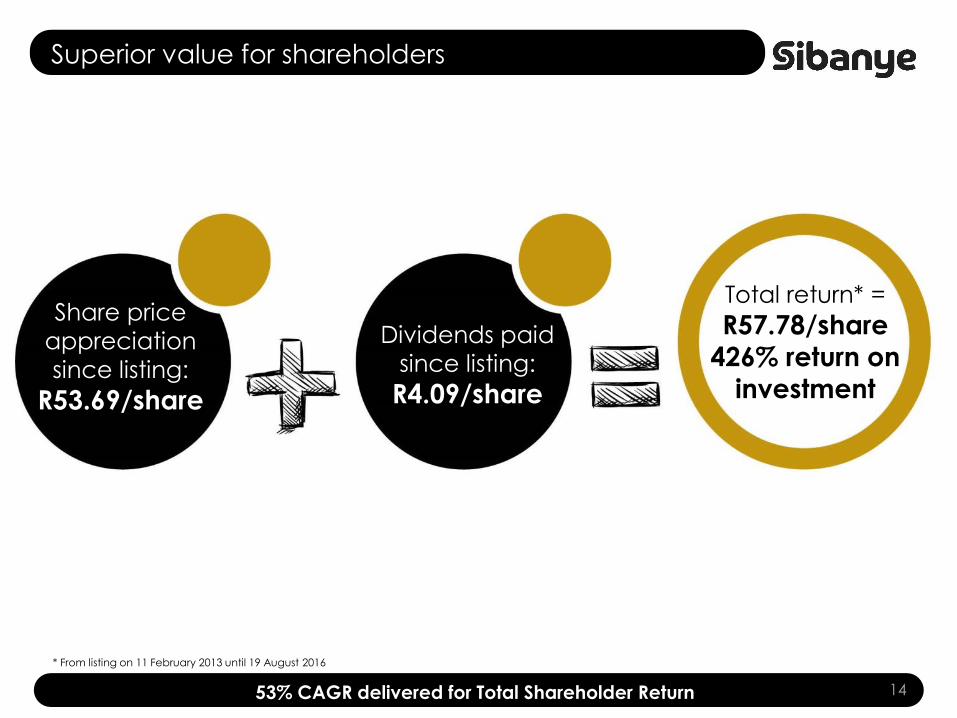
Superior value for shareholders
1453% CAGR delivered for Total Shareholder Return
Share price
appreciation
since listing:
R53.69/share
Dividends paid
since listing:
R4.09/share
Total return* =
R57.78/share
426% return on
investment
* From listing on 11 February 2013 until 19 August 2016

Value creation strategy – a changing landscape
• Sibanye investment case not
commodity specific but primary
focus is still gold and PGMs
• Fewer distressed sellers due to
corporate restructuring, deferral of
capital expenditure and recovery in
metal prices
• Increase in the number of parties
willing to transact
• But… sharp increase in share prices has resulted in less obvious value
opportunities
• Opportunities which offer cost and
operational synergies remain of
interest
15Value accretive acquisitions less prevalent
3 500
5 000
6 500
8 000
9 500
11 000
70
80
90
100
110
120
IMF non-fuel commodity index vs FTSE/JSE
General Mining Index
IMF non-fuel commodity index
FTSE/JSE General Mining index
Index Performance
IMF non-fuel
Commodity
Index
JSE FTSE
General
Mining Index
Since SGL Listing (25%) (39%)
YTD 8% 29%

Sibanye Gold
Division
Operational review

Solid operational performance
• Regression in safety performance a major concern
• Gold Division production of 23 229kg (746 800oz) - 5% higher year-on-year
• Opportunity loss of 1 268kg (40 700oz) as a result of operational disruptions
• Cooke 4 continues to underperform – Section 189 notification issued
• Operations seasonally better in second half – guidance maintained
17
1.50
1.70
1.90
2.10
2.30
2.50
2.70
2.90
3.10
0
2 000
4 000
6 000
8 000
10 000
12 000
14 000
16 000
Mar-14 June-14 Sep-14 Dec-14 Mar-15 Jun-15 Sep-15 Dec-15 Mar-16 Jun-16
g/tkg
Gold division quarterly production and yield
UG Production Surface Production Yield

Gold Division safety trends
18Good safety performance has recently regressed
0.00
0.10
0.20
0.30
FIFR – peer comparison
Sibanye Peer 1 Peer2
* Rates expressed per million man hours worked
0
5
10
15
20
LDIFR – peer comparison
Sibanye Peer 1 Peer2
11.56
6.76
4.73 5.26 5.796.90
6.13 5.876.74 7.22
0
3
6
9
12
Lost day injury frequency rate*
LDIFR Australian Benchmark
0.24
0.150.18
0.120.14
0.17
0.100.12
0.06
0.13
0.00
0.10
0.20
0.30
Fatal injury frequency rate*
FIFR US Mining Industry

Robust financial results
• Significant increase in operating profit driven by higher gold price and production
– operating profit 125% higher at R5.3bn (US$346m)
• Costs well managed, despite the impact of strike action and safety stoppages
– TCC increased 4% to R381 635/kg – down 17% in US$ terms to US$772/oz
– AISC increased 3% to R448 922/kg – down 20% in US$ terms to US$908/oz
• Organic projects at Kloof, Driefontein and Burnstone approved in 2015 – extend
Divisional LoM and offer significant gold price leverage
19
300 000
340 000
380 000
420 000
460 000
500 000
0
500
1 000
1 500
2 000
2 500
3 000
Mar-14 June-14 Sep-14 Dec-14 Mar-15 Jun-15 Sep-15 Dec-15 Mar-16 Jun-16
R/k
g
Rm
Gold Division operating profit and AISC
Operating profit AISC

Investing in organic growth
• Approval of R3.6 billion for capital growth projects given in mid-2015
• Projects fundamentally robust in lower price environment (meet 15% (real after
tax) hurdle rate at gold price of R450,000/kg)
• Significantly leveraged - at gold price of R600 000/kg NPV is approximately R7
billion with IRRs between 20% and 30%
• Organic projects offer best return with lowest risk
– well known and understood ore bodies and mining conditions
– financed from operational cash flow
– extend lives of existing operations – enhancing ROIC
20Investing in sustainable value

Gold projects
21Low risk, leveraged organic growth
Project metrics
(at R450 000/kg)Unit
Kloof 4 Below
Infrastructure
Driefontein 5
Below
Infrastructure
Burnstone
Project life Year 2015 to 2033 2015 to 2042
to 2038 (23 years
at the 3km
radius)
Project capital cost* Rm 691 1 016 1 852
Gold ounces produced** Moz 0.616 1.861 1.727
IRR (at R450 000/kg) % >15% >15% >15%
IRR (at R600 000/kg) % 21% 27% 34%
NPV (at R600 000/kg)*** Rm 1 170 2 510 3 380
* Costs in 2015 money terms as at time of the feasibility study** Reserves estimated at R450 000/kg *** Using an 8% real discount rate

LoM reserve production profiles
22Extending the operating life through value accretive investment
0
10 000
20 000
30 000
40 000
50 000
60 000
kg
Pre-feasibilities studies
undertaken
De Bron
Beisa
Pending capital approval
WRTRP
Projects in development
Burnstone
Below infrastructure projects
Kloof
Driefontein
Surface reserves in LoM
Kloof
Driefontein
Cooke
Beatrix
Underground reserves in LoM
Kloof
Driefontein
Cooke
Beatrix
Note: Project profile is based on pre-feasibility and feasibility studies as at December 2015
Based on Reserves declared as at 31 December 2015
Assumptions: Gold price: R430 000/kg, Uranium R1,455/lb (real 2015 terms)
Gold Fields plan
31 000kg (1Moz)

F2016 outlook*
23A very solid outlook
• Gold production forecast: approximately 50 000 kg (1.6Moz)
• Forecast Total cash cost: approximately R355 000/kg (US$760/oz)
• Forecast All-in sustaining cost: approximately R425 000/kg (US$910/oz)
• Forecast capital expenditure: approximately R3.9 billion (US$270 million)
* Assuming average of R14:50/US$ for F2016
Sibanye Platinum
Division
Operational review

Safety performance - our key focus
Safety a priority – trends remain positive 25
12-month
LTIFR
3-month
LTIFR
Actual Target Actual Target
Kroondal 2.57 3.00 2.55 3.00
Mimosa 1.36 0.00 0.92 0.00
Platinum Mile 0.00 0.00 0.00 0.00
0.04 0.04 0.04 0.03
0.50
0.00 0.00 0.00 0.00 0.00 0.0
0.1
0.2
0.3
0.4
0.5
0.6
Sibanye Pt − FIFR
1.82 2.00
1.61 1.64
1.99
1.18
2.29
1.14
1.58
0.40
0.0
0.5
1.0
1.5
2.0
2.5
Sibanye Pt − SIFR
4.71
3.64
2.39 2.06
3.48
2.37 2.67
2.28 1.97 2.00
0.0
1.0
2.0
3.0
4.0
5.0
Sibanye Pt − LDIFR

Good operationally but prices have the final say
• A good safety performance delivered for the June 2016 quarter
• Excellent quarterly production of 92,773oz (4E) and good unit cost control from Kroondal and Mimosa
• Prevailing PGM prices remain low, squeezing margins
– poor supply discipline has amplified price pressure
– recent rand strength a further headwind
• Difficult decisions required as depletion of the resource without returns is not sustainable
26
• Section 11 approval for Rustenburg acquisition anticipated during 4Q16
• Kroondal not involved in upcoming platinum sector wage negotiations
• Rustenburg conventional shafts performance of significant concern – engaging with Anglo
• Despite synergies expected from consolidation of the Rustenburg region, tough decisions for the benefit of all stakeholders may still be required
0
20 000
40 000
60 000
80 000
100 000
120 000
140 000
160 000
180 000
200 000
Ma
r-20
12
Ju
n-2
012
Se
p-2
01
2
De
c-2
01
2
Ma
r-20
13
Ju
n-2
013
Se
p-2
01
3
De
c-2
01
3
Ma
r-20
14
Ju
n-2
014
Se
p-2
01
4
De
c-2
01
4
Ma
r-20
15
Ju
n-2
015
Se
p-2
01
5
De
c-2
01
5
Ma
r-20
16
Ju
n-2
016
Quarterly 4E ounce production
Kroondal Mimosa

Kroondal: record production offsets unit cost inflation
• Kroondal delivered consistently high production of 60,707oz (4E attributable) despite the impact of unprotected strike action and S54 work stoppages:
– 6% CAGR in 4E PGM production since 2011
– despite mining cost inflation, real unit cost increases have been negated (R9,661/oz (4E) for the quarter)
• Controlling unit cost inflation by increasing throughput has limited scope
• At current prices (post purchase of concentrate (PoC) agreement), Kroondal is marginal
– combining the Kroondal and Rustenburg operations and Sibanye group will deliver significant long term, sustainable cost and operational benefits. In the near term however, operational intervention may be required
Combining Kroondal with Rustenburg to deliver further improvements 27
6 000
7 000
8 000
9 000
10 000
11 000
12 000
13 000
14 000
60 000
70 000
80 000
90 000
100 000
110 000
120 000
130 000
R/4
E o
z
PG
M o
z(4
E)
PGM (4E) Ounces PGM basket price (at 100%) Opex + capital
Note: Revenue pre-PoC

Kroondal: pressure remains on production and costs
• Significant business interruptions experienced
and expected to continue:
– regulatory stoppages
• S54 notices have resulted in estimated revenue loss of R135m for 12 months to June 2016
– community-led protests
• 39 community led protests over the last 52-weeks, with at least 30 being non-mine related
– industrial action
• recent unprotected AMCU strike
resulted in estimated revenue losses
of R56m
External issues are a significant impediment to sustainability 28
135
56
8
Revenue losses due to external factors (Rm)
Section 54s
Unprotected labour action
Community disruptions
• Basket cost inflation above Consumer Price Index (CPI)
– utility tariff escalation substantially in excess of CPI
– wage inflation higher than CPI
• The actions of key stakeholders, who currently benefit from the North West PGM
mines, threaten the sustainability of the mines
• Kroondal’s position is by no means unique in the industry

Mimosa: notable performance despite headwinds
• Mimosa production of 29,491oz (4E attributable), was well above nameplate capacity
– and has been consistently so in a very complex environment – a remarkable achievement
• Consistent quarterly production increases resulted in a c.3% reduction in annual real cash costs and a c.14% reduction in real US$ costs over last 3 years. Mimosa reported a cash
operating cost of US$766/oz (4E) for the quarter
• Progress is being made to expand production by 25% in a capital efficient manner, with a focus on reducing the required spend to well below existing estimates and reduce unit costs so as to deliver a robust IRR
• Base metal revenue adds approx. 22% to PGM revenue reported below
A solid operation with growth potential 29
* Excludes base metal revenue
0
200
400
600
800
1 000
1 200
1 400
0
10 000
20 000
30 000
40 000
50 000
60 000
70 000
US$
/4E o
z
PG
M o
z(4
E)
PGM (4E) Ounces PGM basket price (at 100%)* Opex + capital

F2016 outlook*
• PGM production forecast: approximately 260 000oz (4E)
• Average cash operating cost of R10 600/oz (US$735/oz)
• Forecast capital expenditure: approximately R225 million (US$15 million)
• Continued integration of acquired platinum assets - low PGM prices and
operational disruptions a near term challenge
• Rustenburg acquisition on track for completion in Dec 2016 quarter
– completion of Rustenburg transaction will enable realisation of main synergies
30
*For the 9 months ended 31 December 2016 (attributable)Assuming average of R14:50/US$ for F2016

Financial
Review
31

Reconciliation of earnings
32Different earnings measures impacted by various extra-ordinary items
333
1 114
38
2 152
338
38
(819)
(1 177)
(153)
(85)
0
500
1 000
1 500
2 000
2 500
3 000
Profit
attributable
to owners
Gain on
disposal of
PPE, net of
tax
Impairment Headline
earnings
Loss on
financial
instruments
Gain on
foreign
exchange
Restructuring
and
transaction
costs
Share of
results of
associates,
after tax
Other and
tax effect
Normalised
earnings

Six months ended 30 June 2016
Rand million US$ million
Net operating profit 3 447.5 224.2
(Loss)/gain on financial instruments
(1 177.0) (76.5)
Net other costs (493.0) (32.0)
Profit before non-recurring items
1 777.5 115.7
Impairment (819.1) (53.3)
Other non-recurringitems
(99.4) (6.4)
Profit before royalties and taxation
859.0 56.0
Income statement
33Share scheme benefited from significant share price appreciation
Six months ended 30 June 2016
Rand million US$ million
Net operating profit 3 447.5 224.2
(Loss)/gain on financial instruments
(1 177.0) (76.5)
Net other costs (493.0) (32.0)
Profit before non-recurring items
1 777.5 115.7
Impairment (819.1) (53.3)
Other non-recurringitems
(99.4) (6.4)
Profit before royalties and taxation
859.0 56.0
Cash-settled share options
• SGL Phantom Share Scheme replaced the Gold Fields equity-settled share plans
• Cash-settled share options are valued at the end of each reporting period
• Significant increase in the fair value of the share-based payment obligation mainly due to the significant increase in Sibanye’s share price.
• Share price increased by approximately 120% during the 2016 interim period (over 500% from issue in May 2013 to end June 2016).
• Approximately 70% of Share Scheme rights vested during the period - R1,490 million (US$97 million) in cash payments.
• Outstanding liability at 30 June 2016 – R346m. Maximum remaining liability = R745 million
Impairment
• Despite joint efforts of stakeholders, the Cooke 4 Operation has been unable to meet required production and cost targets, and has continued to
operate at a loss.
• A decision was taken to impair the Cooke 4 Operation’s mining assets by R816.7 million (US53.1million).
-100
0
100
200
300
400
500
600
700
800
2013 2014 2015 2016
%
Sibanye
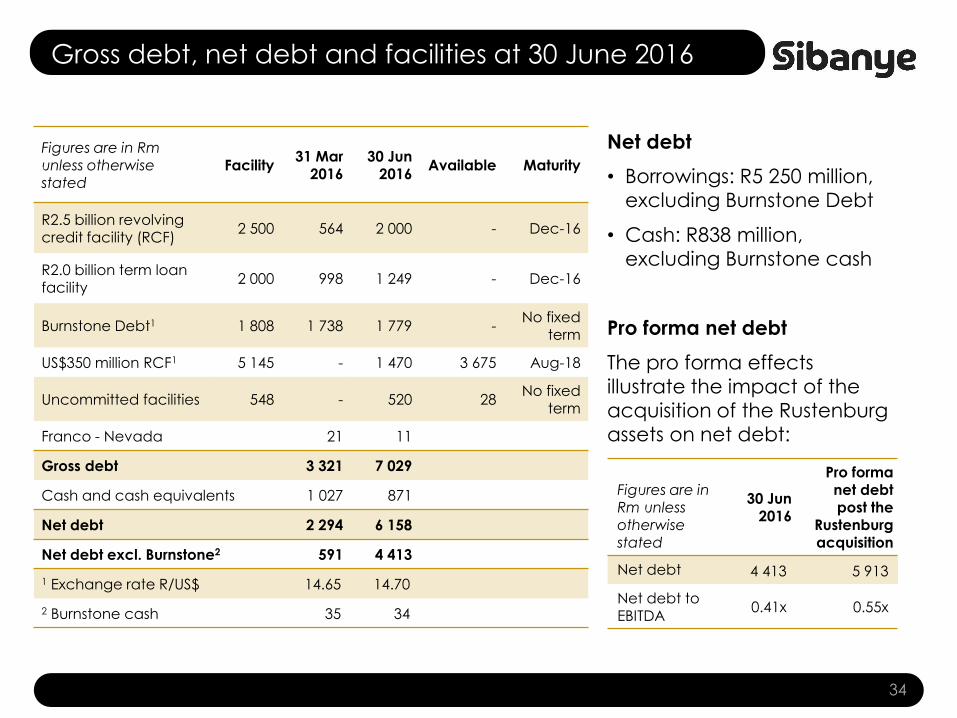
Gross debt, net debt and facilities at 30 June 2016
Figures are in Rm unless otherwise stated
Facility31 Mar
201630 Jun
2016Available Maturity
R2.5 billion revolving credit facility (RCF)
2 500 564 2 000 - Dec-16
R2.0 billion term loan
facility 2 000 998 1 249 - Dec-16
Burnstone Debt1 1 808 1 738 1 779 -No fixed
term
US$350 million RCF1 5 145 - 1 470 3 675 Aug-18
Uncommitted facilities 548 - 520 28No fixed
term
Franco - Nevada 21 11
Gross debt 3 321 7 029
Cash and cash equivalents 1 027 871
Net debt 2 294 6 158
Net debt excl. Burnstone2 591 4 413
1 Exchange rate R/US$ 14.65 14.70
2 Burnstone cash 35 34
34
Figures are in Rm unless otherwise stated
30 Jun 2016
Pro forma net debt post the
Rustenburg acquisition
Net debt 4 413 5 913
Net debt to EBITDA
0.41x 0.55x
Net debt
• Borrowings: R5 250 million,
excluding Burnstone Debt
• Cash: R838 million,
excluding Burnstone cash
Pro forma net debt
The pro forma effects
illustrate the impact of the
acquisition of the Rustenburg
assets on net debt:

Conclusion
Conclusion
• Operational performance solid – regression in safety performance impacting
production and being addressed
• Commitment to industry leading dividend demonstrated again
• Cost management and capital discipline critical during periods of high margin
– intensify cost management
– no cross subsidisation of loss making production – supply discipline
• Value accretive M&A opportunities less prevalent
• Integration of platinum division – low PGM prices and operational disruptions a
near term challenge
– completion of Rustenburg transaction will enable realisation of main
synergies
36Addressing operational challenges – outlook positive

Questions
37