Embed Size (px)
Citation preview

OPERATING PROGRAM SUMMARY
OPERATING ANALYST NOTES
OPERATING ANALYST NOTES
Contents
I: Overview 1
II: Council Approved Budget 4
III: 2014 Service Overview and Plan 5
IV: 2014 Operating Budget 10
V: Issues for Discussion 15
Appendices:
1) 2013 Service Performance 17
2) Operating Budget by Expense Category 18
3) Summary of 2014 Service Changes N/A
4) Summary of 2014 New & Enhanced Service Changes N/A
5) Inflows/Outflows to / from Reserves & Reserve Funds 21
6) 2014 User Fee Rate Changes 23
Exhibition Place 2014 OPERATING BUDGET OVERVIEW What We Do Exhibition Place fosters an inclusive and accessible parkland and business destination for conventions, exhibitions, entertainment, recreation, sporting events, and public celebrations, operating as a self-sustaining and environmentally responsible entity.
Exhibition Place is an integral component of Toronto and Ontario's economy, particularly with respect to sports, festivals, recreation, culture and tourism. Exhibition Place is a world leader in emerging green technologies and attracts over 5.4 million visitors a year.
The total cost to operate Exhibition Place in 2014 is $44.438 million with operating revenues of $44.538 million, thereby fully funding its operations with a $0.100 million budgeted surplus net revenue.
$ %Gross Expenditures 43,650.7 44,438.1 787.4 1.8%Gross Revenue 43,750.7 44,538.1 787.4 1.8%Net Expenditures (100.0) (100.0) 0.0 0.0%
(In $000s) 2013 Budget 2014 BudgetChange
In 2014 Exhibition Place will generate operating revenue of $0.100 million for the City of Toronto. The 2014 Council Approved Operating Budget presents no changes vs. the 2013 Approved Operating Budget. Exhibition Place will continue to deliver its services to the public on a self-sustaining and environmentally friendly manner.
www.toronto.ca/budget2014

2014 Operating Budget Exhibition Place
Fast Facts
Canada's largest conventions, exhibitions and entertainment venue.
Exhibition Place attracts over 5.3 million visitors a year.
192-acre parkland.
Has hosted major events such as the G-8/20 Media Centre, the 2003 Pope's visit, Canadian National Exhibition, Royal Agricultural Winter Fair, Honda Indy and Major League Soccer matches.
Trends
Revenue from tenants has been sustained through the economic downturn, anticipated to grow until 2015 and remain stable in 2016.
Exhibition Place has maintained outstanding customer service over the years, with a 90% customer satisfaction rating in 2013.
Environmental sustainability initiatives generated savings of $3.8 million from 2007 to 2012.
www.toronto.ca/budget 2014 Page 2
Our Service Deliverables for 2014 Exhibition Place is Canada's largest convention, exhibition and entertainment venue, responsible for managing 192-acre parkland, for providing inclusive and accessible parkland, and for serving as a business destination for entertainment, recreation and sporting events, and public celebrations, while operating as a self-sustaining and environmentally responsible entity.
The 2014 Operating Budget will fund:
Exhibition Place Operations and the Direct Energy Centre to host City celebrations and events that attract international visitors, such as the Scotiabank Toronto Caribbean Festival, CHIN Picnic and the Honda Indy Toronto. The Direct Energy Centre will host national and community events and shows such as the Royal Agricultural Winter Fair, the Boat Show, the National Home Show and the One of a Kind Craft Show.
The National Soccer Stadium (BMO Field) as a venue for major league soccer matches, concerts, community use, corporate functions and private parties.
The development of Allstream Conference Centre operating requirements as the new venue enters its fifth year. This facility provides meeting rooms, exhibit space, and a Class A ballroom to complement the event activity at the Direct Energy Centre. The centre will help to attract more international conferences, conventions, festivals, consumer and trades shows to the City.
2008 2009 2010 2011 2012 2013 Proj. 2014 Est. 2015 Est. 2016 Est.
Tenants Rent 1,312.8 1,360.0 1,460.0 1,500.9 1,520.0 1,549.0 1,691.0 1,866.0 1,866.0
Net Show Services 111.3 177.7 131.1 129.7 118.8 122.5 123.0 130.0 130.0
-200.0 400.0 600.0 800.0
1,000.0 1,200.0 1,400.0 1,600.0 1,800.0 2,000.0
Tenants Rent & Net Show Services ($000's )

2014 Operating Budget Exhibition Place
2014 Budget Expenditures & Funding
Where the money goes:
2014 Gross Operating Budget by Service $44.438 Million
2014 Operating Budget by Expenditure Category
Where the money comes from:
2014 Operating Budget Funding Source
$44.538 Million
Key Challenges & Priority Actions
Maintain positive financial performance, by seeking additional revenues and efficiencies within the budget, while mitigating the loss of parking revenue due to hotel construction and the loss of three large events ($1.1 million).
Remain competitive in the market place for venues encouraging high performance and customer service levels through an employee engagement strategy.
Develop an environmental leadership strategy while securing funding for green initiatives.
Promote the site as an international business centre, promoting Exhibition Place and building positive public relationships.
Ensure a safe and secure environment for employees, guests, the property and assets, while maintaining Exhibition Place heritage buildings.
www.toronto.ca/budget 2014 Page 3

2014 Operating Budget Exhibition Place
II: COUNCIL APPROVED BUDGET City Council approved the following recommendations:
1. City Council approve the 2014 Operating Budget for Exhibition Place of $44.438 million gross and $0.100 million net revenue, comprised of the following services:
2. City Council approve Exhibition Place's 2014 service levels, as outlined on page 7, and associated staff complement of 397.5 FTE positions.
3. City council approve the 2014 market rate user fee changes for Exhibition Place as identified in Appendix 6 (Inflation and Other Adjustments) for inclusion in the Municipal Code Chapter 441, User Fees and Charges.
Service:
Gross
($000s)
Net
($000s)
Exhibitions Place & Direct Energy Centre
National Soccer Stadium
Allstream Conference Centre
29,184.3
10,677.0
4,576.8
223.9
(323.9)
0.0
Total Agency Budget 44,438.1 (100.0)
www.toronto.ca/budget 2014 Page 4

2014 Operating Budget Exhibition Place
III: 2014 SERVICE OVERVIEW AND PLAN Program Map Exhibition Place fosters an inclusive and accessible parkland and business destination for conventions, exhibitions, entertainment, recreation, sporting events, and public celebrations by providing the following services:
www.toronto.ca/budget 2014 Page 5
2014 Operating Budget Exhibition Place
2014 Service Deliverables The 2014 Operating Budget of $44.438 million gross expenditure and $0.100 million net revenue for Exhibition Place will fund:
Exhibition Place Operations and the Direct Energy Centre to host City celebrations and events that attract international visitors, such as the Scotiabank Toronto Caribbean Festival, CHIN Picnic and the Honda Indy Toronto. The Direct Energy Centre will host national and community events and shows such as the Royal Agricultural Winter Fair, the Boat Show, the National Home Show and the One of a Kind Craft Show.
The National Soccer Stadium (BMO Field) as a venue for major league soccer matches, concerts, community use, corporate functions and private parties.
The development of Allstream Conference Centre operating requirements as the new venue enters its fifth year. This facility provides meeting room, exhibit space, and a Class A ballroom to complement the event activity at the Direct Energy Centre. The centre will help to attract more international conferences, conventions, consumer and trades shows and festivals to the City.
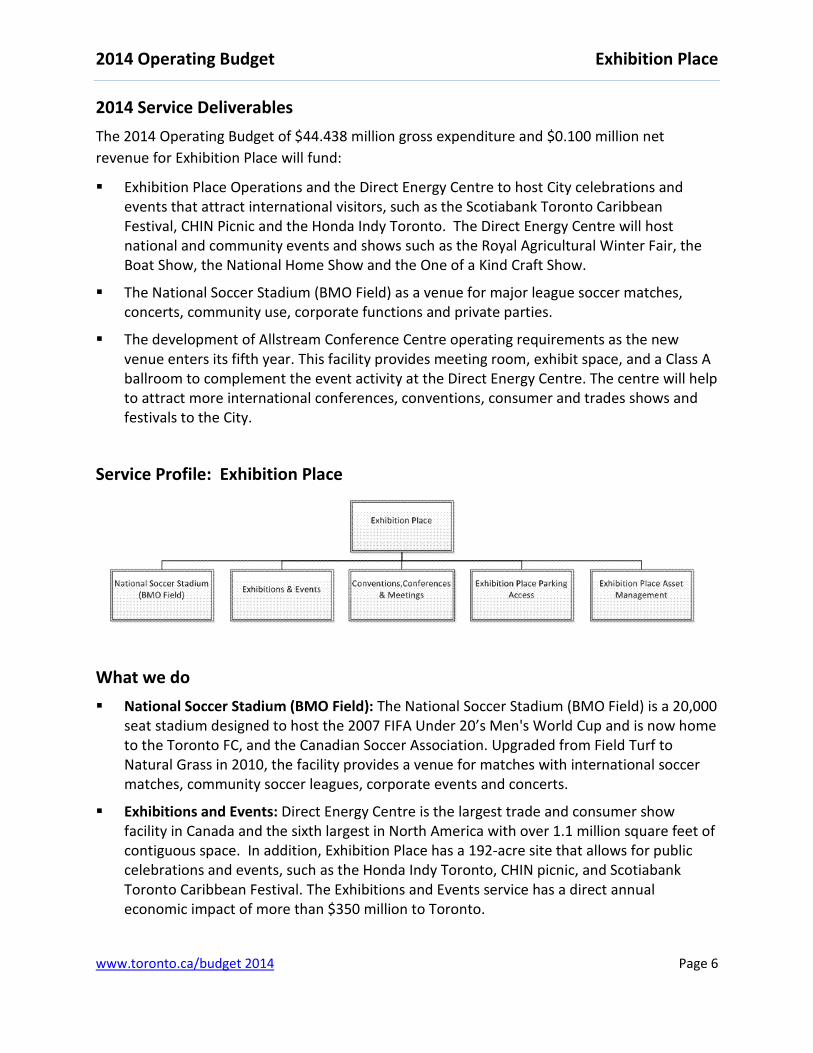
Service Profile: Exhibition Place
What we do National Soccer Stadium (BMO Field): The National Soccer Stadium (BMO Field) is a 20,000
seat stadium designed to host the 2007 FIFA Under 20’s Men's World Cup and is now home to the Toronto FC, and the Canadian Soccer Association. Upgraded from Field Turf to Natural Grass in 2010, the facility provides a venue for matches with international soccer matches, community soccer leagues, corporate events and concerts.
Exhibitions and Events: Direct Energy Centre is the largest trade and consumer show facility in Canada and the sixth largest in North America with over 1.1 million square feet of contiguous space. In addition, Exhibition Place has a 192-acre site that allows for public celebrations and events, such as the Honda Indy Toronto, CHIN picnic, and Scotiabank Toronto Caribbean Festival. The Exhibitions and Events service has a direct annual economic impact of more than $350 million to Toronto.
www.toronto.ca/budget 2014 Page 6

2014 Operating Budget Exhibition Place
Conventions, Conferences & Meetings: Allstream Centre reopened in October 2009 after a $50.0 million renovation to the historic Automotive Building. It provides new meeting rooms, exhibit space, and a Class A ballroom. The new 134,000 square foot facility complements the event activities at the Direct Energy Centre, by attracting more international conferences, consumer and trade shows, and festivals to the City of Toronto.
Exhibition Place Asset Management: Provide building & infrastructure maintenance and construction services to Exhibition Place facilities and structures.
Exhibition Place Parking Access: Provide convenient access to public parking for Exhibition Place events, BMO field sporting events, and general public use.
2014 Service Levels
2014Sporting Event Achieving 84% capacityCorporate Functions /Private Parties 70% util ization projected for 2012Community Use 100% compliance for contracted community usageNational / International Friendlies National / International Friendlies games: achieve 80% capacity or
more of 21,000 seatsGuest Services: Food & Beverage Increase sales per attendee vs. 2012 levelGuest Services: Merchandise $2.80 merchandise sales per attendeeEvent - Trade & Consumer 100% compliance with negotiated termsEvent - Meetings & Corporate 100% compliance with negotiated termsEvent - Community / Festivals / City of Toronto / Sporting / Photo & Film
100% compliance with negotiated terms
Event - Major Citywide celebrations & special events
100% compliance with negotiated terms
Guest Services: Food & Beverage $4.75 food & beverage sales per attendeeGuest Services: Facil ity Support $0.65 of Service Revenue per $1 of Rent RevenueLong-term Tenant Support $10.43 per Square foot of long term tenant space supported
Event Space 100% compliance with negotiated termsGuest Services: Food & Beverage $4.75 food & beverage sales per attendeeGuest Services: Facil ity Support $0.65 of Service Revenue per $1 of Rent RevenueGuest Services: Parking Labour Cost ratio of 9% of revenue
Parking Lots, Roads & Sidewalks Maintain Parking Lots, Roads & Sidewalks in good condition for public access; increase sustainabil ity and reduce failure of Exhibition Place Assets; effective investment of Capital funds; ensure preservation of Historical site and area
Waste Management Waste Management: Achieve 80% waste diversionFleet & Equipment Maintenance Fleet & Equipment Maintenance:
Maintain current 43 vehicles and 73 pieces of equipment and additional acquisitions
Surface 100% of parking spaces available and accessible for all major events. Variable labour cost ratio of 9% of revenue.
Underground 100% of parking spaces available and accessible for all major events. Variable labour cost ratio of 9% of revenue.
Service Activity TypeService Levels
National Soccer Stadium (BMO Field)
Exhibitions & Events
Conventions, Conference & Meetings
Asset Management
Exhibition Place Parking Access
www.toronto.ca/budget 2014 Page 7

2014 Operating Budget Exhibition Place
Service Performance Measures
Efficiency Measure – Utility Cost Savings from Energy Retrofit Projects
2011 Actual
2012 Actual
2013 Projected
Actuals2014 Budget 2015
Plan2016 Plan
$ Savings ($000's) $780 $765 $724 $729 $744 $760
$690$700$710$720$730$740$750$760$770$780$790
Savings in energy costs are projected to grow to reach an amount close to the 2012 savings.
Further savings increases are dependent on future Green Energy Projects.
Effectiveness Measure – Annual Revenue from Tenants under long term lease agreements
2011 Actual
2012 Actual
2013 Projected
Actuals
2014 Budget
2015 Plan
2016 Plan
Tenants Revenue ($000's) 1,501 1,520 1,549 1,691 1,866 1,866
$0$200$400$600$800
$1,000$1,200$1,400$1,600$1,800$2,000
Revenues from tenants have been sustained through the economic down turn, are anticipated to grow until 2015 and remain stable in 2016.
Effectiveness Measure – Annual Parking revenue from visitors utilizing parking facilities
2011 Actual
2012 Actual
2013 Projected
Actuals
2014 Budget
2015 Plan
2016 Plan
Parking Revenue ($000's) $6,680 $6,735 $6,373 $6,278 $6,466 $6,660
$6,000
$6,100
$6,200
$6,300
$6,400
$6,500
$6,600
$6,700
$6,800
Parking revenue has declined since 2013 due to the temporary loss of parking spaces during the hotel construction.
Parking revenue is expected to slowly increase after completion of the hotel project.
www.toronto.ca/budget 2014 Page 8

2014 Operating Budget Exhibition Place
Effectiveness Measure – Revenue from events at the Direct Energy Centre
2011 Actual
2012 Actual
2013 Projected
Actuals2014 Budget 2015
Plan2016 Plan
Revenue ($000's) $7,339 $7,456 $7,500 $7,550 $7,777 $8,010
$7,000
$7,200
$7,400
$7,600
$7,800
$8,000
$8,200
The revenue from events at the Direct Energy Centre is projected to remain stable from 2012 to 2014 and slowly increase from 2015 onwards.
www.toronto.ca/budget 2014 Page 9

2014 Operating Budget Exhibition Place
IV: 2014 Total Operating Budget
2014 Operating Budget (In $000s)
(In $000s) Approved
BudgetProjected
Actual 2014 Base2014
New/Enhanced2014
BudgetBy Service $ $ $ $ $ $ % $ % $ %
Exhibition Place & Direct Energy Centre
Gross Expenditures 29,895.6 29,895.6 29,184.3 29,184.3 (711.3) (2.4) 1,257.0 4.3 (557.3) (1.9)
Revenue 29,690.9 29,690.9 28,960.4 28,960.4 (730.5) (2.5) 1,795.0 6.2 (1,121.3) (3.8)
Net Expenditures 204.7 204.7 223.9 - 223.9 19.2 9.4 (538.0) (240.3) 564.0 225.7
National Soccer Stadium
Gross Expenditures 9,261.1 9,261.1 10,677.0 10,677.0 1,415.9 15.3 169.0 1.6 260.6 2.3
Revenue 9,565.8 9,565.8 11,000.9 11,000.9 1,435.1 15.0 231.0 2.1 224.6 2.0
Net Expenditures (304.7) (304.7) (323.9) - (323.9) (19.2) 6.3 (62.0) 19.1 36.0 (10.3)
Allstream Conference Centre
Gross Expenditures 4,494.0 4,494.0 4,576.8 4,576.8 82.8 1.8 (45.2) (1.0) 102.8 2.2
Revenue 4,494.0 4,494.0 4,576.8 4,576.8 82.8 1.8 (45.2) (1.0) 102.8 2.2
Net Expenditures - - - - - - NA - NA - NA
Total
Gross Expenditures 43,650.7 43,650.7 44,438.1 44,438.1 787.4 1.8 1,380.8 3.1 (193.9) (0.4)
Revenue 43,750.7 43,750.7 44,538.1 44,538.1 787.4 1.8 1,980.8 4.4 (793.9) (1.7)
Total Net Expenditures (100.0) (100.0) (100.0) - (100.0) - - (600.0) 600.0 600.0 (600.0) Approved Positions 397.5 397.5 397.5 397.5 - - 11.0 2.8 (11.0) (2.8)
2013 2014 Operating Budget
2014 vs. 2013 Budget Approved Changes 2015 2016
Incremental Change 2015 and 2016 Plan
The 2014 Operating Budget for Exhibition Place of $43.438 million gross and $0.100 million net revenue is comprised of the following services:
The Exhibition Place & Direct Energy Centre service's 2014 Budget reflects an increase of $0.019 million or 9.4% over the 2013 approved net expenditures. This is driven by an increase in benefits of $0.192 million, lower net reserve contributions of $0.107 million, and a decrease in revenue from exhibits of $0.547 million. This is partially offset by a decrease of $0.191 million in natural gas cost and a decrease of $0.635 million in other expenditures, resulting from lower exhibit volume.
The National Soccer Stadium (BMO Field) service's 2014 Operating Budget reflects a net expenditure decrease of $0.019 million or 6.3% over the 2013 approved net expenditures. This is driven by an increase in COLA and progression pay of $0.022 million, hydro, water and miscellaneous materials and supplies increase of $0.113 million, as well as an increase in cost of services and other expenditures of $1.281 million offset by higher revenues of $1.435 million.
The Allstream Conference Centre service's 2014 Operating Budget has no change over the 2013 approved net expenditures.
Overall, the 2014 Operating Budget for Exhibition Place reflects no change, maintaining its 2013 revenue of $0.100 million net for 2014.
There are no service level changes or new and enhanced services in the Exhibition Place's 2014 Operating Budget.
www.toronto.ca/budget 2014 Page 10

2014 Operating Budget Exhibition Place
The 2014 Budget does not change the Agency's approved staff complement, maintaining its staffing level of 397.5 FTE positions as highlighted in the table below:
2014 Total Staff Complement
Changes2014
Budget2015 Plan
2016 Plan
Opening Complement 397.5 397.5 408.5 In-year AdjustmentsAdjusted Staff Complement 397.5 397.5 408.5 Change in Staff Complement - Temporary Complement - capital project delivery - Operating impacts of completed capital projects - Service Change Adjustments 11.0 (11.0) - New / EnhancedTotal 397.5 408.5 397.5 % Change over prior year 2.8 (2.8)
In 2015, the staff complement will increase by 11 temporary positions to host and deliver Pan Am Games events at Exhibition Place. The additional operating cost will be absorbed by additional revenue earned from the Pan American Games, resulting in additional net revenue to Exhibition Place and, therefore, to the City of Toronto.
2014 Base Budget
(In $000s)
Incremental Change(In $000s)By Service $ $ $ % $ % $ %Exhibition Place & Direct Energy Centre
Gross Expenditures 29,895.6 29,184.3 (711.3) (2.4) (1,043.0) (3.6) 1,742.7 5.8Revenue 29,690.9 28,960.4 (730.5) (2.5) (1,105.0) (3.8) 1,778.7 6.0
Net Expenditures 204.7 223.9 19.2 9.4 62.0 27.7 (36.0) (14.4)National Soccer Stadium
Gross Expenditures 9,261.1 10,677.0 1,415.9 15.3 169.0 1.6 260.6 2.3Revenue 9,565.8 11,000.9 1,435.1 15.0 231.0 2.1 224.6 2.0
Net Expenditures (304.7) (323.9) (19.2) 6.3 (62.0) 19.1 36.0 (10.3)Allstream Conference Centre
Gross Expenditures 4,494.0 4,576.8 82.8 1.8 (45.2) (1.0) 102.8 2.2Revenue 4,494.0 4,576.8 82.8 1.8 (45.2) (1.0) 102.8 2.2
Net Expenditures - - - NA - NA - NA
TotalGross Expenditures 43,650.7 44,438.1 787.4 1.8 (919.2) (2.1) 2,106.1 4.6Revenue 43,750.7 44,538.1 787.4 1.8 (919.2) (2.1) 2,106.1 4.6
Net Expenditures (100.0) (100.0) (0.0) 0.0 - NA - NAApproved Positions 397.5 397.5 - - 11.0 2.8 (11.0) (2.8)
Change 2014 Base vs.
2013 Approved Budget2014 Base
2013 Budget 2015 Plan 2016 Plan
The 2014 Base Budget of $44.438 million gross and $0.100 million net revenue is at the same level as the 2013 Approved Budget of $0.100 million net revenue and represents no base increases, bringing the Agency's base budget to the target of a 0% increase as detailed below.
www.toronto.ca/budget 2014 Page 11

2014 Operating Budget Exhibition Place
Key Cost Drivers (In $000s)
2014(In $000s) Base BudgetGross Expenditure Changes
Economic Factors Increase in hydro, gas, water, materials, supplies, equipment and other expenses. 609.1 Expenditure reductions to reflect actual usage of utilities, equipment, services and rents.
(1,972.9)
COLA and Progression PayCOLA and Progression Pay 244.6
Expenditure ChangesIncreased labor/costs for client services due to increase in volume 1,982.9
Other ChangesChanges to Reserve Contributions (Naming Rights Revenue, Insurance Reserve, Conference Centre Reserve Fund)
91.7
Total Changes 955.4
Revenue ChangesVolume changes in rental shows, parking revenues and various user fees at the BMO Field 955.4
Total Changes 955.4 Net Expenditures 0.0 Key cost drivers of $0.955 million in base budget pressures have been directly offset by corresponding revenue increases.
Economic Factors
An increase of $0.609 million gross consistent with City guidelines for inflationary increases is provided for hydro ($0.110 million), gas ($0.017 million), water ($0.031 million), materials and supplies ($0.015 million), equipment ($0.04 million) and other expenses ($0.432 million).
Expenditure reductions of $1.973 million reflect actual usage of utilities, equipment, and services and rents and offset inflationary increases.
COLA and Progression Pay
A net expenditure increase of $0.245 million is included for 2014: $0.268 million for non-union merit and cost-of-living adjustments and $0.272 million for trade worker COLA as stipulated by union agreements which is partially offset by other wage and benefits decreases of $0.295 million.
Expenditure Changes
Additional expenditures of $1.983 million are the result of increased volume and associated labor/costs for client services which are offset through recoverable revenues that had previously been reported on a net basis.
www.toronto.ca/budget 2014 Page 12

2014 Operating Budget Exhibition Place
Other Base Changes
Changes to reserve contributions reflect an increase of $0.092 million which is comprised of a decreased contribution of $0.025 million from the Naming Rights revenue to the Conference Centre Reserve Fund (CCRF) due to an increase in branding costs, $0.050 million decrease in the contribution to the Insurance Reserve Fund and $0.001 million decrease in contribution for the Sick Leave Reserve Fund due to CNEA's departure. These decreases are offset by a decreased withdrawal of $0.183 million from the Sick Leave reserve fund due to the departure of the CNEA and an increase in the budgeted withdrawal from the CCRF by $0.015 million as a result of increasing principal and interest repayments on the Allstream Conference Centre and Centre Loan.
Base Revenue Changes
The user fee revenues will increase by $0.955 million over 2013 Operating Budget revenues primarily due to volume changes in rental shows, parking revenues, various user fees at the National Soccer Stadium, and grossed up recoverable revenues that were previously reported on a net basis.
2015 and 2016 Plan (In $000s)
Description ($000s)Gross
Expense RevenueNet
Expense
% Change vs. 2014
Operating Budget
# Positions
Gross Expense Revenue
Net Expense
% Change vs. 2014
Operating Budget
# Positions
Known Impacts:
Progression Pay 184.4 184.4 - (218.9) (218.9)
COLA and Fringe Benefits 825.6 825.6 - 948.9 948.9 Sub-Total 1,009.9 - 1,009.9 - 730.0 - 730.0 -
Anticipated Impacts:
Increase in utilities, supplies, equipment, services, rent and other expenses 1,193.8 1,193.8 384.5 384.5
Client services cost (offset by revenue) (2,622.8) (2,622.8) 991.5 991.5
Increase in reserve contributions (500.0) (600.0) 100.0 - (100.0) 100.0
Revenue change (319.1) 319.1 2,206.1 (2,206.1) Sub-Total (1,929.1) (919.1) (1,009.9) - 1,376.0 2,106.1 (730.0) -
Pan Am Games Impacts:
Staffing 720.0 720.0 11.0 (720.0) (720.0) (11.0)
Equipment Rental 765.0 765.0 (765.0) (765.0)
Utilities 300.0 300.0 (300.0) (300.0)
Other Expenses 515.0 515.0 (515.0) (515.0)
Additional Revenue Pan Am Games 3,947.0 (3,947.0) (3,947.0) 3,947.0
Foregone Revenue (Honda Indy & Other Events) (1,047.0) 1,047.0 1,047.0 (1,047.0) Sub-Total 2,300.0 2,900.0 (600.0) 11.0 (2,300.0) (2,900.0) 600.0 (11.0) Total Incremental Impact 1,380.9 1,980.9 (600.0) 600.0% 11.0 (193.9) (793.9) 600.0 -600.0% (11.0)
2015 - Incremental Increase 2016 - Incremental Increase
The 2014 Operating Budget will result in incremental increases of $1.010 million in 2015 and $0.730 million in 2016 which will be fully offset. Exhibition Place is also projecting a one-time revenue increase in 2015 due to Pan Am Games activities.
www.toronto.ca/budget 2014 Page 13

2014 Operating Budget Exhibition Place
Future year incremental costs are primarily attributable to the following:
Known Impacts:
Progression Pay and COLA: An expenditure increase of $1.009 million and $0.730 million in 2015 and 2016 respectively represents progression pay and cost of living adjustments.
Anticipated Impacts:
Utilities, Supplies, Equipment, Services and Rent: An increase of $1.194 million in 2015 and $0.384 million in 2016 is anticipated for cost increases of hydro, gas, water, materials, supplies, equipment as per the city economic guidelines, as well as increases in services and rent.
Change in Client Services Cost: Client services costs related to volume of activity and associated labor/costs for client services are projected to decrease by $2.623 million for 2015 and increase by $0.992 million for 2016.
Increase in Reserve Contributions: An increase of $0.100 million for 2015 and $0.100 million for 2016 is projected for contributions to various reserve funds.
Revenue Changes: A decrease in revenue of $0.319 million is projected in 2015 and an increase of $2.206 million in 2016 due to volume changes in rental shows, parking revenues, various user fees at the National Soccer Stadium.
Pan Am Impact 2015: In 2015, the Pan Am Games will be held in Toronto with the CIBC Pan Am Park at the Exhibition Place being designated the central hub for 12 different sports. The anticipated additional operating cost of $2.300 million will be offset by additional revenue of $2.900 million, resulting in revenue of $0.600 million for Exhibition Place and the City of Toronto in 2015.
Preliminary expenditures are projected to increase by $2.300 million in 2015 with offsetting revenues forecasted at $2.900 million for a net revenue increase of $0.600 million in 2015 to host and deliver the Pan Am Games events.
The additional operating costs of $2.300 million include staffing costs of $0.720 million (facilities, events, sales and security staff), as well as equipment rental expenses of $0.765 million, expenses for utilities of $0.300 million and other expenses of $0.515 million.
The additional revenue includes space rent and show services of $3.947 million and is partially offset by foregone revenue from events that would have taken place at the same time as the Pan Am Games for $1.047 million.
Delivering the Pan Am Games activities at Exhibition Place will require one time additional 11 temporary positions in 2015, which will increase the Exhibition Place's staffing complement from 397.5 to 408.5 positions.
www.toronto.ca/budget 2014 Page 14

2014 Operating Budget Exhibition Place
V: ISSUES FOR DISCUSSION Key Program Issues
Conference Centre Reserve Fund (CCRF)
City Council, at its meeting of December 10, 11, 12, 13 and 14, 2007, approved a loan to The Board of Governors of Exhibition Place” in the amount of $35.6 million (the “Loan”) for funding the renovation of the Automotive Building at Exhibition Place to construct a conference centre facility. The project was completed in 2009 and repayment of the loan, including principal and interest started in 2010.
The Exhibition Place Conference Centre Reserve Fund (CCRF) was established in 2008 to provide a source of funding for any shortfalls in loan payments to the City from Exhibition Place for the Allstream conference centre.
Funds may be withdrawn by the Deputy City Manager/Chief Financial Officer should there be a funding short fall in loan payments to the City from Exhibition Place on an as needed basis. Continuation of the 3 year agreement (2010, 2011 and 2012) is subject to an annual review through the Operating Budget Process to receive approval from the Deputy City Manager/Chief Financial Officer.
The withdrawal from the Conference Centre Reserve Fund to cover anticipated temporary shortfalls in loan payments to the City from Exhibition Place for the Allstream Conference Centre was $1.143 million in 2011, $1.158 million in 2012, and $1.143 million in 2013.
Contributions to the Conference Centre Reserve Fund from Allstream and Direct Energy Centre naming rights revenue will be $1.158 million for 2013. The Allstream naming rights agreement signed in August 2008 and amended in 2013 has a term of 13 years and the Direct Energy Centre naming rights agreement was signed in June 2006 for a 10 year term.
On November 5, 2012, Executive Committee recommended to City Council a report, (EX24.19), from the DCM and CFO "Administrative Amendments to Reserve Fund Accounts -2012" recommending :
City Council changed the purpose of the Exhibition Place Conference Centre Reserve Fund in Schedule #15 of Chapter 227 to: "provides a source of funding, in the first instance, for any shortfalls in the loan payments to the City from Exhibition Place for the new conference centre, and this being provided for, to support any cash shortfalls with respect to capital funding required to maintain the Direct Energy Centre and the Allstream Centre in a state of good repair".
Council directed that Exhibition Place will contribute any surplus provided by improved performance up to $0.500 million in 2013 and 2014 into the Conference Centre Reserve Fund to fund urgently needed improvements to washrooms in the Direct Energy Centre. This SOGR project for washroom repair was started in 2013 and continues in Exhibition Place's 2014 Capital Budget with completion before the Pan Am Games.
www.toronto.ca/budget 2014 Page 15

2014 Operating Budget Exhibition Place
In order to use its Vehicle and Equipment Reserve for equipment costs previously included in the Capital Budget, it is suggested that Exhibition Place set out a schedule of Operating Budget contributions and Capital Budget draws from 2015 and future years.
www.toronto.ca/budget 2014 Page 16

2014 Operating Budget Exhibition Place
Appendix 1 2013 Service Performance
2013 Key Accomplishments In 2013, Exhibition Place achieved the following results:
Maintained outstanding customer service by achieving an average of 90% rating from client satisfaction surveys.
Promoted safety in the workplace, reduced lost time over 2010 base year.
Exhibition Place is projecting to achieve its operating budget target in 2013
Improved events attendance and occupancy.
Continued to promote environmental initiatives; savings of $3.8 million and 49M Kwh from 2007 – 2012.
Continued to develop community use of the grounds
Diversification of customer target group for shows and events to include more film shoots, religious and cultural events and private functions
Completed the transition process for Canadian National Exhibition Association independence from the Exhibition Place and the City.
Contracted new food and beverage provider at Direct Energy Centre and Exhibition Place
2013 Financial Performance 2013 Budget Variance Analysis
(In $000s) 2011
Actuals 2012
Actuals
2013 Approved
Budget
2013ProjectedActuals*
($000s) $ $ $ $ $ % Gross Expenditures 63,199.2 62,393.2 43,650.7 43,650.7 - - Revenues 66,248.7 67,012.0 43,750.7 43,750.7 - - Net Expenditures (3,049.5) (4,618.8) (100.0) (100.0) - -
Approved Positions 529.5 529.5 397.5 397.5 - -
2013 Approved Budget vs. Projected Actual Variance
* Based on the 3rd Quarter Operating Budget Variance Report
2013 Experience At of the 3rd Quarter for 2013, Exhibition Place is forecasting it will be on budget at year-
end.
Impact of 2013 Operating Variance on the 2014 Budget There is no impact of the 2013 Operating Variance on the 2014 Budget.
www.toronto.ca/budget 2014 Page 17

2014 Operating Budget Exhibition Place
Appendix 2 2014 Total Operating Budget
by Expenditure Category
Program Summary by Expenditure Category (In $000s)
20132011 2012 2013 Projected 2014 2015 2016
Category of Expense Actual Actual Budget Actual Budget Plan Plan$ $ $ $ $ $ % $ $
Salaries and Benefits 37,680.7 36,970.5 31,747.6 31,747.6 31,992.2 244.6 0.8% 33,722.1 33,732.2 Materials and Supplies 4,517.6 3,788.9 4,371.8 4,371.8 4,273.1 (98.7) -2.3% 4,459.1 4,648.6 Equipment 284.0 579.2 176.8 176.8 176.8 0.0 0.0% 180.6 184.3 Services & Rents 35,486.4 30,970.9 19,632.1 19,632.1 18,367.0 (1,265.1) -6.4% 20,951.0 19,562.3 Contributions to Capital - - 500.0 500.0 500.0 - 0.0% - - Contributions to Reserve/Res Funds 977.8 984.5 830.2 830.2 778.9 (51.3) -6.2% 778.9 778.9 Contributions to Reserve (CCRF) - Naming Rights 1,142.6 1,158.0 1,168.0 1,168.0 1,143.0 (25.0) -2.1% 1,143.0 1,143.0 Other Expenditures (16,889.9) (12,058.7) (14,775.8) (14,775.8) (12,793.0) 1,982.8 -13.4% (15,415.8) (14,424.3) Interdivisional Charges - - - - - - - -
Total Gross Expenditures 63,199.2 62,393.2 43,650.7 43,650.7 44,438.1 787.4 1.8% 45,818.9 45,625.0
Interdivisional Recoveries - - - - - - - - Provincial Subsidies - Federal Subsidies - Other Subsidies - User Fees & Donations 63,639.0 64,852.8 40,991.1 40,991.1 41,946.5 955.4 2.3% 44,527.4 43,833.5 Transfers from Capital Fund - - 500.0 500.0 500.0 - 0.0% - - Contribution from Reserve Funds 101.4 123.3 308.0 308.0 125.0 (183.0) -59.4% 125.0 125.0 Contribution from Reserve -CCRF 2,508.3 2,035.9 1,951.6 1,951.6 1,966.5 14.9 0.8% 1,866.5 1,766.5 Sundry Revenues - - - - - - - - Required Adjustments -
Total Revenues 66,248.7 67,012.0 43,750.7 43,750.7 44,538.1 787.4 1.8% 46,518.9 45,725.0
Total Net Expenditures (3,050) (4,619) (100) (100) (100) 0.0 0.0% (700) (100) Approved Positions 529.5 529.5 397.5 397.5 397.5 - 0.0% 408.5 397.5
2014 Change from 2013 Budget
2014 Key Cost Drivers
Salaries and Benefits
An expenditure increase of $0.245 million includes $0.268 million for non-union merit and cost-of-living adjustments and $0.272 million for trade worker COLA as stipulated by union agreements, and it is partially offset by other wage and benefits decreases of $0.295 million.
Materials and Supplies
A decrease of $0.099 million on materials and supplies is driven by expenditure reductions to reflect the actual usage of utilities and equipment at Exhibition Place.
Services and Rent
A decrease of $1.265 million in services and rents is driven by additional recoverable revenue from clients of $1.697 million as a result of increased volume, partially offset by associated labour/costs for client services of $0.432 million.
www.toronto.ca/budget 2014 Page 18

2014 Operating Budget Exhibition Place
Contribution to Reserves / Reserve Funds
A $0.076 million decrease in contributions to Reserve funds comprised of $0.025 million decrease in contribution from Naming Rights revenue to the Conference Centre reserve fund due to an increase in branding costs, $0.050 million decrease in contribution to the Insurance Reserve Fund, $0.001 million for the Sick Leave Reserve Fund due to CNEA's independence.
Other Expenditure Changes
Additional expenditures of $1.983 million are the result of increased volume and associated expenditures for client services for $1.491 million, and increases in other expenses for $0.492 million consistent with the City's corporate inflationary increases guidelines.
Revenue Changes
User fee revenues reflect a $0.955 million increase over the 2013 Operating Budget revenues primarily due to volume changes in rental shows, parking revenues, various user fees at the National Soccer Stadium, and grossed up recoverable revenues that were previously reported on a net basis.
Contributions from Reserves / Reserve Funds
A decrease in withdrawal from reserve funds for $0.168 million includes a decreased draw of $0.183 million from the Sick Leave reserve fund in 2014 due to the independence of the CNEA (Canadian National Exhibition Association). It also includes an increase of $0.015 million in the budgeted draw from the Conference Centre reserve fund as a result of increasing principal and interest repayments on the Allstream Conference Centre loan.
www.toronto.ca/budget 2014 Page 19
2014 Operating Budget Exhibition Place
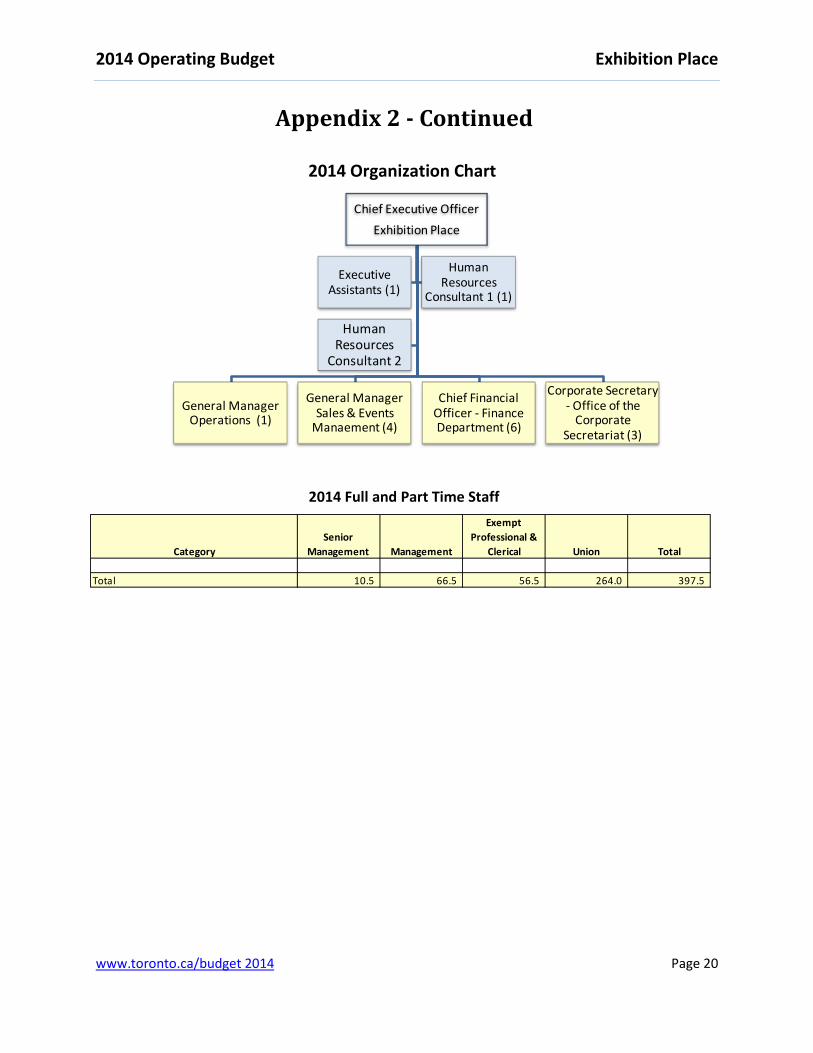
Appendix 2 - Continued
2014 Organization Chart
Chief Executive Officer Exhibition Place
General Manager Operations (1)
General Manager Sales & Events
Manaement (4)
Chief Financial Officer - Finance Department (6)
Corporate Secretary - Office of the
Corporate Secretariat (3)
Executive Assistants (1)
Human Resources
Consultant 1 (1)
Human Resources
Consultant 2
2014 Full and Part Time Staff
CategorySenior
Management Management
Exempt Professional &
Clerical Union Total
Total 10.5 66.5 56.5 264.0 397.5
www.toronto.ca/budget 2014 Page 20

2014 Operating Budget Exhibition Place
Appendix 5
Inflows/Outflows to/from Reserves & Reserve Funds Program Specific Reserve / Reserve Funds
(In $000s)
2014 2015 2016$ $ $ $
Projected Beginning Balance 3,633.8 3,633.8 3,310.2 2,531.7 Conference Centre Reserve Fund XR3019
ProposedWithdrawals (-) (1,966.5) (1,866.5) (1,766.5) Contributions (+) 1,643.0 1,088.0 1,088.0
3,633.8 3,310.2 2,531.7 1,853.2 Other program / Agency Net Withdrawals & ContributionsBalance at Year-End 3,633.8 3,310.2 2,531.7 1,853.2
2014 2015 2016$ $ $ $
Projected Beginning Balance 225.4 225.4 225.4 225.4 Vehicle Equipment Reserve- Exhibition Place XQ1702
ProposedWithdrawals (-) (329.8) (329.8) (329.8) Contributions (+) 329.8 329.8 329.8
225.4 225.4 225.4 225.4 Other program / Agency Net Withdrawals & ContributionsBalance at Year-End 225.4 225.4 225.4 225.4
Reserve / Reserve Fund
Number
Projected Balance as of Dec. 31, 2013
Proposed Withdrawals (-) / Contributions (+)
Reserve / Reserve Fund Name (In $000s)
Total Reserve / Reserve Fund Draws / Contributions
Reserve / Reserve Fund
Number
Projected Balance as of Dec. 31, 2013
Proposed Withdrawals (-) / Contributions (+)
Reserve / Reserve Fund Name (In $000s)
Total Reserve / Reserve Fund Draws / Contributions
www.toronto.ca/budget 2014 Page 21

2014 Operating Budget Exhibition Place
Appendix 5 - Continued
Corporate Reserve / Reserve Funds (In $000s)
2014 2015 2016$ $ $ $
Projected Beginning Balance 36,428.0 36,428.0 37,567.3 40,670.2 Sick Bank Reserve XR1007
ProposedWithdrawals (-) (50.0) (50.0) (50.0) Contributions (+) 50.0 50.0 50.0
36,428.0 36,428.0 37,567.3 40,670.2 Other program / Agency Net Withdrawals & Contributions 1,139.3 3,102.9 5,402.9 Balance at Year-End 36,428.0 37,567.3 40,670.2 46,073.1
2014 2015 2016$ $ $ $
Projected Beginning Balance 18,307.1 36,762.2 51,417.2 Insurance Reserve Fund XR1010 18,307.1
ProposedWithdrawals (-)Contributions (+) 399.1 399.1 399.1
18,307.1 18,706.2 37,161.3 51,816.3 Other program / Agency Net Withdrawals & Contributions 18,056.1 14,256.0 14,691.4 Balance at Year-End 18,307.1 36,762.2 51,417.2 66,507.7
2014 2015 2016$ $ $ $
Projected Beginning Balance 22,759.6 7,888.4 (6,782.8)Environmental Protection (Tree Planting) XR1718 22,759.6
ProposedWithdrawals (-) (75.0) (75.0) (75.0) Contributions (+) - - -
22,759.6 22,684.6 7,813.4 (6,857.8) Other program / Agency Net Withdrawals & Contributions (14,796.2) (14,596.2) (11,796.2) Balance at Year-End 22,759.6 7,888.4 (6,782.8) (18,654.0)
Total Reserve / Reserve Fund Draws / Contributions
Reserve / Reserve Fund
Number
Projected Balance as of
Dec. 31, 2013
Proposed Withdrawals (-) / Contributions (+)
Reserve / Reserve Fund Name
Reserve / Reserve Fund
Number
Projected Balance as of
Dec. 31, 2013
Proposed Withdrawals (-) / Contributions (+)
Reserve / Reserve Fund Name
Total Reserve / Reserve Fund Draws / Contributions
Reserve / Reserve Fund
Number
Projected Balance as of
Dec. 31, 2013
Proposed Withdrawals (-) / Contributions (+)
Reserve / Reserve Fund Name
Total Reserve / Reserve Fund Draws / Contributions
www.toronto.ca/budget 2014 Page 22

2014 Operating Budget Exhibition Place
Appendix 6
2014 User Fee Rate Changes Inflation and Other Adjustment
2013 2015 2016Approved
RateOther
AdjustmentBudget
Rate Plan Rate Plan Rate
Rental charge for use of facil ities Exhibitions & Events Market Based Per sq. ft.$0.085 to $0.168
$0.003 to $0.005
$0.088 to $0.173
$0.090 to $0.178
$0.093 to $0.183
General Parking on Exhibition Ground Exhibitions & Events Market Based Per car park per day $11 to $25 $11 to $25 $11 to $25 $11 to $25
Rental of meeting and ball room (various by size and time)
Conventions, Conference & Meetings Market Based Daily Rate per sq. ft.
$0.54 to $0.59
$0.54 to $0.59
$0.56 to $0.61
$0.56 to $0.61
2014
Rate Description Service Fee Category Fee Basis
www.toronto.ca/budget 2014 Page 23