Embed Size (px)
Citation preview
1
Monetary and Social Valuation: State of the Art
Socio-cultural Valuation and Valuation Methods:
Craig Bullock, Deirdre Joyce, Marcus Collier, Samantha Scholte, Boris Zanten, Peter Verburg, Astrid van Teeffelen, Katja Schmidt, Ariane Walz. November 2015
2
Bullock, Joyce, Collier, Schmidt, Walz, Scholte, Vervurg and Zanten
Prepared under contract from the European CommissionProject reference: 308393
Collaborative project
FP7 Environment
Project acronym: OPERAsProject full title: Operational Potential of Ecosystem Research ApplicationsStart of the project: 1 December 2012
Duration: 54 months
Project coordinator: The University of Edinburgh
Project website: operas-project.eu
Milestone title: Socio-cultural valuation: State of the Art
Deliverable number: 3.2
Nature of the deliverable: Discussion note
Work package responsible: WP3
Partner responsible: UCD
Other partners involved: IVM, UP, WWF
Due date of deliverable: November 2015
Actual submission date: December 2015
Deliverable status: Final
Version Status Date Editors
1.0 Final 15 May 2015
Monetary and Social Valuation: State of the Art
Contributing authors and institutionsSchool of Architecture, Planning and Environmental Policy, University College Dublin (UCD), IrelandCraig Bullock, Deirdre Joyce, Marcus Collier
Institute for Environmental Studies, VU University Amsterdam (IVM-VU), Amsterdam, The NetherlandsSamantha S. K. Scholte, Boris Zanten, Astrid J.A. van Teeffelen, Peter H. Verburg
University of Potsdam (UP)Katja Schmidt, Ariane Walz
World Wildlife Fund (WWF), Danube-Carpathian Programme, BulgariaMaya Todorova
AcknowledgementsThe research leading to the results in this deliverable has received funding from the European Com-mission Seventh Framework Programme under Grant Agreement No. FP7-ENV-2012-308393-2 (OP-ERAs).
i
ii
Bullock, Joyce, Collier, Schmidt, Walz, Scholte, Vervurg and Zanten
Table of contents
1. Introduction.....................................................................................................................1
2. Socio-cultural values and valuation..............................................................................32.1 Introduction..........................................................................................................32.2 Social cultural values........................................................................................4
2.2.1 Held values and principles..................................................................................5
2.2.2 Social-ecological values.....................................................................................6
2.3 Methods for socio-cultural valuation..........................................................72.4 Socio-cultural valuation in this deliverable.............................................92.5 References.............................................................................................................9
3. Multi-dimensional socio-cultural valuation methods................................................12
3.1 Introduction........................................................................................................12
3.2 Willingness to offset? Residents’ perspectives on compensating impacts from urban development through woodland restoration measures..............................................................................................................14
3.2.1 Introduction.......................................................................................................14
3.2.2 Study area........................................................................................................15
3.2.3 Methods............................................................................................................16
3.2.4 Results..............................................................................................................22
3.2.5 Discussion........................................................................................................31
3.2.6 Conclusion........................................................................................................33
3.3 Testing non-monetary methods for social valuation of ecosystem services to explain trade-off in land management in Scotland.....38
3.3.1 Introduction.......................................................................................................38
3.3.2 Study area: Pentland Hills................................................................................38
3.3.3 Methods............................................................................................................39
3.3.4 Results..............................................................................................................42
3.3.5 Discussion........................................................................................................46
3.3.6 Conclusion........................................................................................................47

Monetary and Social Valuation: State of the Art
4 Use of mapping and participatory mapping in socio-cultural valuation.................50
4.1 Introduction........................................................................................................50
4.2 Using choice modelling to map aesthetic values at a landscape scale: lessons from a Dutch case study.................................................51
4.2.1 Introduction.......................................................................................................51
4.2.2 Methods............................................................................................................52
4.2.3 Results..............................................................................................................59
4.2.4 Discussion........................................................................................................62
4.2.5 Conclusions......................................................................................................65
5 Applications of Socio-cultural valuation....................................................................70
5.1 Introduction........................................................................................................70
5.2 Public support for wetland restoration: What is the link with ecosystem service values?...........................................................................72
5.2.1 Introduction............................................................................................................72
5.2.2 Methods.................................................................................................................74
5.2.3 Results..............................................................................................................77
5.2.4 Discussion........................................................................................................82
5.2.5 Acknowledgements..........................................................................................86
5.3 Socio-cultural valuation of ecosystem services – A practical guide based on the use of deliberation...............................................................91
5.3.1 Conceptual Models for capturing SCV...................................................................91
5.3.2 Methods of or Socio-Cultural Valuation............................................................94
5.3.3 The Dublin Exemplar........................................................................................94
5.3.4 Discussion – Learning from SCV and key findings about the process...........105
6 Summary discussion..................................................................................................111
iii
Monetary and Social Valuation: State of the Art
1. IntroductionIn this deliverable report we first describe the nature of social or socio-cultural values and then introduce some of the methods that are being used to understand or elicit these values. The range of socio-cultural valuation methods described here is not comprehensive. A range of methods are available, some of which are multi-dimensional or analytical and others of which are more deliberative. The origins of these methods vary from an interest in the more instrumental approaches as used in economics to explain the basis of preferences and decision making, to methods from psychology or anthropology that have been developed with a primary intension of explaining the fundamental basis of values and choices. The selection of methods depends on the context and specific circumstances as well as the objective of any study, including whether or not the study is intended to inform decision or policy making. In the OPERAs project, the overall objective is one of devising methods that can operationallse the ecosystem services concept at a practical level. The ecosystem services concept is, itself, an anthropocentric one in terms of the perspective it takes on the relationship between nature and people. However, while all societies recognise the benefits that the natural environment provides, the nature of this relationship and the nation of “services” can vary considerably.
The deliverable is based on papers that have been submitted for publication or which are in preparation. There are additional papers and conference proceedings that have already been published as outputs of the project including, for example, Scholte et al. On Integrating socio-cultural perspectives into ecosystem service valuation: a review of concepts and methodologies (Ecological Economics, 2014). In addition, various exemplars within the OPERAs project have included socio-cultural valuation to varying degrees. Most especially this has included the on-going Firth-of-Forth exemplar which is using both deliberation and choice experiments.
In Chapter 2 we first commence with an introduction and discussion of the nature of socio-cultural values and socio-cultural valuation.
In Chapter 3 we illustrate a multidimensional approach to socio-cultural valuation based on two of the three OPERAs exemplars in Scotland. In the first of these, Samantha Scholte and colleagues from IVM Amsterdam explore the influence of socio-cultural values in the question of whether new environmental goods can compensate for new residential development in the urban fringe, in the process. A survey-based approach is applied including non-monetary choice experiment. In the second paper, Katja Schmidt and colleagues from the University of Potsdam (UP) use weighting and rating indices along with trade-off methods to examine landscape management preferences in an upland amenity area. Cluster analysis has is used to examine different preferences based on visitor and landscape characteristics. An objective has been to identify the role of ES in the rating exercise and the trade-offs.
In Chapter 4, Boris Zanten and colleagues from IVM Amsterdam discuss spatial approaches to SCV and the role of participatory mapping. They elicit both cultural values and social-ecological associations with landscapes with the assistance of photographs. The study builds on previous work by van Berkel and Verburg (2013), but includes attitudes towards functional ecosystem
1

2
Bullock, Joyce, Collier, Schmidt, Walz, Scholte, Vervurg and Zanten
service attributes along with more conventional visual attribute preference mapping. Using the cumulative selections from a choice modelling exercise in which landscape attributes are represented within a core set of landscape views, preference values are extended to a larger area to identify the values attached to spatial variation in landscapes.
In Chapter 5, we look at two applications of SCV. On this occasion, Samantha Scholte and colleagues from IVM and the World Wildlife Fund in Bulgaria discuss the role of socio-cultural values in perceptions of ES that could be impacted by wetland restoration along the OPERAs Bulgarian exemplar on the River Danube. The paper distinguishes between levels of awareness and the principal benefits in terms of well-being as this is perceived by fishermen, farmers and local residents. The study identifies the linkages that were found between awareness and benefits as these relate to regulating, provisioning and cultural ecosystem services. Principal components analysis is applied to interview data to identify the values of the different groups of people and their perceptions of the different environments found in the wetland with a view to indicating how stakeholders can best be encouraged to engage in the restoration or be incentivised.
In a second paper in this chapter, Deirdre Joyce of University College Dublin (UCD) applies a rather different approach to the preceding papers by exploring the contribution of deliberative methods to public engagement with ES in a coastal area north of Dublin which comprises the OPERAs Dublin exemplar. She introduces the merits or alternative approaches to socio-cultural valuation, the relationship with ecosystem services and the potential that such approaches have to inform local planning policy and governance.
Finally, in Chapter 6 we bring the insights from these chapters together to discuss the respective contribution of visual, spatial and mapping methods, and of multi-dimensional valuation approaches. Only by identifying and addressing the needs and values of different stakeholders can we aspire to effective and sustainable approaches to environmental and ecosystem management.
Monetary and Social Valuation: State of the Art
2. Socio-cultural values and valuation Craig Bullock
Based on a paper submitted to CAB Reviews
2.1 Introduction
One of the attractions of the concept of ecosystem services (ES) is that it can be used to demonstrate the value of ecosystems for human well-being and to ensure that politicians and policy-makers are correctly informed in situations where there could otherwise appear to be competing demands between economic growth and protection of the environment. This requires an understanding of the full range of values that people attach to their environment.
For the most part, these values have to date been represented either in ecological or economic terms. State-of-the-art economic values and valuation methods were discussed in the project deliverable associated with the preceding worktask. These have an attraction to policy makers because they use monetary measures to express changes in social welfare. They have immediate relevance to the trade-offs that these policy makers have to make between economic growth and other factors that contribute to well-being. An economic valuation aims to ensure that both individual and policy decisions are informed by evidence of the true social value of competing goods. This is a laudable objective many environmental goods, in particular, is not captured by market prices with the risk that these goods will be over-used or exploited. For these reasons, work on economic valuation represents an important output of the OPERAs project.
However, neo-classical economic theory presumes that decision making and consumer behaviour are informed by considerations of individual utility alone and ignores the social or ecological context (Georgescu-Roegen, 1971; Gowdy and Mayumi, 2001). There are other values that inform decision making, for example values associated with ethical principles or cultural traditions. These values are typically imprinted in a person to a varying degree with respect to the society and culture to which they belong (Kumar and Kumar, 2008). Consequently, these values are shared with those of the wider community and are often reinforced by a mutual dependence on the environment.
In this deliverable we firstly introduce this wider set of socio-cultural values. We provide examples of multi-attribute approaches to the estimation of these values. We also explore the influence of the spatial context on socio-cultural values. We illustrate these factors with work undertaken within some of the project exemplars and through examples drawn from outside of OPERAs. One objective is to demonstrate the particular methods needed to explore the role of socio-cultural values. We also aim to examine the potential for complementary or integrated approaches for both socio-cultural and economic valuation of ecosystem services. Diverse or integrated methods of valuation have relevance to governance and to institutional frameworks or policy tools for the management of environmental resources. An inclusion of socio-cultural values in ES research can be used to understand the role of rights, plural and shared values, the multi-causality of social, biophysical and social-ecological
3
4
Bullock, Joyce, Collier, Schmidt, Walz, Scholte, Vervurg and Zanten
influences, and interdependence between ecological processes and value systems (after (IPBES, 2015)).
2.2 Social cultural values
As research on the socio-cultural valuation of ES (within the ES framework) has only recently emerged, there is no common conceptualisation of what socio-cultural values are (Scholte et al., 2014). Rather, insights are lent by disciplines such as psychology, philosophy, sociology and different branches of economics such as ecological and behavioural economics. As noted above, we inherit certain values from our membership of the culture (or society) to which we belong and principles that guide our behaviour and way of life. These values vary for all individuals, but become socio-cultural values as they are informed by personal experience, social institutions and social interaction. They are reflected in our way of life, our sense of identity and are reinforced by social processes (Thrift and Whatmore, 2004). In other cases, purely utility-based values will be relevant to the motivations of individuals or groups. These too are a form of socio-cultural values.
Consequently, a plurality of values is present. This plurality immediately introduces an unwelcome complexity. Although socio-cultural values are anthropocentric, many can be assumed to be incommensurable and incapable of being reduced to a single entity such as willingness-to-pay (de Groot et al., 2002; Farber et al., 2002; Martinez-Alier et al., 1998). The emerging Intergovernmental Panel of Biodiversity and Ecosystem Services (IPBES) is currently grappling with the diverse conceptualisation of values as they exist between different individuals, stakeholders, communities and cultures. However, a recognition of the existence of different worldviews and value plurality, and the on-going development of methods that can account for all, or at least many, of these values, will ultimately strengthen the concept of ES by widening its relevance and acceptability.
A pluralistic approach to ecosystem service valuation necessitates a deeper investigation into types of socio-cultural values including shared and relational values. This requires that we distinguish between value heterogeneity between individuals and the role of contemporary social interactions or inherited cultural values that, for example, determine beliefs and attitudes to such topics as equity and morality. Socio-cultural values are particularly relevant to the tangible and less tangible benefits that people associate with cultural ecosystem services (CES) in that these deal with non-material benefits in which social activities and cultural values have an active influence (Chan et al., 2012). For example, the values attached by people to particular landscapes are heavily influenced by socio-cultural values as landscapes typically represent a co-evolution of natural and human influences. But it is also important to understand that socio-cultural values apply to all ecosystem service types as is, indeed, demonstrated by the paper on the Danube wetlands in this deliverable.. They are relevant to the significance that we place on provisioning services, for example where food production or harvesting involves a varying level of interaction with the ecosystem and one that if often guided by cultural practices. They are also relevant to our understanding and interpretation of supporting and regulating ecosystem services.
Monetary and Social Valuation: State of the Art
In any population there are likely to be divergent views and beliefs. An awareness of social heterogeneity is one of the keys to understanding the nature and diversity of socio-cultural values (Caceras et al., 2015). Power relations, income and property rights all affect access and attitudes to natural resources. Socio-cultural values are also scale dependent and will change as the sampled population becomes larger or includes people living at a greater distance from the source of particular ecosystem services. At all spatial levels there will be a range of stakeholders and the nature of their relationship to the ecosystem service, or the ecosystem service benefits, will certainly change with distance. A distance-decay relationship is typically presumed by economics whereby, at a distance, people may perceive a single site as only making a contribution to a total stock of substitutable sites (Zafonte and Hampton, 2007). However, in other cases, the same intensity of values may apply, particularly for non-use goods. Moreover, the very nature of the values will change, for example from an interest in provisioning services to a concern with cultural services, or vice-versa. Equally, while an ecosystem service could be critical to sustainable local livelihoods, it may also be of symbolic cultural importance.
Context is very important in this regard. The local context will determine the types of socio-cultural values and may comprise of a wider range of ecosystem services. There is the decision or choice itself, the situation to which it applies, whether other members of the community are affected, and whether the decision is “procedural” rather than “substantive” (Simon, 1979). Some decisions are routine and will be informed by familiar rules, whereas other higher-order decisions could involve more complex trade-offs (Hill, 2008). Time, place and immediate past experience are highly influential (Gowdy and Mayumi, 2001), but there is a role for habit, heuristics, inertia and endowments. There is also an input from different types of knowledge, i.e. perceptions, reason, traditional and scientific knowledge. Rather than a simple reliance on a “filing cabinet” (Hanemann, 1994) of past experience assumed by economists, environmental psychologists tend to favour process-based models of value construction whereby knowledge, values and preferences are context dependent and so subject to change.
While context provides a dynamic element, social norms and cultural rules can mean that values become anchored to certain inflexible principles or be insensitive to marginal changes in supply and demand (Sagoff, 2008). This means that people’s freedom to make choices or trade-offs that might maximise their own utility from a material perspective are restricted (Vatn, 2009). Rather than commensurability, these situations are characterised by non-compensatory behaviour. An example of this is provided by the paper of Scholte et al in this deliverable of environmental compensation in Scotland. If successful outcomes are to be found, these may require compromise rather than a logical trade-offs based on expression of free choice (Sen, 1973). However, as well as being scale and context dependent, values are also time dependent. Change may be slow in the face of established principles, but just as cultural norms can evolve over time, so too do socio-cultural values evolve in response to the wider social and cultural environment.
2.2.1 Held values and principles
Held values are the foundations of beliefs or conceptions of what is considered desirable or important (Lockwood, 1999; Scholte et al., 2014). These values are forged by the culture to which we belong and almost inevitably become internalised to a person’s own value system and identity (Kumar and
5
6
Bullock, Joyce, Collier, Schmidt, Walz, Scholte, Vervurg and Zanten
Kumar, 2008; 2004). Of these, eudaimonistic values are relevant to a person’s interpretation of what represents the “good life” (Jax, 2013).. Nature almost always has a relevance to cultures’ interpretation of what contributes to the good life (Church et al., 2011).
Ethical values are another form of held values. Ethical values are informed by deontological principles which guide people as to what is right or wrong (Berger and Luckmann, 1967),. These principles are in turn, typically a product of the cultural context. By definition, these necessarily take into account the needs and rights of others or other entities. Although, in principle, economic typologies of value, i.e. total economic value (see Deliverable 3.4), take into account vicarious or altruistic values, it is hard to see how ethical values can entirely coexist with personal utility motivations. Utility and ethics are often at odds.
Often, the management of resources has evolved to consider the needs or preferences of others or of the wider community. Such decisions are characterised by social rather than individual rationality. They can encompass altruistic concerns or a sense of citizenship as well as a sense of responsibility for future generations (Sagoff, 1988; Wilson and Howarth, 2002).
At a local level, much decision-making is informed by an awareness of shared dependence and reciprocity. Ethical or social considerations are especially likely to be associated with public goods where there shared dependence on provisioning, regulating or cultural services. In these circumstances, the benefits and costs of use are not divisible to the individual. Furthermore, access or use of public goods is often managed by the community using common property institutions or with reference to social-ecological rules and customs that have evolved over a long time. Relational values, i.e. where based on reciprocal arrangements (Kumar and Kumar, 2008), are frequently present and can form the bedrock of social capital.
2.2.2 Social-ecological values
Arguably, anthropocentric values are based on people’s inevitably limited understanding of the ecosystem and can be overly focused on certain broadly familiar species or functions that produce overtly desirable outcomes (Winkler, 2006). However, socio-cultural values can also involve a respect for the environment that reflects direct experience of nature. This experience can be acquired by people who have a direct interest in the environment, for example people who participate in activities that bring them into contact with the outdoors or nature. It includes also people whose livelihood brings them into direct contact with the environment or which involves a two-way interaction within ecological systems. These relationships do not fall neatly into the supplier-recipient relationship represented by ecosystem services. They can involve a respect for ecosystems that can sometimes extend to the extension of rights and responsibilities to nature. The relationship is exemplified by the value that people attach to natural entities including the concept of Mother Earth which is prevalent in parts of South America, but also evident in different forms in many traditional knowledge systems. Purely, eco-centric or bio-centric beliefs fall outside of the predominantly instrumental realm of the ecosystem service framework (Davidson 2013), but an appreciation of the rights of nature can fall within the scope of socio-cultural values and coexist with a belief in the instrumental values too.
Monetary and Social Valuation: State of the Art
Scholte et al (in this report) discuss how individuals can hold a continuum of values from purely instrumental to the more bio-centric.
Socio-cultural values and relationships towards the environment are also influenced by the uncertainty which applies to many natural systems and the complexity of relationships between humans and the natural environment. While economic theory assumes informed choices, in practice utility maximisation inevitably implies some level of risk. Dependence on uncertain or fickle natural systems often results in a need to adopt choices which are satisfying rather than utility maximising (Simon, 1979).. This usually implies a necessary aversion to risk for people on low incomes such as smallholder farmers in the developing world. (Lo, 2011). In addition, because many ES are also public goods, or are supplied by environments that are public goods, their long-term sustainability is incompatible with activities that are based on individual utility motivations (Vatn, 2009). Unfettered access to a natural resource could mean that its use succumbs to a short-lived free-for-all. Rather than the continuous substitution assumed by economics, there may be non-linear relationships between exogenous factors such as climate, habitats and species (Daily et al., 2000). Ecological thresholds may be present from which there is no return and to which probability based expectations are not applicable. An awareness of this uncertainty inevitably impacts on socio-cultural values.
2.3 Methods for socio-cultural valuation
Socio-cultural valuation (SCV) does not have the quality to reduce values to a single measure, but it does have the capacity to address a wide range of value types. There is no single method of valuation. Rather, the plurality of values needs a plurality of methods. Measures are available to represent socio-cultural values in quantitative or qualitative terms, but the processes whereby values are elicited and explored can be as useful as the measures themselves. The discipline from which a research problem is defined can determine how a problem is perceived and how values are articulated and recorded (Caceras et al., 2015; Radovich, 1981; Vatn, 2009). Ideally, however, the process of value articulation is intended to be as unobtrusive as possible with the objective of providing firmer foundations by which to assess social values for ecosystem services.
Single or group interviews can be used for the purpose of content-based analytical approaches to record, transcribe and code recurring words, phrases or value types. Structured or semi-structured interviews can be performed. The latter involves a pre-defined set of questions which can be presented to interviewees in a flexible manner while permitting them to talk freely about a particular issue. Alternatively, structured questionnaires can be designed, for example to identify subsets of participants who share common perspectives or values by asking them to rate certain topics for the purposes of factor or principal components analysis. Similarly, the Q-methodology can be used based on participants’ rating of various expressions of opinion or statements (Singh, 2015).
These qualitative or quantitative research methods can also proceed the use of group discussions. The virtue of group methods is that they allow participants to discuss, reflect and debate their respective points of view or behaviour. Deliberation can be used to discuss socio-cultural values. Typically, this takes the form of workshops, either single workshops with different groups of participants, or a series of workshops with the same participants. The objective is to introduce
7
8
Bullock, Joyce, Collier, Schmidt, Walz, Scholte, Vervurg and Zanten
relevant information and to encourage participants to discuss the respective values that they have. Deliberation conforms to the process of value construction favoured by psychologists. A facilitator may advise on technical matters, but the more important insight is that provided by the participants themselves (Haines-Young and Potschin, 2014). Participants do though engage in a process of social learning. They can discuss alternative courses of action and learn from other participants’ perspectives and values.
Citizen juries are a more formalised deliberation exercise (Alvarez-Farizo and Hanley, 2006; Kenyon et al., 2003; Smith and Wales, 1990). Relevant information and arguments are introduced, sometimes formally in the form of presentations by stakeholders or experts. Participants are encouraged to debate and discuss the information and its merits from the perspective of citizens and to arrive at a consensus position.
Analytical deliberation aims to record the process of deliberation using quantitative measures. Scoring and cluster analysis can be introduced into the process. Deliberative monetary valuation is a method that uses workshops as a means to provide more considered monetary estimates for the purposes of economic valuation (Spash, 2007). This process can be used to improve the reliability of values over successive phases of deliberation (Kenter, 2014). However, deliberative monetary valuation is still vulnerable to the criticism of a reliance on the singular dimension of willingness-to-pay as a means of value articulation. The process will certainly have allowed monetary values to be refined over successful workshops, but useful information on the range of values and their origin is consigned to the record of the process.
Participatory mapping can be used to identify spatial variation in ES and areas of high socio-cultural values (Alessa et al., 2008; Plieninger et al., 2013; Raymond et al., 2009). This can be of direct relevance to environmental management by identifying hotspots of cultural or other ES or valued combinations of landforms most associated with ecosystem services. However, participatory mapping is equally of value for strengthening the deliberation process and for teasing out the various tangible and intangible values that might be present (Gould et al., 2014).
A challenge in the present context is how to introduce the concept of ES into deliberation. In a review of a number of UK stakeholder consultation exercises, Haines-Young and Potschin (2014) acknowledge the difficulty of effectively communicating the concept of ES concept even after numerous rounds of deliberation. To this end, the emphasis may vary from discussion of quality of life, benefits to people, or the protection of biodiversity and ecosystems (IPBES, 2015). In communities engaged in social-ecological systems it might be possible to introduce the notion of ES at an early stage as participants will already have a good familiarity with the functions of the natural environment, albeit one that might not readily conform to the provider-recipient relationship assumed by the ES concept. In other cases where people’s familiarity with the natural environment is principally realised through amenity, it could be difficult to commence with a concept that could be judged to be unfamiliar or complex. It can also be challenging to disentangle cultural or other ES from non-environmental factors (Bieling et al., 2014; Kumar and Kumar, 2008). In these cases, it might be better to commence the deliberation with a discussion of benefits provided by the environment or issues that people have with the management of the environment before introducing the ES concept.
Monetary and Social Valuation: State of the Art
2.4 Socio-cultural valuation in this deliverable
In this deliverable report, we present a variety of methods that have been used in the OPERAs project to examine socio-cultural values or to draw on these values for the purpose of informing environmental or planning policy. The next deliverable chapter introduces two examples of multi-dimensional methods that have used a combination of more interviews and analytical methods, including choice experiments, and scoring, weighting and cluster analysis, to examine the contribution of socio-cultural values to the selection of alternative future scenarios. The following chapter discusses the inclusion of ES in mapping and participatory mapping and compares the results with more conventional approaches to landscape preference assessment. The final chapter presents two more applications of SCV, one more multi-dimensional in that it uses a combination of interviews and choice experiments, and the other an example of the use of deliberation to explore the nature of fundamental socio-cultural values associated with a coastal environment.
Each of the methods overlaps in various ways. Varying use is made of consultation in the respective approaches to stakeholder engagement. More than one of the studies makes use of participatory mapping. The methods are not exclusive. Some of the studies relate to work that is on-going and which is expected to make greater use of multi-criteria analysis or of the TESSA scenario analysisas the projects progress.
2.5 References
Alessa, L., Kliskey, A., Brown, G., 2008. Socio-ecological hotspot mapping: A spatial aprpaoch to identifying coupled social-ecological space. Landscape and Urban Planning 85, 27-39.
Alvarez-Farizo, B., Hanley, N., 2006. Improving the process of valuing non-market benefits; combining citizens' juries with choice modelling. Land Economics 82, 465-478.
Berger, P., Luckmann, T., 1967. The Social Construction of Reality. A Treatise in the Sociology of Knowledge. Penguin Books, London.
Bieling, C., Plieninger, T., Pirker, H., Vogl, C.R., 2014. Linkages between landscapes and human well-being: An empirical exploration with short interviews. Ecological Economics 105, 19-29.
Caceras, D.M., Tapella, E., Quetier, F., Diaz, S., 2015. The social value of biodiversity and ecosystem services from the perspectives of different social actors. Ecology and Society 20.
Chan, K.M.A., Guerry, A.D., Balvanera, P., Klain, S., Satterfield, T., Basurto, X., Bostrom, A.N.N., Chuenpagdee, R., Gould, R., Halpern, B.S., Hannahs, N., Levine, J., Norton, B., Ruckelshaus, M., Russell, R., Tam, J., Woodside, U., 2012. Where are Cultural and Social in Ecosystem Services? A Framework for Constructive Engagement. BioScience 62, 744-756.
Church, A., Burgess, J., Ravenscroft, N., 2011. Cultural Ecosystem Services, UK National Ecosystem Assessment (UK NEA).
Daily, G., Soderqvist, T., Aniyar, S., Arrow, L., Dasgupta, P., Ehrlich, P.R., Folke, C., Jansson, A.-M., Jansson, B.-O., Kautsky, N., Levin, S., Lubchenco, J., Maler, K.-G., Simpson, D., Starrett, D., Tilman, D., Walker, B., 2000 The value of nature and the nature of value. Science 289, 395-396
9
10
Bullock, Joyce, Collier, Schmidt, Walz, Scholte, Vervurg and Zanten
de Groot, R.S., Wilson, M.A., Boumans, R.M.J., 2002. A typology for the classification, description and valuation of ecosystem functions, goods and services. Ecological Economics 41, 393-408.
Farber, S.C., Constanza, R., Wilson, M.A., 2002. Economic and ecological concepts for valuing ecosystem services. Ecological Economics 41, 375-392.
Georgescu-Roegen, N., 1971. The Entropy Law and the Economic Process. Harvard University Press, Cambridge, MA.
Gould, R.R., Klain, S.C., Ardoin, N.M., Satterfield, T., Woodside, U., Hannahs, N., Daily, G.C., 2014. A protocol for eliciting nonmaterial values through a cultural ecosystem services frame. Conservation Biology 29, 575-586.
Gowdy, J.M., Mayumi, K., 2001. Reformulating the foundations of consumer choice theory and environmental valuation. Ecological Values 39, 223-237.
Haines-Young, R., Potschin, M., 2014. The ecosystem approach as a framework for understanding knowledge utilisation. Environment and Planning C 32, 301-319.
Hanemann, M., 1994. Valuing the environment through contingent valuation. Journal of Environmental Perspectives 8.
Hill, C.A., 2008. The rationality of preference construction (and the irrationality of rational choice). Minnesota Journal of Law, Science and Technology 9, 689-742.
IPBES, 2015. Preliminary guide regarding diverse conceptualization of multiple values of nature and its benefits, including biodiversity and ecosystem functions and services. Draft 29 December 2014. Intergovernmental Science-Policy Platform on Biodiversity and Ecosystem Services, Bonn, Germany
Jax, K.e.a., 2013. Ecosystem services and ethics. Ecological Economics 93, 260-268.
Kenter, J.O., 2014. Valuing the Inner Forth: Final Report to the Inner Forth Landscape Initiative. IFLI/University of Aberdeen, Falkirk/Aberdeen, Scotland.
Kenyon, W., Nevin, C., Hanley, N., 2003. Enhancing environmental decision-making using citizens' juries. Local Environment 8, 221-232.
Kumar, M., Kumar, P., 2008. Valuation of the ecosystem services: A psycho-cultural perspective. Ecological Economics 64.
Lo, A.Y., 2011. Analysis and democracy: the antecedents of the deliberative approach of ecosystems valuation. Environment and Planning C 29, 958-974.
Lockwood, M., 1999. Humans valuing nature: Synthesising insights from philosophy, psychology and economics. Environmental Values 8, 381-401.
Martinez-Alier, J., Munda, G., O'Neill, J., 1998. Weak comparability of values as a foundation for ecological economics. Ecological Economics 26, 277-286.
Plieninger, T., Dijks, S., Oteros-rozas, E., Bieling, C., 2013. Assessing, mapping and quantifying cultural ecosystem services at community level. Land Use Policy 33, 118-129.
Radovich, J., 1981. The collapse of the California sardine fishery. What have we learned?, in: Glantz, M.H., Thompson, J.D. (Eds.), Resource management and environmental uncertainty: lessons from coastal upwelling fisheries. Wiley, New York.
Raymond, C.M., Bryan, B.A., MacDonald, D.H., Cast, A., Strathearn, S., Grandgirard, A., Kalivas, T., 2009. Mapping community values for natural capital and ecosystem services. Ecological Economics 68, 1301-1315.
Sagoff, M., 1988. The Economy of the Earth: Philosophy, Law and the Environment. Cambridge University Press, Cambridge.
Sagoff, M., 2008. On the economic value of ecosystem services. Environmental Values 17, 239-257.
Monetary and Social Valuation: State of the Art
Scholte, S.S.K., van Teeffelen, A.J.A.v., Verburg, P.H., 2014. Integrating socio-cultural perspectives into ecosystem service valuation: a review of concepts and methodologies. Ecological Economics.
Sen, A.K., 1973. Behaviour and the concept of preference. Economica 40, 241-259.
Simon, H., 1979. From substantive to procedural rationality, in: Hahn, F., Hollis, M. (Eds.), Philosophy and Economic Theory.
Singh, A.K., 2015. Social Psychology. PHI Learning Private Limited, Delhi.
Smith, G., Wales, C., 1990. The theory and practice of citizens' juries. Policy and Politics 27, 295-308.
Spash, C.L., 2007. Deliberative monetary valuation (DMV): Issues in combining economic and political processes to value environmental change. . Ecological Economics 63, 690-699.
Thrift, N., Whatmore, S., 2004. Cultural Geography: Critical Concepts in the Social Sciences. Routledge, London and New York.
van Berkel, D.B., Verburg, P.H., 2013. Spatial quantification and valaution of cultural ecosystem services in an agricultural landscape Ecological Indicators.
Vatn, A., 2009. An institutional analysis of methods for environmental appraisal. Ecological Economics 58, 2207-2215.
Wilson, M.A., Howarth, R.B., 2002. Discourse-based valuation of ecosystem services: establishing fair outcomes through group deliberation. Ecological Economics 41, 431-443.
Winkler, R., 2006. Valuation of ecosystem goods and services: Part 1: An integrated dynamic approach. Ecological Economics 59, 82-93.
Zafonte, M., Hampton, S., 2007. Exploring welfare implications of resource equivalency in natural resource damage assessments. Ecological Economics, 134-145.
11
12
Bullock, Joyce, Collier, Schmidt, Walz, Scholte, Vervurg and Zanten
3. Multi-dimensional socio-cultural valuation methods
3.1 IntroductionThis chapter examines the merits of using a variety of multi-dimensional methods to identify, and quantify, social or socio-cultural values. As has been discussed, socio-cultural values are diverse and can be expressed by a similarly diverse range of preferences for ecosystem services. Consequently, this diversity can be best explored through the use of a range of methods. In addition to the use of deliberative methods, this chapter illustrates how non-monetary, more quantitative methods can be used to demonstrate the influence of socio-cultural values on preferences, specifically where different ecosystem services are captured within scenarios of landscape change. Visualisation methods are shown to be useful for communicating landscape changes. Methods that require survey respondents to trade-off ecosystem service preferences are examined, specifically the use of weighting methods and non-monetary choice experiments without the inclusion of an economic pricing attribute.
The chapter presents two papers that have been produced by OPERAs to examine the use of multi-dimensional methods for socio-cultural valuation. In the first paper by Schmidt et al., the role of ecosystem services is explored through landscape preferences. The paper examines the relative value and reliability of non-monetary rating and weighting methods to identify varying preferences towards ecosystem services and landscape features. Visitors to a natural park are presented with alternative landscape scenarios comprising nine ecosystem services. These services are rated using a five point Likert scale and these results are compared with those from a weighting exercise in which respondents had to trade-off their perceptions of the same set of ecosystem service attributes by allocating 100 points between each. A cluster analysis is applied which identifies five distinctive preference groupings. Of these, almost half of the respondents (48%) fell into the “nature lover” category, whereas “recreation seekers” comprised only 15% of the total despite the high level of recreational use. The rating exercise identifies distinctive differences between ecosystem service preferences, but that physical use of the landscape receives distinctly more points in the weighting exercise, although preferences in this exercise are guided by a smaller number of ecosystem services.
In the second paper, Scholte et al. examine the relevance of ecosystem services to the pertinent issue of environmental compensation, or offsets, specifically the planting of new woodland in compensation for new housing development in the East Lothian area of Scotland near Edinburgh. In common with the urban periphery in other European cities, the authors find that people living in this semi-rural area place a high value on the ecosystem services associated with the landscape, its wildlife and other natural features.
Scholte et al apply a choice experiment approach to capture people’s values for the multifunctional nature of the landscape. Visualisation is used to demonstrate potential changes to the landscape due to the addition of woodland or new houses. In addition, latent class analysis was included in the choice experiment to identify the sources of heterogeneity in the community. In recent years, heterogeneity within choice experiments has often been addressed through the use of mixed logit.
Monetary and Social Valuation: State of the Art
However, mixed logit only identifies the variables contained within an experiment that are the source of the heterogeneity. Latent class analysis, originally applied in this context by Boxall and Adamowicz (2002) has the merit that heterogeneous population subsets can be identified in advance using methods such as factor analysis before the heterogeneity is examined further through the use of a non-monetary choice experiment. In the current example, the latent class model showed that only two of the four population subclasses accepted the potential for woodland compensation and that these classes placed a positive value on woodlands, if not necessarily all the same types of woodland. Other groups were more reluctant to exchange land for development in return for woodland (as indicated by a low marginal rate of substitution). Scholte et al. how the latter result may be due as much to the social attitudes of the indigenous population towards new migrants, as they are to socio-cultural values associated with ecosystem services that provide for sense of place. The paper also discusses the practical contribution of choice experiments to people’s valuation of, and association with, the landscape. As in the Zanten et al. paper, it is noted how choice experiments inevitably focus on attributes of the landscape rather than adopting a holistic perspective that could be assumed by many people. On the other hand, this approach may be well suited to ecosystem services which may tend to be associated with particular features relevant to ecosystem functions such as habitats, including woodlands and types of woodlands.
13
14
Bullock, Joyce, Collier, Schmidt, Walz, Scholte, Vervurg and Zanten
Paper 1
3.2 Willingness to offset? Residents’ perspectives on compensating impacts from urban development through woodland restoration measuresSamantha S. K. Scholte Based on paper submitted to Land Use Policy
3.2.1 IntroductionUrbanization is a key driver of land use change (Liu et al., 2014; Seto et al., 2011; Song et al., 2015).
In Europe, cities have tended to expand in a dispersed rather than compact manner (Salvati and
Carlucci, 2015). Dispersed growth – commonly referred to as urban sprawl - is characterized by low-
density development patterns due to changing population characteristics and lifestyles (Camagni et
al., 2002). The dispersion of urban settlements has led to significant environmental impacts as a
consequence of land take and demand for transport and energy (Bart, 2010). These developments
affect the functioning of habitats and the species that rely on these habitats (Braaker et al., 2014;
Pauleit et al., 2005).
In addition to biodiversity impacts, development activities in rural areas also affect the benefits people
derive from such landscapes, i.e. ecosystem services (ES). The benefits associated with rural
landscapes are no longer limited to single agricultural products; instead these ‘multi-functional’
landcapes are increasingly valued in terms of multiple goods and services (Munton, 2009; Zasada,
2011), including, for example, food production, recreation, and tourism. Rural landscapes are
bestowed with cultural heritage values that place emphasis on the conservation of the traditional
character of agricultural landscapes, small-scale farming and consumption of local products (Hall et
al., 2004). Furthermore, the cultural importance of rural landscapes is strongly reflected by the
emotional bonds people have with such landscapes, often referred to as sense of place or place
attachment (Lokocz et al., 2011; Soini et al., 2012; Walker and Ryan, 2008).
The growing concern about negative impacts from urbanization has led to a large set of policy
instruments to manage urban growth and minimize its impact on open space (Bengston et al., 2004;
Westerink et al., 2013). These instruments include steps to avoid, reduce and offset impacts on the
environment, the so-called ‘mitigation hierarchy’ (BBOP, 2012). Particularly the last step, biodiversity
offsets - which aim to ensure that unavoidable adverse environmental impacts of development are
Monetary and Social Valuation: State of the Art
counterbalanced by environmental gains to achieve a net neutral or beneficial outcome aim - is
receiving much attention (Maron et al., 2015; McKenney and Kiesecker, 2010; Moilanen et al., 2009).
The large majority of policies and studies dealing with environmental compensation have typically
focused on biodiversity, protected habitats and species, and have neglected the impact of
development on ESs (Brownlie et al., 2013; Tallis et al., 2015). This is problematic as environmental
compensation is also intended to protect people from environmental degradation associated with
development (Villarroya et al., 2014, Persson 2013). Environmental compensation efforts could follow
a more holistic approach that includes both biodiversity and ESs, taking into account both ecological
and social impacts. The European Commission aims to address this gap ‘ (NNL) initiative as part of
the EU Biodiversity Strategy to ensure no-net-loss of biodiversity and ESs (Tucker et al., 2013).
To offset negative development impacts on biodiversity and ESs in rural landscapes, the restoration
of landscape elements, e.g. hedgerows, and woodland patches, has been suggested (Fischer et al.,
2006; Rey Benayas and Bullock, 2012). The effect of such pathways on improving habitat connectivity
for plant and animal species has been widely studied (e.g., Benton et al., 2003; Van Teeffelen et al.,
2015), but to our knowledge no effort has been made to study the public perception of such
restoration measures and their relation to social values for ESs. As part of the OPERAs project, we
investigated the potential of environmental compensation measures to offset the impact of urban
sprawl on biodiversity and ESs from a social perspective. We examined how local residents evaluate
the use of environmental compensation, in the form of added landscape elements, in a rural
residential development context. The specific aims were (i) to measure the extent to which residents’
are willing to accept the offsetting of additional housing through restoration of landscape elements and
associated ESs, (ii) to assess what type of environmental compensation is preferred, and (iii) to
explain residents’ preferences by looking at attitudes towards residential development, values for ESs
and socio-demographic variables. To test this we conducted a choice experiment in Scotland, where
the number of households is expected to increase by 21% between 2008 and 2033 (GROS 2010).
This increase poses a large challenge for the Scottish government to meet the related housing
demand. The pressure for residential development in peri-urban and rural areas has been the basis
for much conflict and ‘has transformed the rural environment on the periphery of many of Britain’s
cities into a battle ground’ (Pacione, 2013).
3.2.2 Study areaOur study region, East Lothian, is one of the 32 council areas in Scotland (Fig 1.), covering an area of
679 km² east from Edinburgh, for which large population increases are expected. The population was
estimated at 101,360 people in 2013 and is expected to grow by 10.3% to 111,800 in 2022 (East
Lothian Council).
15
16
Bullock, Joyce, Collier, Schmidt, Walz, Scholte, Vervurg and Zanten
The lowlands in East Lothian are one of the largest areas of high-quality farmland in Scotland. Since
the 1940s, agricultural intensification has led to wide-spread loss of (semi-)natural habitats in (Ghaffar
and Robinson, 1997). In 2000, the native woodland cover of East Lothian comprised only 0.9% of the
total land area. In addition, lack of management had resulted in farm woodlands, especially
hedgerows, becoming fragmented. While broadleaved woodland was subject to large-scale felling in
the post-war period, the overall woodland cover increased because of the plantation of softwoods and
mixed woodlands . Overall, since the 1940s, the area has shown an increase in coniferous
plantations, built land, transport corridors, recreation facilities (mostly golf courses), and bare ground
(for mining/quarrying). At the same time this has led to a decrease in natural grasslands, broadleaved
woodland, parkland and hedgerows in the area (East Lothian Fourth Statistical Account Society,
2003).
The demand for new housing is estimated at around 5,000 dwellings per year for the entire area of
Edinburgh and the Lothians. Brownfield land is prioritized in the allocation of new housing areas, but
these areas are not adequate to meet the housing demand, making the loss of greenfield sites
unavoidable. As additional housing is prohibited on greenfield sites within the green belt surrounding
the city of Edinburgh, this has forced development to be allocated to areas in the rural countryside
(Edinburgh and the Lothians Structure Plan 2015).
3.2.3 MethodsTo analyse how respondents evaluate the use of woodland restoration to compensate for additional
housing in the East Lothian, we used a Discrete Choice Experiment (DCE). Choice experiments are
specifically suited to evaluate marginal landscape changes and trade-offs between landscape
attributes (de Ayala et al., 2015; Domínguez-Torreiro and Soliño, 2011). Since the multifunctional
character of rural landscapes is increasingly emphasized , choice experiments are frequently used to
investigate public preferences for benefits provided by rural landscapes (e.g., de Ayala et al., 2015;
Grammatikopoulou et al., 2012; Newell and Swallow, 2013; Vecchiato and Tempesta, 2013). In our
study, we tried to better comprehend respondents’ preferences for rural landscape options by
complementing the choice experiment with an assessment of the importance people assign to the
ESs that can be provided by the rural countryside. We considered respondents’ values for ESs, the
ESs respondents attributed to environmental compensation measures, and the attitudes of
respondents towards additional housing in East Lothian.
Questionnaire design The questionnaire consisted of five parts. In the first part we asked respondents about their current
use of, and familiarity with, the East Lothian landscape. This part of the questionnaire included
questions regarding recreational activities and residency in East Lothian, including whether
respondents grew up in East Lothian.
Monetary and Social Valuation: State of the Art
In the second part of the questionnaire we asked respondents to evaluate a set of ESs, so that we
could assess how their choice for environmental compensation could be explained by perceptions of
the landscape. We chose to include nine ESs in this study: Air quality, climate change mitigation (by
carbon sequestration), support of agricultural production, the provision of timber, tourism, recreation,
the traditional character of the landscape, aesthetic quality, and biodiversity 1. We based the selection
of these ESs on scientific literature and policy reports about ESs and important woodland functions in
rural and peri-urban landscapes in the UK (Haines-Young and Potschin, 2008; Nijnik and Mather,
2008; Swanwick et al., 2007). As the ESs concept tends to be rather abstract for lay people, we made
pictograms for the nine ESs, explaining these as the benefits that are provided by the East Lothian
countryside. We asked people to point out those three services which they found most important for
their own personal well-being. This included which ES they associated most with each of the
proposed environmental compensation measures: shelterbelts, softwood forest and broadleaved
forest (the choice of which we explain in section 3.3.1.).
A key assumption in our study was that additional housing was perceived as a threat to the landscape
by local residents. To test the validity of this assumption, in the third part of the questionnaire, we
tested the respondents’ attitudes towards additional residential development in East Lothian. We
included four statements which respondents had to evaluate on a 5-point Likert scale. Additionally we
asked respondents which ES, if any, they thought would be most impacted by residential
development.
After the general questions about people’s familiarity, use and perception of the East Lothian
landscape, we presented the choice experiment (of which the specifics will be explained in section
3.3.). We showed respondents photos of the different compensation measures and asked them
whether they thought the addition of these landscape elements would improve the East Lothian
landscape. We then asked them to choose between choice sets in which restoration of woodland
types could act as compensation for additional residential development. After the choice experiment
we asked respondents several control questions to see to what attribute they had paid most attention
to and whether they thought that the proposed woodland restoration would be adequate and/or
necessary to compensate for residential development in East Lothian.
Data collectionWe conducted the survey using face to face interviews with local residents in October 2014, after
having done a pilot study in July 2014. In total, 258 respondents were interviewed. For data analysis
we excluded all respondents who, after being asked to what attributes in the choice experiment they
paid most attention, had explicitly stated that they had ignored the attributes in the choice experiment
but had rather based their decision on the overall impression of the photo. This reduced our sample to
240 respondents for further analysis, resulting in 1920 observations for the choice model estimation.
1 We conceptualize support of biodiversity as a warm-glow value, which reflects the satisfaction people may derive from al-truism towards nature. As such, it can be considered a benefit to humans and thus an ecosystem service (Davidson, 2013).
17
18
Bullock, Joyce, Collier, Schmidt, Walz, Scholte, Vervurg and Zanten
The choice experimentIn the choice experiment the agricultural landscape was the good and differed in each alternative
according to a set of landscape attributes, i.e. the environmental compensation measures, and a
housing attribute, representing different levels of potential additional housing in East Lothian.
Respondents were consequently asked to choose, on the basis of these attributes, the alternative
they preferred most.
Identification of landscape attributesTo inform the choice of landscape attributes in the choice experiment, two focus group sessions and a
pilot study (n=20) were held in July 2014. One focus group meeting included four local councillors,
from the spatial planning department, cultural heritage department and wildlife department. The other
focus group meeting included one local councillor and three advisors for the Lothians Fife and Green
Network Partnership. Four specific woodland types were considered: softwood forests, native forests,
mixed woodland and urban woodlands. Softwood forests are commonly associated with commercial
timber plantations, but recently more effort has been put in restructuring softwood forests to improve
their contribution to recreational opportunities, biodiversity and landscape quality. Mixed woodlands
usually consist of a mix of native species and contribute much to the landscape character of the
region’s rural areas, mostly in the form of shelterbelts or patches of forest around the edges of
agricultural fields. Native forests are mostly found in the riparian corridors of the Lothians, which have
remained inaccessible to intensive agriculture and development pressures. We chose to focus on the
creation of new softwood forests and mixed woodlands as compensation measures relevant for our
study context. We split up mixed woodlands into shelterbelts and (patches of) broadleaved forest.
Mixed woodlands may consist of a mix of both broadleaved and coniferous trees, but are mostly
dominated by broadleaved species. To put emphasis on the presence of broadleaved species we
therefore termed this landscape attribute ‘broadleaved forest’.
Monetary and Social Valuation: State of the Art
The housing attributeCommonly, choice experiments include a price attribute, in the form of some type of payment or
compensation , that is used to estimate the change in welfare related to changing attribute levels. The
coefficient of the price attribute can be interpreted as a marginal utility of income and can
consequently be used to calculate the willingness to pay (WTP) for a certain attribute. The proper use
and framing of a payment vehicle in environmental research, however, is complicated due to the fact
that people are not used to paying for most environmental goods and services (Burney, 2000) or may
even refuse to pay for them (García-Llorente et al., 2011; Svedsater, 2003). In addition, the
calculation of price estimates for environmental goods and services is not always necessary nor
sufficient to advance our understanding of environmental preferences and choices (Adamowicz, 2004;
Kerr and Sharp, 2008; Vatn and Bromley, 1994). It is also possible to study the impact of
environmental change by considering the marginal rates of substitution between (non-monetary)
environmental choice attributes (e.g., Aravena et al., 2014; Cleland et al., 2015)
Since it was not our intention to estimate the willingness to pay for landscape changes, but rather to
assess how people make trade-offs between levels of additional housing and different woodland
restoration types, we decided not to include a price attribute. For the policy context of our study it was
more relevant to gain insight into the direction of preferences for compensation measures and the
marginal rates of substitution between housing and environmental compensation. In addition we did
not want to make the choice experiment overly complicated by introducing a varying price attribute on
top of the variation in housing, which might have led to a high cognitive burden on the respondents
(Aravena et al., 2014).
The housing attribute levels were set at 250, 500, 750 and 1000 houses. These levels were based on
results from the pilot study, where people were asked what the maximum amount of housing was that
they were willing to allow. We explained to respondents that the additional housing would take place
directly surrounding existing settlements and that the development would be small-scale and in
character of the settlement or the local area (as stated by the Edinburgh and Lothians Structure Plan
2015).
Table 1. Choice attributes. Status quo attribute levels are given in bold.Attribute Description Levels
Shelterbelts The addition of shelterbelts to the landscape None, Low, Medium, High
Softwood forest The addition of softwood forest to the landscape in patches along the edges of agricultural fields or replacing agricultural fields
None, Low, Medium, High
Broadleaved forest
The addition of broadleaved forest to the landscape in patches along the edges of agricultural fields or replacing agricultural fields
None, Low, Medium, High
Houses Amount of additional houses to be built in East Lothian (per year) 250 (16ha), 500 (32ha), 750 (48ha), 1000 (64ha)
19
20
Bullock, Joyce, Collier, Schmidt, Walz, Scholte, Vervurg and Zanten
Experimental design of the choice experimentTo obtain the choice sets an experimental design is used to combine all the attributes, according to
the different attribute levels, within each alternative. In our case, a full factorial design including all
possible alternatives would lead to 256 distinct alternatives (as we have four attributes, each with four
different levels) which is unwieldy. We therefore used a fractional factorial design, specifically a
randomized balanced overlap design using Sawtooth software (www.sawtoothsoftware.com), to
reduce the number of alternatives. Randomized designs are constructed as to account for (i) minimal
overlap, i.e. showing each attribute level as few times as possible in a single choice set, (ii) balanced
levels, i.e. showing each attribute an equal number of times overall, and (iii) orthogonality, i.e.
choosing attribute levels independently from each other so that each attribute level’s effect can be
measured independently from all other effects. To look into possible interactions between attributes,
this design allows for some overlap between attributes within choice tasks without losing much
precision in the estimates of main effects.
Our final design consisted of 64 choice sets which we blocked into eight different versions.
Respondents were thus confronted with eight choice sets that consisted of three options: a baseline
scenario (i.e. status quo) plus two alternatives. In the baseline scenario, no environmental
compensation was offered and the amount of houses to be built in East Lothian was kept at a
minimum (250).
Model specificationChoice models are based on the assumption that individuals will choose the alternative that
maximizes their utility, i.e. provides the greatest utility U. Following Random Utility Theory (RUT)
(McFadden, 1974), the utility of an individual i from choosing an alternative j consists of a systematic
component vij and a random error component ε ij, so that
U ij=v ij+εij (1)
where vij is a term which depends on observable explanatory variables and ε ij is random variable
following a standard Gumbel distribution with a location parameter of 0 and a scale parameter of 1.
The systematic component V ij can also be denoted as
V ij=β i X ij (2)
where X is a vector of explanatory variables, i.e. attributes (with different levels), and β is a vector of
individual specific utility parameters.
A wide range of methods exists to analyze choice experiment data of which the conditional logit (CL)
model has been most standard. A strength of the CL model is its simplicity, but the model also as -
Monetary and Social Valuation: State of the Art
sumes that respondents have identical preferences. Though it is possible to take into account some
observed preference heterogeneity through interaction terms, other models have been proposed to
relax the homogeneity assumption and to account for unobserved heterogeneity (Boxall & Adamow-
icz, 2002). One of these is the latent class model (LCM) which we employed in this study.
In a LCM the assumption is made that an individual can be sorted into a set of C classes which are all
characterized by unique class-specific utility parameters. The choice for a certain alternative by an
individual i is conditioned by class membership c, so that the probability for choosing alternative j
amongst a set of N alternatives can be denoted as
Pij∨c=
exp (βc X ij)
∑n=1
N
exp (βc X¿)(3)
The probability that individual i belongs to class c out of C classes can be denoted as
Pc=exp (γc Z i)
∑c=1
C
exp (γ cZ i) (4)
where Z is a vector of covariates, commonly observed socio-demographic variables. Both γc and βc are specific class vectors of parameters to be estimated associated respectively with the covariates
and attributes. The unconditional joint probability of an individual i choosing alternative j, is the
product of the two probabilities stated in Eq. (3) and Eq. (4), so that
Pij=∑c=1
C [( exp ( γcZ i )
∑c=1
C
exp (γ cZ i ) ) .( exp (βcX ij )
∑n=1
N
exp (βcX ¿) )] (5)
Our choice of covariates was based on hypotheses about the potential sources of heterogeneity in
landscape preferences. The role of place of residence and familiarity with the landscape in landscape
preferences has been often discussed in the literature (e.g. Hasund, Kataria, & Lagerkvist, 2011; Van
den Berg & Koole, 2006). We therefore distinguished between urban and rural residents and included
a variable that indicated whether people grew up in East Lothian and whether they went for recreation
in the East Lothian countryside . In addition we included age, which has also been correlated with
resistance to change in the landscape (Van den Berg and Koole, 2006).
We also included the functions of the landscape people assign most importance to, i.e. the ESs, as
these may influence the choice of particular woodland attributes. Shelterbelts are often associated
21

22
Bullock, Joyce, Collier, Schmidt, Walz, Scholte, Vervurg and Zanten
with cultural heritage in rural landscapes (McCollin, 2000; Oreszczyn and Lane, 2000). Furthermore,
biodiversity is often associated with the perceived naturalness of forests (Bakhtiari et al., 2014; Fry et
al., 2009).Thus, we hypothesized that respondents with high values for biodiversity would have
preferences for alternatives with high levels of broadleaved forest instead of softwood plantations. We
therefore chose to include a variable indicating whether respondents assigned importance to
biodiversity or whether respondents think maintaining the traditional character of the landscape is an
important function of the East Lothian countryside.
All choice models were estimated using NLOGIT 4 (Econometric Software, Inc. www.nlogit.com). We
dummy coded all the environmental compensation variables, entering these into the utility function
while keeping the lowest level as a reference category. We specified a separate utility function for the
status quo option, which included an alternative specific constant (ASC) to capture potential status-
quo effects.
Marginal rate of substitution between housing and environmental compensationTo gain more insight into the extent to which people would be willing to offset housing with
environmental compensation, we calculated the marginal rate of substitution (MRS) between housing
and all the landscape attributes as follows:
MRSk=−βkβh
(6)
where βk is the utility coefficient of the landscape attributes, representing the marginal utility of an
environmental compensation measure, and βh is the utility coefficient of the housing attribute,
representing the marginal utility of additional housing in East Lothian. The consequent MRS can be
interpreted as the amount of houses people are willing to ‘pay’, i.e. allow in the area, for a change in
any of the landscape attributes.
Figure 2. Choice card examples
VisualizationsThe pilot study revealed that the initial set-up of the choice experiment, where woodland attribute
levels were communicated in terms of hectares and meters, was too abstract for people to process.
Monetary and Social Valuation: State of the Art
Instead, we chose to add visualizations to the choice sets, which is not uncommon in choice
experiment studies (e.g. Rambonilaza & Dachary-Bernard, 2007; Westerberg et al., 2013). We chose
a representative landscape photo of the case study area as the background layer. The photo was
taken from a viewpoint in July 2014 and used Adobe Photoshop to digitally adjust the photos and
visualize the different choice sets. The final choice cards consisted of both a visualization of the
attribute levels in the lower half and pictograms depicting the different attribute levels in the upper half
(Fig. 2).
3.2.4Results
Descriptive statistics of the sampleTaking into account age, gender and education, our sample comprised a fairly representative picture
of the East Lothian population. There is a slight underrepresentation of young adults and people aged
above 75. The time of residence varied greatly among respondents, with a minimum of 0.5 years and
a maximum of 88 years. Almost half of the respondents grew up in East Lothian.
Overall, respondents strongly agreed with the statement that additional housing will have a negative
effect on the East Lothian landscape (Table 3). There was, however, more disagreement with regard
to the following statements about the necessity of housing in East Lothian.
Most residents did not particularly like the idea of more houses being built in East Lothian (as
confirmed by the fourth statement), and would perhaps rather keep the level of housing as it is. At the
same time they may also have felt that the increasing population will inevitably require additional
housing. When we asked respondents to indicate which three of the nine depicted ESs they thought
were most important fortheir personal well-being, recreation, maintaining the traditional character of
the landscape, and supporting biodiversity, were mentioned most often. Timber and through carbon
sequestration were mentioned least often. Tourism was not found to be very important, which may be
because people do not regard tourism as important for their own personal well-being.
Seventy-five percent of the respondents mentioned that they thought that at least one of the ESs
would be threatened by additional housing in East Lothian. In addition, 11 % answered that maybe
one of the ESs would be affected by additional housing. When asked which one would be affected the
most, biodiversity, traditional character of the landscape, supporting agriculture and aesthetic quality
were mentioned most often.
After asking people about their values for ESs, we also asked which ES they associated most with
each of the woodland restoration attributes (Fig. 4). Broadleaved forest was mostly associated with
biodiversity, although the perceived difference between softwood forest and broadleaved forest for
23
24
Bullock, Joyce, Collier, Schmidt, Walz, Scholte, Vervurg and Zanten
this ES was small (6%). This may indicate that forests are generally thought to be beneficial for plants
and wildlife, in contrast to agricultural fields.
Shelterbelts were mostly associated with supporting agriculture and maintaining the traditional
character of the landscape. Softwood forest was mostly associated with the provision of timber, which
was considered important by many respondents. Recreation was associated mostly with mixed
broadleaved forest, but it was not mentioned often. This may be because many respondents
answered that they went to the coast of East Lothian for recreation (63.8%), whereas 44.6%
mentioned that they went to the rural countryside of East Lothian for recreation.
Fig 4. Associations of ES with the three types of woodland. Numbers indicate the percentage of respondents that listed a particular ES by each woodland type.
Preferences for landscape attributes
The conditional logit modelThe conditional logit model indicates all landscape attributes, except for the low level of softwood
forest, had a significant effect on the choice of alternatives (Table 3). The high levels of all the
woodland restoration attributes played the largest role, with most emphasis on mixed broadleaved
forest. As hypothesized, on average the housing attribute negatively affected choice and the
woodland restoration attributes positively affected choice of the alternatives. The negative coefficient
for the ASC suggests that on average respondents significantly chose one of the two alternatives
rather than the status quo option. The explanatory power of the model however, as indicated by the ρ²
statistic, is rather low.
Table 3. Results from the conditional logit model
Attribute Variable name β s.e.
ASC -.457*** .133Houses Houses -.002*** .034
Monetary and Social Valuation: State of the Art
Softwood forest low SFlow .148 .096Softwood forest medium SFmed .366*** .097Softwood forest high SFhigh .536*** .097Shelterbelts low SBlow .191** .097Shelterbelts medium SBmed .385*** .108Shelterbelts high SBhigh .454*** .102Broadleaved forest low BFlow .281*** .099Broadleaved forest medium BFmed .546*** .094Broadleaved forest high BFhigh .802*** .101
Log Likelihood -1829.16Adjusted ρ² 0.0852
The latent class modelA latent class model (LCM) can be run using different amounts of segments, i.e. classes. Determining
the appropriate number of classes is usually based on goodness of fit indicators such as the Bayesian
Information Criterion (BIC) and Akaike’s Information Criterion (AIC). For the identification of the proper
amount of classes, however, the significance of parameter estimates as well as the external validity of
the model have to be considered (Scarpa and Thiene, 2011). In our case, the BIC favours a model
with 2 classes, while the AIC keeps improving with increasing number of classes (Table 4). Taking
into account the significance levels of the parameter estimates and the external validity of the model,
we chose the model with 4 classes as the most appropriate.
Table 4. Criteria for identifying the appropriate number of classes
Number of classes ρ² AIC BIC Log Likelihood Parameters1 0.0852 3682.234 3743.424 -1829.16 112 0.2336 3289.472 3450.699 -1615.74 29
3 0.2524 3246.066 3507.365 -1576.03 47
4 0.2731 3195.008 3556.379 -1532.5 65
5 0.2836 3186.558 3648.001 -1510.28 83
The four-class LCM reveals that preferences for both the housing and landscape attributes clearly
differ between groups, indicating that for most attributes preferences are quite heterogeneous (Table
5). Probability of membership in class 1 was highest at 44.3% and lowest for class 4 at 13.3%.
Table5. Results from the latent class model
Class 1 Class 2 Class 3 Class 4Attributes β s.e. β s.e. β s.e. β s.e.
ASC -2.213*** 0.433 -0.256 0.255 -1.126*** 0.235 0.426 0.581Houses -0.001*** 0.0002 -0.0003 0.0003 -0.005*** 0.072 -0.018*** 0.002
SF low 0.237 0.152 0.223 0.203 0.263 0.180 0.774 0.566
SF med 0.384** 0.168 0.657*** 0.216 0.475** 0.187 1.111* 0.591
SF high 0.860*** 0.167 0.443** 0.197 0.375** 0.166 1.031* 0.578
25
26
Bullock, Joyce, Collier, Schmidt, Walz, Scholte, Vervurg and Zanten
SB low 0.728*** 0.166 -0.326 0.201 -0.307* 0.171 0.451 0.451
SB med 0.924*** 0.199 0.323 0.214 -0.238 0.196 0.397 0.546
SB high 1.108*** 0.187 0.445** 0.197 -0.392** 0.179 1.471*** 0.478
BF low 0.394** 0.154 0.083 0.190 0.433** 0.204 0.197 0.560
BF med 0.983*** 0.155 -0.397** 0.193 0.947*** 0.176 -0.550 0.573
BF high 1.610*** 0.184 -0.762*** 0.212 0.489** 0.192 0.639 0.470
Log Likelihood -1532.504
McFadden Pseudo ρ² 0.2730875
Class function probabilities 0.443 0.153 0.272 0.133
Constant 1.629 0.905 -0.899 1.157 -0.566 1.086 - -
Urban 0.472 0.555 1.195* 0.695 -0.194 0.699 - -
Age 0.010 0.015 -0.014 0.020 0.027 0.018 - -
Grow up -0.735 0.510 -1.485** 0.665 -1.283** 0.588 - -
Biodiversity -0.221 0.494 -1.026 0.640 .610 0.601 - -
Recreation -0.478 0.497 -.455 0.659 -1.243** 0.597 - -
Traditional character -0.292 0.492 -0.605 0.660 -.547 0.573 - -
*significant at 0.1, **significant at 0.05, ***significant at 0.01
The ASC is not significant for all groups; only class 1 and class 3 show significant negative
coefficients for the ASC, meaning that it was only in these two groups that respondents were more
likely to choose one of the two alternatives with environmental compensation rather than the status
quo. The coefficient for the housing attribute was negative and significant for all classes, except for
class 2, indicating that for this class the amount of houses did not play a significant role in choosing
for a certain alternative.
Looking at the significance of the coefficients for the woodland attributes, it is clear that respondents
in class 1 and class 3 were more positive towards woodland restoration than the other two groups.
Class 1 had a high preference for alternatives including high levels of broadleaved forest and
shelterbelts, while class 3 rather avoided options with high levels of shelterbelts. For respondents in
class 2, softwood forest and high levels of shelterbelts were most important. Respondents in this class
had a negative preference for broadleaved forest. For class 4, only the presence of high levels of
shelterbelts played a highly significant role in the choice of alternatives. The coefficient for softwood
forest was slightly significant.
The parameter estimates for the socio-economic and ES variables in the lower portion of table 6,
reveal some information about the sources of heterogeneity. The parameters for class 4 are
normalized to 0 for estimation, so the estimates for the first three classes are evaluated relative to
class 4. None of the socio-economic variables were significant for the first class. Respondents who
did not grow up in East Lothian were more likely to be part of class 2 or class 3. The negative
Monetary and Social Valuation: State of the Art
parameter for the recreation variable indicates that respondents who recreate in the East Lothian
countryside were less likely to be part of class 3. Respondents who lived in urban settlements were
more likely to be part of class 2 and may explain why the housing attribute was not significant for this
group, indicating that urban residents have a more positive attitude towards with additional housing
than rural residents.
Substitution between housing and environmental compensationTo show differences between the CL model and the LCM we calculated the MRS for both models
(Table 7). We also discuss the differences between 3 classes of the LCM. We did not calculate the
MRS for class 2, since the housing attribute was not significant.
The CL model showed that, on average, the MRS increases with higher levels of environmental
compensation, indicating that people are willing to allow a higher level of housing when more
woodland restoration takes place. This is also the case for the first group of the latent class model,
where respondents displayed a relatively high MRS for all woodland restoration attributes. For high
levels of shelterbelts and broadleaved forests, respondents in this class are willing to allow the
development of more than a 1000 houses in East Lothian. By comparison, the results reveal a
considerably lower MRS for the woodland restoration attributes for respondents in class 3 and class 4.
In class 3, the maximum amount of houses people were willing to allow was 189, for medium levels of
broadleaved forest, and in class 4 the maximum amount of houses people were willing to allow, for
high levels of shelterbelts, is 82.
Table 7. Marginal rates of substitution between housing and woodland attributes for the CL and LCM model
CL Class 1 Class 2 Class 3 Class 4Attributes MRS Rank MRS Rank MRS Rank MRS Rank MRS Rank
SFlow - - - - - - - - - -SFmed 183 7 384 8 - 1 95 3 57 2SFhigh 268 6 860 5 - 3 75 5 25 3SBlow 95.5 8 728 6 - - -61 - - -SBmed 192.5 4 924 4 - - - - - -SBhigh 227 3 1108 2 - 2 -78 - 82 1BFlow 140.5 5 394 7 - - 87 4 - -BFmed 273 2 983 3 - - 189 1 - -BFhigh 401 1 1610 1 - - 98 2 - -
Class 4 exhibits the lowest rates of marginal substitution. We suspect that this class exhibits signs of
lexicographic preference ordering and that the most important attribute for this group was the amount
of housing. This was confirmed by the follow-up control question in which we asked respondents to
which attribute(s) they had paid most attention: 82% of the respondents in this class stated that
27
28
Bullock, Joyce, Collier, Schmidt, Walz, Scholte, Vervurg and Zanten
housing had been the most important attribute. The respondents in this class may therefore have
ordered their preferences according to the housing attribute, meaning that environmental
compensation, specifically shelterbelts, was only preferred when combined with low levels of housing.
This suggests that for respondents in this class woodland restoration cannot compensate for
additional housing as people are not willing to offset higher levels of housing with environmental
compensation.
Explaining choices for environmental compensation
Latent class profilesTo enrich our understanding of the respondent groups identified by the latent class analysis we
summarized the data for several characteristics of individuals in each latent class (Table 8). To do so,
we allocated respondents to a certain class according to their class probabilities (where the
respondent was allocated to the class for which they had the largest probability). Average class
probabilities for all but one of the four classes were at or above 90%. Class 4 had an average of 82%.
We therefore think the profiles can provide a useful description of all the classes.
We tested for independency between classes for several of the variables (using chi-squared for
categorical variables, a Kruskal Wallis test for ordinal variables and a one way ANOVA for continuous
variables. To test for significance between specific groups we conducted pair wise comparisons
through post-hoc tests).
Table 8. Latent class profiles
Variables Class 1 Class 2 Class 3 Class 4Socio-demographic characteristics
Urban (%) 27.3 45.7 17.7 21.2
Age (mean) 47.6 50.4 52.4 44.6
Income (mean)* 3.3 3.5 2.9 3.5
Education (mean)** 2.6 2.5 2.6 2.7
Female (%) 53.6 45.7 64.5 66.7
Grew up in East Lothian (%) 51.8 34.3 32.3 69.7
Residence time (mean, as % of age) 60.1 44.1 48.1 66.8
Goes for recreation in countryside (%) 48.2 45.7 30.6 60.6
Values for ESs (%)
Aesthetic quality 32.7 34.3 38.7 45.5
Supporting biodiversity 49.1 31.4 71.0 51.5
Supporting agriculture 42.7 20.0 29.0 27.3
Maintaining traditional character of the landscape 57.3 57.1 48.4 60.6
Provision of timber 7.3 5.7 1.6 0.0
Recreation 60.9 62.9 62.9 72.7
Tourism 20.9 48.6 19.4 18.2
Monetary and Social Valuation: State of the Art
Climate change mitigation 8.2 5.7 3.2 9.1
Air quality 20.9 34.3 25.8 15.2
Attitudes towards residential development(mean with standard deviation in parenthesis, 1= absolutely disagree, 5 =absolutely agree)Additional housing will have a negative effect on the landscape of East Lothian 3.7 (1.23) 4.3 (1.03) 4.2 (1.03) 4.4 (0.78)
We have got enough houses in East Lothian 2.6 (1.48) 2.7 (1.19) 3.1 (1.45) 3.8 (1.47)
Additional housing is necessary 3.7 (1.32) 3.7 (1.25) 3.3 (1.37) 2.9 (1.39)
It would be nice to have new settlements in East Lothian 2.8 (1.33) 3.1 (1.24) 2.4 (1.44) 2.2 (1.45)
Evaluation of environmental compensationDo you think that woodland restoration can adequately compensate for additional housing in East Lothian?
Yes (%) 64.5 65.7 45.2 30.3
Maybe (%) 23.6 20.0 37.1 36.4Do you think that woodland restoration should be obligatory when building in East Lothian?
Yes (%) 80.9 88.6 75.8 75.8
Maybe (%) 14.5 5.7 12.9 6.1
*on a scale from 1 to 5, where 1=0-999, 2=1000-1499,3=1500-1999, 4=2000-3000, 5>3000 ** on a scale from 0 to 4, where 0=no education, 1=primary, 2=secondary, 3=bachelor/higher degree and 4= postgraduate.
As became apparent in the class probability function (Table 6), the classes differ significantly when
looking at place of residence (urban versus rural, χ²= 9.5414, df=3, p<0.05) and growing up in East
Lothian (χ²=15.5326, df=3, p<0.01). Class 2 consists of more urban residents (45.7%) than the other
classes. Class 4 is clearly characterized by respondents who grew up in East Lothian and who have
lived there for a long time (relative to age). Residence time (F=3.5696, df=3, p<0.05) differed
significantly between classes. No significant differences were found for education and income
between the classes.
Recreation and maintaining the traditional character of the landscape were mentioned often as an
important ES by all groups. There was a significant difference between classes concerning the
support of biodiversity (χ²=15.24, df=3, p<0.01), which was a more important function for respondents
in class 3 than it was for respondents in class 1 and 2. Significant differences were also found for
tourism (χ²=13.4399, df=3, p<0.01) which was found more important in class 2 than in the other
groups, and for supporting agriculture (χ²=8.1606, df=3, p<0.05), which was found more important in
class 1 than in class 2.
Regarding the attitudes towards residential development, significant differences between classes
were found for statement 1 (χ²= 16.9447, df=3, p<0.01), where respondents in class 1 agreed less
29
30
Bullock, Joyce, Collier, Schmidt, Walz, Scholte, Vervurg and Zanten
with the notion that additional housing will have a negative effect on the landscape than respondents
in the other classes. Respondents in class 4 agreed significantly more with the statement there are
already enough houses in East Lothian than respondents in class 1 and 2 (χ²=16.9701, df=3, <0.01).
Consistent with this result, respondents in class 4 also agreed significantly less with the statement
that additional housing is necessary (χ²=12.0572, df=3, p<0.01).
Finally, significant differences were also found between the classes for the question as to whether
woodland restoration is adequate to compensate for additional housing. (χ²=16.2304, df=3, p<0.01).
Whereas most respondents in class 1 and 2 thought environmental compensation would be adequate,
respondents in class 3 and 4 did not. A majority of the respondents in all classes agreed that
environmental compensation should be mandatory.
Spatial distribution of class probabilitiesThe results from the previous sections indicate a difference between urban and rural residents. To
further explore the effect of place of residence, we created a map which shows the composition of the
latent classes for each town (Fig. 5). Respondents that fit in the second class, who mind housing the
least, are slightly more represented in areas close to Edinburgh. This is, however, not merely a
function of distance: the largest proportion of respondents in class 2 can be found in Tranent, and not
closest to the border with Edinburgh. Tranent has recently seen a lot of new housing.
The largest proportion of respondents in class 4, who oppose housing most strongly, can be found in
Haddington. This, could be explained by the historical character of Haddington and its importance as,
not only the geographical, but also the cultural centre of East Lothian. Respondents in Haddington
could therefore be more resistant to change.
Figure 5. Spatial distribution of the latent classes. The urban rural classification is according to the Scottish urban rural classification 2012-2013. The size of the pie charts is conditional on the number of respondents that lived in the town. 32 respondents were excluded from this analysis as they did not live in any of the larger settlements but were dispersed over the small towns in East Lothian.
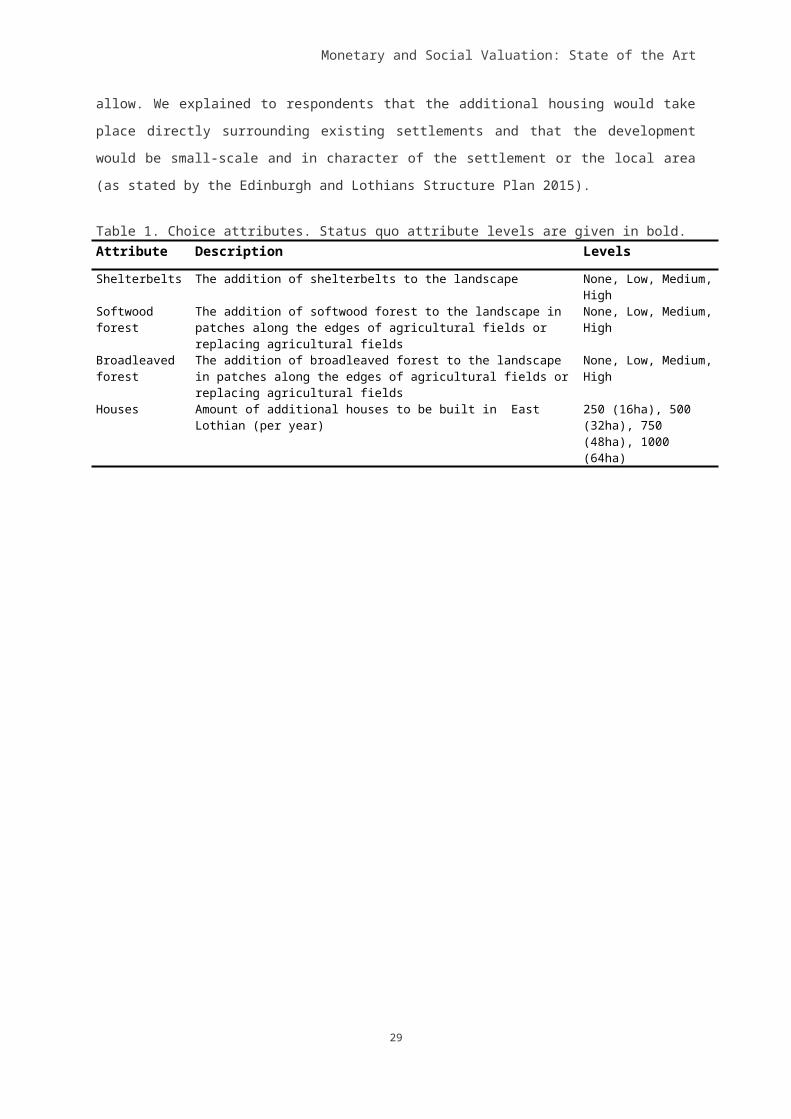
Monetary and Social Valuation: State of the Art
Class 1 contained the largest proportion of respondents in all towns except North Berwick. North
Berwick has a larger representation of respondents in class 3 than the other towns. As was
demonstrated, this class had particularly high values for biodiversity. The high representation of class
3 in North Berwick could possibly be related to the presence of the Scottish Seabird Centre, making
residents more aware of biodiversity issues than in other areas.
3.2.5 Discussion
Mitigating impacts from land use change is commonly focused on biodiversity (Tallis et al., 2015),
thereby neglecting other ESs provided by the landscape and the preferences of local residents. This
paper took up the challenge of taking the broader ESs perspective in assessing residents’
preferences for alternative compensation options and their willingness to offset additional urban
development for woodland restoration.
Residents’ acceptance of environmental compensation to offset impacts from additional housing Following our results, it is important to distinguish between the necessity and adequacy of
environmental compensation. Most respondents agreed with the statement that additional housing in
East Lothian would have a negative impact on the landscape of East Lothian. A majority of the
respondents also stated that environmental compensation should be mandatory when building
additional housing in East Lothian. This indicates that there is overall support for the general idea of
environmental compensation and/or biodiversity offsets and that, if impact cannot be avoided,
environmental compensation should be implemented. Similar findings were obtained in by Bauer et al.
(2004), who, studying preferences for wetland mitigation banking in the US, found that people were in
favour of some mitigation rather than none, despite the additional costs.
Our assessment of values for ESs shows that residential development was perceived mostly as a
threat to biodiversity and the traditional character of the landscape. These two aspects of the
landscape were also highly valued by residents indicating the importance of mitigating adverse
environmental impacts due to urban sprawl. Given the high values respondents had for biodiversity,
people could be very positive towards the restoration of woodlands to support biodiversity In our study
area, the re-introduction of shelterbelts, in combination with patches of forest, may have great
potential to both restore the traditional character of the landscape and improve conditions for
biodiversity. However, as people did not associate shelterbelts much with supporting biodiversity,
proper communication of their biodiversity benefits may be needed to achieve public support.
In contrast to opinions about the necessity of environmental compensation, there is far less
agreement about the extent to which environmental compensation could be an adequate tool to
compensate for additional housing in East Lothian. This predominantly relates to the extent to which
31
32
Bullock, Joyce, Collier, Schmidt, Walz, Scholte, Vervurg and Zanten
additional housing is perceived as problematic. Environmental compensation has potential to mitigate
the environmental impacts associated with urban sprawl, but urban sprawl can also have important
social impacts. The migration of former urban residents to the rural countryside changes, not only the
landscape, but also the lifestyles of those living in the landscape (Antrop, 2004; Primdahl et al., 2013).
It may not be possible in practice to differentiate between the social and environmental impacts. This
could explain why respondents in class 4, who opposed to housing so strongly, were not willing to
accept much more housing in return for woodland restoration. In addition to the impact on the
landscape, respondents in class 4 may have perceived additional housing as a threat to their own
cultural identity, for which woodland restoration cannot compensate. Respondents in this class were
characterized by rural residents who grew up in East Lothian and may have strong emotional links to
the East Lothian landscape. High levels of place attachment ‘can result in an emotional sense of loss
when these places change or disappear’ (Walker and Ryan, 2008). In contrast, respondents in class
1, the largest group in our sample, did not have such strong oppositions against additional housing,
and were consequently more willing to accept environmental compensation. This finding has
important implications for planning environmental compensation measures in locations where people
would be most affected by additional residential development.
Methodological considerationsChoice experiments are increasingly being used in a landscape valuation context, as they provide a
useful method to assess societal preference towards changes in landscape characteristics. At the
same time, however, choice experiments offer a reductionist approach towards landscape valuation
by breaking down landscapes into different components, whereas people may rather perceive
landscapes as a ‘whole’ and not merely as a sum of its parts (Swanwick et al., 2007). Choice
experiments are not appropriate to the holistic study the importance of landscapes, and their related
goods and services, as the summation of values for single landscape attributes does not necessarily
give an accurate reflection of the value of landscape. Our study should thus not be seen as an
attempt to provide an overall valuation of the landscape, but rather to measure preferences for
specific changes in certain characteristics of the landscape.
While conventionally choice experiments are used with a monetary attribute to estimate WTP for
specific measures, we have chosen an experimental setup in which the tradeoff was not represented
by the level of additional housing instead. Even though the use of a monetary value estimate can be
useful to assess impacts of environmental change on social welfare, it is not always necessary to
better understand environmental preferences or choice behavior (Adamowicz 2004). As expressed by
Kerr & Sharp (2008) the ‘adequacy of mitigation may be explored using choice experiments, whether
or not they include monetary attributes’. The omission of a monetary attribute can help researchers
overcome problems related to communicating a suitable payment vehicle for non-marketed
environmental goods and services and may improve respondents’ performance in the choice tasks.
Monetary and Social Valuation: State of the Art
Although we do take into account the heterogeneity in preferences among respondents, our results
draw a relatively one-sided picture of environmental compensation in a rural residential context. In our
study, we only focused on the general public within the residential areas, while farmers would have to
play a large role in the implementation of environmental compensation efforts. Most land in East
Lothian is privately owned, and so the introduction of woodland restoration schemes would also entail
financial compensation to those who would lose agricultural land and related crop yields. This poses
an additional trade-off which we have not treated extensively in our study. An objective for future
research would be to investigate where and when agricultural land can be sacrificed for environmental
compensation, according to public preferences.
3.2.6 ConclusionThe results of our study in Scotland indicate that offsetting does not necessarily alleviate objections
against land take: residents who oppose additional housing the most are the least willing to accept
environmental compensation. Where resistance to change is high, any form of landscape change,
including both development and environmental restoration, may be perceived as a threat. This
indicates the importance of adhering to the mitigation hierarchy (BBOP, 2012), i.e. emphasizing the
avoidance of impacts, before considering minimizing and compensating impacts.
Thus far, in Scotland, environmental compensation has received little attention in the planning of
residential development. In addition, the development of green infrastructures are now mostly planned
within newly built neighbourhoods to accommodate newcomers with additional goods and services,
without compensating existing residents for lost amenities and ESs in the agricultural landscape. Our
study highlights the importance of an integrated planning approach at a landscape scale that
integrates both environmental and social goals.
Acknowledgements
We would like to thank Stuart MacPherson from the East Lothian Council for his assistance in setting
up the pilot and field study. In addition we would like to thank Koen Tieskens for his assistance.
References
Adamowicz, W.L., 2004. What’s it worth? An examination of historical trends and future directions in environmental valuation*. Aust. J. Agric. Resour. Econ. 48, 419–443. doi:10.1111/j.1467-8489.2004.00258.x
Antrop, M., 2004. Landscape change and the urbanization process in Europe. Landsc. Urban Plan. 67, 9–26. doi:10.1016/S0169-2046(03)00026-4
Aravena, C., Martinsson, P., Scarpa, R., 2014. Does money talk? — The effect of a monetary attribute on the marginal values in a choice experiment. Energy Econ. 44, 483–491. doi:10.1016/j.eneco.2014.02.017
Bakhtiari, F., Jacobsen, J.B., Strange, N., Helles, F., 2014. Revealing lay people’s perceptions of
33
34
Bullock, Joyce, Collier, Schmidt, Walz, Scholte, Vervurg and Zanten
forest biodiversity value components and their application in valuation method. Glob. Ecol. Conserv. 1, 27–42. doi:10.1016/j.gecco.2014.07.003
Bart, I.L., 2010. Urban sprawl and climate change: A statistical exploration of cause and effect, with policy options for the EU. Land use policy 27, 283–292. doi:10.1016/j.landusepol.2009.03.003
Bauer, D.M., Cyr, Ni.E., Swallow, S.K., 2004. Public Preferences for Compensatory Mitigation of Salt Marsh Losses: a Contingent Choice of Alternatives. Conserv. Biol. 18, 401–411. doi:10.1111/j.1523-1739.2004.00367.x
Bengston, D.N., Fletcher, J.O., Nelson, K.C., 2004. Public policies for managing urban growth and protecting open space: policy instruments and lessons learned in the United States. Landsc. Urban Plan. 69, 271–286. doi:10.1016/j.landurbplan.2003.08.007
Benton, T.G., Vickery, J.A., Wilson, J.D., 2003. Farmland biodiversity: is habitat heterogeneity the key? Trends Ecol. Evol. 18, 182–188. doi:10.1016/S0169-5347(03)00011-9
Born, R.J.G. Van Den, Lenders, R.H.J., Groot, W.T. de, Huijsman, E., 2001. The new biophilia: an exploration of visions of nature in Western countries. Environ. Conserv. 28, 65–75. doi:10.1017/S0376892901000066
Boxall, P.C., Adamowicz, W.L., n.d. Understanding Heterogeneous Preferences in Random Utility Models: A Latent Class Approach. Environ. Resour. Econ. 23, 421–446. doi:10.1023/A:1021351721619
Braaker, S., Moretti, M., Boesch, R., Ghazoul, J., Obrist, M.K., Bontadina, F., 2014. Assessing habitat connectivity for ground-dwelling animals in an urban environment. Ecol. Appl. 24, 1583–1595. doi:10.1890/13-1088.1
Brownlie, S., King, N., Treweek, J., 2013. Biodiversity tradeoffs and offsets in impact assessment and decision making: can we stop the loss? Impact Assess. Proj. Apprais. 31, 24–33. doi:10.1080/14615517.2012.736763
Burney, J., 2000. Is Valuing Nature Contributing to Policy Development? Environ. Values 9, 511–520. doi:10.3197/096327100129342182
Camagni, R., Gibelli, M.C., Rigamonti, P., 2002. Urban mobility and urban form: the social and environmental costs of different patterns of urban expansion. Ecol. Econ. 40, 199–216. doi:10.1016/S0921-8009(01)00254-3
Cleland, J.A., Rogers, A.A., Burton, M.P., 2015. Investigating stakeholder reactions to a bold salinity policy using a choice experiment. Land use policy 42, 718–728. doi:10.1016/j.landusepol.2014.10.010
Davidson, M.D., 2013. On the relation between ecosystem services, intrinsic value, existence value and economic valuation. Ecol. Econ. 95, 171–177. doi:http://dx.doi.org/10.1016/j.ecolecon.2013.09.002
de Ayala, A., Hoyos, D., Mariel, P., 2015. Suitability of discrete choice experiments for landscape management under the European Landscape Convention. J. For. Econ. 21, 79–96. doi:10.1016/j.jfe.2015.01.002
Domínguez-Torreiro, M., Soliño, M., 2011. Provided and perceived status quo in choice experiments: Implications for valuing the outputs of multifunctional rural areas. Ecol. Econ. 70, 2523–2531. doi:10.1016/j.ecolecon.2011.08.021
East Lothian Fourth Statistical Account Society, 2003. East Lothian Fourth Statistical Account 1945-2000. East Lothian Council Library Service, East Lothian.
Edinburgh & Lothians Forest Habitat Network Partnership, 2010. Foresty Framework for Edinburgh and the Lothians. Edinburgh.
Edinburgh and the Lothians Structure Plan 2015, 2004. Edinburgh and the Lothians.
Feranec, J., Jaffrain, G., Soukup, T., Hazeu, G., 2010. Determining changes and flows in European
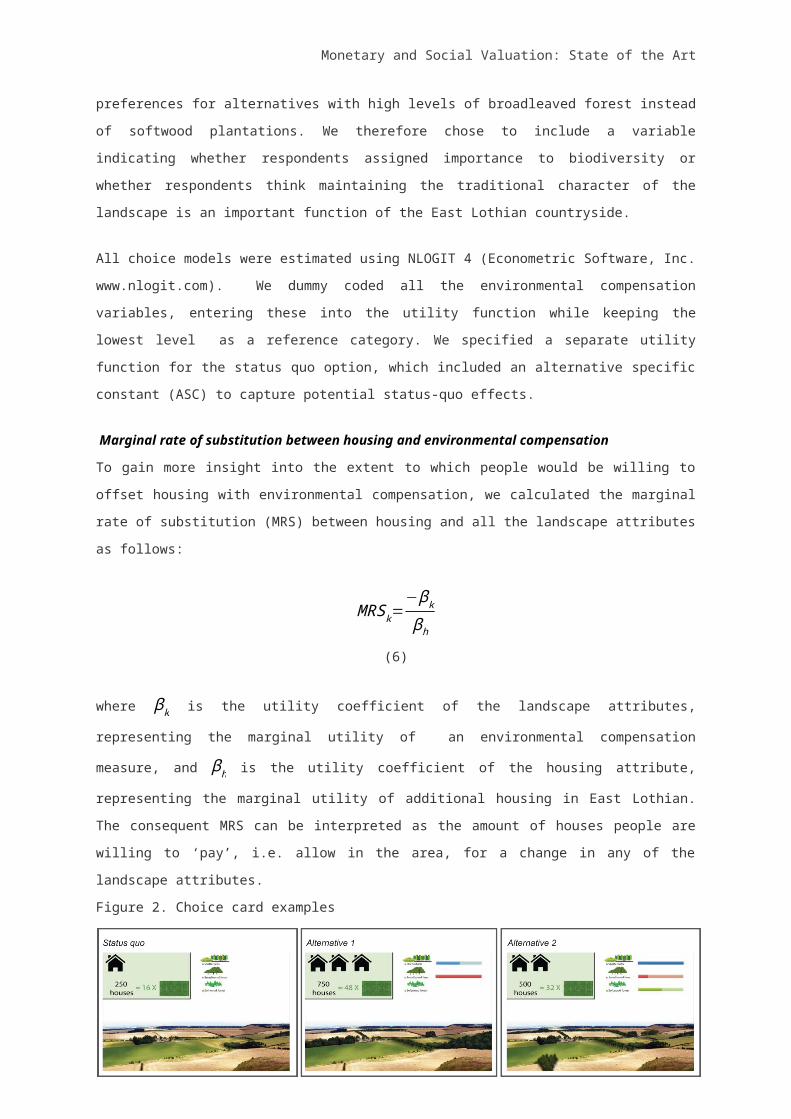
Monetary and Social Valuation: State of the Art
landscapes 1990–2000 using CORINE land cover data. Appl. Geogr. 30, 19–35. doi:10.1016/j.apgeog.2009.07.003
Fischer, J., Lindenmayer, D.B., Manning, A.D., 2006. Biodiversity, ecosystem function, and resilience: Ten guiding principles for commodity production landscapes. Front. Ecol. Environ. 4, 80–86. doi:10.1890/1540-9295(2006)004[0080:BEFART]2.0.CO;2
Fry, G., Tveit, M.S., Ode, Å., Velarde, M.D., 2009. The ecology of visual landscapes: Exploring the conceptual common ground of visual and ecological landscape indicators. Ecol. Indic. 9, 933–947. doi:10.1016/j.ecolind.2008.11.008
García-Llorente, M., Martín-López, B., Montes, C., 2011. Exploring the motivations of protesters in contingent valuation: Insights for conservation policies. Environ. Sci. Policy 14, 76–88. doi:http://dx.doi.org/10.1016/j.envsci.2010.11.004
Ghaffar, A., Robinson, G.M., 1997. Restoring the agricultural landscape: the impact of government policies in East Lothian, Scotland. Geoforum 28, 205–217. doi:10.1016/S0016-7185(97)00006-7
Grammatikopoulou, I., Pouta, E., Salmiovirta, M., Soini, K., 2012. Heterogeneous preferences for agricultural landscape improvements in southern Finland. Landsc. Urban Plan. 107, 181–191. doi:10.1016/j.landurbplan.2012.06.001
Haines-Young, R., Potschin, M., 2008. England’s Terrestrial Ecosystem Services and the Rationale for an Ecosystem Approach.
Hall, C., McVittie, A., Moran, D., 2004. What does the public want from agriculture and the countryside? A review of evidence and methods. J. Rural Stud. 20, 211–225. doi:10.1016/j.jrurstud.2003.08.004
Hasund, K.P., Kataria, M., Lagerkvist, C.J., 2011. Valuing public goods of the agricultural landscape: a choice experiment using reference points to capture observable heterogeneity. J. Environ. Plan. Manag. 54, 31–53. doi:10.1080/09640568.2010.502753
Kasanko, M., Barredo, J.I., Lavalle, C., McCormick, N., Demicheli, L., Sagris, V., Brezger, A., 2006. Are European cities becoming dispersed? Landsc. Urban Plan. 77, 111–130. doi:10.1016/j.landurbplan.2005.02.003
Kerr, G.N., Sharp, B.M.H., 2008. Evaluating off-site environmental mitigation using choice modelling*. Aust. J. Agric. Resour. Econ. 52, 381–399. doi:10.1111/j.1467-8489.2008.00432.x
Lancaster, K.J., 1966. A New Approach to Consumer Theory. J. Polit. Econ. 74.
Liu, Z., He, C., Zhou, Y., Wu, J., 2014. How much of the world’s land has been urbanized, really? A hierarchical framework for avoiding confusion. Landsc. Ecol. 29, 763–771. doi:10.1007/s10980-014-0034-y
Lokocz, E., Ryan, R.L., Sadler, A.J., 2011. Motivations for land protection and stewardship: Exploring place attachment and rural landscape character in Massachusetts. Landsc. Urban Plan. 99, 65–76. doi:10.1016/j.landurbplan.2010.08.015
Lothians and Fife Green Network Partnership, 2012. Edinburgh and Lothians Forestry & Woodland Strategy 2012-2017.
Maron, M., Gordon, A., Mackey, B.G., Possingham, H.P., Watson, J.E.M., 2015. Conservation: Stop misuse of biodiversity offsets. Nature 523, 401–403. doi:10.1038/523401a
McCollin, D., 2000. Editorial: Hedgerow policy and protection—changing paradigms and the conservation ethic. J. Environ. Manage. 60, 3–6. doi:10.1006/jema.2000.0357
McFadden, D., 1974. Conditional logit analysis of qualitative choice behavior, in: Zarembka, P. (Ed.), Frontiers in Econometrics. Academic Press, New York, pp. 105–142.
McKenney, B.A., Kiesecker, J.M., 2010. Policy development for biodiversity offsets: a review of offset frameworks. Environ. Manage. 45, 165–76. doi:10.1007/s00267-009-9396-3
35
36
Bullock, Joyce, Collier, Schmidt, Walz, Scholte, Vervurg and Zanten
Moilanen, A., van Teeffelen, A.J.A., Ben-Haim, Y., Ferrier, S., 2009. How Much Compensation is Enough? A Framework for Incorporating Uncertainty and Time Discounting When Calculating Offset Ratios for Impacted Habitat. Restor. Ecol. 17, 470–478. doi:10.1111/j.1526-100X.2008.00382.x
Munton, R., 2009. Rural land ownership in the United Kingdom: Changing patterns and future possibilities for land use. Land use policy 26, Supple, S54–S61. doi:http://dx.doi.org/10.1016/j.landusepol.2009.08.012
Newell, L.W., Swallow, S.K., 2013. Real-payment choice experiments: Valuing forested wetlands and spatial attributes within a landscape context. Ecol. Econ. 92, 37–47. doi:http://dx.doi.org/10.1016/j.ecolecon.2012.08.008
Nijnik, M., Mather, A., 2008. Analyzing public preferences concerning woodland development in rural landscapes in Scotland. Landsc. Urban Plan. 86, 267–275. doi:10.1016/j.landurbplan.2008.03.007
Oreszczyn, S., Lane, A., 2000. The meaning of hedgerows in the English landscape: Different stakeholder perspectives and the implications for future hedge management. J. Environ. Manage. 60, 101–118. doi:10.1006/jema.2000.0365
Pacione, M., 2013. Private profit, public interest and land use planning—A conflict interpretation of residential development pressure in Glasgow’s rural–urban fringe. Land use policy 32, 61–77. doi:10.1016/j.landusepol.2012.09.013
Pauleit, S., Ennos, R., Golding, Y., 2005. Modeling the environmental impacts of urban land use and land cover change—a study in Merseyside, UK. Landsc. Urban Plan. 71, 295–310. doi:10.1016/j.landurbplan.2004.03.009
Persson, J., Larsson, A., Villarroya, A., 2015. Compensation in Swedish infrastructure projects and suggestions on policy improvements. Nat. Conserv. 11, 113–127. doi:10.3897/natureconservation.11.4367
Primdahl, J., Andersen, E., Swaffield, S., Kristensen, L., 2013. Intersecting Dynamics of Agricultural Structural Change and Urbanisation within European Rural Landscapes: Change Patterns and Policy Implications. Landsc. Res. 38, 799–817. doi:10.1080/01426397.2013.772959
Rambonilaza, M., Dachary-Bernard, J., 2007. Land-use planning and public preferences: What can we learn from choice experiment method? Landsc. Urban Plan. 83, 318–326. doi:10.1016/j.landurbplan.2007.05.013
Reginster, I., Rounsevell, M., 2006. Scenarios of future urban land use in Europe. Environ. Plan. B Plan. Des. 33, 619–636. doi:10.1068/b31079
Rey Benayas, J.M., Bullock, J.M., 2012. Restoration of Biodiversity and Ecosystem Services on Agricultural Land. Ecosystems 15, 883–899. doi:10.1007/s10021-012-9552-0
Salvati, L., Carlucci, M., 2015. Land-use structure, urban growth, and periurban landscape: a multivariate classification of the European cities. Environ. Plan. B Plan. Des. doi:10.1068/b120029p
Seto, K.C., Fragkias, M., Güneralp, B., Reilly, M.K., 2011. A meta-analysis of global urban land expansion. PLoS One 6, e23777. doi:10.1371/journal.pone.0023777
Soini, K., Vaarala, H., Pouta, E., 2012. Residents’ sense of place and landscape perceptions at the rural–urban interface. Landsc. Urban Plan. 104, 124–134. doi:http://dx.doi.org/10.1016/j.landurbplan.2011.10.002
Song, W., Pijanowski, B.C., Tayyebi, A., 2015. Urban expansion and its consumption of high-quality farmland in Beijing, China. Ecol. Indic. 54, 60–70. doi:10.1016/j.ecolind.2015.02.015
Standard on Biodiversity Offsets, 2012. . Washington DC.
Svedsater, H., 2003. Economic Valuation of the Environment: How Citizens Make Sense of
Monetary and Social Valuation: State of the Art
Contingent Valuation Questions. Land Econ. 79, 122. doi:10.2307/3147109
Swanwick, C., Hanley, N., Termansen, M., 2007. Scoping Study on Agricultural Landscape Valuation.
Tallis, H., Kennedy, C.M., Ruckelshaus, M., Goldstein, J., Kiesecker, J.M., 2015. Mitigation for one & all: An integrated framework for mitigation of development impacts on biodiversity and ecosystem services. Environ. Impact Assess. Rev. 55, 21–34. doi:10.1016/j.eiar.2015.06.005
Tress, B., Tress, G., 2003. Scenario visualisation for participatory landscape planning—a study from Denmark. Landsc. Urban Plan. 64, 161–178. doi:10.1016/S0169-2046(02)00219-0
Tucker, G., Allen, B., Conway, M., Dickie, I., Hart, K., Rayment, M., Schulp, C., van Teeffelen, A., 2013. Policy Options for an EU No Net Loss Initiative.
Van den Berg, A.E., Koole, S.L., 2006. New wilderness in the Netherlands: An investigation of visual preferences for nature development landscapes. Landsc. Urban Plan. 78, 362–372. doi:http://dx.doi.org/10.1016/j.landurbplan.2005.11.006
Van Teeffelen, A.J.A., Vos, C.C., Jochem, R., Baveco, J.M., Meeuwsen, H., Hilbers, J.P., 2015. Is green infrastructure an effective climate adaptation strategy for conserving biodiversity? A case study with the great crested newt. Landsc. Ecol. 30, 937–954. doi:10.1007/s10980-015-0187-3
Vatn, A., Bromley, D.W., 1994. Choices without Prices without Apologies. J. Environ. Econ. Manage. 26, 129–148. doi:10.1006/jeem.1994.1008
Vecchiato, D., Tempesta, T., 2013. Valuing the benefits of an afforestation project in a peri-urban area with choice experiments. For. Policy Econ. 26, 111–120. doi:http://dx.doi.org/10.1016/j.forpol.2012.10.001
Villarroya, A., Barros, A.C., Kiesecker, J., 2014. Policy development for environmental licensing and biodiversity offsets in Latin America. PLoS One 9, e107144. doi:10.1371/journal.pone.0107144
Walker, A.J., Ryan, R.L., 2008. Place attachment and landscape preservation in rural New England: A Maine case study. Landsc. Urban Plan. 86, 141–152. doi:10.1016/j.landurbplan.2008.02.001
Westerberg, V., Jacobsen, J.B., Lifran, R., 2013. The case for offshore wind farms, artificial reefs and sustainable tourism in the French mediterranean. Tour. Manag. 34, 172–183. doi:http://dx.doi.org/10.1016/j.tourman.2012.04.008
Westerink, J., Haase, D., Bauer, A., Ravetz, J., Jarrige, F., Aalbers, C.B.E.M., 2013. Dealing with Sustainability Trade-Offs of the Compact City in Peri-Urban Planning Across European City Regions. Eur. Plan. Stud. 21, 473–497. doi:10.1080/09654313.2012.722927
37
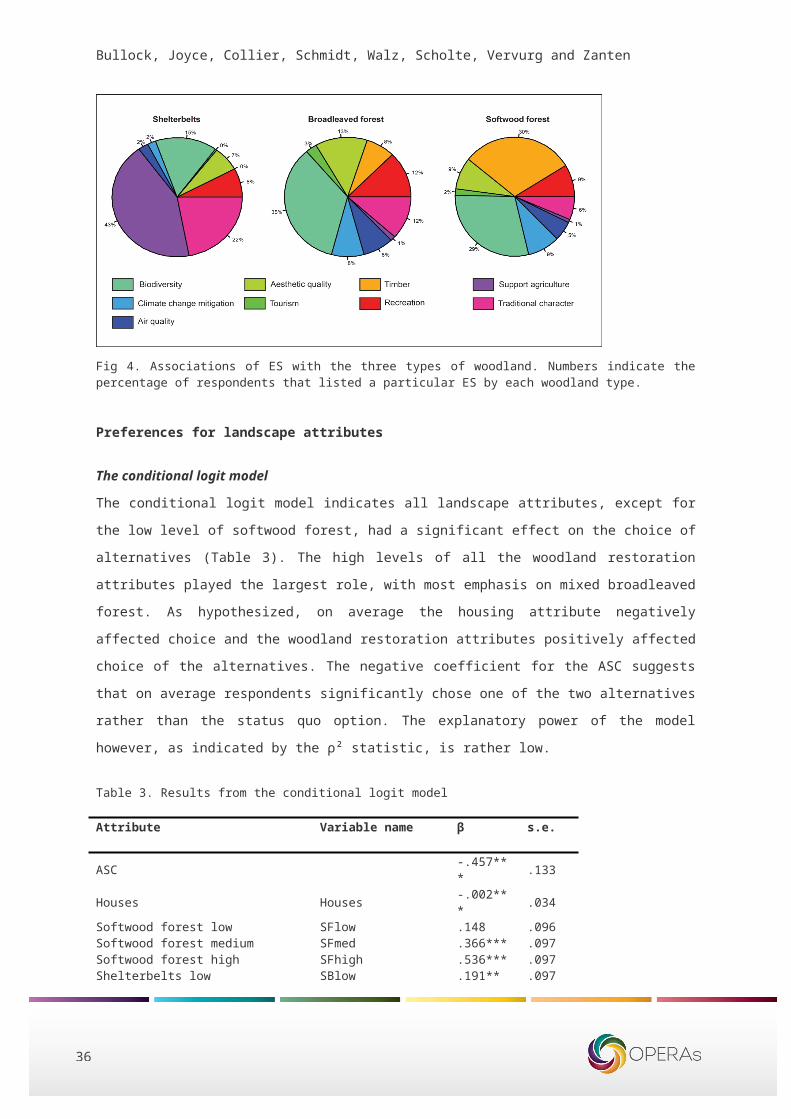
38
Bullock, Joyce, Collier, Schmidt, Walz, Scholte, Vervurg and Zanten
Paper 2
3.3 Testing non-monetary methods for social valuation of ecosystem services to explain trade-off in land management in ScotlandKatja Schmidt, Ariane Walz, Berta Martin-Lopez and R. Sachse.
3.3.1 Introduction Several methods use social valuation to assess the importance of ecosystem services (ES),
emphasizing stakeholder participation and expressing individual or group opinions. These opinions
can generally be expressed in monetary or non-monetary terms. Whereas the application of monetary
valuation methods has prevailed since the introduction of the ESs concept (Gómez-Baggethun et al.,
2014), the notion of value pluralism which acknowledges multiple equally fundamental values has
been adapted recently in scientific and policy communities (Chan et al., 2012; Díaz et al., 2015;
Gómez-Baggethun et al., 2014; Spangenberg et al.). It is argued that the assessment of the multiple
values (i.e. monetary, non-monetary, and biophysical) of ES provides more comprehensive
information on ecosystem values (Martín-López et al., 2014) and can be used to identify trade-offs
between ESs for the purposes of equitable policy decisions (Díaz et al., 2015).
Non-monetary valuation, despite having been increasingly implemented into landscape management
in recent years (Reed, 2008) and having been acknowledged in ES typologies (MA, TEEB, CICES),
has not yet found a balanced application in ES assessments (Nieto-Romero et al., 2014). In this
study, we aim to improve understanding of the potential of non-monetary techniques for the valuation
of ESs through the comparison of rating and weighting methods in the novel context of landscape
preference assessment . The specific objectives are (1) to explore the importance of ESs through
rating and weighting approaches (2) to explain landscape preferences by rating and weighting, (3) to
statistically analyse for which ESs weighting and rating are distinct between clusters of people with
divergent landscape preferences, and (4) to draw conclusions about the explanatory value of
weighting and rating for landscape preferences. We identify clusters of people with similar landscape
preferences, identify rating and weighting levels of ESs for these clusters, and statistically analyse the
explanatory value of the rating of single ESs within a case study in Scotland.
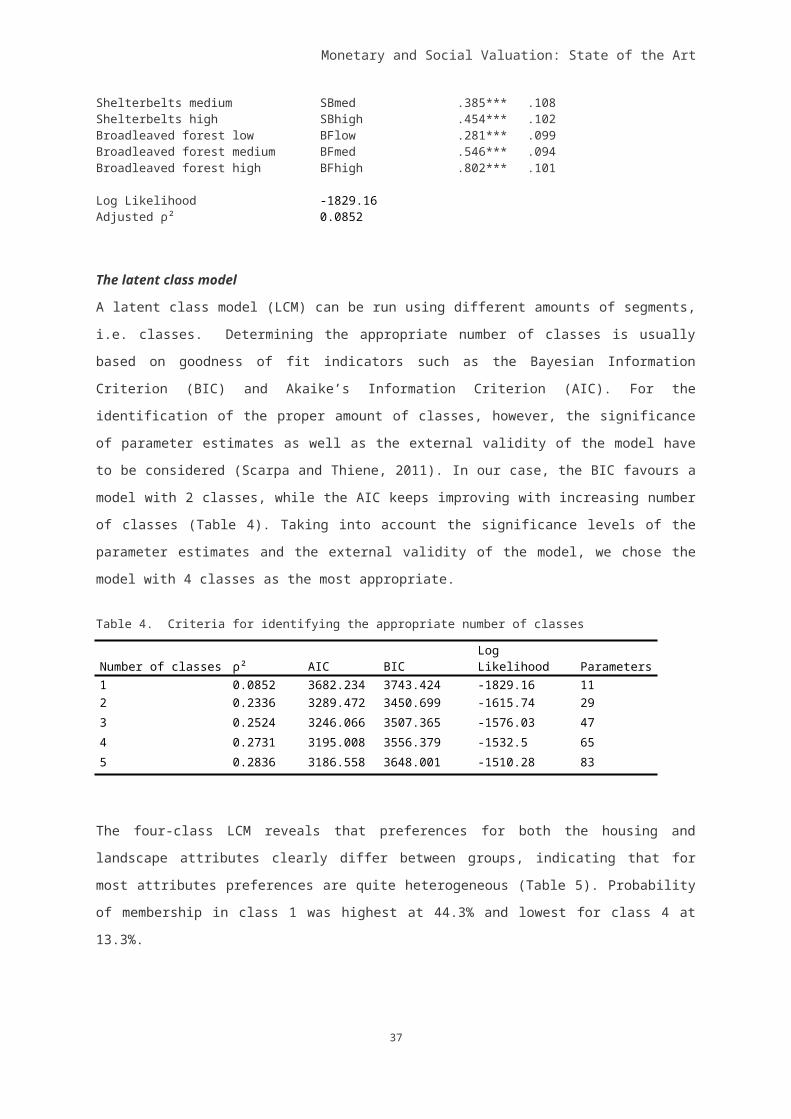
Monetary and Social Valuation: State of the Art
3.3.2 Study area: Pentland HillsThe Pentland Hills is located to the south-west of Edinburgh. The area comprises a variety of land
uses and provides an important recreational asset in the region. The northern part of the Pentland
Hills has been designated as a Regional Park since 1986 under the provisions of the Countryside
(Scotland) Act 1981 and covers an area of around 10,000 hectares.
The land within the Pentland Hills Regional Park is mostly privately owned by over 30 landowners and
farmers. Smaller sections are owned by the City of Edinburgh Council, Midlothian Council, West
Lothian Council and Scottish Water. The Regional Park is designated as an Area of Great Landscape
Value and comprises a landscape of hills, upland heather moorland, small pockets of woodland and
reservoirs. The main land use is sheep farming (upland and lowland areas), arable farming on lower
sections and equine. Traditional activities include shooting and fishing. The Regional Park is managed
by the City of Edinburgh Council Natural Heritage Service and aims to conserve and enhance the
environmental quality and public enjoyment of the area.
3.3.3 MethodsData collection
i. User surveyA user survey was conducted in the summer and fall of 2014. Tablet-based, on-site face-to-face
visitor interviews were conducted over a 4-week period in June and July 2014. Respondents were
randomly selected and approached on one of five car parks around the Regional Park before or after
their trip (n=454). Additionally, an online survey was available from August until October 2014
(n=109), the link to which was distributed widely among stakeholders of the Regional Park and
through the project’s website and social media. In both surveys, we elicited actual use, preferences
and values of ESs of visitors to the Regional Park.
ii. Questionnaire and selection of ESsThe clarity and suitability of the questionnaire was pre-tested on-site in February 2014. The final
questionnaire (see Appendix A) consisted of four sections: The first section derives general
information of the users, the motivation of their visit, activities they took part in and general attitudes
toward the management of the Regional Park. The second section assesses non-monetary values
that the Pentland Hills generate via rating and weighting techniques. The third section asks the
respondents to interactively choose a future landscape management scenario for the Pentland Hills
reflecting their personal preferences. Demographic information of the respondents was derived in a
last section.
39
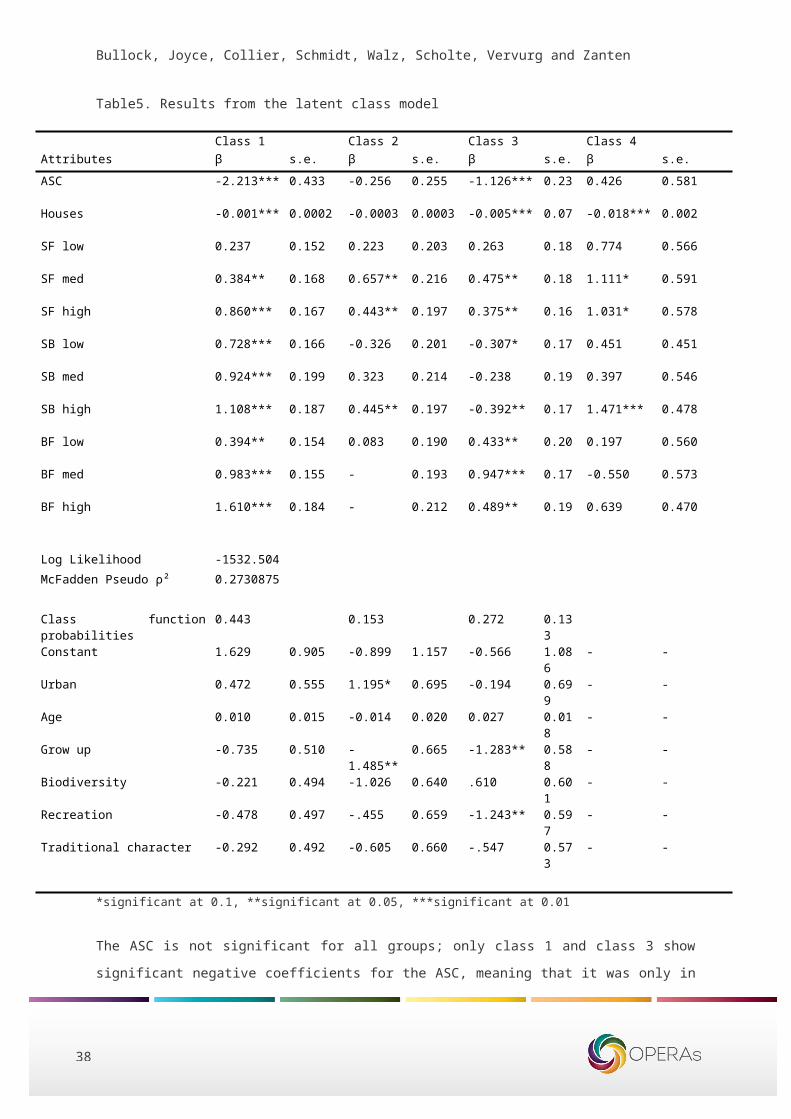
40
Bullock, Joyce, Collier, Schmidt, Walz, Scholte, Vervurg and Zanten
The questions in the first part were to a large part based on questions that were initially retrieved in
the Pentland Hills Regional Park Visitor Survey 2006 which the Regional Park Management had
expressed particular interest in up-dating. The list of ESs was derived in cooperation with the
Regional Park Management and selected members of the Councils and includes the most important
ESs provided by the Regional Park (Table 1).
Table. 1 Ecosystem services according to CICES classes and associated benefits that were used in the user survey
Ecosystem services(according to CICES class)
Benefit it provides to users (visitors, landowners)
Non-monetary valuation method
Experiential use of plants, animals and land-/seascapes in different environmental settings
It enables to experience nature by watching it
Rating, weighting
Physical use of land-/seascapes in different environmental settings
It enables to use nature by biking, hiking, walking in it
Rating, weighting, landscape preferences
Educational It enables to learn about and investigate the environment (education, research)
Rating, weighting
Heritage, cultural It holds places and things of natural and human history (landscape, farming traditions)
Rating, weighting
Aesthetic It provides inspiration and conveys a sense of place (aesthetics)
Rating, weighting, landscape preferences
Provision of reared animals and their outputs It provides agricultural products (food, wool)
Rating, weighting, landscape preferences
Filtration/sequestration/storage/accumulation by micro-organisms, algae, plants, and animals
It cleans and renews air, water and soils
Rating, weighting
Global climate regulation by reduction of greenhouse gas concentrations
It regulates the climate as a carbon sink
Rating, weighting, landscape preferences
Maintaining nursery populations and habitats It provides habitat for wild plants and animals
Rating, weighting, landscape preferences
iii Rating and weighting of ESs
Two non-monetary techniques were used for the valuation of ES and tested against the assessment
of landscape preferences (see next part) in a user survey in the Pentland Hills Regional Park, namely
rating and weighting. The importance that each respondent attributed to the 9 ES was first measured
by a rating approach based on Likert’s (1932) measurement of attitudes, using a five-point scale,
where 1= not important at all, 2= not very important, 3= of medium importance, 4= quite important,
and 5=very important. Likert scales are a common tool for the assessment and rating of stakeholder
values and attitudes in environmental research (Calvet-Mir et al., 2012; de Chazal et al., 2008;
Petrosillo et al., 2007; Ruiz-Frau et al., 2013).
In a second step, based on a study by Brown and Reed (2000), respondents were asked to weight
these ESs by allocating a total of 100 points across the listed ES. Respondents were free to distribute
the points according to their preferences, allowing them to distribute points evenly or in favour of only
a few or even one ES.
Monetary and Social Valuation: State of the Art
iii. Landscape preferences based on trade-offsIn a novel approach for measuring the importance of ES, respondents were asked to adjust a virtual
landscape indicating their preferences of actual and discussed land uses in the Pentland Hills, namely
food provisioning, habitat for wild plants and trees, habitat for wild animals, wind farming, climate
regulation (interlinked with habitat for wild plants), and recreation (Fig. 1), while being confronted with
trade-offs of these land uses. Respondents were asked to rate their preferred scenario on a scale
from 0-5 the level of personal inspiration each landscape could potentially provide.
By introducing trade-offs, we aim to derive a more nuanced picture of what ES respondents are willing
to give up for the attainment of their preferences. Trade-offs were based on algorithms, indicating the
potential impact of each land use on other land uses based on current research findings and
guidelines of practice. As we aimed to depict tangible trade-offs for very complex biophysical
relationships, we simplified the context and scientific information. For instance, we assume a linear
dependency between woodland expansion and carbon sequestration in our trade-off scenario,
forgoing the complex analysis of soil organic matter.
Fig. 1 Virtual trade-off based landscape management preferences; top shows original screen presented to respondents before preferences were logged, bottom shows a hypothetical scenario of preferences with strong focus on habitat for wild animals (birds)
Data analysis
To explore the valuation data, a series of statistical analyses was performed. First, respondents were
clustered into groups with similar landscape preferences. For these clusters, we performed basic
descriptive statistics on the rating and weighting data as well as non-parametric methods to test for
differences among clusters.
41
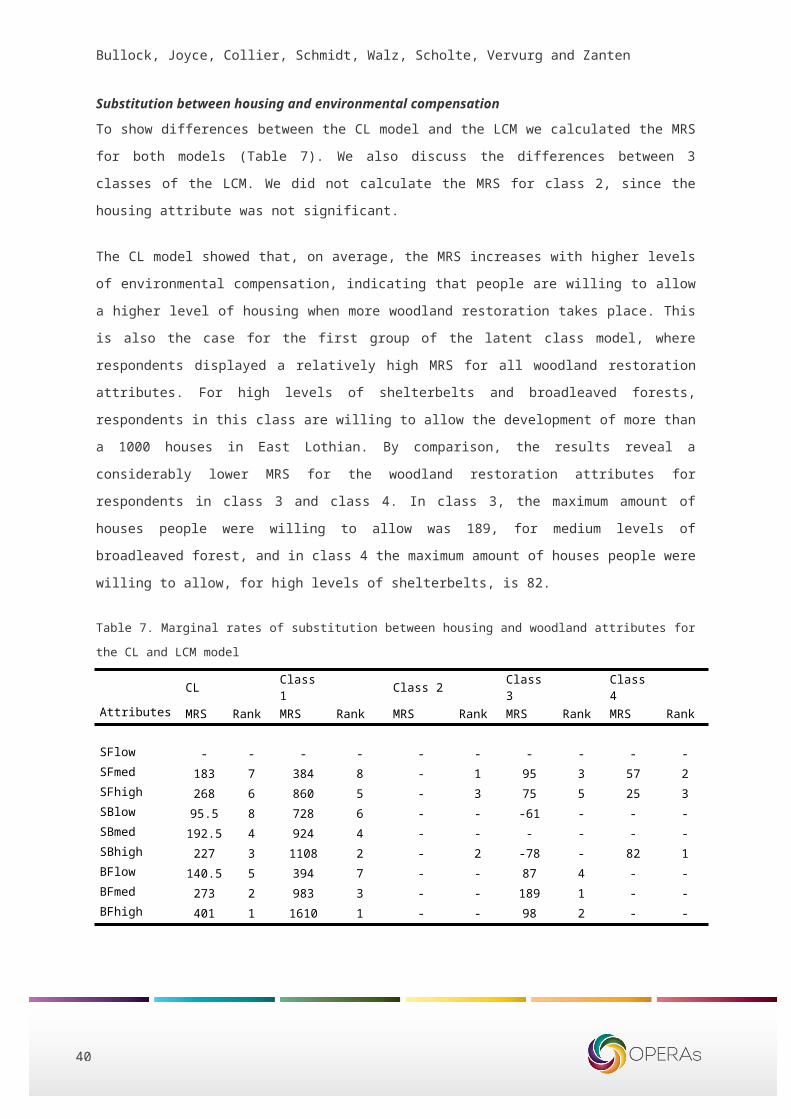
42
Bullock, Joyce, Collier, Schmidt, Walz, Scholte, Vervurg and Zanten
i. Cluster Analysis for landscape preferencesAs a first step in the data analysis, we performed Hierarchical Cluster Analysis (HCA) in order to
identify discernable groups of users according to their landscape preferences. We used Bray-Curtis
dissimilarity index and Ward’s linkage technique as agglomerative method to identify respondent
groups with similar landscape preferences in the HCA (Bray and Curtis, 1957; Ward, 1963).
ii. Descriptive statisticsWe performed simple statistical analyses (means, standard deviation) for both the rating and
weighting results to get a general overview over valuation results. In order to obtain a more specific
idea of the differences in the distribution of values of ESs in each cluster, we depicted medians and
quartiles for all nine ES in respect of their rating and weighting scores.
iii. Kruskal Wallis rank sum test / Dunn’s testA non-parametric Kruskal-Wallis rank sum test was performed to test if samples originate from the
same distribution, i.e. for differences between the clusters rating and weighting ES (Kruskal and
Wallis, 1952). A Post-hoc Dunn’s test was used to report which clusters differed by pairwise
comparison (Dunn, 1964).
3.3.4 Results
Cluster analysis based on trade-off preferences
Hierarchical cluster analysis based on landscape preferences for the future management in the
Pentland Hills Regional Park revealed five distinctive respondent groups (Fig. 2). These groups are
characterized by similar preferences in terms of the future land use in the Pentland Hills and what
they are willing to trade-off to maintain these preferences.
Cluster 1 (13%) represent the “Traditionalists”, who indicated moderate preferences for woodland,
habitat and species diversity, who could tolerate sheep farming and recreational uses to a small
extent, but who indicated that their preferences provided little inspiration.
Cluster 2 (16%), named “Multi-functionalists”, could almost equally tolerate all of the suggested land
uses, i.e. indicating no preferences for any particular land uses but a broad acceptance for them all.
Respondents indicated that their preferences would allow for a medium level of inspiration.
Cluster 3 (48%). We found that of the 563 respondents of our survey, almost half fitted into this
cluster, “Nature lovers”, who indicated clear preferences for habitat and species diversity as well as an
increase in woodland areas, while being tolerant of sheep farming and recreational uses.
Monetary and Social Valuation: State of the Art
Respondents in cluster 3 had little no or little tolerance for wind turbines in the Pentlands and
indicated their preferences would allow for a high level of inspiration.
Cluster 4 (15 %) These respondents were characterized as “recreation seekers”. They indicated the
highest preference for recreational infrastructure and uses while having a low-medium interest in
sheep farming, habitat and biodiversity and forest areas. Respondents had no or little tolerance for
wind turbines and indicated that their preferred land use scenario allowed for a medium level of
inspiration.
Cluster 5 (3%). ‘Forest enthusiasts’ were the smallest group of respondents. They indicated a strong
preference for forest areas and the expansion of forest far beyond the current area while indicating a
low tolerance of sheep farming. Respondents indicated a low-medium interest in habitat and
biodiversity and recreational uses while tolerating wind farms to a small extent. They indicated that
their preferred scenario would provide a low-medium level of inspiration.
43
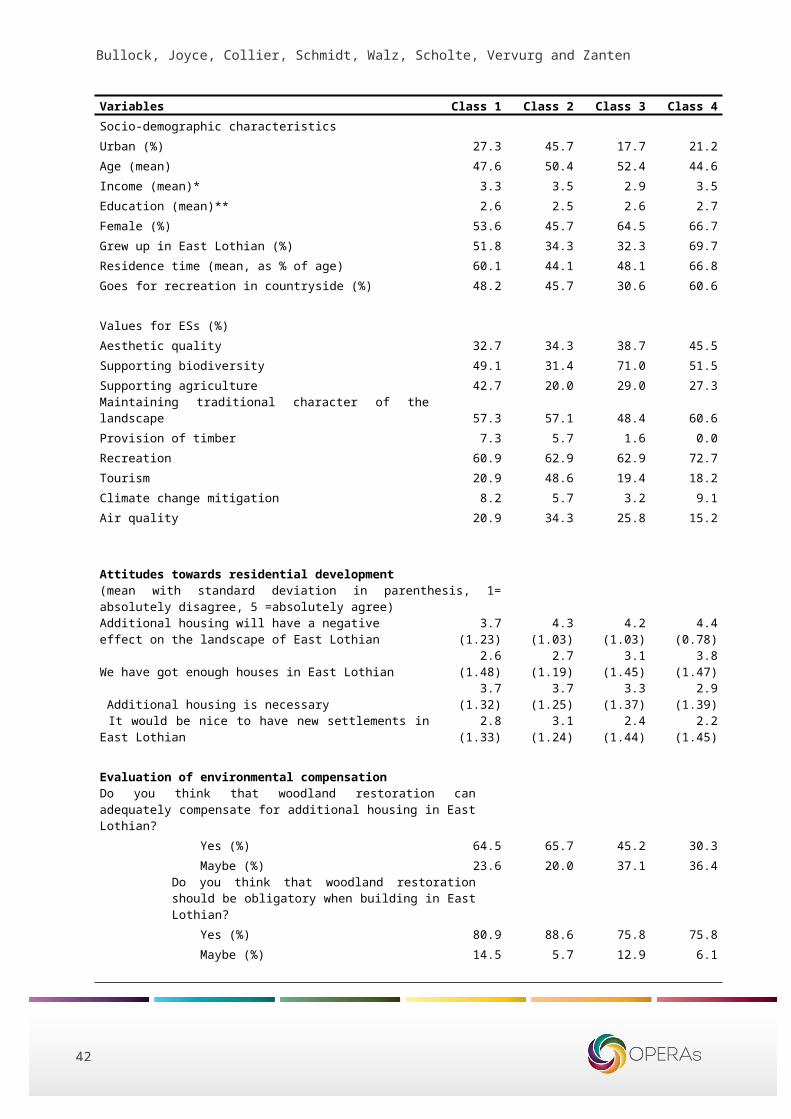
44
Bullock, Joyce, Collier, Schmidt, Walz, Scholte, Vervurg and Zanten
Fig. 2 Virtual landscapes of 5 clusters based on landscape preferences; barplots indicate mean
landscape preferences per cluster; boxplots indicate results of social rating (Likert scale) and social
weighting (allocation of 100 points) per cluster based on landscape preferences
Monetary and Social Valuation: State of the Art
Descriptive statistics
Simple statistical analysis was used to get an overview of ESs values across the sample. As shown in
Table 2, results of both valuation exercises suggest that the physical use of the Park is the most
important ES provided to users. The provision of food as well as carbon sequestration are found to be
the least important ES for users. Whereas the value points in the rating exercise range from 2.7 to 4.7
(medium personal importance to very high personal importance), the weighting exercise reveals a
more nuanced picture of the respondents’ preferences. Here we found that more than half of all points
were allocated towards three ES, whereas very few points were distributed to a couple of ES.
Table 2 Mean values and standard deviation for rating and weighting of ES across entire sample
Ecosystem service Rating Weighting
Mean SD Mean SD
Experiential use of plants, animals and
land-/seascapes in different environmental
settings
4.2 1.2 15.9 16.1
Physical use of land-/seascapes in different
environmental settings
4.7 0.8 27.5 20.6
Educational 3.3 1.4 11.5 12.0
Heritage, cultural 3.6 1.4 8.6 11.5
Aesthetic 3.8 1.3 7.7 9.9
Provision of reared animals and their outputs 2.7 1.5 5.1 8.7
Filtration/sequestration/storage/accumulation
by micro-organisms, algae, plants, and animals
3.8 1.4 5.4 8.3
Global climate regulation by reduction of
greenhouse gas concentrations
3.1 1.7 5.0 8.0
Maintaining nursery populations and habitats 4.2 1.1 12.3 13.3
Medians of the rating and weighting values reveal fine differences between the clusters, but larger
differences between applied valuation methods (Fig. 2). Rating scores across the sample are
homogeneous and comparably high for all clusters. Cultural ES (mostly physical and experiential use
of the landscape) and habitat services are most important to the people in all clusters, whereas the
provision of food is found least important for the respondents on a personal level. Whereas
Traditionalists and Multi-functionalists gave high to very high scores for all ES, Nature lovers and
Forest enthusiasts considered education and food provision to be of low to medium importance for
them personally. Recreation seekers considered food provision and carbon sequestration of low to
medium importance.
Weighting scores are more differentiated than rating results and show a similar, but more nuanced
picture with regard to ES across all clusters. Physical use of the landscape is assigned the highest
45
46
Bullock, Joyce, Collier, Schmidt, Walz, Scholte, Vervurg and Zanten
number of points in all clusters, the number of points being particularly high in the group of Recreation
seekers. Again, the experiential use of the landscape and habitat services are allocated the second
and third highest amounts of points across all five clusters, indicating their relatively high importance
to all respondents. Multi-functionalists and Forest enthusiasts allocate points across all ES, whereas
Traditionalists, Nature lovers and Recreation seekers focus on fewer ES and allocate only small
amounts of points to the other ES.
Kruskal-Wallis rank sum test / Dunn’s test
Kruskal-Wallis rank sum test reveals that rating and weighting of ES are not identical between
clusters. In the rating exercise, with the exception of education and mediation of pollutants, at least
one cluster values ES significantly different from the other clusters across all ES (Table 3). Dunn’s
test provides information about which clusters are distinguishable. As an example, whereas Nature
lovers value the experiential use of nature very highly (mean value=4.38, group A), this service is
significantly less important to Recreation seekers (mean value =3.91, group B) and Forest enthusiasts
(mean value =3.90, group B). Traditionalists (mean value =4.19) and Multi-functionalists (mean value
=4.11) lie in between both categories and thus overlap into group AB. Differences in the rating of
education and mediation of pollutants are not significant between clusters.
Table 3 Results of Kruskal-Wallis rank sum test and post-hoc Dunn’s test to examine how rating of ecosystem services differs between clusters
Ecosystem services
Kruskal-Wallis ranks sum test
Dunn’s test for rating of ES
Mean ratingCluster
1Tradition
alists
Cluster 2Multi-
functionalists
Cluster 3Naturelovers
Cluster 4
Recreation
seekers
Cluster 5Forest
enthusiasts
P-value Chi2 df GroupsExperiential use of
nature0.003579 15.6
174 AB AB A B B
Physical use of nature
0.006059 14.424
4 AB A A AB B
Education 0.2804 5.0674
4 A A A A A
Cultural and natural history
0.01766 11.959
4 AB AB A AB B
Aesthetics/Sense of place
0.0001783 22.256
4 B AB A AB B
Food provision 0.0009578 18.562
4 AB A BC AB C
Mediation of pollutants
0.1604 6.5705
4 A A A A A
Carbon sequestration
0.01338 12.604
4 AB A B B AB
Habitat/biodiversity 0.009658 13.357
4 B A AB A AB
Regarding the weighting exercise that required the allocation of 100 points across all ES, we find
significant differences in the weighting of ES between clusters (Table 4) compared with the rating
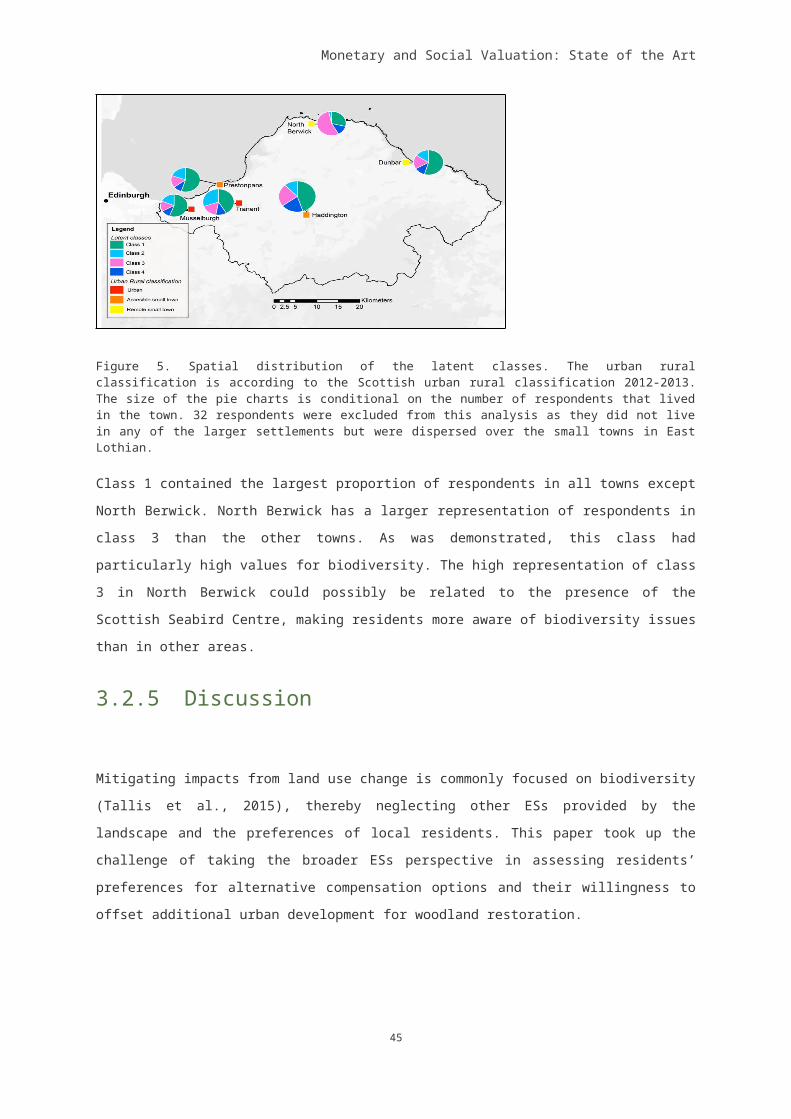
Monetary and Social Valuation: State of the Art
exercise. The results suggest that the weights placed on experiential use of nature, aesthetics/sense
of place, mediation of pollutants, carbon sequestration and habitat/biodiversity vary significantly
across clusters, whereas weights for the physical use of nature, education, cultural and natural
history, and food provision are not significantly different across groups with different landscape
preferences.
Table 4 Results of Kruskal-Wallis rank sum test and post-hoc Dunn’s test to examine how weighting (allocation of 100 points) of ecosystem services differ between clusters
Ecosystem services
Kruskal-Wallis ranks sum test Dunn’s test for weighting of ES
Mean ranking
Cluster 1
Traditionalist
s
Cluster 2Multi-
functionalists
Cluster 3Naturelovers
Cluster 4Recreatio
n seekers
Cluster 5Forest
enthusiasts
P-value Chi2 df Groups
Experiential use of nature
0.000785 19.003
4 B AB A AB B
Physical use of nature
0.1021 7.727 4 A A A A A
Education 0.3885 4.1315
4 A A A A A
Cultural and natural history
0.6792 2.3088
4 A A A A A
Aesthetics/Sense of place
0.00017 22.294
4 B A A AB AB
Food provision 0.212 5.832 4 A A A A A
Mediation of pollutants
0.02988 10.721
4 AB A AB B AB
Carbon sequestration
0.00067 19.335
4 B A B B A
Habitat/biodiversity 0.006421 14.291
4 B AB AB A B
3.3.5 Discussion
Non-monetary valuation of ESs is an emerging field and is gaining momentum in the ES community
(Kelemen et al., 2014; Scholte et al., 2015). Non-monetary techniques such as rating and weighting
have been applied in several cases for the social valuation of ES in recent studies (Hicks et al., 2013;
Sherrouse et al., 2011; Sherrouse et al., 2014; Tilliger et al., 2015). Results in this study indicate that
there are differences in the explanatory value of rating and weighting techniques for landscape
management. We found that for visitors to the Pentland Hills Regional Park in Scotland, the rating and
weighting scores of ES differed across groups with different landscape preferences. Whereas
descriptive statistics revealed only fine differences in ratings and weights across the five groups of
diverging landscape preferences, the Kruskal-Wallis rank sum test revealed significant differences in
non-monetary valuation across the clusters. We found that the experiential use of nature,
47
48
Bullock, Joyce, Collier, Schmidt, Walz, Scholte, Vervurg and Zanten
aesthetics/sense of place, carbon sequestration and habitat/biodiversity are ES that are rated and
weighted differently in the five clusters based on landscape preferences. We also found that the rating
exercise revealed more differences in ES values than the weighting exercise, even though, at first
glance, the rating results appear to be more uniform across clusters. Although it is not considered
desirable to achieve an equal level of methodological consistency as for monetary valuation, the
applicability of non-monetary valuation of ES is guided by an assessment of which methods are most
reliable in the valuation context (Kelemen et al., 2014).
Our results demonstrate that habitat/biodiversity, and the experiential and physical use of nature, are
the most important ESs provided by the Pentland Hills Regional Park. We analysed five clusters of
respondents with similar landscape preferences based on selected trade-offs that could mark the
future land management in the Pentland Hills within a novel valuation approach and found distinct
values for ES in each cluster. Descriptive analysis of the rating and weighting data without
consideration of landscape preferences limits the information content of the non-monetary valuation
approaches and compromises their explanatory value. We therefore propose that limitations in terms
of trade-offs are included within any non-monetary valuation approach to reduce homogeneous
valuation and to obtain a more differentiated picture of landscape preferences.
3.3.6 ConclusionRecent publications have recognized the plurality of values of ESs and the specifically the need to
improve our understanding of social values of ESs. Our results have increased our understanding of
non-monetary approaches to assess social values of ESs by empirically demonstrating (1) how the
importance of ES differs by the choice of valuation approach (rating, weighting), (2) how landscape
preferences can be explained by rating and weighting of ES, (3) how ESs rating and weighting results
are different between clusters of people with diverging landscape preferences, and (4) that the
explanatory value of weighting and rating approaches is greater with the inclusion of trade-offs as
applied here to clusters of landscape preferences.
ReferencesBray, J. R., Curtis, J. T., 1957, An Ordination of the Upland Forest Communities of Southern Wiscon-
sin, Ecological Monographs 27(4):326-349.
Brown, G., Reed, P., 2000, Validation of a forest values typology for use in national forest planning, Forest Science 46(2):240-247.
Calvet-Mir, L., Gómez-Baggethun, E., Reyes-García, V., 2012, Beyond food production: Ecosystem services provided by home gardens. A case study in Vall Fosca, Catalan Pyrenees, North-eastern Spain, Ecological Economics 74(0):153-160.
Chan, K. M. A., Guerry, A. D., Balvanera, P., Klain, S., Satterfield, T., Basurto, X., Bostrom, A., Chuenpagdee, R., Gould, R., Halpern, B. S., Hannahs, N., Levine, J., Norton, B., Ruck-
Monetary and Social Valuation: State of the Art
elshaus, M., Russell, R., Tam, J., Woodside, U., 2012, Where are Cultural and Social in Ecosystem Services? A Framework for Constructive Engagement, BioScience 62(8):744-756.
de Chazal, J., Quetier, F., Lavorel, S., Van Doorn, A., 2008, Including multiple differing stakeholder values into vulnerability assessments of socio-ecological systems, Global Environmental Change-Human and Policy Dimensions 18(3):508-520.
Dunn, O. J., 1964, Multiple Comparisons Using Rank Sums, Technometrics 6(3):241-252.
Díaz, S. et al The IPBES Conceptual Framework — connecting nature and people, Current Opinion in Environmental Sustainability 14:1-16.
Gómez-Baggethun, E et al;/, 2014,.State-of-the-art report on integrated valuationof ecosystem ser-vices, European Commission FP7.
Hicks, C. C., Graham, N. A. J., Cinner, J. E., 2013, Synergies and tradeoffs in how managers, scien-tists, and fishers value coral reef ecosystem services, Global Environmental Change 23(6):1444-1453.
Kelemen, E., García-Llorente, M., Pataki, G., Martín-López, B., Gómez-Baggethun, E., 2014, Non-monetary techniques for the valuation of ecosystem services, in: OpenNESS Reference Book (M. Potschin, K. Jax, eds.), EC FP7 Grant Agreement no. 308428.
Kruskal, W. H., Wallis, W. A., 1952, Use of Ranks in One-Criterion Variance Analysis, Journal of the American Statistical Association 47(260):583-621.
Likert, R., 1932, A Technique for the Measurement of Attitudes, Archives of Psychology 22(140):1-55.
Martín-López, B., Gómez-Baggethun, E., García-Llorente, M., Montes, C., 2014, Trade-offs across value-domains in ecosystem services assessment, Ecological Indicators 37, Part A(0):220-228.
Nieto-Romero, M., Oteros-Rozas, E., González, J. A., Martín-López, B., 2014, Exploring the knowl-edge landscape of ecosystem services assessments in Mediterranean agroecosystems: In-sights for future research, Environmental Science & Policy 37(0):121-133.
Petrosillo, I., Zurlini, G., Corliano, M., Zaccarelli, N., Dadamo, M., 2007, Tourist perception of recre-ational environment and management in a marine protected area, Landscape and Urban Planning 79(1):29-37.
Reed, M. S., 2008, Stakeholder participation for environmental management: A literature review, Bio-logical Conservation 141(10):2417-2431.
Ruiz-Frau, A., Hinz, H., Edwards-Jones, G., Kaiser, M. J., 2013, Spatially explicit economic assess-ment of cultural ecosystem services: Non-extractive recreational uses of the coastal environ-ment related to marine biodiversity, Marine Policy 38(0):90-98.
Scholte, S. S. K., van Teeffelen, A. J. A., Verburg, P. H., 2015, Integrating socio-cultural perspectives into ecosystem service valuation: A review of concepts and methods, Ecological Economics 114:67-78.
Sherrouse, B. C., Semmens, D. J., Clement, J. M., 2014, An application of Social Values for Ecosys-tem Services (SolVES) to three national forests in Colorado and Wyoming, Ecological Indica-tors 36(0):68-79.
Spangenberg, J. H., Görg, C., Settele, J., Stakeholder involvement in ESS research and governance: Between conceptual ambition and practical experiences – risks, challenges and tested tools, Ecosystem Services.
Tilliger, B., Rodríguez-Labajos, B., Bustamante, J. V., Settele, J., 2015, Disentangling Values in the Interrelations between Cultural Ecosystem Services and Landscape Conservation—A Case Study of the Ifugao Rice Terraces in the Philippines, Land 4(3):888-913.
Ward, J. H., 1963, Hierarchical Grouping to Optimize an Objective Function, Journal of the American Statistical Association 58(301):236-244.
49
50
Bullock, Joyce, Collier, Schmidt, Walz, Scholte, Vervurg and Zanten
Using choice modeling to map aesthetic values at a landscape scale: lessons from a Dutch case
study
Monetary and Social Valuation: State of the Art
4 Use of mapping and participatory mapping in socio-cultural valuation
4.1 IntroductionMapping, and specifically participatory mapping, can contribute to socio-cultural valuation both, as a tool in its own right for recording the location and extent of important ES, and as a means to stimulate deliberation processes. Various papers have been produced on the use of participatory mapping in recent years including, for example, Raymond et al (2009), Plieninger e al (2013) and Brown and Raymond (2014). These studies have been applied in various cultures and settings and demonstrate that people can identify places that are important for supporting, regulating and provisioning services. However, they also reveal the perceived value of cultural ecosystem service (CES) values with these often transcending other more instrumental ecosystem service benefits. It is argued that these values arise from socio-ecological relationships, often associated with food production or important natural resources such as water. These values are typically found to relate to bundles of CES and other ES benefits, and are often concentrated in known hot-spots.
Landscape preferences can be difficult to convert into maps and to extrapolate to other locations. This chapter presents a paper by Zanten et al from IVM which examines the potential for mapping aesthetic value as an ES as a means to capture people’s interaction with landscape through the use of photographs and the mapping of hot-spots of values. The authors combine this with choice experiments to determine people’s principal preferences and compare the results with more conventional methods of landscape assessment that focus on landscape structures and components. These results are compared in turn with the results from a revealed preference method based on numbers of individuals uploading photographs to the website Panoramio
They authors argue that, in comparison with ES-based preferences, other methods may be overly dependent on aesthetics and fail to account the multiple causality behind landscape preferences. The argument corresponds to the aforementioned bundling of ES values which support the notion of landscape multifunctionality. Zanten et al find that, using the ES, participants attach an importance to smaller-scale features of agricultural landscapes such as tree lines, small woods and the presence of livestock. whereas conventional methods often picked out larger features of land cover such as forested areas.
By comparison, the authors find that a landscape features assessment examines features in isolation and may fail to take into account the wider landscape context. They argue that by combining CE with photographs instead, participants are required to take into account various landscape attributes in the image, the perceived value of which can then be traded-off using a choice experiment (CE). The same more integrated assessment was found to be true of the landscape structure and compositional assessments.
51
52
Bullock, Joyce, Collier, Schmidt, Walz, Scholte, Vervurg and Zanten
4.2 Using choice modelling to map aesthetic values at a landscape scale: lessons from a Dutch case studyBoris T. van Zanten, Peter H. Verburg, Samantha S.K. .Scholte, K.F.Tieskens, K.F.
Based on paper submitted to Ecological Economics
4.2.1 IntroductionQuantifying and mapping ecosystem services is increasingly employed to guide policies in their
search for environmental sustainability. Traditionally, most mapping and quantification studies have
addressed regulating and/or provisioning ecosystem services (Crossman et al., 2013; Martínez-
Harms and Balvanera, 2012). Mapping cultural services has been more challenging as these services
do not directly relate to physical or ecological processes that are linked to common datasets and
observatories, but evolve from human interaction with the site and the environmental perception of
people (Plieninger et al., 2015). Consequently, the absence of an evident universal link between
physical features of landscapes and cultural services, such as aesthetic and recreational values,
complicates the design of effective landscape policies that aim to safeguard this type of services (van
Zanten et al., 2014a).
Commonly, approaches to map cultural ecosystem services, especially those that address aesthetics
or recreation potential, have been developed using secondary data or expert evaluation. These
approaches either use simple look-up tables to relate the value of services to land-cover classes
(Burkhard et al., 2009; Jacobs et al., 2015; Kienast et al., 2009), or assume relations between cultural
services and indicators that describe the state of an ecological system (e.g. naturalness or diversity)
(Casado-Arzuaga et al., 2013). These studies have in common that they do not explicitly account for
the multiple causality of cultural services and aesthetics specifically: Next to physical features of
landscapes (e.g. land-cover), the benefits that people obtain from cultural services depend on
individual, cultural and socio-ecological contexts (Chan et al., 2012; Daniel and Boster, 1976;
Fagerholm et al., 2012), and therefore, these assessments lose credibility when values are spatially
extrapolated over inappropriate scales (Geijzendorffer and Roche, 2014).
Outside the realm of the ecosystem service approach, a substantial body of methods and data has
been developed to study the aesthetic and recreational value of landscapes through landscape
preferences (Daniel et al., 2012). In these studies, sophisticated methods were developed to estimate
the value of specific landscape features, but often they do not make these aesthetic and recreational
values spatially explicit in the format of maps (van Zanten et al., 2014b). Typically, landscape
preference studies use landscape photographs as a surrogate for a ‘real’ landscape experience in a
particular case study area (Dramstad et al., 2006; Hull and Stewart, 1992; Ode et al., 2009). Based on
Monetary and Social Valuation: State of the Art
such landscape photographs they measure preferences, mostly using a ‘representative’ or
‘characteristic’ landscape picture as a reference (Howley, 2011; Rogge et al., 2007). Yet, these
landscape preference studies hold valuable methodologies that relate subjective aesthetic values to
specific features of landscapes. Since information on the spatial occurrence of these landscape
features is available in spatial datasets, there is a potential to use landscape preference studies to
support aesthetic value mapping.
To bridge the gap between proxy-based cultural services maps and landscape preference research a
number of novel approaches for mapping cultural ecosystem services were developed recently.
These approaches specifically consider the scalability of recreational values (Grêt-regamey et al.,
2014) and community values through participatory mapping (Brown and Fagerholm, 2015; Plieninger
et al., 2013). However, a mapping method to assess landscape preferences in order to evaluate the
contribution of specific features to the aesthetic value of landscapes has not been developed yet.
Including the aesthetic values of landscapes within methods to map cultural ecosystems services can
further advance the operational value of ecosystem service mapping to inform landscape policy and
management.
The aim of this study is to develop a comprehensive method to evaluate landscape preferences to
map aesthetic values across a landscape or region. Using manipulated landscape photographs, this
method aims to enable the evaluation of aesthetic values based on preferences for specific features in
the visual landscape. We apply this method in an agricultural landscape in the east of the Netherlands
where features range from livestock presence to features that describe land-cover structure and
composition. To systematically capture landscape users’ trade-offs between different features of the
agricultural landscape, we apply a choice experiment. Subsequently, we scale-up preferences for
(combinations of) landscape features that we find on a visual landscape level to a regional landscape
map using generic feature mapping (Alessa et al., 2008). We reflect upon the validity of the proposed
method through a comparison with existing generic feature mapping methods for cultural ecosystem
services that address aesthetic values on a landscape scale (Burkhard et al 2009, van Berkel &
Verburg, 2014) and by a comparison to a revealed landscape preference map.
4.2.2 Methods
Overview of the methodologyThe first step of the analysis comprises the selection of relevant landscape features that are included
as landscape attributes in a choice experiment. This selection is based on a synthesis of existing
literature and engagement of local stakeholders to identify a shortlist of those landscape attributes
that contribute to the provision of aesthetic values in the case study. Second, spatial data are
collected from existing datasets and observatories to assess the spatial variation of the selected
53
54
Bullock, Joyce, Collier, Schmidt, Walz, Scholte, Vervurg and Zanten
landscape attributes in the case study area. Third, the observed spatial variation of landscape
attribute levels in the area is used to determine the attribute levels of the choice experiment. Fourth,
the predicted probabilities from the choice model are used to estimate the aesthetic value in a
spatially explicit manner for the landscapes in the case study region as a whole. Fifth, we compare the
thus produced map of aesthetic values to other mapping approaches that have used different
methodologies (Burkhard et al., 2009; van Berkel and Verburg, 2014). For verification purposes we
compare our results to the density of uploaded Panoramio photo’s in the area, (Casalegno et al.,
2013), which we use as an indicator of revealed aesthetic landscape preferences.
Although the method is designed to be generically applicable, we test the method in the context of
Winterswijk National Landscape, located in the east of the Netherlands. The area is recognized as a
distinctive rural landscape in the Netherlands and is protected under Dutch law as a National
Landscape. Agriculture is the dominant land use in the area. Throughout the national landscape, the
agricultural system is oriented towards the production of dairy products with mostly grazing livestock
(grasslands) and corn fodder crops grown. Past socio-economic processes and poor soil conditions
have largely shaped agricultural activities in Winterswijk, with farmers constrained to small and
dispersed agricultural plots (Wildenbeest, 1989). The resulting land-use pattern is a relatively well
preserved traditional characteristically scattered agricultural landscape, with small plots enclosed by
hedgerows (Coulisse landscape). As a consequence, aesthetic values and other cultural ecosystem
services are valued highly in the region. Recreation, cultural heritage and aesthetic quality are
considered important and Winterswijk has a well-developed landscape related tourism industry with
several bed and breakfasts and campsites (Bäcklund et al., 2011; Korevaar et al., 2008; van Berkel
and Verburg, 2014). In addition, the number of hobby-farmers is steadily increasing.
Selection of landscape attributesIn a choice experiment, an ecosystem service or good is described based on its key attributes. By
forming different combinations of attributes, hypothetical alternative ‘goods’ (i.e. landscape scenarios)
are created out of which the respondents in the experiment choose an alternative they prefer most
(Louviere et al., 2003). Hence, the selection of landscape attributes is essential for the degree of
external validity of the study.
The landscape attributes were selected through a careful process: Using the results of the meta-
analysis (van Zanten et al., 2014b), a number of potentially important categories of landscape
attributes to describe the aesthetic value of agricultural landscapes was identified. Most European
landscape preference studies include attributes describing 1) agricultural practices, such as the
presence of livestock, farm stewardship or intensity of practices; 2) the composition of agricultural
land use (i.e. specific crops or grassland); 3) the prevalence of landscape elements, such as
hedgerows, stone walls or riparian vegetation; 4) the presence of patches of forest or moorland.
Monetary and Social Valuation: State of the Art
These categories were further refined and adapted to the local landscape context through
engagement of stakeholders that are involved in local landscape management and rural tourism. We
asked the stakeholders through an open question which characteristics of the agricultural landscape
in the area they perceive as the most important for its aesthetic values. They mentioned a number of
landscape characteristics including the small-scale agricultural landscape with plots enclosed by
hedgerows and tree lines, the diversity of crops, and the presence of cattle. Based on this discussion,
the authors decided that in this study, the visual appearance of the agricultural landscape is mainly
defined by four landscape attributes: 1) the presence of livestock (cattle), 2) the ratio between maize
and grassland, 3) the prevalence of hedgerows and tree lines and 4) the prevalence of forest patches.
Spatial variation of landscape attributesSpatial data on the presence of livestock is extracted from the Dutch agricultural census,
georeferenced at farm level (Naeff et al., 2014). This attribute is defined as a dichotomous variable; it
describes the presence or absence of livestock based on the likelihood of encountering livestock in
the field. The maize-grassland ratio – the attribute to describe the composition of agricultural land use
– is extracted from the Dutch national topographical vector dataset (TOP10; Kadaster, 2013).
Because the largest share of the arable land in the area is used to grow maize (75%, Korevaar et al.,
2008), the maize-grassland ratio is established by dividing the area arable land by the area grassland.
The prevalence of hedgerows and tree lines is measured by the length of these linear elements in
meters. The data are extracted from the VIRIS-database (Alterra Wageningen UR, 2006), which is a
25 meter resolution grid based on the TOP10 source data. The prevalence of forest patches is
mapped based on TOP10 vector data and is defined as a continuous variable based on the count of
forest patches. Because of the high level of detail of the data (often one forest patch consists of
multiple polygons), forest patches are aggregated in a search area of 25 meter around each polygon.
Since the presence of landscape elements and forest patches in this type of small-scale agricultural
landscapes often obstructs a full 360o view, we assume that the visual landscape is twice the area
presented in the base landscape picture. For the presence of livestock, the results of the moving
window analysis indicate the mean presence of livestock in the field, which yields a value between 0
and 1. We interpret this value as the probability of encountering livestock. For the maize-grassland
ratio, the moving window analysis yields the mean value in the neighbourhood around each cell. For
prevalence of hedgerows and tree lines and the prevalence of forest patches, we calculate the sum in
the neighbourhood around each cell.
We use the results of the moving window analysis to define the levels of the landscape attributes in
the choice experiment. In the choice experiment, the presence of livestock has two levels: presence
and absence of livestock, as a probability for encountering livestock is not easily visualized in
landscape pictures.
55
56
Bullock, Joyce, Collier, Schmidt, Walz, Scholte, Vervurg and Zanten
Choice experimentChoice modelling is a tool to elicit preference for a set of alternative goods, services or policy
alternatives (Hoyos, 2010; Louviere et al., 2003; Rambonilaza and Dachary-Bernard, 2007). In a
choice experiment, an good or service – in this case a visual agricultural landscape – is defined using
a set of attributes that are expected to determine the value of the good. In this experiment, we present
a series of eight choices to respondents, which each consist of three different landscape alternatives
(i.e. combinations of landscape attributes, see Figure 1). Choice experiments build on random utility
theory, which states that the utility that an individual gains from a good depends on a systematic
component, i.e. the landscape attributes, and a random component (McFadden, 1974). Based on the
collected data, a choice model estimates the probability that respondents choose a landscape
alternative, using the attributes in the experiment as independent variables. Generally, choice
experiments in environmental economics consist of a number of ecological/landscape attributes as
well as a price-attribute to enable inference of a monetary value of environmental attributes (Hanley et
al., 1998; Hynes and Campbell, 2011). However, for this experiment the objective is to map the
relative preferences for the key visual landscape attributes in the area (as a proxy for the aesthetic as
an ecosystem service) rather than a monetary estimate of the stated value of the agricultural
landscapes. Therefore, we do not include a price attribute.
In July 2013, the choice experiment and an accompanying questionnaire was completed through 191
face-to-face interviews in the Dutch municipality of Winterswijk. All respondents were briefly
introduced with the concept of agri-environmental measures. For the choice experiment itself, each
respondent was confronted with eight choice situations with three landscape alternatives. The
experiment did not include an opt-out option. The experiment is not focused on specific policy
measures or a landscape change over time, but it is developed to assess the relative importance of
the different attributes in the landscape in the regional landscape context. For a detailed description of
the data collection and model estimation for this choice experiment, we refer to the Supplementary
Material S1.
Table 1 shows the translation of attribute levels derived from the spatial datasets to the digitally
manipulated landscape pictures in the choice experiment. Figure 1 shows three alternative landscape
pictures as they are presented to the respondents. The maps above the landscape alternatives show
where and how the attributes maize-grassland ratio, prevalence of hedgerows and tree lines and the
prevalence of forest patches are placed into the landscape that is visible on the picture. The presence
of livestock is a dichotomous variable (present or absent), displayed in the foreground and therefore
not shown in the map. The background landscape is held constant in all landscape alternatives. The
location of the background landscape is selected because of the slightly elevated perspective, which

Monetary and Social Valuation: State of the Art
enables us to capture all four landscape attributes in a single picture, but still ensuring a credible
surrogate for a realistic first person landscape experience (Figure 1).
Table 1: Attribute levels in the spatial data and the landscape visualization. Attribute Low Medium High
Spatial data
Visualization Spatial data
Visualization
Spatial data
Visualization
Presence of Livestock < 0.5 Livestock is absent - - > 0.5 Livestock is present
Maize/grassland ratio < 0.1 ≈0.1 (visualized in background)
0.1-1 ≈0.4 > 1 ≈1.1
Prevalence of hedgerows and tree lines
< 440m ≈0m 440-1440m
≈500m >1440m ≈1000m
Prevalence of forest patches
< 4 patches
2 patches (visualized in background)
4-10 patches
4 patches > 10 patches
6 patches
Figure 1: Three landscape alternatives that were included in the choice experiment. The photographs below were presented to the respondents. The pictures above show a map of the photographed area with graphical illustrations of the manipulated landscape attributes.
57
58
Bullock, Joyce, Collier, Schmidt, Walz, Scholte, Vervurg and Zanten
Mapping aesthetic valuesUsing the choice model, we apply a market share simulation exercise (Louviere et al., 2003) to assess
the relative preferences for all possible landscape alternatives that occur in the case study area.
These market shares describe the value (i.e. utility) of a landscape alternative relative to all other
landscape alternatives in the experiment. For this, we use the attribute level parameters from the
conditional logit model (Table 2) and calculate the predicted probabilities for all combinations of
landscape attributes in the case study area. The predicted probabilities describe the probability that a
respondent chooses a landscape alternative out of the 54 (2*3*3*3) possible combinations of
landscape attributes, and thus, represents the part-worth utility or relative aesthetic value of that
particular landscape alternative. The probability scores were subsequently linked to a combined map
of all landscape attribute levels, which indicates for each 25*25m resolution grid cell the combination
of landscape attribute levels that occur in their neighborhood. This results in the final map of relative
visual landscape preferences as a proxy for the aesthetic service provision in the area.
Table 2: Output of the conditional logit choice model. Attribute Coefficient std. error p-value
Presence of livestock 1.245*** 0.081 0.000
Med maize-grassland .300*** 0.076 0.000
High maize-grassland .612*** 0.096 0.000
Med hedges and tree lines 1.595*** 0.145 0.000
High hedges and tree lines 2.063*** 0.155 0.000
Med forest patches .215** 0.080 0.011
High forest patches .713*** 0.080 0.000
Log-likelihood -1199
McFadden adjusted pseudo-R2 0.28
N observations 1528
N individuals 191
***, **, * ==> Significance at 1%, 5%, 10% level
Comparison of mapping methodsWe compare the results of our method to existing landscape scale mapping approaches for aesthetic
values. Two of these methods are generic feature mapping approaches using primary preference data
at different scales of landscape evaluation that were developed by van Berkel and Verburg (2014) in
the context of our case study area. The third method is the widely adopted land-cover based ES-
matrix developed by Burkhard et al. (2009).
Burkhard et al., (2009) introduced an ecosystem service assessment method based on land-cover
classes, which is referred to as the ES-matrix (Jacobs et al., 2015). In its initial application, the
Monetary and Social Valuation: State of the Art
method builds on a generic expert evaluation of capacities to provide recreational & aesthetic values
and other ecosystem services on a 1 to 5 scale linked to 100m resolution European CORINE land-
cover data (European Environment Agency, 2012) and can, therefore, be applied in our (and any
other European) case study area. The two mapping methods developed by van Berkel & Verburg
(2014) build on primary landscape preference data collected through questionnaires among visitors.
For their first method, an aesthetic value map was created based on preferences for individual
landscape features, values were assigned to these landscape features and spatially extrapolated over
the case study area. The second mapping method developed by van Berkel & Verburg (2014) values
landscape aesthetics based on land cover structure and composition: respondents chose from a set
of six satellite images showing agricultural landscapes with different compositions and configurations
of agricultural land, forest and landscape elements. Using a fuzzy membership calculation, it was
determined to what extent each of the six satellite images fitted landscape structure and composition
across the study areas. Subsequently, the aesthetic value map was created by a weighted overlay of
the six fuzzy membership layers. Weights were determined by the amount of respondents that chose
the satellite image based on its land cover structure and composition.
We qualitatively describe the impact of the mapping method on the hotspots of aesthetic values and
the degree of spatial clustering. Hotspots are areas with high densities of ecosystem service supply
(Alessa et al., 2008). We apply a hotspot analysis in ArcMap to calculate the Getis-Ord Gi* spatial
statistic. This statistic enables us to identify and compare statistically significant spatial clusters
(McPhearson et al., 2013; Zhu et al., 2010) of high and low values in the four mapping approaches.
The Gi* Z-scores describe the standard deviation of values in a cluster. Under the assumption of a
normal distribution, the Z-scores of 1.65, 1.98 and 2.58 correspond with p-values of < .10, <0.05 and
<0.01. For quantitative comparison of the configuration of hot and cold spots, we create an agreement
map using a methodology developed by Schulp et al. (2014) and we present the percentage
agreement on hot spots among the four methods in tabular form. Additionally, to compare the overall
degree of spatial clustering in the maps, we apply an incremental spatial autocorrelation analysis and
compare Moran’s I among the four approaches at incremental distance of 100-1000 meters around
each cell. Moran’s I is a spatial statistic ranging from -1 (perfect negative autocorrelation) to 1 (perfect
positive autocorrelation). A value of 0 indicates a perfectly random spatial pattern.
Comparison to revealed preferencesTo verify the results of our mapping approach, we descriptively compare the cultural
ecosystem services map based on the choice experiment method to a density map of
geotagged photographs extracted from the web platform Panoramio. Density functions of
online passively-crowdsourced photo repositories are a valuable source of information to
estimate the provision of cultural ecosystem services and have been applied in several other
studies, such as Casalegno et al. (2013), Nahuelhual et al. (2013) and Wood et al. (2013).
59
60
Bullock, Joyce, Collier, Schmidt, Walz, Scholte, Vervurg and Zanten
To estimate the aesthetic value of landscapes, the Panoramio database in particular hosts
valuable information as this repository focuses on photographs of landscapes and natural
features of the environment specifically. In this study, we follow the methodology that is
proposed by Casalegno et al., (2013) to map the aesthetic value of landscapes. The number
of individuals that have uploaded photographs per unit area (1 km2) is used as a measure of
landscape value (we excluded photos geotagged in urban areas). This approach is more
appropriate than the total number photographs, as otherwise the data can be severely
biased by very active individual photographers in a particular unit area.
4.2.3 Results
Aesthetic value mapUsing these choice data of respondents, we estimate a conditional logit choice model (Table 2). The
attribute levels are dummy-coded. Low levels are the reference categories. All coefficients are positive
and statistically significant, indicating that the presence of any medium or high level attribute
increases the probability that a respondent chooses a landscape alternative. The size of the
coefficient shows the preference of respondents for the attribute level relative to the presence of the
other attributes. The third column of the table shows the standard errors of the parameter estimates.
The goodness of fit of the model is indicated by the McFadden adjusted Pseudo-R2.
Figure 4 shows the aesthetic value map that was developed using the results of the approach
developed for this study. The map displays the stretched values of the predicted probabilities of the
different landscape alternatives. The red areas on the map represent high values. These are areas
with the most preferred combination of landscape attributes in the visual landscape. In the south and
south-east of the case study area, the highest concentration of high values is found. Comparing
Figure 4 with map of landscape attributes, we can conclude that the high concentration in the south
and southeast of the area is a result of a combination of a high level of hedges and tree lines,
Figure 4 (1 column): Aesthetic value map based on a choice experiment among landscape visitors. Values on the map show the predicted probabilities from the choice model. The predicted probabilities are determined by the presence of landscape attributes in a neighbourhood, depicting the visual landscape, around each cell.
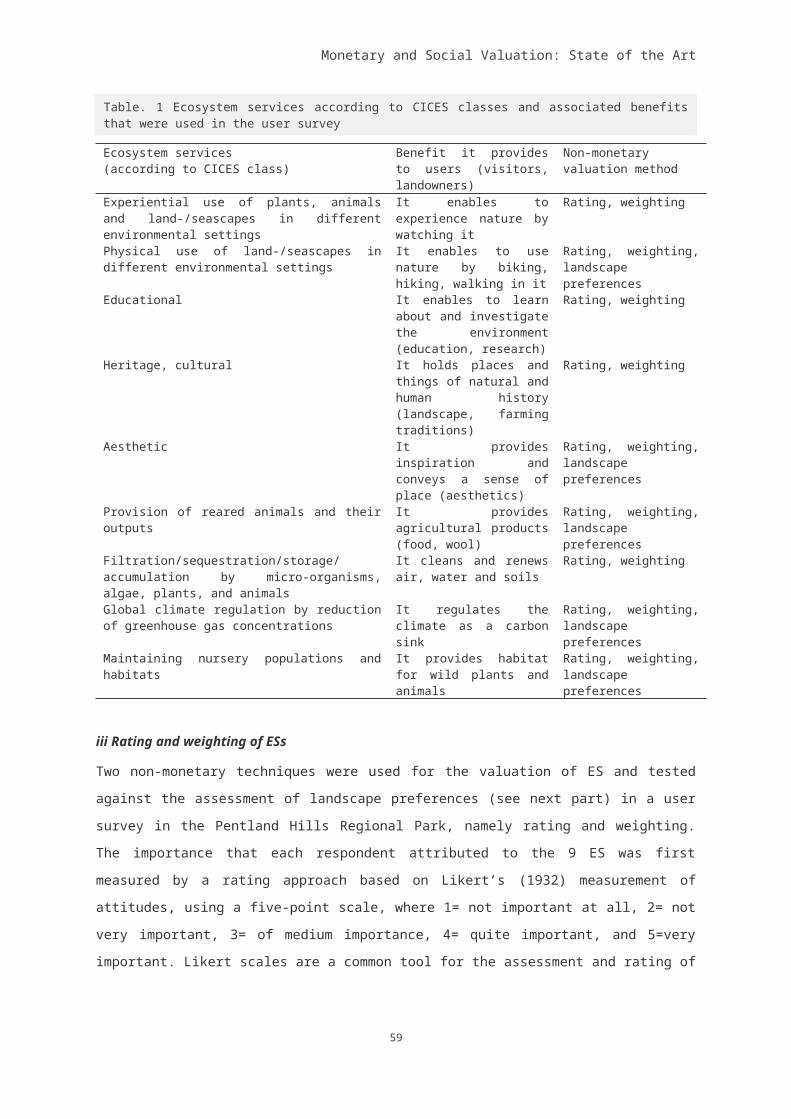
Monetary and Social Valuation: State of the Art
presence of livestock and forest patches. In several other places in the area, we find clusters of low
values. For instance, the absence of livestock in the eastern part of the area causes an elongated
area of low values in the aesthetic value map. Also, the absence of hedgerows and tree lines and
forest patches in western parts of the area clearly results in a clustering of low values
Comparison of mapping methods
Qualitative comparison To qualitatively compare aesthetic value patterns, we conduct a hotspot analysis on maps produced
using the choice experiment method, the ES-matrix and land-cover method (Burkhard et al., 2009),
and the landscape features method and landscape structure and composition method (van Berkel and
Verburg, 2014). The map shows the Getis-Ord Gi* Z-scores (Figure 3). The red areas signify the
hotspots on the map and blue areas show the cold spots. The Z-score is the standard deviation of
preference estimates in the cluster. If Z-scores are > 2.58, values in the cluster are >2.58 times the
standard deviation.
The maps in Figure 3 have in common that they all identify hotspots in the small-scale agricultural
landscapes with forest patches in the south and east of the case study area. In particular, the ES-
matrix and land cover method and the landscape features method reveal a similar pattern of hotspots
in the forested areas in the south and east. The choice experiment method also depicts a high
number of hotspots in the south and east, but the configuration of those hotspots follows an inverse
61
Figure 3: A hotspot analysis of the cultural ecosystem service map based on the choice experiment and three other landscape scale generic feature mapping approaches for cultural ecosystem services.
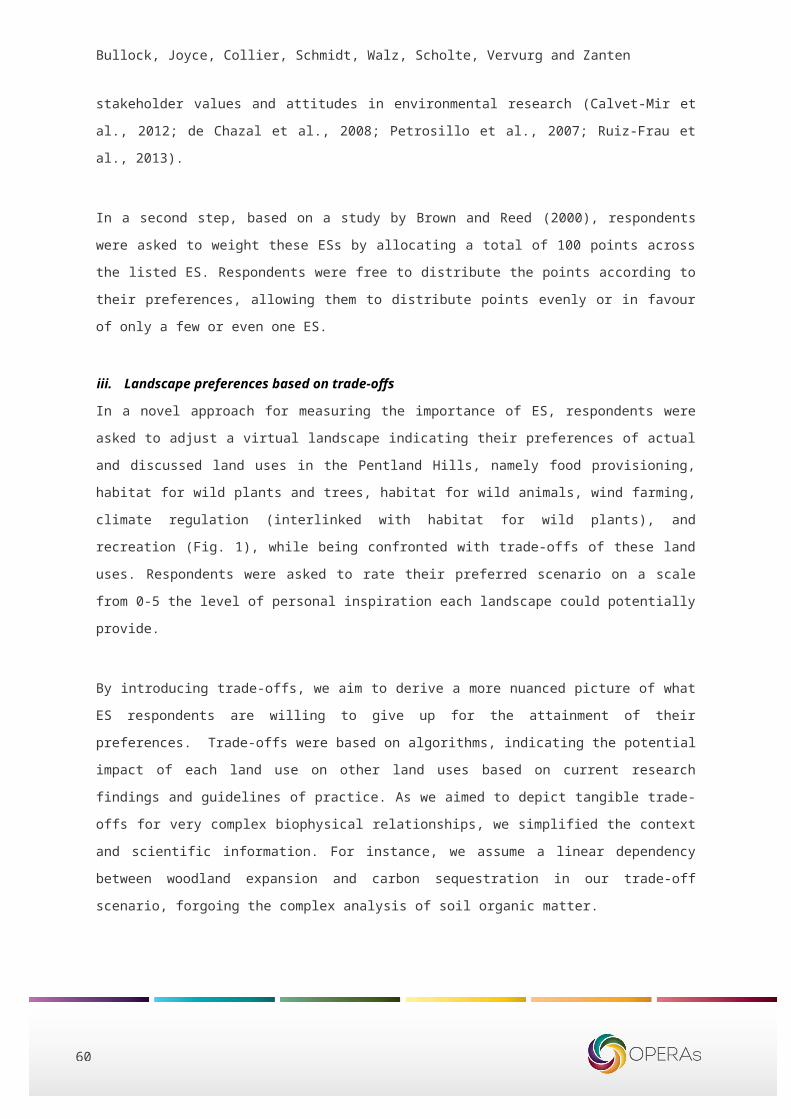
62
Bullock, Joyce, Collier, Schmidt, Walz, Scholte, Vervurg and Zanten
pattern compared with the pattern shown by the ES-matrix and land-cover method and landscape
features method. This result can be explained by the high value attributed to forested areas by the
latter two methods while the choice experiment revealed that visitors in the area mostly appreciate the
small-scale agricultural areas that are enclosed by linear elements and forest patches. Except for the
forested areas, the ES-matrix and land-cover method (Burkhard et al., 2009) hardly show similarities
with the other mapping approaches. While the three other methods identify hotspots in the southern
and eastern section of the case study area, the ES-matrix and land-cover method reveals large cold
spots in these areas. This is because mosaic land-cover classes in CORINE (grid codes 20 and 21,
EAA, 2012) are assigned low values for aesthetic and recreational values in the ES-matrix, whereas
the three other maps – which are based on primary data – show that these mosaic landscapes are
actually hotspots of aesthetic values in the area.
Quantitative comparisonWe compare the spatial configuration of agreement on hot and cold spots between the four different
mapping methods. Areas of disagreement are evenly distributed over the case study area. As a
measure of overall quantitative comparison between the maps, Table 2 presents the pairwise
agreement on hot spots between the methods across the region. For instance, out of the hot spots
identified by the ES-matrix and land cover method 83% overlaps with hot spots from the landscape
feature method. Hot spots identified by the landscape features method overlap for 39% with hot spots
from the landscape structure and composition method.
Figure 4 (1.5 column): An agreement map of aesthetic values between the four mapping methods that are compared (a)) and an agreement map of aesthetic values between the choice experiment method and the density of Panoramio photo’s (b)). The legend shows that green areas indicate an agreement on hot spots (HS), whereas blue areas indicate agreement on cold spots (CS). Red areas signify places the in landscape where there is disagreement about hot and cold spots.
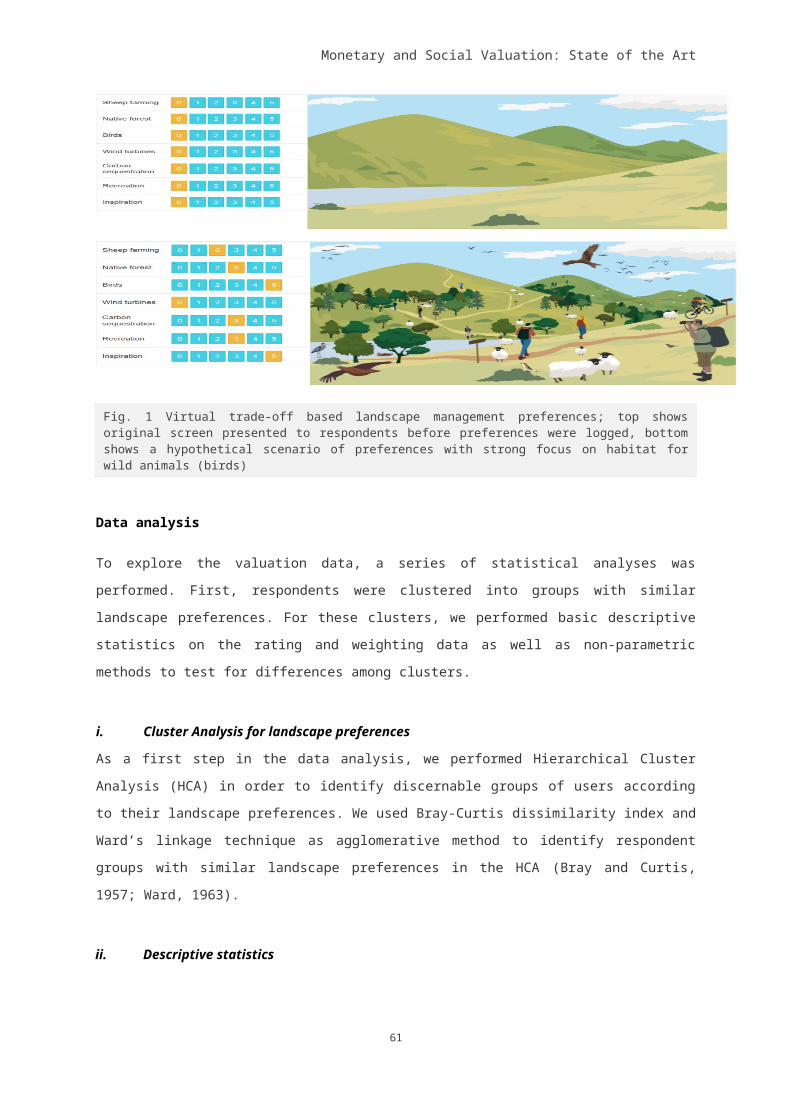
Monetary and Social Valuation: State of the Art
Table 3: The percentage overlap of hot spots with other methods in the comparison.
Method (number of hot spot cells)
ES-matrix and land
coverLandscape
features
Landscape structure and composition
Choice experiment
ES-matrix and land cover (1279) - 83.11% 59.42% 14.78%
Landscape features (6613) 16.07% - 38.56% 27.82%
Landscape structure and composition
(5208) 14.59% 48.96% - 28.26%
Choice experiment (5049) 3.74% 36.44% 29.15% -
To describe the differences between the methods with respect to spatial clustering of aesthetic
values, we conduct an incremental spatial autocorrelation analysis. The lowest level of spatial
autocorrelation between 100-600 meters around cells is found for the ES-matrix and land-cover
method and the landscape features method. Above the 600 meter increment, the choice experiment
method has a lower spatial autocorrelation than the landscape features method.
Comparison to revealed preferences We compare a hotspot map of the choice experiment method with the Panoramio photo-density map.
The photo-density map is classified based on seven quantiles of the distribution. In total, our dataset
consists of 1595 photo’s that have been uploaded by 253 users. When we only consider the number
of unique user uploads per unit area, 660 observations remain. We observe similar patterns of hot-
and cold spots in the two maps. In both maps, there is a high concentration of hotspots in the south
and southeast of the area. Especially the cluster just south of the town of Winterswijk (the large white
area in the center of the map) shows remarkable similarities. A clear difference is seen in the far
southeast corner of the study area where based on the choice experiment we find a high landscape
preference while only few Panoramio photos are taken in this area. Also, smaller hotspots in the
northwest and southwest of the case study area reveal similar patterns in the two maps. With regard
to cold spots, we observe a relatively similar pattern in the eastern and north-eastern area.
4.2.4 Discussion
Applicability of the method outside the case study areaThe method presented in this paper provides a novel approach for mapping the aesthetic values of
the landscape, as a component of cultural ecosystem services, by accounting for the stated
preferences of respondents. The approach may be applied to regions of different size as long as they
are relatively homogeneous in landscape features and user groups. For diverse landscapes it may be
difficult to construct a choice experiment that consistently represents all landscape features. In case of
strong variation in user groups a more detailed sampling approach across the region may be needed.
63

64
Bullock, Joyce, Collier, Schmidt, Walz, Scholte, Vervurg and Zanten
The approach can be made specific to different groups of landscape users. In our case study we
focused on visitors as they are very important to the regional economy and largely attracted by the
visual quality of the landscape in our case study area (Bäcklund et al., 2011; van Berkel and Verburg,
2014). However, this method can also be applied to samples of local residents and, by comparing
maps, areas of conflicting landscape preferences between user groups may be identified.
Alternatively, this method can be combined with scenario analysis of landscape change (van Berkel
and Verburg, 2012) exploring the effects of future LU/LC change in agricultural landscapes on its
aesthetic values as perceived by user groups.
The added value for policy making of the proposed method is that it allows measuring the contribution
of specific features to the overall aesthetic value of the landscape. At the same time, it is required to
define landscape features general enough to allow spatial extrapolation (i.e. mapping) of aesthetic
values across the region of interest. This type of information potentially can help the design of regional
agri-environmental policies, which aim to safeguard cultural ecosystem services provided by agrarian
landscapes (Plieninger et al., 2012).
Methodological ConsiderationsWe review the validity of this method and its results through a comparison to other mapping methods,
and through a partial verification of the results using Panoramio photo-densities as an indicator of
revealed landscape preferences. The methodological comparison has demonstrated clear similarities
and differences between the different aesthetic value maps, which can be explained by a number of
key methodological choices that underlie the different mapping methods. In the following sections, we
reflect upon these methodological choices.
Selection of landscape attributes: which landscape features contribute to its aesthetic value? The type of landscape features that are addressed in the mapping procedure, i.e. the type of
ecosystem service providing units (Andersson et al., 2015), co-determines the outcomes of the
mapping method. The choice experiment method shows that the presence of livestock is perceived as
an important landscape attribute in the area, whereas the other studies do not take it into account. Of
the four methods, the landscape features method includes the most specific and detailed landscape
attributes. For the other two mapping methods compared in this paper, the service providing units are
defined in a more abstract way and at other spatial scales, expressing the value of a landscape solely
based on land-cover composition (Burkhard et al., 2009) or the spatial structure and composition of
land-cover (van Berkel and Verburg, 2014). For instance, in comparison with the landscape features
method and the landscape structure and composition method, the choice experiment method reveals
a higher concentration of hotspots in the north of the case study area (Figure 3). This is a result of the
high levels of presence of livestock and a high maize-grassland ratio in the northern area; these
attributes/service providing units, are only included in the choice experiment.
Monetary and Social Valuation: State of the Art
The significant differences originating from the choice of landscape attributes accounted for indicates
that a proper selection of landscape attributes is essential (Blamey et al., 2002). We propose that in
mapping studies a rationale for the choice of landscape attributes that are considered as determinants
of landscape preferences is explicitly provided.
The scale and level of integration of landscape evaluationThe mapping approaches in the comparison that rely on primary data (i.e. the choice experiment
method, the landscape features method and the landscape structure and composition method) all use
choice-based elicitation methods with landscape pictures to value landscape attributes. However,
there are some notable differences with respect to the scale of evaluation and the level of integration
of the landscape attributes in the elicitation of preferences. For the landscape features method, the
respondents ranked landscape attributes in isolation, regardless of the landscape context in the
landscape in the direct vicinity of that particular landscape feature. In contrast, the choice experiment
and landscape structure and composition method take an integrated approach evaluating all
landscape attributes in a single picture and thus force respondents to trade-off different attributes.
However, the choice experiment method and the landscape structure and composition method apply
different scales of landscape evaluation. In the choice experiment, we measure landscape
preferences at a visual landscape scale as a surrogate for the real landscape experience, the
structure and composition method visualizes and presents landscape structure and composition to
respondents using satellite imagery (van Berkel and Verburg, 2014). The difference in spatial
autocorrelation between the landscape structure and composition method and the choice experiment
method is partly a result of this difference in scale of landscape evaluation. In the choice experiment
only the visual landscape is evaluated, whereas the structure and composition method evaluates
≈2km2 blocks. This leads to a higher level of spatial detail in the choice experiment map and thus to
disagreement between hot and cold spots in the value maps (Figure 4a). Also, the scale at which the
landscape is evaluated by respondents has consequences for geo-spatial characteristics of attributes
that can be included in the study (Daniel, 2001). Preferences for the presence of livestock, for
example, cannot be measured through satellite images.
The lowest level of spatial autocorrelation of aesthetic values is found for the ES-matrix and land-
cover method and the landscape features method. This is a direct consequence of the approach in
which categorical landscape attributes are being valued in isolation from each other rather than
accounting for the context in the visual landscape in around each grid cell. Aesthetic values assigned
to landscapes are often considered holistic, implicating that in a landscape “each element only gets its
meaning, significance or value according to the context or the surrounding elements” (Antrop, 2000,
pp 19). Therefore, we argue that in order to quantify the contribution of specific landscape features in
a meaningful way, an integrated evaluation of landscape features is required. Additionally, if aesthetic
65
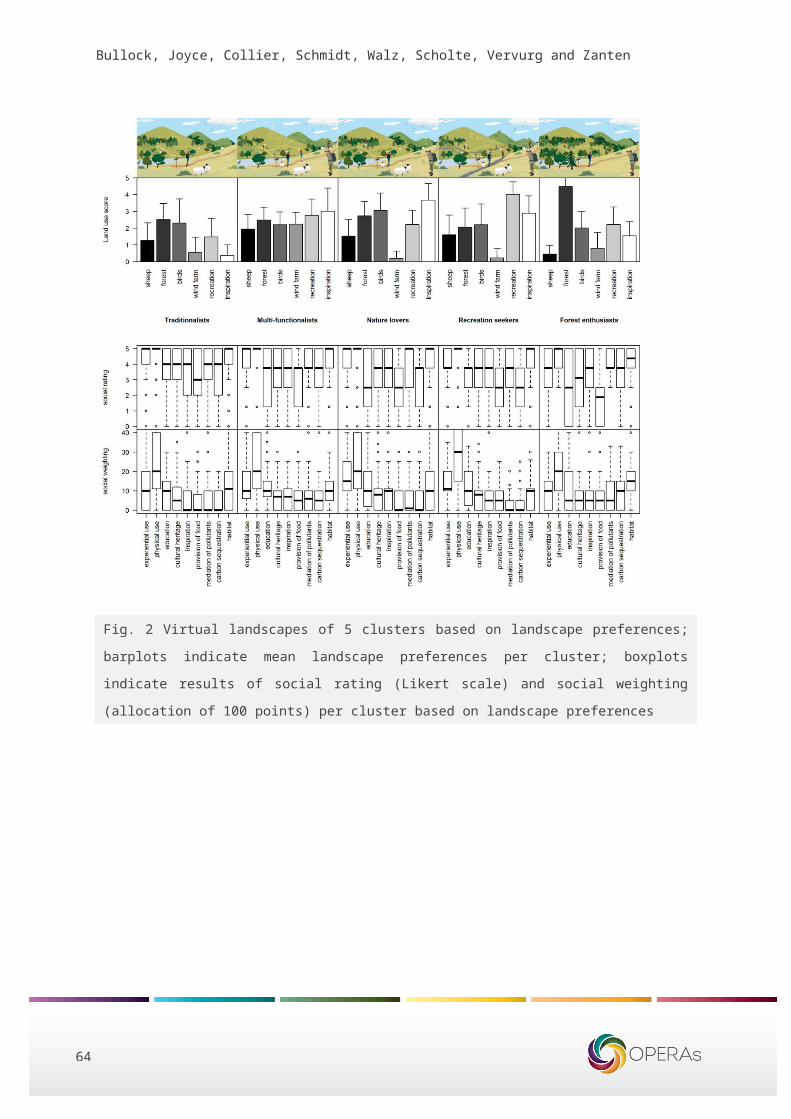
66
Bullock, Joyce, Collier, Schmidt, Walz, Scholte, Vervurg and Zanten
value maps aim to directly relate to the values that were assigned to these landscape attributes by the
users of the landscape, it is important to ensure that the mapping method and value assignment
capture as much as possible the landscape user’s visual scale of experience (Daniel and Boster,
1976; Daniel, 2001; Tveit et al., 2006). Our approach that values landscape attributes within the visual
landscape context in an integrated way is designed to meet these requirements.
Validation using revealed preferencesAlthough we aim to validate the general pattern of aesthetic values by comparison to the Panoramio
photo-density map, we do not expect the two maps to be perfectly correlated due to conceptual and
methodological differences. The choice experiment map represents stated landscape preferences,
while the Panoramio photo density map indicates revealed preferences of landscape users. Thus, one
should consider that extrapolated stated preferences from the choice experiment indicate the potential
of the agricultural landscape to provide aesthetic enjoyment by visitors, whereas the Panoramio map
is an indicator of where services are actually provided, which is also determined by accessibility of the
landscape and the locations of tourism accommodations. Moreover, except for the four landscape
attributes that are included in the choice experiment, there may be other specific attributes of the
agricultural landscape that trigger higher photo densities (e.g., traditional farm buildings, variations in
grassland management).
4.2.5 ConclusionsTo identify the aesthetic value of a landscape, the choice experiment based approach proposed in this
paper addresses some of the shortcomings in mapping approaches existing in the literature. First, the
approach is based on a careful selection process of relevant landscape attributes, using both a
European level meta-analytic categorization and local expert and stakeholder knowledge. Second, as
many other studies have shown (e.g. Eigenbrod et al., 2010), value-transfer based on simple
ecological proxies leads to poor estimates of cultural ecosystem services due to contextual biases
(Jacobs et al., 2015). Our choice-based primary data approach avoids these types of biases. Third,
the method enables an integrated evaluation of the landscape attributes within the visual landscape
context as experienced by landscape users. In addition, applying a choice experiment introduces
trade-offs and assessment of the relative importance of landscape attributes (e.g. Arnberger and
Eder, 2011; Daniel et al., 2012). It is often the combination and/or the configuration of landscape
characteristics that contributes to its aesthetic value. Fourth, landscape preferences are measured
from a visual landscape perspective to provide realistic surrogate for a real landscape experience,
which enables the inclusion of relevant attributes at that occur at different scales in the visual
landscape, ranging from livestock to land cover composition. By representing the regional range of
occurrence of landscape attributes in the choice experiment the results become useful for mapping.
Although the implementation of the approach is region-specific, the overall methodology is easily
transferable between different regions and beneficiary groups. In that sense, our method can be
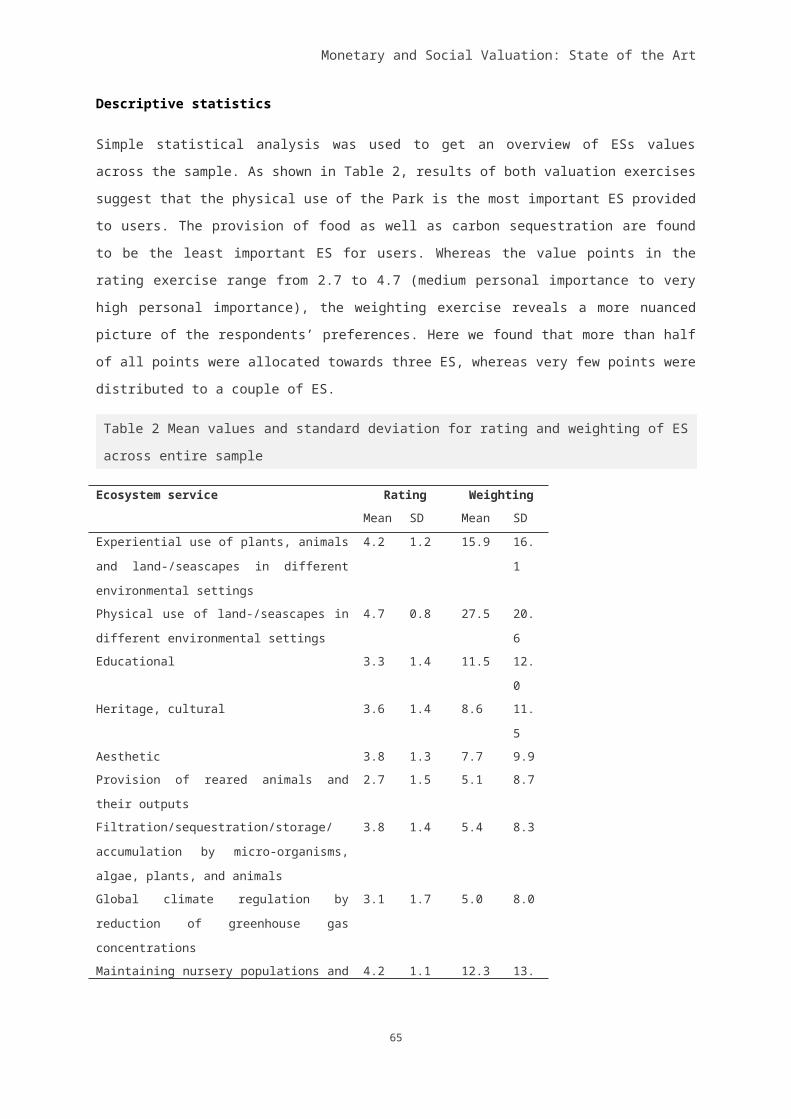
Monetary and Social Valuation: State of the Art
regarded as a generic methodology for context-sensitive mapping values of aesthetic ecosystem
services.
References
Alessa, L. (Naia), Kliskey, A. (Anaru), Brown, G., 2008. Social-ecological hotspots mapping: A spatial approach for identifying coupled social-ecological space. Landsc. Urban Plan. 85, 27–39. doi:10.1016/j.landurbplan.2007.09.007
Alterra Wageningen UR, 2006. Visueel Ruimtelijk Informatiesysteem (VIRIS) [WWW Document]. URL http://www.wageningenur.nl/nl/show/VIRIS.htm (accessed 5.12.13).
Andersson, E., McPhearson, T., Kremer, P., Gomez-Baggethun, E. Haase, D., Tuvendal, M., Wurster, D., 2015. Scale and Context Dependence of Ecosystem Service Providing Units. Ecosyst. Serv. doi:10.1016/j.ecoser.2014.08.001
Antrop, M., 2000. Background concepts for integrated landscape analysis. Agric. Ecosyst. Environ. 77, 17–28.
Appleton, K., Lovett, A., 2003. GIS-based visualisation of rural landscapes: defining “sufficient” real-ism for environmental decision-making. Landsc. Urban Plan. 65, 117–131. doi:10.1016/S0169-2046(02)00245-1
Arnberger, A., Eder, R., 2011. Exploring the Heterogeneity of Rural Landscape Preferences: An Im-age-Based Latent Class Approach. Landsc. Res. 36, 19–40. doi:10.1080/01426397.2010.536204
Bäcklund, A., Schenk, A., Atger, F., 2011. Understanding European Regional Diversity-Lessons learned from Case Studies, Research Reports in Human Geography.
Blamey, R.K., Bennett, J.W., Louviere, J.J., Morrison, M.D., Rolfe, J.C., 2002. Attribute causality in environmental choice modelling. Environ. Resour. Econ. 23, 167–186. doi:10.1023/A:1021202425295
Brown, G., Fagerholm, N., 2015. Empirical PPGIS/PGIS mapping of ecosystem services: A review and evaluation. Ecosyst. Serv. 1–15. doi:10.1016/j.ecoser.2014.10.007
Burkhard, B., Kroll, F., Müller, F., Windhorst, W., 2009. Landscapes‘ Capacities to Provide Ecosystem Services – a Concept for Land-Cover Based Assessments. Landsc. Online 15, 1–22. doi:10.3097/LO.200915
Casado-Arzuaga, I., Onaindia, M., Madariaga, I., Verburg, P.H., 2013. Mapping recreation and aes-thetic value of ecosystems in the Bilbao Metropolitan Greenbelt (northern Spain) to support land-scape planning. Landsc. Ecol. 29, 1393–1405. doi:10.1007/s10980-013-9945-2
Casalegno, S., Inger, R., Desilvey, C., Gaston, K.J., 2013. Spatial covariance between aesthetic value & other ecosystem services. PLoS One 8, e68437. doi:10.1371/journal.pone.0068437
Chan, K.M.A., Guerry, A.D., Balvanera, P., Klain, S., Satterfield, T., Bostrom, A., Chuenpagdee, R., Gould, R., Halpern, B.S., Hannahs, N., Levine, J., Norton, B., Ruckelshaus, M., Russell, R., Tam, J., Woodside, U., 2012. Where are Cultural and Social in Ecosystem Services? A Frame-work for Constructive Engagement. Bioscience 62, 744–756. doi:10.1525/bio.2012.62.8.7
Crossman, N.D., Burkhard, B., Nedkov, S., Willemen, L., Petz, K., Palomo, I., Drakou, E.G., Martín-Lopez, B., McPhearson, T., Boyanova, K., Alkemade, R., Egoh, B., Dunbar, M.B., Maes, J., 2013. A blueprint for mapping and modelling ecosystem services. Ecosyst. Serv. 4, 4–14. doi:10.1016/j.ecoser.2013.02.001
Daniel, T.C., 2001. Whither scenic beauty? Visual landscape quality assessment in the 21st century. Landsc. Urban Plan. 54, 267–281. doi:10.1016/S0169-2046(01)00141-4
67
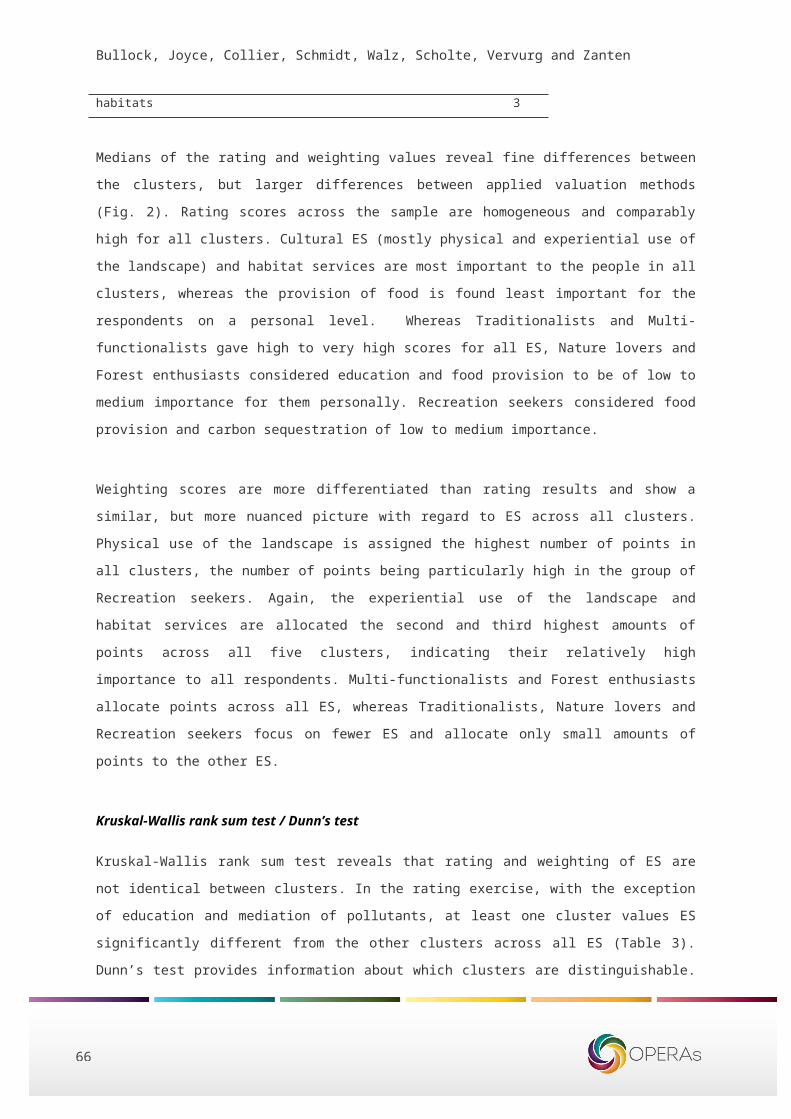
68
Bullock, Joyce, Collier, Schmidt, Walz, Scholte, Vervurg and Zanten
Daniel, T.C., Boster, R.S., 1976. Measuring landscape esthetics: the scenic beauty estimation method, USDA Forest Service Research Paper.
Daniel, T.C., Muhar, A., Arnberger, A., Aznar, O., Boyd, J.W., Chan, K.M. a, Costanza, R., Elmqvist, T., Flint, C.G., Gobster, P.H., Grêt-Regamey, A., Lave, R., Muhar, S., Penker, M., Ribe, R.G., Schauppenlehner, T., Sikor, T., Soloviy, I., Spierenburg, M., Taczanowska, K., Tam, J., von der Dunk, A., 2012. Contributions of cultural services to the ecosystem services agenda. Proc. Natl. Acad. Sci. U. S. A. 109, 8812–9. doi:10.1073/pnas.1114773109
Dramstad, W.E., Tveit, M.S., Fjellstad, W.J., Fry, G.L. a., 2006. Relationships between visual land-scape preferences and map-based indicators of landscape structure. Landsc. Urban Plan. 78, 465–474. doi:10.1016/j.landurbplan.2005.12.006
EAA (European Environment Agency), 2012. CORINE Land Cover 2006 raster data – 100 m, version 16 [WWW Document].
Eigenbrod, F., Armsworth, P.R., Anderson, B.J., Heinemeyer, A., Gillings, S., Roy, D.B., Thomas, C.D., Gaston, K.J., 2010. The impact of proxy-based methods on mapping the distribution of ecosystem services. J. Appl. Ecol. 47, 377–385. doi:10.1111/j.1365-2664.2010.01777.x
Fagerholm, N., Käyhkö, N., Ndumbaro, F., Khamis, M., 2012. Community stakeholders’ knowledge in landscape assessments – Mapping indicators for landscape services. Ecol. Indic. 18, 421–433. doi:10.1016/j.ecolind.2011.12.004
Geijzendorffer, I.R., Roche, P.K., 2014. The relevant scales of ecosystem services demand. Ecosyst. Serv. 10, 49–51. doi:10.1016/j.ecoser.2014.09.002
Grêt-regamey, A., Weibel, B., Kienast, F., Rabe, S., Zulian, G., 2014. A tiered approach for mapping ecosystem services. Ecosyst. Serv. 1–11. doi:10.1016/j.ecoser.2014.10.008
Hanley, N., Wright, R.E., Adamowicz, V.I.C., 1998. Using Choice Experiments to Value the Environ-ment. Environ. Resour. Econ. 11, 413–428.
Howley, P., 2011. Landscape aesthetics: Assessing the general publics’ preferences towards rural landscapes. Ecol. Econ. 72, 161–169. doi:10.1016/j.ecolecon.2011.09.026
Hoyos, D., 2010. The state of the art of environmental valuation with discrete choice experiments. Ecol. Econ. 69, 1595–1603. doi:10.1016/j.ecolecon.2010.04.011
Hull, R.H., Stewart, W., 1992. Validity of photo-based scenic beauty judgments. J. Environ. Psychol. 101–114.
Hynes, S., Campbell, D., 2011. Estimating the welfare impacts of agricultural landscape change in Ire-land: a choice experiment approach. J. Environ. Plan. Manag. 54, 1019–1039. doi:10.1080/09640568.2010.547691
Jacobs, S., Burkhard, B., Van Daele, T., Staes, J., Schneiders, A., 2015. “The Matrix Reloaded”: A re-view of expert knowledge use for mapping ecosystem services. Ecol. Modell. 295, 21–30. doi:10.1016/j.ecolmodel.2014.08.024
Kadaster, 2013. TOP10NL [WWW Document]. URL https://www.pdok.nl/nl/producten/pdok-down-loads/basis-registratie-topografie/topnl/topnl-actueel/top10nl (accessed 6.8.13).
Kienast, F., Bolliger, J., Potschin, M., de Groot, R.S., Verburg, P.H., Heller, I., Wascher, D., Haines-Young, R., 2009. Assessing landscape functions with broad-scale environmental data: insights gained from a prototype development for Europe. Environ. Manage. 44, 1099–120. doi:10.1007/s00267-009-9384-7
Korevaar, H., Meulenkamp, W., Agricola, H., Geerts, R., van der Kolk, J., 2008. Kwaliteit van het landelijk gebied in drie Nationale Landschappen (Rural area quality in three Dutch “National Landscapes”) 94.
Louviere, J.J., Hensher, D.A., Swait, J.D., 2003. Stated Choice Methods: Analysis and Applications. Cambridge University Press, Cambridge.
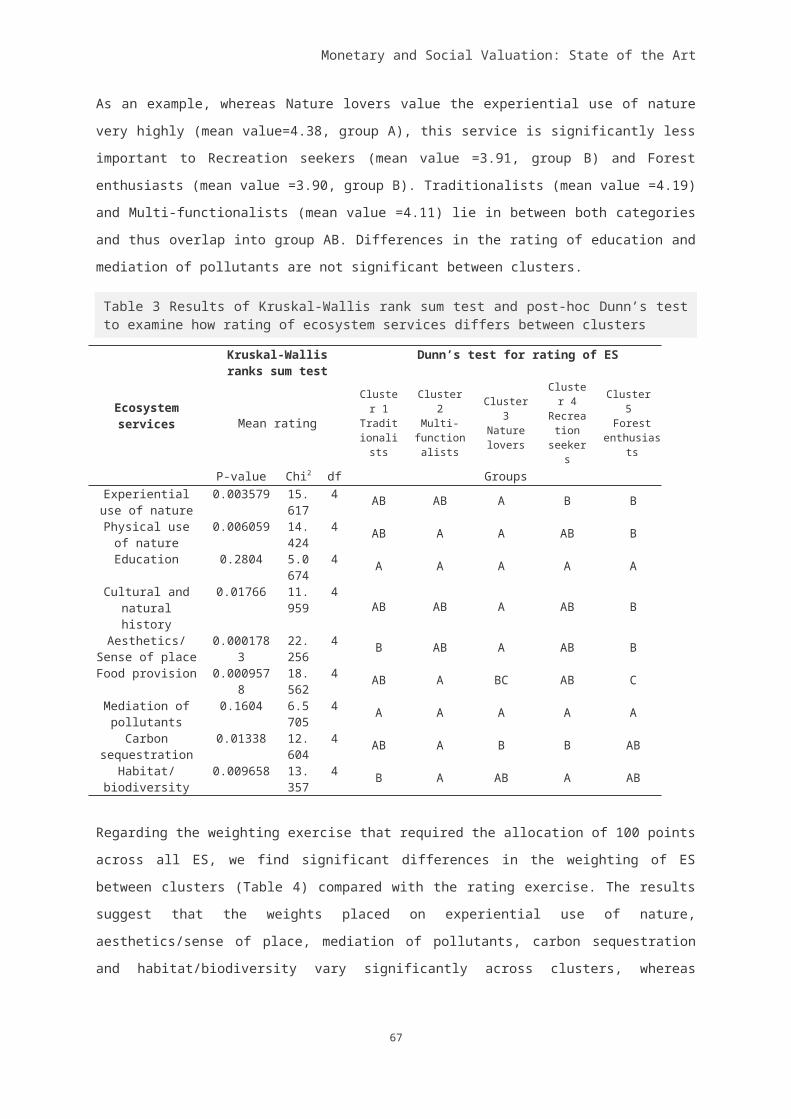
Monetary and Social Valuation: State of the Art
Martínez-Harms, M.J., Balvanera, P., 2012. Methods for mapping ecosystem service supply: a review. Int. J. Biodivers. Sci. Ecosyst. Serv. Manag. 8, 17–25. doi:10.1080/21513732.2012.663792
McFadden, D., 1974. Conditional logit analysis of qualitative choice behavior, in: Zarembaka, P. (Ed.), Frontiers in Econometrics. Academic Press, New York, pp. 105–142.
McPhearson, T., Kremer, P., Hamstead, Z. a., 2013. Mapping ecosystem services in New York City: Applying a social-ecological approach in urban vacant land. Ecosyst. Serv. 5, 11–26. doi:10.1016/j.ecoser.2013.06.005
Naeff, H.S.D., Smit, R.A., Vos, E.C., 2014. Geactualiseerd GIAB bestand 2011 voor Nederland.
Nahuelhual, L., Carmona, A., Lozada, P., Jaramillo, A., Aguayo, M., 2013. Mapping recreation and ecotourism as a cultural ecosystem service: An application at the local level in Southern Chile. Appl. Geogr. 40, 71–82. doi:10.1016/j.apgeog.2012.12.004
Ode, A., Fry, G., Tveit, M.S., Messager, P., Miller, D., 2009. Indicators of perceived naturalness as drivers of landscape preference. J. Environ. Manage. 90, 375–83. doi:10.1016/j.jenvman.2007.10.013
Paracchini, M.L., Zulian, G., Kopperoinen, L., Maes, J., Schägner, J.P., Termansen, M., Zandersen, M., Perez-Soba, M., Scholefield, P. a., Bidoglio, G., 2014. Mapping cultural ecosystem services: A framework to assess the potential for outdoor recreation across the EU. Ecol. Indic. 45, 371–385. doi:10.1016/j.ecolind.2014.04.018
Plieninger, T., Dijks, S., Oteros-rozas, E., Bieling, C., 2013. Assessing , mapping , and quantifying cul-tural ecosystem services at community level. Land use policy 33, 118–129. doi:10.1016/j.lan-dusepol.2012.12.013
Plieninger, T., Kizos, T., Bieling, C., Dû-blayo, L. Le, Budniok, M., Bürgi, M., Carole, L., 2015. Explor-ing ecosystem-change and society through a landscape lens : recent progress in European land-scape research. Ecol. Soc. 20, 5. doi:http://dx.doi.org/10.5751/
Plieninger, T., Schleyer, C., Schaich, H., Ohnesorge, B., Gerdes, H., Hernández-Morcillo, M., Bieling, C., 2012. Mainstreaming ecosystem services through reformed European agricultural policies. Conserv. Lett. 5, 281–288. doi:10.1111/j.1755-263X.2012.00240.x
Rambonilaza, M., Dachary-Bernard, J., 2007. Land-use planning and public preferences: What can we learn from choice experiment method? Landsc. Urban Plan. 83, 318–326. doi:10.1016/j.lan-durbplan.2007.05.013
Rehr, A.P., Williams, G.D., Levin, P.S., 2014. A test of the use of computer generated visualizations in support of ecosystem-based management. Mar. Policy 46, 14–18. doi:10.1016/j.marpol.2013.12.012
Rogge, E., Nevens, F., Gulinck, H., 2007. Perception of rural landscapes in Flanders: Looking beyond aesthetics. Landsc. Urban Plan. 82, 159–174. doi:10.1016/j.landurbplan.2007.02.006
Schirpke, U., Tasser, E., Tappeiner, U., 2013. Predicting scenic beauty of mountain regions. Landsc. Urban Plan. 111, 1–12. doi:10.1016/j.landurbplan.2012.11.010
Schulp, C.J.E., Burkhard, B., Maes, J., Vliet, J. Van, Verburg, P.H., 2014. Uncertainties in Ecosystem Service Maps: A Comparison on the European Scale. PLoS One 9. doi:10.1371/journal.pone.0109643
Scott, M.J., Canter, D.V., 1997. Picture or place? A multiple sorting study of landscape. J. Environ. Psychol. 17, 263–281.
Tveit, M., Ode, Å., Fry, G., 2006. Key concepts in a framework for analysing visual landscape charac-ter. Landsc. Res. 31, 229–255. doi:10.1080/01426390600783269
Van Berkel, D.B., Verburg, P.H., 2012. Combining exploratory scenarios and participatory backcast-ing: using an agent-based model in participatory policy design for a multi-functional landscape. Landsc. Ecol. 27, 641–658. doi:10.1007/s10980-012-9730-7
69
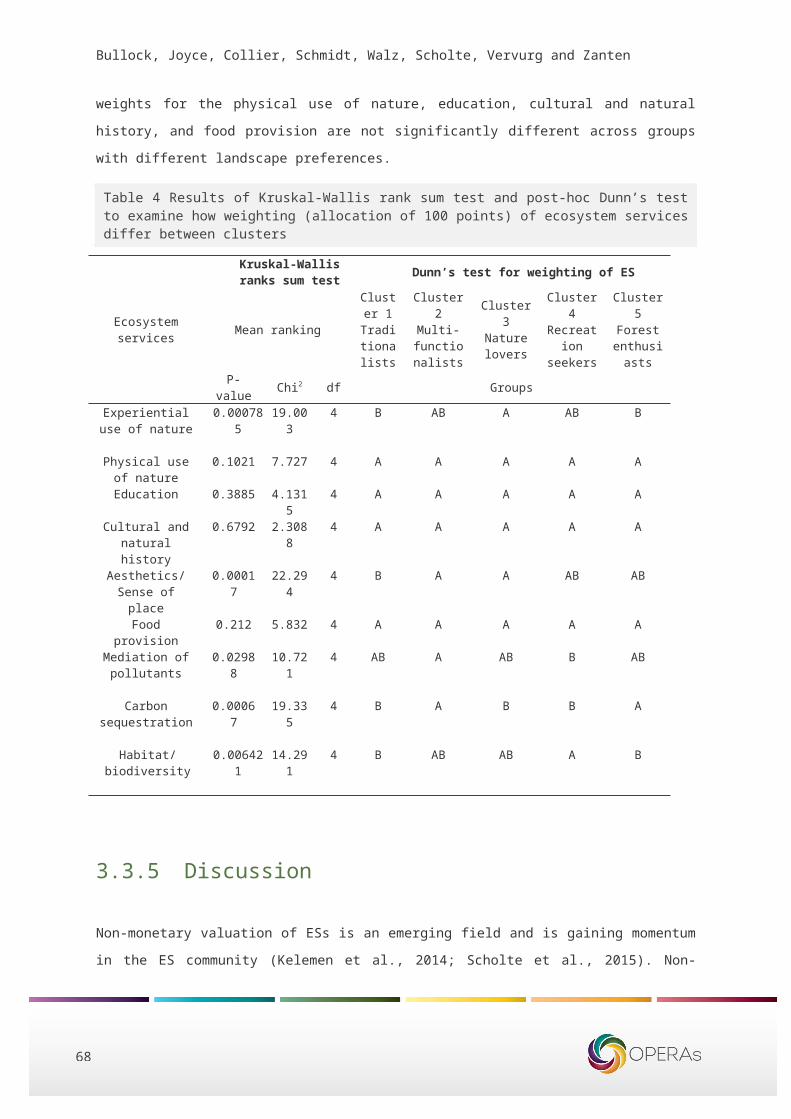
70
Bullock, Joyce, Collier, Schmidt, Walz, Scholte, Vervurg and Zanten
Van Berkel, D.B., Verburg, P.H., 2014. Spatial quantification and valuation of cultural ecosystem ser-vices in an agricultural landscape. Ecol. Indic. 37, 163–174. doi:10.1016/j.ecolind.2012.06.025
Van Zanten, B.T., Verburg, P.H., Espinosa, M., Gomez-y-Paloma, S., Galimberti, G., Kantelhardt, J., Kapfer, M., Lefebvre, M., Manrique, R., Piorr, A., Raggi, M., Schaller, L., Targetti, S., Zasada, I., Viaggi, D., 2014a. European agricultural landscapes, common agricultural policy and ecosystem services: a review. Agron. Sustain. Dev. 34, 309–325. doi:10.1007/s13593-013-0183-4
Van Zanten, B.T., Verburg, P.H., Koetse, M.J., van Beukering, P.J.H., 2014b. Preferences for Euro-pean agrarian landscapes: A meta-analysis of case studies. Landsc. Urban Plan. 132, 89–101. doi:10.1016/j.landurbplan.2014.08.012
Wildenbeest, G., 1989. Recent Farmers’ protests in a Dutch Municipality: the Legacy of the past, in: Boisserain, J., Verrips, J. (Eds.), Dutch Dilemmas: Anthropologist Look at the Netherlands. van Gorcum, Assen.
Wood, S. a, Guerry, A.D., Silver, J.M., Lacayo, M., 2013. Using social media to quantify nature-based tourism and recreation., Scientific reports. doi:10.1038/srep02976
Zhu, X., Pfueller, S., Whitelaw, P., Winter, C., 2010. Spatial differentiation of landscape values in the Murray River region of Victoria, Australia. Environ. Manage. 45, 896–911. doi:10.1007/s00267-010-9462-x
Monetary and Social Valuation: State of the Art
5 Applications of Socio-cultural valuation
5.1 IntroductionIn this chapter we introduce two examples of the use of SCV methods in practice. The first of these,
by Samantha Scholte, Maya Todorova, Astrid van Teeffelen and Peter Verburg, provides an example
of how SCV was applied to the subject of wetland protection in the OPERAs exemplar of the River
Danube in Bulgaria. Various international conservation agencies are looking to restore the wetlands
along the river, but in common with many such initiatives, they have to combine this conservation with
the needs of local people, where livelihoods depend on the resource or where local people have a
particular values or understandings of the environment.
Scholte et al examine the influence of socio-cultural values on people’s relationship with ecosystem
services (ES). This includes people’s awareness of these services and their relevance to their
livelihoods. The authors undertook face-to-face interviews with farmers, fishermen and other residents
of the Lower Danube in Bulgaria to determine how these socio-cultural values influenced people’s
support or acceptance of wetland restoration. They identified cultural, ecocentric and economic values
as well as the sources of negative perceptions. The authors examine the value of the ES concept for
demonstrating links between the natural environment and human well-being. Through the interviews
they also aimed to learn more about the value that people place on their local environment.
The authors applied principal components analysis to the questionnaire data. In this particular
example, they could identify no distinction between personal and social benefits. Nor did respondents
distinguish between different types of wetland. The authors did uncover a higher level of awareness of
regulating ecosystem services (RES) amongst farmers and fishermen rather amongst wider residents,
but found that neither group valued these services as highly as some other ES. Indeed, fishermen
were found to place a high value on cultural ecosystem services (CES). Scholte et al argue that these
findings conform with the view of there being a continual scale between people’s ecocentric and
instrumental values. CES were valued highly because of their cultural associations and connections to
ways of life, including the collection or harvesting of food that might more immediately be judged to be
a PES. Consequently, the contribution of socio-demographic influences to people’s valuation of the
environment may be less evident than beliefs and socio-cultural connections. By comparison, RES
may be perceived as being more relevant to sustainability considerations. They also argue that
people’s attachment to particular landscapes, such as wetlands, or to conservation and biodiversity,
may be at a more general level. However, while these ecocentric and cultural attachments may be
strong, they can be dominated by more fundamental needs such as those associated with PES.
Consequently, it is argued that conservation, including wetland restoration, needs to recognise these
71
72
Bullock, Joyce, Collier, Schmidt, Walz, Scholte, Vervurg and Zanten
conflicting values and needs through the interaction and involvement of stakeholders in order to
identify synergies and trade-offs.
In the second paper, Deirdre Joyce presents a discussion of the nature of socio-cultural values and of
the role of deliberative approaches in the context of the Dublin coastal exemplar in County Fingal.
This introductory discussion is a necessary entre to the paper in that the objective of the exemplar
was to explore the fundamental roots of local stakeholders’ values. The paper presents a different,
more qualitative approach to SCV than the preceding papers, but also makes use of some of the
same methods of participatory mapping and value rating, although in this instance both are intended
more to inform the deliberation process itself. These steps were subsequently followed by face-to-face
semi-structured interviews and a factor analysis (currently underway). Ultimately, it is proposed that
the deliberation will conclude with a participatory multi-criteria analysis of alternative coastal
scenarios.
Deirdre’s paper examines some of the approaches that have been used for SCV and deliberation to
date. The paper questions some of the sequencing and structure of the ES Approaches in the context
of communities where the socio-ecological relationship is based more on amenity, quality of life and
intangible values. The usefulness of the approach is gauged as a tool for local strategic land use
planning and resource management.
Monetary and Social Valuation: State of the Art
Paper 1
5.2 Public support for wetland restoration: What is the link with ecosystem service values?Samantha S. K. Scholte, Maya Todorova, Astrid J.A. van Teeffelen, Peter H. VerburgPaper submitted to Journal of Environmental Management
5.2.1 IntroductionWetlands are of key importance to biodiversity conservation and important providers of a range of goods and services such as water quality improvement, flood abatement and carbon sequestration (Zedler and Kercher 2005; de Groot et al 2012). Yet, wetland areas suffer greatly from overuse of resources, eutrophication and pollution, disconnection from parent rivers by dyke construction, water abstraction for industrial and domestic use, and land reclamation (Junk et al 2012; van Asselen et al 2013). In Europe, 50% of the wetlands have been converted to urban and agricultural lands (Gumiero et al., 2013). International agreements and EU legislation aim to prevent the further degradation of wetland ecosystems, e.g. the Ramsar convention, the EU Water Framework Directive and the Habitats Directive. Although such regulations have contributed towards conservation and restoration, wetland areas are still susceptible to drainage and reclamation, especially when major economic interests are at stake (Čížková et al 2011; Verhoeven 2014). Gathering public support for wetland restoration is essential to ensure social commitment towards sustainable use and management of restored wetlands.
A challenge for gathering public support for wetland restoration is that restoration may undermine local income, as a result of limited access to the natural resources, or conversion of farmland to natural land cover (Naughton-Treves et al., 2005). Ecological restoration initiatives often form part of an international framework that aims to achieve regional and/or global conservation targets (such as the Aichi Biodiversity Targets and EU biodiversity targets), and can be divorced from the needs of local people (Adams et al., 2010; Kari & Korhonen-Kurki, 2013). In the conservation literature, this tension has been referred to as the ‘parks versus people’ debate, where the protection of global biodiversity through so-called fortress conservation is at one end of the spectrum and a focus on improving local livelihoods is at the other end (Southworth et al., 2006; Minteer & Miller, 2011). Bringing these two groups together is often difficult, as ecological restoration often involves competing rather than complementary goals (McShane et al 2011). To protect nature restoration and conservation areas from resource depletion or destruction, restrictions on natural resource use are necessary. Because of such restrictions, people have been displaced or denied access to the resources, threatening their rights and livelihoods (Brockington and Wilkie 2015).
An additional challenge for wetland restoration is that people commonly have negative associations with wetland ecosystems. Wetlands are perceived as useless, difficult to access and unattractive
73
74
Bullock, Joyce, Collier, Schmidt, Walz, Scholte, Vervurg and Zanten
(Meindl 2000; Nassauer 2004).Although the importance of public engagement for ecological restoration has long been recognized, the communication of restoration benefits to the wider public has had limited success (Groffman et al 2010). To tackle this issue, an ES approach is increasingly being advocated. The ES framework aims to inform the public about the benefits humans receive from nature, by portraying explicit links between a wide range of (wetland) ecosystem functions and human well-being (Costanza et al., 1997; Daily, 1997; de Groot et al., 2002).
The dominant narrative of the ES framework (as shown in the ES cascade depicted in Fig. 1) has focused on the supply of ESs (Raymond et al 2013; Comberti et al 2015), portraying how ecosystems, through different ecological functions, provide services and goods that people value (de Groot et al 2010; Haines-Young and Potschin 2010). As such, the ES framework has commonly been used as an awareness raising tool, with the underlying assumption that once people become aware of ESs, they will be more willing to support nature conservation. The importance people assign to ecosystems and their related goods and services, however, is not only influenced by knowledge, but also depends on how people interact with ecosystems (Daw et al 2011; Scholte et al 2015). Given the supply-based focus in ES research, there is limited understanding of how values for (wetland) ESs are shaped by the way people perceive, depend on and use the ecosystem (Asah et al 2014). To contribute to this research gap, we investigate how the importance that local beneficiaries assign to wetland ESs, i.e. values for ESs, can be understood by looking at their knowledge of wetland ecosystems, i.e. awareness of ESs, and the way in which they depend on and use wetland ecosystems (Fig.1). In addition, we aim to understand how values for ESs are related to attitudes towards wetland restoration.
Fig.1. Conceptual diagram of the studied factors within the ES framework. Adapted from de Groot et al. (2010) and Haines-Young & Potschin (2010).
We explicitly distinguish between the awareness of ESs and the socio-cultural values of ESs, because these two do not necessarily coincide. A person may be aware of the flood regulating capacity of a wetland as a benefit to others, but not consider it important for his or her own livelihood. As such, we define awareness of ESs as the ability of an individual to recognize the ESs delivered by an ecosystem and we define value of ESs as the importance people assign to ESs. Our focus is on a
Monetary and Social Valuation: State of the Art
nature conservation area on the Lower Danube in Bulgaria where several wetlands have recently been restored. We explore the perceptions, values and activities of local farmers, fishermen and residents to gain a better understanding of why local users are motivated to support wetland restoration efforts. By exploring the different perspectives towards wetland restoration this paper provides insights that can be used to better manage wetland conservation and restoration areas.
5.2.2 Methods
Study areaPersina Nature Park is the only nature conservation area along the Bulgarian part of the Danube
River, covering an area of 21,762 hectares. It was established in 2001 comprises the last 860 km of
the 3000 km long Danube River, There are two municipalities within the boundaries of Persina:
Belene (10,318 inhabitants) and Nikopol (9,305). The main economic activities in the area are
agriculture and fishing. Most of the area is state-owned (60%), while the rest of the area is owned by
farmers. Small scale farms are most prominent, but are often owned and managed by big
leaseholders.
Along the Lower Danube 75% of the floodplains have been cut off from the river (Ebert et al., 2009),
mostly in the 1960’s to make room for agricultural lands, fishponds and hybrid poplar plantations
(Schneider 2010). Recognizing the loss of important hydrological and ecological functions, such as
the mediation of pollutants and the increased probability of a flood event (Hulea et al., 2009), the
World Wide Fund for Nature (WWF) secured an agreement between the governments of Bulgaria,
Romania, Ukraine and Moldova to establish a ‘Lower Danube Green Corridor’ (LDGC) in 2000. The
aim of the LDGC project is to:
‘make the Lower Danube a living River again, connected to its natural flooding areas and wetlands,
reducing risks of major flooding in areas with human settlements and offering benefits both for local
economies – fisheries, tourism – and for the ecosystems along the river’ (WWF 2010).
A further important aim of the WWF, who co-manage this restoration project, was to raise awareness
about the benefits provided by wetlands and to gather the support of local communities for wetland
restoration. It is in this particular context that this study has taken place.
75
76
Bullock, Joyce, Collier, Schmidt, Walz, Scholte, Vervurg and Zanten
Fig. 2. Location of the study area
Wetland typesThere are different types of wetlands, each type having their own distinct characteristics. Dobbie and
Green (2013) demonstrated that people do not see wetlands as a homogeneous group, but
distinguish between different types.. We address three specific wetland types that are prominent in
our study region: (a) treed wetlands, i.e. riparian forests, (b) wetlands with open water, i.e. marshes,
and (c) grasslands, i.e. meadows. These wetland types also correspond to classes that can be found
under the Ramsar Classification System for Wetland Type, specifically ‘Freshwater tree-dominated
wetlands’ (riparian forests, class Xf), ‘Permanent freshwater marshes’ (marshes, class Tp), and
‘Seasonally intermittent freshwater marshes/pools, including seasonally flooded meadows’ (meadows,
class Ts) (Ramsar Convention Secretariat 2010).
Data collection and questionnaire designWe conducted structured face to face interviews amongst three different user groups in Persina:
farmers, fishermen and local residents of Nikopol and Belene in April and May 2014. We recruited
four local interviewers and pre-tested a questionnaire in March 2014. We approached all farmers who
applied for yearly funding at the Agricultural service between the period of April and May 2014 and
requested their participation. The Executive Agency for Fisheries and Aquaculture provided us with
contact details of all fishermen associations in the area. We approached local residents at public
places, e.g. parks, restaurants and shops, in Belene and Nikopol. This lead to a total of 105
interviews. Three respondents did not complete the interview, leaving a total of 102 completed
questionnaires.
Monetary and Social Valuation: State of the Art
The questionnaire was divided into five sections, addressing 56 questions about: the use of ESs,
awareness of ESs, socio-cultural values of ESs, attitudes towards wetland restoration and socio-
demographics. For the questionnaire, we identified a list of 14 ESs. We pre-selected ESs based on
the Millennium Ecosystem Assessment (MEA) (2005) classification and adapted this list with input
from stakeholders working at local environmental organizations. The final ESs included in this study
were provisioning (food, materials, medicines and biomass for energy), regulating (climate regulation,
maintaining water quality, ground water retention, soil erosion control and flood control) and cultural
(environmental education, tourism, recreation, aesthetic values and existence values for biodiversity).
The first section of the questionnaire was aimed at gaining information on the respondents’ familiarity
with and activities undertaken in Persina. In the second part we asked respondents which ESs they
thought were provided by Persina and asked them to indicate which wetland type were related to
these ESs. We used pictograms that visualized the ESs to avoid scientific terminology (. Each
respondent had to choose a maximum of 5 ESs that they thought were supplied by (a) Persina in
general, (b) riparian forests, (c), marshes and (d) meadows. The different wetland types were each
represented by 2 photos (see supplementary material). We also asked respondents whether they
could think of any other benefits that was not depicted on the cards. In addition we asked the
respondents if they had any negative associations and if so, to specify them.
In the third part of the questionnaire, respondents had to choose a maximum of 5 ESs that they
thought were most important for their personal well-being (i.e., self-oriented values) and for the well-
being of all people living in Persina (i.e., other-oriented values), assuming that all could be supplied by
Persina.
In the fourth part of the questionnaire, we tested specific attitudes towards wetland restoration . We
first showed respondents a map of Persina and asked respondents whether they were aware of these
wetland restoration projects. Respondents also had to evaluate 7 statements about wetland
restoration in Persina which were evaluated using a 3-point Likert scale. In the final part of the
questionnaire, respondents were asked to provide information regarding their age, place of residence,
occupation, income and education.
Data analysisWe first defined multi-response sets for the awareness and valuation variables. The multi-response
sets were consequently used for further analysis by calculating frequency tables and chi-square
statistics to analyse differences between user groups and their awareness of the ESs supplied by the
different wetland types. To link ES values to attitudes towards wetland restoration we calculated a
variable to reflect how many ESs in each ES category, i.e. cultural, provisioning and regulating, the
respondent had mentioned. Since the amount of services was not equal in all three ES categories, we
corrected the value of each variable by dividing the amount of mentioned ESs by the total amount of
77

78
Bullock, Joyce, Collier, Schmidt, Walz, Scholte, Vervurg and Zanten
ESs in each category. For instance if a respondent had mentioned one regulating service, the value
was 1 divided by 5, since 5 regulating services were considered. To each respondent we assigned a
value for cultural ESs (CES), regulating ESs (RES), and Provisioning ESs (PES). Consequently, we
standardized both the value variables and attitude variables and performed an exploratory principal
component analysis (PCA) using a Promax rotation and applied the Kaiser criterion (eigenvalue >1) to
identify significant components. Finally, to identify how much each respondent within the user groups
could be associated with each component, we created scatter plots based on the component scores.
5.2.3 Results
Use of ESsFarming and fishingMore than half of the farmers worked on a mixed farm, 27.3% worked on an animal farm and 21.2 %
worked on a crop farm (Table 1). The size of the farms differed substantially, but animal farms were
much smaller (0.5-40 ha) than crop (2-400 ha) and mixed farms (1-1900 ha). The majority of the
farmers (71%) worked on farms smaller than 50 ha which they owned, partially leased or fully leased.
Farmers working on lands ranging from 100 to 1000 ha (20%) owned only a very small proportion of
this land. None of the fishermen said they could live entirely on fishing, and many had taken on other
jobs to sustain their livelihoods.
Visiting PersinaOf all respondents, 13.8% never visited Persina Nature Park, 16.7% had visited Persina once, 25.5%
had visited Persina a few times and 45.1% visited Persina often. Fishermen visited Persina most often
outside work, while farmers visited less often. The most popular recreational activities was walking,
although 7.8 percent of the respondents (only farmers and fishermen) also went hunting every now
and then. Of all respondents, 24.6 % mentioned they went to Persina to collect food and/or materials.
Four respondents mentioned they collected materials, mostly wood. Other respondents collected
herbs and fruits (11.8 %) or fish (11.8 %).
Table 1. Use of ESs by different user groups. Values indicate percentages per user group.
Use of ESsFarmers(n=33)
Fishermen (n=24)
Residents (n=45)
Total(n=102)
WorkType of farm Crop 21.2 - - Animal 27.3 - - Mixed 54.5 - -
Percentage of income dependent on farming/fishing
Less than half 17.1 56.0 - About half 28.6 20.0 - More than half 17.1 24.0 -
Monetary and Social Valuation: State of the Art
All 37.2 -
Recreation & collection of food/materials
Visit Persina Nature Park outside work 81.8 100 84.4 87.2
Once 15.2 16.7 17.8 16.7 2-5 times 36.4 20.8 20.0 25.5 More than 5 times 30.3 62.5 46.7 45.1
Visit Danube river and/or islands 60.6 91.7 82.2 77.4Walking 69.7 50.0 60.0 60.8Hunting 9.1 20.8 - 7.8Collecting food/materials for own livelihoods
12.1 29.2 31.3 24.6
Awareness of ESsDo people recognize the ESs provided by wetlands in Persina?When asked whether they thought that Persina provided any of the depicted ESs, respondents most
often mentioned provisioning and RES , specifically provision of food and recreation (Fig. 3). Flood
regulation was only mentioned once. Seven percent of the respondents had negative associations
with Persina, which mostly had to do with mosquitoes, accessibility, and perceived degradation of the
area.
When linking ESs to specific wetland types, CES and RES were mentioned the most. RES were not
mentioned that often, but a few respondents did associate flood regulation and soil erosion control
with marshes and riparian forests. Several ESs were often linked to Persina, but were mentioned less
often when linked to specific wetland types: this was particularly the case for environmental education,
tourism, recreation, and the provision of food.
There were significant differences between the awareness of ESs provided by meadows, mashes and
riparian forests (χ²=83.219, df= 29, p<0.05). Meadows were associated with the provision of medicine
and food. Biodiversity and water quality were mostly associated with marshes, and the provision of
materials and recreation were mostly associated with riparian forests. Meadows were associated
more with aesthetic quality than marshes and riparian forests.
Twenty-two percent of the respondents had negative associations with marshes, mostly regarding the
presence of mosquitoes. Two respondents associated marshes with a threat of floods. Ten percent of
the respondents had negative associations with riparian forests, which related mostly to a flooding. In
addition, a few respondents mentioned that riparian forests were not easily accessible and that they
are not properly managed. Two respondents mentioned improper management of the area.
79
80
Bullock, Joyce, Collier, Schmidt, Walz, Scholte, Vervurg and Zanten
How are knowledge of and visits to Persina related to the awareness of ESs?
Of all respondents, 80% had heard about Persina before and 75% knew that Persina had a protected
area status. At the same time, only 37% had heard about the wetland restoration project at Persin
island. We performed a chi-square test to see whether people who knew about the wetland
restoration project, were also more aware off RES provided by wetlands in Persina, but found no
significant results.
Respondents who visited Persina more often may also have been more aware of particular ESs . We
therefore assessed linkages between awareness of ESs and the visits people made to Persina: type
of visits, frequency of visits and location of visits. We grouped all responses to each separate wetland
type (i.e. marshes, meadows and riparian forests) into one a variable, reflecting whether people had
recognized any ESs for any of the wetland ecosystems in Persina. From each category, i.e. cultural,
provisioning, and RES, we selected the ES that was mentioned most for the wetland types: water
quality, existence values for biodiversity and the provision of food.
Significant differences were found for all three ESs. Respondents who visited Persina frequently,
more often recognized water quality as an ES than respondents who visited Persina a few times or
less,. In addition, respondents who went walking in Persina or who collected food were more aware of
water quality than respondents who did not. Respondents who went to the Danube River during visits
also recognized water quality more often than respondents who did not. These respondents also
recognized the ability of wetlands to support biodiversity. Not surprisingly, respondents who collected
food in Persina mentioned food as an ES more often.
Fig. 3. The socio-cultural values of ESs expressed as the amount of times the ES was mentioned for personal
well-being (self-oriented) and well-being of everybody living in Persina (other-oriented).
Monetary and Social Valuation: State of the Art
Values for ESs provided by PersinaTo account for both self-oriented values and community oriented values, the respondents were asked
to value ESs, first for their own personal well-being, and subsequently for the well-being of all
residents . Overall, differences between the two types of value were not significant (χ²=9.958, df= 14,
p=0.765). For both self-oriented and other-oriented values, the provisioning of food and materials,
recreation, existence of biodiversity, aesthetic values, and tourism were found to be the most
important ESs (Fig. 2).
Differences in awareness and values between different users
There were significant differences between user groups in their awareness of RES, specifically
climate regulation and water quality, and PES, specifically provision of material and provision of food.
Fishermen recognized materials and food as an ES significantly more often than did farmers and
residents. Farmers and fishermen were significantly more aware of RES than residents, specifically
climate regulation and water quality.
Despite the higher awareness of RES, farmers and fishermen did not mention these ESs significantly
more often than residents when asked to indicate which ESs were most important for their personal
well-being. Across all user groups, the cultural and PES were regarded as most important. Significant
differences were found for biodiversity, which was most important to the farmers. Provision of
materials and food were both considered most important by fishermen. Despite the importance of
provisioning services for fishermen, they also assigned a lot of value to RES, specifically recreation.
The most important CES for residents were recreation and aesthetic values.
Links between values for ESs and attitudes towards wetland restorationResults from the PCA demonstrated four different perspectives on wetland restoration (Table 2). Four
components with Eigen values larger than 1 were found, explaining 67.5 % of the total variance
(Kaiser-Meyer-Olkin measure of sampling adequacy, KMO=0.700; Bartlett’s test of sphericity,
χ²=285.605, df =45, p<0.001). The Promax component correlation matrix indicated a slight correlation
(r²=0,389) between the first and the second component.
The first component explained 32.5 % of the variance and can be understood as supporting wetland
restoration from a cultural perspective, emphasizing the cultural importance of wetlands for people.
Both the statements ‘Wetlands are important for the local population’ and ‘Wetlands are important for
downstream communities’ correlated positively with this component This indicates the importance of
cultural benefits such as recreation and tourism. The statement ‘the restoration of wetlands limits the
economic growth of this region’ correlated negatively with this component, suggesting a ‘nature and
people’ perspective, in which wetland restoration and economic development do not necessarily
conflict.
81
82
Bullock, Joyce, Collier, Schmidt, Walz, Scholte, Vervurg and Zanten
The second component explained 14.5 % of the variance and can be explained as supporting wetland
restoration from an eco-centric perspective, with a focus on the importance of wetlands for plants and
animals. No correlation was found with any of the ES variables, which may indicate that this
perspective sees wetlands as ‘nature for itself’, without making strong links with benefits for people.
This is confirmed by the positive correlation of the statement “wetlands should not be drained for
agricultural purposes”.
The third component explained 10.5 % of the variance and can be understood as viewing wetland res-
toration from an economic perspective. Appreciation of provisioning services correlated with this com-
ponent, while appreciation of regulating services correlated negatively with this component. As the
statements concerning the importance of wetlands did not strongly correlate (either positively or neg-
atively) with this component, it is difficult to judge whether this component indicates a negative or pos-
itive attitude toward wetland restoration.
Table 2 Four perspectives were identified linking attitude toward wetland restoration and values for ES categories. Loadings between -0.4 and 0.4 are excluded from the table.
VariablesCultural per-
spective (32,5%)
Eco-centric perspective
(14,5%)
Economic perspective (10,5%)
Negativeperspective (10%)
Wetlands are important for the local population.769
Wetlands are important for downstream communities.748
Value for RES .740Wetlands should not be drained for agricultural pur-poses .824
Wetlands are an important part of the landscape in this region .636
Wetlands are important for plants and animals .628 -.425Value for RES -.803Value for PES .661The restoration of wetlands limits the economic growth of this region -.511 .548
The restoration of wetlands is a waste of valuable land.878
The final component demonstrates a negative attitude towards wetland restoration. There was no cor -
relation with appreciation for ESs, suggesting that a negative perspective may go together with low
values for all ESs, i.e. seeing nature as providing no benefits.
Using a one-way ANOVA we tested for differences between the user groups for all components. No
significant differences were found for component 2 and 4. We did find significant differences between
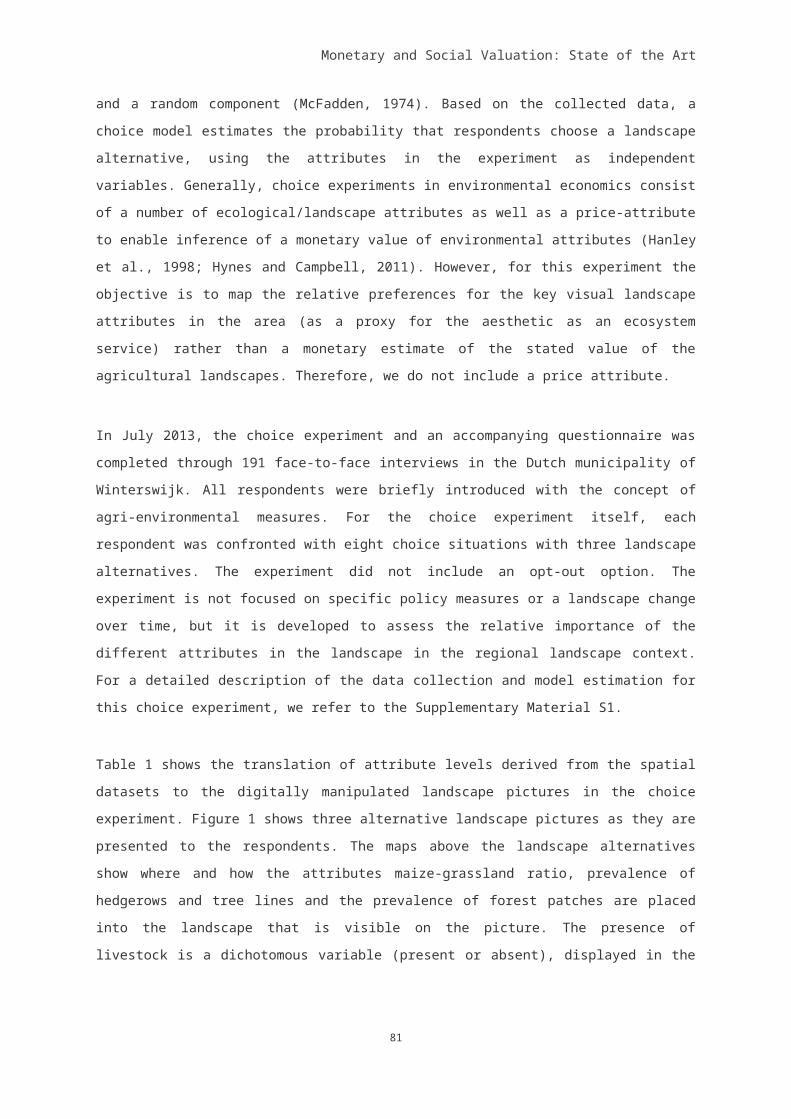
Monetary and Social Valuation: State of the Art
the user groups for component 1 (F(2,99)=5.985,p<0.01) and component 3 (F(2,99)=4.126, p<0.05).
For component 1, the Tukey post-hoc test revealed a significant difference between farmers and fish-
ermen (p<0.01): whereas farmers had mostly negative scores for the cultural perspective, fishermen
had mostly positive scores for the cultural perspective. For component 3, we found a significant differ -
ence between fishermen and residents (p<0.05) and farmers and residents (p<0.1): residents had
lower scores for the economic perspective than did farmers and fishermen.
Fig 5. Scatterplots of PCA scores for each respondent, categorized by the different user groups.
5.2.4 Discussion
Linking use, awareness and valuation of ESsAcross the entire sample, we found a low appreciation for RES and a higher appreciation for cultural
and PES. Our results show that farmers and fishermen were more aware of RES than were residents.
As farmers and fishermen interact more closely with ecosystems than residents, they may indeed
have a better understanding of ecological functions. At the same time, our results demonstrate that
despite this higher awareness of RES, farmers and fishermen did not place higher values on RES
than the residents. Regulating services may not have been considered important because people do
not see the end-benefit of such services or how they are relevant in their lives.
83
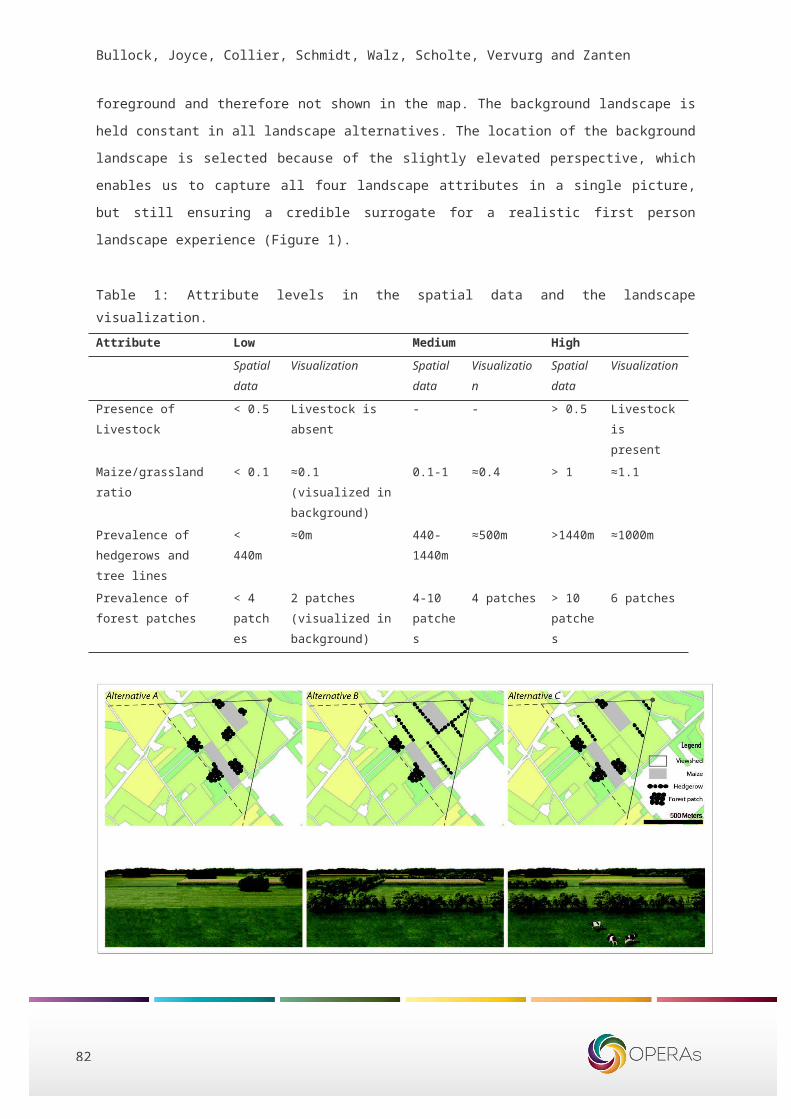
84
Bullock, Joyce, Collier, Schmidt, Walz, Scholte, Vervurg and Zanten
The importance of PES is not surprising given the economic dependency of famers and fisherman on
the resources provided by Persina. An emphasis on the importance of the material benefits of an
ecosystem is common in areas where social and ecological systems are tightly linked (Rönnbäck et
al., 2007; Hartter, 2010). This does not mean that immaterial benefits are disregarded or not
considered important: our results show that RES were valued highly, by all user groups. This is in line
with findings by Calvet-Mir et al. (2011), who studied home-gardens and found that, despite the
importance of the provision of food, the cultural services, such as cultural heritage and aesthetic
values, ‘played a central role in explaining the societal importance attributed to home gardens’. What
is particularly apparent in our study is that farmers and fishermen, who had high values for
provisioning services, also found several RES more important than residents. Residents placed the
highest values on aesthetic quality of the landscape, but fishermen placed high values on recreation
and tourism. In addition, farmers and fishermen found existence values for biodiversity significantly
more important than did the residents. This suggests that even though there may be conflicts between
agriculture/fishing and biodiversity, being a farmer or fisherman may promote a sense of stewardship,
by which a connection with nature can be established.
The importance fishermen assigned to both recreation and food provision may indicate the limitations
of treating ESs as separate entities. This problem has been discussed by several other scholars who
indicate that ESs are often interlinked, and so it may be difficult for people to value them separately
(Asah et al 2014; Pröpper and Haupts 2014). The collection of food may be important for subsistence,
but it may also contribute towards social cohesion. On a similar level, fishing as an economic activity
may have multiple dimensions. Future ES research should focus on identifying the linkages between
services and should acknowledge the myriad of ways with which people interact with nature, both
physically and mentally. Insight into how people connect with nature may provide us with the
information necessary to strengthen this relationship, thereby promoting a nature conservation ethic.
Linking ESs to wetland typesPrevious ES studies have often related socio-cultural values to ESs provided by a conservation area
in general, not differentiating between specific ecosystems or ecosystem components (Castro et al.,
2011; Tengberg et al., 2012; Allendorf & Yang, 2013; Petrosillo et al., 2013; Sagie et al., 2013) . Our
results show that there is substantial difference between asking people for their awareness of ESs
provided by Persina in general and the specific wetland types. Fifty-three percent of the respondents
associated Persina with recreation, but less than 25% associated recreation with any of the wetland
types. Such discrepancies were also found for tourism, environmental education, and the provision of
food. This could mean that people associated different types of ecosystems and/or landscapes with
these services. People may have associated the provision of food most with the agricultural fields
present in Persina, or the Danube River itself, rather than with the wetlands within the park. It could
however, also mean that people had a general perception of the landscapes in Persina, which did not
completely correspond with the landscapes they saw on the photos.
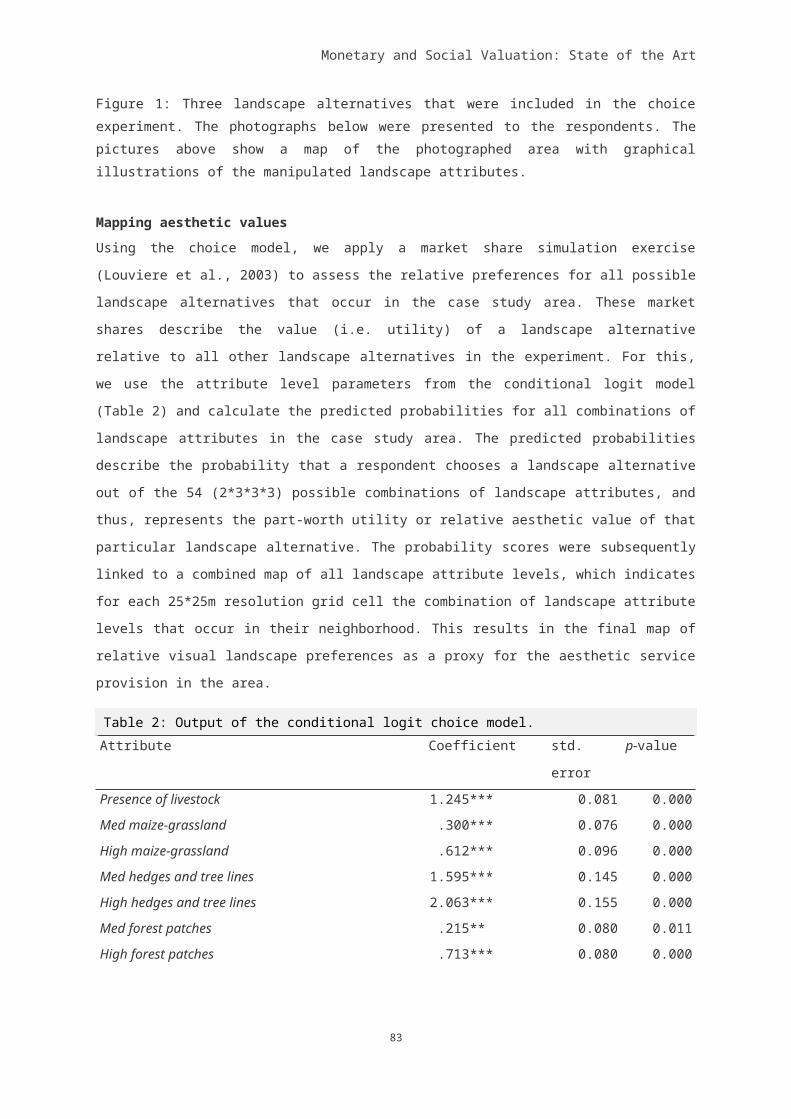
Monetary and Social Valuation: State of the Art
Scholars studying landscape perceptions and preferences argue that people do not only form
opinions about the landscape on the basis of the biophysical characteristics of that landscape, but
also by ‘mental images’ (Lindemann-Matthies et al., 2010) or conceptions of what a landscape should
look like (Terkenli 2001). Such mental images may be based on information, experiences, knowledge,
institutions, and social networks. Comparing visual versus verbal techniques to capture forest
landscape preferences, Tahvanainen et al. (2001) showed that preconceptions (i.e. mental images,
about landscape management measures) did not match visual perceptions of these measures. While
landscape visualizations are commonly used in landscape preference studies (Kohsaka & Flitner,
2004; Dramstad et al., 2006; Lange et al., 2008; Arnberger & Eder, 2011; Barroso et al., 2012) , they
are less often used in ES studies. Researchers are often interested in assigned values related to
specific ecosystem and/or landscape types. However, Pietrzyk-Kaszyńska et al. (2012) suggest that
people are more positive towards ‘nature’ on a general level than they are towards specific
landscapes. Our results confirm this notion because only 7% of the respondents had negative
associations when asked about Persina in general, while more respondents had negative
associations with wetland ecosystems.
Understanding attitudes towards wetland restoration from different social perspectivesThe four perspectives we identified are consistent with underlying motivations for biodiversity and ES
conservation that have been identified by other scholars. Studying local motivation for biodiversity
conservation, Johansson (2005) identified three personal motives for biodiversity conservation: (a)
consideration of human well-being and recreation, (b) human survival, and (c) respect for nature.
Similarly, Opdam et al. (2015) refer to a socio-cultural frame, a sustainability frame, and an economic
frame. In ES research much effort has been spent on clarifying links between values for ESs and
socio-demographic characteristics, while environmental value orientations may be more closely linked
to the assigned importance to ESs.
Environmental value orientations underlie attitudes and normative beliefs (Vaske and Donnelly 1999)
and can be found on a continuum between eco-centric and anthropocentric value orientations.
Whereas anthropocentric value orientations stress the instrumental use of nature, , eco-centric value
orientations put more emphasis on the intrinsic value of nature, . The importance of environmental
value orientations as underlying constructs for assigned values and attitudes has been put forward by
several scholars in environmental psychology (Stern & Dietz, 1994; Fulton et al., 1996; Vaske &
Donnelly, 1999; Kaltenborn & Bjerke, 2002), but the link between environmental value orientations
and values for ESs has been poorly studied.
The ES framework provides an anthropocentric frame and emphasizing the benefits provided by
nature for human well-being. Opdam et al. (2015) argue, however, that even within the larger frame of
the ES approach, the three ES categories, cultural, regulating and PES, correspond with three
85
86
Bullock, Joyce, Collier, Schmidt, Walz, Scholte, Vervurg and Zanten
different storylines. They argue that RES correspond with a socio-cultural frame that emphasizes
cultural benefits, RES correspond with a sustainability frame, and PES correspond with an economic
frame . Our results partially confirm this conceptualization, although we have found two perspectives
that do not correspond with values for ES categories.
The eco-centric perspective did not correlate with values for ESs in Persina which may indicate that
the ES framework, with its focus on instrumental values, does not fit with eco-centric motivations for
nature conservation (McCauley, 2006; Norgaard, 2010; Luck et al., 2012). Although several scholars
have argued that socio-cultural ES assessments may allow for the integration of eco-centric values
(Jax et al., 2013; Schröter et al., 2014), most ES valuation studies have not attempted to explicitly
address eco-centric values.
The negative perspective also did not correlate with values for ESs. One of the critiques on the ES
framework is its positive framing, implying that all outcomes of ecological processes are desirable
(McCauley 2006; Schröter et al 2014). Our results show that 22% of the respondents had negative
associations with marshes: respondents referred mostly to poor management, mosquitoes, and
inaccessibility. This indicates that for a group of the respondents, wetland restoration may come with
a certain cost that outweighs the associated benefits. Restoration efforts should therefore not only
focus on the benefits provided by ecosystems, but include strategies that deal with potential costs of
restoration.
Fostering public support for wetland restorationIn this study, most fishermen had positive values for both the cultural and economic perspective on
ESs. Every person is likely to have multiple perspectives, but in differing strengths (Kollmuss and
Agyeman 2002). Even though people may adhere to multiple motivations for wetland restoration,
when goals related to these motivations conflict, a choice has to be made. De Groot & Steg (2007)
argued that ‘although altruistic and environmental values may be correlated, altruistic and biospheric
goals can conflict’. As an example: many respondents in this study acknowledged existence values of
biodiversity, but at the same time highly valued PES. People may be sympathetic towards the
conservation of biodiversity, but when it comes to daily practices and actual environmental behavior,
activities that conflict with biodiversity conservation still have priority. This emphasizes the necessity
of wetland restoration projects to identify synergies and trade-offs, to deal with both complementary
and competing goals. A targeted approach is necessary to foster support for wetland restoration,.
Raising awareness can be a useful strategy to foster public support for wetland restoration, but
different groups of people may require different kinds of information. Reflecting upon the theory of
Festinger (1957), Kollmuss & Agyeman (2002) argue that ‘information that supports our existing
values and mental frameworks is readily accepted, whereas information that contradicts or
undermines our beliefs is avoided or not perceived at all’. This means that the benefits and losses of
wetland restoration should be “framed” in ways that resonate with the public (Groffman et al 2010).
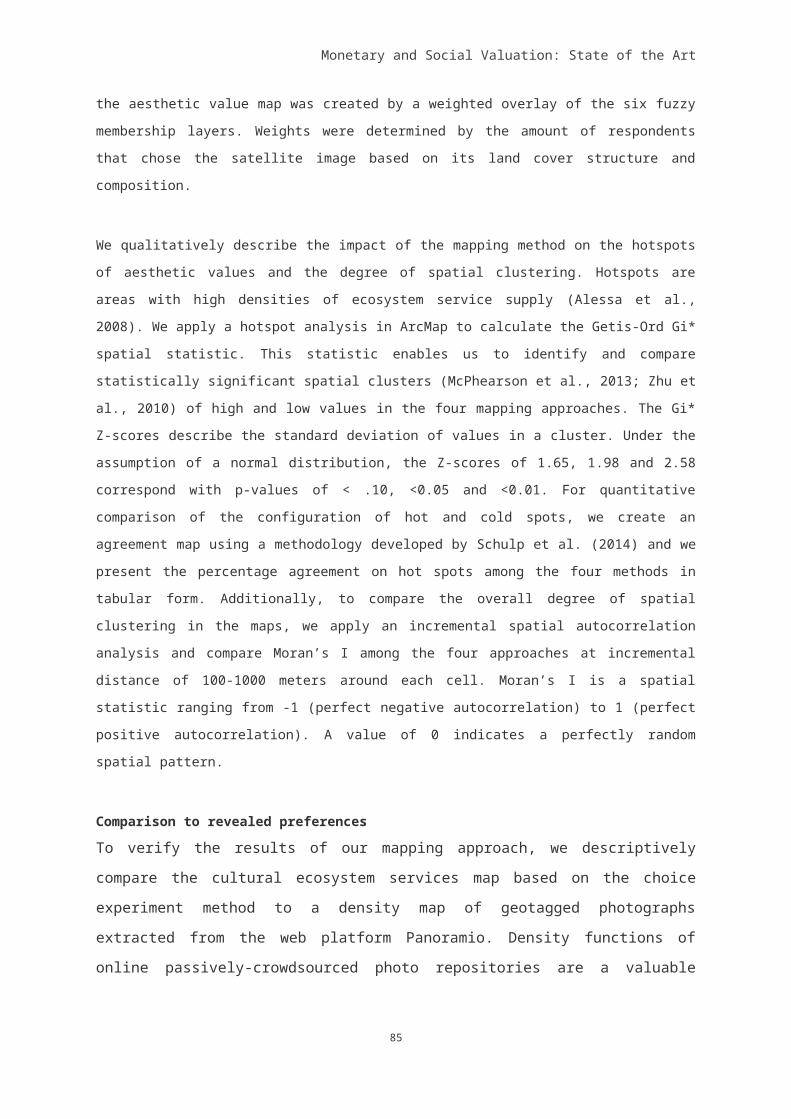
Monetary and Social Valuation: State of the Art
The results from this paper suggest that insight into how people interact with and perceive
ecosystems is important to understand what aspects of ecosystem conservation and/or restoration
people place most emphasis on. The perspectives we identified provide guidance for targeted
information that can be used by local environmental organizations to reach a diverse set of
stakeholders.
In addition, careful thought should be put into crafting opportunities to engage with local users about
wetland restoration (Varner 2014). People do not learn about science through formal education but
through informal sources (Groffman et al 2010). When forming ideas and attitudes about ecological
restoration, people may not rely on logical arguments and reasoning, but on knowledge they draw
from experiences, e.g. of nature, talking with others, and/or emotions (Brody 2005; Fazey et al 2013).
Having local stakeholders actively participate in ecological restoration efforts, for example by assisting
in environmental monitoring, may positively affect the way local users think about ecological
restoration (Conrad and Hilchey 2011). In addition, scientists should make use of informal and non-
scientific events to exchange ideas about the benefits and costs of ecological restoration with the
public (Sayer et al 2014). By actively engaging with local users, scientists and environmental
managers can foster support wetland restoration and conservation (Cooke et al 2013).
5.2.5 Acknowledgements
Emilia Petkova, Vasilka Petrova, Zlatko Kamenarov and Channa Lozeva for their assistance with the interviews.
ReferencesAdams VM, Pressey RL, Naidoo R (2010) Opportunity costs: Who really pays for conservation?
Biological Conservation 143:439–448. doi: 10.1016/j.biocon.2009.11.011
Agbenyega O, Burgess PJ, Cook M, Morris J (2009) Application of an ecosystem function framework to perceptions of community woodlands. Land Use Policy 26:551–557. doi: 10.1016/j.landusepol.2008.08.011
Allendorf TD, Yang J (2013) The role of ecosystem services in park–people relationships: The case of Gaoligongshan Nature Reserve in southwest China. Biological Conservation 167:187–193. doi: 10.1016/j.biocon.2013.08.013
Arnberger A, Eder R (2011) Exploring the Heterogeneity of Rural Landscape Preferences: An Image-Based Latent Class Approach. Landscape Research 36:19–40. doi: 10.1080/01426397.2010.536204
Asah ST, Guerry AD, Blahna DJ, Lawler JJ (2014) Perception, acquisition and use of ecosystem services: Human behavior, and ecosystem management and policy implications. Ecosystem Services. doi: 10.1016/j.ecoser.2014.08.003
Barroso FL, Pinto-Correia T, Ramos IL, et al (2012) Dealing with landscape fuzziness in user preference studies: Photo-based questionnaires in the Mediterranean context. Landscape and Urban Planning 104:329–342. doi:10.1016/j.landurbplan.2011.11.005
Brockington D, Wilkie D (2015) Protected areas and poverty. Philosophical transactions of the Royal
87
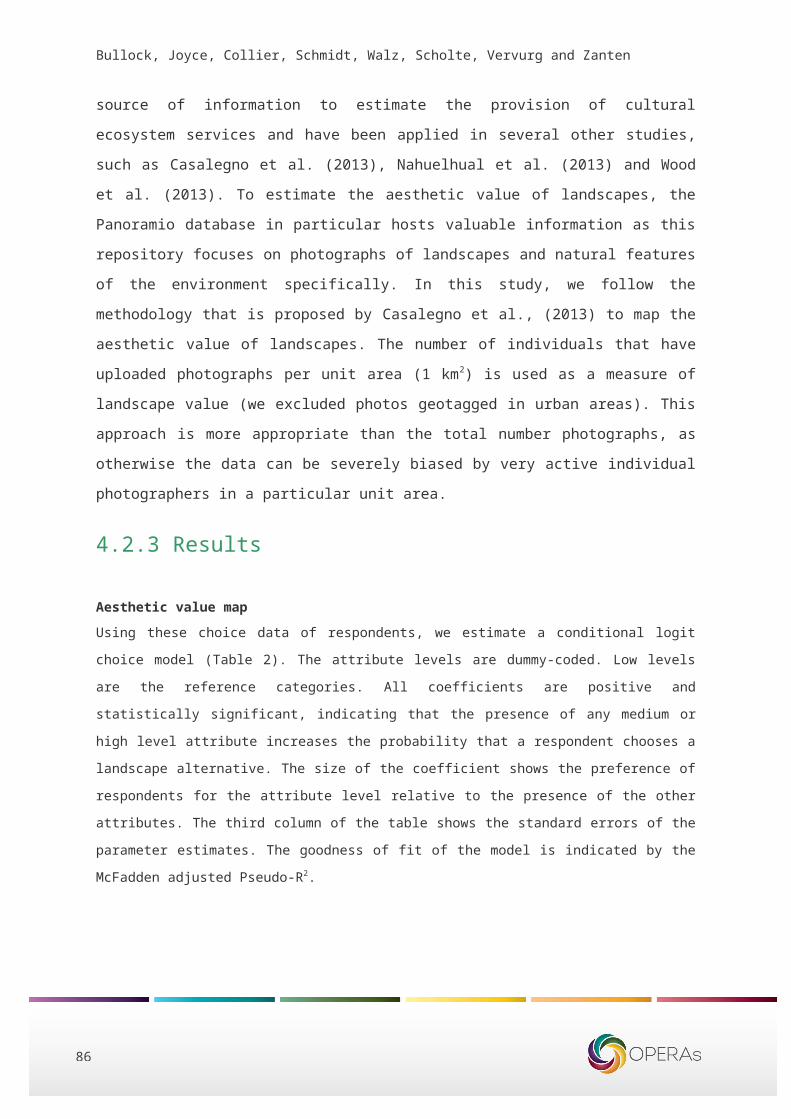
88
Bullock, Joyce, Collier, Schmidt, Walz, Scholte, Vervurg and Zanten
Society of London. Series B, Biological sciences 370. doi: 10.1098/rstb.2014.0271
Brody M (2005) Learning in nature. Environmental Education Research 11:603–621. doi: 10.1080/13504620500169809
Castro a. J, Martín-López B, García-LLorente M, et al (2011) Social preferences regarding the delivery of ecosystem services in a semiarid Mediterranean region. Journal of Arid Environments 75:1201–1208. doi: 10.1016/j.jaridenv.2011.05.013
Čížková H, Květ J, Comín FA, et al (2011) Actual state of European wetlands and their possible future in the context of global climate change. Aquatic Sciences 75:3–26. doi: 10.1007/s00027-011-0233-4
Comberti C, Thornton TF, Wylliede Echeverria V, Patterson T (2015) Ecosystem services or services to ecosystems? Valuing cultivation and reciprocal relationships between humans and ecosystems. Global Environmental Change 34:247–262. doi: 10.1016/j.gloenvcha.2015.07.007
Conrad CC, Hilchey KG (2011) A review of citizen science and community-based environmental monitoring: Issues and opportunities. Environmental Monitoring and Assessment 176:273–291. doi: 10.1007/s10661-010-1582-5
Cooke SJ, Lapointe NWR, Martins EG, et al (2013) Failure to engage the public in issues related to inland fishes and fisheries: Strategies for building public and political will to promote meaningful conservationa. Journal of Fish Biology 83:997–1018. doi: 10.1111/jfb.12222
Costanza R, d’Arge R, de Groot R, et al (1997) The value of the world’s ecosystem services and natural capital. Nature 387:253–260. doi: 10.1038/387253a0
Daily GC (1997) Nature’s Services: Societal Dependence On Natural Ecosystems. Island Press Washington, DC, Washington DC
Daw T, Brown K, Rosendo S, Pomeroy R (2011) Applying the ecosystem services concept to poverty alleviation: the need to disaggregate human well-being. Environmental Conservation 38:370–379. doi: 10.1017/S0376892911000506
de Groot JIM, Steg L (2007) Value Orientations to Explain Beliefs Related to Environmental Significant Behavior: How to Measure Egoistic, Altruistic, and Biospheric Value Orientations. Environment and Behavior 40:330–354. doi: 10.1177/0013916506297831
de Groot R, Brander L, van der Ploeg S, et al (2012) Global estimates of the value of ecosystems and their services in monetary units. Ecosystem Services 1:50–61. doi: 10.1016/j.ecoser.2012.07.005
de Groot R, Fisher B, Christie M, et al (2010) Integrating the ecological and economic dimensions in biodiversity and ecosystem service valuation. Econ. Ecosyst. Biodivers. Ecol. Econ. Found.
de Groot RS, Wilson M a, Boumans RM. (2002) A typology for the classification, description and valuation of ecosystem functions, goods and services. Ecological Economics 41:393–408. doi: 10.1016/S0921-8009(02)00089-7
Dobbie M, Green R (2013) Public perceptions of freshwater wetlands in Victoria, Australia. Landscape and Urban Planning 110:143–154. doi: 10.1016/j.landurbplan.2012.11.003
Dramstad WE, Tveit MS, Fjellstad WJ, Fry GLA (2006) Relationships between visual landscape preferences and map-based indicators of landscape structure. Landscape and Urban Planning 78:465–474. doi: 10.1016/j.landurbplan.2005.12.006
Ebert S, Hulea O, Strobel D (2009) Floodplain restoration along the lower Danube: A climate change adaptation case study. Climate and Development 1:212–219. doi: 10.3763/cdev.2009.0022
Fazey I, Evely AC, Reed MS, et al (2013) Knowledge exchange: a review and research agenda for environmental management. Environmental Conservation 40:19–36. doi: 10.1017/S037689291200029X
Fulton DC, Manfredo MJ, Lipscomb J (1996) Wildlife value orientations: A conceptual and
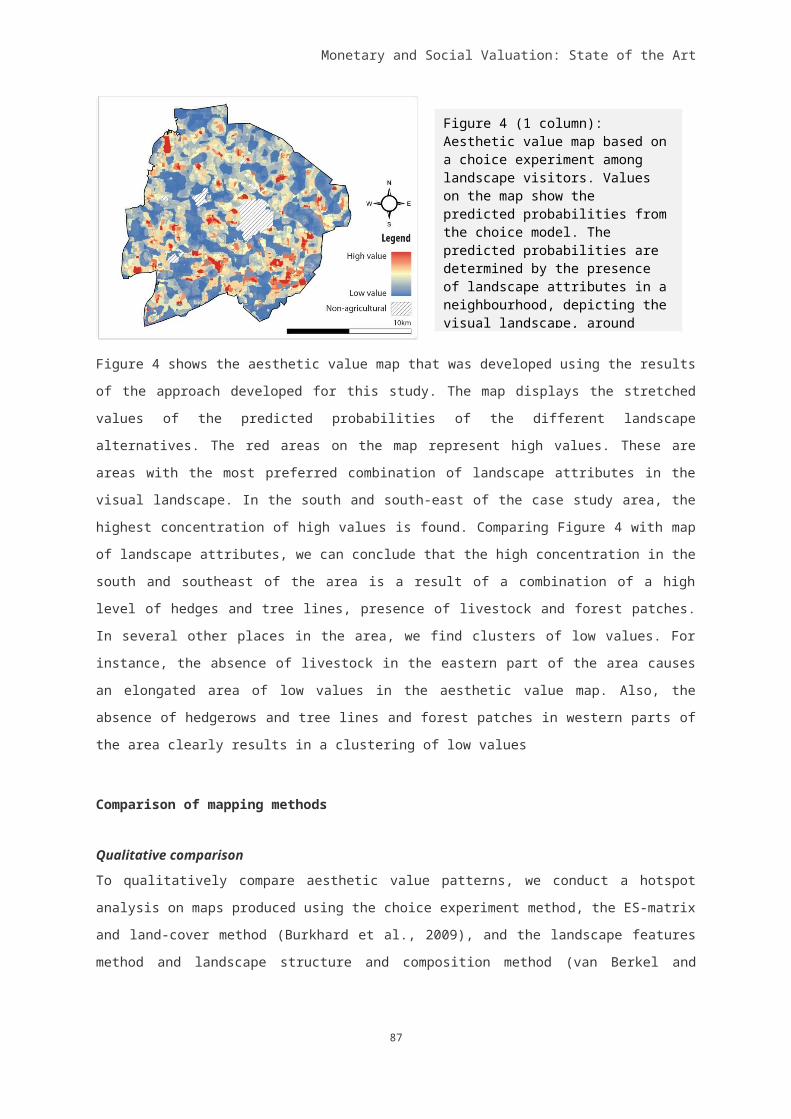
Monetary and Social Valuation: State of the Art
measurement approach. Human Dimensions of Wildlife 1:24–47. doi: 10.1080/10871209609359060
Grêt-Regamey A, Celio E, Klein TM, Wissen Hayek U (2013) Understanding ecosystem services trade-offs with interactive procedural modeling for sustainable urban planning. Landscape and Urban Planning 109:107–116. doi: 10.1016/j.landurbplan.2012.10.011
Groffman PM, Stylinski C, Nisbet MC, et al (2010) Restarting the conversation: challenges at the interface between ecology and society. Frontiers in Ecology and the Environment 8:284–291. doi: 10.1890/090160
Gumiero B, Mant J, Hein T, et al (2013) Linking the restoration of rivers and riparian zones/wetlands in Europe: Sharing knowledge through case studies. Ecological Engineering 56:36–50. doi:10.1016/j.ecoleng.2012.12.103
Haines-Young RH, Potschin MB (2010) The links between biodiversity , ecosystem services and human well-being. Ecosyst. Ecol. a new Synth.
Hartter J (2010) Resource Use and Ecosystem Services in a Forest Park Landscape. Society & Natural Resources 23:207–223. doi: 10.1080/08941920903360372
Hulea O, Ebert S, Strobel D (2009) Floodplain restoration along the Lower Danube: A climate change adaptation case study. IOP Conference Series: Earth and Environmental Science 6:402002. doi: 10.1088/1755-1307/6/40/402002
Jax K, Barton DN, Chan KMA, et al (2013) Ecosystem services and ethics. Ecological Economics 93:260–268. doi: 10.1016/j.ecolecon.2013.06.008
Johansson M (2005) Local people’s motives for biodiversity conservation. Hogrefe & Huber Publishers
Junk WJ, An S, Finlayson CM, et al (2012) Current state of knowledge regarding the world’s wetlands and their future under global climate change: a synthesis. Aquatic Sciences 75:151–167. doi: 10.1007/s00027-012-0278-z
Kaltenborn BP, Bjerke T (2002) Associations between environmental value orientations and landscape preferences. Landscape and Urban Planning 59:1–11. doi: 10.1016/S0169-2046(01)00243-2
Kari S, Korhonen-Kurki K (2013) Framing local outcomes of biodiversity conservation through ecosystem services: A case study from Ranomafana, Madagascar. Ecosystem Services 3:e32–e39. doi: http://dx.doi.org/10.1016/j.ecoser.2012.12.003
Kohsaka R, Flitner M (2004) Exploring forest aesthetics using forestry photo contests: case studies examining Japanese and German public preferences. Forest Policy and Economics 6:289–299. doi: http://dx.doi.org/10.1016/j.forpol.2004.03.016
Kollmuss A, Agyeman J (2002) Mind the Gap : Why do people act environmentally and what are the barriers to pro- environmental behavior ? Environmental Education Research 8: 37–41. http://dx.doi.org/10.1080/13504620220145401
Lange E, Hehl-Lange S, Brewer MJ (2008) Scenario-visualization for the assessment of perceived green space qualities at the urban-rural fringe. Journal of environmental management 89:245–56. doi: 10.1016/j.jenvman.2007.01.061
Lindemann-Matthies P, Junge X, Matthies D (2010) The influence of plant diversity on people’s perception and aesthetic appreciation of grassland vegetation. Biological Conservation 143:195–202. doi: http://dx.doi.org/10.1016/j.biocon.2009.10.003
Luck GW, Chan KMA, Eser U, et al (2012) Ethical Considerations in On-Ground Applications of the Ecosystem Services Concept. BioScience 62:1020–1029. doi: 10.1525/bio.2012.62.12.4
MA (Millenium Ecosystem Assessment) (2005) Ecosystems and Human Well-Being - Synthesis.
89
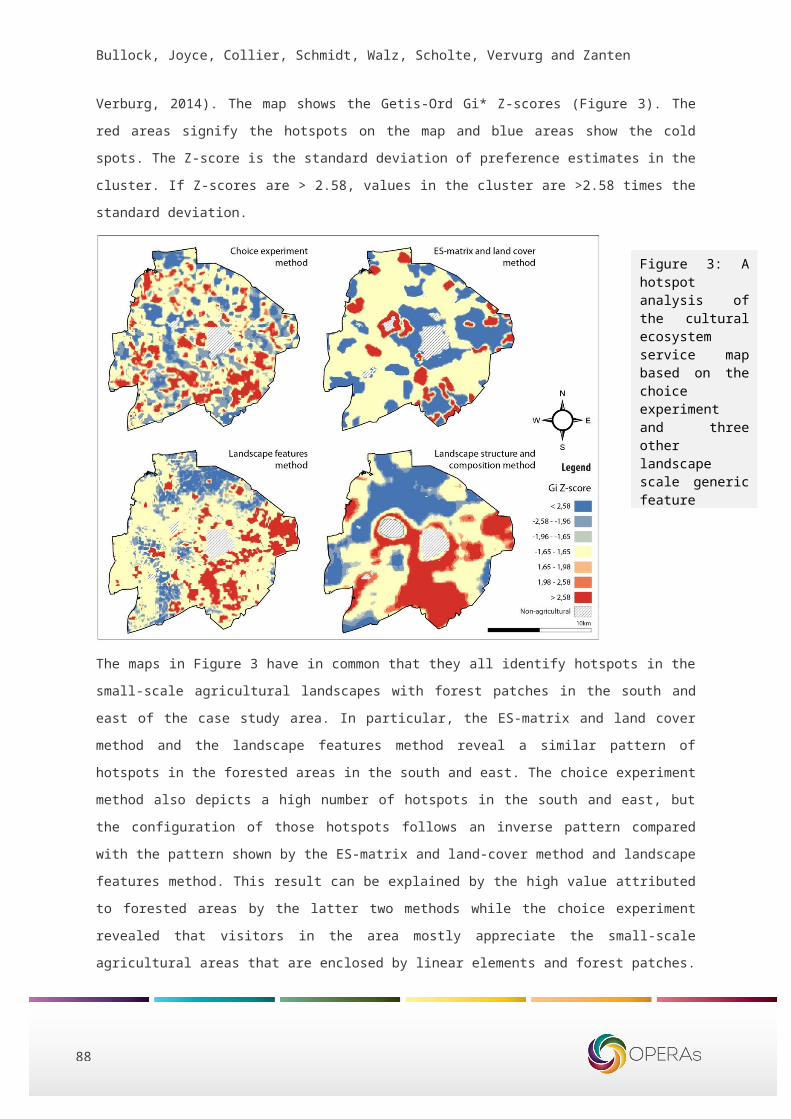
90
Bullock, Joyce, Collier, Schmidt, Walz, Scholte, Vervurg and Zanten
Island Press, Washington DC
McCauley DJ (2006) Selling out on nature. Nature 443:27–8. doi: 10.1038/443027a
McShane TO, Hirsch PD, Trung TC, et al (2011) Hard choices: Making trade-offs between biodiversity conservation and human well-being. Biological Conservation 144:966–972. doi: 10.1016/j.biocon.2010.04.038
Meindl CF (2000) Past Perception of the Great American Wetland: Florida’s Everglades during the Early Twentieth Century. Environmental History 5:378–395. doi: 10.2307/3985482
Minteer BA, Miller TR (2011) The New Conservation Debate: Ethical foundations, strategic trade-offs, and policy opportunities. Biological Conservation 144:945–947. doi: 10.1016/j.biocon.2010.07.027
Nassauer JI (2004) Monitoring the success of metropolitan wetland restorations: Cultural sustainability and ecological function. Wetlands 24:756–765. doi: 10.1672/0277-5212
Naughton-Treves L, Holland MB, Brandon K (2005) the Role of Protected Areas in Conserving Biodiversity and Sustaining Local Livelihoods. Annual Review of Environment and Resources 30:219–252. doi: 10.1146/annurev.energy.30.050504.164507
Norgaard RB (2010) Ecosystem services: From eye-opening metaphor to complexity blinder. Ecological Economics 69:1219–1227. doi: 10.1016/j.ecolecon.2009.11.009
Opdam P, Coninx I, Dewulf A, et al (2015) Framing ecosystem services: Affecting behaviour of actors in collaborative landscape planning? Land Use Policy 46:223–231. doi: 10.1016/j.landusepol.2015.02.008
Petrosillo I, Costanza R, Aretano R, et al (2013) The use of subjective indicators to assess how natural and social capital support residents’ quality of life in a small volcanic island. Ecological Indicators 24:609–620. doi: 10.1016/j.ecolind.2012.08.021
Pietrzyk-Kaszyńska A, Cent J, Grodzińska-Jurczak M, Szymańska M (2012) Factors influencing perception of protected areas—The case of Natura 2000 in Polish Carpathian communities. Journal for Nature Conservation 20:284–292. doi: 10.1016/j.jnc.2012.05.005
Pröpper M, Haupts F (2014) The culturality of ecosystem services. Emphasizing process and transformation. Ecological Economics 108:28–35. doi: 10.1016/j.ecolecon.2014.09.023
Ramsar Convention Secretariat (2010) Designating Ramsar Sites: Strategic Framework and guidelines for the future development of the List of Wetland for International Importance. Gland, Switzerland
Raymond CM, Singh G, Benessaiah K, et al (2013) Ecosystem Services and Beyond. BioScience 63:536–546. doi: 10.1525/bio.2013.63.7.7
Rönnbäck P, Crona B, Ingwall L (2007) The return of ecosystem goods and services in replanted mangrove forests: perspectives from local communities in Kenya. Environmental Conservation 34:313–324. doi: 10.1017/S0376892907004225
Sagie H, Morris A, Rofè Y, et al (2013) Cross-cultural perceptions of ecosystem services: A social inquiry on both sides of the Israeli–Jordanian border of the Southern Arava Valley Desert. Journal of Arid Environments 97:38–48. doi: 10.1016/j.jaridenv.2013.05.007
Salmon RA, Priestley RK, Goven J (2015) The reflexive scientist: an approach to transforming public engagement. Journal of Environmental Studies and Sciences. doi: 10.1007/s13412-015-0274-4
Sayer EJ, Featherstone HC, Gosling WD (2014) Sex & Bugs & Rock ’n Roll--getting creative about public engagement. Trends in ecology & evolution 29:65–7. doi: 10.1016/j.tree.2013.12.008
Schneider E (2010) Floodplain Restoration of Large European Rivers with Examples from the Rhine and the Danube. In: Eiseltová M (ed) Restoration of Lakes, Streams, Floodplains, and Bogs in Europe. Springer Netherlands, pp 185–223
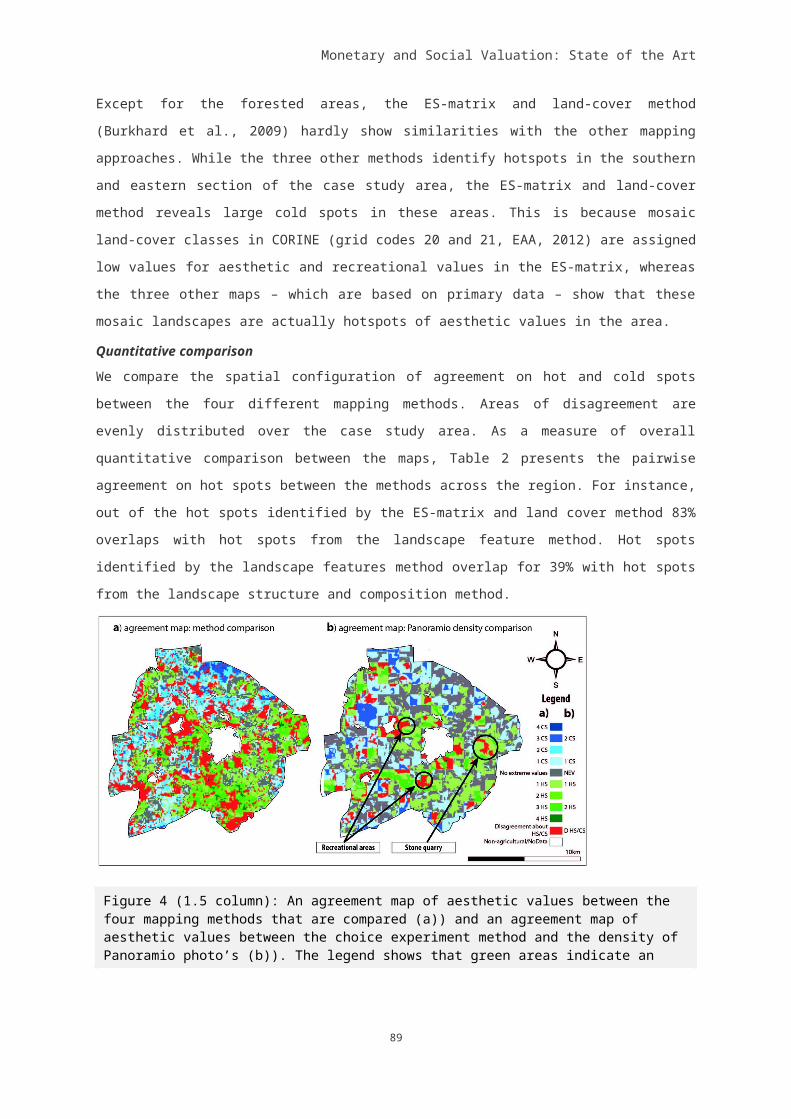
Monetary and Social Valuation: State of the Art
Scholte SSK, van Teeffelen AJA, Verburg PH (2015) Integrating socio-cultural perspectives into ecosystem service valuation: A review of concepts and methods. Ecological Economics 114:67–78. doi: 10.1016/j.ecolecon.2015.03.007
Schröter M, van der Zanden EH, van Oudenhoven APE, et al (2014) Ecosystem services as a contested concept: a synthesis of critique and counter-arguments. Conservation Letters 7:n/a–n/a. doi: 10.1111/conl.12091
Setten G, Stenseke M, Moen J (2012) Ecosystem services and landscape management: three challenges and one plea. International Journal of Biodiversity Science, Ecosystem Services & Management 8:305–312. doi: 10.1080/21513732.2012.722127
Southworth J, Nagendra H, Munroe DK (2006) Introduction to the special issue: Are parks working? Exploring human–environment tradeoffs in protected area conservation. Applied Geography 26:87–95. doi: 10.1016/j.apgeog.2005.11.001
Stern PC, Dietz T (1994) The Value Basis of Environmental Concern. Journal of Social Issues 50:65–84. doi: 10.1111/j.1540-4560.1994.tb02420.x
Tahvanainen L, Tyrväinen L, Ihalainen M, et al (2001) Forest management and public perceptions — visual versus verbal information. Landscape and Urban Planning 53:53–70. doi: 10.1016/S0169-2046(00)00137-7
Tengberg A, Fredholm S, Eliasson I, et al (2012) Cultural ecosystem services provided by landscapes: Assessment of heritage values and identity. Ecosystem Services 2:14–26. doi: 10.1016/j.ecoser.2012.07.006
Terkenli TS (2001) Towards a theory of the landscape: the Aegean landscape as a cultural image. Landscape and Urban Planning 57:197–208. doi: 10.1016/S0169-2046(01)00204-3
van Asselen S, Verburg PH, Vermaat JE, Janse JH (2013) Drivers of wetland conversion: a global meta-analysis. PloS one 8:e81292. doi: 10.1371/journal.pone.0081292
Varner J (2014) Scientific Outreach: Toward Effective Public Engagement with Biological Science. BioScience 64:333–340. doi: 10.1093/biosci/biu021
Vaske JJ, Donnelly MP (1999) A Value-Attitude-Behavior Model Predicting Wildland Preservation Voting Intentions. Society & Natural Resources 12:523–537. doi: 10.1080/089419299279425
Verhoeven JTA (2014) Wetlands in Europe: Perspectives for restoration of a lost paradise. Ecological Engineering 6:6–9. doi:10.1016/j.ecoleng.2013.03.006
Zedler JB, Kercher S (2005) Wetland Resources: Status, Trends, Ecosystem Services, and Restorability. Annual Review of Environment and Resources 30:39–74. doi: 10.1146/annurev.energy.30.050504.144248
WWF (2010). Lower Green Danube Corridor. Accessed online at http://assets.panda.org/downloads/wwf_ldgc.pdf
91
92
Bullock, Joyce, Collier, Schmidt, Walz, Scholte, Vervurg and Zanten
Paper 2
5.3 Socio-cultural valuation of ecosystem services – A practical guide based on the use of deliberation
Deirdre Joyce, School of Architecture, Planning and Environmental Policy, University College Dublin.
5.3.1 Conceptual Models for capturing SCV
The ES Approach (ESA) to decision-making is different to other assessment models because it
examines change in terms of alterations in service benefits under the frame of the ‘ES typology’ at a
specific scale and/or within a selected setting (MA, 2005). It uses ecosystems services (ES) as the
guise to detect the socio-ecological links between people and nature through the identification of
users and beneficiaries of ES (MA, 2005, UNEP-WCMC, 2011, Spangenberg, et al, 2014, Chan et al,
2012). Tomich et al in Ash (2010) describe the development of conceptual frameworks for ES
Assessment and outline that these frameworks are anthropocentric and must establish the “centrality
of nature to people”. Nature has many different meanings to people and therefore a pluralist
approach which aims to capture the range of linkages between both natural and social processes as
they relate to underlying ES is required. Knowledge about these linkages can only be found by
engaging with stakeholders to establish what they value most (Ibid).
ES assessment can apply ecological, economic or socio-cultural assessment or combine each of
these approaches. These can be carried out by means of:
(i) A scientific analysis of land use and mapping of service functions (Ecological)
(ii) An utilitarian economic valuation methods to capture the Total Economic Value (use and non-use)
ES (Economic)
(iii) The individual use /or combined use of qualitative, deliberative or discourse methods with more
rational methods to draw out expressions of Socio-Cultural linkages with ES - be this a
characterisation of values or benefits arising from a specific socio-ecological system or context, a
more quantitative process of ranking of values, or a mapping of the location of different value
characteristics within a given setting (SCV). These values can be articulated through processes which
are individual (self-oriented) or group (other-oriented). The purpose of this paper is to present an
overview of the third assessment process – that is the socio-cultural valuation (SCV) of ES.
Monetary and Social Valuation: State of the Art
Socio-Cultural Values
While the literature places emphasis on the need to capture Socio-Cultural Values there is
inconsistency in its interpretation and conceptualisation. There is significant cross over and conflation
of the concept with the MA’s conceptualisation of Cultural Services and a range of values and
concepts relating to SCV in the literature (Scholte et al, 2015). The MA refers to the “socio-cultural
perspective”, which can be linked to wide ranging aspects such a social rules, community identity,
inspirational experiences but characteristically these values should be above utilitarian “preference
satisfaction”. For de Groot (in TEEB, 2010) -cultural values are synonymous with non-use health and
wellbeing benefits, but in other instances they are considered to represent material as well as non-
material values. Haines-Young and Potschin (2009) refer to factors that contribute to 'Socio-cultural
fulfilment'. They comprise spiritual/philosophical contentment, social groupings, recreation/leisure,
meaningful occupation, aesthetics, and opportunity values (culture, biological, knowledge and
education and genetic resources). Zografos and Kumar (in TEEB, 2010, Chapter 4) consider it
necessary to examine the ‘socio-cultural context’ or different interpretations of value because,
although the benefits of ES might be the same, the values attached to these benefits will be different
depending on the socio-cultural preferences of individuals or communities. It is necessary therefore to
understand the spectrum of SCV including social attitudes and preferences as they impact on direct
use and non-consumptive value as well as values more associated with instrumental or utility benefits.
Evidence of socio-ecological relationships may also emerge from the process, although they may not
necessarily always be the target of the assessment.
Socio-cultural valuation
The many interpretations of what is meant by socio-cultural value likewise cause socio-cultural
valuation (SCV) to mean many different things. SCV is a process of understanding stakeholder
perceptions and interactions with, their natural environment . The MA (2005) conceptualisation for the
assessment of ES puts human-environment interactions at the core of the process. Ecosystems do
not provide services in themselves, it is only when they are used by people or they support human-
wellbeing indirectly, do they become ES (Spangenberg et al, 2014). It is the demand-side benefits of
ecosystems that are of interest initially, as this is the conduit to establishing the services which
support these benefits and which in turn provide an indication of the relative importance of particular
ES to people. Stakeholder interpretations of value are the key to the process of valuation. SCV is not
expert driven and relies principally on the expression of self-reported values by individuals or groups.
The ordering of the importance of particular ES in a given assessment may therefore be quite different
to that espoused by economic or ecological ES valuation processes and can highlight disparities
between lay and expert interpretations of the values attached to ES. The role of the SCV processes
is to highlight such differences in a full ES assessment, as well as to provide information about value
93
94
Bullock, Joyce, Collier, Schmidt, Walz, Scholte, Vervurg and Zanten
differences between individuals and groups and to generate knowledge about priority ES to inform
management of land use and decisions on land use change.
Alongside the confusion in the literature about what constitutes Socio-Cultural Value there is also a
lack of clarity about the methodological approach and scope of SCV. This has affected the emergence
of clear methodologies. Firstly there is a persistent confusion between the terms ‘service benefits’ and
‘values’ within the literature, and between Cultural Services and socio-cultural values (Chan et al,
2012, Satz et al, 2013). The MA (2005) represents Cultural Service valuation as the ‘social’ unit of
analysis of ES within the typology of services. This only applies to the “non-material benefits people
obtain from ecosystems…” (p. 40), whereas social valuation is much wider, capturing both material
and non-material benefits as they apply to all services (Felipe-Lucia et al, 2015 and Scholte et al,
2015). Satz et al offer some clarity by explaining that services produce a large number of ‘benefits’
(market and non-market) which in turn are assigned different kinds of ‘value’ and these values can
have different meanings and weights according to their use by individuals or communities. Therefore
SCV tries to establish the patchwork of benefits-to-value linkages within a given site across all
services, not just Cultural. What is unique about this method is that it is the stakeholders or the public,
not scientists, decision makers or external experts, who decide what the benefits-to-value linkages
are. The conflation in terms between ‘values’ and ‘benefits’ and ‘services’ has made it difficult to
interpret the correct entry point for the characterisation of SCV with the result there is no agreement
as yet within the literature on the conceptual framework and sequencing for the process of assessing
SCV.
Sequencing of Socio-Cultural Valuation
The purpose of SCV is to identify or draw out which ES are interpreted as being important to people
within a given context, time and spatial scale. The ES framework for assessment designed by the MA
(2005) suggests that you need to understand: (i) ecological elements (ii) the service production arising
from the ecological elements (iii) the benefits (“constituents of wellbeing”) and (iv) identify the values
attached to these benefits. If we are to understand the value of ES it will be necessary to first identify
the benefit or beneficiaries to work out what is, or is not, a service (Boyd and Banzhaf, 2007) . This
puts stakeholders at the centre of the process of both service identification and value articulation. The
MA’s model suggests that there is a sequential process starting out with identification of ES services
which then leads to the identification of benefits. Raffaelli (2006) and Boyd and Banzhaf propose
another arrangement, i.e. that the process should commence on the ‘benefits’ side before working
back to the various ES services that support these benefits rather than the other, more conventional,
way of beginning with the ES as suggested by the MA. Ultimately it is the identification of the benefit
that provides the route or pathway to the identification of the ES of importance within a given context.
Monetary and Social Valuation: State of the Art
5.3.2 Methods of or Socio-Cultural Valuation
SCV is different to economic or ecological valuation because value estimates are interpretations of
value rather than necessarily absolutes of value. Chiesura et al (2003), in her paper on the socio-
cultural perspective on natural capital, explains that in the “socio-cultural reference system” value is
catalogued in terms of “significance, meanings, perceptions and qualitative associations”. SCVs can
be revealed in a variety of ways, for example as an expression of relative values, spatially by means
of mapping, through ranking or rating values or through the use of value networks linking different
values to different stakeholder groups . Felipe-Lucia et al (2015) carried out a literature review on the
approaches to social valuation (or SCV) in research studies up to 2013. The review demonstrated that
there are many approaches and entry points to understanding SCV with no one single approach
coming to the fore as a definitively accepted methodology.
Table 1: Methods used to extrapolate SCV in research studies (after Felipe-Lucia et al (2015)
Method for elicitation of values Percentage Use in SCV research studies
Discourse analysis 34.3%
Likert scale (rating of values) 27.1%
Ranking / weighting 22.9%
Multi-criteria Decision Analysis (MCDA) 8.6%
Community mapping 5.7%
Outcomes from Workshops and Focus Groups 1.4%
Sole method used
Discourse analysis 24%
Likert scale 24%
Ranking/rating 13%
Combination of discourse/ranking 11%
Level of use of method in all valuations
Interviews 46.8%
Workshops/workshops 29%
Surveys (face-to-face) 22.6%
95
96
Bullock, Joyce, Collier, Schmidt, Walz, Scholte, Vervurg and Zanten
5.3.3 The Dublin Exemplar Context
The Dublin Exemplar explored the field of SCV as a method to uncover the values that stakeholders
attach to the coastal ecosystem in Fingal, north County Dublin. The research addressed the
assessment of the socio-cultural values (material and non-material benefits) to establish where and
how stakeholders value coastal ES. The aim of the research was to explore the merits of the model of
assessment from two perspectives: (i) as a means for public consultation (i.e. Process) and (ii) to
assess if the valuation can provide information worthy of consideration within the context of land-use
planning (i.e. Outputs). A further focus was to engage stakeholders in understanding their relationship
with ecosystems and to use this knowledge as a decision framework in a deliberative decision making
exercise at a later stage in the research.
The Dublin Exemplar tested a method of SCV over two workshops in October 2014 and May 2015
and through follow-up semi-structured interviews in June 2015. The purpose of the work was to
engage a group of stakeholders in the ES concept and to use both a deliberative approach and
participatory value mapping to draw out socio-cultural values attached to the coastline, to identify
perceptions of the relative importance of values, and to introduce stakeholders to the connection
between their values and ES that underpin them.
Taking a lead from TEEB, 2010 and Chan et al, 2012, the research took a values assessment
approach to allow participants to reflect on their relationship with nature and to allow the research
team to gather different perspectives on what matters to stakeholders. UCD took a pre-structuring
approach to value assessment whereby participants were asked to articulate their values against a
prepared list of socio-cultural values adapted from McLain et al, 2013. It combined this with a framing
of the research process using the ES conceptualisation through which services provide benefits which
are of value to people for different reasons (economic, social-cultural and ecological) (MA, 2005). This
approach is considered to facilitate an awareness of ES benefits, to raise consciousness about
human impacts on the environment and the consequences of decisions from a values perspective
(see Haines-Young and Potschin, 2014). Value assessment can also provide a platform for the
expression of a plurality of individual values, as well as of shared values which may shed light on
issues that are contested (Kenter et al, 2014). This information can bring previously unknown
perspectives into view (Gould et al, 2014) and can highlight often invisible trade-offs in benefits
between stakeholders (Chan et al, 2012). Within a deliberative process social learning occurs
whereby participants come to understand the values of others. This can also help to divert entrenched
positions (Mooney and Tan, 2012).
Monetary and Social Valuation: State of the Art
Stakeholder selection
The ES framework designed by the MA is as a producer-consumer (service to benefit) anthropological
model. With this in mind the research targeted community and ES users at each of the main coastal
villages and towns in Fingal so as to provide a representative sample of (a) locations and (b) a cross
section of different demand side benefits from coastal ES. Stakeholders representing 58 different
organisations and interests were invited to the first workshop, these included representatives from
tourism, education, golf, fishing, local government biodiversity, planning, heritage officers, marine
tourism, ENGOs, business, fishing/angling, residents associations, heritage groups and local public
representatives. Seventeen participants attended the first workshop, including one public
representative. The same participants were invited to the second workshop but only six of the original
group returned, although a total of 15 attended. This lack of continuity did not present a problem for
the research objectives.
Methodology
The research was carried out by means of two participatory workshops. The first workshop was
assisted by Prospex, an OPERAs partner with expertise in facilitation and delivered over two hours.
The second workshop in May 2014 was carried out in order to provide feedback on the results of the
first valuation exercise and to revisit the valuation ranking undertaken in the preceding workshop to
establish if they accurately reflected the values of the stakeholders. Following the workshops semi-
structured interviews were conducted with each participant to gather more qualitative information on
individual values and feedback on the valuation process and to establish if linkages between ES and
values could be identified by interviewees. This combination of methods aimed to provide research
data to indicate the relative importance of values, the location of ES value bundles along the coastline
along with qualitative data on values arising from the interviews which could then be used for a
planned Multi-Criteria Decision Analysis workshop at a later date.
Workshop 1
The focus of the first workshop was to introduce participants to the ES concept and to extrapolate
values both spatially through participatory mapping of values and in terms of ranking of value. The
workshop was broken down into four distinct but inter-linked stages.
Stage 1: Introduction to ES concept
The first phase of the workshop comprised a presentation to introduce the participants to the concept
of ES. A list of indicators was presented to highlight the status of some of the services within the
Fingal context in order for stakeholders to relate the ES concept directly to their own local area.
Participants demonstrated some cognitive constraints in conceptualising the “services” approach to
the environment It can be remarked that the term "environment" can be a catch-all phrase to describe
green infrastructure tourism) or social benefits (e.g. community space/sense of place identity).
97
98
Bullock, Joyce, Collier, Schmidt, Walz, Scholte, Vervurg and Zanten
Stage 2: Understanding Socio-Cultural Values
The second phase of the workshop involved conceptually advancing the concept of Social-Cultural
values. Along the Fingal coast most of ES are represented by Cultural Ecosystem Services (CES). To
date, CES have often not been the focus of ecosystem assessments because their articulation has
been considered difficult due to the heterogeneous and incommensurable nature of the underlying
socio-cultural values. CES values are considered as being largely intangible (Chan et al, 2012), yet
socio-cultural values as they apply to CES can also include tangible values. The literature suggests
intangible values are more important to people (see West, 2006, Raymond et al, 2009) therefore we
introduced a model to disentangle these values so that they could be both understood by the
stakeholders and compared as part of the assessment. A typology of CES adapted from a landscape
values typology used in a previous study (McLain et al, 2013) was presented. The typology was
presented placing CES into two categories (i) Tangible Values (n=11) linked to the material benefits
or tactile values associated with recreation and wildlife appreciation, and (ii) Intangible/or less tangible
values (n=14) linked to the non-material health, spiritual, intrinsic, sense of place, community values
(Tables 2, 3). To date, tangible values (instrumental or functional) have been given higher regard in
assessments (Turnpenny et al, 2014). Often, CES have not been the focus of ecosystem
assessments because their articulation has been considered difficult due to the heterogeneous and
incommensurable nature of the underlying socio-cultural values
The participants were asked:
(i) If they recognised any of the values listed
(ii) Were they something that they could relate to
(iii) Where might they expect to see these or experience them along the Fingal coastline.
Monetary and Social Valuation: State of the Art
The floor was then opened up for discussion to allow participants to describe their perception of ES in
their own words. Participants agreed that they could connect with the concept of CES and describes
how and where they might have encountered CES benefits along the Fingal coastline through
recreational experience, aesthetic appreciation and experience of wildlife. The discussion about the
availability of ES in the Fingal setting demonstrated that value assessment can reveal “webs of
values” as discussed in the literature (Chan et al, 2012).
Box 1: Participants’ cognitive understanding of the range of CES Values
Tangible “Walking – uplifting, views, dog owners, paths”
“Coast/environment – exists for others”
“Wildlife, seals”
“Fishing – economics”
“Attracting visitors – tourism”
“Swimming”
“Wildlife”
“Sailing – economics, tourism”
“Harbours – for walking, wildlife, seals/birds”
“Sea angling”
“Horse riding experience”
“Birdwatching”
“Biodiversity”
“Designations – planning”
Less Tangible “Empty rugged landscape (coast)”
“Community”
“Healthy and uplifting”
“Most heritage properties along the
coast (St. Ita’s Portrane)”
“Spiritual – at night time, to be able to
see the islands”
“Learning”
“Knowledge”
“Broad views”
“Beach – empty and wild”
“Health – physical and psychological –
the value attached to health”
99
100
Bullock, Joyce, Collier, Schmidt, Walz, Scholte, Vervurg and Zanten
Stage 3: Mapping of Values
The third phase of the workshop used a participatory value mapping method to identify values.
Participatory mapping can allow stakeholders to connect their values directly with the landscape. At
the same time, it enables the production of information about value bundles and possible conflicts
between value demands and land use or management in a given location (Raymond et al 2014,
McLain et al 2013). Value maps can therefore complement biophysical maps and mesh together
relevant socio-cultural and socio-ecological information with biophysical and land use data. During this
exercise stakeholders were organised in cluster groups around four tables representing seven coastal
settlements each containing one map of a coastal settlement area. Participants were given three
questions to consider and asked to mark the specific locations of different values according to a
handout of CES provided to each individual. Each participant was asked to identify where they (a)
experienced (personal values) and/or (b) knew where Cultural Values existed in their own locality
(shared values).
Box 2: Values articulation prompt questions
1. What natural environment or ES do you value – believe to be important –?
2. Where you believe they are located?
3. Why you think these are of value:
– To you personally, to the community or in your capacity as a representative/stakeholder.
Objective: To provide information for future spatial planning and for the management of the environment.
– By understanding what people value most about the Fingal coast
– By mapping and measuring changes in these values over time.
Monetary and Social Valuation: State of the Art
They were guided to use the legend on the CES typology and to match coded values to each line that
they drew on the map so the different values could be clearly seen at each location. The participants
were advised that they could place any number of ES values at any given location (i.e. value
bundles). The results of this exercise demonstrated that the participants were very familiar with the
different qualities and values of their allotted map and were able to freely identify a range of values for
each map area. What can be clearly seen from the maps is that the Fingal coastline is characterised
by a rich range of socio-cultural values. It is was evident that there are places in Fingal that have a
wider range of values than others, i.e. sites with bundled values or ‘value hotspots’ (Plieninger et al,
2014). With this in mind, the map markings were subsequently digitized that the research team could
combine this values data with biophysical data at later date for presentation at the second workshop
and during a Multi-Criteria Decision Analysis workshop planned for 2016.
At the end of the mapping exercise each group was asked to nominate a speaker to summarise the
range of CES that were identified on each map. This provided an opportunity for sharing the value
characteristics of each location and space to reflect on the particular places of value and why they
were valued by each group. In addition it brought home to participants the myriad of values available
along the coastline.
Stage 4: Ranking of values
In comparison with monetary values, socio-cultural values can be incommensurable, but inferred
values for ES can be expressed by means of rating the importance of different categories of socio-
cultural value within a given location. This approach was adopted in this study. Using a Likert Scale
descending in value from 5 –1, participants were asked to rank both the Tangible and Less Tangible
values listed on the ES chart limiting the number of no value (1) and highest value (5) to a maximum
of 5 stickers, so that participants could prioritise the most important service benefits. Subsequent to
the workshop, each value category was totalled for the whole of the coastline. This revealed that
Intangible Values had a larger number of higher scored values than Tangible Values with six values
scoring over 40 out of 60: Aesthetics, Environmental quality, Bequest, Learning, Health and Wellbeing
and Social/Community. The Tangible values, namely Economic (e.g. tourism), Recreation (Walking,
Beaches), Wildlife watching and wildlife habitat (Bird watching Mammals/seabirds)) were associated
more with the functionality of nature and had lower scores. Supporting services, for example, the
Habitat value of estuaries scored 30 suggesting that stakeholders did not perceive that functional
aspects merited as high a value as CES or particularly intangible CES. Furthermore the more
Tangible economic benefits of the coastline ES were not valued highly by this stakeholder group, as
demonstrated by the low scores for Fishing industry (33) and Tourism (28). Nevertheless, in practice,
Intangible values associated with ES still rely on the maintenance of the natural environment, or
regulating ES. Future or bequest values were though given high scores also (45 out of 60).
101
102
Bullock, Joyce, Collier, Schmidt, Walz, Scholte, Vervurg and Zanten
What we learnt from these results is the most important aspects of the coastline are (a) offering a
place for casual activity and nature-based recreation on the Tangible side and (b) the wild visual
landscape character contributing to personal physical and psychological health on the Intangible side.
Workshop 2
The purpose of the second workshop was to revisit the rating results and to allow participants to more
openly discuss the values that they identified at each map location. A presentation was given on the
results of the first workshop to illustrate the values that were listed most on the maps (Slide 1 over)
and to provide feedback on the results of the rating of Tangible and Less Tangible Values.
It was explained that the value mapping exercise revealed that nature based values of Wilderness,
Wildlife, Birdwatching, Estuaries and Aesthetics, Walking and Health were the values most identified
on the maps and that these tallied with results of the value rating exercise. In order to explore the
values further and allow for a sharing of values, a photo elicitation method was used to prompt
participants to discuss their values more openly. Each group was asked first to describe what they
saw in each image and then what values might exist there, and what kind environmental services
might support these values. In addition the OPERAs TESSA tool was used to provide prompts to draw
out ES values in this location. The process did not work as regards getting more information on the
scoring of values in each area as there were many interest groups wishing to highlight issues of
concern about their own location or area of interest. However this process did uncover the different
issues at play in each mapped area and this provided an opportunity for a sharing of interests,
knowledge and perspectives on the issues. In the follow up interviews a number of participants
expressed that they found this aspect of the workshop very informative and revealing and it enabled a
non-confrontational expression of different concerns about the coastline. Two themes emerged from
this process (i) concern for the condition and management of the coastline and (ii) the potential of the
coastline not being realised and infrastructure needs.
ES Value Network Map

Monetary and Social Valuation: State of the Art
One of the aims of this workshop was to involve participants in the co-creation of an ecosystem-to
values network map (Concept Systems Model) so that they could begin to understand the influence of
different ES in shaping their values and to build some social learning about the relative importance of
particular services. A model linkage map was devised based on one used by Kenter et al, 2014 which
had linked the influences between different variables within a socio-cultural system. Network maps
can be used to explain the dynamic links between a set of variables and are considered to be easier
to convey information about causal relationships than numerical or scientific models (Mooney and
Tan, 2012). The ES-Value network model included 2 sets of variables: (i) categories of ES with
examples taken from the Exemplar and (ii) values expressed by participants. It was proposed that the
group would indicate the linkages between the two variables through a facilitator who would draw
directly onto a chart to transpose the value-ES services.
This process failed to occur however because there was insufficient time due to an overrun on the
previous stage which was given over to participants in sharing concerns about the coastline. The
facilitators decided therefore that it would be best to try and introduce this process to participants
individually during one-to-one interviews.
Figure 1: ES-Value Linkages Network Model
Interviews
103
104
Bullock, Joyce, Collier, Schmidt, Walz, Scholte, Vervurg and Zanten
Shortly after the second workshop 13 out of 15 participants took part in recorded interviews, for which
transcripts were made. The interviews combined two open-ended questions to get views on (i) the
concept of ES and (ii) responses to the model of SCV as a means to articulate values, and two further
process style questions (iii) asking interviewees to draw links between underlying ES and values on a
network diagram and (iv) asking them to revisit the value scoring to indicate their scores from an
individual and community perspective. Interviewees’ responses to the ES concept, the workshop
model and ES links are outlined first below.
Questions (i) and (ii): Responses to the ES concept and SCV model process
Participants found the ES concept challenging and were more comfortable expressing the benefits
that the coastline offers to them or their community (Tangible values) or the benefits that flow to them
personally (Intangible values). A number of participants expressed some confusion about where the
process will go or if it can be used in decision making. One considered it “a bit wishy washy, no right
or wrong” (I12). Another thought the concept of asking people about their values in advance might be
a good thing (I11). Another participant thought it would be appropriate to use the results of the
mapping process to inform zoning and planning decisions (I 7).
It was also considered that it is difficult to really assess people’s values unless they are faced with a
problem which really challenged them. A number of interviewees were positive about the use of the
ES concept as model to understand the benefits of the environment. Others considered the model
beneficial as it provided a platform for sharing of values, interests and concerns in a non-adversarial
setting with no hidden agendas.
Question (ii) and (iii): ES Linkages and Values Elicited
During the interviews each participant was shown the ES-value linkage model diagram and asked to
consider the linkages between the two sets of variables as they applied in the Exemplar. Only two of
the thirteen interviews could engage directly in the process of drawing on the model. Many
demonstrated cognitive difficulty in engaging with the chart indicating that it was a challenge for the
stakeholders to understand the relationships between services and values.
It was decided therefore not to pursue this task any further other than using the diagram as a support
for discussion about ES-value linkages. Interviewees did make verbal reference to the linkages stating
rather that “they are all linked” . It appears therefore that there is a level of understanding about
linkages, but that this exists more at an implicit level. Some stakeholders can see how values overlap
rather than making connections between the values and the ES. The linkage chart may is therefore
more suitable as a prompt rather than exercise to reveal values.
Monetary and Social Valuation: State of the Art
The values and themes emerging from the interviews
A preliminary analysis of the second set of questions was carried out using the QSR NVivo software.
The interview transcripts were coded according to different value based themes indicating
participants’ socio-ecological relationship with the coastal ES. A number of themes emerged that
demonstrated that although these participants are not directly dependent upon coastal ES for their
livelihood or wellbeing, they are affected by changes in ES and are aware that changes in ES can
impact on the flow of benefits that they receive from the coastal ES. It also illustrates that
stakeholders are concerned about the quality of the ES as it impacts on the recreation and amenity
value and consider accessibility to the coastline a key issue to increase the overall potential value of
the coastline. It is intended that a more complete analysis will be undertaken and will be used as
reference for the Multi-Criteria Decision workshop in 2016.
a) Way of Life Value
The interviews revealed that the changes in ES dynamics and quality can alter way of life / traditional
values in a peri-urban area, but sometimes in unexpected ways. For example, one interviewee
referred to having once been able to go on “fishing picnics”, but that he could no longer do so due to
as he believed that the overpopulation of seals has reduced the fish stocks (I05).
“There were photos of beaches covered in people – long ago – people rented out their houses to people
(secondary/casual income – this was also provided by selling fish catches to markets) and moved into back
sheds in garden – people rented house for whole summer –seasonal income” [I05]
“Going out to Colt island to fish today…Colt Island, nature reserve, if we go fishing there’s a lot less fish in
the sea from when we were younger…we used to go out fishing with grandad and come back with fish
boxes and we used to go door to door selling them and gutting them for the people, that isn’t the case
anymore”. [I12]
“The town of Rush at that stage probably had anything from 150-200 small growers – they might have now
10-20 growers at the moment – maybe a little bit more – I don’t want to exaggerate, but it has changed
drastically – the Fingal area is probably the same – I wouldn’t know the fishing industry places but if you
look at Skerries you only have a couple of fishing boats in Skerries – it’s changed so much. The
environment we are living has changed so much all the time”. [I03]
b) Change
Interviewees seemed to lament the past image of Fingal and its vibrant coastal towns and villages
supported by fishing and Dublin day-tripper tourism. Other interviewees accepted that change was
only to be expected and that new activities, some linked to ES, could replace the old, for example
wildlife watching or recreational or sea-angling.
“Natural/way of life heritage value – don’t know if there is a historical thing going on – new activities
have replaced shipbuilding – pleasure craft replaced shipping” [I10]
105
106
Bullock, Joyce, Collier, Schmidt, Walz, Scholte, Vervurg and Zanten
“While recognising that we can’t stop development, we can’t necessarily keep all these things to
ourselves – you know…should be able to access the things were able to enjoy as well but we have to
balance that in protecting environment and enjoying it” [I04]
c) Values of ES not being realised
Interviewees reflected on uses of ES and barriers to use and also considered how the quality of the
ES can impact on the potential value of the coastline, which many felt to have greater potential.
During the process of scoring of values, a number of interviewees stated that they would score values
higher if the quality of the ES was improved or better managed (e.g. water quality) (I01, I03)) or that
scores would be higher with more infrastructure or access. In this regard, an emerging theme was that
of accessibility to the coast for walking or cycling . A number of interviewees felt that if accessibility
and infrastructure was improved the values linked to the coastal ES would be higher.
“Coastline not used for walking – people go on the ring roads – need coastal path to be safe to walk” [I01]
“Sense of community – beach –is free for everyone – it’s a public space – accessibility matters – it’s easy to
use [I02]
“…mean people have different interests to I have and you have to be realistic about it – you can’t use an
area unless it has facilities to use it and we’re not talking about bringing 1000s people – if 10-20 people
want to go down into a small car park, have a picnic, have a look at birds going in and out – you mean
without passing the wildlife as well - it should be accessible –it’s not at the moment” [I03]
“I think the Planners need to – if they want to protect the environment they need to make it accessible,
so that people take ownership” [106]
d) Management of ES
Interviewees made reference to the impact of sewage on water quality and its knock on effect on the
enjoyment of the recreational amenity value of the coastline. They also referred to the need to
manage commercial fishing and tourism/recreational uses so that wildlife value of the coastline could
be protected.
“I don’t know why that is…I assume it’s been overfished and not monitored…but you have someone else
who works in the sea – like fishermen, they value the sea because it’s the way of making a living - our
values are different but no less important” [I12]
“I mean when environmental committee raised the issue of the sewage in the water – we’re not trying to put
people off using it – we’d love to see them using it more – when you think in reality they are diving into
sewage – it’s pretty sad – you know the harbour area – I think there’s a strong history there…” [I03]
“Env/quality - I know that the odd occasion when the beaches were closed because of problems with water
quality there is a major impact because people do us the beaches so much in the summer to go swimming
so it’s a big concern”. [I04]
Monetary and Social Valuation: State of the Art
Values way down - angling, boating/sailing, swimming/surfing. Skerries water treatment plant – old
treatment plant was a huge septic tank on Shenick island – sewage was overflowing down beach into the
sea” [I05]
“..yeah we’re looking for a Golden Mile right around the island [Explain to me…] It’s the shallow water – it’s
v. rich water, v. diverse, it’s also the nursery area for a lot of commercial species of fish – so trawlers,
working heavy gear in the inshore area is damaging the nursery and spawning areas – it’s also displacing
the fisheries for the small inshore boats who can only work close to land anyway – so a couple of big
industrial boats can ruin fishing inshore area v. quickly” [I06]
“If you put houses down close to the estuary you introduce disturbance – you introduce people with dogs,
walkers, that which again people don’t realise it – dogs walk on the beach – there’s a group of birds you see
the dog running through – scatters them (don’t pay any attention) they are roosting and they are intertidal
roosters and they are trying to rest” [I07]
Values Scoring
At the end of the interviews each participant was given a copy of the bar chart illustrating the results of
the scores from the workshops. The interviewees were asked if they wished to revise the scores up or
down by drawing new scores on a scale of 1-10 on each bar of the chart for each of the two
categories of value (Tangible values (community based) and Intangible values (personal)). This
process also allowed the participants to reflect again on their values. The results of the scoring were
totalled subsequently and aligned with the results of the original workshop. The process revealed
changes in the value scoring for both Tangible (community) and Intangible (personal) values. Higher
scores were recorded for all Intangible values during the interviews, indicating even stronger
preferences for non-material values, with Inspiration, Heritage and Social/Community and Sense of
Place values altering most. The Tangible values scores revealed that the value Wildlife Value
(Mammals/seabirds) is not as significant and has reduced but the value of angling in the estuaries and
harbours has increased, along with the value of coastal flora.
Figure 2: Comparison between first and second valuations across all values
107
108
Bullock, Joyce, Collier, Schmidt, Walz, Scholte, Vervurg and Zanten
5.3.4 Discussion – Learning from SCV and key findings about the process
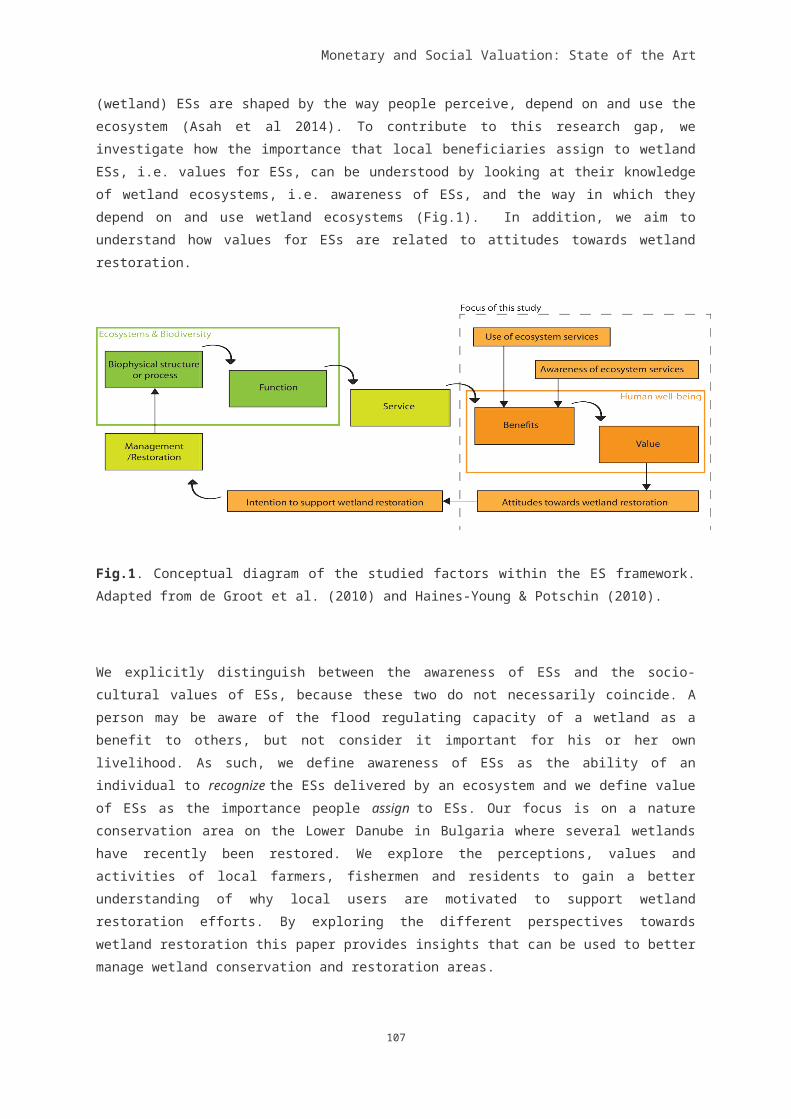
Monetary and Social Valuation: State of the Art
The SCV of ES is intended as a mechanism to provide information on the value of ES from a human
benefits perspective so that decision makers can make more balanced, informed decisions. The
literature demonstrates that there are various different approaches to SCV with varying types of
outputs including value maps, value ranking tables, network diagrams – all representing values in
different value formats2. The UCD research examined a values assessment approach to draw out
values. It had three aims (i) to test one approach to SCV valuation in practice (ii) to assess it as a
consultation mechanism to understand human-environment interactions and (ii) to establish if the
outputs of the process could provide information appropriate for decision making in the land use
planning context. The results of the research demonstrate that stakeholders are positive about
engaging in the process. The merits of the approach go beyond generating data about values as it
allows stakeholders to reflect on the values that they have for the ES in context. This reflective aspect
can generate new knowledge about how these relationships can be enhanced or affected by changes
in ES quality. SCV as a consultation mechanism is appropriate therefore for uncovering insights into
what values are important as well as revealing how socio-ecological relationships can be enhanced.
The SCV has the potential to transform public participation processes within planning by directing it at
the examination of the human-nature interactions and the landscape of socio-cultural values related to
ES, rather than primarily focusing on the consequences of land use change decisions at project or
plan level, and their related impacts on the environment as currently required under Environmental
Impact Assessment (EIA), Strategic Environmental Assessment (SEA) and the Habitats Directive.
Fundamental to the ES approach, as promoted by the MA (2005) is the assessment of the web of
interactions and relationships between ecosystems and people. This process of examining socio-
ecological relationships reveals how changes in services can impact on the benefits that people enjoy
from nature. This value based information is currently not sought after within existing consultation
impact assessment arenas. SCV could therefore be an operational model that fills this gap as it is an
opening-up mechanism that allows for the expression of perceptions and preferences of stakeholders
towards nature.
On the other hand, the UCD field work has highlighted the difficulty that stakeholders have grasping
the concept of ES and linking ES with values (see also Defra/Define Research, 2007 and Fairbank et
al, 2010). In order to use the approach as a mechanism for deliberative decision making involving
stakeholders it will be necessary to convert the ES construct (i.e. ES services flows become ES
values) into a form of visible, relatable services in the local context (see for example Cáceres et al
2015). Only by doing so can stakeholders begin to consider and articulate the impact of change on
their local environment from an ES perspective.
Key Learning Messages
2 For examples to different approaches see Bernue et al, 2014, Bieling, 2014, Tomich et al [in] Ash et, 2010, Mac Kenzie, 2012, Todd, 2014, Cáceres et al, 2015, Kati and Jari, 2016 (forthcoming), Raymond et al, 2009, Mooney and Tan, , 2012.
109
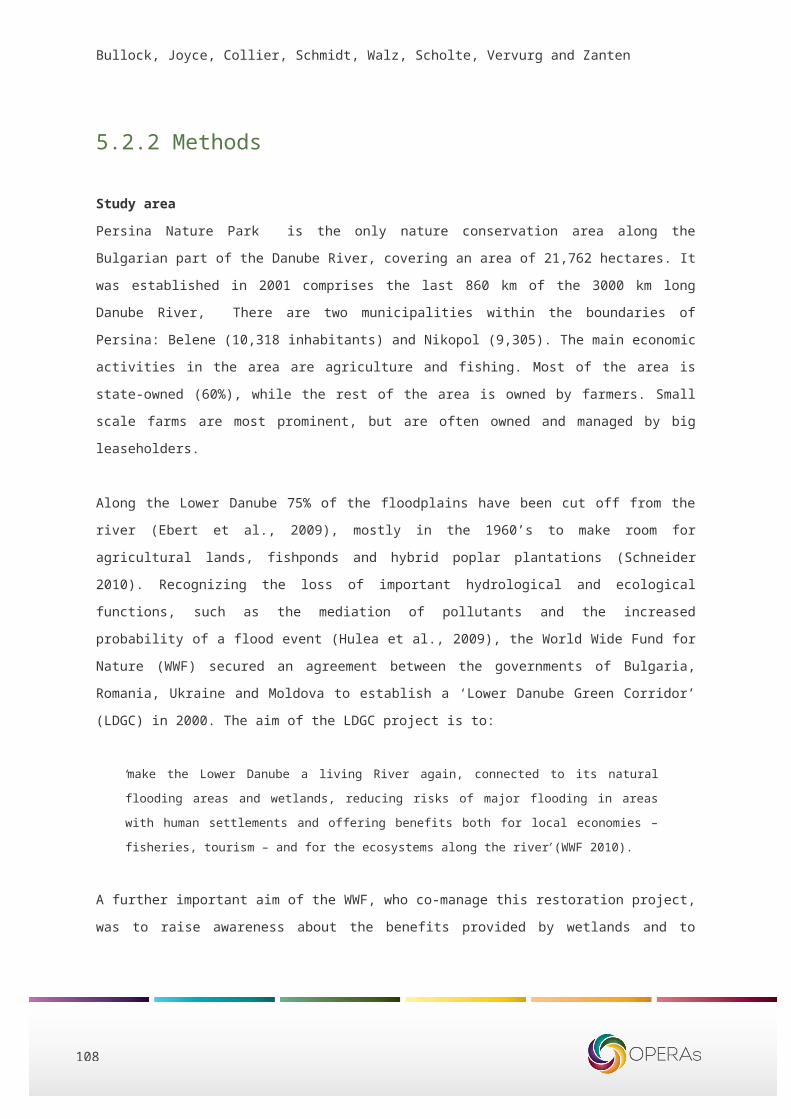
110
Bullock, Joyce, Collier, Schmidt, Walz, Scholte, Vervurg and Zanten
1. SCV as a participatory process is important as it provides a platform for stakeholders to express
their values openly in a non-adversarial forum. SCV of ES has a ‘boundary effect’ that channels
stakeholders into thinking about their relationship with nature and the impact of change on the
benefits that they receive, rather than focussing on issues of conflict in valuation style consultation
processes.
2. The valuation assessment can provide information on value preferences within a given area but this
does necessarily enable participants to connect with the value-ES linkages per se. In order to
overcome this and allow for cognitive development about ES-value linkages, facilitators must track
these links in the valuation context during assessments so that participants can directly relate their
values in be a tangible way to the ES services supporting each value.
3. SC Valuation assessment does not in itself enable participants to consider the relative importance
of ES. Rather SCV should be used as an opening up mechanism for deliberative processes,
highlighting the values that exist within a given setting. In order for participants to use ESs as decision
criteria, ES-to-value linkages must be made either collaboratively with natural science experts through
the creation of network diagrams, or demonstrated to them by other means, so that they can use this
knowledge as the criteria for decision making.
4. Qualitative assessment of SCVs using semi-structured interviews and engaging participants
individually with the scoring of values prompts them to reflect on current, past and future values. This
process can provide feedback on perceptions about the overall management of the ES in the context
in question. If stakeholders consider that they could score values higher if improvements were made
to the management of natural assets, the quality of the ecosystem, or in environmental education ,
this suggests a conduit through which people’s local knowledge can be applied to realise higher ES
benefits .
5. Mapping of values as part of a valuation assessment , allows participants to reflect on those places
which are important to them as well as learning about the plurality of values within a given setting. The
maps created through such a process could be scaled up and integrated into GIS maps so that
decision makers can identify where value bundles exist, indicating value demands of stakeholders.
This information may be used by decision makers to consider management arrangements for ES so
that they are improved, conserved or protected, to support value demands. Alternatively, maps can be
used to provide information on conflicts between value demands and current or planned land uses.
6. The SCV knowledge generated about those places that are considered to be most important,
through the identification of value bundles or density of single values on maps, can inform land-use
decision makers about what values will be disrupted if there is land-use change ex-ante before these
decisions take place. This will provide decision makers with more nuanced information about the
arena of contestation when decisions have to be taken. Knowing what is at stake will allow them to
examine alternative plans or to negotiate trade-offs.
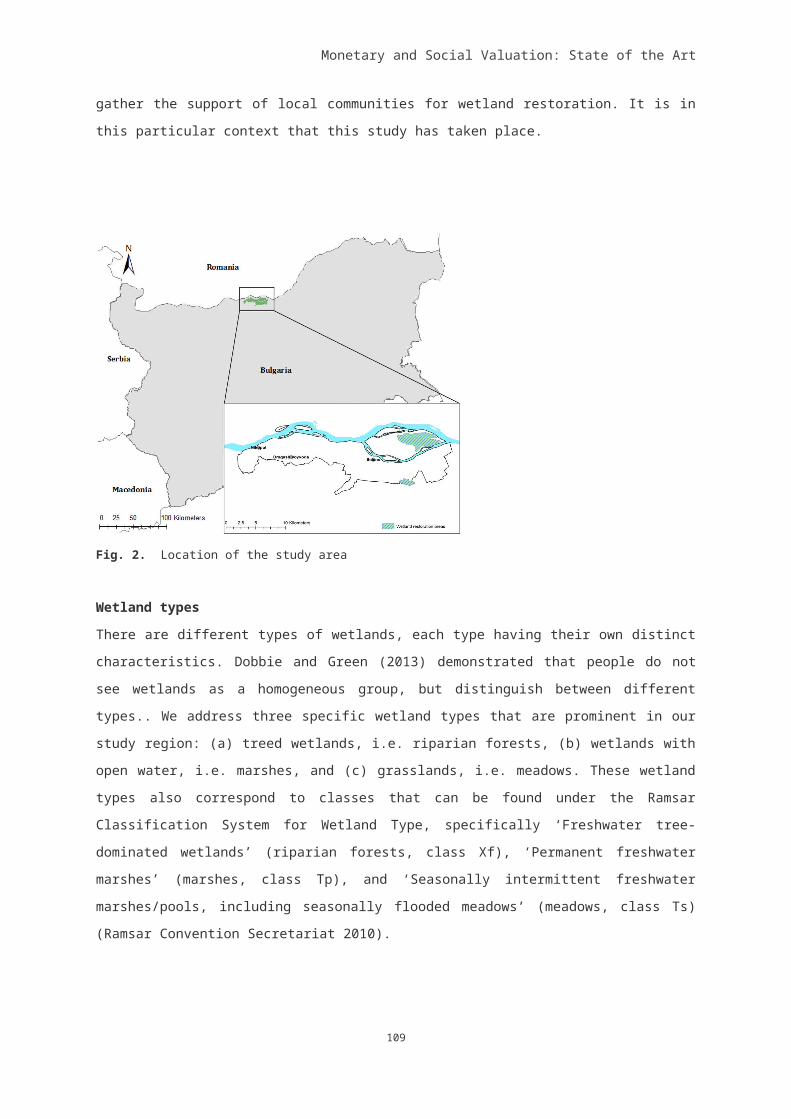
Monetary and Social Valuation: State of the Art
7. Qualitative assessment of values can uncover the perceptions that stakeholders have of socio-
ecological relationships . It can draw out stakeholders’ viewpoints about the management of ES and
can provide some direction on how to improve these socio-ecological relationships so that people can
derive more benefit from the ES.
References
Ash, N., Blanco, H., Brown, C., Garcia, K., Henrichs, T., Lucas, N., Raudsepp-Hearne, R., & Simpson, D., Scholes, R., Tomich, T., Vira, B., Zurek, M. (EDS.), 2010. 2010. Ecosystems and Human Wellbeing — A Manual for Assessment Practitioners, E. Island Press, Washington D.C.
Bieling, C. & Plieninger, T.2014. Cultural ecosystem services as revealed through short stories from residents of the Swabian Alb (Germany). Ecosystem Services 8(0), 207-215.
Boyd, J. & Banzhaf, S. 2007. What are ecosystem services? The need for standardized environmental accounting units. Ecological Economics, 63, 616-626.
Cáceres, D. M., Tapella, E., Quétier, F. & Díaz, S. 2015. The social value of biodiversity and ecosystem services from the perspectives of different social actors. Ecology and Society, 20, 62.
Chiesura, A. & De Groot, R. 2003. Critical natural capital: a socio-cultural perspective. Ecological Economics, 44, 219-231.
Chan, K. M., Guerry, A. D., Balvanera, P., Klain, S., Satterfield, T., Basurto, X., Bostrom, A., Chuenpagdee, R., Gould, R. & Halpern, B. S. 2012. Where are cultural and social in ecosystem services? A framework for constructive engagement. BioScience, 62, 744-756.
Council and European Parliament Directive 2001/42/ EC on the assessment of the effects of certain plans and programmes on the environment (SEA Directive). Official Journal of the European Communities. Official Journal. OJ L 197. 27th June, 2001. pp30-38
Council And European Parliament Directive 2014/52/EU amending Directive 2011/92/EU on the assessment of the effects of certain public and private projects on the environment (EIA Directive). Official Journal of the European Communities. OJ L 124. 25th April, 2014. pp1-18
Council Directive 92/43/EEC on the conservation of natural habitats and of wild fauna and flora (Habitats Directive). Official Journal . OJ L206. 21ST May, 1992. pp7-50
De Groot, R. S., Wilson, M. A. & Boumans, R. M. J. 2002. A typology for the classification, description and valuation of ecosystem functions goods and services. Ecological Economics, 41, 393-408
Define Research and Insights/Defra. 2007. Public understanding of the concepts and languageAround description and valuation of ecosystem functions, goods and services. Project NR0115.
111
112
Bullock, Joyce, Collier, Schmidt, Walz, Scholte, Vervurg and Zanten
Fairbank, Maslin, Maullin, Metz & Associates. 2010 For The Nature Conservancy. Key Findings from Recent National Opinion on Ecosystem Services Research.
Felipe-Lucia, M. R., Comín, F. A. & Escalera-Reyes, J. 2015. A framework for the social valuationof ecosystem services. Ambio, 44, 308-318.
Gould, R., Klain, S., Ardoin, N., Satterfield, T., Woodside, U., Hannahs, N., Daily, G. & Chan, K. 2014. A protocol for eliciting nonmaterial values using a cultural ecosystem services frame: analyzing cultural ecosystem services. Conserv. Biol., 1-35.
Haines-Young, R. H. & Potschin, M.B. 2009. Methodologies for defining and assessing ecosystem services. Final Report, JNCC, Project Code C08-0170-0062. 69pp.
Kati, V. & Jari, N. 2016. Bottom-up thinking—Identifying socio-cultural values of ecosystem services in local blue–green infrastructure planning in Helsinki, Finland. Land Use Policy, 50, 537-547.
Kenter, J. O. 2014. Valuing the Inner Forth. Final report to the Inner Forth Landscape Initiative. Falkirk/Aberdeen: IFLI/University of Aberdeen
MacKenzie, J. 2012. Socio-cultural values in the adaptive water planning cycle. Report for the Northern Australia Water Futures Assessment Cultural and Social Program. Darwin, Australia: Charles Darwin University: Darwin.
McLain, R., L. Cerveny, D. Besser, D. Banis, K. Biedenweg, A. Todd, C. Kimball-Brown, and S. Rohdy. 2013. Mapping Human-Environment Connections On The Olympic Peninsula: An Atlas Of Landscape Values. Portland University. USA
Millennium Ecosystem Assessment (MA). 2005. Ecosystems and human well-being: Our human planet: Summary for decision makers. Washington, DC: Island Press.
Mooney C & Pl Tan 2012. South Australia’s River Murray: Social and cultural values in water on “Ecosystem Services". Planning. Journal of Hydrology 474, 29-37.
Plieninger, T., Dijks, Sebastian, Oteros-Rozas, Elisa, Bieling, Claudia . 2013. Assessing, mapping and quantifying cultural ecosystem services at community level. Land Use Policy 33, 118-129
Raffaelli, D. G. 2006. Biodiversity and ecosystem functioning: issues of scale and trophic complexity. Marine Ecology-Progress Series 311: 285-294.
Raymond, C. M., Bryan, B. A., Macdonald, D. H., Cast, A., Strathearn, S., Grandgirard, A. & Kalivas, T. 2009. Mapping community values for natural capital and ecosystem services. Ecological Economics, 68, 1301-1315.
Satz, D., Gould, R. K., Chan, K. M., Guerry, A., Norton, B., Satterfield, T., Halpern, B. S.,
Levine, J., Woodside, U. & Hannahs, N. 2013. The challenges of incorporating cultural ecosystem services into environmental assessment. Ambio, 42, 675-684.
Scholte, S. S. K., Van Teeffelen, A. J. A. & Verburg, P. H. 2015. Integrating socio-cultural perspectives into ecosystem service valuation: A review of concepts and methods. Ecological Economics, 114, 67-78.
Spangenberg, J. H., Görg, C., Truong, D. T., Tekken, V., Bustamante, J. V. & Settele, J. 2014. Provision of ecosystem services is determined by human agency, not ecosystem functions. Four case studies. International Journal of Biodiversity Science, Ecosystem Services & Management, 10, 40-53.
Monetary and Social Valuation: State of the Art
TEEB 2010. The Economics of Ecosystems and Biodiversity Ecological and Economic Foundations. KUMAR, P.(ed.). London and Washington: Earthscan.
Todd, A. N. 2014. Mapping Sociocultural Values of Visitors on the Olympic Peninsula, Washington. Portland State University. USA.
Turnpenny, J., Russel, D. & Jordan, A. 2014. The challenge of embedding an ecosystems services approach: patterns of knowledge utilisation in public policy appraisal. Environment and Planning C: Government and Policy, 32, 247-262.
UNEP-WCMC, C. 2011. UK National Ecosystem Assessment. The UK National Ecosystem Assessment: Synthesis of the Key Findings. Cambridge, UK.
Zografos & Kumar. 2010. Socio-cultural context of ecosystem and biodiversity valuation [in] TEEB 2010. The Economics of Ecosystems and Biodiversity Ecological and Economic Foundations. KUMAR, P. (ed.). London and Washington: Earthscan.
113
114
Bullock, Joyce, Collier, Schmidt, Walz, Scholte, Vervurg and Zanten
6 Summary discussionThis deliverable has discussed the role of social or socio-cultural values and has introduced some of
the methods of socio-cultural valuation (SCV) ranging from deliberative methods, to mapping,
multivariate, quantitative and analytical approaches. Social or socio-cultural values underpin many
decisions that we make, especially for those more important decisions where there is a reason to
account for personal interests, the needs of others and our presumed responsibility for the
environment in which we live. As such they take into account a range of personal and shared values,
which in turn are informed by personal experience and social and cultural norms.
Amidst all the factors to which we must give consideration, the specific values that inform attitudes
and choices with regard to the environment can be hard to filter out or distinguish. Ecosystem
services (ES) are a complex and unfamiliar concept for most people, and their role can be difficult to
communicate or understand. Almost inevitably, people will relate most closely to cultural ecosystem
services (CES) as these are experienced in the settings or situations with which people most typically
interact with nature and realise its benefits. By comparison, the value associated with regulating
ecosystem services (RES) can be overlooked as their contribution is intermediate or less understood.
An onus is placed on the researcher to identify situations in which RES contribute significantly to final
ES benefits which people do value or which might largely be realised through the medium of CES.
The usefulness of attempting to inform stakeholders or the public of this contribution depends on the
extent to which a wider awareness of ES is considered useful for sustainable environmental
management. This issue is discussed in the paper by Deirdre Joyce. However, the paper by Scholte
et al on the Danube wetlands finds that, even among primary producers who might be expected to
have the best knowledge of RES through their participation in socio-ecological systems, CES benefits
still have a very considerable influence on the value that people attach to the environment.
The deliverable report began by remarking on the limited range of values that might be amenable to
economic valuation. A problem with SCV is that it must address a wide range of values and then
distinguish those that are relevant to the environment. A further problem is that environmental and
non-environmental values become bundled together. A SCV cannot shirk the presence of bundles as
it has already acknowledged the wide scope of socio-cultural values. Rather, the various methods of
SCV each have their means of teasing these values apart. Deliberative methods can be used to
encourage participants to focus on the specific role of ES. This process that can aided by participatory
mapping. Images and visualisation can assist too in both deliberation and survey based approaches.
The use of trade-offs can also focus people's attention on those things that are valued most.
Inevitably, choice experiments must identify a limited number of attributes for the experiments to be
workable. However, the use of attributes can also obscure the role of bundled values and the more
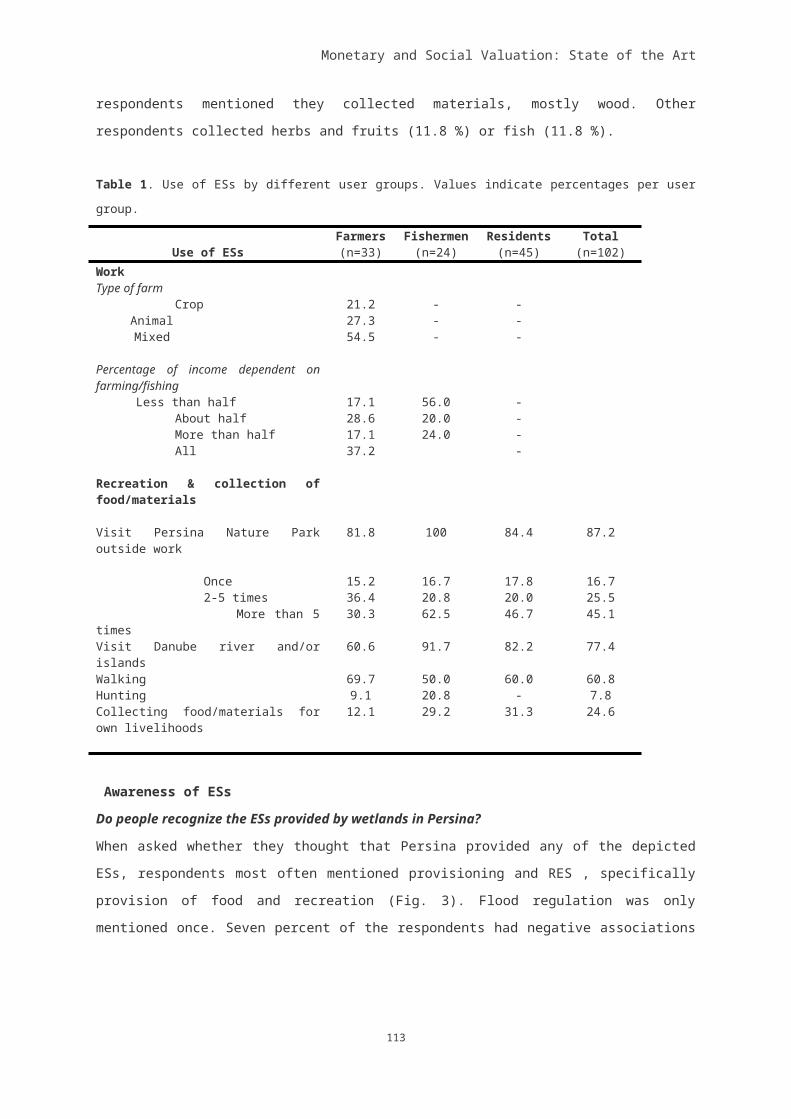
Monetary and Social Valuation: State of the Art
holistic perceptions of the environment. Nevertheless, the concept of ES does lend itself to
presentation within choice experiments and calling upon respondents to make trade-offs can be an
effective means to force them to focus on what they value most. For this reason, the papers by
Scholte et al and Zanten et al. both make use of choice experiments without the monetary attribute
associated with economic valuation.
Multicriteria analysis and scenario-based comparisons (e.g. TESSA) are other means to encourage
people to make trade-offs. Participatory multicriteria analysis is a method that can be used in a
deliberative process as described by Joyce. It can also be combined with scoring and weighting
approaches to explore heterogeneity in values and preferences as discussed by Schmidt et al. In
practice, the wide range and origins of socio-cultural values is such that not all values are
commensurable or separable. Scholte et al describe the presence of a continuous range of values
from the purely instrumental to the more biocentric. However, methods of SCV have an important role
in determining the extent of comparability and commensurability along such a continuum.
115
116
Bullock, Joyce, Collier, Schmidt, Walz, Scholte, Vervurg and Zanten