Embed Size (px)
Citation preview
OpenShift Container Platform 4.2
Monitoring
Configuring and using the monitoring stack in OpenShift Container Platform 4.2
Last Updated: 2020-04-17


OpenShift Container Platform 4.2 Monitoring
Configuring and using the monitoring stack in OpenShift Container Platform 4.2
Legal Notice
Copyright © 2020 Red Hat, Inc.
The text of and illustrations in this document are licensed by Red Hat under a Creative CommonsAttribution–Share Alike 3.0 Unported license ("CC-BY-SA"). An explanation of CC-BY-SA isavailable athttp://creativecommons.org/licenses/by-sa/3.0/. In accordance with CC-BY-SA, if you distribute this document or an adaptation of it, you mustprovide the URL for the original version.
Red Hat, as the licensor of this document, waives the right to enforce, and agrees not to assert,Section 4d of CC-BY-SA to the fullest extent permitted by applicable law.
Red Hat, Red Hat Enterprise Linux, the Shadowman logo, the Red Hat logo, JBoss, OpenShift,Fedora, the Infinity logo, and RHCE are trademarks of Red Hat, Inc., registered in the United Statesand other countries.
Linux ® is the registered trademark of Linus Torvalds in the United States and other countries.
Java ® is a registered trademark of Oracle and/or its affiliates.
XFS ® is a trademark of Silicon Graphics International Corp. or its subsidiaries in the United Statesand/or other countries.
MySQL ® is a registered trademark of MySQL AB in the United States, the European Union andother countries.
Node.js ® is an official trademark of Joyent. Red Hat is not formally related to or endorsed by theofficial Joyent Node.js open source or commercial project.
The OpenStack ® Word Mark and OpenStack logo are either registered trademarks/service marksor trademarks/service marks of the OpenStack Foundation, in the United States and othercountries and are used with the OpenStack Foundation's permission. We are not affiliated with,endorsed or sponsored by the OpenStack Foundation, or the OpenStack community.
All other trademarks are the property of their respective owners.
Abstract
This document provides instructions for configuring and using the Prometheus monitoring stack inOpenShift Container Platform.

. . . . . . . . . . . . . . . . . . . . . . . . . . . . . . . . . . . . . . . . . . . . . . . . . . . . . . . . . . . . . . . . . . . . . . . . . . . . . . . . . . . . . . . . . . . . . . . . . . . . . . . . . . . . . . . . . . . . . . . . . . . . . . . . . . . . . . . . . . . . . . . . . . . . . . . . . . . . . . . . . . . . . . . . . . . . . . . . . . . . . . . . . . . . . . . . . . . . . . . . . . . . . . . . . . . . . . . . . . . . . . . . . . . . . . . . . . . . . . . . . . . . . . . . . . . . . . . . . . . . . . . . . . . . . . . . . . . . . . . .
. . . . . . . . . . . . . . . . . . . . . . . . . . . . . . . . . . . . . . . . . . . . . . . . . . . . . . . . . . . . . . . . . . . . . . . . . . . . . . . . . . . . . . . . . . . . . . . . . . . . . . . . . . . . . . . . . . . . . . . . . . . . . . . . . . . . . . . . . . . . . . . . . . . . . . . . . . . . . . . . . . . . . . . . . . . . . . . . . . . . . . . . . . . . . . . . . . . . . . . . . . . . . . . . . . . . . . . . . . . . . . . . . . . . . . . . . . . . . . . . . . . . . . . . . . . . . . . . . . . . . . . . . . . . . . . . . . . . . . . .
Table of Contents
CHAPTER 1. CLUSTER MONITORING1.1. ABOUT CLUSTER MONITORING
1.1.1. Stack components and monitored targets1.2. CONFIGURING THE MONITORING STACK
1.2.1. Maintenance and support1.2.2. Creating cluster monitoring ConfigMap1.2.3. Configuring the cluster monitoring stack1.2.4. Configurable monitoring components1.2.5. Moving monitoring components to different nodes1.2.6. Assigning tolerations to monitoring components1.2.7. Configuring persistent storage
1.2.7.1. Configuring a local persistent volume claim1.2.7.2. Modifying retention time for Prometheus metrics data
1.2.8. Configuring Alertmanager1.2.8.1. Alertmanager default configuration1.2.8.2. Applying custom Alertmanager configuration1.2.8.3. Alerting rules1.2.8.4. Listing acting alerting rules
1.3. MANAGING CLUSTER ALERTS1.3.1. Contents of the Alerting UI1.3.2. Getting information about alerts and alerting rules1.3.3. Silencing alerts1.3.4. Getting information about silences1.3.5. Editing silences1.3.6. Expiring silences
1.4. EXAMINING CLUSTER METRICS1.4.1. Contents of the Metrics UI1.4.2. Running metrics queries1.4.3. Exploring the visualized metrics
1.5. ACCESSING PROMETHEUS, ALERTMANAGER, AND GRAFANA1.5.1. Accessing Prometheus, Alerting UI, and Grafana using the web console1.5.2. Accessing Prometheus, Alertmanager, and Grafana directly
CHAPTER 2. EXPOSING CUSTOM APPLICATION METRICS FOR AUTOSCALING2.1. EXPOSING CUSTOM APPLICATION METRICS FOR HORIZONTAL POD AUTOSCALING
3335566789
1011
1213131415161617192122222223232526262627
2828
Table of Contents
1

OpenShift Container Platform 4.2 Monitoring
2
CHAPTER 1. CLUSTER MONITORING
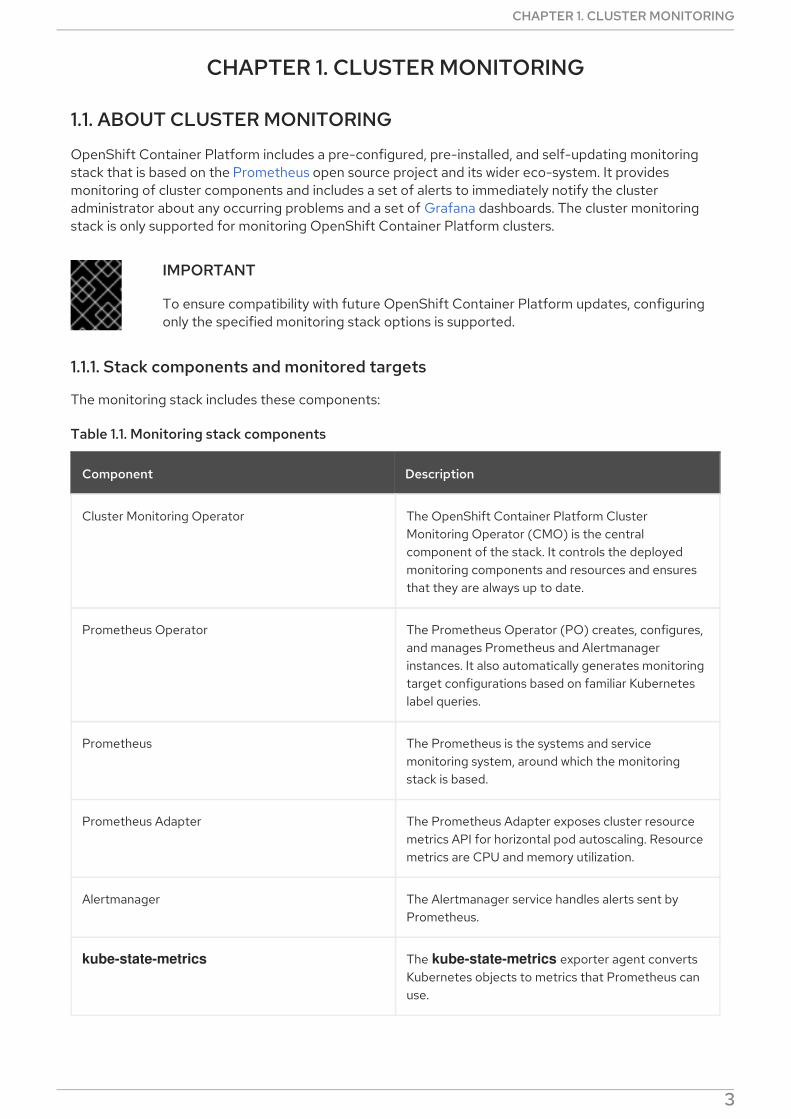
1.1. ABOUT CLUSTER MONITORING
OpenShift Container Platform includes a pre-configured, pre-installed, and self-updating monitoringstack that is based on the Prometheus open source project and its wider eco-system. It providesmonitoring of cluster components and includes a set of alerts to immediately notify the clusteradministrator about any occurring problems and a set of Grafana dashboards. The cluster monitoringstack is only supported for monitoring OpenShift Container Platform clusters.
IMPORTANT
To ensure compatibility with future OpenShift Container Platform updates, configuringonly the specified monitoring stack options is supported.
1.1.1. Stack components and monitored targets
The monitoring stack includes these components:
Table 1.1. Monitoring stack components
Component Description
Cluster Monitoring Operator The OpenShift Container Platform ClusterMonitoring Operator (CMO) is the centralcomponent of the stack. It controls the deployedmonitoring components and resources and ensuresthat they are always up to date.
Prometheus Operator The Prometheus Operator (PO) creates, configures,and manages Prometheus and Alertmanagerinstances. It also automatically generates monitoringtarget configurations based on familiar Kuberneteslabel queries.
Prometheus The Prometheus is the systems and servicemonitoring system, around which the monitoringstack is based.
Prometheus Adapter The Prometheus Adapter exposes cluster resourcemetrics API for horizontal pod autoscaling. Resourcemetrics are CPU and memory utilization.
Alertmanager The Alertmanager service handles alerts sent byPrometheus.
kube-state-metrics The kube-state-metrics exporter agent convertsKubernetes objects to metrics that Prometheus canuse.
CHAPTER 1. CLUSTER MONITORING
3
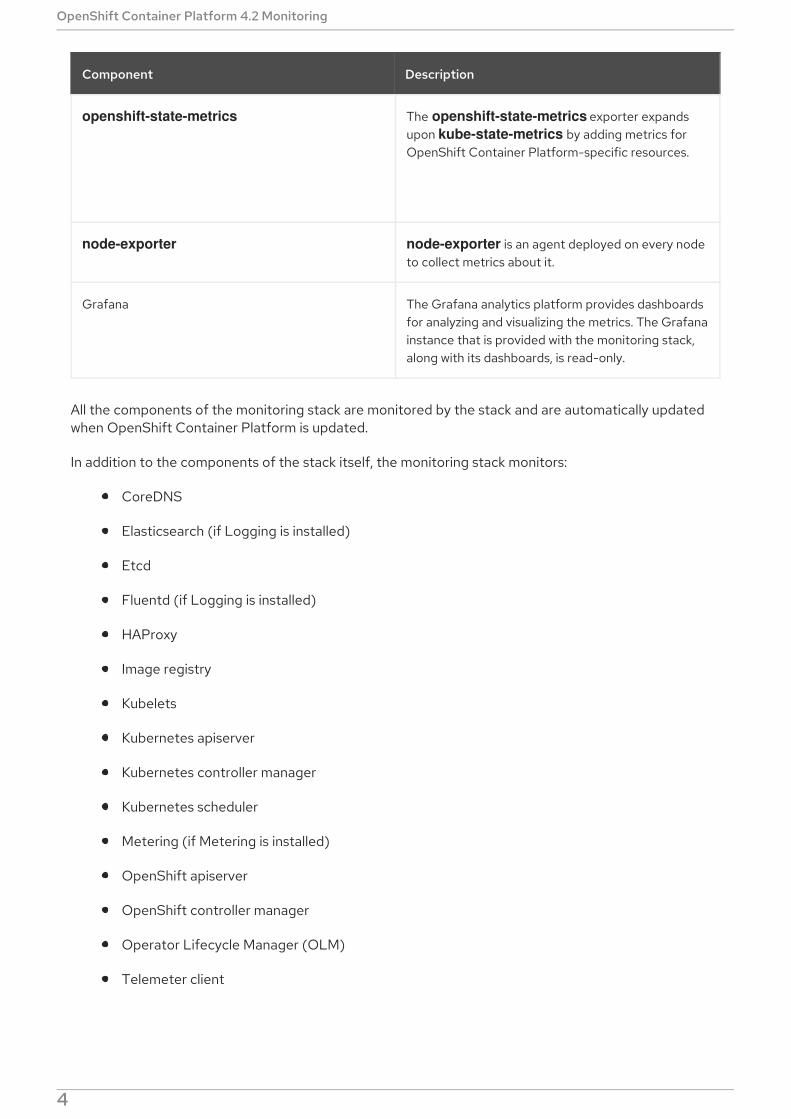
openshift-state-metrics The openshift-state-metrics exporter expandsupon kube-state-metrics by adding metrics forOpenShift Container Platform-specific resources.
node-exporter node-exporter is an agent deployed on every nodeto collect metrics about it.
Grafana The Grafana analytics platform provides dashboardsfor analyzing and visualizing the metrics. The Grafanainstance that is provided with the monitoring stack,along with its dashboards, is read-only.
Component Description
All the components of the monitoring stack are monitored by the stack and are automatically updatedwhen OpenShift Container Platform is updated.
In addition to the components of the stack itself, the monitoring stack monitors:
CoreDNS
Elasticsearch (if Logging is installed)
Etcd
Fluentd (if Logging is installed)
HAProxy
Image registry
Kubelets
Kubernetes apiserver
Kubernetes controller manager
Kubernetes scheduler
Metering (if Metering is installed)
OpenShift apiserver
OpenShift controller manager
Operator Lifecycle Manager (OLM)
Telemeter client
NOTE
OpenShift Container Platform 4.2 Monitoring
4
NOTE
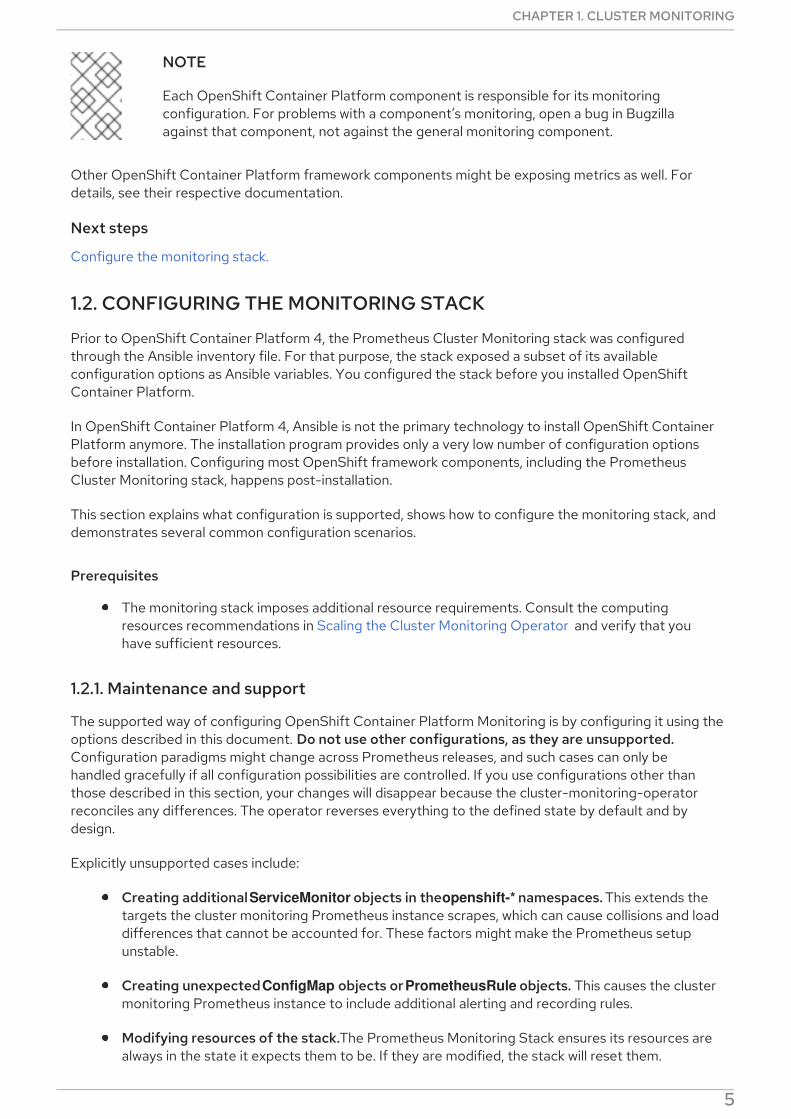
Each OpenShift Container Platform component is responsible for its monitoringconfiguration. For problems with a component’s monitoring, open a bug in Bugzillaagainst that component, not against the general monitoring component.
Other OpenShift Container Platform framework components might be exposing metrics as well. Fordetails, see their respective documentation.
Next steps
Configure the monitoring stack.
1.2. CONFIGURING THE MONITORING STACK
Prior to OpenShift Container Platform 4, the Prometheus Cluster Monitoring stack was configuredthrough the Ansible inventory file. For that purpose, the stack exposed a subset of its availableconfiguration options as Ansible variables. You configured the stack before you installed OpenShiftContainer Platform.
In OpenShift Container Platform 4, Ansible is not the primary technology to install OpenShift ContainerPlatform anymore. The installation program provides only a very low number of configuration optionsbefore installation. Configuring most OpenShift framework components, including the PrometheusCluster Monitoring stack, happens post-installation.
This section explains what configuration is supported, shows how to configure the monitoring stack, anddemonstrates several common configuration scenarios.
Prerequisites
The monitoring stack imposes additional resource requirements. Consult the computingresources recommendations in Scaling the Cluster Monitoring Operator and verify that youhave sufficient resources.
1.2.1. Maintenance and support
The supported way of configuring OpenShift Container Platform Monitoring is by configuring it using theoptions described in this document. Do not use other configurations, as they are unsupported.Configuration paradigms might change across Prometheus releases, and such cases can only behandled gracefully if all configuration possibilities are controlled. If you use configurations other thanthose described in this section, your changes will disappear because the cluster-monitoring-operatorreconciles any differences. The operator reverses everything to the defined state by default and bydesign.
Explicitly unsupported cases include:
Creating additional ServiceMonitor objects in the openshift-* namespaces. This extends thetargets the cluster monitoring Prometheus instance scrapes, which can cause collisions and loaddifferences that cannot be accounted for. These factors might make the Prometheus setupunstable.
Creating unexpected ConfigMap objects or PrometheusRule objects. This causes the clustermonitoring Prometheus instance to include additional alerting and recording rules.
Modifying resources of the stack. The Prometheus Monitoring Stack ensures its resources arealways in the state it expects them to be. If they are modified, the stack will reset them.
CHAPTER 1. CLUSTER MONITORING
5
Using resources of the stack for your purposes. The resources created by the PrometheusCluster Monitoring stack are not meant to be used by any other resources, as there are noguarantees about their backward compatibility.
Stopping the Cluster Monitoring Operator from reconciling the monitoring stack.
Adding new alerting rules.
Modifying the monitoring stack Grafana instance.
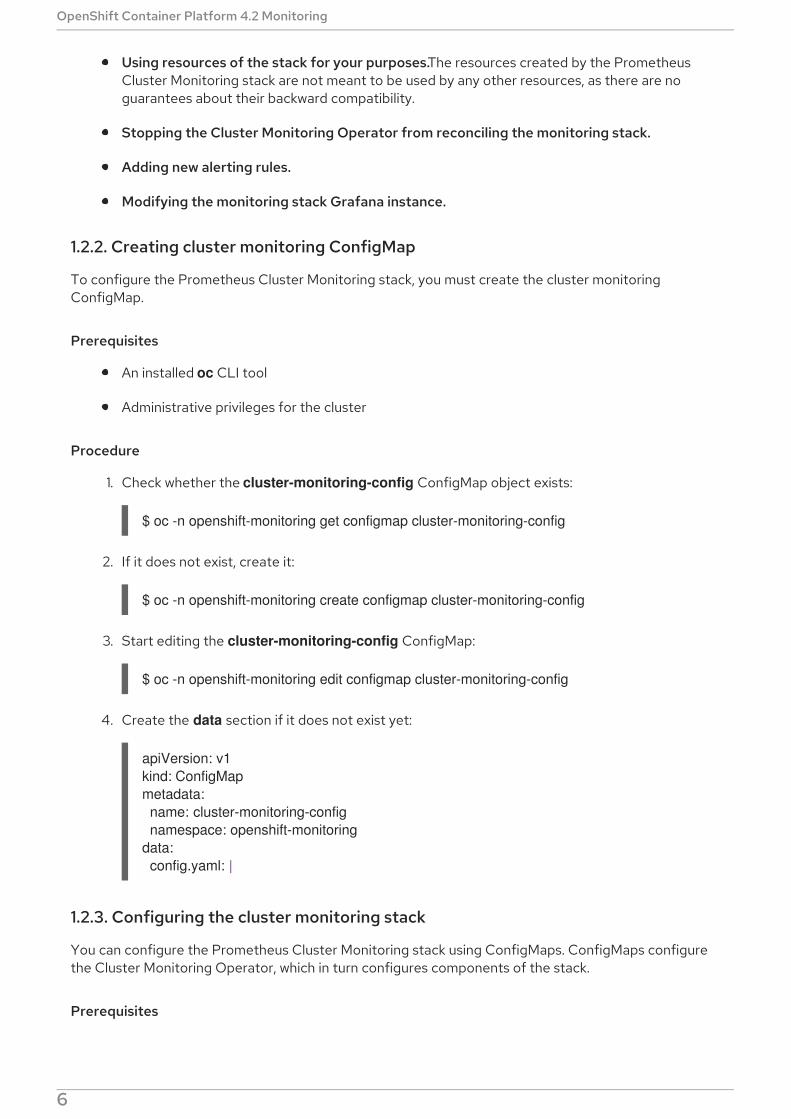
1.2.2. Creating cluster monitoring ConfigMap
To configure the Prometheus Cluster Monitoring stack, you must create the cluster monitoringConfigMap.
Prerequisites
An installed oc CLI tool
Administrative privileges for the cluster
Procedure
1. Check whether the cluster-monitoring-config ConfigMap object exists:
$ oc -n openshift-monitoring get configmap cluster-monitoring-config
2. If it does not exist, create it:
$ oc -n openshift-monitoring create configmap cluster-monitoring-config
3. Start editing the cluster-monitoring-config ConfigMap:
$ oc -n openshift-monitoring edit configmap cluster-monitoring-config
4. Create the data section if it does not exist yet:
1.2.3. Configuring the cluster monitoring stack
You can configure the Prometheus Cluster Monitoring stack using ConfigMaps. ConfigMaps configurethe Cluster Monitoring Operator, which in turn configures components of the stack.
Prerequisites
Make sure you have the cluster-monitoring-config ConfigMap object with the
apiVersion: v1kind: ConfigMapmetadata: name: cluster-monitoring-config namespace: openshift-monitoringdata: config.yaml: |
OpenShift Container Platform 4.2 Monitoring
6

Make sure you have the cluster-monitoring-config ConfigMap object with the data/config.yaml section.
Procedure
1. Start editing the cluster-monitoring-config ConfigMap:
$ oc -n openshift-monitoring edit configmap cluster-monitoring-config
2. Put your configuration under data/config.yaml as key-value pair <component_name>: <component_configuration>:
Substitute <component> and <configuration_for_the_component> accordingly.
For example, create this ConfigMap to configure a Persistent Volume Claim (PVC) forPrometheus:
Here, prometheusK8s defines the Prometheus component and the following lines define itsconfiguration.
3. Save the file to apply the changes. The pods affected by the new configuration are restartedautomatically.
1.2.4. Configurable monitoring components
This table shows the monitoring components you can configure and the keys used to specify thecomponents in the ConfigMap:
Table 1.2. Configurable monitoring components
Component Key
Prometheus Operator prometheusOperator
apiVersion: v1kind: ConfigMapmetadata: name: cluster-monitoring-config namespace: openshift-monitoringdata: config.yaml: | <component>: <configuration_for_the_component>
apiVersion: v1kind: ConfigMapmetadata: name: cluster-monitoring-config namespace: openshift-monitoringdata: config.yaml: | prometheusK8s: volumeClaimTemplate: spec: storageClassName: fast volumeMode: filesystem resources: requests: storage: 40Gi
CHAPTER 1. CLUSTER MONITORING
7
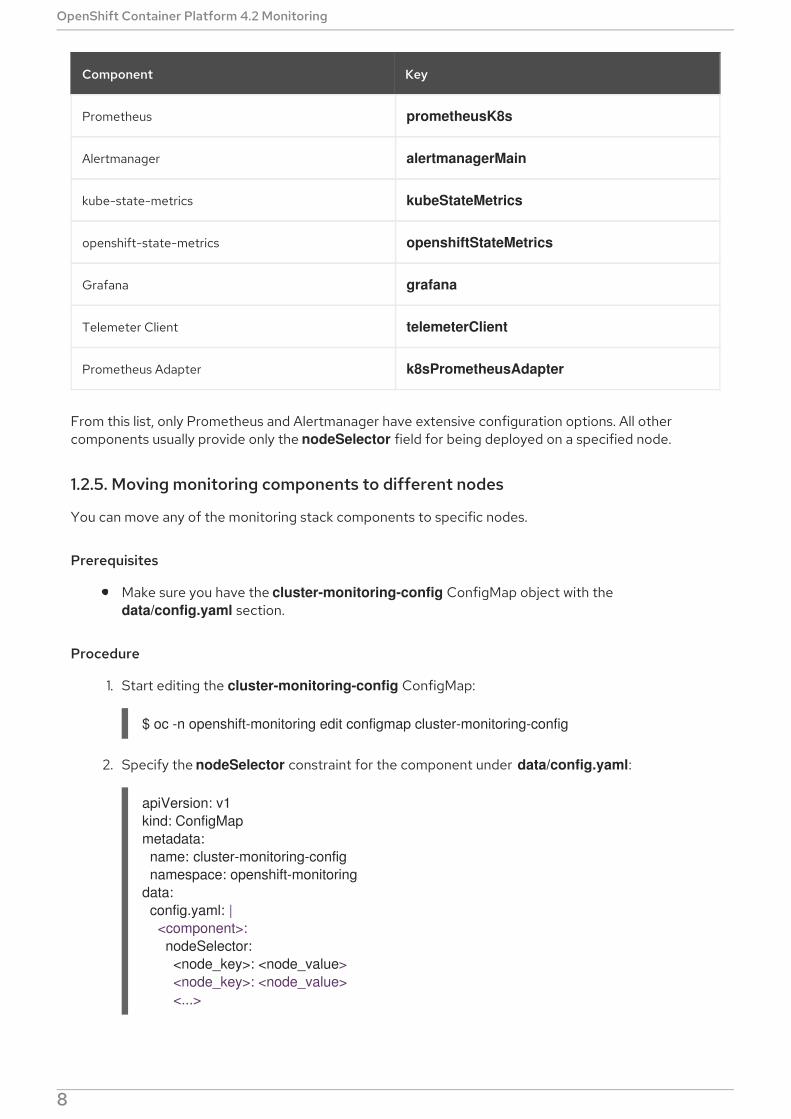
Prometheus prometheusK8s
Alertmanager alertmanagerMain
kube-state-metrics kubeStateMetrics
openshift-state-metrics openshiftStateMetrics
Grafana grafana
Telemeter Client telemeterClient
Prometheus Adapter k8sPrometheusAdapter
Component Key
From this list, only Prometheus and Alertmanager have extensive configuration options. All othercomponents usually provide only the nodeSelector field for being deployed on a specified node.
1.2.5. Moving monitoring components to different nodes
You can move any of the monitoring stack components to specific nodes.
Prerequisites
Make sure you have the cluster-monitoring-config ConfigMap object with the data/config.yaml section.
Procedure
1. Start editing the cluster-monitoring-config ConfigMap:
$ oc -n openshift-monitoring edit configmap cluster-monitoring-config
2. Specify the nodeSelector constraint for the component under data/config.yaml:
Substitute <component> accordingly and substitute <node_key>: <node_value> with the
apiVersion: v1kind: ConfigMapmetadata: name: cluster-monitoring-config namespace: openshift-monitoringdata: config.yaml: | <component>: nodeSelector: <node_key>: <node_value> <node_key>: <node_value> <...>
OpenShift Container Platform 4.2 Monitoring
8
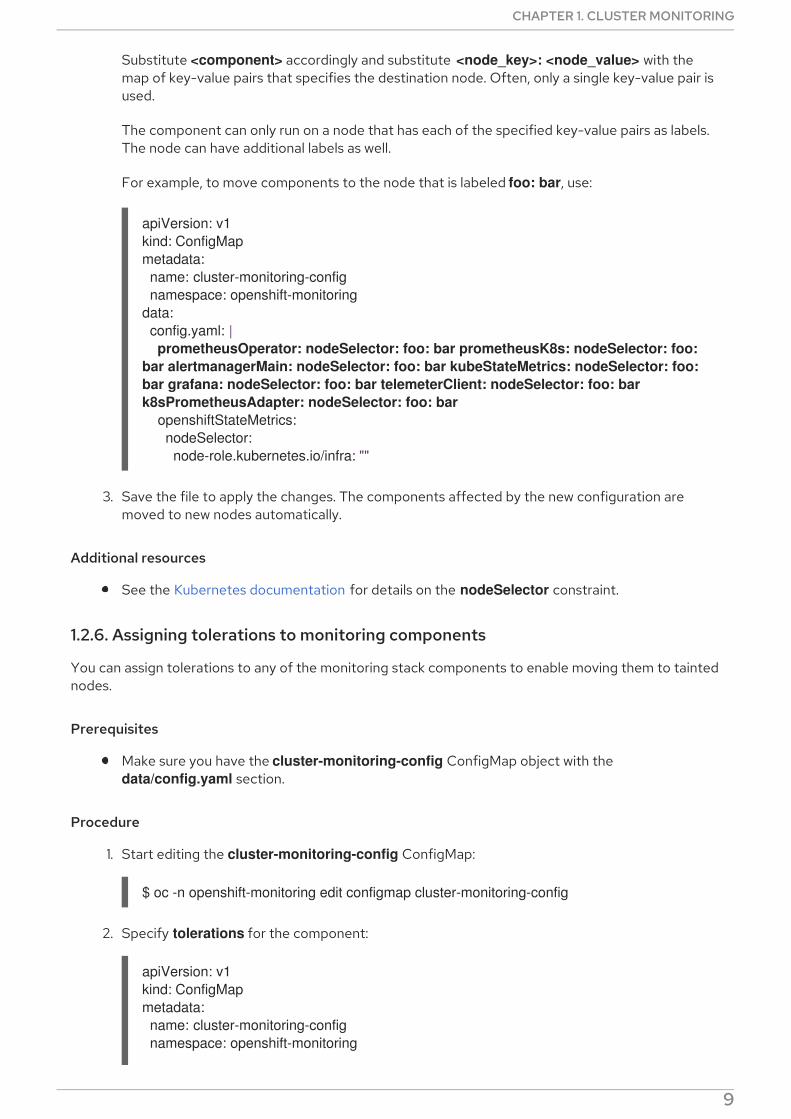
Substitute <component> accordingly and substitute <node_key>: <node_value> with themap of key-value pairs that specifies the destination node. Often, only a single key-value pair isused.
The component can only run on a node that has each of the specified key-value pairs as labels.The node can have additional labels as well.
For example, to move components to the node that is labeled foo: bar, use:
3. Save the file to apply the changes. The components affected by the new configuration aremoved to new nodes automatically.
Additional resources
See the Kubernetes documentation for details on the nodeSelector constraint.
1.2.6. Assigning tolerations to monitoring components
You can assign tolerations to any of the monitoring stack components to enable moving them to taintednodes.
Prerequisites
Make sure you have the cluster-monitoring-config ConfigMap object with the data/config.yaml section.
Procedure
1. Start editing the cluster-monitoring-config ConfigMap:
$ oc -n openshift-monitoring edit configmap cluster-monitoring-config
2. Specify tolerations for the component:
apiVersion: v1kind: ConfigMapmetadata: name: cluster-monitoring-config namespace: openshift-monitoringdata: config.yaml: | prometheusOperator: nodeSelector: foo: bar prometheusK8s: nodeSelector: foo: bar alertmanagerMain: nodeSelector: foo: bar kubeStateMetrics: nodeSelector: foo: bar grafana: nodeSelector: foo: bar telemeterClient: nodeSelector: foo: bar k8sPrometheusAdapter: nodeSelector: foo: bar openshiftStateMetrics: nodeSelector: node-role.kubernetes.io/infra: ""
apiVersion: v1kind: ConfigMapmetadata: name: cluster-monitoring-config namespace: openshift-monitoring
CHAPTER 1. CLUSTER MONITORING
9
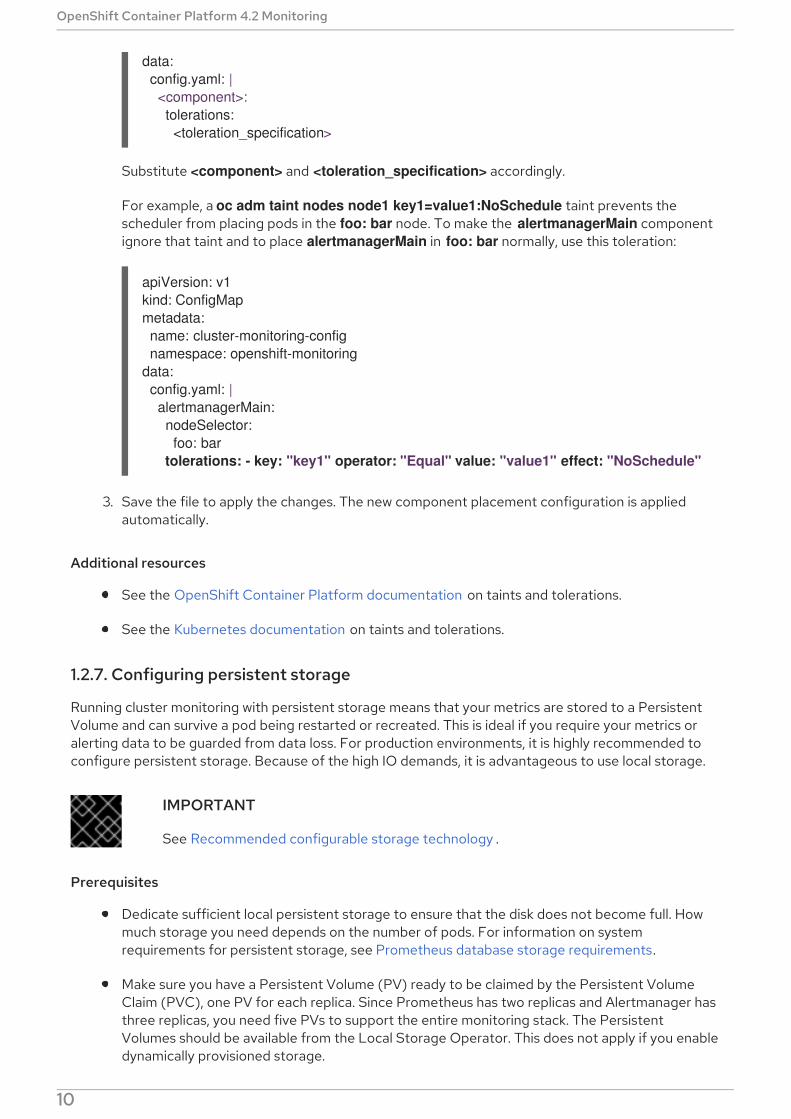
Substitute <component> and <toleration_specification> accordingly.
For example, a oc adm taint nodes node1 key1=value1:NoSchedule taint prevents thescheduler from placing pods in the foo: bar node. To make the alertmanagerMain componentignore that taint and to place alertmanagerMain in foo: bar normally, use this toleration:
3. Save the file to apply the changes. The new component placement configuration is appliedautomatically.
Additional resources
See the OpenShift Container Platform documentation on taints and tolerations.
See the Kubernetes documentation on taints and tolerations.
1.2.7. Configuring persistent storage
Running cluster monitoring with persistent storage means that your metrics are stored to a PersistentVolume and can survive a pod being restarted or recreated. This is ideal if you require your metrics oralerting data to be guarded from data loss. For production environments, it is highly recommended toconfigure persistent storage. Because of the high IO demands, it is advantageous to use local storage.
IMPORTANT
See Recommended configurable storage technology .
Prerequisites
Dedicate sufficient local persistent storage to ensure that the disk does not become full. Howmuch storage you need depends on the number of pods. For information on systemrequirements for persistent storage, see Prometheus database storage requirements.
Make sure you have a Persistent Volume (PV) ready to be claimed by the Persistent VolumeClaim (PVC), one PV for each replica. Since Prometheus has two replicas and Alertmanager hasthree replicas, you need five PVs to support the entire monitoring stack. The PersistentVolumes should be available from the Local Storage Operator. This does not apply if you enabledynamically provisioned storage.
data: config.yaml: | <component>: tolerations: <toleration_specification>
apiVersion: v1kind: ConfigMapmetadata: name: cluster-monitoring-config namespace: openshift-monitoringdata: config.yaml: | alertmanagerMain: nodeSelector: foo: bar tolerations: - key: "key1" operator: "Equal" value: "value1" effect: "NoSchedule"
OpenShift Container Platform 4.2 Monitoring
10
Use the block type of storage.
Configure local persistent storage.
1.2.7.1. Configuring a local persistent volume claim
For the Prometheus or Alertmanager to use a persistent volume (PV), you first must configure apersistent volume claim (PVC).
Prerequisites
Make sure you have the cluster-monitoring-config ConfigMap object with the data/config.yaml section.
Procedure
1. Edit the cluster-monitoring-config ConfigMap:
$ oc -n openshift-monitoring edit configmap cluster-monitoring-config
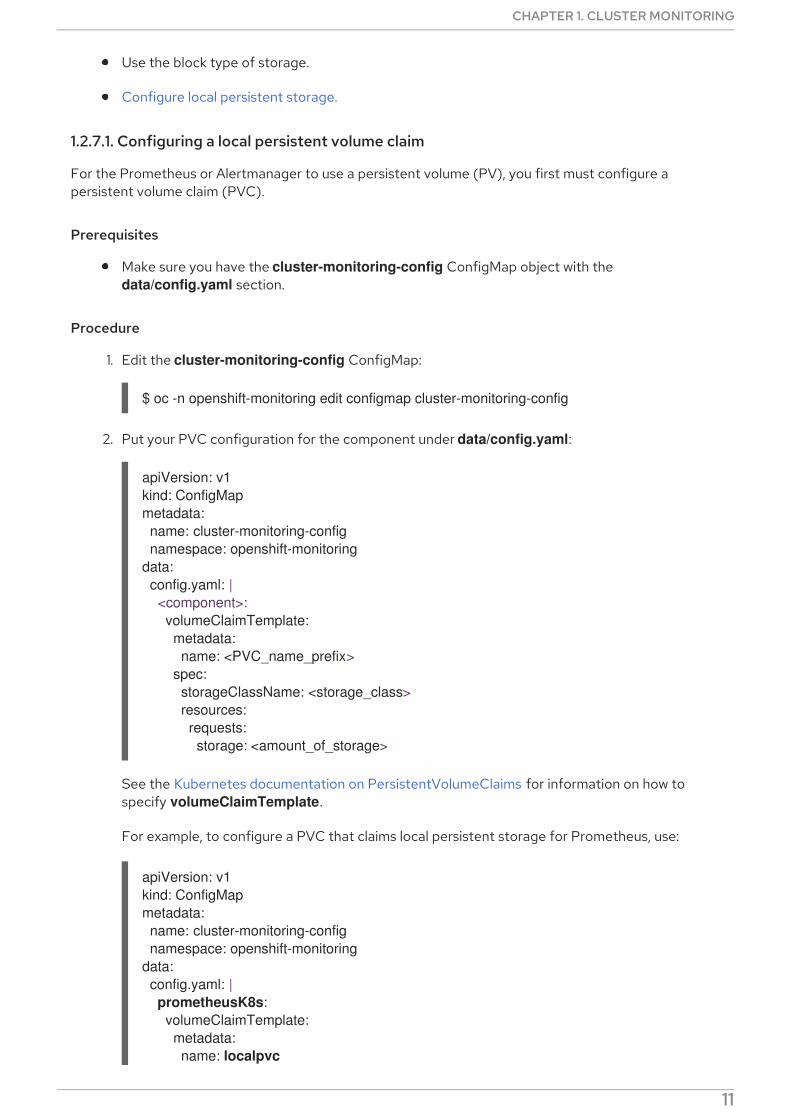
2. Put your PVC configuration for the component under data/config.yaml:
See the Kubernetes documentation on PersistentVolumeClaims for information on how tospecify volumeClaimTemplate.
For example, to configure a PVC that claims local persistent storage for Prometheus, use:
apiVersion: v1kind: ConfigMapmetadata: name: cluster-monitoring-config namespace: openshift-monitoringdata: config.yaml: | <component>: volumeClaimTemplate: metadata: name: <PVC_name_prefix> spec: storageClassName: <storage_class> resources: requests: storage: <amount_of_storage>
apiVersion: v1kind: ConfigMapmetadata: name: cluster-monitoring-config namespace: openshift-monitoringdata: config.yaml: | prometheusK8s: volumeClaimTemplate: metadata: name: localpvc
CHAPTER 1. CLUSTER MONITORING
11
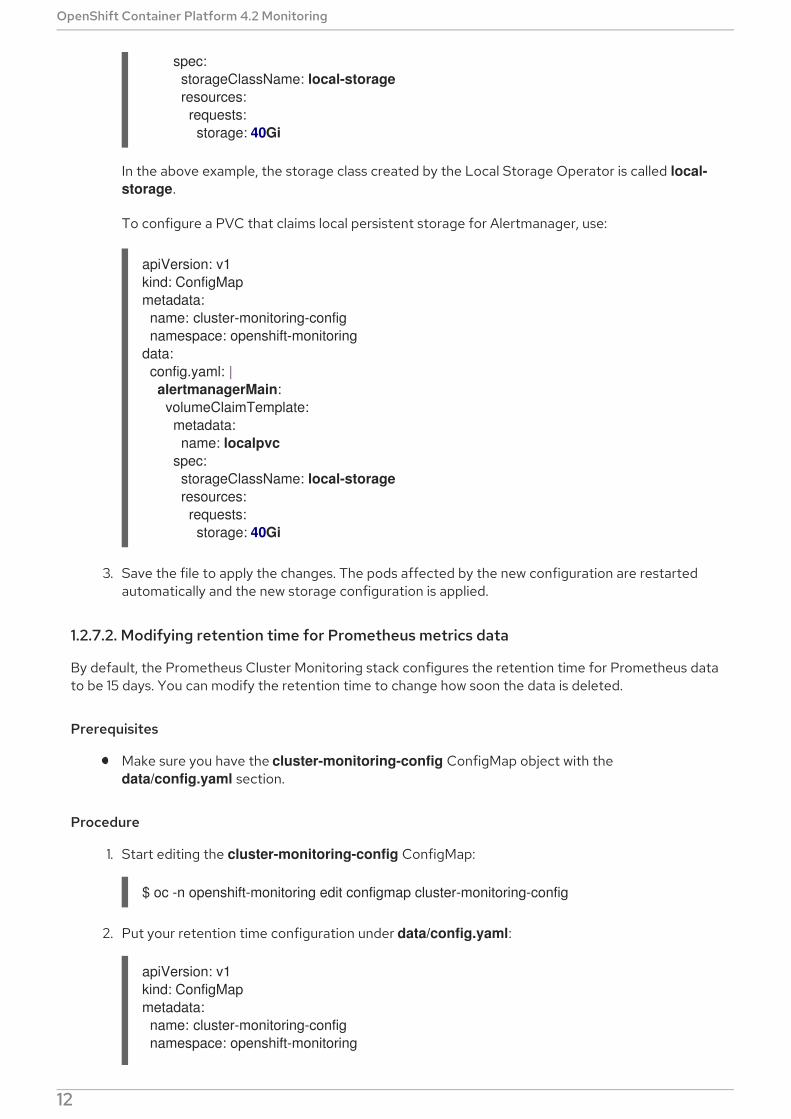
In the above example, the storage class created by the Local Storage Operator is called local-storage.
To configure a PVC that claims local persistent storage for Alertmanager, use:
3. Save the file to apply the changes. The pods affected by the new configuration are restartedautomatically and the new storage configuration is applied.
1.2.7.2. Modifying retention time for Prometheus metrics data
By default, the Prometheus Cluster Monitoring stack configures the retention time for Prometheus datato be 15 days. You can modify the retention time to change how soon the data is deleted.
Prerequisites
Make sure you have the cluster-monitoring-config ConfigMap object with the data/config.yaml section.
Procedure
1. Start editing the cluster-monitoring-config ConfigMap:
$ oc -n openshift-monitoring edit configmap cluster-monitoring-config
2. Put your retention time configuration under data/config.yaml:
spec: storageClassName: local-storage resources: requests: storage: 40Gi
apiVersion: v1kind: ConfigMapmetadata: name: cluster-monitoring-config namespace: openshift-monitoringdata: config.yaml: | alertmanagerMain: volumeClaimTemplate: metadata: name: localpvc spec: storageClassName: local-storage resources: requests: storage: 40Gi
apiVersion: v1kind: ConfigMapmetadata: name: cluster-monitoring-config namespace: openshift-monitoring
OpenShift Container Platform 4.2 Monitoring
12
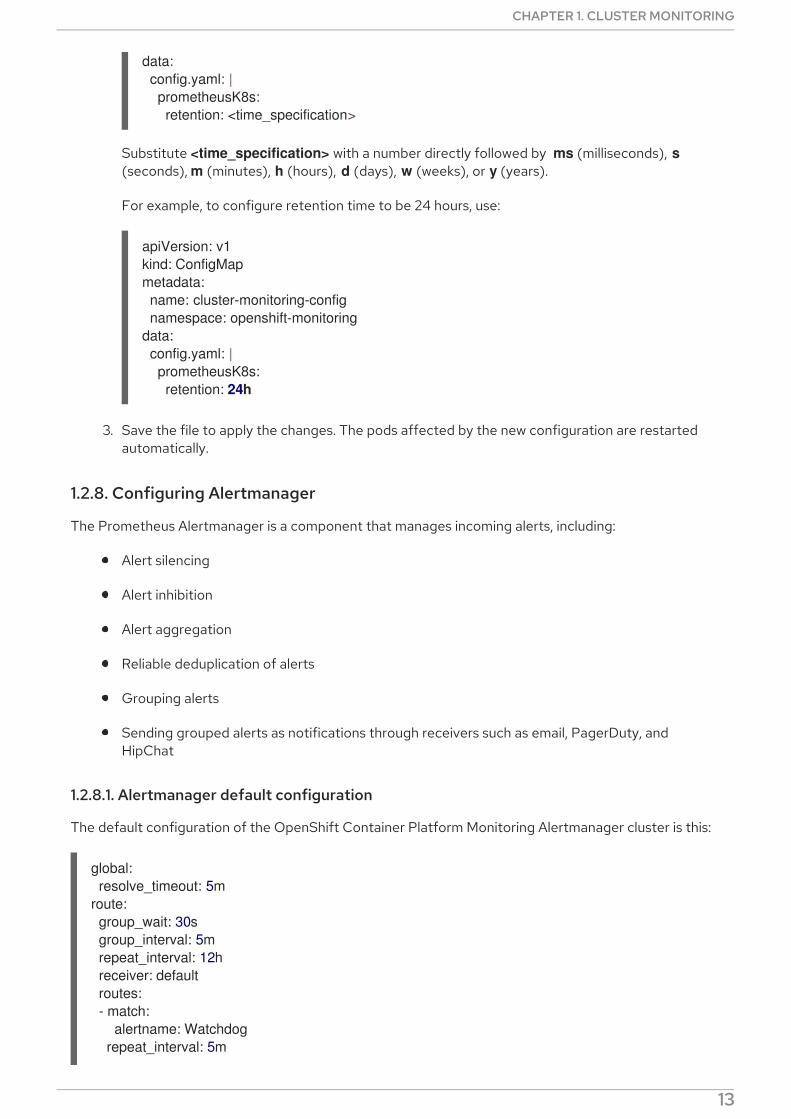
Substitute <time_specification> with a number directly followed by ms (milliseconds), s(seconds), m (minutes), h (hours), d (days), w (weeks), or y (years).
For example, to configure retention time to be 24 hours, use:
3. Save the file to apply the changes. The pods affected by the new configuration are restartedautomatically.
1.2.8. Configuring Alertmanager
The Prometheus Alertmanager is a component that manages incoming alerts, including:
Alert silencing
Alert inhibition
Alert aggregation
Reliable deduplication of alerts
Grouping alerts
Sending grouped alerts as notifications through receivers such as email, PagerDuty, andHipChat
1.2.8.1. Alertmanager default configuration
The default configuration of the OpenShift Container Platform Monitoring Alertmanager cluster is this:
data: config.yaml: | prometheusK8s: retention: <time_specification>
apiVersion: v1kind: ConfigMapmetadata: name: cluster-monitoring-config namespace: openshift-monitoringdata: config.yaml: | prometheusK8s: retention: 24h
global: resolve_timeout: 5mroute: group_wait: 30s group_interval: 5m repeat_interval: 12h receiver: default routes: - match: alertname: Watchdog repeat_interval: 5m
CHAPTER 1. CLUSTER MONITORING
13
1
OpenShift Container Platform monitoring ships with the Watchdog alert, which fires continuously.Alertmanager repeatedly sends notifications for the Watchdog alert to the notification provider, forexample, to PagerDuty. The provider is usually configured to notify the administrator when it stopsreceiving the Watchdog alert. This mechanism helps ensure continuous operation of Prometheus as wellas continuous communication between Alertmanager and the notification provider.
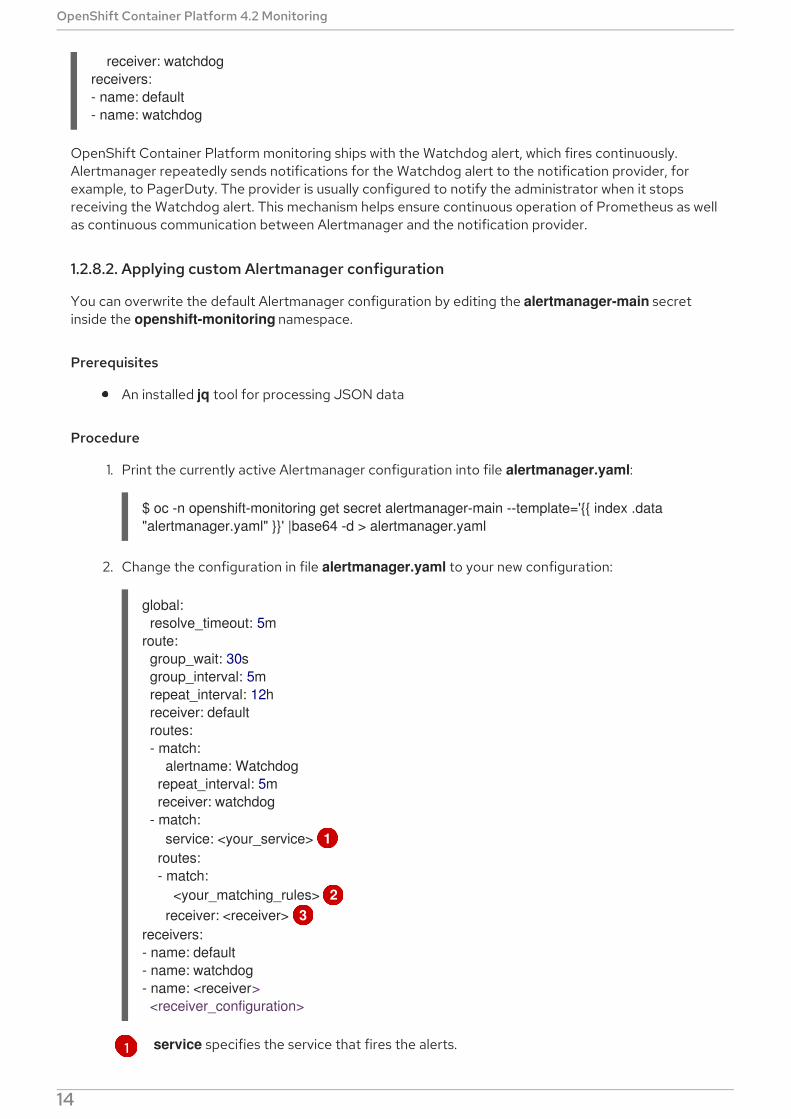
1.2.8.2. Applying custom Alertmanager configuration
You can overwrite the default Alertmanager configuration by editing the alertmanager-main secretinside the openshift-monitoring namespace.
Prerequisites
An installed jq tool for processing JSON data
Procedure
1. Print the currently active Alertmanager configuration into file alertmanager.yaml:
$ oc -n openshift-monitoring get secret alertmanager-main --template='{{ index .data "alertmanager.yaml" }}' |base64 -d > alertmanager.yaml
2. Change the configuration in file alertmanager.yaml to your new configuration:
service specifies the service that fires the alerts.
receiver: watchdogreceivers:- name: default- name: watchdog
global: resolve_timeout: 5mroute: group_wait: 30s group_interval: 5m repeat_interval: 12h receiver: default routes: - match: alertname: Watchdog repeat_interval: 5m receiver: watchdog - match: service: <your_service> 1 routes: - match: <your_matching_rules> 2 receiver: <receiver> 3receivers:- name: default- name: watchdog- name: <receiver> <receiver_configuration>
OpenShift Container Platform 4.2 Monitoring
14
2
3
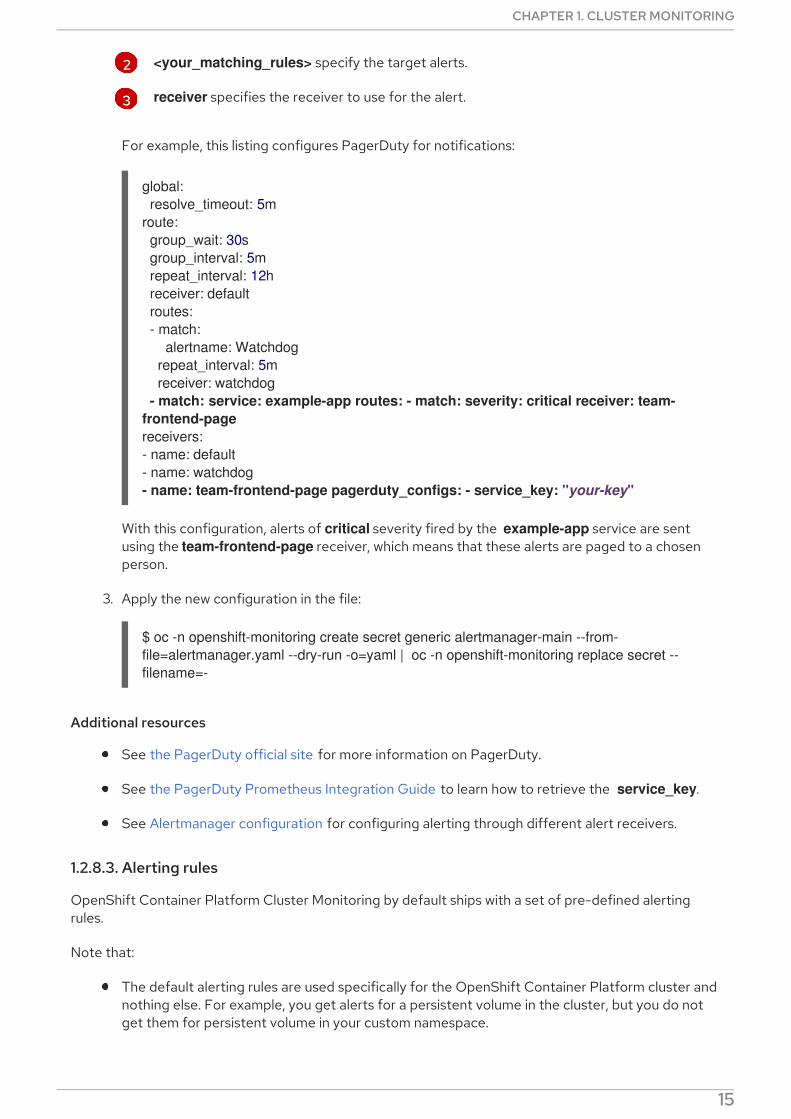
<your_matching_rules> specify the target alerts.
receiver specifies the receiver to use for the alert.
For example, this listing configures PagerDuty for notifications:
With this configuration, alerts of critical severity fired by the example-app service are sentusing the team-frontend-page receiver, which means that these alerts are paged to a chosenperson.
3. Apply the new configuration in the file:
$ oc -n openshift-monitoring create secret generic alertmanager-main --from-file=alertmanager.yaml --dry-run -o=yaml | oc -n openshift-monitoring replace secret --filename=-
Additional resources
See the PagerDuty official site for more information on PagerDuty.
See the PagerDuty Prometheus Integration Guide to learn how to retrieve the service_key.
See Alertmanager configuration for configuring alerting through different alert receivers.
1.2.8.3. Alerting rules
OpenShift Container Platform Cluster Monitoring by default ships with a set of pre-defined alertingrules.
Note that:
The default alerting rules are used specifically for the OpenShift Container Platform cluster andnothing else. For example, you get alerts for a persistent volume in the cluster, but you do notget them for persistent volume in your custom namespace.
global: resolve_timeout: 5mroute: group_wait: 30s group_interval: 5m repeat_interval: 12h receiver: default routes: - match: alertname: Watchdog repeat_interval: 5m receiver: watchdog - match: service: example-app routes: - match: severity: critical receiver: team-frontend-pagereceivers:- name: default- name: watchdog- name: team-frontend-page pagerduty_configs: - service_key: "your-key"
CHAPTER 1. CLUSTER MONITORING
15
Currently you cannot add custom alerting rules.
Some alerting rules have identical names. This is intentional. They are sending alerts about thesame event with different thresholds, with different severity, or both.
With the inhibition rules, the lower severity is inhibited when the higher severity is firing.
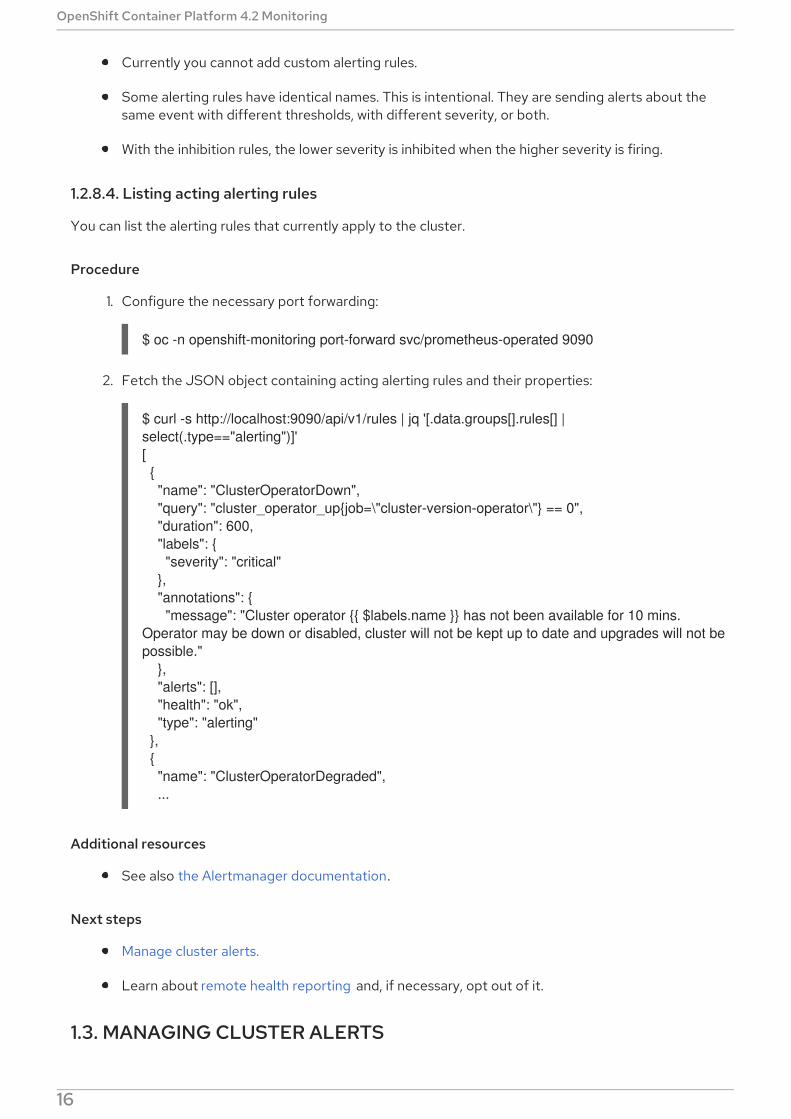
1.2.8.4. Listing acting alerting rules
You can list the alerting rules that currently apply to the cluster.
Procedure
1. Configure the necessary port forwarding:
$ oc -n openshift-monitoring port-forward svc/prometheus-operated 9090
2. Fetch the JSON object containing acting alerting rules and their properties:
$ curl -s http://localhost:9090/api/v1/rules | jq '[.data.groups[].rules[] | select(.type=="alerting")]'[ { "name": "ClusterOperatorDown", "query": "cluster_operator_up{job=\"cluster-version-operator\"} == 0", "duration": 600, "labels": { "severity": "critical" }, "annotations": { "message": "Cluster operator {{ $labels.name }} has not been available for 10 mins. Operator may be down or disabled, cluster will not be kept up to date and upgrades will not be possible." }, "alerts": [], "health": "ok", "type": "alerting" }, { "name": "ClusterOperatorDegraded", ...
Additional resources
See also the Alertmanager documentation.
Next steps
Manage cluster alerts.
Learn about remote health reporting and, if necessary, opt out of it.
1.3. MANAGING CLUSTER ALERTS
OpenShift Container Platform 4.2 Monitoring
16
OpenShift Container Platform 4.2 provides a web interface to the Alertmanager, which enables you tomanage alerts. This section demonstrates how to use the Alerting UI.
1.3.1. Contents of the Alerting UI
This section shows and explains the contents of the Alerting UI, a web interface to the Alertmanager.
The main three pages of the Alerting UI are the Alerts, the Silences, and the YAML pages.
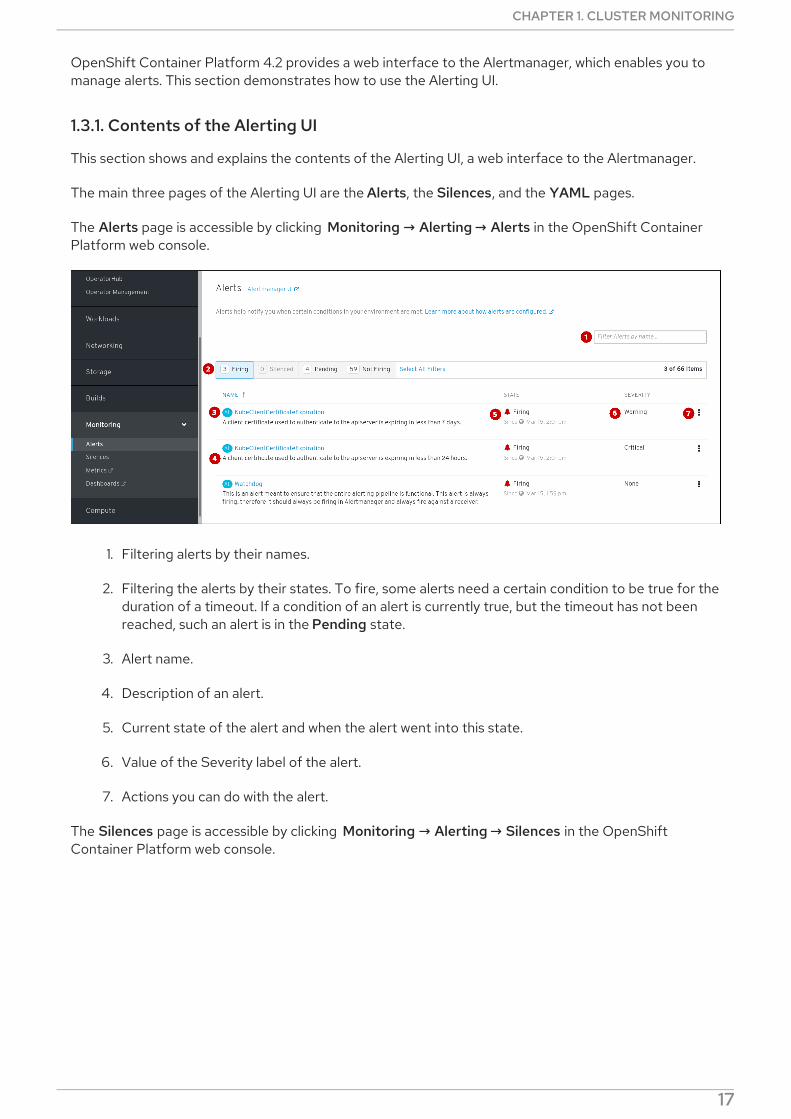
The Alerts page is accessible by clicking Monitoring → Alerting → Alerts in the OpenShift ContainerPlatform web console.
1. Filtering alerts by their names.
2. Filtering the alerts by their states. To fire, some alerts need a certain condition to be true for theduration of a timeout. If a condition of an alert is currently true, but the timeout has not beenreached, such an alert is in the Pending state.
3. Alert name.
4. Description of an alert.
5. Current state of the alert and when the alert went into this state.
6. Value of the Severity label of the alert.
7. Actions you can do with the alert.
The Silences page is accessible by clicking Monitoring → Alerting → Silences in the OpenShiftContainer Platform web console.
CHAPTER 1. CLUSTER MONITORING
17
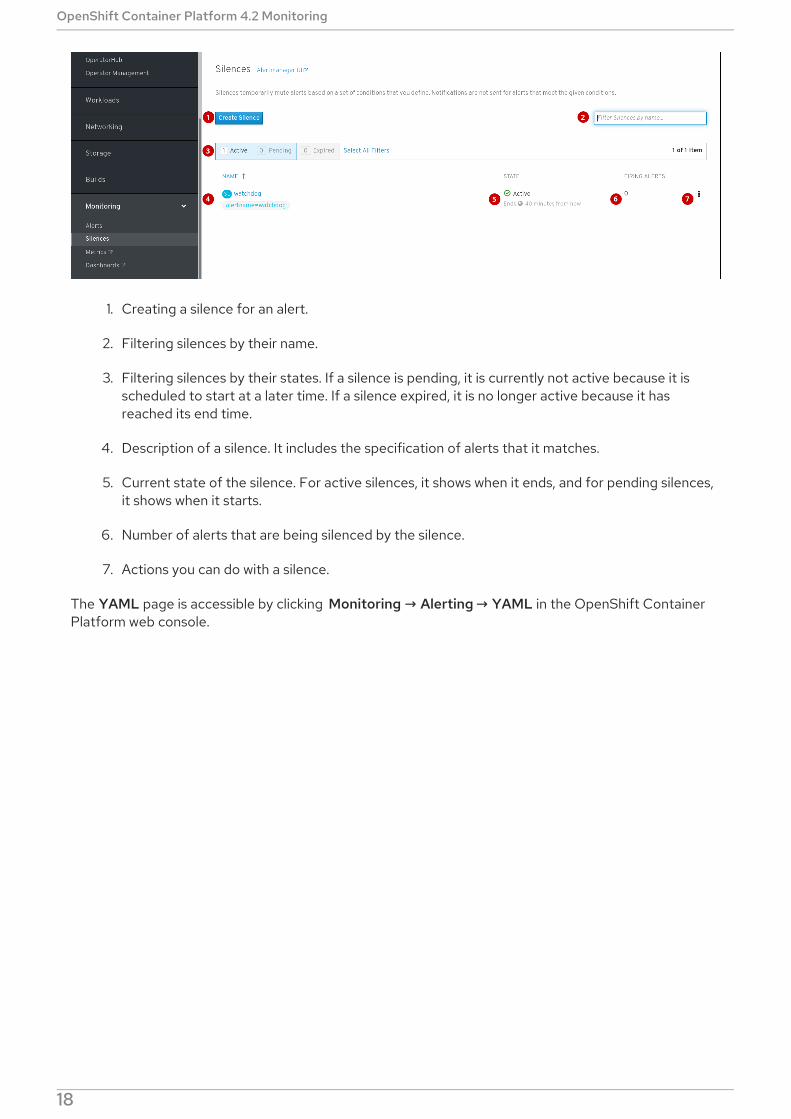
1. Creating a silence for an alert.
2. Filtering silences by their name.
3. Filtering silences by their states. If a silence is pending, it is currently not active because it isscheduled to start at a later time. If a silence expired, it is no longer active because it hasreached its end time.
4. Description of a silence. It includes the specification of alerts that it matches.
5. Current state of the silence. For active silences, it shows when it ends, and for pending silences,it shows when it starts.
6. Number of alerts that are being silenced by the silence.
7. Actions you can do with a silence.
The YAML page is accessible by clicking Monitoring → Alerting → YAML in the OpenShift ContainerPlatform web console.
OpenShift Container Platform 4.2 Monitoring
18
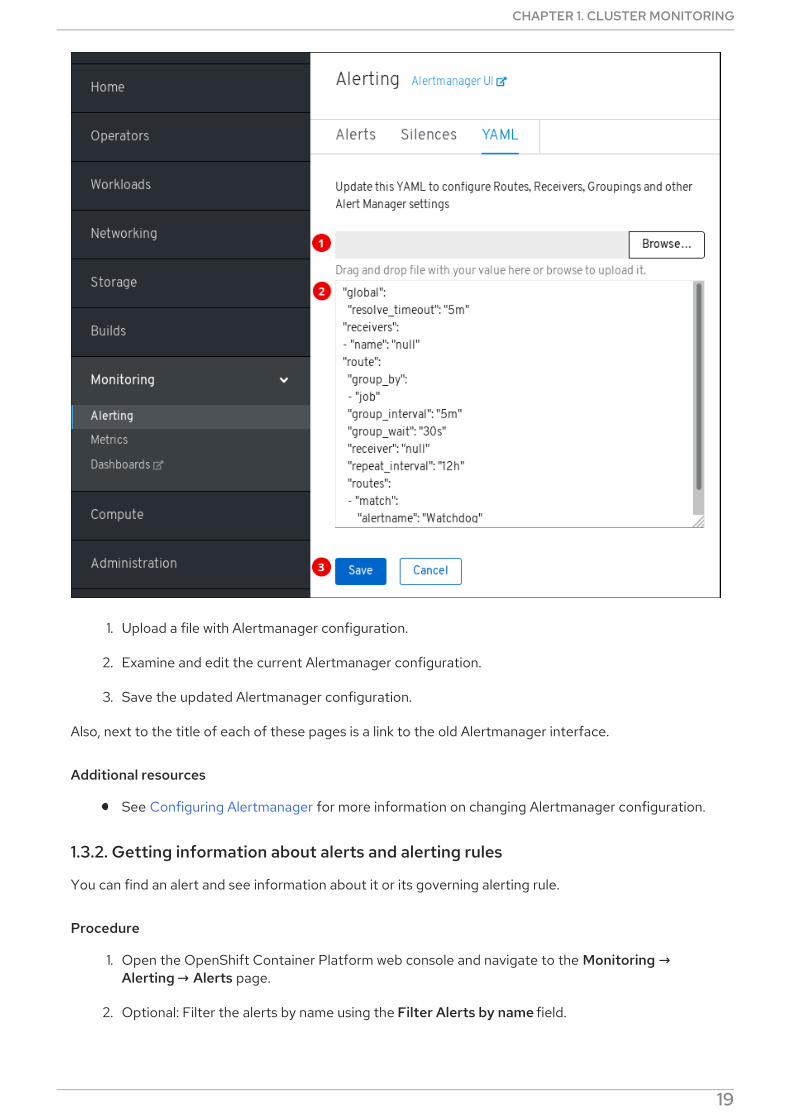
1. Upload a file with Alertmanager configuration.
2. Examine and edit the current Alertmanager configuration.
3. Save the updated Alertmanager configuration.
Also, next to the title of each of these pages is a link to the old Alertmanager interface.
Additional resources
See Configuring Alertmanager for more information on changing Alertmanager configuration.
1.3.2. Getting information about alerts and alerting rules
You can find an alert and see information about it or its governing alerting rule.
Procedure
1. Open the OpenShift Container Platform web console and navigate to the Monitoring →Alerting → Alerts page.
2. Optional: Filter the alerts by name using the Filter Alerts by name field.
3. Optional: Filter the alerts by state using one or more of the state buttons Firing, Silenced,
CHAPTER 1. CLUSTER MONITORING
19
3. Optional: Filter the alerts by state using one or more of the state buttons Firing, Silenced,Pending, Not firing.
4. Optional: Sort the alerts by clicking one or more of the Name, State, and Severity columnheaders.
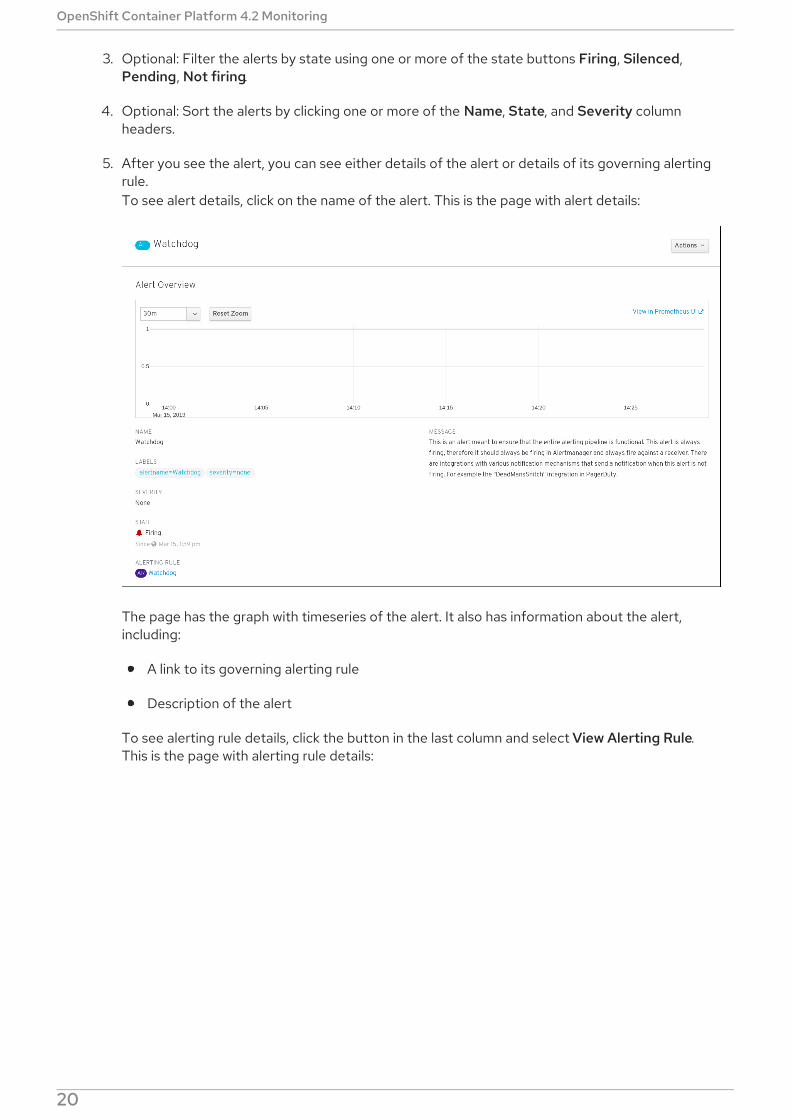
5. After you see the alert, you can see either details of the alert or details of its governing alertingrule.To see alert details, click on the name of the alert. This is the page with alert details:
The page has the graph with timeseries of the alert. It also has information about the alert,including:
A link to its governing alerting rule
Description of the alert
To see alerting rule details, click the button in the last column and select View Alerting Rule.This is the page with alerting rule details:
OpenShift Container Platform 4.2 Monitoring
20
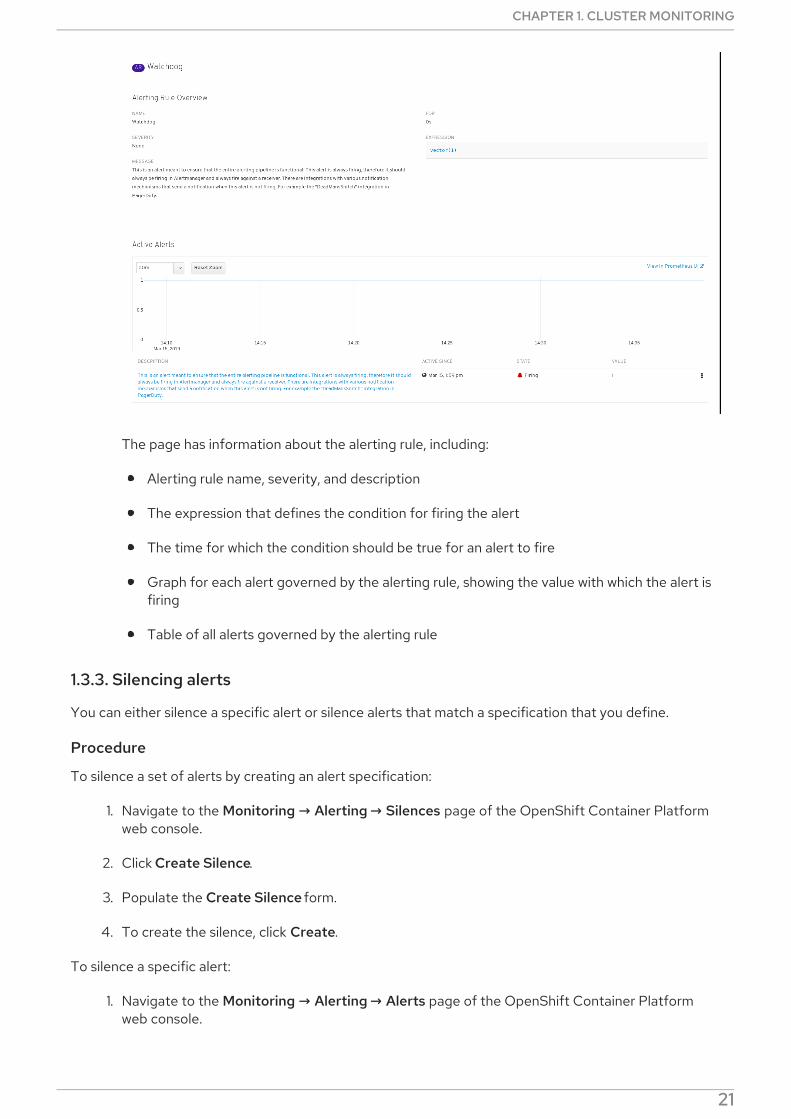
The page has information about the alerting rule, including:
Alerting rule name, severity, and description
The expression that defines the condition for firing the alert
The time for which the condition should be true for an alert to fire
Graph for each alert governed by the alerting rule, showing the value with which the alert isfiring
Table of all alerts governed by the alerting rule
1.3.3. Silencing alerts
You can either silence a specific alert or silence alerts that match a specification that you define.
Procedure
To silence a set of alerts by creating an alert specification:
1. Navigate to the Monitoring → Alerting → Silences page of the OpenShift Container Platformweb console.
2. Click Create Silence.
3. Populate the Create Silence form.
4. To create the silence, click Create.
To silence a specific alert:
1. Navigate to the Monitoring → Alerting → Alerts page of the OpenShift Container Platformweb console.
2. For the alert that you want to silence, click the button in the last column and click Silence Alert.
CHAPTER 1. CLUSTER MONITORING
21
2. For the alert that you want to silence, click the button in the last column and click Silence Alert.The Create Silence form will appear with prepopulated specification of the chosen alert.
3. Optional: Modify the silence.
4. To create the silence, click Create.
1.3.4. Getting information about silences
You can find a silence and view its details.
Procedure
1. Open the OpenShift Container Platform web console and navigate to the Monitoring →Alerting → Silences page.
2. Optional: Filter the silences by name using the Filter Silences by name field.
3. Optional: Filter the silences by state using one or more of the state buttons Active, Pending,Expired.
4. Optional: Sort the silences by clicking one or more of the Name, State, and Firing alerts columnheaders.
5. After you see the silence, you can click its name to see the details, including:
Alert specification
State
Start time
End time
Number and list of firing alerts
1.3.5. Editing silences
You can edit a silence, which will expire the existing silence and create a new silence with the changedconfiguration.
Procedure
1. Navigate to the Monitoring → Alerting → Silences page.
2. For the silence you want to modify, click the button in the last column and click Edit silence.Alternatively, you can click Actions → Edit Silence in the Silence Overview screen for aparticular silence.
3. In the Edit Silence screen, enter your changes and click the Save button. This will expire theexisting silence and create one with the chosen configuration.
1.3.6. Expiring silences
You can expire a silence. Expiring a silence deactivates it forever.
OpenShift Container Platform 4.2 Monitoring
22
Procedure
1. Navigate to the Monitoring → Alerting → Silences page.
2. For the silence you want to expire, click the button in the last column and click Expire Silence.Alternatively, you can click the Actions → Expire Silence button in the Silence Overview pagefor a particular silence.
3. Confirm by clicking Expire Silence. This expires the silence.
Next steps
Examine cluster metrics.
1.4. EXAMINING CLUSTER METRICS
OpenShift Container Platform 4.2 provides a web interface to Prometheus, which enables you to runPrometheus Query Language (PromQL) queries and examine the metrics visualized on a plot. Thisfunctionality provides an extensive overview of the cluster state and enables you to troubleshootproblems.
1.4.1. Contents of the Metrics UI
This section shows and explains the contents of the Metrics UI, a web interface to Prometheus.
The Metrics page is accessible by clicking Monitoring → Metrics in the OpenShift Container Platformweb console.
CHAPTER 1. CLUSTER MONITORING
23
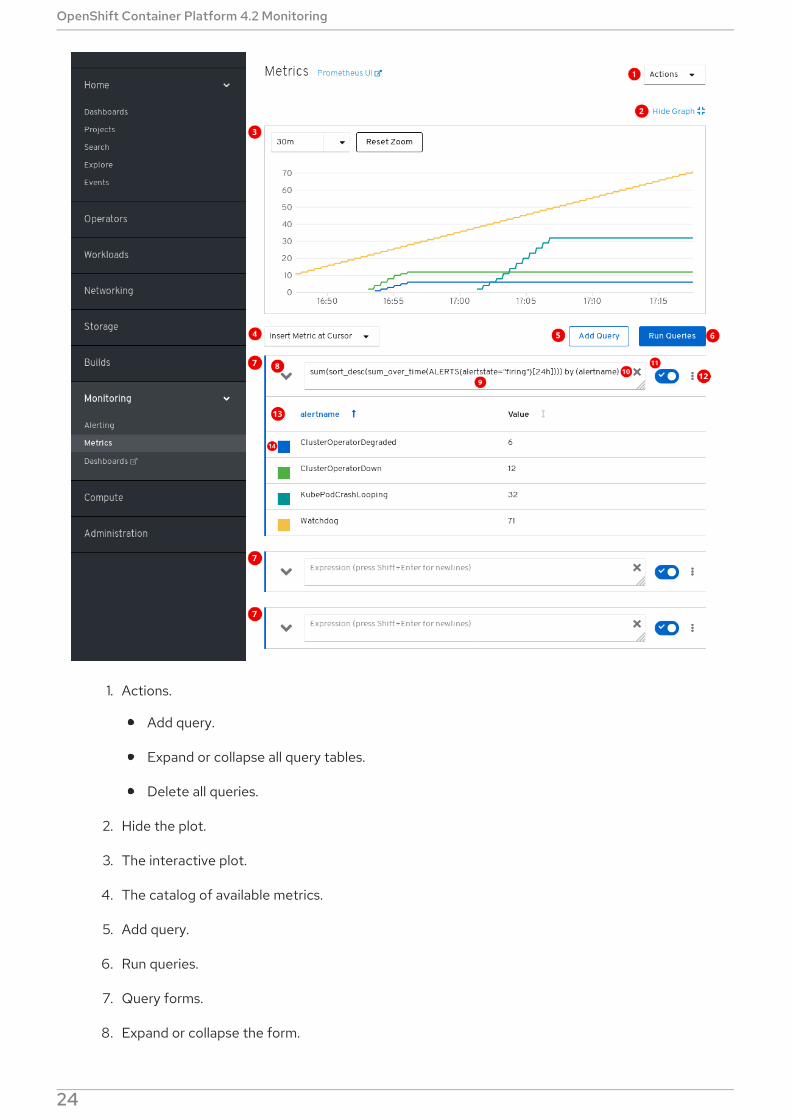
1. Actions.
Add query.
Expand or collapse all query tables.
Delete all queries.
2. Hide the plot.
3. The interactive plot.
4. The catalog of available metrics.
5. Add query.
6. Run queries.
7. Query forms.
8. Expand or collapse the form.
OpenShift Container Platform 4.2 Monitoring
24
9. The query.
10. Clear query.
11. Enable or disable query.
12. Actions for a specific query.
Enable or disable query.
Show or hide all series of the query from the plot.
Delete query.
13. The metrics table for a query.
14. Color assigned to the graph of the metric. Clicking the square shows or hides the metric’s graph.
Additionally, there is a link to the old Prometheus interface next to the title of the page.
1.4.2. Running metrics queries
You begin working with metrics by entering one or several Prometheus Query Language (PromQL)queries.
Procedure
1. Open the OpenShift Container Platform web console and navigate to the Monitoring →Metrics page.
2. In the query field, enter your PromQL query.
To show all available metrics and PromQL functions, click Insert Metric at Cursor.
3. For multiple queries, click Add Query.
4. For deleting queries, click for the query, then select Delete query.
5. For keeping but not running a query, click the Disable query button.
6. Once you finish creating queries, click the Run Queries button. The metrics from the queriesare visualized on the plot. If a query is invalid, the UI shows an error message.
NOTE
Queries that operate on large amounts of data might timeout or overload thebrowser when drawing timeseries graphs. To avoid this, hide the graph andcalibrate your query using only the metrics table. Then, after finding a feasiblequery, enable the plot to draw the graphs.
7. Optional: The page URL now contains the queries you ran. To use this set of queries again in thefuture, save this URL.
Additional resources
CHAPTER 1. CLUSTER MONITORING
25
See the Prometheus Query Language documentation.
1.4.3. Exploring the visualized metrics
After running the queries, the metrics are displayed on the interactive plot. The X axis of the plotrepresents time. The Y axis represents the metrics values. Each metric is shown as a colored graph. Youcan manipulate the plot and explore the metrics.
Procedure
1. Initially, all metrics from all enabled queries are shown on the plot. You can select which metricsare shown.
To hide all metrics from a query, click for the query and click Hide all series.
To hide a specific metric, go to the query table and click the colored square near the metricname.
2. To zoom into the plot and change the shown time range, do one of the following:
Visually select the time range by clicking and dragging on the plot horizontally.
Use the menu in the left upper corner to select the time range.
To reset the time range, click Reset Zoom.
3. To display outputs of all queries at a specific point in time, hold the mouse cursor on the plot atthat point. The query outputs will appear in a pop-up box.
4. For more detailed information about metrics of a specific query, expand the table of that queryusing the drop-down button. Every metric is shown with its current value.
5. To hide the plot, click Hide Graph.
Next steps
Access the Prometheus, Alertmanager, and Grafana.
1.5. ACCESSING PROMETHEUS, ALERTMANAGER, AND GRAFANA
To work with data gathered by the monitoring stack, you might want to use the Prometheus,Alertmanager, and Grafana interfaces. They are available by default.
1.5.1. Accessing Prometheus, Alerting UI, and Grafana using the web console
You can access Prometheus, Alerting, and Grafana web UIs using a web browser through the OpenShiftContainer Platform web console.
NOTE
The Alerting UI accessed in this procedure is the new interface for Alertmanager.
Prerequisites
Authentication is performed against the OpenShift Container Platform identity and uses the
OpenShift Container Platform 4.2 Monitoring
26
Authentication is performed against the OpenShift Container Platform identity and uses thesame credentials or means of authentication as is used elsewhere in OpenShift ContainerPlatform. You must use a role that has read access to all namespaces, such as the cluster-monitoring-view cluster role.
Procedure
1. Navigate to the OpenShift Container Platform web console and authenticate.
2. To access Prometheus, navigate to the "Monitoring" → "Metrics" page.To access the Alerting UI, navigate to the "Monitoring" → "Alerting" page.
To access Grafana, navigate to the "Monitoring" → "Dashboards" page.
1.5.2. Accessing Prometheus, Alertmanager, and Grafana directly
You can access Prometheus, Alertmanager, and Grafana web UIs using the oc tool and a web browser.
NOTE
The Alertmanager UI accessed in this procedure is the old interface for Alertmanager.
Prerequisites
Authentication is performed against the OpenShift Container Platform identity and uses thesame credentials or means of authentication as is used elsewhere in OpenShift ContainerPlatform. You must use a role that has read access to all namespaces, such as the cluster-monitoring-view cluster role.
Procedure
1. Run:
$ oc -n openshift-monitoring get routesNAME HOST/PORT ...alertmanager-main alertmanager-main-openshift-monitoring.apps._url_.openshift.com ...grafana grafana-openshift-monitoring.apps._url_.openshift.com ...prometheus-k8s prometheus-k8s-openshift-monitoring.apps._url_.openshift.com ...
2. Prepend https:// to the address, you cannot access web UIs using unencrypted connection.For example, this is the resulting URL for Alertmanager:
https://alertmanager-main-openshift-monitoring.apps._url_.openshift.com
3. Navigate to the address using a web browser and authenticate.
Additional resources
For documentation on the new interface for Alertmanager, see Managing cluster alerts.
CHAPTER 1. CLUSTER MONITORING
27
CHAPTER 2. EXPOSING CUSTOM APPLICATION METRICSFOR AUTOSCALING
You can export custom application metrics for the horizontal pod autoscaler.
IMPORTANT
Prometheus Adapter is a Technology Preview feature only. Technology Preview featuresare not supported with Red Hat production service level agreements (SLAs) and mightnot be functionally complete. Red Hat does not recommend using them in production.These features provide early access to upcoming product features, enabling customersto test functionality and provide feedback during the development process.
For more information about the support scope of Red Hat Technology Preview features,see https://access.redhat.com/support/offerings/techpreview/.
2.1. EXPOSING CUSTOM APPLICATION METRICS FOR HORIZONTALPOD AUTOSCALING
You can use the prometheus-adapter resource to expose custom application metrics for the horizontalpod autoscaler.
Prerequisites
Make sure you have a custom Prometheus instance installed. In this example, it is presumed thatPrometheus was installed in the default namespace.
Make sure you configured monitoring for your application. In this example, it is presumed thatthe application and the service monitor for it were installed in the default namespace.
Procedure
1. Create a YAML file for your configuration. In this example, it is called deploy.yaml.
2. Add configuration for creating the service account, necessary roles, and role bindings for prometheus-adapter:
kind: ServiceAccountapiVersion: v1metadata: name: custom-metrics-apiserver namespace: default---apiVersion: rbac.authorization.k8s.io/v1kind: ClusterRolemetadata: name: custom-metrics-server-resourcesrules:- apiGroups: - custom.metrics.k8s.io resources: ["*"] verbs: ["*"]---apiVersion: rbac.authorization.k8s.io/v1
OpenShift Container Platform 4.2 Monitoring
28
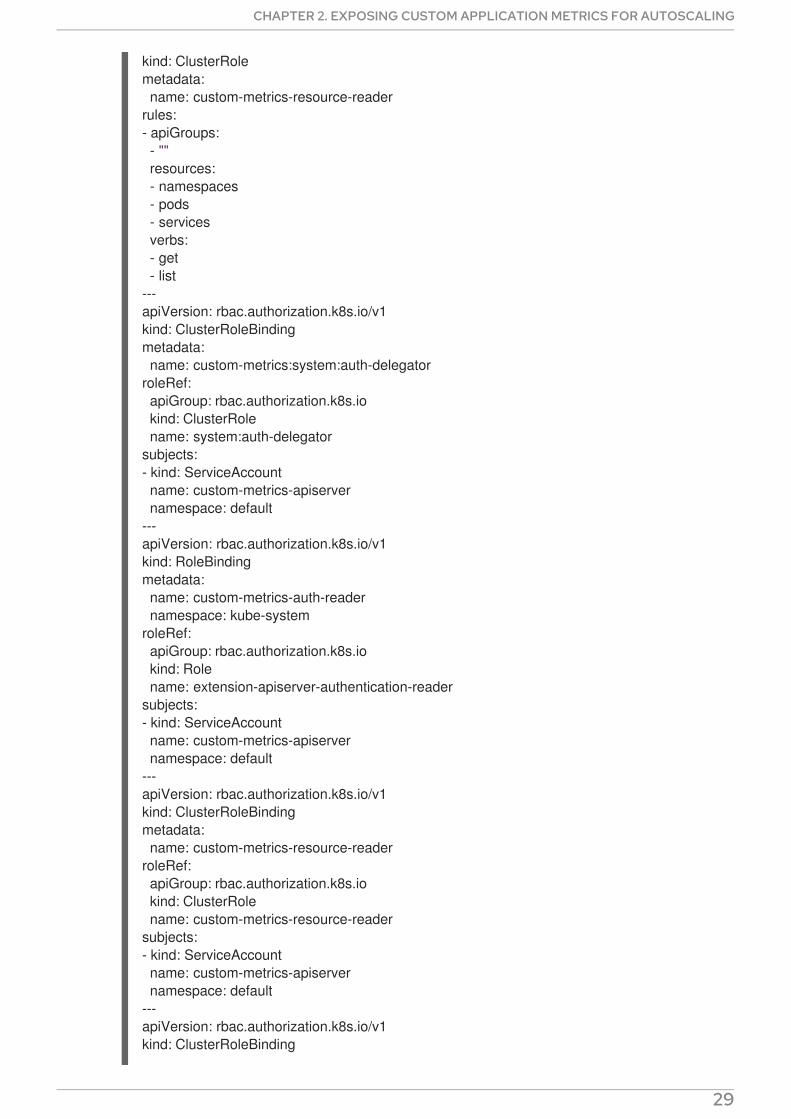
kind: ClusterRolemetadata: name: custom-metrics-resource-readerrules:- apiGroups: - "" resources: - namespaces - pods - services verbs: - get - list---apiVersion: rbac.authorization.k8s.io/v1kind: ClusterRoleBindingmetadata: name: custom-metrics:system:auth-delegatorroleRef: apiGroup: rbac.authorization.k8s.io kind: ClusterRole name: system:auth-delegatorsubjects:- kind: ServiceAccount name: custom-metrics-apiserver namespace: default---apiVersion: rbac.authorization.k8s.io/v1kind: RoleBindingmetadata: name: custom-metrics-auth-reader namespace: kube-systemroleRef: apiGroup: rbac.authorization.k8s.io kind: Role name: extension-apiserver-authentication-readersubjects:- kind: ServiceAccount name: custom-metrics-apiserver namespace: default---apiVersion: rbac.authorization.k8s.io/v1kind: ClusterRoleBindingmetadata: name: custom-metrics-resource-readerroleRef: apiGroup: rbac.authorization.k8s.io kind: ClusterRole name: custom-metrics-resource-readersubjects:- kind: ServiceAccount name: custom-metrics-apiserver namespace: default---apiVersion: rbac.authorization.k8s.io/v1kind: ClusterRoleBinding
CHAPTER 2. EXPOSING CUSTOM APPLICATION METRICS FOR AUTOSCALING
29
1
2
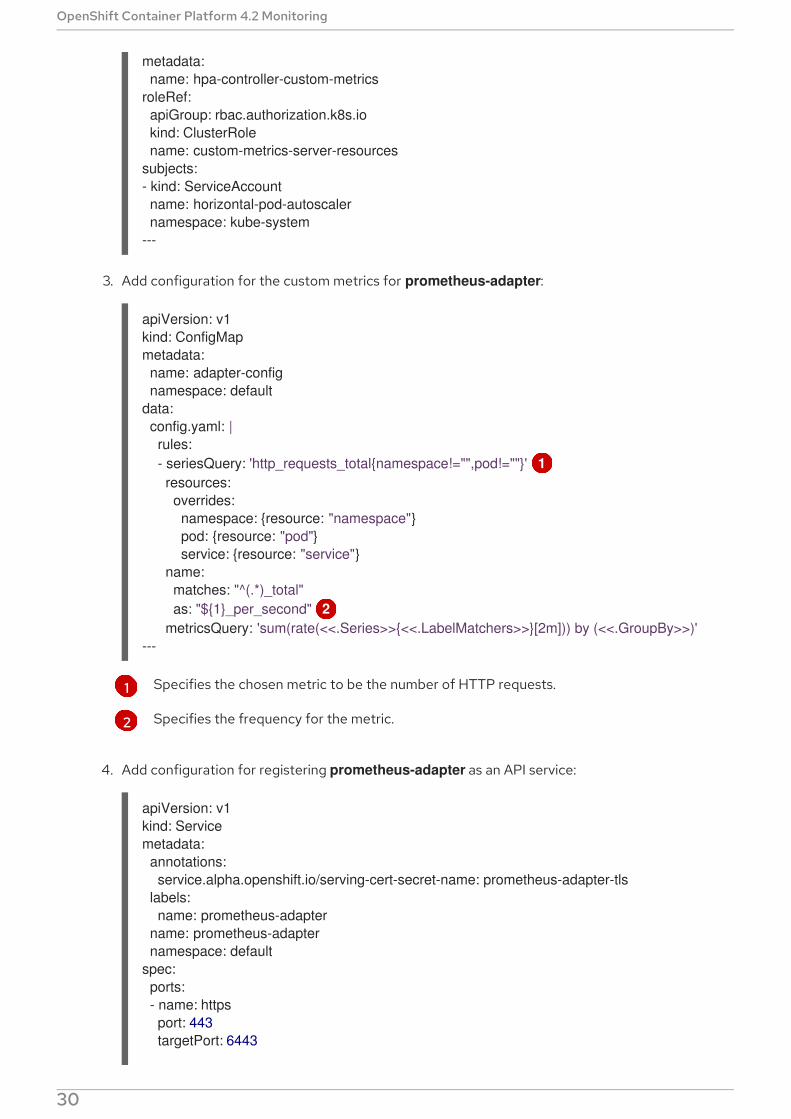
3. Add configuration for the custom metrics for prometheus-adapter:
Specifies the chosen metric to be the number of HTTP requests.
Specifies the frequency for the metric.
4. Add configuration for registering prometheus-adapter as an API service:
metadata: name: hpa-controller-custom-metricsroleRef: apiGroup: rbac.authorization.k8s.io kind: ClusterRole name: custom-metrics-server-resourcessubjects:- kind: ServiceAccount name: horizontal-pod-autoscaler namespace: kube-system---
apiVersion: v1kind: ConfigMapmetadata: name: adapter-config namespace: defaultdata: config.yaml: | rules: - seriesQuery: 'http_requests_total{namespace!="",pod!=""}' 1 resources: overrides: namespace: {resource: "namespace"} pod: {resource: "pod"} service: {resource: "service"} name: matches: "^(.*)_total" as: "${1}_per_second" 2 metricsQuery: 'sum(rate(<<.Series>>{<<.LabelMatchers>>}[2m])) by (<<.GroupBy>>)'---
apiVersion: v1kind: Servicemetadata: annotations: service.alpha.openshift.io/serving-cert-secret-name: prometheus-adapter-tls labels: name: prometheus-adapter name: prometheus-adapter namespace: defaultspec: ports: - name: https port: 443 targetPort: 6443
OpenShift Container Platform 4.2 Monitoring
30
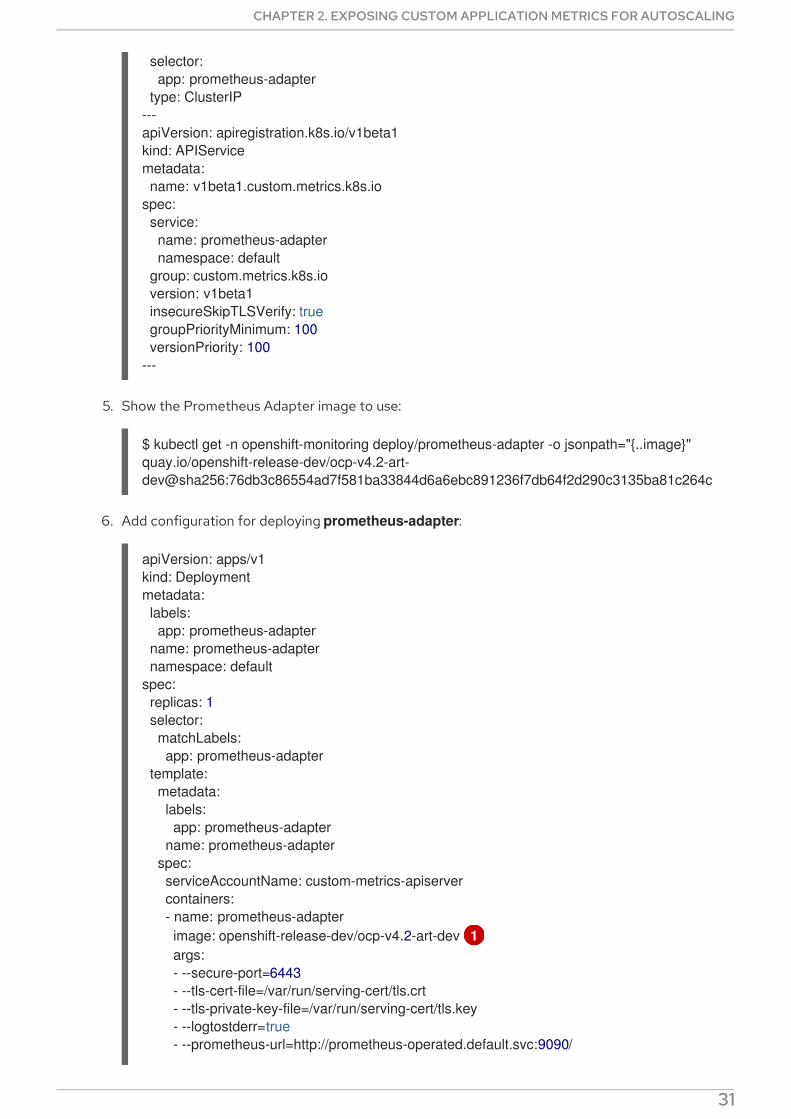
5. Show the Prometheus Adapter image to use:
$ kubectl get -n openshift-monitoring deploy/prometheus-adapter -o jsonpath="{..image}"quay.io/openshift-release-dev/ocp-v4.2-art-dev@sha256:76db3c86554ad7f581ba33844d6a6ebc891236f7db64f2d290c3135ba81c264c
6. Add configuration for deploying prometheus-adapter:
selector: app: prometheus-adapter type: ClusterIP---apiVersion: apiregistration.k8s.io/v1beta1kind: APIServicemetadata: name: v1beta1.custom.metrics.k8s.iospec: service: name: prometheus-adapter namespace: default group: custom.metrics.k8s.io version: v1beta1 insecureSkipTLSVerify: true groupPriorityMinimum: 100 versionPriority: 100---
apiVersion: apps/v1kind: Deploymentmetadata: labels: app: prometheus-adapter name: prometheus-adapter namespace: defaultspec: replicas: 1 selector: matchLabels: app: prometheus-adapter template: metadata: labels: app: prometheus-adapter name: prometheus-adapter spec: serviceAccountName: custom-metrics-apiserver containers: - name: prometheus-adapter image: openshift-release-dev/ocp-v4.2-art-dev 1 args: - --secure-port=6443 - --tls-cert-file=/var/run/serving-cert/tls.crt - --tls-private-key-file=/var/run/serving-cert/tls.key - --logtostderr=true - --prometheus-url=http://prometheus-operated.default.svc:9090/
CHAPTER 2. EXPOSING CUSTOM APPLICATION METRICS FOR AUTOSCALING
31
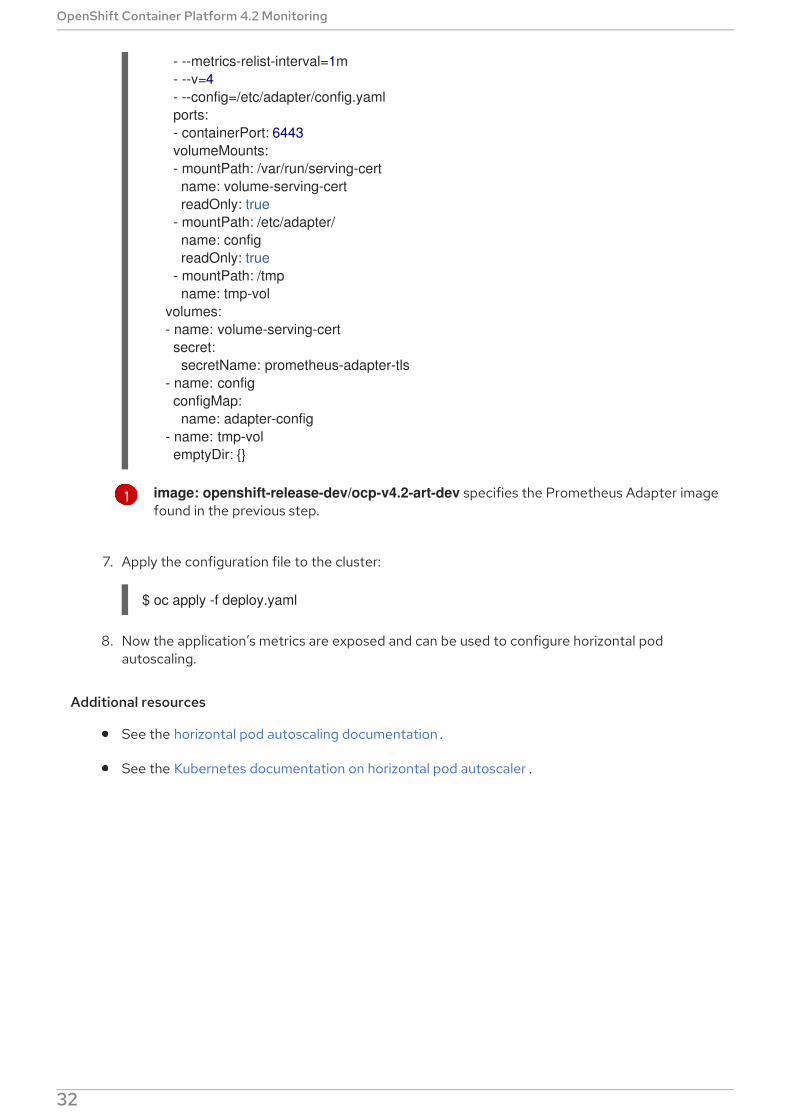
1 image: openshift-release-dev/ocp-v4.2-art-dev specifies the Prometheus Adapter imagefound in the previous step.
7. Apply the configuration file to the cluster:
$ oc apply -f deploy.yaml
8. Now the application’s metrics are exposed and can be used to configure horizontal podautoscaling.
Additional resources
See the horizontal pod autoscaling documentation .
See the Kubernetes documentation on horizontal pod autoscaler .
- --metrics-relist-interval=1m - --v=4 - --config=/etc/adapter/config.yaml ports: - containerPort: 6443 volumeMounts: - mountPath: /var/run/serving-cert name: volume-serving-cert readOnly: true - mountPath: /etc/adapter/ name: config readOnly: true - mountPath: /tmp name: tmp-vol volumes: - name: volume-serving-cert secret: secretName: prometheus-adapter-tls - name: config configMap: name: adapter-config - name: tmp-vol emptyDir: {}
OpenShift Container Platform 4.2 Monitoring
32