Embed Size (px)
Citation preview

Shaw and Partners
1.37000 0000 000
OPY – Equity Report current as at –27/08/2021–Pg. 1
Openpay Limited (OPY) Rating: Buy | Risk: High | Price Target: $3.50
FY22 should be transformational with US and UK scaling up; Opportunity beckons …
Danny Younis | Senior Analyst
+61 2 9238 1292 [email protected]
Event FY21 result largely in line with expectations given recent 4Q21 trading update, which was largely pre-announced highlighting the continuing and accelerating momentum (very strong 1Q21, 2Q21, 3Q21 and 4Q21 results) with all growth metrics trending in the right (positive) direction (# of plans, # of customers, # of merchants, net bad debt, TTV) – all of which translated into solid, if a little weaker than expected, FY revenue vs. Shaw forecasts. No changes to our FY22 numbers.
Highlights
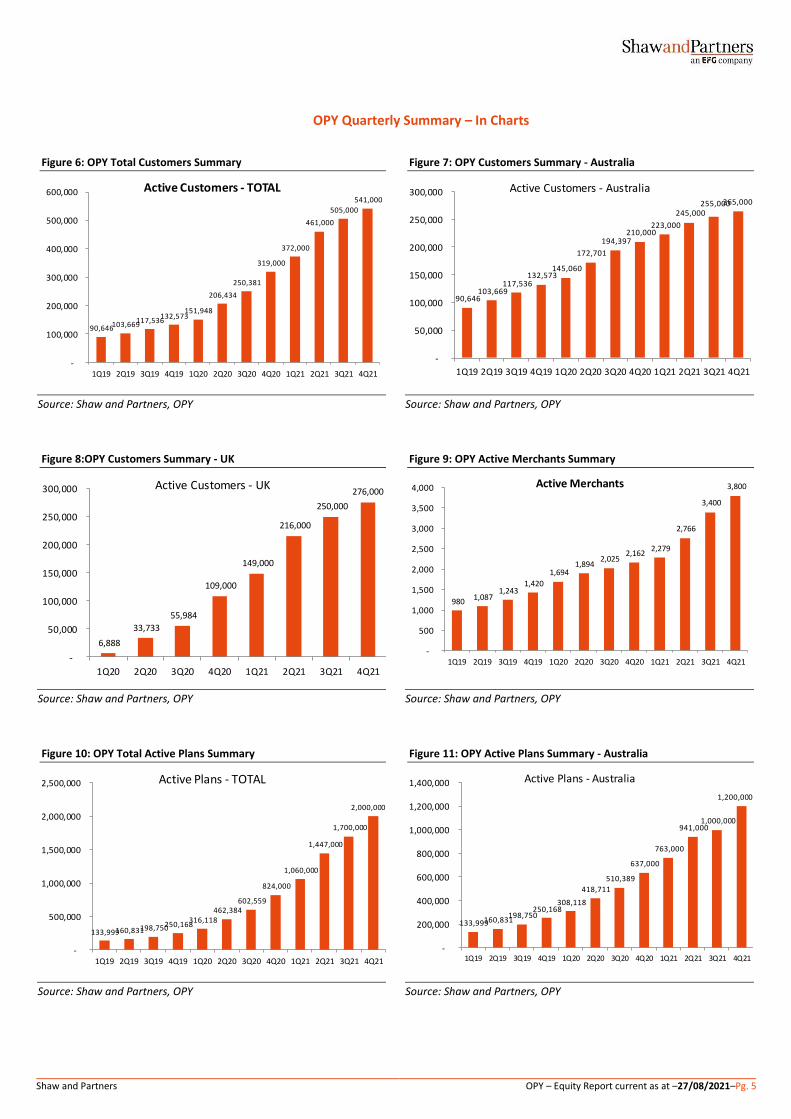
• Active customers +69% from 319k in pcp (4Q20) to a record 541k (+7% on pp’s 3Q21) – with UK customers +153% from 109k in pcp to 276k (or +10% on pp), implying Australian customer growth was +70% on pcp and +7% on pp at ~1.2m;
• Active merchants improved again at +77% from ~2,100 in pcp to a record 3,800 (+12% on pp) – the major positive here was that the latest trend from 2Q21 merchant growth (i.e. reversing the relatively weaker trend of q-on-q growth for the previous last five periods which had softened from 19% in 1Q20 to ~5% growth period-on-period due to larger enterprise targets) is continuing to improve into 3Q21 and now 4Q21;
• Active Plans +141% on pcp and from ~800k to a record ~2,000k (+18% on pp) – this implies 88% growth in Australia on pcp vs. 3289% in the UK over the same period and a standout result was new plans from repeat customers at record 84% vs. 70% in pcp and 82% pp. 90% of plans are over 3 months tenure.
• TTV up a whopping +77% from $193m to $339m – vs. Shaw’s extant $357m estimate. This is before acquisition of Payment Assist, UK ramp up and US entry post October 2021 this year;
• Revenue +44% from $18m in pcp to $26.0m (revenue yield as expected falling from 9.3% to 7.6% as previously flagged) vs. Shaw’s original $28.8m – 1Q21 was +68% from $3.7m in pcp to $6.2m; 2Q21 +58% from $4.6m to $7.2m, 3Q21 +24% from $5.3m in pcp to $6.6m, 4Q21 was +33% from $4.5m in pcp to $6.0m; and
• Bad debts (as % of TTV) finished the year at 2.8% (1Q21 1.6%, 2Q21 2.1%, 3Q21 3.3%, 4Q21 4.0%) – company targets levels of <2.5% in the short-term.
• Net loss for the year was $63.1m (vs. cash loss of $66.4m) – well below Z1P’s $653m and APT’s $159m (equivalent NLAT) losses.
• Opex (excl-SIs) for FY21 was $81m, +68% over FY20 – owing to investing significantly in the foundation of staff, processes and its technical platforms, to deliver its growth strategy (particularly in the US).
• FY21 ended with cash on hand of $52m – combined with undrawn funding lines of $162m equates to overall firepower of $214m. This provides ample headroom given an FY21 cash loss of $66.4m vs. Shaw and Partners’ $55.8m loss. The bulk of losses stemmed from staffing costs ($31m) as the business ramps up in the UK and enters the US.
• July 2021 has seen very strong momentum continuing – with Active Customers +64%, on pcp, Active Merchants +77%, Active Plans +130%, TTV +50% to $36m and sales +10% to $2.3m. Importantly NTM has increased from 0.6% to 1.7%.
• Additional B2B/ SaaS partnership win Kyriba (US-based global leader in treasury and payables solutions – provides access to over 2,000 enterprise clients globally and a pathway to significantly reduce acquisition costs with shorter sales cycles
Recommendation BUY. OPY trades at a significant – and attractive – 44% discount to BNPL peers on an FY22 EV/Sales multiple of 4.1x vs. combined 7.4x (consensus) for APT, HUM, LBY, SPT, SZL, Z1P.
Shaw and Partners OPY – Equity Report current as at –27/08/2021–Pg. 2
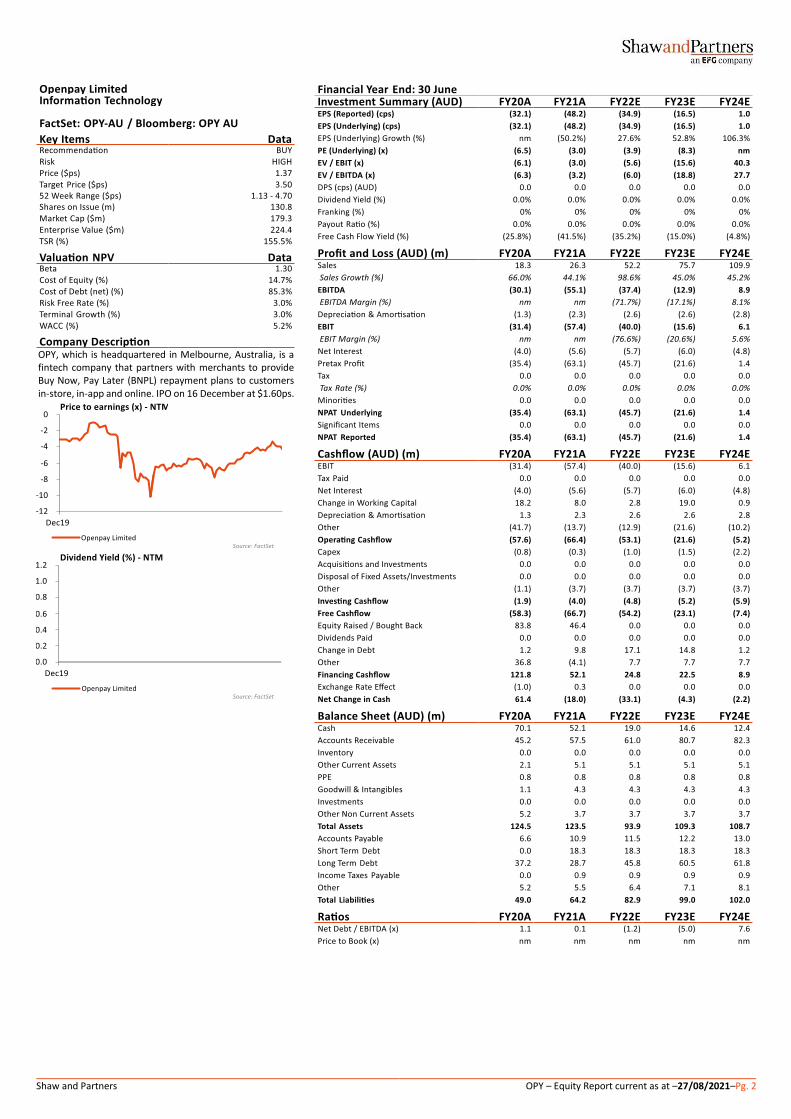
OPY, which is headquartered in Melbourne, Australia, is a fintech company that partners with merchants to provide Buy Now, Pay Later (BNPL) repayment plans to customers in-store, in-app and online. IPO on 16 December at $1.60ps.

Shaw and Partners OPY – Equity Report current as at –27/08/2021–Pg. 3
Recommendation
BUY. Despite the watershed APT/Square deal, BNPL / OPY sentiment is currently negative on the back of aggressive competition from incumbents and the plethora of new – and large – players entering the space (PYPL, AAPL, GS, etc.), in addition to current listed players clearly showing slowing growth in their recent 4Q21 results vs. 3Q21, the accelerating cost bases as players seek global dominion which in turn is pushing out and exacerbating losses further as the global land grab race heats up and costs increase – and indeed losses – significantly (e.g. Z1P reported NLAT of $(653)m and APT $(159)m in FY21).
In OPY’s case, the market is also concerned about the massive investment in the business to scale up into the US and UK – as the accelerating cash burn peaks at ~$6-7m per month and losses mount before the TTV and revenue flows through further down the track. OPY has been caught up in this sector-wide slipstream – but we believe its differentiated model (higher ATV, longer plans, non-Retail focus, more mature customer, and B2B/SaaS offering via lending platform Lumi) is an attractive counterpoint to the prevailing and homogenous ‘pay-in-4’ offerings globally.
FY22 catalysts include: (1) monetising recent eneterprise partnerships/customers with the likes of Woolworths, Ford, Pentana, Lumi, HP, etc; (2) US scaling from October 2021; and (3) UK now ramping up with key partnerships inked with e-Commerce platform providers (e.g. One Step Checkout with >20,000 global merchants, Shopwired with >8,500 merchants, Apparel 21 with >120 POS brands, and Aero Commerce – all should go live in 1Q22).
The transformational acquisition of Payment Assist in one of the world’s largest markets (UK) accelerates its position and opportunity in this market (effectively triples its UK TTV, increases customer numbers by >64%, accelerates the path to profitability and generates high returns and yields), and indeed secures OPY position as a major BNPL player in the UK, with the leading Auto BNPL provider. The US is now also recording major wins in the form of WorldPay and Kyriba with significantly embedded ecosystems of merchant partners which lowers OPY’s customer acquisition cost and expedites the penetration in the US.
OPY also trades at a significant – and attractive – 44% discount to BNPL peers on an FY22 EV/Sales multiple of 4.1x vs. combined 7.4x (consensus) for APT, HUM, LBY, SPT, SZL, Z1P.
• UK now starting to accelerate too – with active Plans +329% to 800k (vs. $231m in ANZ), active customers +153% to 276k (vs. 1,200k in ANZ),active merchants +308% to 102 (vs. 3,720 in ANZ) and TTV +205% to $108m (vs. $231m in ANZ).
• US penetration has begun – in advanced discussions re: potential funding partners, payments processors and foundational merchants in core verticals plus differentiated offering to short-term plan peers with longer tenures (3-5 months), differing verticals (Auto service and repair, Healthcare, Home Improvement and Education) and additional service capability (e.g. B2B) enables OPY to step in to fill an unmet market need.
Figure 1:OPY UK vs. Payment Assist Contribution Summary
Source: OPY (Note: Figures as of 9 June 2021 and GBP/AUD FX rate of $0.5422 used)

Shaw and Partners OPY – Equity Report current as at –27/08/2021–Pg. 4
Funding Facilities
Figure 2: OPY Funding Position Figure 3: OPY Funding Facilities and Buffer
Source: Shaw and Partners, OPY
Source: Shaw and Partners, OPY
US Market & Strategy – A Major Future Driver & Catalyst Recent Investor Briefing highlighted the very significant opportunity available to OPY in the US, notably: (1) multi-billion dollar TTV potential vs. current $165m TTV from Australia/UK at end of December 2020; and (2) the clearly differentiated offering to its homogenous “pay-in-4” and short term (<2 months) peer offering (much higher ATV, longer 2-24 month tenure, non-Retail vertical focus on Health/Auto/Home, older demographic, etc.). Key points as follows:
• Key take away: Total Addressable Market (TAM) for BNPL globally is >US$6.5t (comprising US$5.5t, UK $0.63t, Australia US$0.32t and NZ US$0.1t) and OPY’s share of this US wallet is estimated at c. 15%, equating to a mammoth US$829b target market in the US alone – by non-Retail sub-vertical is US$379b Big-Ticket Retail, US$218b Health, US$78b Home, US$89b Education and US$65b Auto (source: Barclays, IBIS, World Bank).
• A “back-of-the-envelope” sensitivity by Shaw and Partners with respect to the potential revenue impact of US penetration (market share vs. gross revenue yield) highlights that this significant scale, opportunity and revenue runway, based on relatively conservative assumptions, could potentially yield a quantum leap in revenue generation, as outlined in the Table below (source: Shaw and Partners).
Figure 4: OPY US Penetration vs. Sales Sensitivity Summary Figure 5: OPY Global Penetration vs. Sales Sensitivity Summary
Source: Shaw and Partners, OPY
Source: Shaw and Partners, OPY
• Share of online wallet expected to grow 4x in the US by 2024 – BNPL is the fastest growing US payment option (YTD data to Sept-20) (source: Barclays):
1. BNPL accelerating: +201% Gen Z, +86% Millennials, +63% Other;
2. Debit declining: +19% Gen Z, +24% Millennials, +17% Other; and
3. Credit falling rapidly: -8% Gen Z, -7% Millennials, -12% Other.
• Moreover, mobile commerce is the fastest growing channel in retail payments (growing at a CAGR of 28% from 2020 to 2027) – mobile revolution is fuelling the proliferation of digital and mobile wallets (eWallets e.g. Apple Pay, Samsung Pay, Google Pay, and WeChat Pay / AliPay in China), both online and at POS, as well as BNPL options like OPY. eWallets now account to ~43% of retail eComm transactions globally, and up to 50-60% during COVID-19 (source: Euromonitor, Allied Markets Research and Worldpay).
Funding PositionTotal
Facility
Undrawn
as of 31-Mar-21Notes
GCI (Comm Bill) A$40m A$10m 3-Yr term
255 Finance (RCF) A$25m A$25m Option to $100m / renewal Sept-21
GGC (UK) GPB £60m GPB £50m 2 years @fixed rate
Working Capital A$35m A$35m
4Q21 estimated cash available
1 Net cash outflows -$21.933m
2 Cash at end of quarter $52.078m
3 Unused finance facilities $162.098m
4 Total available funding (#2 + #3) $214.176m
Number of quarters of funding available (#4 divided by #1) 9.8
OPY US Revenue Contribution Forecast (US$m)
$3,732.30 0.5% 1.0% 1.5% 2.0% 2.5%
5% $207.4 $414.7 $622.1 $829.4 $1,036.8
6% $248.8 $497.6 $746.5 $995.3 $1,244.1
7% $290.3 $580.6 $870.9 $1,161.2 $1,451.5
8% $331.8 $663.5 $995.3 $1,327.0 $1,658.8
9% $373.2 $746.5 $1,119.7 $1,492.9 $1,866.2
10% $414.7 $829.4 $1,244.1 $1,658.8 $2,073.5
Re
ven
ue
Yie
ld
(% o
f TT
V)
US Market Share
OPY Global Revenue Contribution Forecast (US$m)
$4,935.68 0.5% 1.0% 1.5% 2.0% 2.5%
5% $246.8 $493.6 $740.4 $987.1 $1,233.9
6% $296.1 $592.3 $888.4 $1,184.6 $1,480.7
7% $345.5 $691.0 $1,036.5 $1,382.0 $1,727.5
8% $394.9 $789.7 $1,184.6 $1,579.4 $1,974.3
9% $444.2 $888.4 $1,332.6 $1,776.8 $2,221.1
10% $493.6 $987.1 $1,480.7 $1,974.3 $2,467.8
Re
ven
ue
Yie
ld
(% o
f TT
V)
Global Market Share
Shaw and Partners OPY – Equity Report current as at –27/08/2021–Pg. 5
OPY Quarterly Summary – In Charts
Figure 6: OPY Total Customers Summary Figure 7: OPY Customers Summary - Australia
Source: Shaw and Partners, OPY
Source: Shaw and Partners, OPY
Figure 8:OPY Customers Summary - UK Figure 9: OPY Active Merchants Summary
Source: Shaw and Partners, OPY
Source: Shaw and Partners, OPY
Figure 10: OPY Total Active Plans Summary Figure 11: OPY Active Plans Summary - Australia
Source: Shaw and Partners, OPY
Source: Shaw and Partners, OPY
90,646 103,669 117,536 132,573
151,948
206,434
250,381
319,000
372,000
461,000
505,000
541,000
-
100,000
200,000
300,000
400,000
500,000
600,000
1Q19 2Q19 3Q19 4Q19 1Q20 2Q20 3Q20 4Q20 1Q21 2Q21 3Q21 4Q21
Active Customers - TOTAL
90,646 103,669
117,536 132,573
145,060
172,701
194,397 210,000
223,000
245,000 255,000 265,000
-
50,000
100,000
150,000
200,000
250,000
300,000
1Q19 2Q19 3Q19 4Q19 1Q20 2Q20 3Q20 4Q20 1Q21 2Q21 3Q21 4Q21
Active Customers - Australia
6,888
33,733
55,984
109,000
149,000
216,000
250,000
276,000
-
50,000
100,000
150,000
200,000
250,000
300,000
1Q20 2Q20 3Q20 4Q20 1Q21 2Q21 3Q21 4Q21
Active Customers - UK
980 1,087
1,243 1,420
1,694 1,894
2,025 2,162
2,279
2,766
3,400
3,800
-
500
1,000
1,500
2,000
2,500
3,000
3,500
4,000
1Q19 2Q19 3Q19 4Q19 1Q20 2Q20 3Q20 4Q20 1Q21 2Q21 3Q21 4Q21
Active Merchants
133,999 160,831 198,750 250,168 316,118
462,384 602,559
824,000
1,060,000
1,447,000
1,700,000
2,000,000
-
500,000
1,000,000
1,500,000
2,000,000
2,500,000
1Q19 2Q19 3Q19 4Q19 1Q20 2Q20 3Q20 4Q20 1Q21 2Q21 3Q21 4Q21
Active Plans - TOTAL
133,999 160,831 198,750
250,168 308,118
418,711
510,389
637,000
763,000
941,000 1,000,000
1,200,000
-
200,000
400,000
600,000
800,000
1,000,000
1,200,000
1,400,000
1Q19 2Q19 3Q19 4Q19 1Q20 2Q20 3Q20 4Q20 1Q21 2Q21 3Q21 4Q21
Active Plans - Australia

Shaw and Partners OPY – Equity Report current as at –27/08/2021–Pg. 6
Figure 12:OPY Active Plans Summary - UK Figure 13: OPY TTV Summary
Source: Shaw and Partners, OPY
Source: Shaw and Partners, OPY
Figure 14:OPY Revenue Summary
Figure 15: OPY Revenue Yield Summary
Source: Shaw and Partners, OPY
Source: Shaw and Partners, OPY
Figure 16:OPY Net Bad Debts Summary Figure 17: OPY TTV per Customer Summary
Source: Shaw and Partners, OPY
Source: Shaw and Partners, OPY
8,000 43,673
92,170
187,000
297,000
506,000
700,000
800,000
-
100,000
200,000
300,000
400,000
500,000
600,000
700,000
800,000
900,000
1Q20 2Q20 3Q20 4Q20 1Q21 2Q21 3Q21 4Q21
Active Plans - UK
19.6 23.7 25.4 28.6
34.9
49.5 45.8
62.6 68.0
97.1
83.0
92.0
-
20.0
40.0
60.0
80.0
100.0
120.0
1Q19 2Q19 3Q19 4Q19 1Q20 2Q20 3Q20 4Q20 1Q21 2Q21 3Q21 4Q21
TTV ($m)
2.5 2.3
3.1 3.1
3.7
4.6
5.3
4.5
6.2
7.2
6.6
6.0
0
1
2
3
4
5
6
7
8
1Q19 2Q19 3Q19 4Q19 1Q20 2Q20 3Q20 4Q20 1Q21 2Q21 3Q21 4Q21
Revenue ($m)12.8%
9.7%
12.2%
10.8% 10.6%
9.3%
11.6%
7.2%
9.1%
7.4%8.0%
6.5%
0.0%
2.0%
4.0%
6.0%
8.0%
10.0%
12.0%
14.0%
1Q19 2Q19 3Q19 4Q19 1Q20 2Q20 3Q20 4Q20 1Q21 2Q21 3Q21 4Q21
Revenue / TTV Yield
3.0%
2.2%2.4%
4.7%
2.9%
1.6%
2.1%
3.3%
4.0%
0.0%
0.5%
1.0%
1.5%
2.0%
2.5%
3.0%
3.5%
4.0%
4.5%
5.0%
4Q19 1Q20 2Q20 3Q20 4Q20 1Q21 2Q21 3Q21 4Q21
Net Bad debts as % of TTV
$216$229
$216 $216$230
$240
$183$196
$183
$211
$164 $170
$0
$50
$100
$150
$200
$250
$300
1Q19 2Q19 3Q19 4Q19 1Q20 2Q20 3Q20 4Q20 1Q21 2Q21 3Q21 4Q21
TTV per Customer

Shaw and Partners OPY – Equity Report current as at –27/08/2021–Pg. 7
Figure 18:OPY NTM Summary Figure 19: OPY NTL Summary
Source: Shaw and Partners, OPY
Source: Shaw and Partners, OPY
Figure 20:OPY New Customer Plans Summary Figure 21: OPY Concurrent Customer Plans Summary
Source: Shaw and Partners, OPY
Source: Shaw and Partners, OPY
UK Summary
Figure 22:OPY UK Customer Summary Figure 23: OPY UK Active Plans Summary
Source: Shaw and Partners, OPY
Source: Shaw and Partners, OPY
8.6%
7.3%
4.3%
2.5%
0.6%
4.0%
1.4%
0.0%
1.0%
2.0%
3.0%
4.0%
5.0%
6.0%
7.0%
8.0%
9.0%
10.0%
FY17A FY18A FY19A FY20A FY21A 1H20A 1H21A
Net Transaction Margin (%)
0.50% 0.50%
1.20%
2.30% 2.30% 2.3%
1.7%
0.0%
0.5%
1.0%
1.5%
2.0%
2.5%
FY17A FY18A FY19A FY20A FY21A 1H20A 1H21A
Net Transaction Loss (%)
47%52%
60%66% 66%
63%69% 70%
78% 77%82% 84%
0%
10%
20%
30%
40%
50%
60%
70%
80%
90%
1Q19 2Q19 3Q19 4Q19 1Q20 2Q20 3Q20 4Q20 1Q21 2Q21 3Q21 4Q21
New Plans from Repeat Customers
21%23%
28%32%
35%38%
40%42%
46%49%
51%53%
0%
10%
20%
30%
40%
50%
60%
1Q19 2Q19 3Q19 4Q19 1Q20 2Q20 3Q20 4Q20 1Q21 2Q21 3Q21 4Q21
Customers with Concurrent Plans
6,888
33,733
55,984
109,000
149,000
216,000
250,000
276,000
-
50,000
100,000
150,000
200,000
250,000
300,000
1Q20 2Q20 3Q20 4Q20 1Q21 2Q21 3Q21 4Q21
Active Customers - UK
8,000 43,673
92,170
187,000
297,000
506,000
700,000
800,000
-
100,000
200,000
300,000
400,000
500,000
600,000
700,000
800,000
900,000
1Q20 2Q20 3Q20 4Q20 1Q21 2Q21 3Q21 4Q21
Active Plans - UK

Shaw and Partners OPY – Equity Report current as at –27/08/2021–Pg. 8
Figure 24: Peer Customers Summary Figure 25: Peer Merchants Summary
Source: Shaw and Partners, OPY, FactSet, Companies
Source: Shaw and Partners, OPY, Companies
Figure 26: Peer TTV Summary Figure 27: Peer Sales+1 Summary
Source: Shaw and Partners, OPY, Companies. (Note: TTV annualised from last reported Quarter)
Source: Shaw and Partners, OPY, Companies
541,000
16,200,000
2,700,000
829,000 566,000
3,000,000
7,300,000
0
2,000,000
4,000,000
6,000,000
8,000,000
10,000,000
12,000,000
14,000,000
16,000,000
18,000,000
OPY APT HUM LBY SPT SZL Z1P
# Customers (Globally)
3,800
98,200
58,250
10,4312,800
41,800
51,300
0
20,000
40,000
60,000
80,000
100,000
120,000
OPY APT HUM LBY SPT SZL Z1P
# Active Merchants
$388
$21,100
$1,300 $750 $690$1,970
$7,500
$0
$5,000
$10,000
$15,000
$20,000
$25,000
OPY APT HUM LBY SPT SZL Z1P
TTV (A$m) - Last Q Annualised
111
2,328
526
95 38
413
942
0
500
1,000
1,500
2,000
2,500
OPY APT HUM LBY SPT SZL Z1P
Sales (Consensus)+1 (A$m)

Shaw and Partners OPY – Equity Report current as at –27/08/2021–Pg. 9
Valuation
Figure 29: BNPL Sector EV/Sales (x) Figure 30: BNPL Sector MktCap/Sales
Source: Shaw and Partners, FactSet, Companies
Source: Shaw and Partners, FactSet, Companies
41.3x
7.5x 6.6x
2.4x
7.0x
13.7x 13.6x
6.6x
25.3x
6.2x7.3x
1.9x4.0x
8.9x 8.8x
4.1x
0.0x
5.0x
10.0x
15.0x
20.0x
25.0x
30.0x
35.0x
40.0x
45.0x
APT EPY HUM LBY SZL SPT Z1P OPY
FY21 FY22EV / Sales (x)
Source: Shaw and Partners; FactSet
3.0
25.2
1.1
8.9
48.8
5.4 5.9
0
10
20
30
40
50
60
OPY APT HUM LBY SPT SZL Z1P
Market Cap / Sales (x)
Figure 28:BNPL CompCo Summary
Source: Shaw and Partners, FactSet
Domestic - BNPL
Security Name Country Last Price Mkt Cap FY20 FY21 FY22 FY20 FY21 FY22
APT Afterpay Australia $132.23 $38,295 - 1259.2x 269.7x 73.5x 41.3x 25.3x
EPY EarlyPay Australia $0.50 $139 30.1x 10.8x 9.2x 6.0x 7.5x 6.2x
HUM Humm Group Australia $0.96 $475 14.3x 8.1x 7.0x 6.2x 6.6x 7.3x
IOU IOUpay Australia $0.27 $149 - - - - - -
LBY Laybuy Group Holdings New Zealand $0.54 $137 - - - 4.4x 2.4x 1.9x
PYR Payright Australia $0.42 $37 - - - - 3.6x 0.3x
SZL Sezzle CDI United States $6.50 $1,285 - - - 16.1x 7.0x 4.0x
SPT Splitit Payments Australia $0.48 $224 - - - 23.8x 13.7x 8.9x
Z1P Zip Australia $7.06 $3,969 - - 477.1x 31.2x 13.6x 8.8x
OPY Openpay Group Ltd. Australia $1.37 179.2 - - - 8.0x 6.6x 4.1x
Average 22.2x 426.0x 190.7x 21.2x 11.4x 7.4x
vs. Average - - - -62% -42% -44%
Median 22.2x 10.8x 139.5x 12.1x 7.0x 6.2x
High 30.1x 1259.2x 477.1x 73.5x 41.3x 25.3x
Low 14.3x 8.1x 7.0x 4.4x 2.4x 0.3x
PE (x) EV/Sales (x)

Shaw and Partners OPY – Equity Report current as at –27/08/2021–Pg. 10
Figure 31: BNPL Sector MktCap/Sales+1 (x) Figure 32: BNPL Sector MktCap/Annualised TTV (x)
Source: Shaw and Partners, FactSet, Companies
Source: Shaw and Partners, FactSet, Companies
Figure 33: CompCo Share Price Movements – Last Month Figure 34: CompCo Share Price Movements – L3M
Source: Shaw and Partners, FactSet
Source: Shaw and Partners, FactSet
Figure 35: CompCo Share Price Movements – Last 6M Figure 36: CompCo Share Price Movements – L12M
Source: Shaw and Partners, FactSet
Source: Shaw and Partners, FactSet
1.7
16.6
0.9 1.4
6.0
3.24.3
0
2
4
6
8
10
12
14
16
18
OPY APT HUM LBY SPT SZL Z1P
Market Cap / Sales+1 (x)
0.5
1.8
0.4
0.20.3
0.70.5
0.0
0.2
0.4
0.6
0.8
1.0
1.2
1.4
1.6
1.8
2.0
OPY APT HUM LBY SPT SZL Z1P
Market Cap / TTV (x)
14%
25%
-1%
17%
-7%
-18%
1% 2%4%
-25%
-20%
-15%
-10%
-5%
0%
5%
10%
15%
20%
25%
30%
OPY APT HUM LBY SPT SZL Z1P ASX200XJO
Last Month
-15%
44%
-2%
0%
-26%
-10%
-1%
6%9%
-30%
-20%
-10%
0%
10%
20%
30%
40%
50%
OPY APT HUM LBY SPT SZL Z1P ASX200XJO
Last 3 Months
-49%
-1%
-8%
-62%-59%
-34% -35%
10% 12%
-70%
-60%
-50%
-40%
-30%
-20%
-10%
0%
10%
20%
OPY APT HUM LBY SPT SZL Z1P ASX200XJO
Last 6 Months
-64%
44%
-23%
0%
-67%
-26%
-6%
22% 26%
-80%
-60%
-40%
-20%
0%
20%
40%
60%
OPY APT HUM LBY SPT SZL Z1P ASX200XJO
Last 12 Months

Shaw and Partners OPY – Equity Report current as at –27/08/2021–Pg. 11
Key risks • Regulation – The BNPL sector in particular has had a number of recent inquiries
including the ASIC, RBA and Senate inquiries. We expect that the regulatory environment and focus will continue to remain dynamic.
• Credit and Bad Debts – OPY is exposed to any deterioration in quality of the loan book. Significant deterioration in credit quality across the book that exceeds current retained BDD provision levels may negatively affect earnings, as well as finance costs and availability.
• Finance and Funding –One of the largest risks to OPY (and other BNPL players) is availability as well as costs of financing. Finance and funding risk are magnified within the current global volatile environment.
• Fraud Risk – Although dealing in small ticket sizes and so unlikely to encounter large scale frauds (such as other listed alternative financiers have encountered) OPY may encounter fraud that could cause customer or merchant losses, which in turn may affect or cause an increase in costs for the company. This indeed happened in December 2020 (now remedied).
• Economic Environment – May affect the levels of transaction volume, user adoption, savings rates or seasonality within the business. Having demonstrated strong quarter on quarter growth rates since inception OPY will progressively, as it becomes bigger with scale, be affected by overall seasonality particularly in the retail sector it operates within.
• Competitive Landscape – OPY has a number of both mainstream (such as traditional bank credit, Humm, etc.) and alternative (Afterpay, Zip Co., etc.) competitors within various products and sectors the company operates within. Higher competition is likely to manifest itself within compression on merchant fees, tendering processes for larger merchants and overall customer acquisition costs.
• Acquisition risk – Upon completion of the Payment Assist acquisition, execution is paramount and to ensure the year-on-year historical growth rates are at least maintained.
Core drivers and catalyst Our positive recommendation and attraction to OPY is driven by the following:
• Structural tailwinds driving mainstream adoption – We expect structural tailwinds to continue to grow adoption from both merchants and customers, driving well above system growth and taking share from major incumbents, whilst growing the size of the overall pie.
• Fintech competitive advantages – OPY has a best-in-breed product. OPY has competitive advantages across three key value chains which include: 1) customers; 2) merchants; and 3) funders – a rare position to be in.
• Recurring income – Although having relatively short amortisation and book turn metrics compared with a traditional personal finance lender, OPY has a material base of customers, repeat transactions and some duration and repeatability to its book.
• Optionality around further geographies and products – We see opportunity for further growth with penetration into NZ and the UK and then other geographies such as Europe as well. The recent deals with Ford, Pentana (cars) and Woolworths (SaaS) are further evidence – and validation – of OPY’s broad product offering.

Shaw and Partners OPY – Equity Report current as at –27/08/2021–Pg. 12
Rating Classification
Buy Expected to outperform the overall market
Hold Expected to perform in line with the overall market
Sell Expected to underperform the overall market
Not Rated Shaw has issued a factual note on the company but does not have a recommendation
Risk Rating
High Higher risk than the overall market – investors should be aware this stock may be speculative
Medium Risk broadly in line with the overall market
Low Lower risk than the overall market
RISK STATEMENT: Where a company is designated as ‘High’ risk, this means that the analyst has determined that the risk profile for this company is
significantly higher than for the market as a whole, and so may not suit all investors. Clients should make an assessment as to whether this stock
and its potential price volatility is compatible with their financial objectives. Clients should discuss this stock with their Shaw adviser before making
any investment decision.
Distribution of Investment Ratings
History of Investment Rating and Target Price - Openpay Limited
08/18 12/18 04/19 08/19 12/19 04/20 08/20 12/20 04/21$0.0
$1.0
$2.0
$3.0
$4.0
$5.0
$6.0
Openpay Limited Target Price
Buy

Shaw and Partners OPY – Equity Report current as at –27/08/2021–Pg. 13
Disclaimer
Shaw and Partners Limited ABN 24 003 221 583 (“Shaw”) is a Participant of ASX Limited, Chi-X Australia Pty Limited and holder of Australian Financial Services Licence number 236048. ANALYST CERTIFICATION: The Research Analyst who prepared this report hereby certifies that the views expressed in this document accurately reflect the analyst's personal views about the Company and its financial products. Neither Shaw nor its Research Analysts received any direct financial or non-financial benefits from the company for the production of this document. However, Shaw Research Analysts may receive assistance from the company in preparing their research which can include attending site visits and/or meetings hosted by the company. In some instances the costs of such site visits or meetings may be met in part or in whole by the company if Shaw considers it is reasonable given the specific circumstances relating to the site visit or meeting. As at the date of this report, the Research Analyst does not hold, either directly or through a controlled entity, securities in the Company that is the subject of this report, where they do hold securities those interests are not material. Shaw restricts Research Analysts from trading in securities outside of the ASX/S&P100 for which they write research. Other Shaw employees may hold interests in the company, but none of those interests are material. DISCLAIMER: This report is published by Shaw to its clients by way of general, as opposed to personal, advice. This means it has been prepared for multiple distribution without consideration of your investment objectives, financial situation and needs (“Personal Circumstances”). Accordingly, the advice given is not a recommendation that a particular course of action is suitable for you and the advice is therefore not to be acted on as investment advice. You must assess whether or not the advice is appropriate for your Personal Circumstances before making any investment decisions. You can either make this assessment yourself, or if you require a personal recommendation, you can seek the assistance of your Shaw client adviser. This report is provided to you on the condition that it not be copied, either in whole or in part, distributed to or disclosed to any other person. If you are not the intended recipient, you should destroy the report and advise Shaw that you have done so. This report is published by Shaw in good faith based on the facts known to it at the time of its preparation and does not purport to contain all relevant information with respect to the financial products to which it relates. The research report is current as at the date of publication until it is replaced, updated or withdrawn. Although the report is based on information obtained from sources believed to be reliable, Shaw does not make any representation or warranty that it is accurate, complete or up to date and Shaw accepts no obligation to correct or update the information or opinions in it. If you rely on this report, you do so at your own risk. Any projections are indicative estimates only and may not be realised in the future. Such projections are contingent on matters outside the control of Shaw (including but not limited to market volatility, economic conditions and company-specific fundamentals) and therefore may not be realised in the future. Past performance is not a reliable indicator of future performance. Except to the extent that liability under any law cannot be excluded, Shaw disclaims liability for all loss or damage arising as a result of any opinion, advice, recommendation, representation or information expressly or impliedly published in or in relation to this report notwithstanding any error or omission including negligence. Depending on the timing and size of your investment, your portfolio composition may differ to the model. Performance figures are derived from the inception date of the model and its investment transactions from that date, therefore the performance for your portfolio may be different. If you have any questions in connection with differences between your portfolio and the model, you should speak with your adviser. IMPORTANT INFORMATION TO CONSIDER: It is important that before making a decision to invest in a Shaw Managed Accounts, a managed fund, an exchange traded fund, an individual hybrid security or listed debt instrument that you read the relevant Product Disclosure Statement (“PDS”). The PDS will contain information relevant to the specific product, including the returns, features, benefits and risks. The PDS can be found at: www.shawandpartners.com.au/media/1348/shawmanagedaccounts_pds.pdf. RISKS ASSOCIATED WITH HYBRID SECURITIES: Hybrid securities and listed debt instruments differ from investments in equities and cash products in a number of important respects. The liquidity risk associated with an investment in hybrid securities and listed debt instruments will generally be greater than that associated with equities. The credit risk associated with hybrid securities and listed debt instruments is higher than that of a cash product or term deposit. Some hybrid securities may be perpetual in nature, meaning that they can only be redeemed or exchanged for cash or equity at the issuer’s option. Hybrids may also contain terms which automatically trigger the deferral of an interest payment or cause the issuer to repay the hybrid earlier or later than anticipated. ASIC has published information to assist consumers in understanding the risks and benefits associated with an investment in hybrid securities or listed debt instruments. This information can be found under the heading ‘Complex Investments’ at www.moneysmart.gov.au/investing. DISCLOSURE: Shaw will charge commission in relation to client transactions in financial products and Shaw client advisers will receive a share of that commission. Shaw, its authorised representatives, its associates and their respective officers and employees may have earned previously or may in the future earn fees and commission from dealing in the Company's financial products.