Embed Size (px)
Citation preview
openLCA (1.7.2)
Case Study
Ceramic cup vs. Paper cup
openLCA Version: 1.7.2
Document version: 1.1
Date: December 13, 2018
Authors: Sarah Martin, Jonas Bunsen, Andreas Ciroth
GreenDelta GmbH
Müllerstrasse 135
13349 Berlin
GERMANY
Tel +49 30 48496030
Fax +49 30 4849 6991
Ceramic cup vs. Paper cup
2
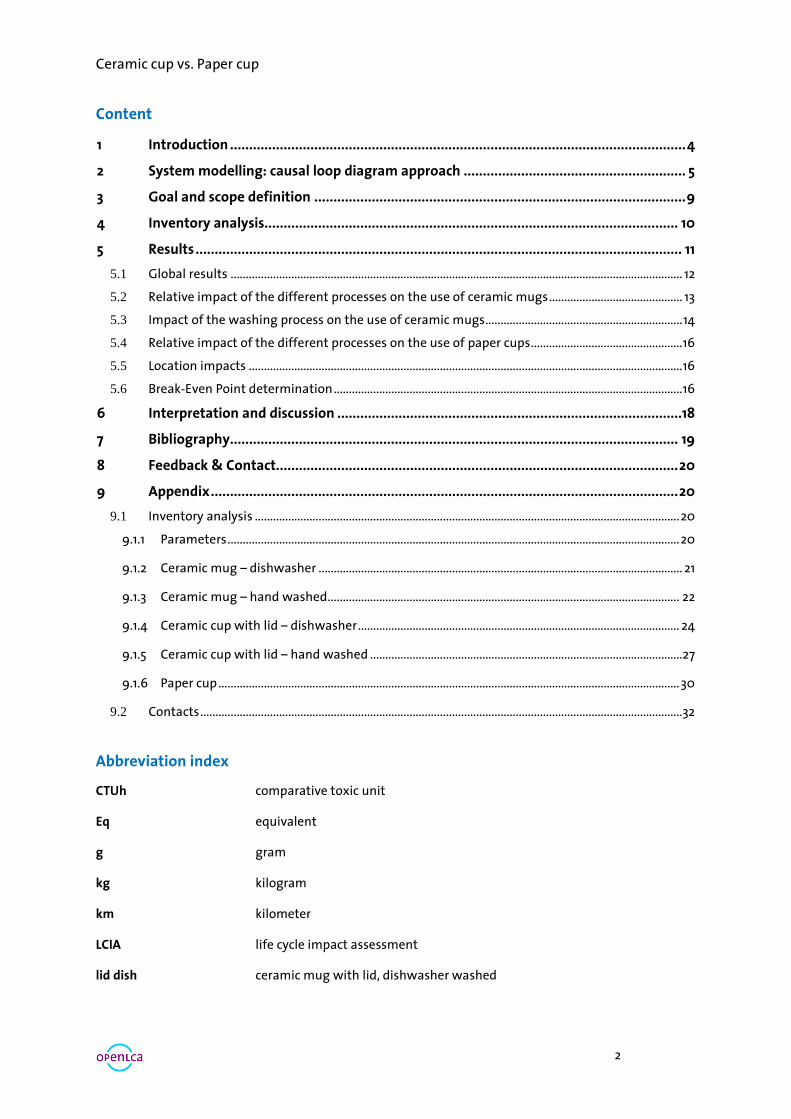
Content
1 Introduction ....................................................................................................................... 4
2 System modelling: causal loop diagram approach .......................................................... 5
3 Goal and scope definition ................................................................................................. 9
4 Inventory analysis............................................................................................................ 10
5 Results ............................................................................................................................... 11
5.1 Global results ..................................................................................................................................................... 12
5.2 Relative impact of the different processes on the use of ceramic mugs ............................................ 13
5.3 Impact of the washing process on the use of ceramic mugs................................................................. 14
5.4 Relative impact of the different processes on the use of paper cups.................................................. 16
5.5 Location impacts ............................................................................................................................................... 16
5.6 Break-Even Point determination ................................................................................................................... 16
6 Interpretation and discussion ..........................................................................................18
7 Bibliography ..................................................................................................................... 19
8 Feedback & Contact......................................................................................................... 20
9 Appendix .......................................................................................................................... 20
9.1 Inventory analysis ............................................................................................................................................ 20
9.1.1 Parameters ..................................................................................................................................................... 20
9.1.2 Ceramic mug – dishwasher ........................................................................................................................ 21
9.1.3 Ceramic mug – hand washed .................................................................................................................... 22
9.1.4 Ceramic cup with lid – dishwasher .......................................................................................................... 24
9.1.5 Ceramic cup with lid – hand washed ....................................................................................................... 27
9.1.6 Paper cup ........................................................................................................................................................ 30
9.2 Contacts ...............................................................................................................................................................32
Abbreviation index
CTUh comparative toxic unit
Eq equivalent
g gram
kg kilogram
km kilometer
LCIA life cycle impact assessment
lid dish ceramic mug with lid, dishwasher washed
Ceramic cup vs. Paper cup
3
lid hand ceramic mug with lid, hand-washed
m3 cubic meter
MJ mega Joule
mL milliliter
mol mole
mug dish ceramic mug, dishwasher washed
mug hand ceramic mug, hand washed
mug hand cold ceramic mug, hand washed, cold water
t ton
t*km tonkilometer
Table index
Tab.1 Environmental impact categories of the ILCD Midpoint method 11
Tab.2 LCIA results for the different cups, per impact category 12
Tab.3 Relative LCIA results for the different cups (incl. results with cold water) 14
Tab.4 Parameters definition and formula 20
Tab.5 Flow inventory for the use of a ceramic mug, dishwasher-washed 20
Tab.6 Flow inventory for the use of a ceramic mug, hand-washed 22
Tab.7 Flow inventory for the use of a ceramic cup with lid, dishwasher-washed 24
Tab.8 Flow inventory for the use of ceramic cup with lid, hand-washed 27
Tab.9 Flow inventory for the use of a paper cup 30
Figure index
Fig.1 Causal loop diagram: ceramic mug 6
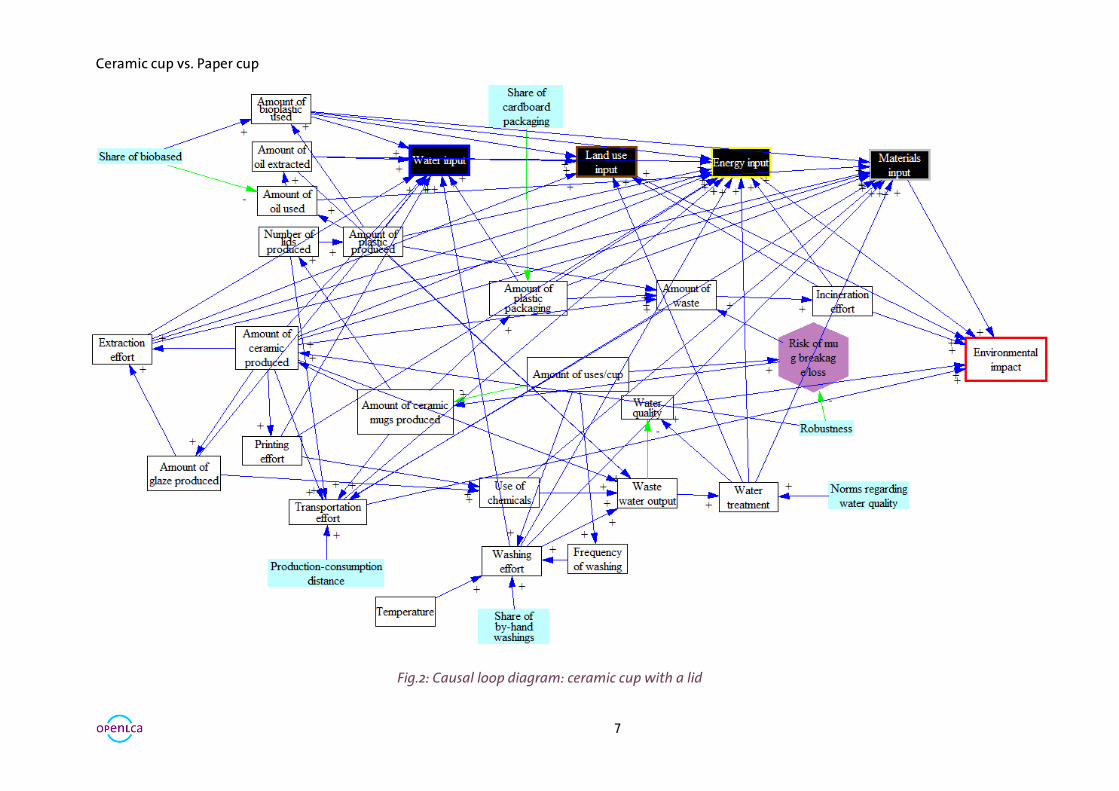
Fig.2 Causal loop diagram: ceramic cup with lid 7
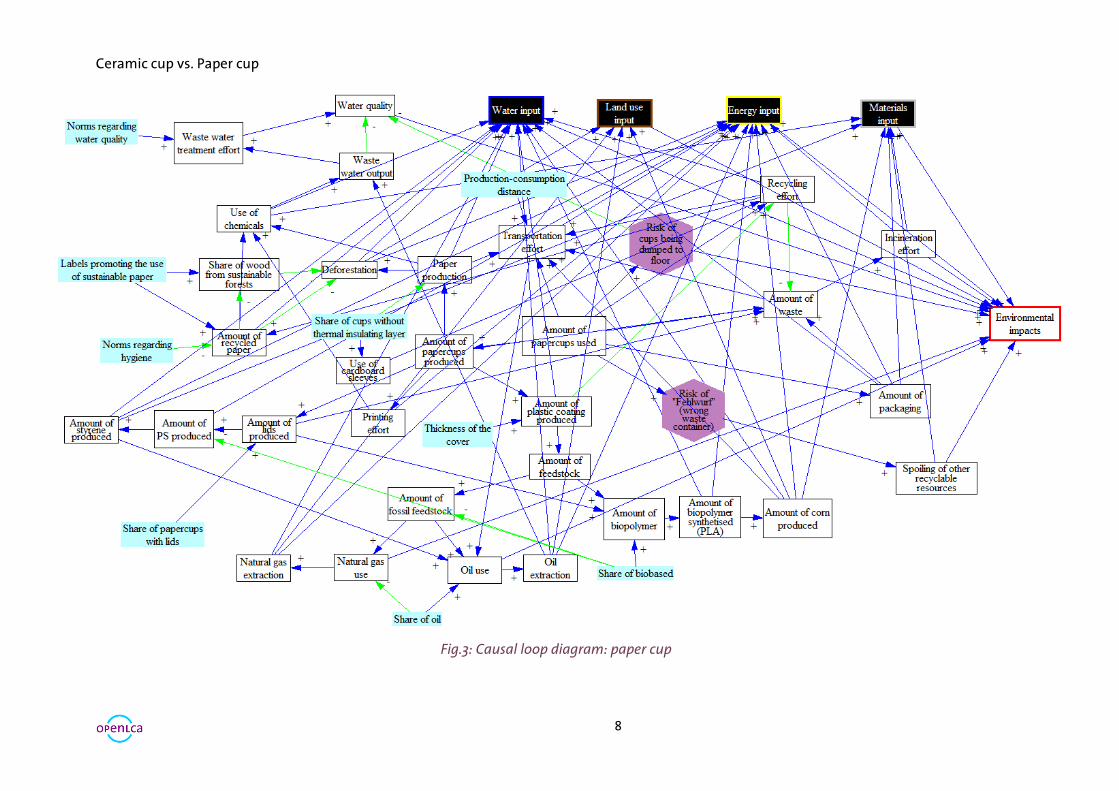
Fig.3 Causal loop diagram: paper cup 8
Fig.4 Representation of the three cups considered 9
Fig.5 Ceramic mug life cycle 10
Fig.6 Ceramic cup with lid life cycle 10
Fig.7 Paper cup life cycle 11
Ceramic cup vs. Paper cup
4
Fig.8 Relative indicator results for every cup type, per impact category 13
Fig.9 Influence of the different processes on the use of a ceramic mug 13
Fig.10 Influence of the different on the washing of a ceramic mug 14
Fig.11 Relative LCIA results for the different cups, per impact category. 750 uses, but
only 250 washings
15
Fig.12 Influence of the different processes on the use of a paper cup, expressed by a
percentage per environmental category
15
Fig.13 Comparison of the location impacts between reusable cups and paper cups for
the category climate change
16
Fig.14 Break-Even-Point of the ceramic cups for the climate change category 16
Fig.15 Break-Even-Point of the ceramic mugs for each category 17
Fig.16 Break-Even-Point of the ceramic cups with lid for each category 17
1 Introduction
A recent study published by the Deutschen Umwelthilfe [1] revealed that every day in
Berlin, 460,000 disposable cups are used and thrown away, leading to more than 2.400 tons
of waste per year. On a global scale, more than 500 billion of these cups end up in landfills
annually.[2] That is why Berlin politicians decided to propose a deposit system, using reusable
cups instead of disposable paper cups.[3] However, despite the bad reputation of disposable
cups, no scientific study has so far been able to establish a clear winner between disposable
and reusable cups.[4] These latter are indeed mostly made of ceramic, metal, glass or hard
plastic, and consequently require more energy to be produced than disposable cups.
Life Cycle assessments determine the environmental impact of a product adopting a
“cradle-to-grave” approach. To do so, the product life cycle is divided into different unit
processes, for which the energy and material in and outputs are identified and quantified. This
method enables to draw conclusions on the significance of every flow on the total
environmental impact of the analyzed product as well as to compare different products.
Nevertheless, many variables and uncertainties come into play while performing a life cycle
analysis. For example, some data for the inputs or outputs of individual processes are not yet
available in the existing databases. Data from similar products are then needed to perform an
exhaustive analysis. In order to avoid uncertainty and distortion, a precise goal and scope must
be defined for each study. The results thus depend on this study-specific definition.
Nevertheless, through precisely defined, modeled situations, it is possible to assess and
compare different products under the same conditions. The results can ultimately lead to a
systematic optimization of the products and the consequent improvement of their
environmental impacts. Further information on LCA can be found in the General guide for Life
Cycle Assessment – Detailed Guidance, published by the European Commission, or in the ISO
14040:2006 and ISO 14044:2006.
Ceramic cup vs. Paper cup
5
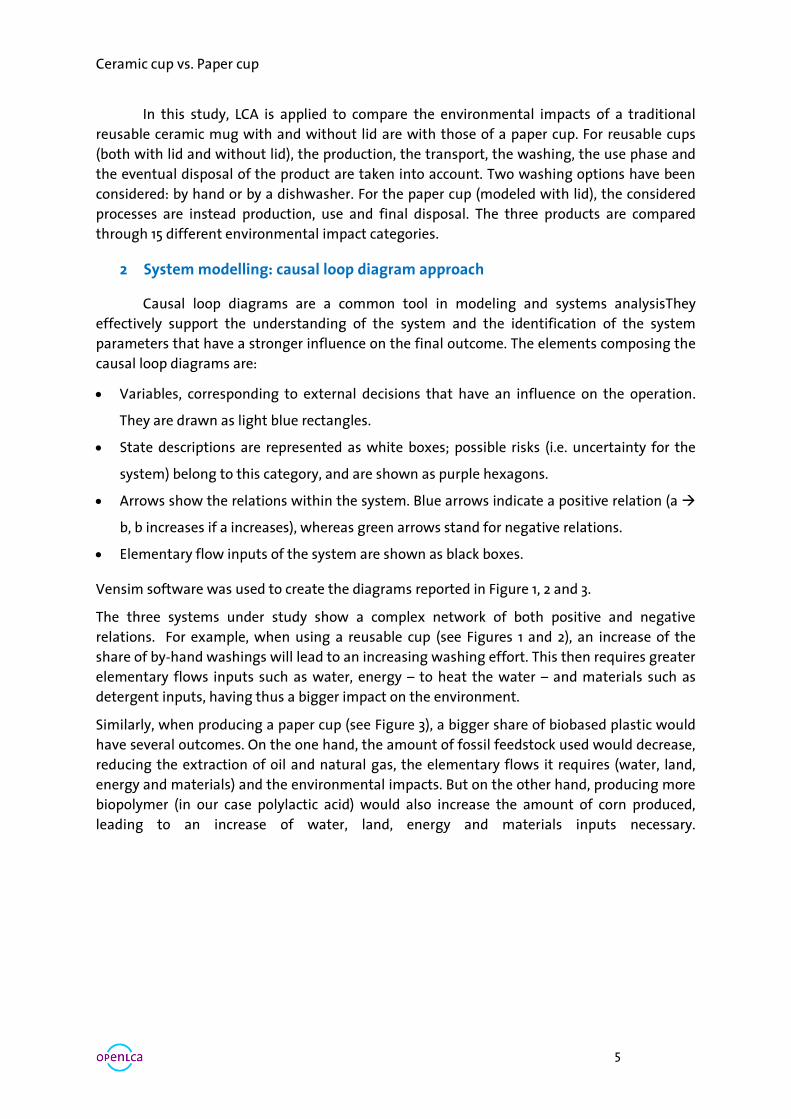
In this study, LCA is applied to compare the environmental impacts of a traditional
reusable ceramic mug with and without lid are with those of a paper cup. For reusable cups
(both with lid and without lid), the production, the transport, the washing, the use phase and
the eventual disposal of the product are taken into account. Two washing options have been
considered: by hand or by a dishwasher. For the paper cup (modeled with lid), the considered
processes are instead production, use and final disposal. The three products are compared
through 15 different environmental impact categories.
2 System modelling: causal loop diagram approach
Causal loop diagrams are a common tool in modeling and systems analysisThey
effectively support the understanding of the system and the identification of the system
parameters that have a stronger influence on the final outcome. The elements composing the
causal loop diagrams are:
Variables, corresponding to external decisions that have an influence on the operation.
They are drawn as light blue rectangles.
State descriptions are represented as white boxes; possible risks (i.e. uncertainty for the
system) belong to this category, and are shown as purple hexagons.
Arrows show the relations within the system. Blue arrows indicate a positive relation (a
b, b increases if a increases), whereas green arrows stand for negative relations.
Elementary flow inputs of the system are shown as black boxes.
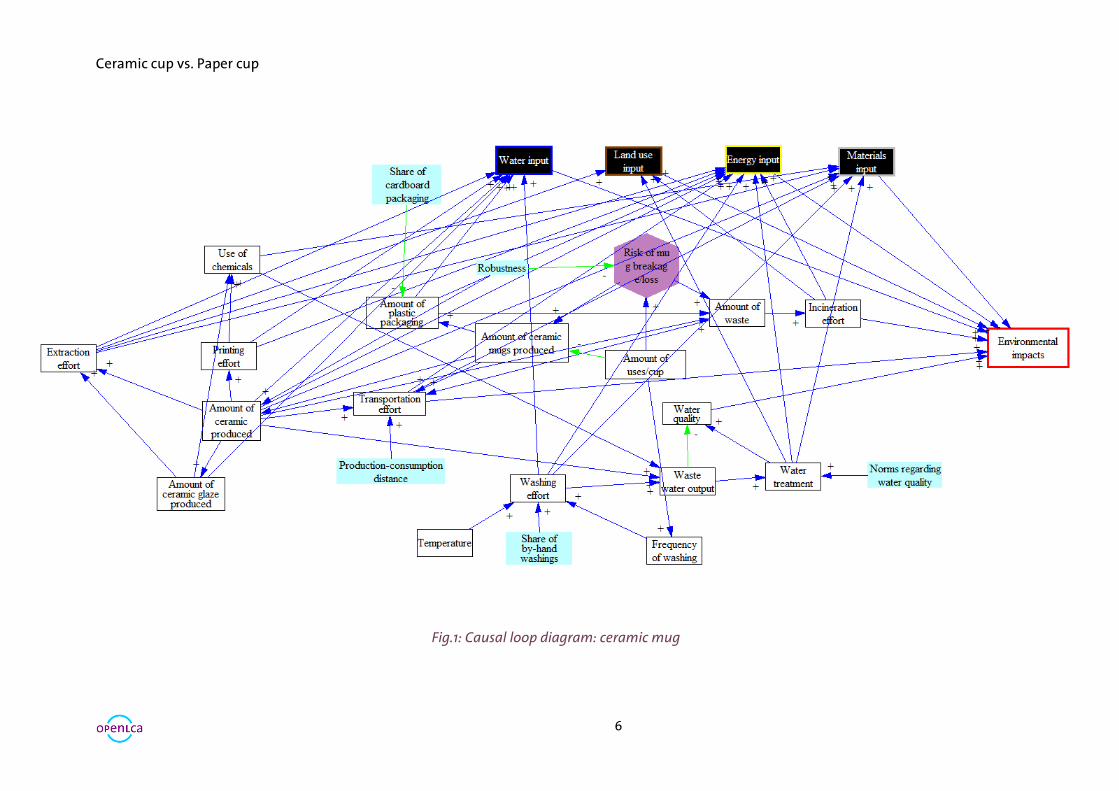
Vensim software was used to create the diagrams reported in Figure 1, 2 and 3.
The three systems under study show a complex network of both positive and negative
relations. For example, when using a reusable cup (see Figures 1 and 2), an increase of the
share of by-hand washings will lead to an increasing washing effort. This then requires greater
elementary flows inputs such as water, energy – to heat the water – and materials such as
detergent inputs, having thus a bigger impact on the environment.
Similarly, when producing a paper cup (see Figure 3), a bigger share of biobased plastic would
have several outcomes. On the one hand, the amount of fossil feedstock used would decrease,
reducing the extraction of oil and natural gas, the elementary flows it requires (water, land,
energy and materials) and the environmental impacts. But on the other hand, producing more
biopolymer (in our case polylactic acid) would also increase the amount of corn produced,
leading to an increase of water, land, energy and materials inputs necessary.
Ceramic cup vs. Paper cup
6
Fig.1: Causal loop diagram: ceramic mug
Ceramic cup vs. Paper cup
7
Fig.2: Causal loop diagram: ceramic cup with a lid
Ceramic cup vs. Paper cup
8
Fig.3: Causal loop diagram: paper cup
Ceramic cup vs. Paper cup
9
3 Goal and scope definition
This study aims to compare three different types of cups in terms of environmental
impacts. The functional unit defined for such comparison is “Coffee served in cup”, i.e. the
total volume of coffee served. The break-even point in term of potential for climate change
and the best alternative for every impact category will be determined using the ecoinvent 3.4
database and the open LCA 1.7.2 software.
In order to better frame the scope of the study and the analysis, the following assumptions
have been hypothesized:
The cups are bought and used in Berlin.
Sponge, sink and dishwasher production or disposal were not considered.
Water is electrically heated in the washing process.
No garbage materials are produced during production and transportation.
The reusable cups last for the entire usage assumed in the functional unit. The lifespan of a
ceramic mug was here considered with a risk of breakage. Indeed, if the cup breaks, a new
cup must be produced, and the resulting waste is to be treated. To represent this risk a pa-
rameter “broken” was created and applied in the use and washing phases (Figures 5 and
6) to model this risk. If the cup breaks, a new cup must be produced, and the resulting
waste is to be treated.
The amount of recycled paper cups was not considered, and thus that every used paper cup
was incinerated. In Germany, only 2/3 of the used cups are indeed disposed in the appro-
priate recycling bin. Besides, the recycling process is not optimal: due to the inner plastic
layer, most of the paper doesn’t dissolve and ends up being incinerated as well. [5]
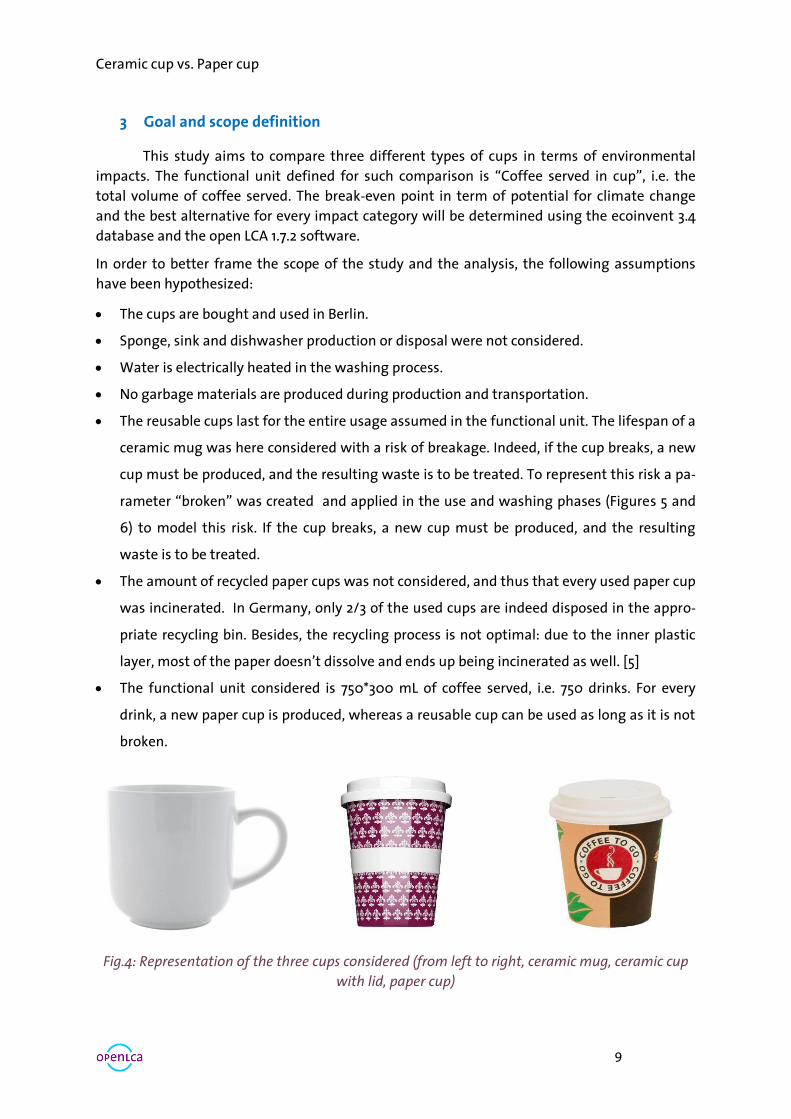
The functional unit considered is 750*300 mL of coffee served, i.e. 750 drinks. For every
drink, a new paper cup is produced, whereas a reusable cup can be used as long as it is not
broken.
Fig.4: Representation of the three cups considered (from left to right, ceramic mug, ceramic cup
with lid, paper cup)
Ceramic cup vs. Paper cup
10
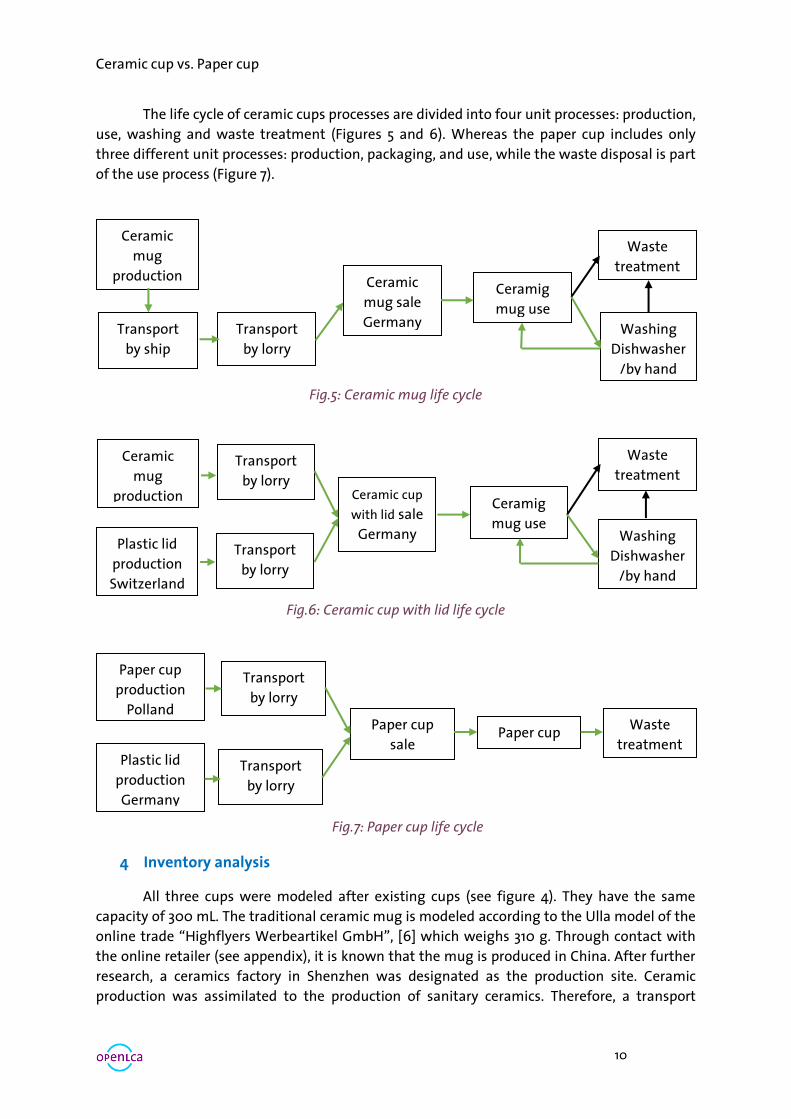
The life cycle of ceramic cups processes are divided into four unit processes: production,
use, washing and waste treatment (Figures 5 and 6). Whereas the paper cup includes only
three different unit processes: production, packaging, and use, while the waste disposal is part
of the use process (Figure 7).
Fig.5: Ceramic mug life cycle
Fig.6: Ceramic cup with lid life cycle
Fig.7: Paper cup life cycle
4 Inventory analysis
All three cups were modeled after existing cups (see figure 4). They have the same
capacity of 300 mL. The traditional ceramic mug is modeled according to the Ulla model of the
online trade “Highflyers Werbeartikel GmbH”, [6] which weighs 310 g. Through contact with
the online retailer (see appendix), it is known that the mug is produced in China. After further
research, a ceramics factory in Shenzhen was designated as the production site. Ceramic
production was assimilated to the production of sanitary ceramics. Therefore, a transport
Paper cup
production
Polland
Transport
by lorry
Paper cup
sale
Germany
Paper cup
use Plastic lid
production
Germany
Transport
by lorry
Waste
treatment
Ceramic
mug
production
Czech
Republic
Transport
by lorry
Ceramic cup
with lid sale
Germany
Waste
treatment
Ceramig
mug use Washing
Dishwasher
/by hand
Plastic lid
production
Switzerland
Transport
by lorry
Ceramic
mug
production
China Ceramic
mug sale
Germany Transport
by ship
Transport
by lorry
Waste
treatment
Ceramig
mug use
Washing
Dishwasher
/by hand
Ceramic cup vs. Paper cup
11
route for the entire life cycle of 18521.51 km was measured for the sea route to Hamburg and
300 km by truck to Berlin.
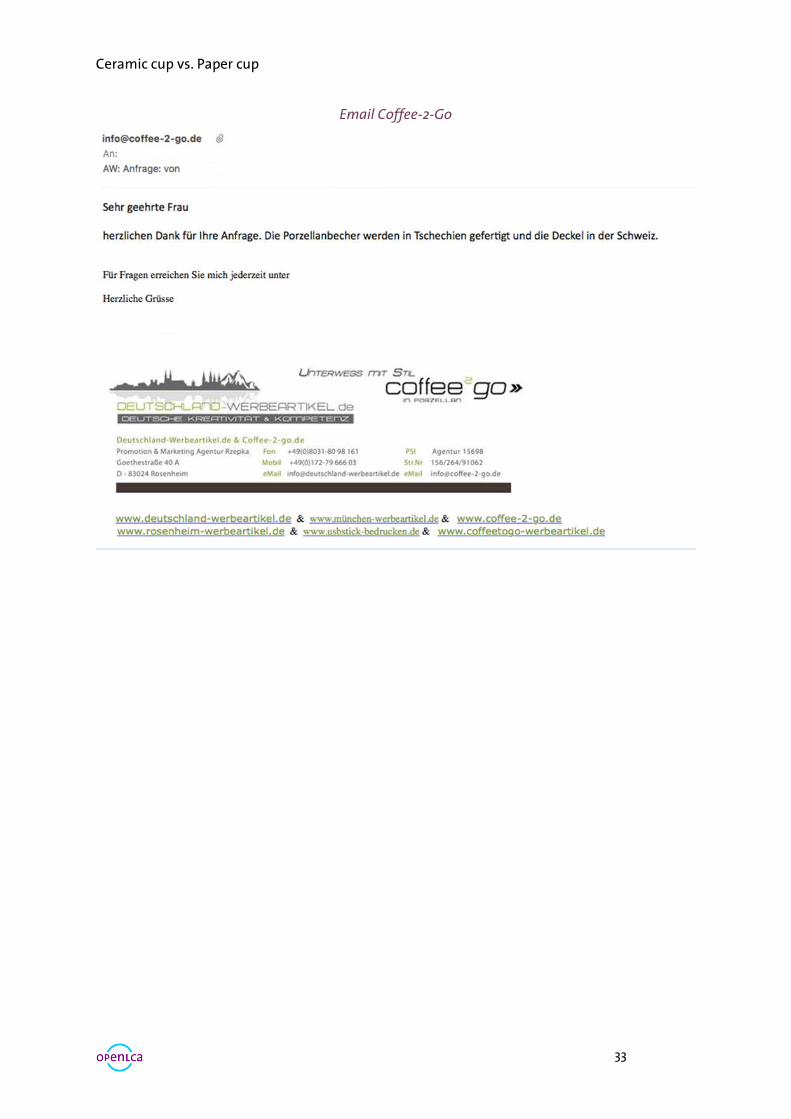
The ceramic cup with plastic lid was created after the Coffee-2-go provider models. [7] It
is however not made of ceramics but of porcelain. Due to the lack of data on porcelain
production, the cup was also modeled as a ceramic cup. It is manufactured in Czech Republic,
while the matching lid comes from Switzerland. A transport distance of 1195 km was computed
for this type of cup, corresponding to the Zurich-Berlin and Prague-Berlin routes. For both cups,
the printing process could was neither provided by the producer nor available in the database.
A similar process was therefore chosen.
As already mentioned, the washing behavior of reusable cups is a determinant factor for the
final outcome, which is why two alternatives have been assessed. For manual washing, energy
and detergent consumption data were taken from an existing study,[8] and the amount of hot
water was determined by an experiment. For the dishwasher, energy and water consumption
were taken from an A++++ certified machine.[9] All values of the wash process were divided
by 20 for the cups because it was assumed that 20 ceramic cups could be washed during a
single cycle, and by 50 for the lids. As per the detergent, no dish detergent was found on the
Ecoinvent 3.4 database. Consequently, it was chosen to take the different existing
components[10] as inputs. To limit the uncertainty due to the lack of information on detergent
manufacturing, it was considered that half of the detergent was regular soap.
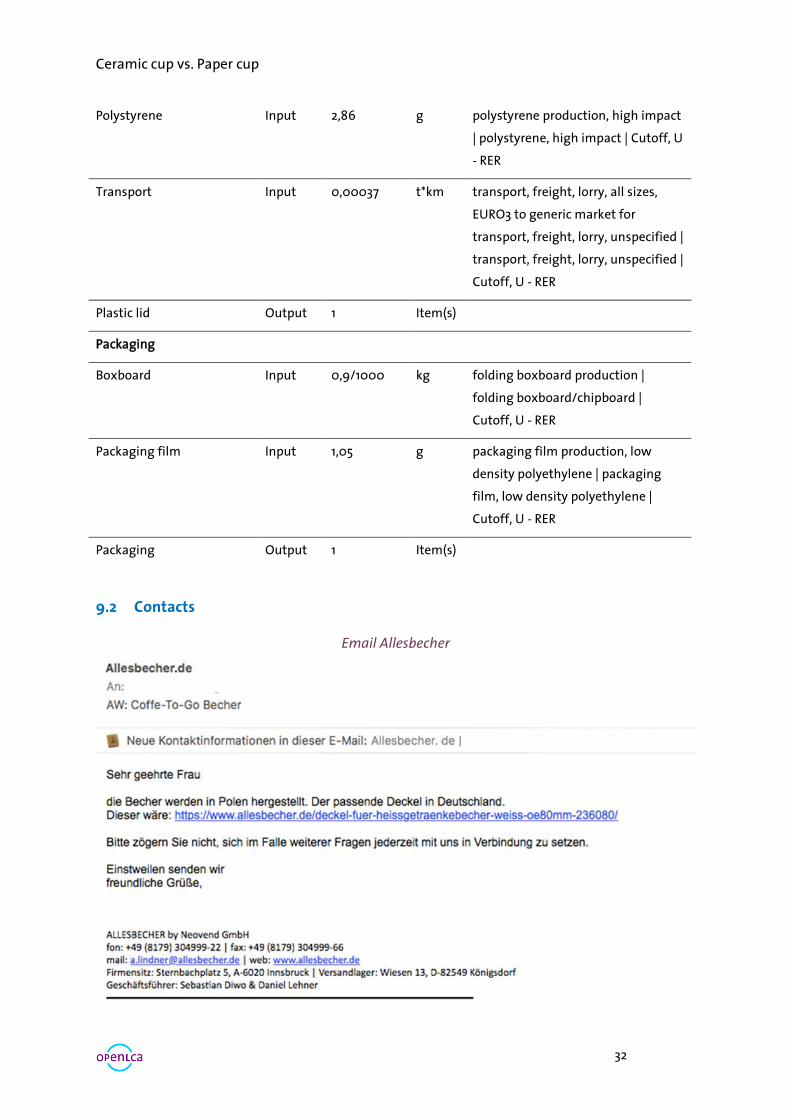
The paper cup is modeled (see Fig.7) after the model Café D [11] of the online retailer
allesbecher.de and the matching polystyrene lid of the same company. The cup weighs 8.3 g
and has an inner plastic (polyethylene) coating of 0.1 g. The lid weighs 0.93 g. Through email
contact with the company, it is known that the cup is produced in Poland and the lid in
Germany. A more accurate production location was unfortunately not given. The transport
path of the paper cup was then defined over 300 km and the one of the cover over 400 km.
Because of a lack of information on the inner coating of the paper cup, a similar process was
chosen. The resulting waste represents all parts of the paper cup, including its packaging. To
report the percentage of sorted packaging cardboard, a “sorted” parameter has been created.
Besides the data collected directly from the producers, secondary and tertiary data used
in this study is based on the ecoinvent 3.4 database. Swiss data had to be used several times, it
was assumed that identical conditions prevail in Berlin. Tables presenting parameters
definition and all in- and outputs are to be found in the appendix.
5 Results
In this section, the impact assessment results (LCIA) for the three alternatives cups are
reported. The ILCD Midpoint method (August 2016) was selected for this phase and all the 15
impact categories are considered to compare the considered cups (see Table 1). Two
alternatives were added to the three cups described in section 3, differentiating through the
washing phase (dishwasher vs. hand-washing).
Ceramic cup vs. Paper cup
12
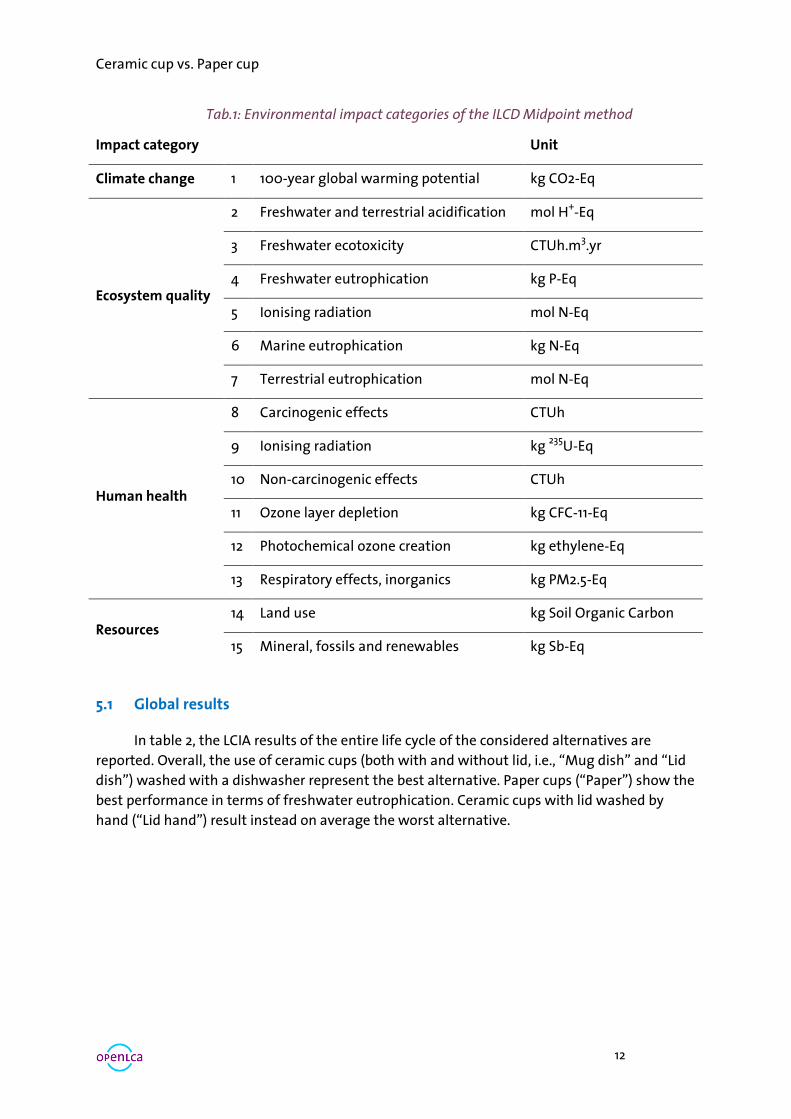
Tab.1: Environmental impact categories of the ILCD Midpoint method
Impact category Unit
Climate change 1 100-year global warming potential kg CO2-Eq
Ecosystem quality
2 Freshwater and terrestrial acidification mol H+-Eq
3 Freshwater ecotoxicity CTUh.m3.yr
4 Freshwater eutrophication kg P-Eq
5 Ionising radiation mol N-Eq
6 Marine eutrophication kg N-Eq
7 Terrestrial eutrophication mol N-Eq
Human health
8 Carcinogenic effects CTUh
9 Ionising radiation kg 235U-Eq
10 Non-carcinogenic effects CTUh
11 Ozone layer depletion kg CFC-11-Eq
12 Photochemical ozone creation kg ethylene-Eq
13 Respiratory effects, inorganics kg PM2.5-Eq
Resources 14 Land use kg Soil Organic Carbon
15 Mineral, fossils and renewables kg Sb-Eq
5.1 Global results
In table 2, the LCIA results of the entire life cycle of the considered alternatives are
reported. Overall, the use of ceramic cups (both with and without lid, i.e., “Mug dish” and “Lid
dish”) washed with a dishwasher represent the best alternative. Paper cups (“Paper”) show the
best performance in terms of freshwater eutrophication. Ceramic cups with lid washed by
hand (“Lid hand”) result instead on average the worst alternative.
Ceramic cup vs. Paper cup
13
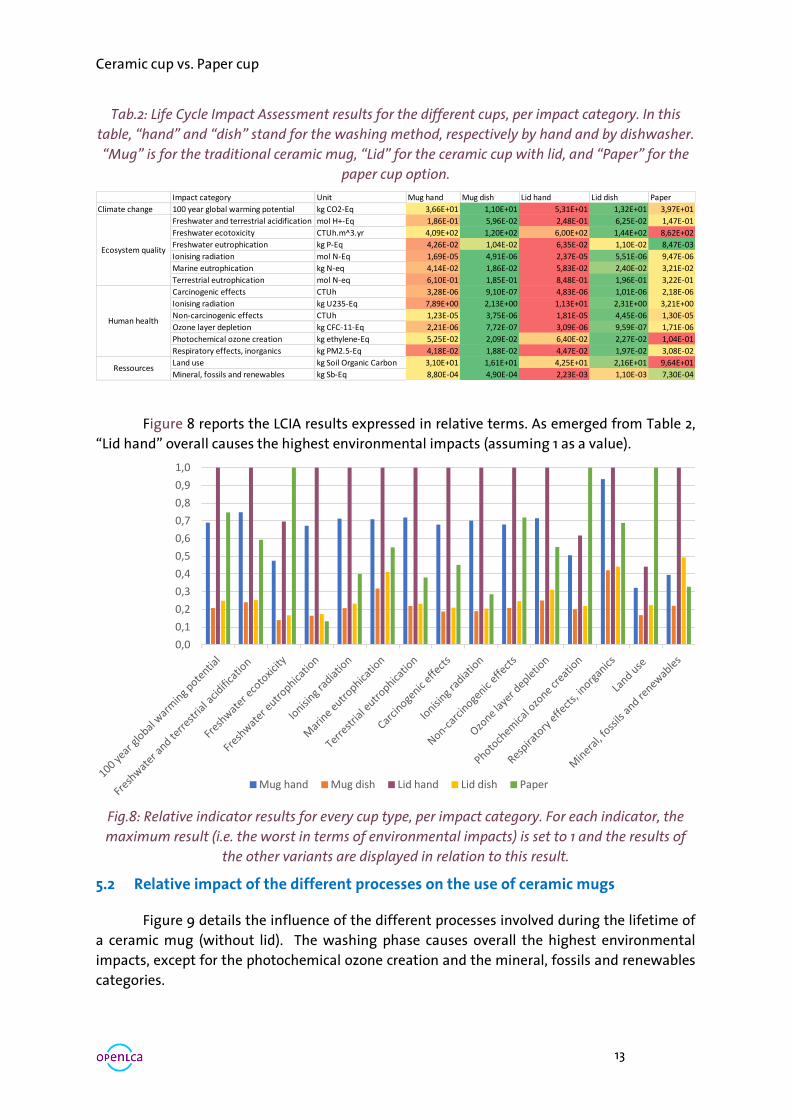
Tab.2: Life Cycle Impact Assessment results for the different cups, per impact category. In this
table, “hand” and “dish” stand for the washing method, respectively by hand and by dishwasher.
“Mug” is for the traditional ceramic mug, “Lid” for the ceramic cup with lid, and “Paper” for the
paper cup option.
Figure 8 reports the LCIA results expressed in relative terms. As emerged from Table 2,
“Lid hand” overall causes the highest environmental impacts (assuming 1 as a value).
Fig.8: Relative indicator results for every cup type, per impact category. For each indicator, the
maximum result (i.e. the worst in terms of environmental impacts) is set to 1 and the results of
the other variants are displayed in relation to this result.
5.2 Relative impact of the different processes on the use of ceramic mugs
Figure 9 details the influence of the different processes involved during the lifetime of
a ceramic mug (without lid). The washing phase causes overall the highest environmental
impacts, except for the photochemical ozone creation and the mineral, fossils and renewables
categories.
Impact category Unit Mug hand Mug dish Lid hand Lid dish Paper
Climate change 100 year global warming potential kg CO2-Eq 3,66E+01 1,10E+01 5,31E+01 1,32E+01 3,97E+01
Freshwater and terrestrial acidification mol H+-Eq 1,86E-01 5,96E-02 2,48E-01 6,25E-02 1,47E-01
Freshwater ecotoxicity CTUh.m^3.yr 4,09E+02 1,20E+02 6,00E+02 1,44E+02 8,62E+02
Freshwater eutrophication kg P-Eq 4,26E-02 1,04E-02 6,35E-02 1,10E-02 8,47E-03
Ionising radiation mol N-Eq 1,69E-05 4,91E-06 2,37E-05 5,51E-06 9,47E-06
Marine eutrophication kg N-eq 4,14E-02 1,86E-02 5,83E-02 2,40E-02 3,21E-02
Terrestrial eutrophication mol N-eq 6,10E-01 1,85E-01 8,48E-01 1,96E-01 3,22E-01
Carcinogenic effects CTUh 3,28E-06 9,10E-07 4,83E-06 1,01E-06 2,18E-06
Ionising radiation kg U235-Eq 7,89E+00 2,13E+00 1,13E+01 2,31E+00 3,21E+00
Non-carcinogenic effects CTUh 1,23E-05 3,75E-06 1,81E-05 4,45E-06 1,30E-05
Ozone layer depletion kg CFC-11-Eq 2,21E-06 7,72E-07 3,09E-06 9,59E-07 1,71E-06
Photochemical ozone creation kg ethylene-Eq 5,25E-02 2,09E-02 6,40E-02 2,27E-02 1,04E-01
Respiratory effects, inorganics kg PM2.5-Eq 4,18E-02 1,88E-02 4,47E-02 1,97E-02 3,08E-02
Land use kg Soil Organic Carbon 3,10E+01 1,61E+01 4,25E+01 2,16E+01 9,64E+01
Mineral, fossils and renewables kg Sb-Eq 8,80E-04 4,90E-04 2,23E-03 1,10E-03 7,30E-04
Ecosystem quality
Human health
Ressources
0,0
0,1
0,2
0,3
0,4
0,5
0,6
0,7
0,8
0,9
1,0
Mug hand Mug dish Lid hand Lid dish Paper
Ceramic cup vs. Paper cup
14
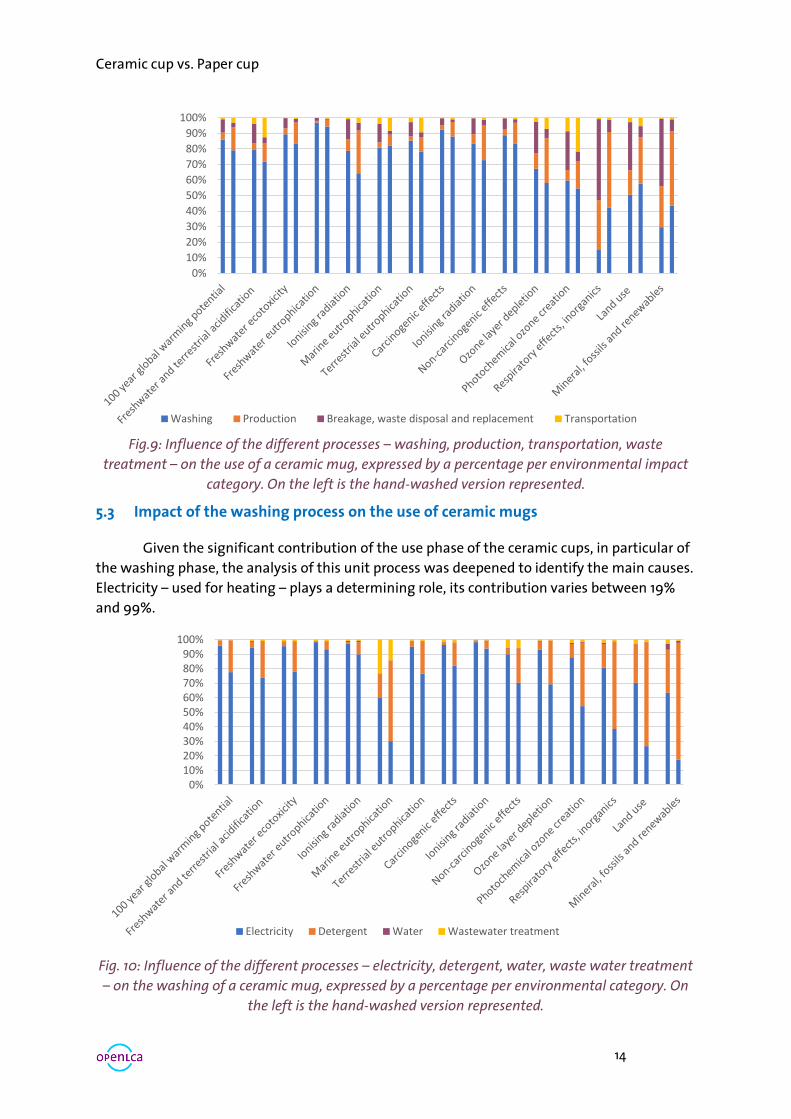
Fig.9: Influence of the different processes – washing, production, transportation, waste
treatment – on the use of a ceramic mug, expressed by a percentage per environmental impact
category. On the left is the hand-washed version represented.
5.3 Impact of the washing process on the use of ceramic mugs
Given the significant contribution of the use phase of the ceramic cups, in particular of
the washing phase, the analysis of this unit process was deepened to identify the main causes.
Electricity – used for heating – plays a determining role, its contribution varies between 19%
and 99%.
Fig. 10: Influence of the different processes – electricity, detergent, water, waste water treatment
– on the washing of a ceramic mug, expressed by a percentage per environmental category. On
the left is the hand-washed version represented.
0%
10%
20%
30%
40%
50%
60%
70%
80%
90%
100%
Washing Production Breakage, waste disposal and replacement Transportation
0% 10% 20% 30% 40% 50% 60% 70% 80% 90%
100%
Electricity Detergent Water Wastewater treatment
Ceramic cup vs. Paper cup
15
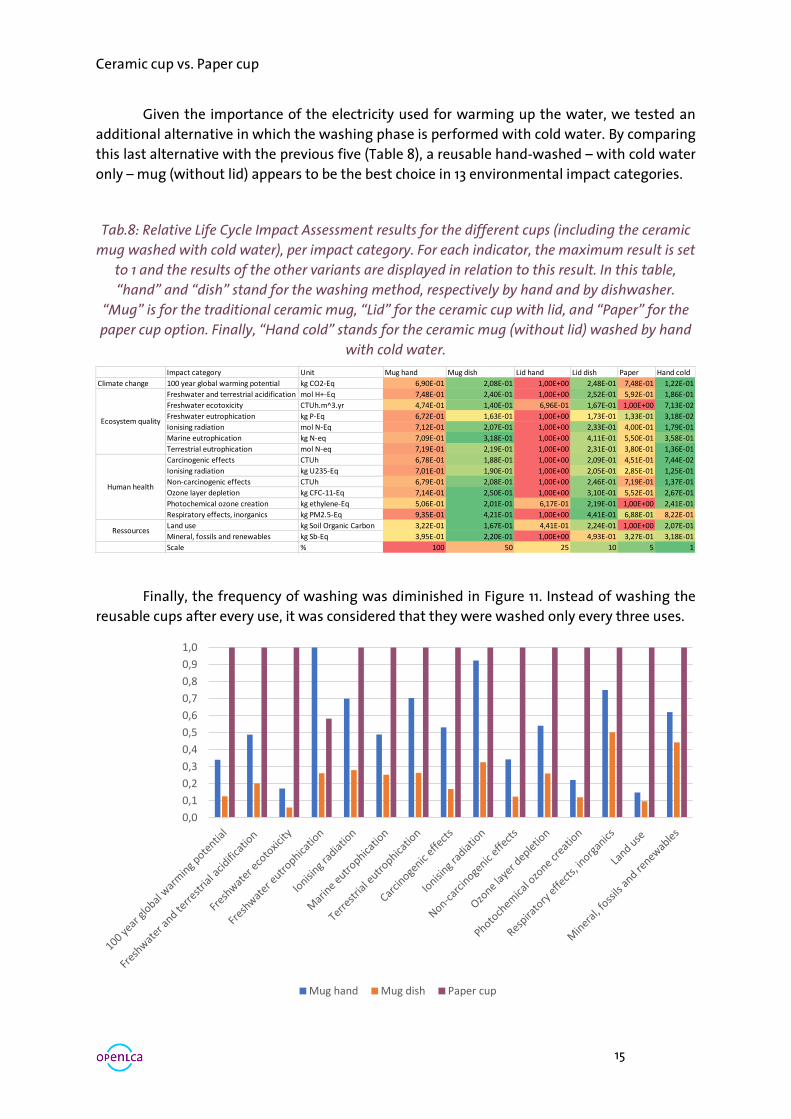
Given the importance of the electricity used for warming up the water, we tested an
additional alternative in which the washing phase is performed with cold water. By comparing
this last alternative with the previous five (Table 8), a reusable hand-washed – with cold water
only – mug (without lid) appears to be the best choice in 13 environmental impact categories.
Tab.8: Relative Life Cycle Impact Assessment results for the different cups (including the ceramic
mug washed with cold water), per impact category. For each indicator, the maximum result is set
to 1 and the results of the other variants are displayed in relation to this result. In this table,
“hand” and “dish” stand for the washing method, respectively by hand and by dishwasher.
“Mug” is for the traditional ceramic mug, “Lid” for the ceramic cup with lid, and “Paper” for the
paper cup option. Finally, “Hand cold” stands for the ceramic mug (without lid) washed by hand
with cold water.
Finally, the frequency of washing was diminished in Figure 11. Instead of washing the
reusable cups after every use, it was considered that they were washed only every three uses.
Impact category Unit Mug hand Mug dish Lid hand Lid dish Paper Hand cold
Climate change 100 year global warming potential kg CO2-Eq 6,90E-01 2,08E-01 1,00E+00 2,48E-01 7,48E-01 1,22E-01
Freshwater and terrestrial acidification mol H+-Eq 7,48E-01 2,40E-01 1,00E+00 2,52E-01 5,92E-01 1,86E-01
Freshwater ecotoxicity CTUh.m^3.yr 4,74E-01 1,40E-01 6,96E-01 1,67E-01 1,00E+00 7,13E-02
Freshwater eutrophication kg P-Eq 6,72E-01 1,63E-01 1,00E+00 1,73E-01 1,33E-01 3,18E-02
Ionising radiation mol N-Eq 7,12E-01 2,07E-01 1,00E+00 2,33E-01 4,00E-01 1,79E-01
Marine eutrophication kg N-eq 7,09E-01 3,18E-01 1,00E+00 4,11E-01 5,50E-01 3,58E-01
Terrestrial eutrophication mol N-eq 7,19E-01 2,19E-01 1,00E+00 2,31E-01 3,80E-01 1,36E-01
Carcinogenic effects CTUh 6,78E-01 1,88E-01 1,00E+00 2,09E-01 4,51E-01 7,44E-02
Ionising radiation kg U235-Eq 7,01E-01 1,90E-01 1,00E+00 2,05E-01 2,85E-01 1,25E-01
Non-carcinogenic effects CTUh 6,79E-01 2,08E-01 1,00E+00 2,46E-01 7,19E-01 1,37E-01
Ozone layer depletion kg CFC-11-Eq 7,14E-01 2,50E-01 1,00E+00 3,10E-01 5,52E-01 2,67E-01
Photochemical ozone creation kg ethylene-Eq 5,06E-01 2,01E-01 6,17E-01 2,19E-01 1,00E+00 2,41E-01
Respiratory effects, inorganics kg PM2.5-Eq 9,35E-01 4,21E-01 1,00E+00 4,41E-01 6,88E-01 8,22E-01
Land use kg Soil Organic Carbon 3,22E-01 1,67E-01 4,41E-01 2,24E-01 1,00E+00 2,07E-01
Mineral, fossils and renewables kg Sb-Eq 3,95E-01 2,20E-01 1,00E+00 4,93E-01 3,27E-01 3,18E-01
Scale % 100 50 25 10 5 1
Ecosystem quality
Human health
Ressources
0,0
0,1
0,2
0,3
0,4
0,5
0,6
0,7
0,8
0,9
1,0
Mug hand Mug dish Paper cup
Ceramic cup vs. Paper cup
16
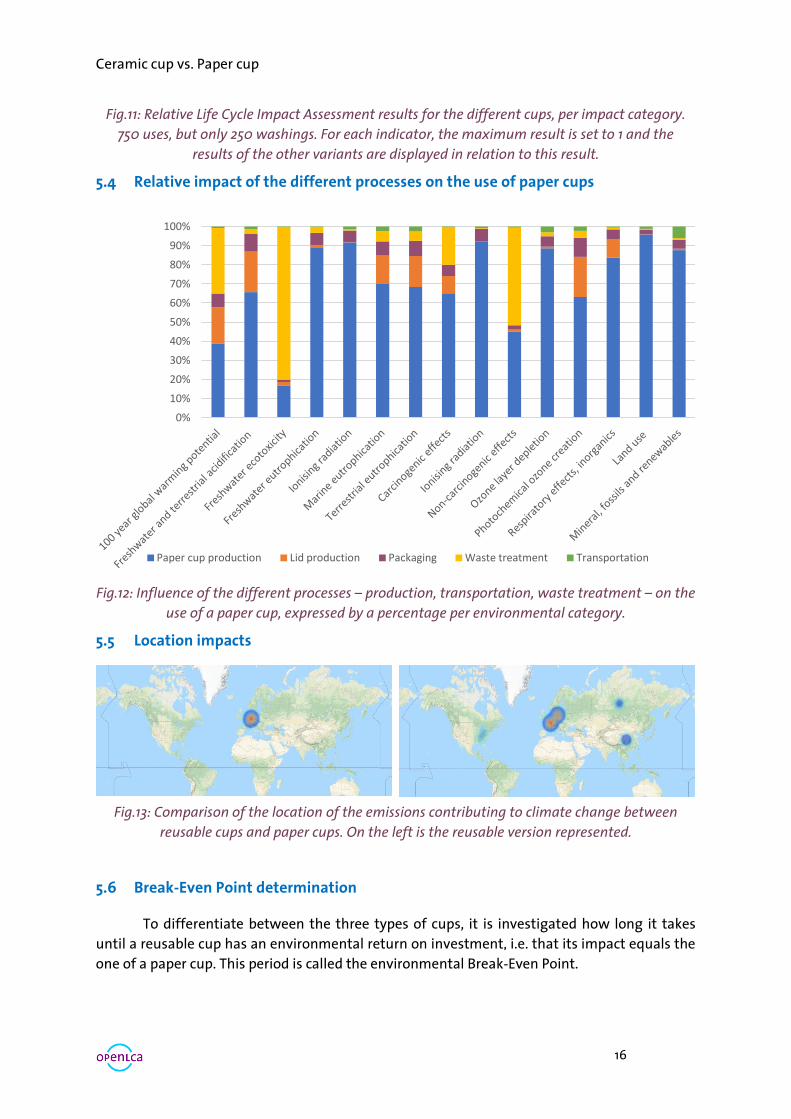
Fig.11: Relative Life Cycle Impact Assessment results for the different cups, per impact category.
750 uses, but only 250 washings. For each indicator, the maximum result is set to 1 and the
results of the other variants are displayed in relation to this result.
5.4 Relative impact of the different processes on the use of paper cups
Fig.12: Influence of the different processes – production, transportation, waste treatment – on the
use of a paper cup, expressed by a percentage per environmental category.
5.5 Location impacts
Fig.13: Comparison of the location of the emissions contributing to climate change between
reusable cups and paper cups. On the left is the reusable version represented.
5.6 Break-Even Point determination
To differentiate between the three types of cups, it is investigated how long it takes
until a reusable cup has an environmental return on investment, i.e. that its impact equals the
one of a paper cup. This period is called the environmental Break-Even Point.
0%
10%
20%
30%
40%
50%
60%
70%
80%
90%
100%
Paper cup production Lid production Packaging Waste treatment Transportation
Ceramic cup vs. Paper cup
17
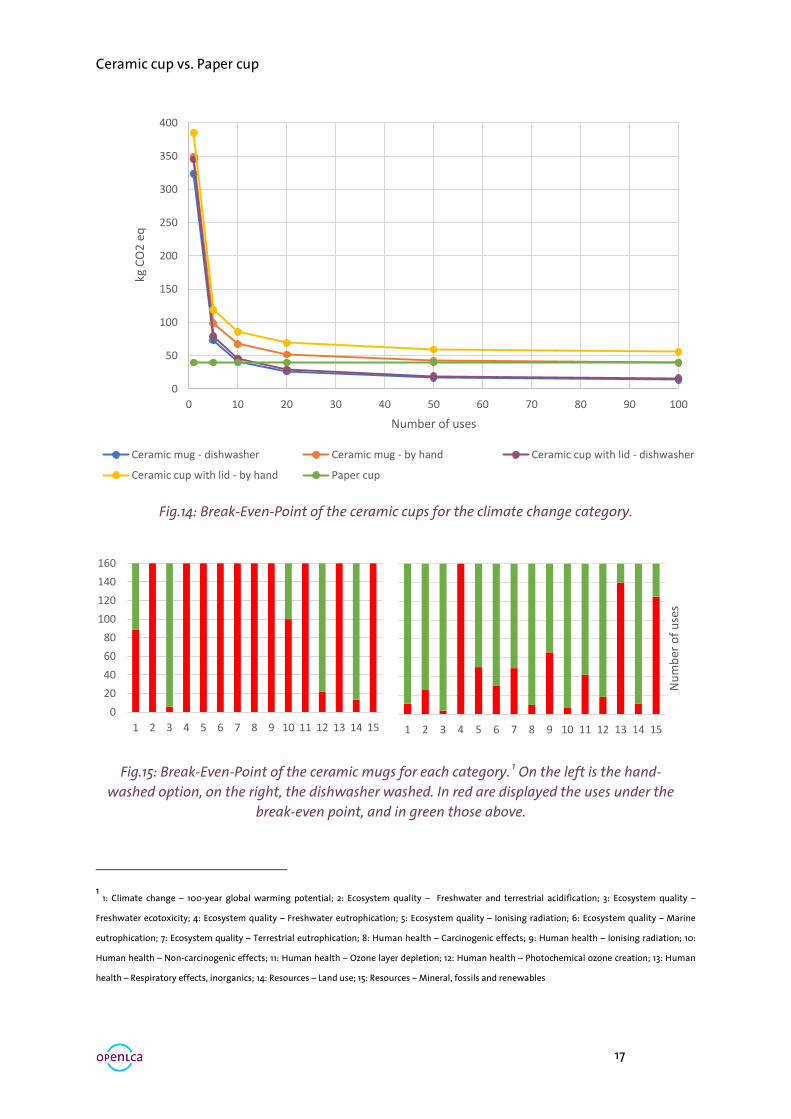
Fig.14: Break-Even-Point of the ceramic cups for the climate change category.
Fig.15: Break-Even-Point of the ceramic mugs for each category. 1 On the left is the hand-
washed option, on the right, the dishwasher washed. In red are displayed the uses under the
break-even point, and in green those above.
1 1: Climate change – 100-year global warming potential; 2: Ecosystem quality – Freshwater and terrestrial acidification; 3: Ecosystem quality –
Freshwater ecotoxicity; 4: Ecosystem quality – Freshwater eutrophication; 5: Ecosystem quality – Ionising radiation; 6: Ecosystem quality – Marine
eutrophication; 7: Ecosystem quality – Terrestrial eutrophication; 8: Human health – Carcinogenic effects; 9: Human health – Ionising radiation; 10:
Human health – Non-carcinogenic effects; 11: Human health – Ozone layer depletion; 12: Human health – Photochemical ozone creation; 13: Human
health – Respiratory effects, inorganics; 14: Resources – Land use; 15: Resources – Mineral, fossils and renewables
0
50
100
150
200
250
300
350
400
0 10 20 30 40 50 60 70 80 90 100
kg C
O2
eq
Number of uses
Ceramic mug - dishwasher Ceramic mug - by hand Ceramic cup with lid - dishwasher
Ceramic cup with lid - by hand Paper cup
0
20
40
60
80
100
120
140
160
1 2 3 4 5 6 7 8 9 10 11 12 13 14 15 1 2 3 4 5 6 7 8 9 10 11 12 13 14 15
Nu
mb
er o
f u
ses
Ceramic cup vs. Paper cup
18
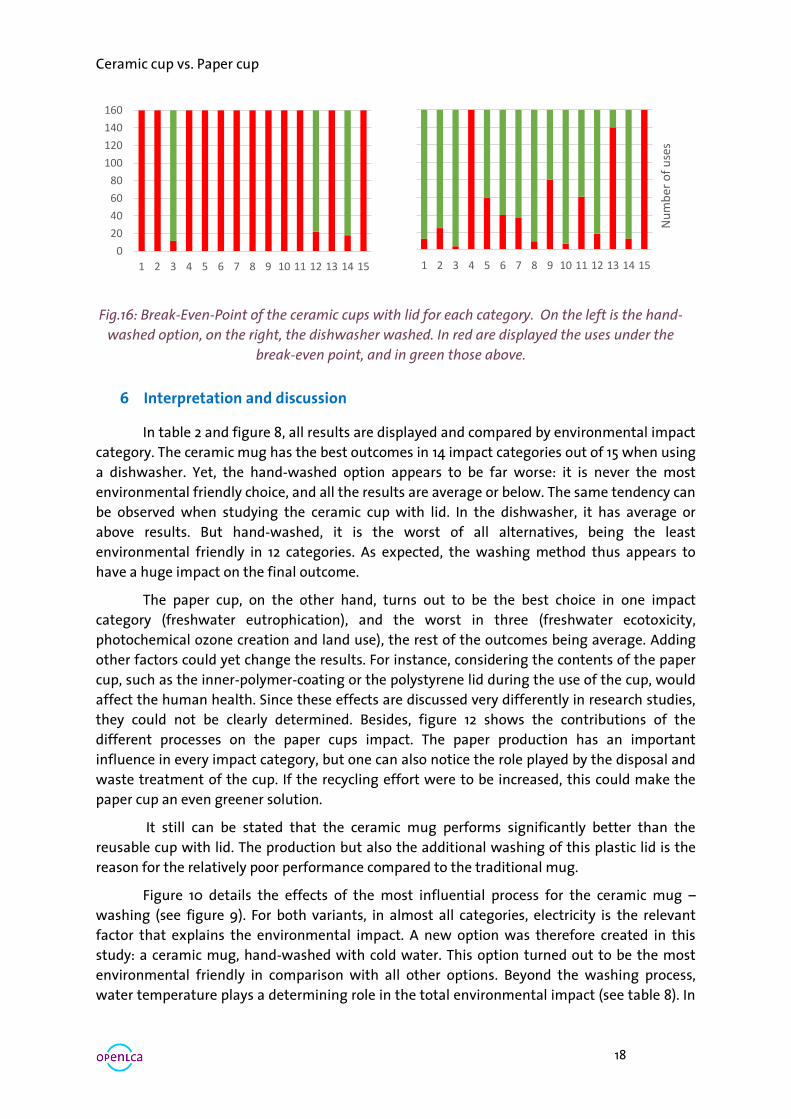
Fig.16: Break-Even-Point of the ceramic cups with lid for each category. On the left is the hand-
washed option, on the right, the dishwasher washed. In red are displayed the uses under the
break-even point, and in green those above.
6 Interpretation and discussion
In table 2 and figure 8, all results are displayed and compared by environmental impact
category. The ceramic mug has the best outcomes in 14 impact categories out of 15 when using
a dishwasher. Yet, the hand-washed option appears to be far worse: it is never the most
environmental friendly choice, and all the results are average or below. The same tendency can
be observed when studying the ceramic cup with lid. In the dishwasher, it has average or
above results. But hand-washed, it is the worst of all alternatives, being the least
environmental friendly in 12 categories. As expected, the washing method thus appears to
have a huge impact on the final outcome.
The paper cup, on the other hand, turns out to be the best choice in one impact
category (freshwater eutrophication), and the worst in three (freshwater ecotoxicity,
photochemical ozone creation and land use), the rest of the outcomes being average. Adding
other factors could yet change the results. For instance, considering the contents of the paper
cup, such as the inner-polymer-coating or the polystyrene lid during the use of the cup, would
affect the human health. Since these effects are discussed very differently in research studies,
they could not be clearly determined. Besides, figure 12 shows the contributions of the
different processes on the paper cups impact. The paper production has an important
influence in every impact category, but one can also notice the role played by the disposal and
waste treatment of the cup. If the recycling effort were to be increased, this could make the
paper cup an even greener solution.
It still can be stated that the ceramic mug performs significantly better than the
reusable cup with lid. The production but also the additional washing of this plastic lid is the
reason for the relatively poor performance compared to the traditional mug.
Figure 10 details the effects of the most influential process for the ceramic mug –
washing (see figure 9). For both variants, in almost all categories, electricity is the relevant
factor that explains the environmental impact. A new option was therefore created in this
study: a ceramic mug, hand-washed with cold water. This option turned out to be the most
environmental friendly in comparison with all other options. Beyond the washing process,
water temperature plays a determining role in the total environmental impact (see table 8). In
0
20
40
60
80
100
120
140
160
1 2 3 4 5 6 7 8 9 10 11 12 13 14 15 1 2 3 4 5 6 7 8 9 10 11 12 13 14 15
Nu
mb
er o
f u
ses
Ceramic cup vs. Paper cup
19
the figure 11 is the frequency of washing studied. If the cups have been used 750 but washed
only every three uses, the impacts of the washing are reduced and the paper cup becomes
then the worst choice.
More surprisingly, the transportation factor, and thus the production location (see
figures 9 and 12) does not have a significant influence on the global impact. From a global
environmental perspective, it is consequently almost irrelevant whether the cups are produced
in Asia or Europe. Nevertheless, one can observe different effects on climate change
depending on the location, especially for the paper cup (see figure 14). It has indeed an impact
on Europe, mostly due to waste treatment and polystyrene production, but also in Asia
because of the paper production. On the contrary, for reusable cups, the effects are
concentrated in Europe since the main process – washing – requires electricity production.
Finally, the break-even points of the reusable cups are calculated (see figures 14-15-16).
After 11 uses, the impact of the entire life cycle on climate change of the ceramic mug,
dishwasher washed, equals the impact of the paper cups. This phenomenon happens after 13
uses of the dishwasher-washed ceramic cup with lid. When hand-washed, the ceramic cup
with lid never reaches a break-even point, whereas without, it requires 89 uses. Based on these
outcomes, considering all impact categories, it is then recommended that hot drinks should be
consumed in ceramic mugs, provided that these cups are washed with a modern dishwasher
and used at least 140 times.
The Life Cycle Analysis of the cups faces a high level of uncertainty. In some cases,
variables could only be estimated and values of similar products had to replace missing data,
which influences the results. The washing data are particularly decisive for assessing the
impact. Individual washing habits could not be considered either. Using an older dishwasher
would change the final results, and the ceramic mug would tend to have a bigger impact.
Based on the results of this study, it is generally recommended to use a conventional ceramic
cup over a long period of time and to wash it off continuously by means of a dishwasher, or by
hand without hot water. However, to enjoy an occasional coffee-to-go, the paper cup remains
a greener option.
7 Bibliography
[1] Deutsche Umwelt Hilfe, “Berliner werden Becherhelden: Startschuss für Coffee to go-Mehrwegbecher – Deutsche Umwelthilfe e.V.,” 2017. .
[2] L. Woods and B. R. Bakshi, “Reusable vs. disposable cups revisited: guidance in life cycle comparisons ad-dressing scenario, model, and parameter uncertainties for the US consumer.,” 2014.
[3] Der Tagesspiegel, “Kaffee ohne Abfall: Was Berlin gegen die Pappbecher tun will - Wirtschaft - Tagesspiegel,” 2016. .
[4] Clean Water Action, “Greenhouse Gas Impacts of Disposable vs Reusable Foodservice Products,” 2017.
[5] Deutsche Umwelthilfe e.V., “Coffee to go-Einwegbecher - Umweltauswirkungen und Alternativen: Hintergrundpapier der Deutschen Umwelthilfe,” pp. 1–18, 2015.
[6] Highflyers Werbeartikel GmbH, “Tasse Ulla - 300 ml.” .
[7] Coffee-2-go, “Porzellan Coffee to go.” .
[8] Trinity College Dublin, “Lifecycle Assessment: reusable mugs vs. disposable cups,” 2013.
Ceramic cup vs. Paper cup
20
[9] GED Gesellschaft für Energiedienstleistung - GmbH & Co. KG, “HAUSGERÄTE+ / Energielabel,” 2017. .
[10] S. Aitouche and T. Ziane, “Formulation et étude de la stabilité d’un détergent liquide vaisselle Pril Isis,” Université A.MIRA-Bejaia, 2017.
[11] allesbecher, “Pappbecher Coffee to Go D4 300ml | Allesbecher.de.” .
Feedback & Contact
If you have other questions not addressed by this document, or should you need further
clarifications on any of the points commented, then please contact us:
Tel. +49 30 48 496 – 030
Fax +49 30 48 496 – 991
GreenDelta GmbH
Müllerstrasse 135
D-13357 Berlin, Germany
www.greendelta.com
8 Appendix
9.1 Inventory analysis
9.1.1 Parameters
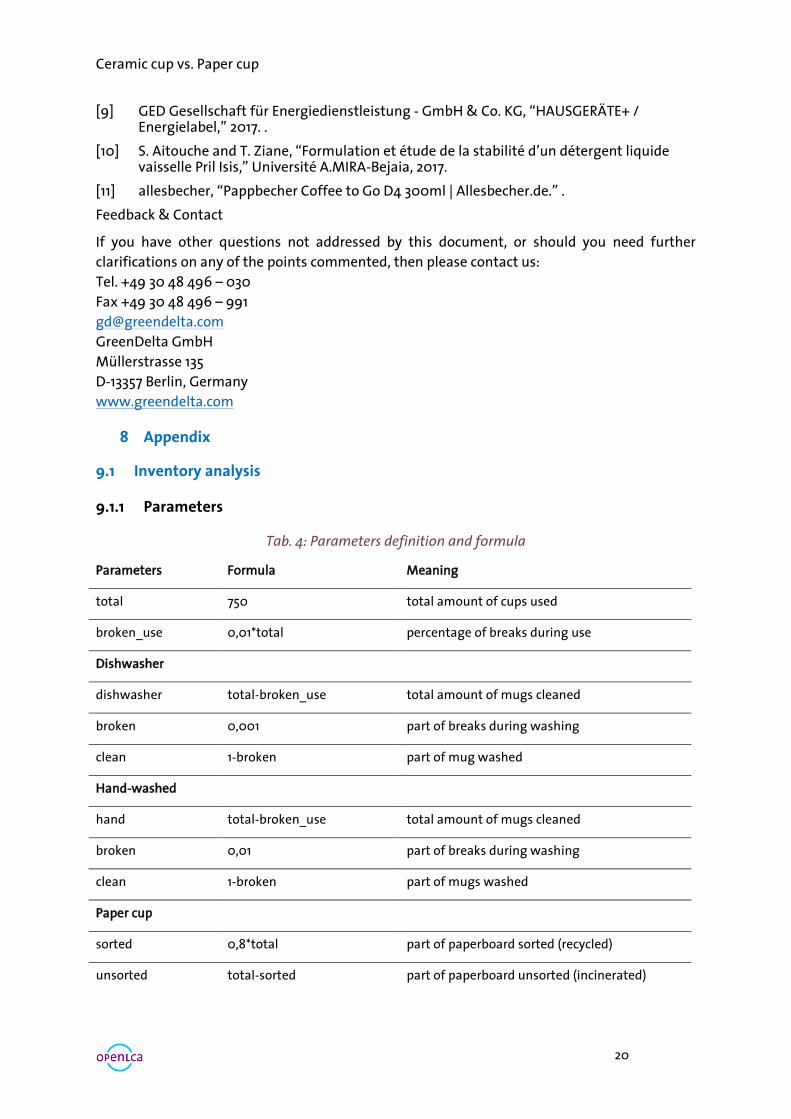
Tab. 4: Parameters definition and formula
Parameters Formula Meaning
total 750 total amount of cups used
broken_use 0,01*total percentage of breaks during use
Dishwasher
dishwasher total-broken_use total amount of mugs cleaned
broken 0,001 part of breaks during washing
clean 1-broken part of mug washed
Hand-washed
hand total-broken_use total amount of mugs cleaned
broken 0,01 part of breaks during washing
clean 1-broken part of mugs washed
Paper cup
sorted 0,8*total part of paperboard sorted (recycled)
unsorted total-sorted part of paperboard unsorted (incinerated)
Ceramic cup vs. Paper cup
21
9.1.2 Ceramic mug – dishwasher
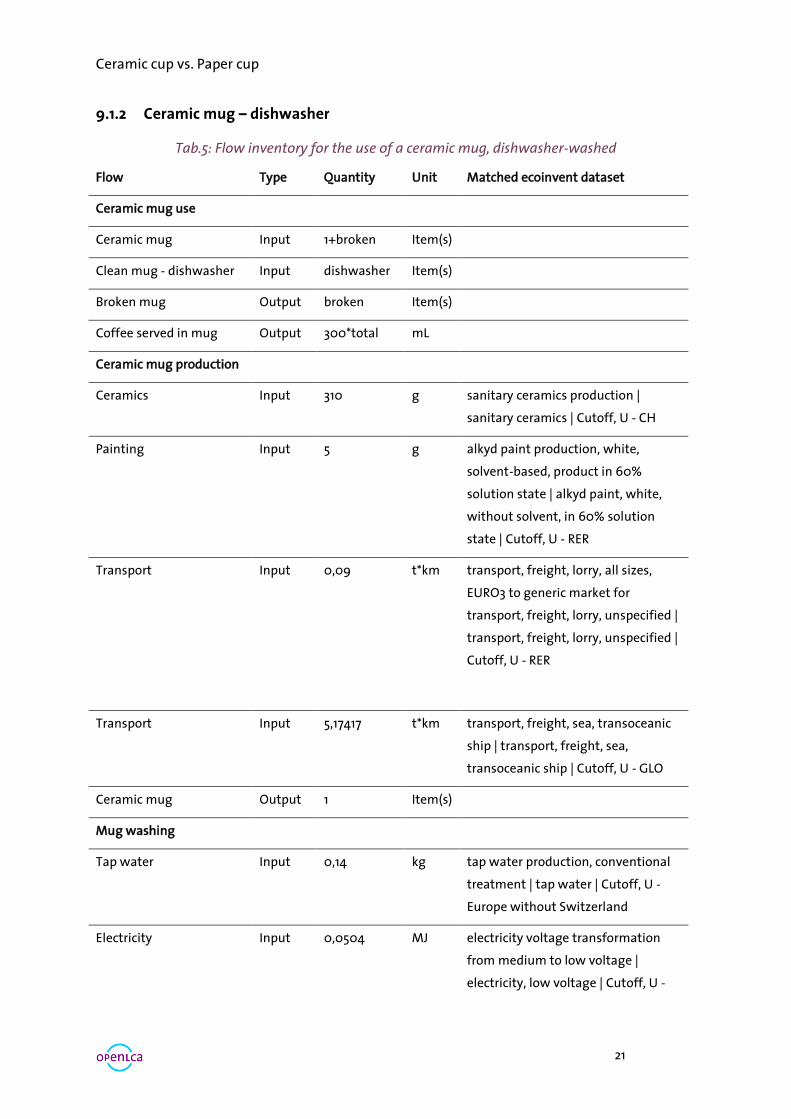
Tab.5: Flow inventory for the use of a ceramic mug, dishwasher-washed
Flow Type Quantity Unit Matched ecoinvent dataset
Ceramic mug use
Ceramic mug Input 1+broken Item(s)
Clean mug - dishwasher Input dishwasher Item(s)
Broken mug Output broken Item(s)
Coffee served in mug Output 300*total mL
Ceramic mug production
Ceramics Input 310 g sanitary ceramics production |
sanitary ceramics | Cutoff, U - CH
Painting Input 5 g alkyd paint production, white,
solvent-based, product in 60%
solution state | alkyd paint, white,
without solvent, in 60% solution
state | Cutoff, U - RER
Transport
Input
0,09 t*km transport, freight, lorry, all sizes,
EURO3 to generic market for
transport, freight, lorry, unspecified |
transport, freight, lorry, unspecified |
Cutoff, U - RER
Transport Input 5,17417 t*km transport, freight, sea, transoceanic
ship | transport, freight, sea,
transoceanic ship | Cutoff, U - GLO
Ceramic mug Output 1 Item(s)
Mug washing
Tap water Input 0,14 kg tap water production, conventional
treatment | tap water | Cutoff, U -
Europe without Switzerland
Electricity Input 0,0504 MJ electricity voltage transformation
from medium to low voltage |
electricity, low voltage | Cutoff, U -
Ceramic cup vs. Paper cup
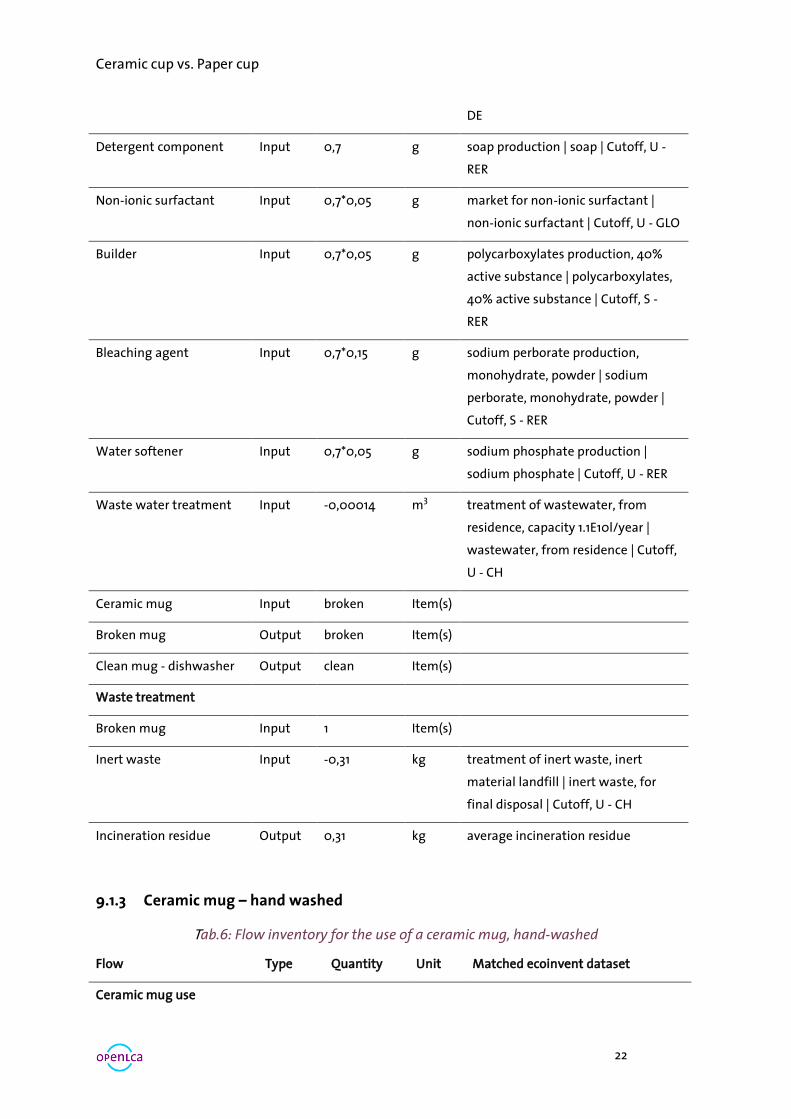
22
DE
Detergent component Input 0,7 g soap production | soap | Cutoff, U -
RER
Non-ionic surfactant Input 0,7*0,05 g market for non-ionic surfactant |
non-ionic surfactant | Cutoff, U - GLO
Builder Input 0,7*0,05 g polycarboxylates production, 40%
active substance | polycarboxylates,
40% active substance | Cutoff, S -
RER
Bleaching agent Input 0,7*0,15 g sodium perborate production,
monohydrate, powder | sodium
perborate, monohydrate, powder |
Cutoff, S - RER
Water softener Input 0,7*0,05 g sodium phosphate production |
sodium phosphate | Cutoff, U - RER
Waste water treatment Input -0,00014 m3 treatment of wastewater, from
residence, capacity 1.1E10l/year |
wastewater, from residence | Cutoff,
U - CH
Ceramic mug Input broken Item(s)
Broken mug Output broken Item(s)
Clean mug - dishwasher Output clean Item(s)
Waste treatment
Broken mug Input 1 Item(s)
Inert waste Input -0,31 kg treatment of inert waste, inert
material landfill | inert waste, for
final disposal | Cutoff, U - CH
Incineration residue Output 0,31 kg average incineration residue
9.1.3 Ceramic mug – hand washed
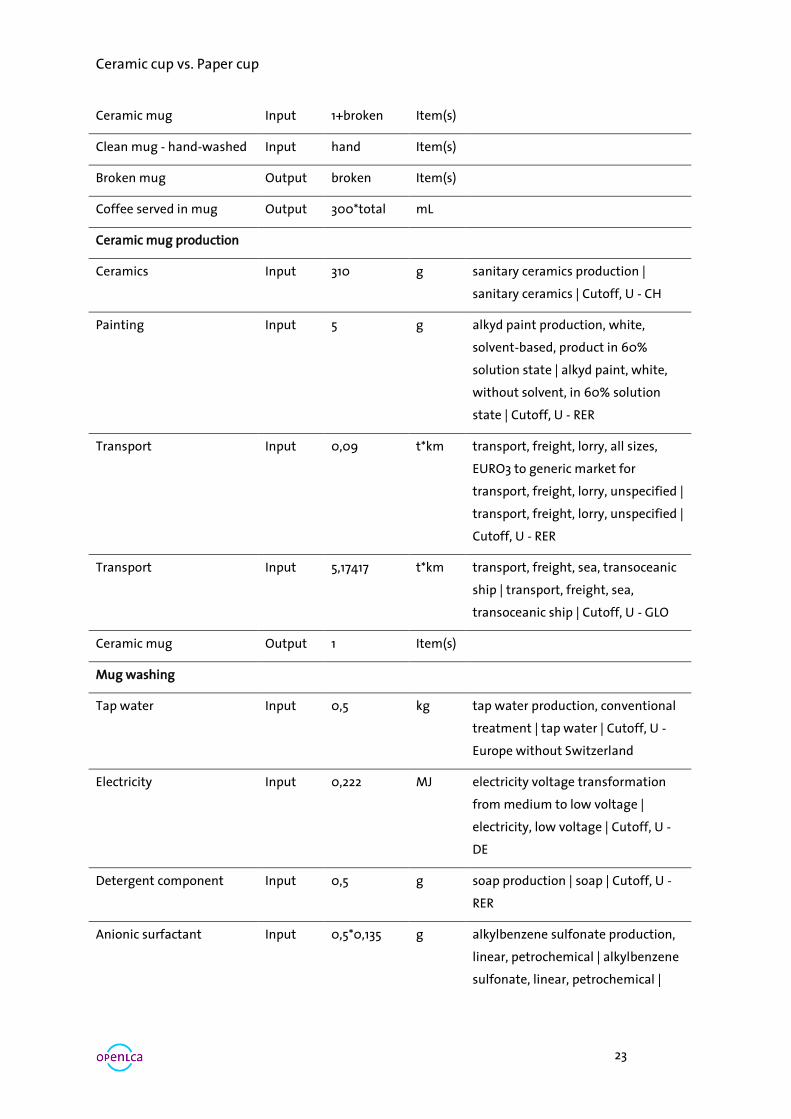
Tab.6: Flow inventory for the use of a ceramic mug, hand-washed
Flow Type Quantity Unit Matched ecoinvent dataset
Ceramic mug use
Ceramic cup vs. Paper cup
23
Ceramic mug Input 1+broken Item(s)
Clean mug - hand-washed Input hand Item(s)
Broken mug Output broken Item(s)
Coffee served in mug Output 300*total mL
Ceramic mug production
Ceramics Input 310 g sanitary ceramics production |
sanitary ceramics | Cutoff, U - CH
Painting Input 5 g alkyd paint production, white,
solvent-based, product in 60%
solution state | alkyd paint, white,
without solvent, in 60% solution
state | Cutoff, U - RER
Transport
Input
0,09 t*km transport, freight, lorry, all sizes,
EURO3 to generic market for
transport, freight, lorry, unspecified |
transport, freight, lorry, unspecified |
Cutoff, U - RER
Transport Input 5,17417 t*km transport, freight, sea, transoceanic
ship | transport, freight, sea,
transoceanic ship | Cutoff, U - GLO
Ceramic mug Output 1 Item(s)
Mug washing
Tap water Input 0,5 kg tap water production, conventional
treatment | tap water | Cutoff, U -
Europe without Switzerland
Electricity Input 0,222 MJ electricity voltage transformation
from medium to low voltage |
electricity, low voltage | Cutoff, U -
DE
Detergent component Input 0,5 g soap production | soap | Cutoff, U -
RER
Anionic surfactant Input 0,5*0,135 g alkylbenzene sulfonate production,
linear, petrochemical | alkylbenzene
sulfonate, linear, petrochemical |
Ceramic cup vs. Paper cup
24
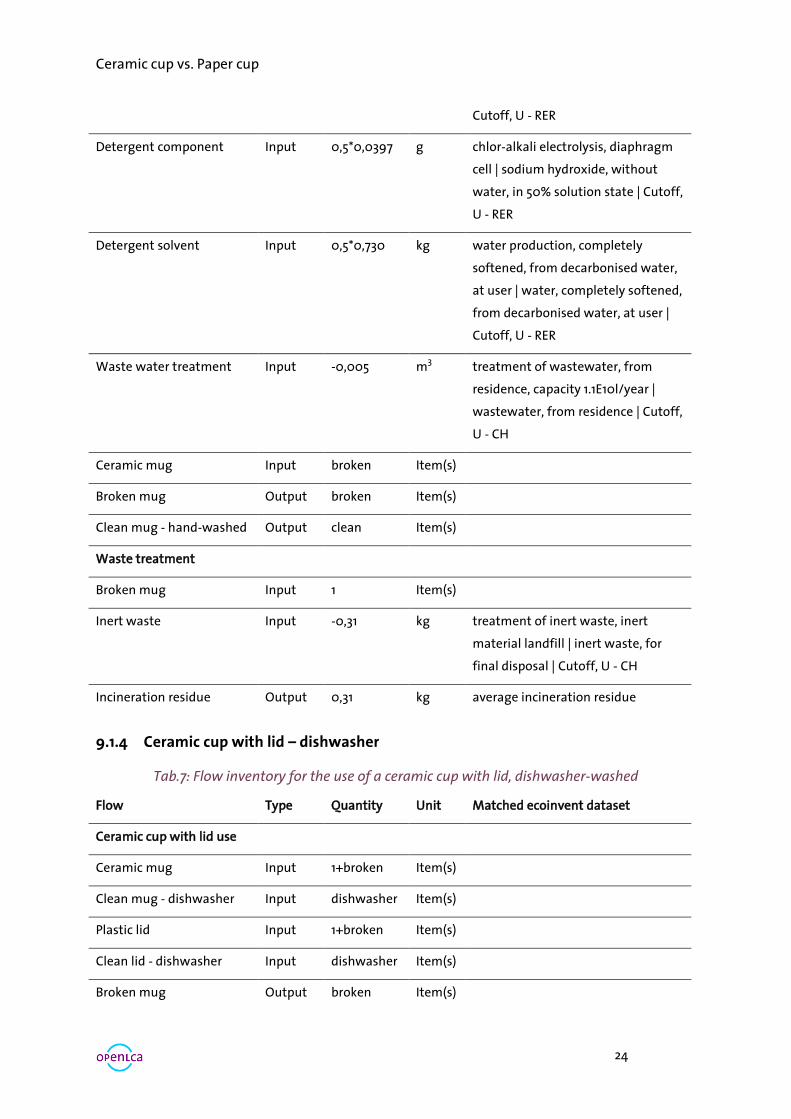
Cutoff, U - RER
Detergent component Input 0,5*0,0397 g chlor-alkali electrolysis, diaphragm
cell | sodium hydroxide, without
water, in 50% solution state | Cutoff,
U - RER
Detergent solvent Input 0,5*0,730 kg water production, completely
softened, from decarbonised water,
at user | water, completely softened,
from decarbonised water, at user |
Cutoff, U - RER
Waste water treatment Input -0,005 m3 treatment of wastewater, from
residence, capacity 1.1E10l/year |
wastewater, from residence | Cutoff,
U - CH
Ceramic mug Input broken Item(s)
Broken mug Output broken Item(s)
Clean mug - hand-washed Output clean Item(s)
Waste treatment
Broken mug Input 1 Item(s)
Inert waste Input -0,31 kg treatment of inert waste, inert
material landfill | inert waste, for
final disposal | Cutoff, U - CH
Incineration residue Output 0,31 kg average incineration residue
9.1.4 Ceramic cup with lid – dishwasher
Tab.7: Flow inventory for the use of a ceramic cup with lid, dishwasher-washed
Flow Type Quantity Unit Matched ecoinvent dataset
Ceramic cup with lid use
Ceramic mug Input 1+broken Item(s)
Clean mug - dishwasher Input dishwasher Item(s)
Plastic lid Input 1+broken Item(s)
Clean lid - dishwasher Input dishwasher Item(s)
Broken mug Output broken Item(s)
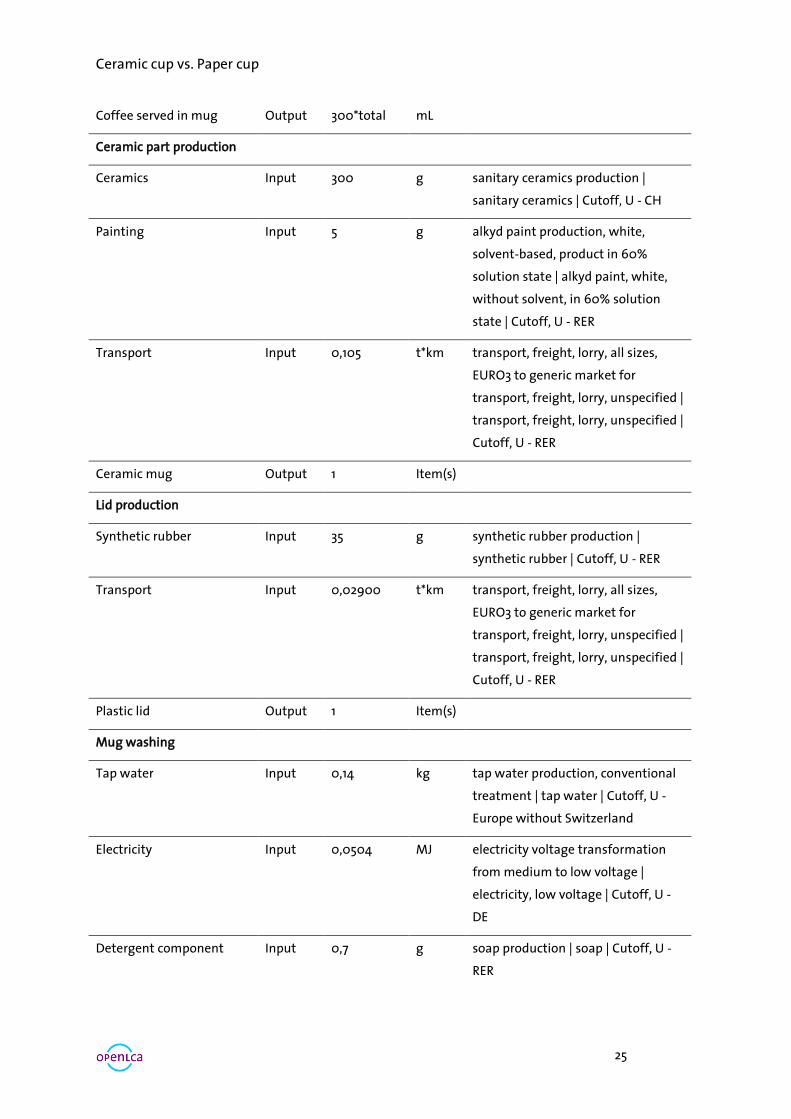
Ceramic cup vs. Paper cup
25
Coffee served in mug Output 300*total mL
Ceramic part production
Ceramics Input 300 g sanitary ceramics production |
sanitary ceramics | Cutoff, U - CH
Painting Input 5 g alkyd paint production, white,
solvent-based, product in 60%
solution state | alkyd paint, white,
without solvent, in 60% solution
state | Cutoff, U - RER
Transport
Input
0,105 t*km transport, freight, lorry, all sizes,
EURO3 to generic market for
transport, freight, lorry, unspecified |
transport, freight, lorry, unspecified |
Cutoff, U - RER
Ceramic mug Output 1 Item(s)
Lid production
Synthetic rubber Input 35 g synthetic rubber production |
synthetic rubber | Cutoff, U - RER
Transport Input 0,02900 t*km transport, freight, lorry, all sizes,
EURO3 to generic market for
transport, freight, lorry, unspecified |
transport, freight, lorry, unspecified |
Cutoff, U - RER
Plastic lid Output 1 Item(s)
Mug washing
Tap water Input 0,14 kg tap water production, conventional
treatment | tap water | Cutoff, U -
Europe without Switzerland
Electricity Input 0,0504 MJ electricity voltage transformation
from medium to low voltage |
electricity, low voltage | Cutoff, U -
DE
Detergent component Input 0,7 g soap production | soap | Cutoff, U -
RER
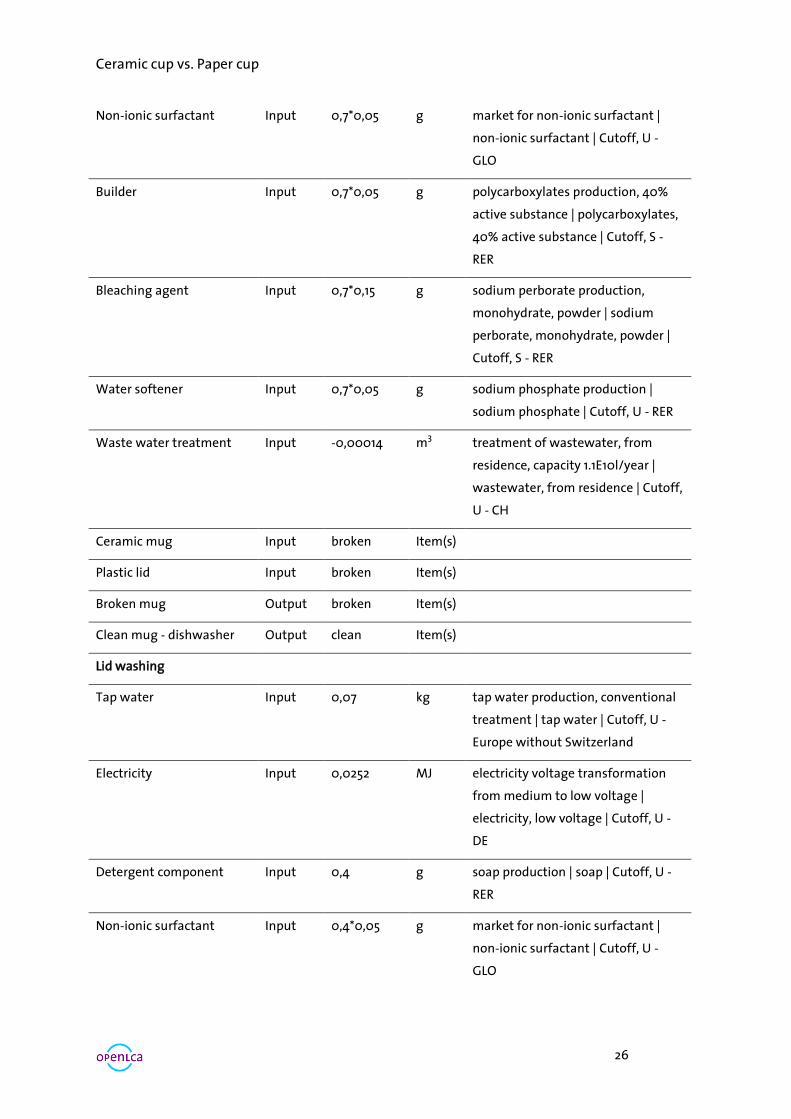
Ceramic cup vs. Paper cup
26
Non-ionic surfactant Input 0,7*0,05 g market for non-ionic surfactant |
non-ionic surfactant | Cutoff, U -
GLO
Builder Input 0,7*0,05 g polycarboxylates production, 40%
active substance | polycarboxylates,
40% active substance | Cutoff, S -
RER
Bleaching agent Input 0,7*0,15 g sodium perborate production,
monohydrate, powder | sodium
perborate, monohydrate, powder |
Cutoff, S - RER
Water softener Input 0,7*0,05 g sodium phosphate production |
sodium phosphate | Cutoff, U - RER
Waste water treatment Input -0,00014 m3 treatment of wastewater, from
residence, capacity 1.1E10l/year |
wastewater, from residence | Cutoff,
U - CH
Ceramic mug Input broken Item(s)
Plastic lid Input broken Item(s)
Broken mug Output broken Item(s)
Clean mug - dishwasher Output clean Item(s)
Lid washing
Tap water Input 0,07 kg tap water production, conventional
treatment | tap water | Cutoff, U -
Europe without Switzerland
Electricity Input 0,0252 MJ electricity voltage transformation
from medium to low voltage |
electricity, low voltage | Cutoff, U -
DE
Detergent component Input 0,4 g soap production | soap | Cutoff, U -
RER
Non-ionic surfactant Input 0,4*0,05 g market for non-ionic surfactant |
non-ionic surfactant | Cutoff, U -
GLO
Ceramic cup vs. Paper cup
27
Builder Input 0,4*0,05 g polycarboxylates production, 40%
active substance | polycarboxylates,
40% active substance | Cutoff, S -
RER
Bleaching agent Input 0,4*0,15 g sodium perborate production,
monohydrate, powder | sodium
perborate, monohydrate, powder |
Cutoff, S - RER
Water softener Input 0,4*0,05 g sodium phosphate production |
sodium phosphate | Cutoff, U - RER
Waste water treatment Input -0,00007 m3 treatment of wastewater, from
residence, capacity 1.1E10l/year |
wastewater, from residence | Cutoff,
U - CH
Clean lid Output 1 Item(s)
Waste treatment
Broken mug Input 1 Item(s)
Inert waste Input -300 g treatment of inert waste, inert
material landfill | inert waste, for
final disposal | Cutoff, U - CH
Plastic waste Input -35 g treatment of waste plastic plaster,
collection for final disposal | waste
plastic plaster | Cutoff, U - CH
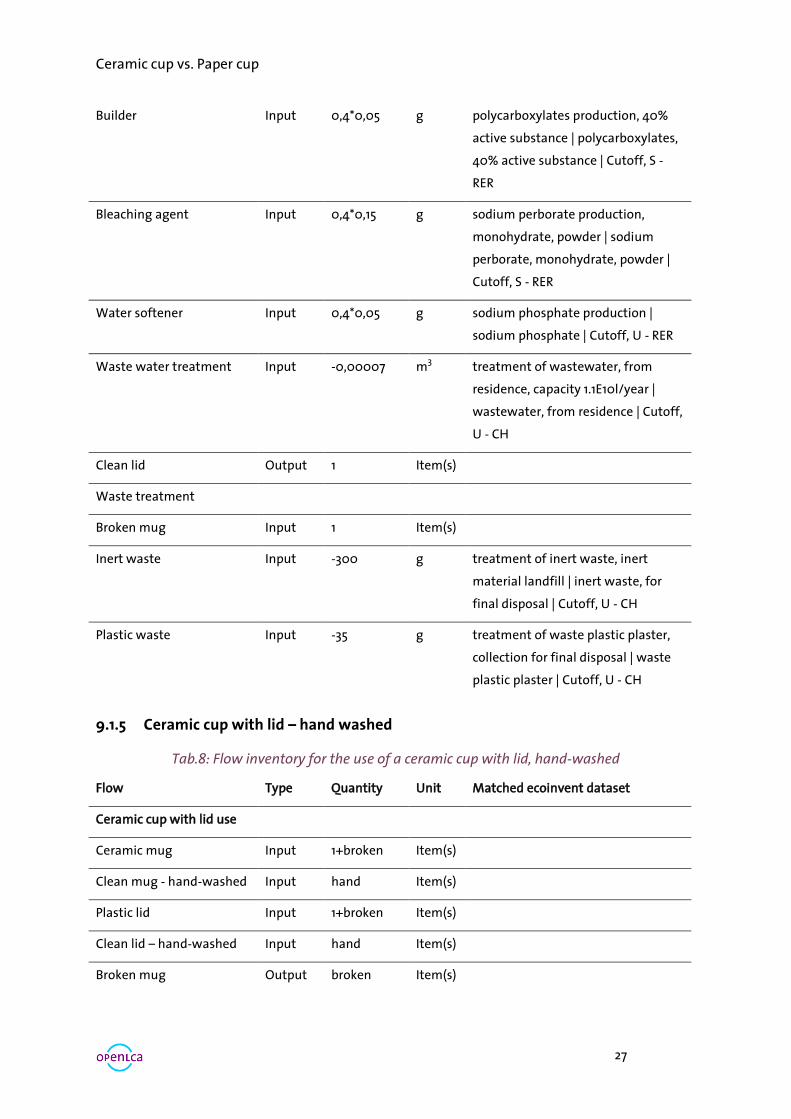
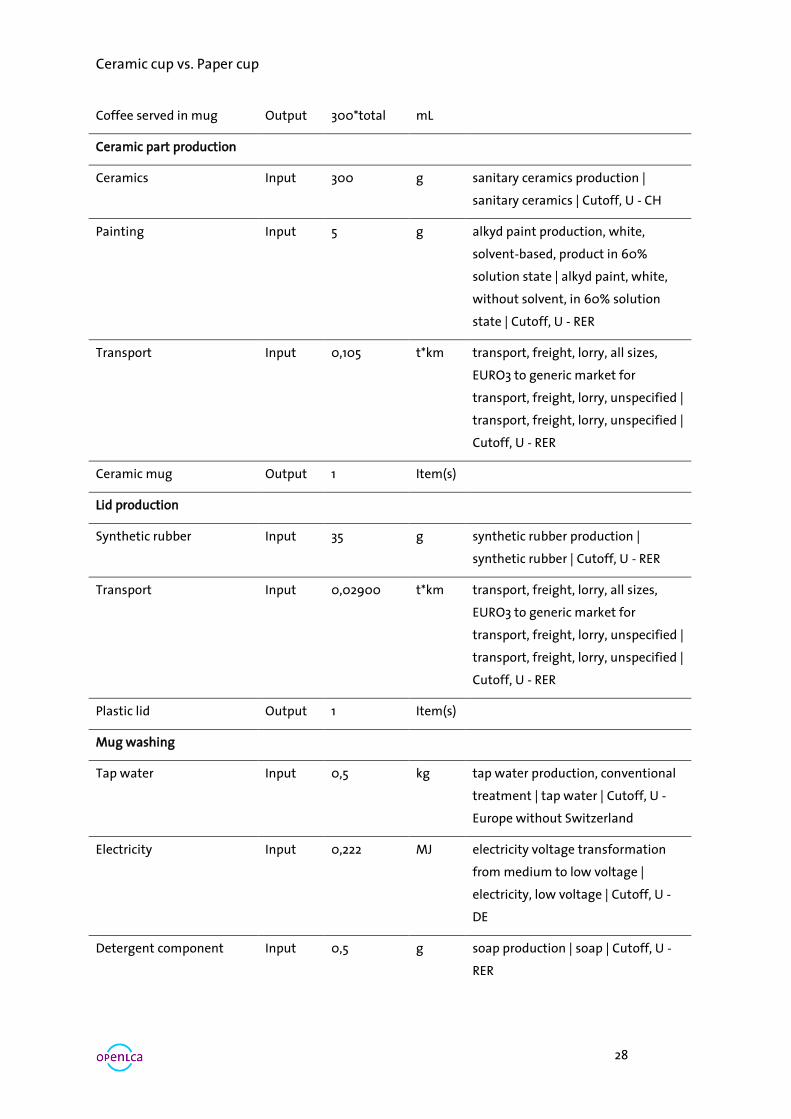
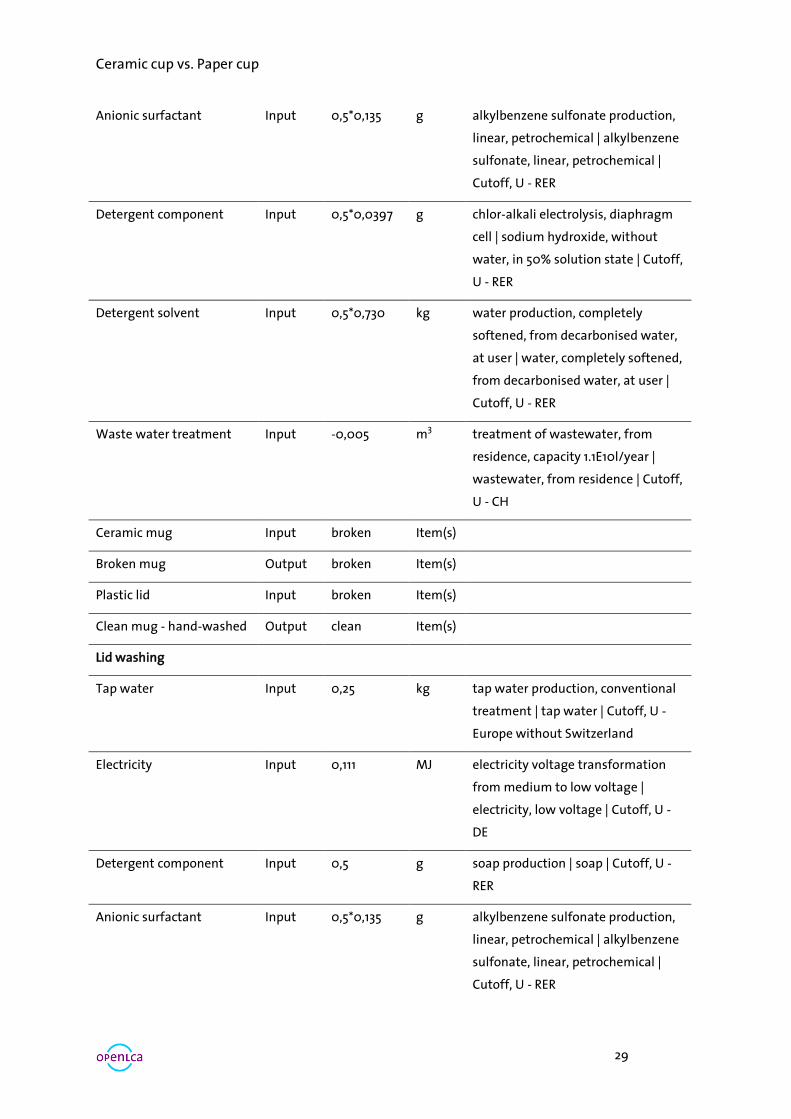
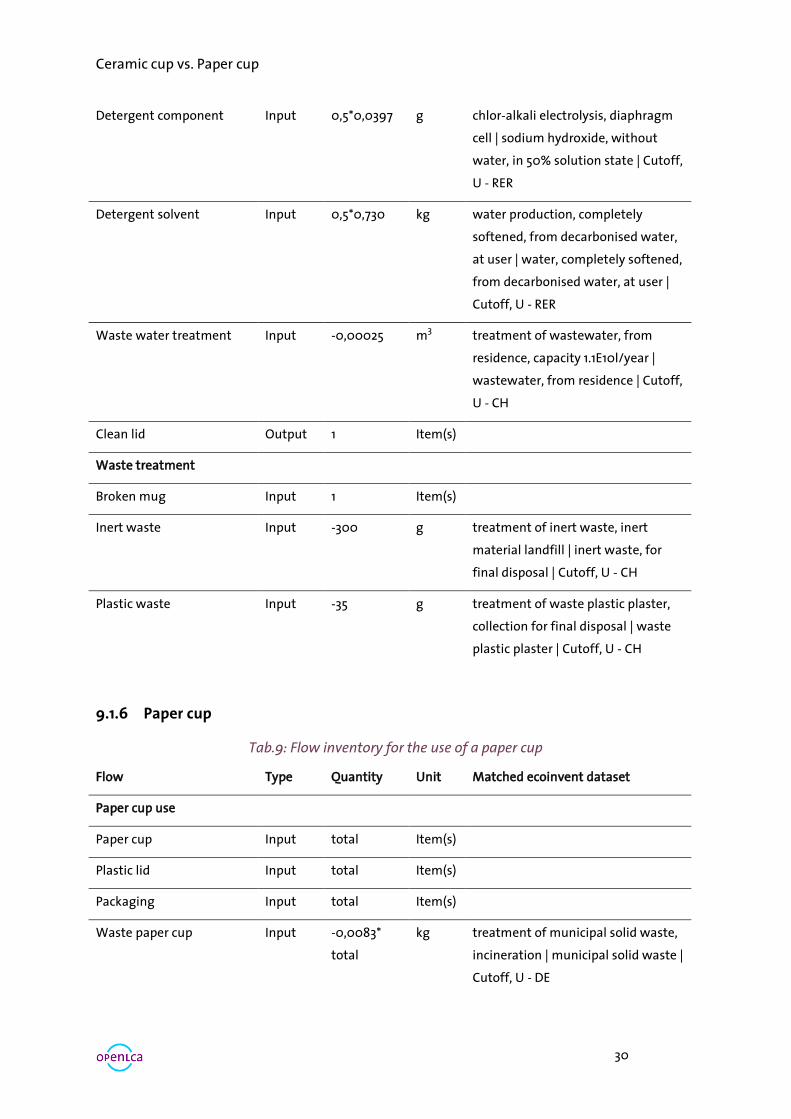
9.1.5 Ceramic cup with lid – hand washed
Tab.8: Flow inventory for the use of a ceramic cup with lid, hand-washed
Flow Type Quantity Unit Matched ecoinvent dataset
Ceramic cup with lid use
Ceramic mug Input 1+broken Item(s)
Clean mug - hand-washed Input hand Item(s)
Plastic lid Input 1+broken Item(s)
Clean lid – hand-washed Input hand Item(s)
Broken mug Output broken Item(s)
Ceramic cup vs. Paper cup
28
Coffee served in mug Output 300*total mL
Ceramic part production
Ceramics Input 300 g sanitary ceramics production |
sanitary ceramics | Cutoff, U - CH
Painting Input 5 g alkyd paint production, white,
solvent-based, product in 60%
solution state | alkyd paint, white,
without solvent, in 60% solution
state | Cutoff, U - RER
Transport
Input
0,105 t*km transport, freight, lorry, all sizes,
EURO3 to generic market for
transport, freight, lorry, unspecified |
transport, freight, lorry, unspecified |
Cutoff, U - RER
Ceramic mug Output 1 Item(s)
Lid production
Synthetic rubber Input 35 g synthetic rubber production |
synthetic rubber | Cutoff, U - RER
Transport Input 0,02900 t*km transport, freight, lorry, all sizes,
EURO3 to generic market for
transport, freight, lorry, unspecified |
transport, freight, lorry, unspecified |
Cutoff, U - RER
Plastic lid Output 1 Item(s)
Mug washing
Tap water Input 0,5 kg tap water production, conventional
treatment | tap water | Cutoff, U -
Europe without Switzerland
Electricity Input 0,222 MJ electricity voltage transformation
from medium to low voltage |
electricity, low voltage | Cutoff, U -
DE
Detergent component Input 0,5 g soap production | soap | Cutoff, U -
RER
Ceramic cup vs. Paper cup
29
Anionic surfactant Input 0,5*0,135 g alkylbenzene sulfonate production,
linear, petrochemical | alkylbenzene
sulfonate, linear, petrochemical |
Cutoff, U - RER
Detergent component Input 0,5*0,0397 g chlor-alkali electrolysis, diaphragm
cell | sodium hydroxide, without
water, in 50% solution state | Cutoff,
U - RER
Detergent solvent Input 0,5*0,730 kg water production, completely
softened, from decarbonised water,
at user | water, completely softened,
from decarbonised water, at user |
Cutoff, U - RER
Waste water treatment Input -0,005 m3 treatment of wastewater, from
residence, capacity 1.1E10l/year |
wastewater, from residence | Cutoff,
U - CH
Ceramic mug Input broken Item(s)
Broken mug Output broken Item(s)
Plastic lid Input broken Item(s)
Clean mug - hand-washed Output clean Item(s)
Lid washing
Tap water Input 0,25 kg tap water production, conventional
treatment | tap water | Cutoff, U -
Europe without Switzerland
Electricity Input 0,111 MJ electricity voltage transformation
from medium to low voltage |
electricity, low voltage | Cutoff, U -
DE
Detergent component Input 0,5 g soap production | soap | Cutoff, U -
RER
Anionic surfactant Input 0,5*0,135 g alkylbenzene sulfonate production,
linear, petrochemical | alkylbenzene
sulfonate, linear, petrochemical |
Cutoff, U - RER
Ceramic cup vs. Paper cup
30
Detergent component Input 0,5*0,0397 g chlor-alkali electrolysis, diaphragm
cell | sodium hydroxide, without
water, in 50% solution state | Cutoff,
U - RER
Detergent solvent Input 0,5*0,730 kg water production, completely
softened, from decarbonised water,
at user | water, completely softened,
from decarbonised water, at user |
Cutoff, U - RER
Waste water treatment Input -0,00025 m3 treatment of wastewater, from
residence, capacity 1.1E10l/year |
wastewater, from residence | Cutoff,
U - CH
Clean lid Output 1 Item(s)
Waste treatment
Broken mug Input 1 Item(s)
Inert waste Input -300 g treatment of inert waste, inert
material landfill | inert waste, for
final disposal | Cutoff, U - CH
Plastic waste Input -35 g treatment of waste plastic plaster,
collection for final disposal | waste
plastic plaster | Cutoff, U - CH
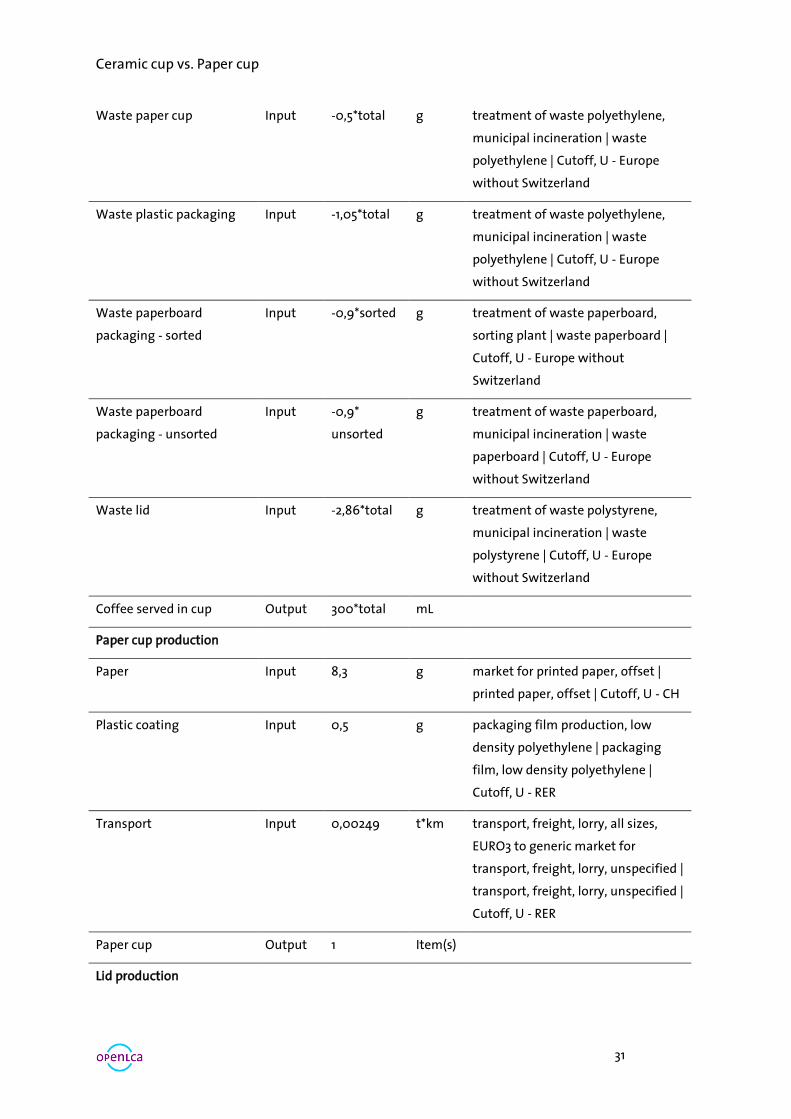
9.1.6 Paper cup
Tab.9: Flow inventory for the use of a paper cup
Flow Type Quantity Unit Matched ecoinvent dataset
Paper cup use
Paper cup Input total Item(s)
Plastic lid Input total Item(s)
Packaging Input total Item(s)
Waste paper cup Input -0,0083*
total
kg treatment of municipal solid waste,
incineration | municipal solid waste |
Cutoff, U - DE
Ceramic cup vs. Paper cup
31
Waste paper cup Input -0,5*total g treatment of waste polyethylene,
municipal incineration | waste
polyethylene | Cutoff, U - Europe
without Switzerland
Waste plastic packaging Input -1,05*total g treatment of waste polyethylene,
municipal incineration | waste
polyethylene | Cutoff, U - Europe
without Switzerland
Waste paperboard
packaging - sorted
Input -0,9*sorted g treatment of waste paperboard,
sorting plant | waste paperboard |
Cutoff, U - Europe without
Switzerland
Waste paperboard
packaging - unsorted
Input -0,9*
unsorted
g treatment of waste paperboard,
municipal incineration | waste
paperboard | Cutoff, U - Europe
without Switzerland
Waste lid Input -2,86*total g treatment of waste polystyrene,
municipal incineration | waste
polystyrene | Cutoff, U - Europe
without Switzerland
Coffee served in cup Output 300*total mL
Paper cup production
Paper Input 8,3 g market for printed paper, offset |
printed paper, offset | Cutoff, U - CH
Plastic coating Input 0,5 g packaging film production, low
density polyethylene | packaging
film, low density polyethylene |
Cutoff, U - RER
Transport
Input
0,00249 t*km transport, freight, lorry, all sizes,
EURO3 to generic market for
transport, freight, lorry, unspecified |
transport, freight, lorry, unspecified |
Cutoff, U - RER
Paper cup Output 1 Item(s)
Lid production
Ceramic cup vs. Paper cup
32
Polystyrene Input 2,86 g polystyrene production, high impact
| polystyrene, high impact | Cutoff, U
- RER
Transport Input 0,00037 t*km transport, freight, lorry, all sizes,
EURO3 to generic market for
transport, freight, lorry, unspecified |
transport, freight, lorry, unspecified |
Cutoff, U - RER
Plastic lid Output 1 Item(s)
Packaging
Boxboard Input 0,9/1000 kg folding boxboard production |
folding boxboard/chipboard |
Cutoff, U - RER
Packaging film Input 1,05 g packaging film production, low
density polyethylene | packaging
film, low density polyethylene |
Cutoff, U - RER
Packaging Output 1 Item(s)
9.2 Contacts
Email Allesbecher
Ceramic cup vs. Paper cup
33
Email Coffee-2-Go