Embed Size (px)
Citation preview
OpenLayers Workshop
Thomas WoodOpenLayers User & Contributor
SoC Summer School 09 SouthamptonTuesday, 8th September
Follow along with the demos athttp://sn.im/soc-ol-demos
What is OpenLayers?● “an Open Source map viewing framework
written in JavaScript”
- an alternative to commercial mapping APIs
- considered by some hard to use and too complex
– I am going to try and dispel some of that myth!
- designed to integrate well with existing GIS web servers as well as neogeograpy 'standards'
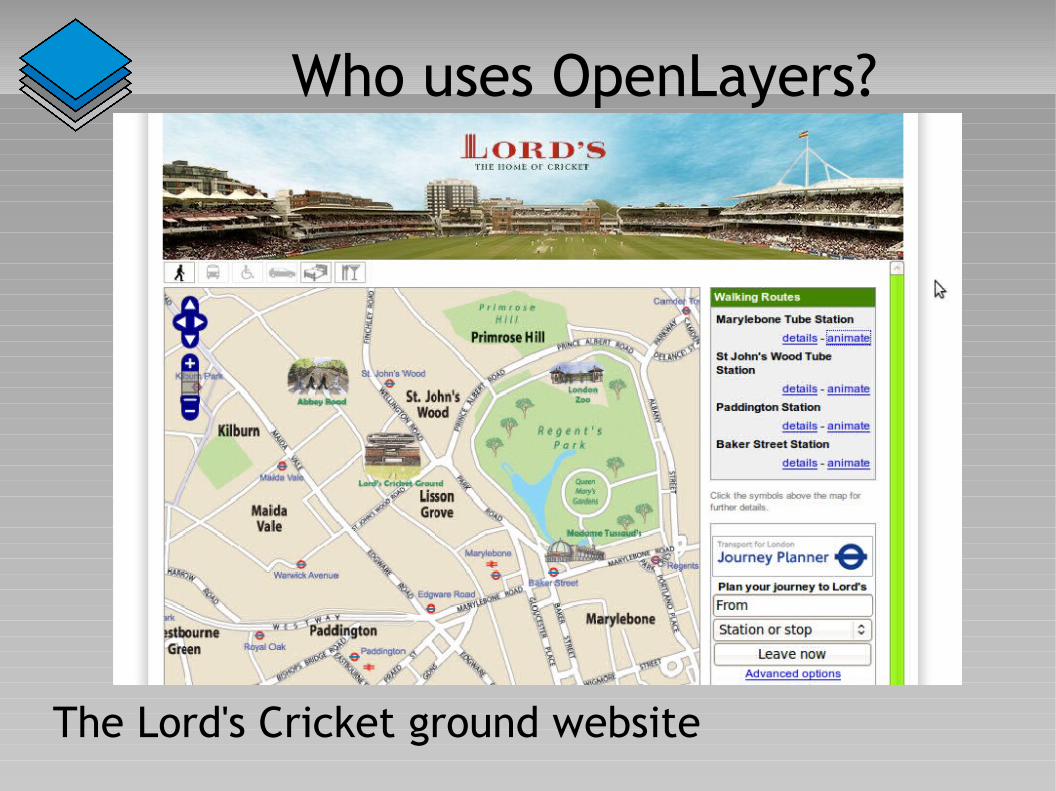
Who uses OpenLayers?
The Lord's Cricket ground website
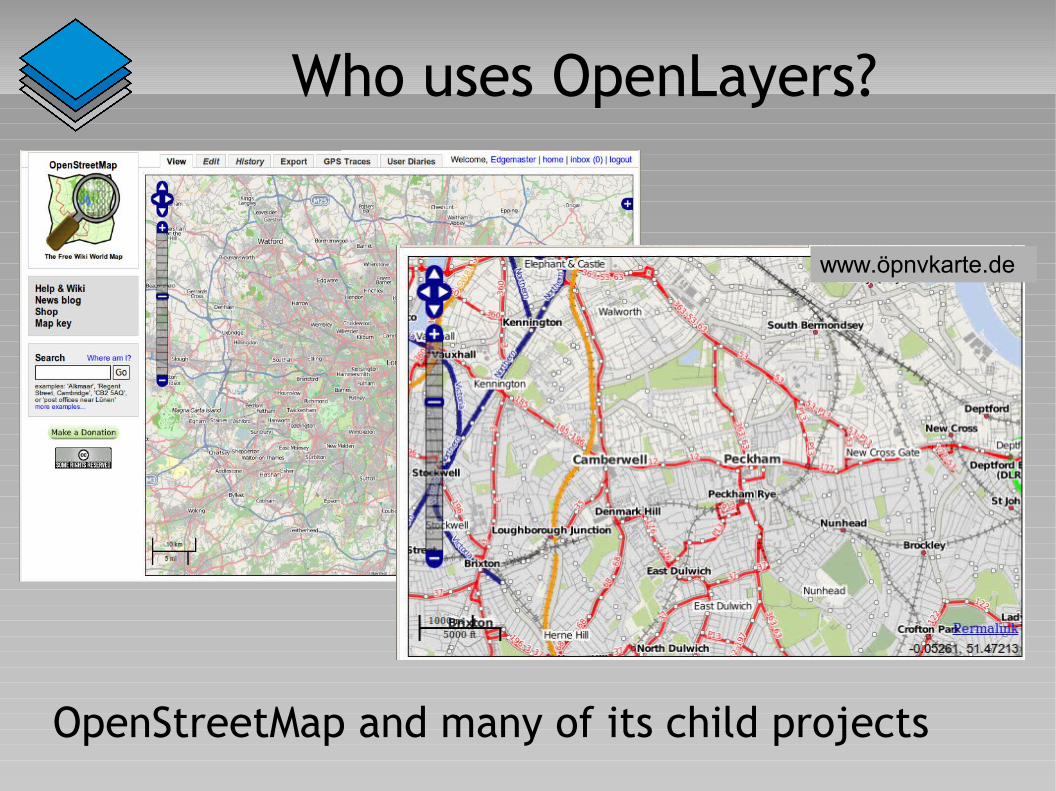
Who uses OpenLayers?
OpenStreetMap and many of its child projects
www.öpnvkarte.de
Who uses OpenLayers?
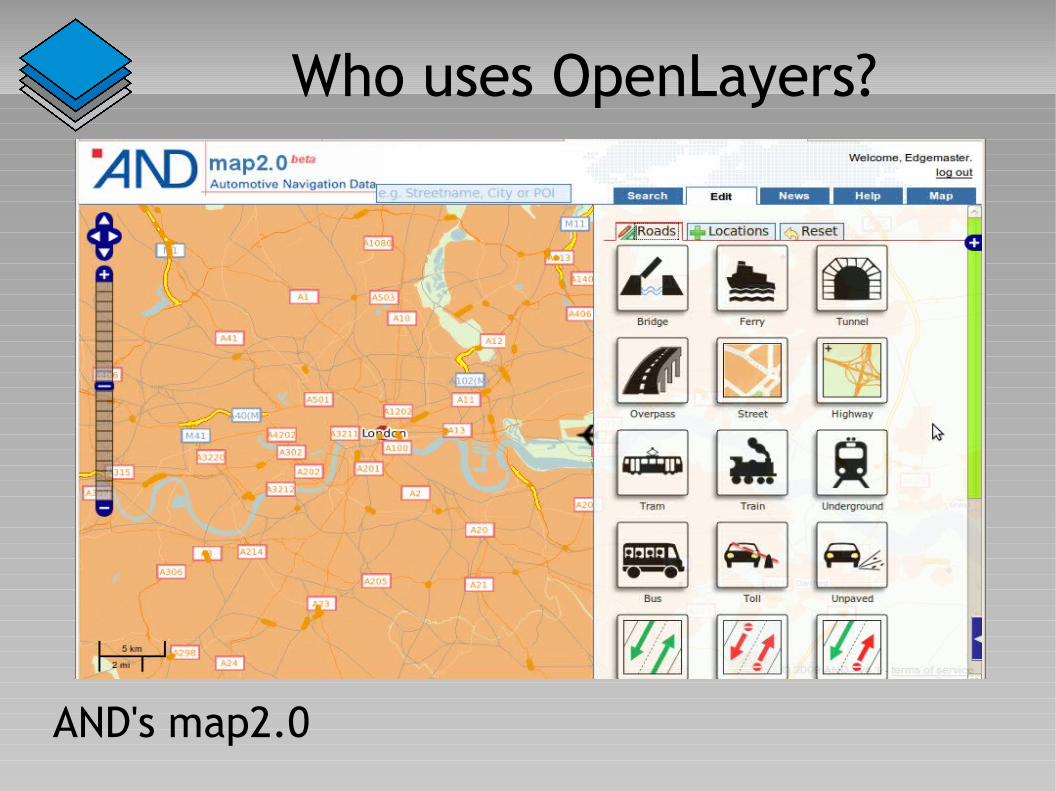
AND's map2.0
Who uses OpenLayers?
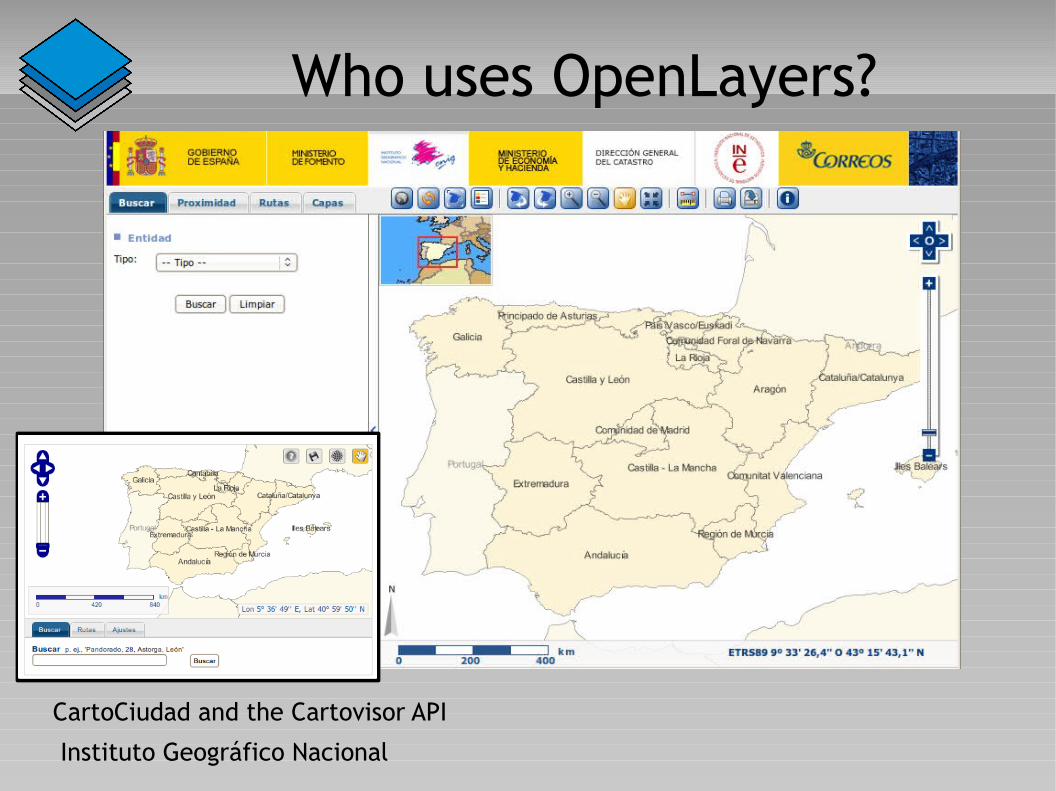
CartoCiudad and the Cartovisor API
Instituto Geográfico Nacional
Who uses OpenLayers?
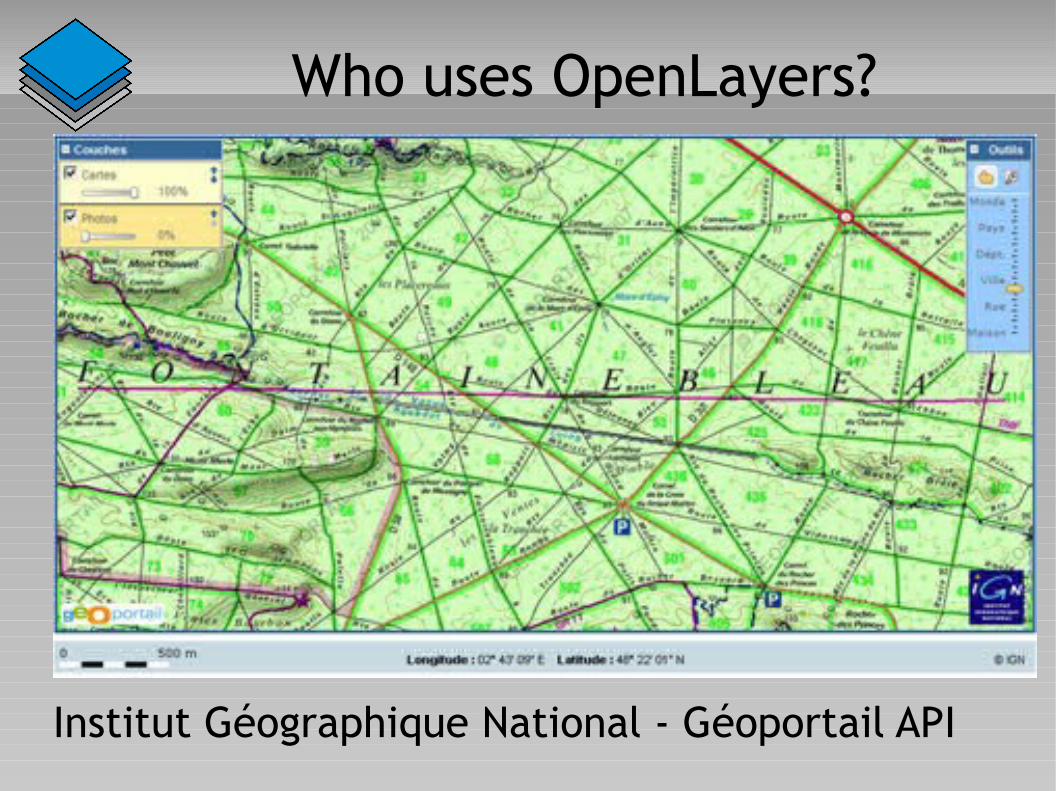
Institut Géographique National - Géoportail API
Who uses OpenLayers?
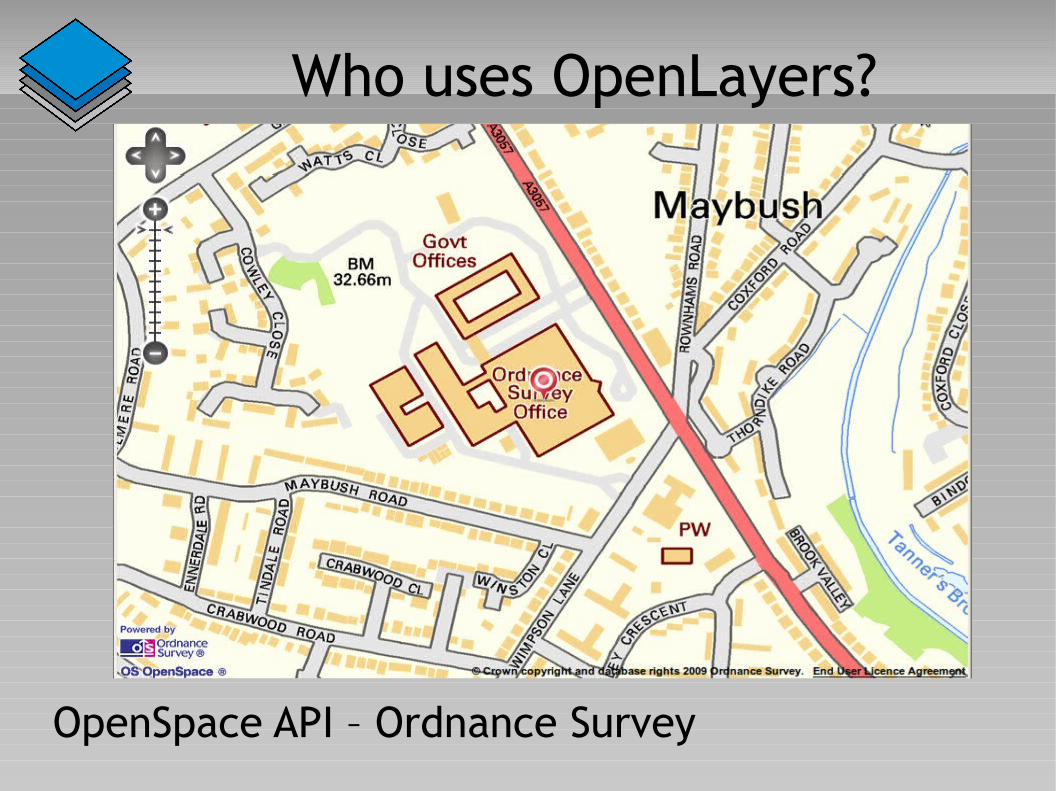
OpenSpace API – Ordnance Survey
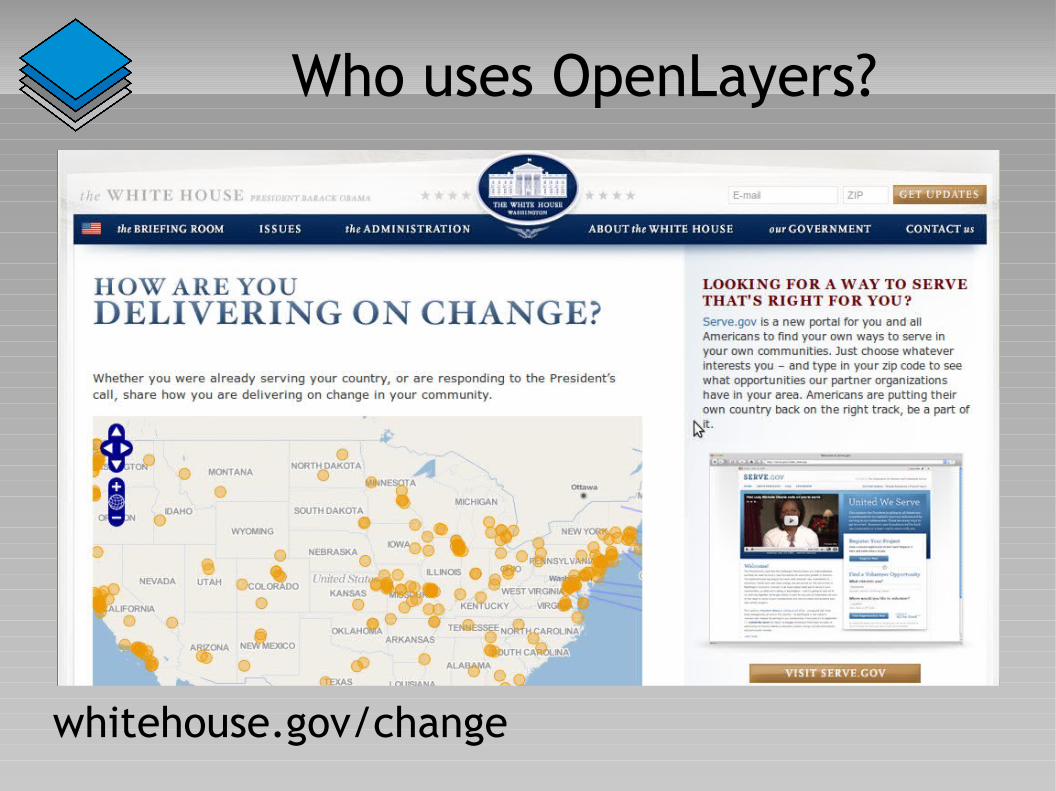
Who uses OpenLayers?
whitehouse.gov/change
Getting Started
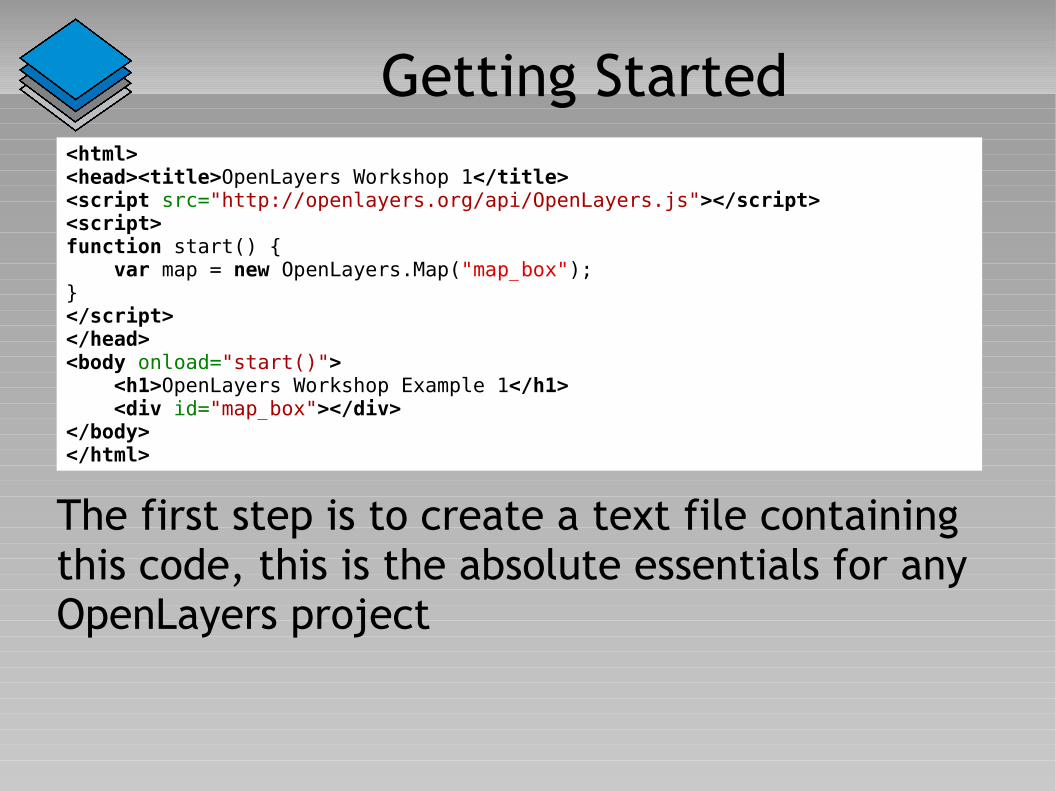
The first step is to create a text file containing this code, this is the absolute essentials for any OpenLayers project
<html><head><title>OpenLayers Workshop 1</title><script src="http://openlayers.org/api/OpenLayers.js"></script><script>function start() { var map = new OpenLayers.Map("map_box");}</script></head><body onload="start()"> <h1>OpenLayers Workshop Example 1</h1> <div id="map_box"></div></body></html>
Getting Started
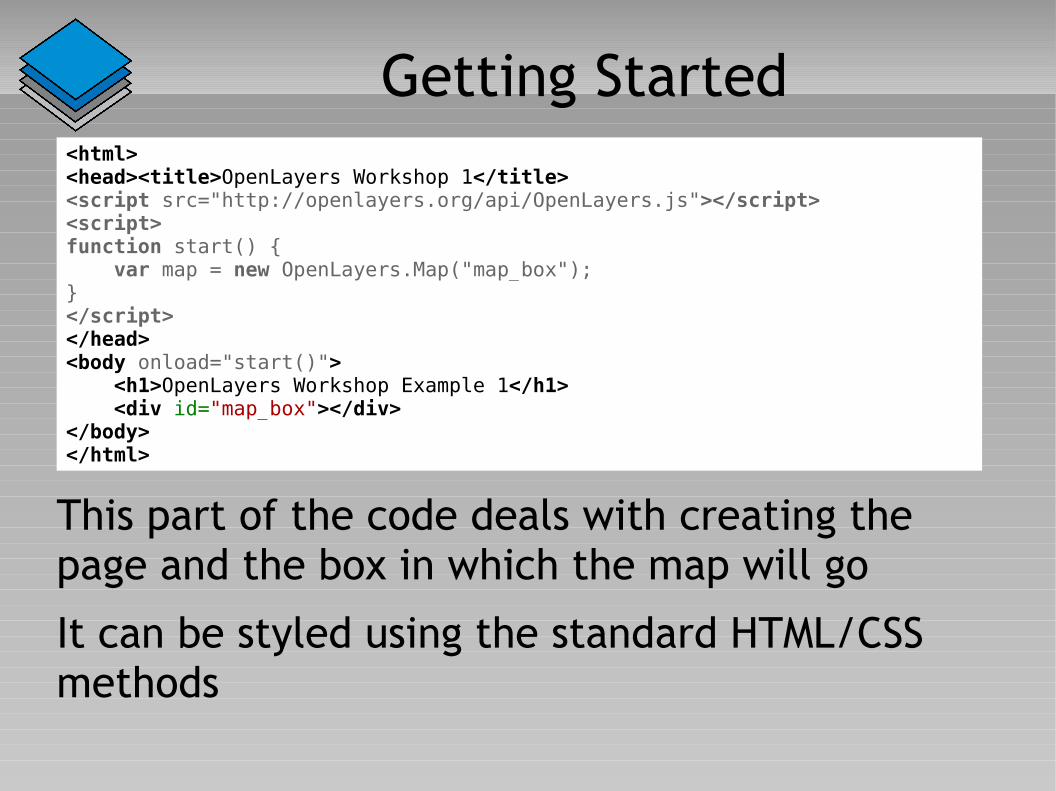
This part of the code deals with creating the page and the box in which the map will go
It can be styled using the standard HTML/CSS methods
<html><head><title>OpenLayers Workshop 1</title><script src="http://openlayers.org/api/OpenLayers.js"></script><script>function start() { var map = new OpenLayers.Map("map_box");}</script></head><body onload="start()"> <h1>OpenLayers Workshop Example 1</h1> <div id="map_box"></div></body></html>
Getting Started
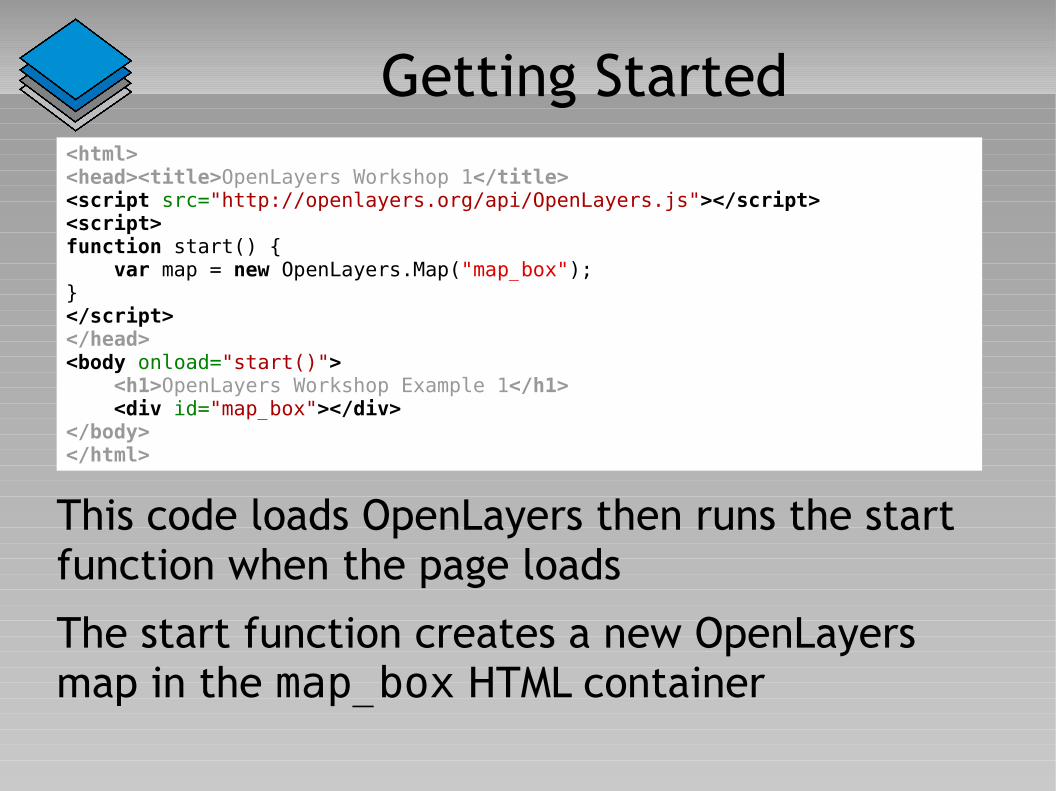
This code loads OpenLayers then runs the start function when the page loads
The start function creates a new OpenLayers map in the map_box HTML container
<html><head><title>OpenLayers Workshop 1</title><script src="http://openlayers.org/api/OpenLayers.js"></script><script>function start() { var map = new OpenLayers.Map("map_box");}</script></head><body onload="start()"> <h1>OpenLayers Workshop Example 1</h1> <div id="map_box"></div></body></html>
OpenLayers.Map
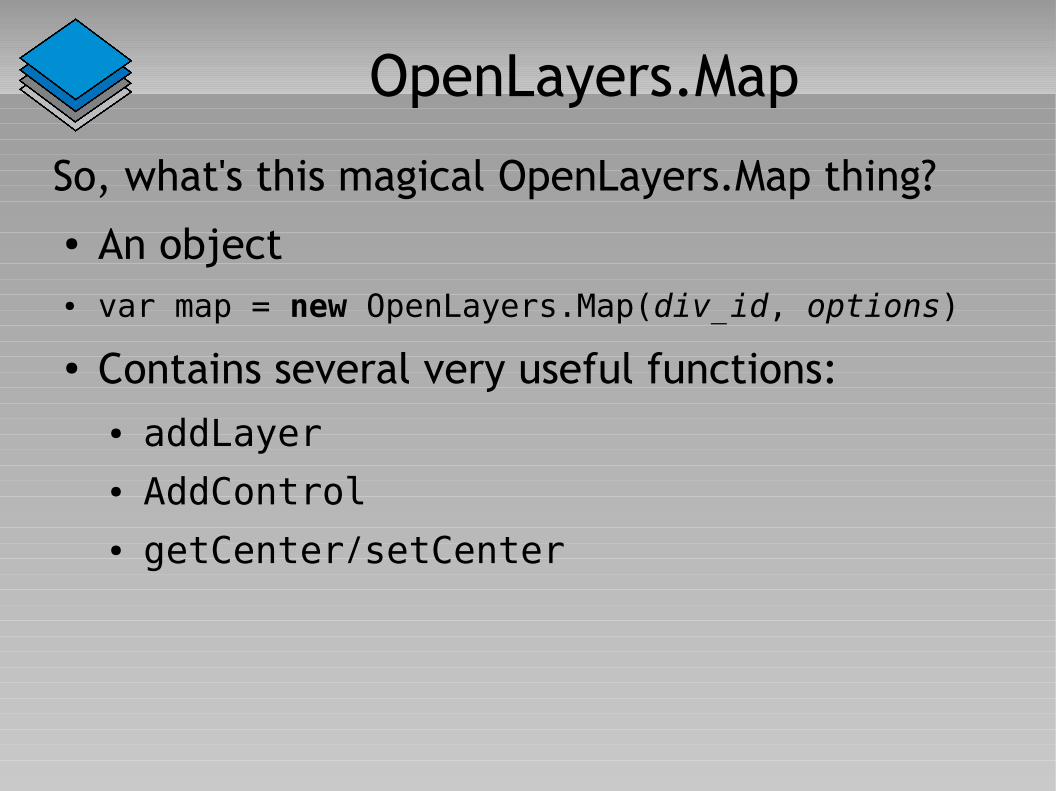
So, what's this magical OpenLayers.Map thing?● An object● var map = new OpenLayers.Map(div_id, options)
● Contains several very useful functions:● addLayer● AddControl● getCenter/setCenter
Adding (Raster) Layers
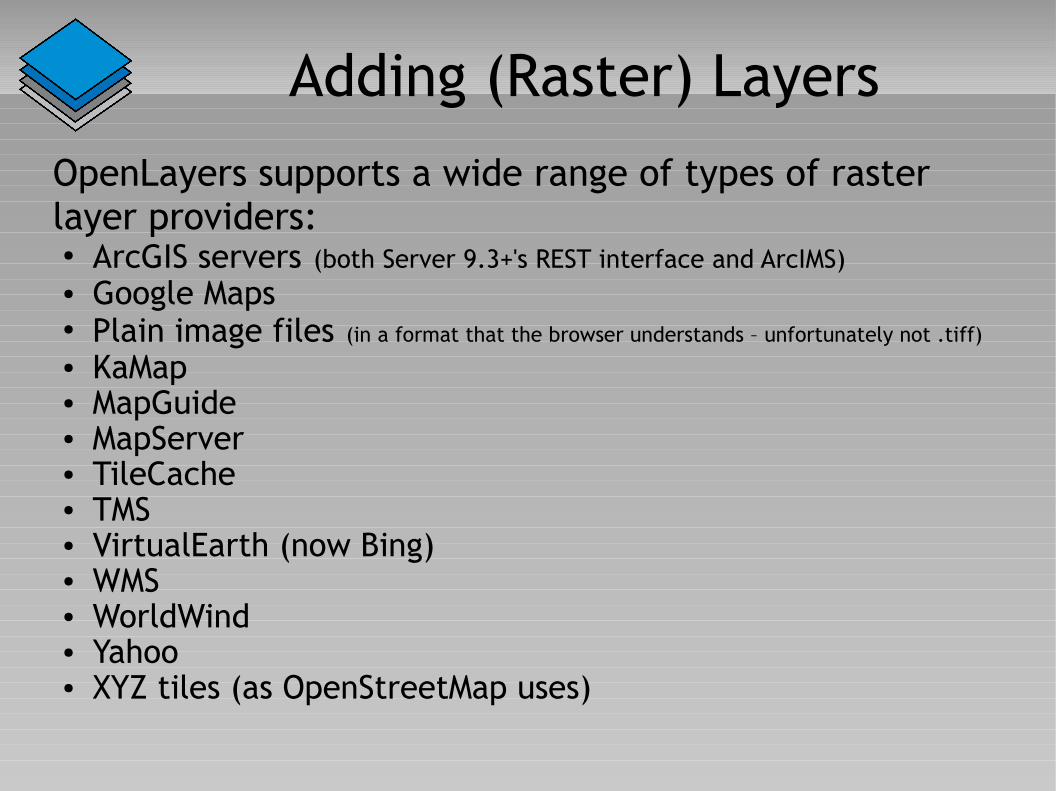
OpenLayers supports a wide range of types of raster layer providers:● ArcGIS servers (both Server 9.3+'s REST interface and ArcIMS)● Google Maps● Plain image files (in a format that the browser understands – unfortunately not .tiff)● KaMap● MapGuide● MapServer● TileCache● TMS● VirtualEarth (now Bing)● WMS● WorldWind● Yahoo● XYZ tiles (as OpenStreetMap uses)
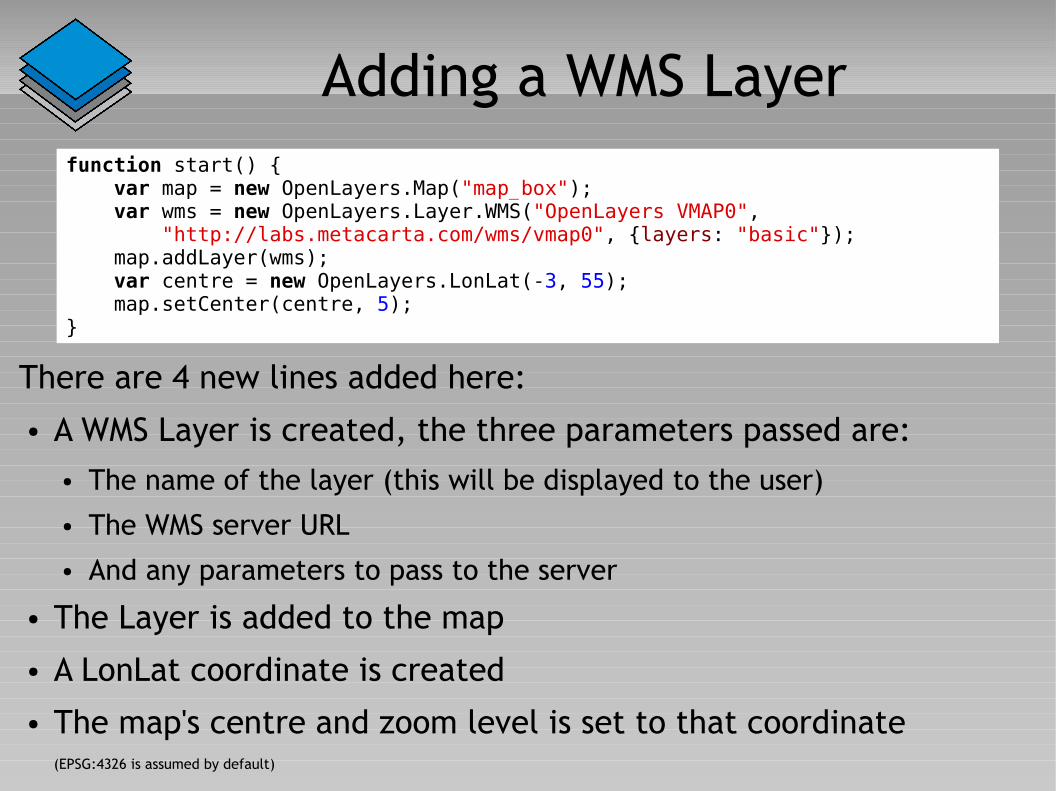
Adding a WMS Layerfunction start() { var map = new OpenLayers.Map("map_box"); var wms = new OpenLayers.Layer.WMS("OpenLayers VMAP0", "http://labs.metacarta.com/wms/vmap0", {layers: "basic"}); map.addLayer(wms); var centre = new OpenLayers.LonLat(-3, 55); map.setCenter(centre, 5);}
There are 4 new lines added here:
● A WMS Layer is created, the three parameters passed are:● The name of the layer (this will be displayed to the user)● The WMS server URL● And any parameters to pass to the server
● The Layer is added to the map
● A LonLat coordinate is created
● The map's centre and zoom level is set to that coordinate(EPSG:4326 is assumed by default)
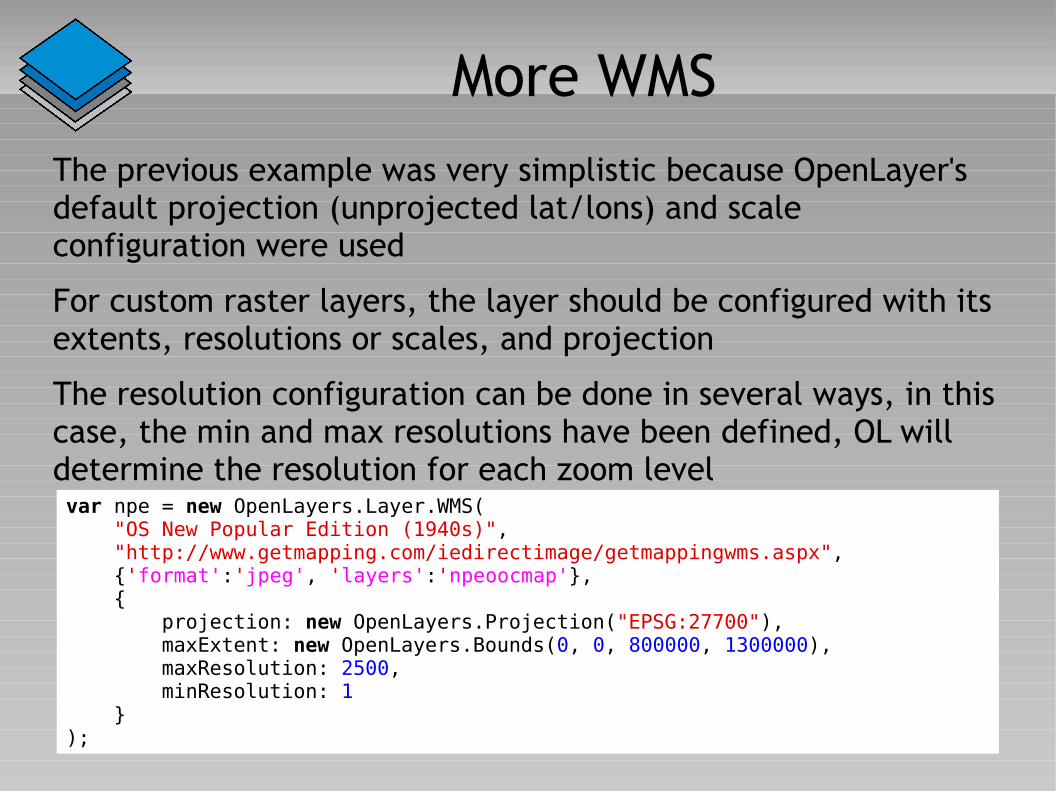
More WMSThe previous example was very simplistic because OpenLayer's default projection (unprojected lat/lons) and scale configuration were used
For custom raster layers, the layer should be configured with its extents, resolutions or scales, and projection
The resolution configuration can be done in several ways, in this case, the min and max resolutions have been defined, OL will determine the resolution for each zoom levelvar npe = new OpenLayers.Layer.WMS( "OS New Popular Edition (1940s)", "http://www.getmapping.com/iedirectimage/getmappingwms.aspx", {'format':'jpeg', 'layers':'npeoocmap'}, { projection: new OpenLayers.Projection("EPSG:27700"), maxExtent: new OpenLayers.Bounds(0, 0, 800000, 1300000), maxResolution: 2500, minResolution: 1 });
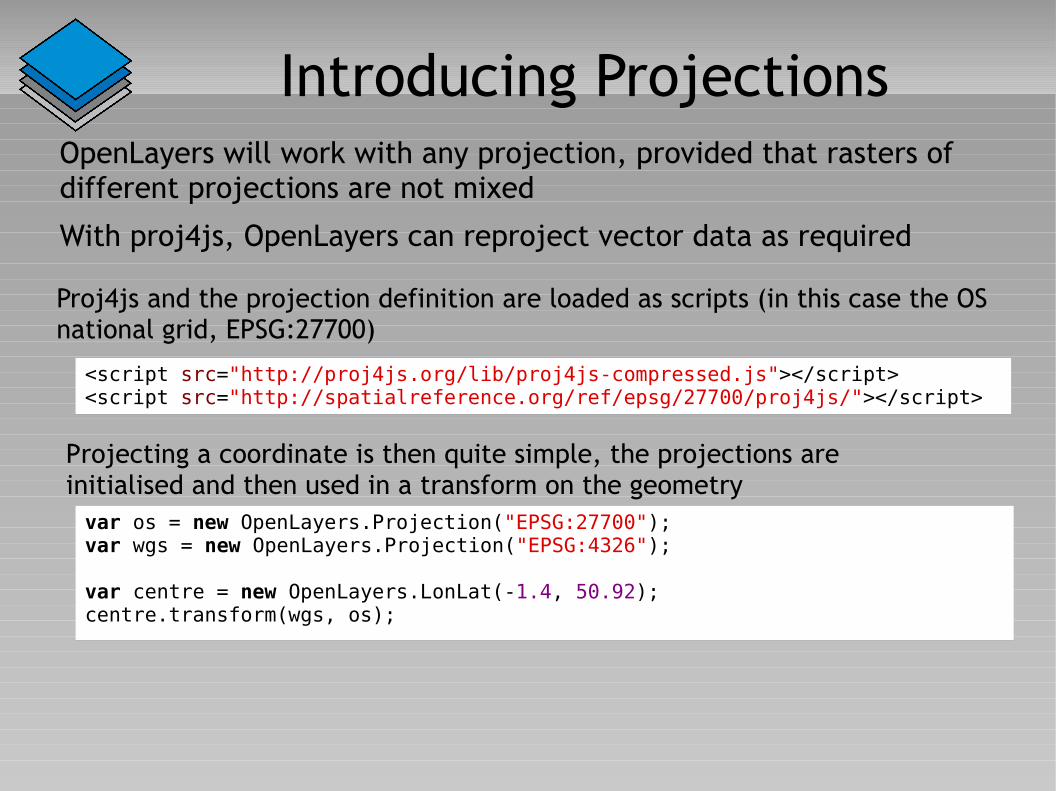
Introducing ProjectionsOpenLayers will work with any projection, provided that rasters of different projections are not mixed
With proj4js, OpenLayers can reproject vector data as required
var os = new OpenLayers.Projection("EPSG:27700");var wgs = new OpenLayers.Projection("EPSG:4326");
var centre = new OpenLayers.LonLat(-1.4, 50.92);centre.transform(wgs, os);
<script src="http://proj4js.org/lib/proj4js-compressed.js"></script><script src="http://spatialreference.org/ref/epsg/27700/proj4js/"></script>
Proj4js and the projection definition are loaded as scripts (in this case the OS national grid, EPSG:27700)
Projecting a coordinate is then quite simple, the projections are initialised and then used in a transform on the geometry

XYZ Tile LayersGridded tiles in the “Google” XYZ file naming scheme are an ever popular way of serving custom map rendersvar osmrail = new OpenLayers.Layer.XYZ("OSM Rail Map", "http://dev.openstreetmap.org/~steve8/railway_tiles/${z}/${x}/${y}.png", { sphericalMercator: true, attribution: "Data CCBYSA OpenStreetMap, rendering by Steve Chilton" });
● The layer name
● The URL where the tile images will be found● ${x} ${y} and ${z} are replaced by the appropriate tile reference
● The options 'hash', containing:● A shortcut configuration option to tell OL to use the appropriate projection
settings for Spherical Mercator type layers
● The layer's attribution to be displayed with the layer
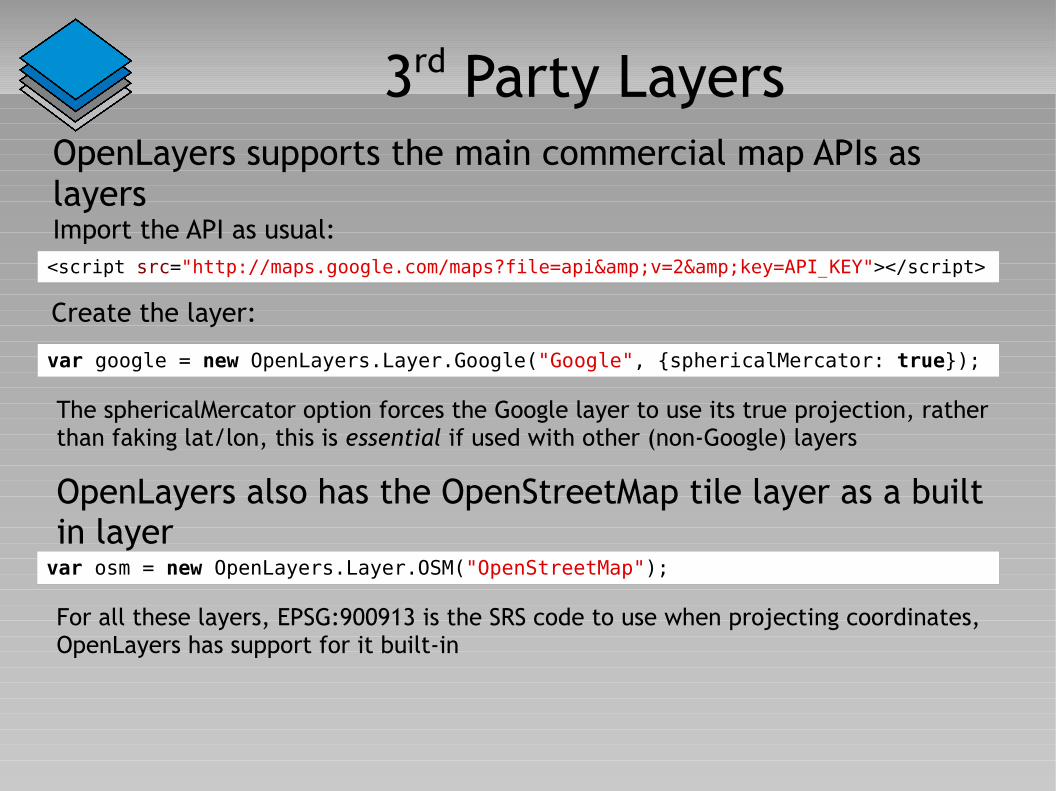
3rd Party LayersOpenLayers supports the main commercial map APIs as layersImport the API as usual:<script src="http://maps.google.com/maps?file=api&v=2&key=API_KEY"></script>
The sphericalMercator option forces the Google layer to use its true projection, rather than faking lat/lon, this is essential if used with other (non-Google) layers
var google = new OpenLayers.Layer.Google("Google", {sphericalMercator: true});
Create the layer:
OpenLayers also has the OpenStreetMap tile layer as a built in layervar osm = new OpenLayers.Layer.OSM("OpenStreetMap");
For all these layers, EPSG:900913 is the SRS code to use when projecting coordinates, OpenLayers has support for it built-in
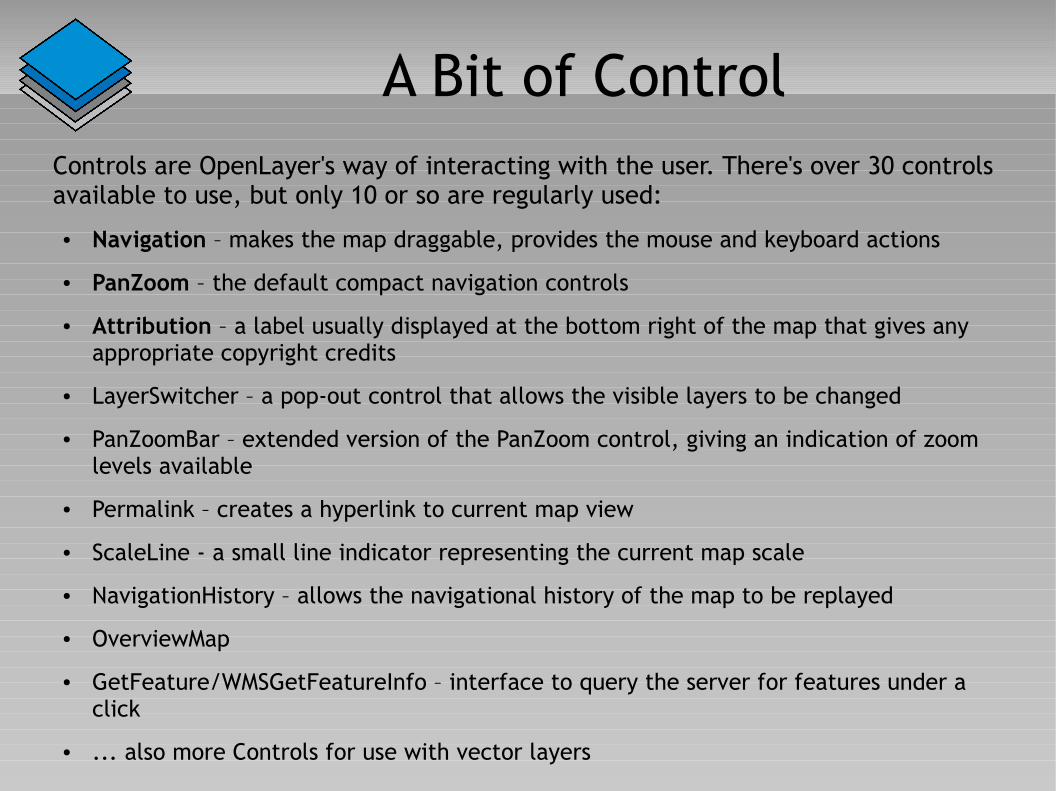
A Bit of ControlControls are OpenLayer's way of interacting with the user. There's over 30 controls available to use, but only 10 or so are regularly used:
● Navigation – makes the map draggable, provides the mouse and keyboard actions
● PanZoom – the default compact navigation controls
● Attribution – a label usually displayed at the bottom right of the map that gives any appropriate copyright credits
● LayerSwitcher – a pop-out control that allows the visible layers to be changed
● PanZoomBar – extended version of the PanZoom control, giving an indication of zoom levels available
● Permalink – creates a hyperlink to current map view
● ScaleLine - a small line indicator representing the current map scale
● NavigationHistory – allows the navigational history of the map to be replayed
● OverviewMap
● GetFeature/WMSGetFeatureInfo – interface to query the server for features under a click
● ... also more Controls for use with vector layers
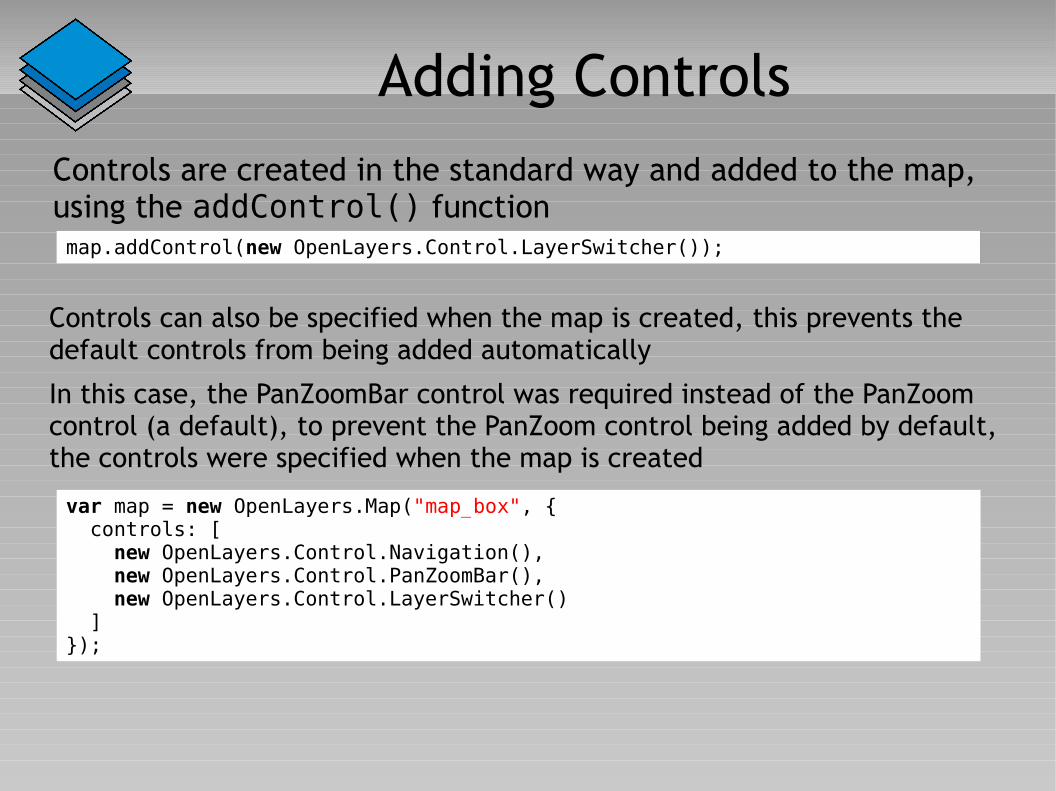
Adding ControlsControls are created in the standard way and added to the map, using the addControl() functionmap.addControl(new OpenLayers.Control.LayerSwitcher());
var map = new OpenLayers.Map("map_box", { controls: [ new OpenLayers.Control.Navigation(), new OpenLayers.Control.PanZoomBar(), new OpenLayers.Control.LayerSwitcher() ]});
Controls can also be specified when the map is created, this prevents the default controls from being added automatically
In this case, the PanZoomBar control was required instead of the PanZoom control (a default), to prevent the PanZoom control being added by default, the controls were specified when the map is created
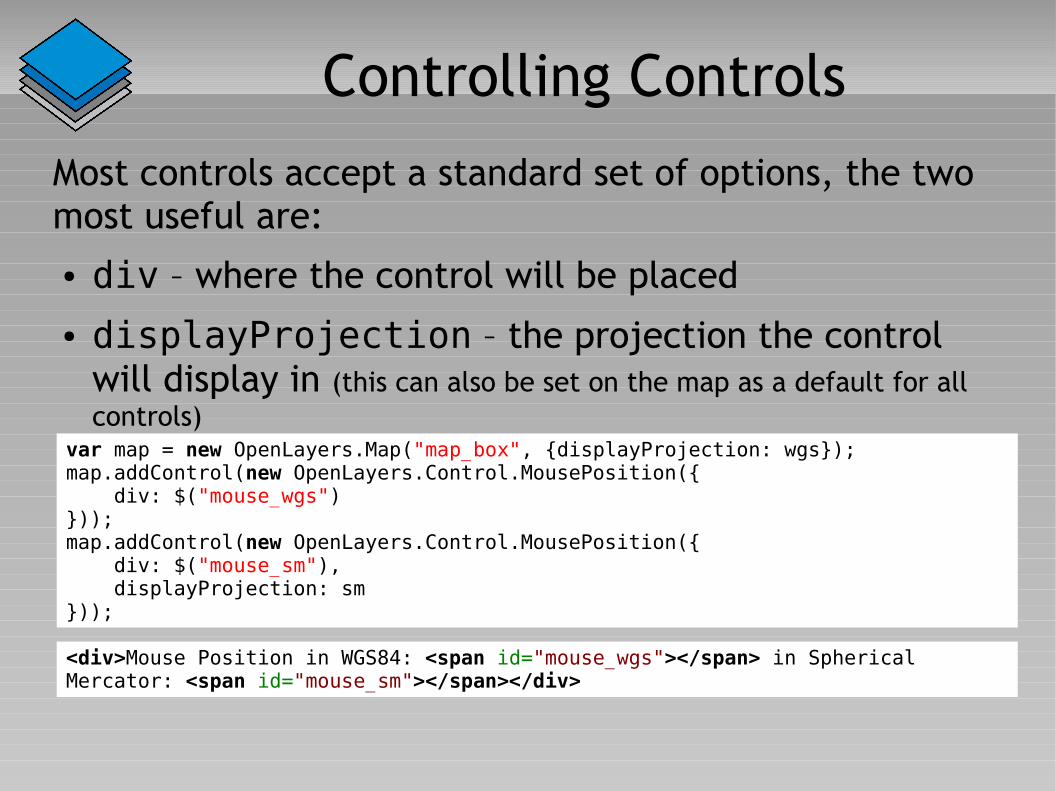
Controlling Controls
Most controls accept a standard set of options, the two most useful are:● div – where the control will be placed● displayProjection – the projection the control
will display in (this can also be set on the map as a default for all controls)
<div>Mouse Position in WGS84: <span id="mouse_wgs"></span> in Spherical Mercator: <span id="mouse_sm"></span></div>
var map = new OpenLayers.Map("map_box", {displayProjection: wgs});map.addControl(new OpenLayers.Control.MousePosition({ div: $("mouse_wgs")}));map.addControl(new OpenLayers.Control.MousePosition({ div: $("mouse_sm"), displayProjection: sm}));
Vectors, Features and Geometries● A Geometry is the description of a
geographical object● A Feature is a combination of a Geometry with
attributes, styles and other metadata● A Vector layer is a collection of Features to be
rendered on the map
Vector layers can be produced by manually creating Geometries and Features, but it is usually easier to load a data file
Loading Vector Data
OpenLayers provides a number of ways to load vector data onto a map, however the 'behaviours' method has become the preferred method since version 2.8 was released
The 'behaviours' method relies on a Protocol/Format/Strategy model to request data:● Protocol – how the data is to be retrieved (HTTP or WFS)● Format – the file format the data is in● Strategy – what subset of data should be displayed (eg: all
data, by BBOX, in clusters, by page, or by a more specific filter)
Supported Vector Formats● ArcXML● GeoJSON● GeoRSS● GML● GPX● KML● OSM● Text (comma separated values)● WKT
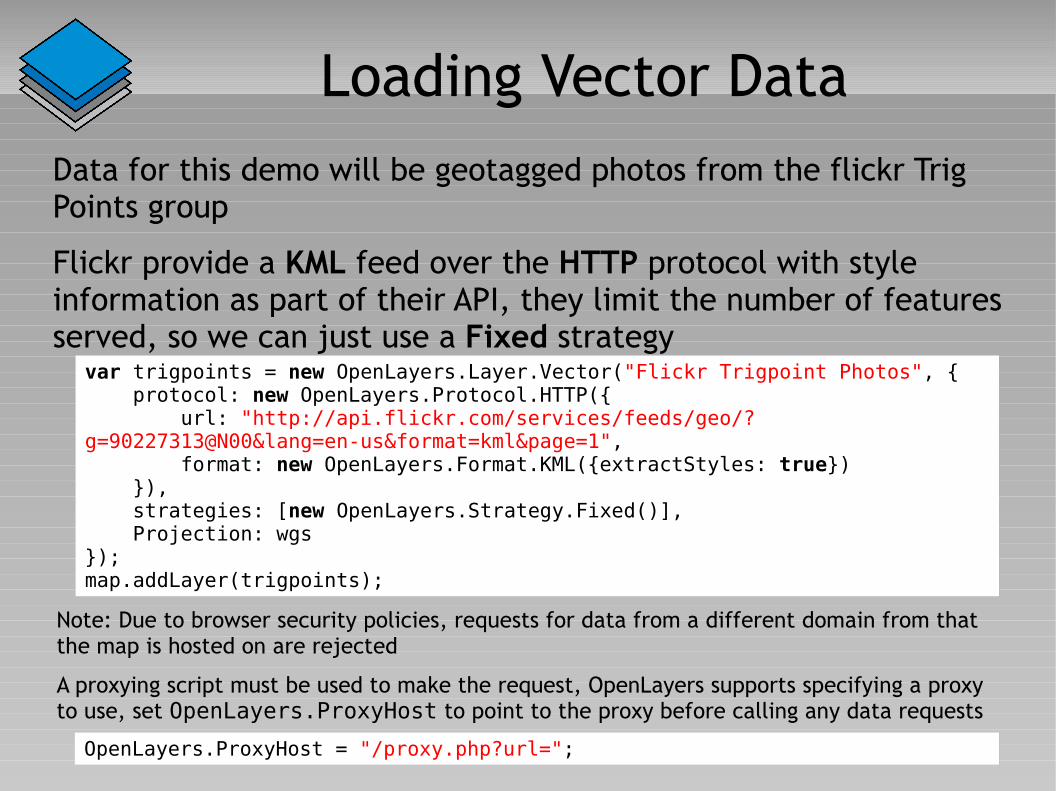
Loading Vector DataData for this demo will be geotagged photos from the flickr Trig Points group
Flickr provide a KML feed over the HTTP protocol with style information as part of their API, they limit the number of features served, so we can just use a Fixed strategy
var trigpoints = new OpenLayers.Layer.Vector("Flickr Trigpoint Photos", { protocol: new OpenLayers.Protocol.HTTP({ url: "http://api.flickr.com/services/feeds/geo/?g=90227313@N00&lang=en-us&format=kml&page=1", format: new OpenLayers.Format.KML({extractStyles: true}) }), strategies: [new OpenLayers.Strategy.Fixed()], Projection: wgs});map.addLayer(trigpoints);
Note: Due to browser security policies, requests for data from a different domain from that the map is hosted on are rejected
A proxying script must be used to make the request, OpenLayers supports specifying a proxy to use, set OpenLayers.ProxyHost to point to the proxy before calling any data requests
OpenLayers.ProxyHost = "/proxy.php?url=";
Filtering by BBOX
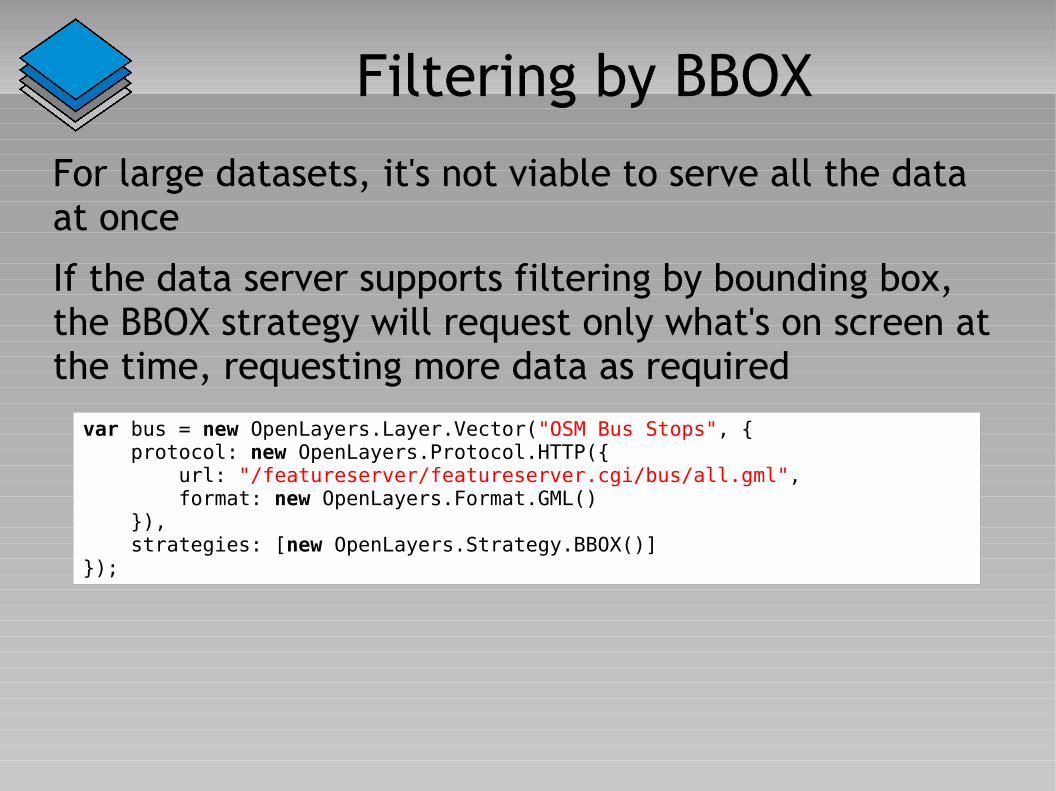
For large datasets, it's not viable to serve all the data at once
If the data server supports filtering by bounding box, the BBOX strategy will request only what's on screen at the time, requesting more data as required
var bus = new OpenLayers.Layer.Vector("OSM Bus Stops", { protocol: new OpenLayers.Protocol.HTTP({ url: "/featureserver/featureserver.cgi/bus/all.gml", format: new OpenLayers.Format.GML() }), strategies: [new OpenLayers.Strategy.BBOX()]});
Clustering
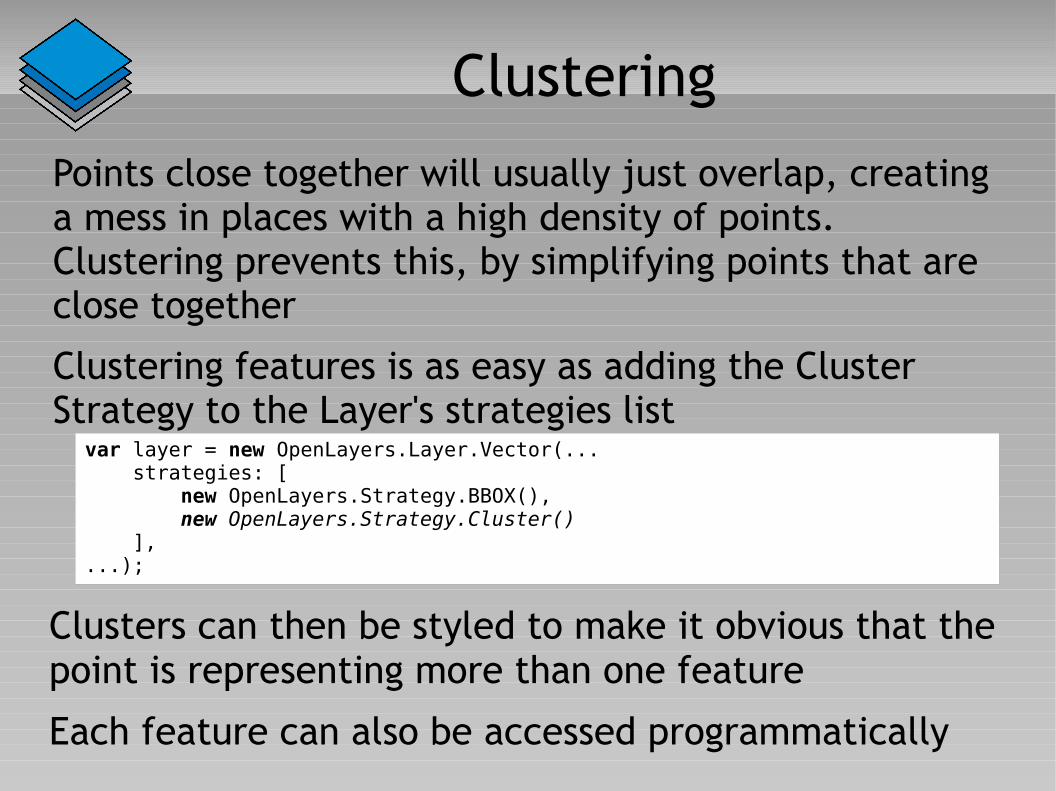
Points close together will usually just overlap, creating a mess in places with a high density of points. Clustering prevents this, by simplifying points that are close together
Clustering features is as easy as adding the Cluster Strategy to the Layer's strategies list
var layer = new OpenLayers.Layer.Vector(... strategies: [ new OpenLayers.Strategy.BBOX(), new OpenLayers.Strategy.Cluster() ],...);
Clusters can then be styled to make it obvious that the point is representing more than one feature
Each feature can also be accessed programmatically
StyleThe default orange blobs are boring
OpenLayers supports a range of styling properties for all features, a full list of them is available in the OL documentation
A Style is the way a feature is drawn at a particular time
A StyleMap is a collection of styles, one of which is used, depending on the feature's state
Styles can be dynamic – they can be set using a feature's attributes, functions can also be written to process an attribute into a style property
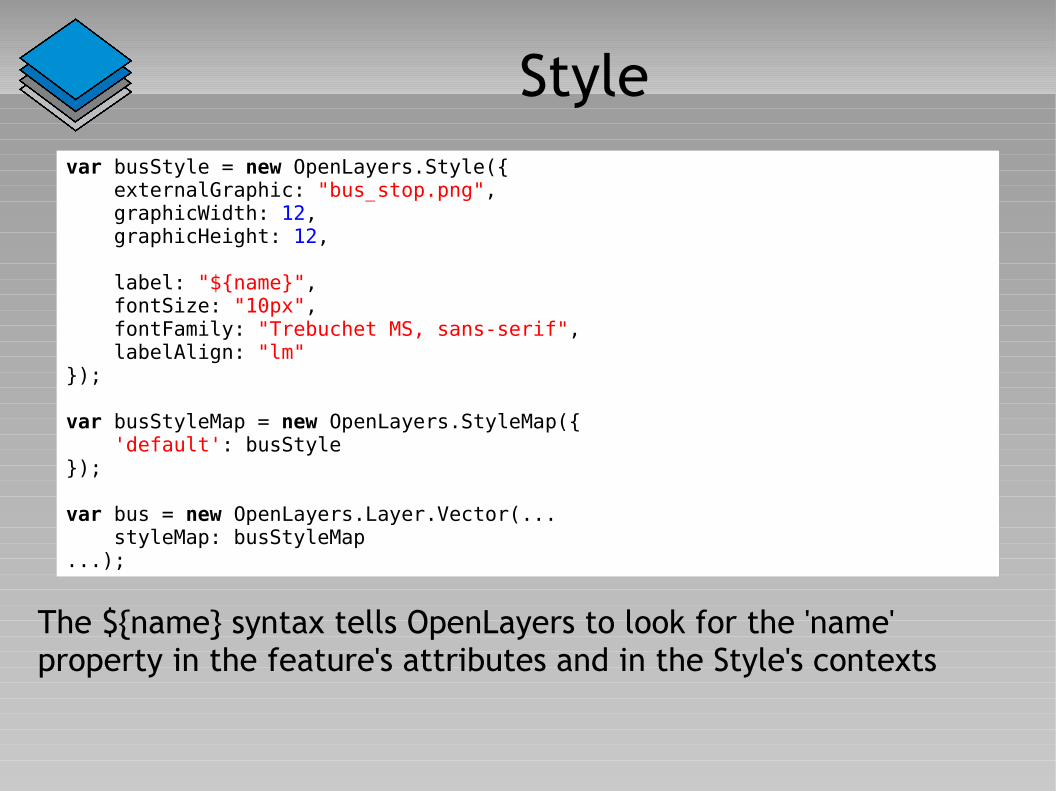
Stylevar busStyle = new OpenLayers.Style({ externalGraphic: "bus_stop.png", graphicWidth: 12, graphicHeight: 12,
label: "${name}", fontSize: "10px", fontFamily: "Trebuchet MS, sans-serif", labelAlign: "lm"});
var busStyleMap = new OpenLayers.StyleMap({ 'default': busStyle});
var bus = new OpenLayers.Layer.Vector(... styleMap: busStyleMap...);
The ${name} syntax tells OpenLayers to look for the 'name' property in the feature's attributes and in the Style's contexts
Style 'Contexts'
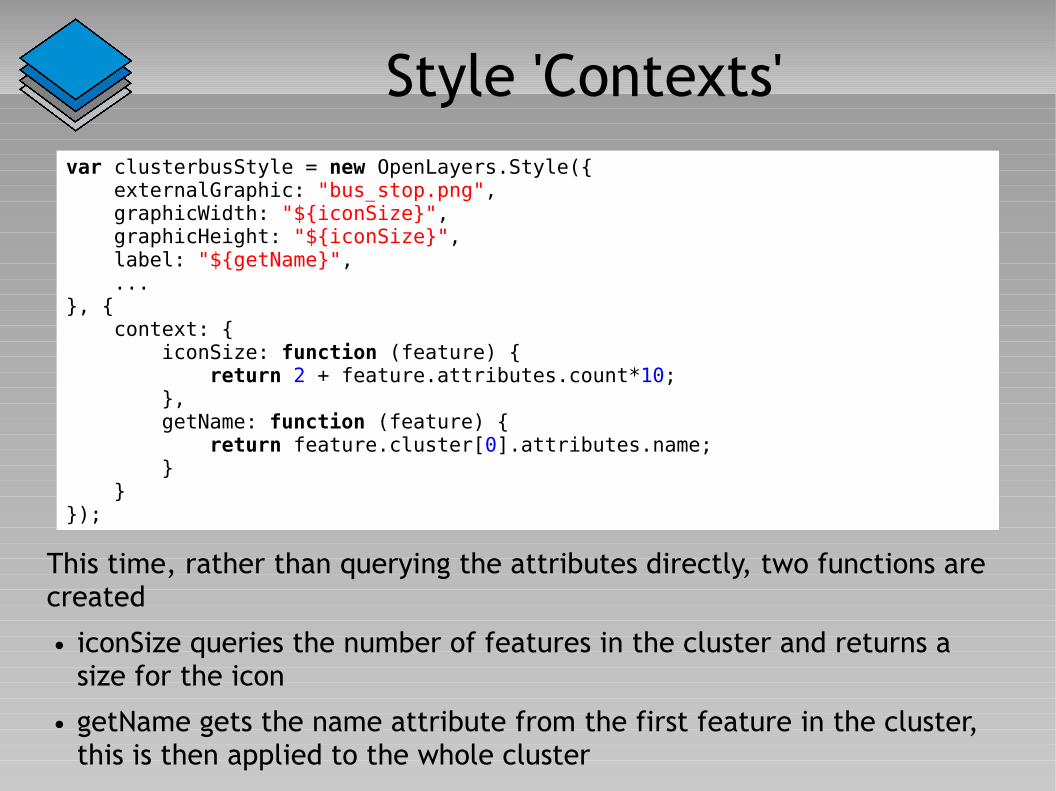
This time, rather than querying the attributes directly, two functions are created
● iconSize queries the number of features in the cluster and returns a size for the icon
● getName gets the name attribute from the first feature in the cluster, this is then applied to the whole cluster
var clusterbusStyle = new OpenLayers.Style({ externalGraphic: "bus_stop.png", graphicWidth: "${iconSize}", graphicHeight: "${iconSize}", label: "${getName}", ...}, { context: { iconSize: function (feature) { return 2 + feature.attributes.count*10; }, getName: function (feature) { return feature.cluster[0].attributes.name; } }});
Interacting with Vectors
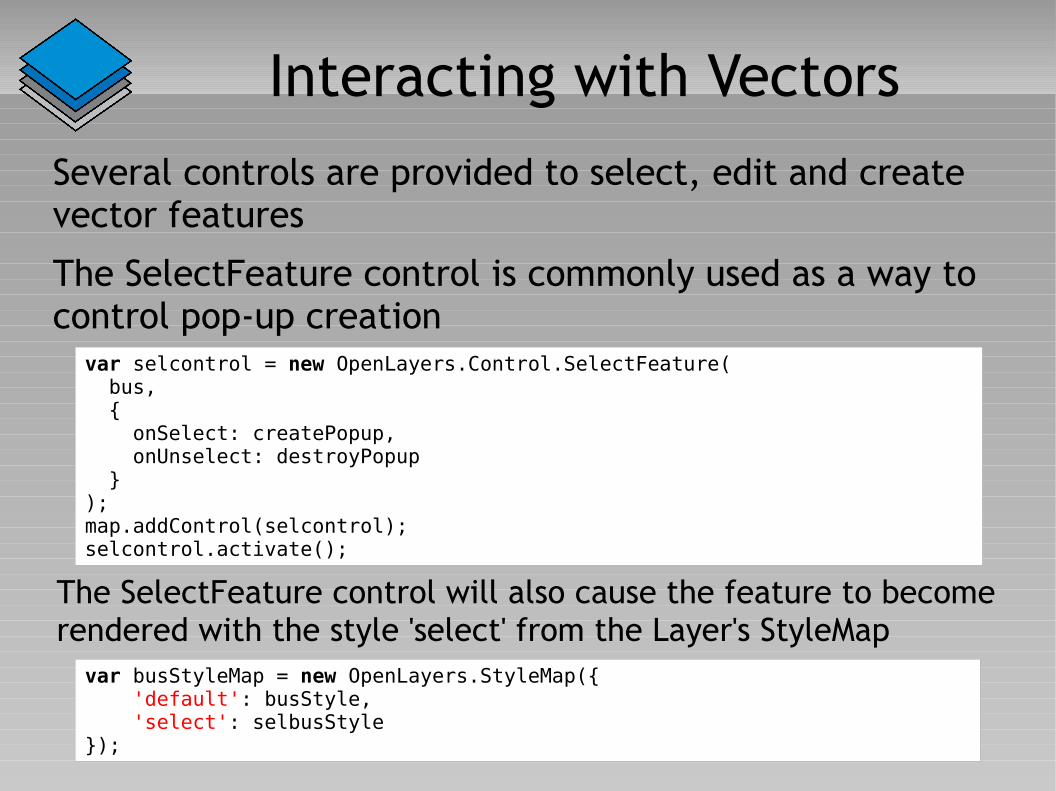
Several controls are provided to select, edit and create vector features
The SelectFeature control is commonly used as a way to control pop-up creation
var selcontrol = new OpenLayers.Control.SelectFeature( bus, { onSelect: createPopup, onUnselect: destroyPopup });map.addControl(selcontrol);selcontrol.activate();
The SelectFeature control will also cause the feature to become rendered with the style 'select' from the Layer's StyleMap
var busStyleMap = new OpenLayers.StyleMap({ 'default': busStyle, 'select': selbusStyle});
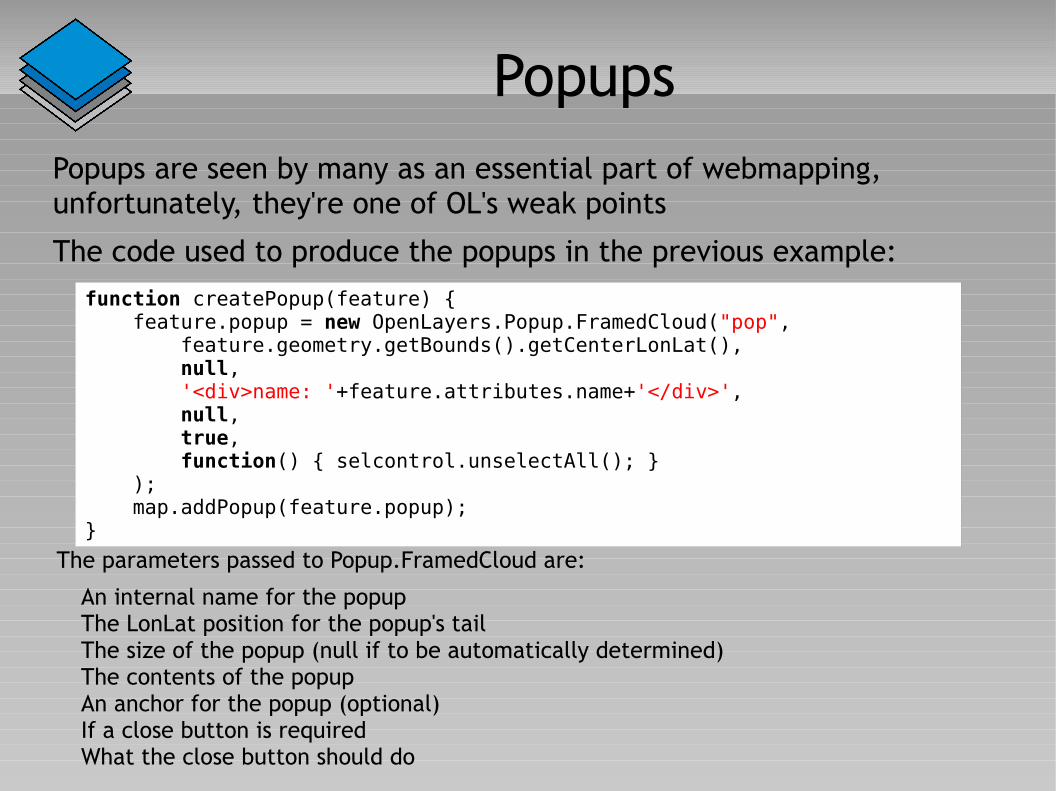
PopupsPopups are seen by many as an essential part of webmapping, unfortunately, they're one of OL's weak points
The code used to produce the popups in the previous example:
function createPopup(feature) { feature.popup = new OpenLayers.Popup.FramedCloud("pop", feature.geometry.getBounds().getCenterLonLat(), null, '<div>name: '+feature.attributes.name+'</div>', null, true, function() { selcontrol.unselectAll(); } ); map.addPopup(feature.popup);}
The parameters passed to Popup.FramedCloud are:
An internal name for the popupThe LonLat position for the popup's tailThe size of the popup (null if to be automatically determined)The contents of the popupAn anchor for the popup (optional)If a close button is requiredWhat the close button should do
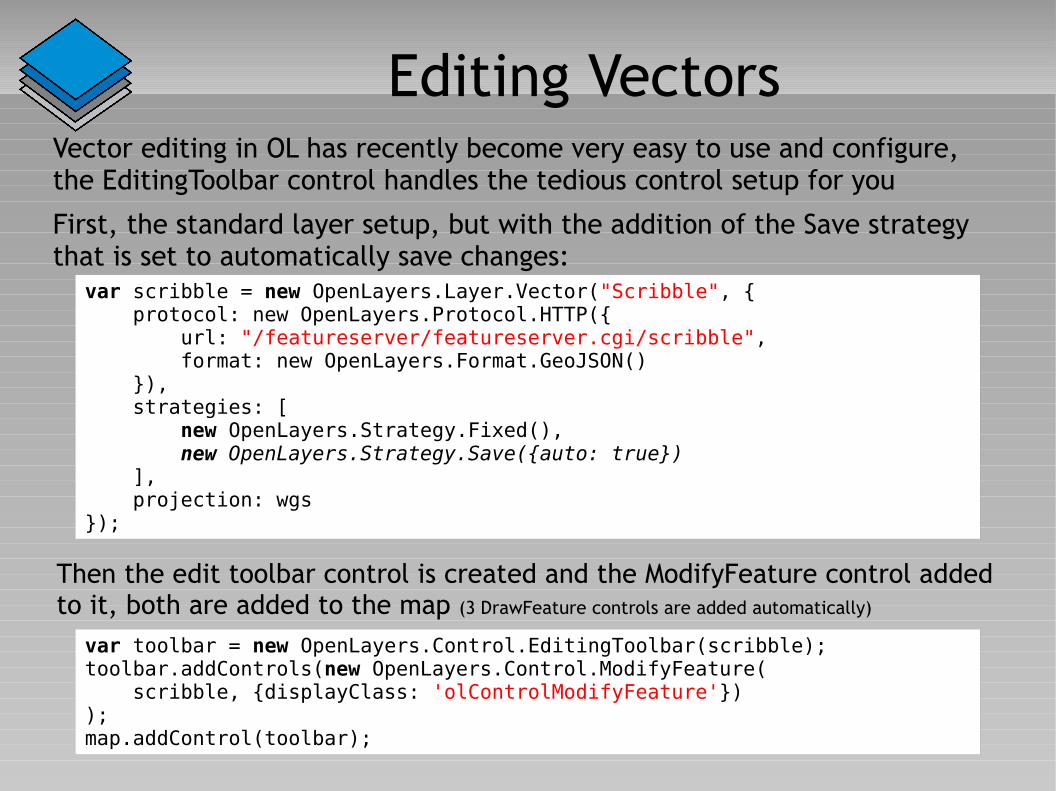
Editing VectorsVector editing in OL has recently become very easy to use and configure, the EditingToolbar control handles the tedious control setup for you
First, the standard layer setup, but with the addition of the Save strategy that is set to automatically save changes:
var scribble = new OpenLayers.Layer.Vector("Scribble", { protocol: new OpenLayers.Protocol.HTTP({ url: "/featureserver/featureserver.cgi/scribble", format: new OpenLayers.Format.GeoJSON() }), strategies: [ new OpenLayers.Strategy.Fixed(), new OpenLayers.Strategy.Save({auto: true}) ], projection: wgs});
var toolbar = new OpenLayers.Control.EditingToolbar(scribble);toolbar.addControls(new OpenLayers.Control.ModifyFeature( scribble, {displayClass: 'olControlModifyFeature'}));map.addControl(toolbar);
Then the edit toolbar control is created and the ModifyFeature control added to it, both are added to the map (3 DrawFeature controls are added automatically)
And Finally...
This workshop has been only a small overview of OpenLayers' core features, in addition to this it also supports more interaction with vector features such as filters and geometry intersections
Further Information
http://www.openlayers.org/
Demos● Todays demos are at http://sn.im/soc-ol-demos
along with all these links, this link will continue to work shortly after the conference
● Official at http://openlayers.org/dev/examples
Documentation● http://docs.openlayers.org/