Embed Size (px)
Citation preview
Open Research OnlineThe Open University’s repository of research publicationsand other research outputs
Gaia Data Release 1: Open cluster astrometry:performance, limitations, and future prospectsJournal Item
How to cite:
van Leeuwen, F.; Vallenari, A.; Jordi, C.; Lindegren, L.; Bastian, U.; Prusti, T.; de Bruijne, J. H. J.; Brown,A. G. A.; Babusiaux, C.; Bailer-Jones, C. A. L.; Biermann, M.; Evans, D. W.; Eyer, L.; Jansen, F.; Klioner, S. A.;Lammers, U.; Luri, X.; Mignard, F.; Panem, C.; Pourbaix, D.; Randich, S.; Sartoretti, P.; Siddiqui, H. I.; Soubiran,C.; Valette, V.; Walton, N. A.; Aerts, C.; Arenou, F.; Cropper, M.; Drimmel, R.; Høg, E.; Katz, D.; Lattanzi, M.G.; O’Mullane, W.; Grebel, E. K.; Holland, A. D.; Huc, C.; Passot, X.; Perryman, M.; Bramante, L.; Cacciari, C.;Castaneda, J.; Chaoul, L.; Cheek, N.; De Angeli, F.; Fabricius, C.; Guerra, R.; Hernandez, J.; Jean-Antoine-Piccolo,A.; Masana, E.; Messineo, R.; Mowlavi, N.; Nienartowicz, K.; Ordonez-Blanco, D.; Panuzzo, P.; Portell, J.; Richards,P. J.; Riello, M.; Seabroke, G. M.; Tanga, P.; Thevenin, F.; Torra, J.; Els, S. G.; Gracia-Abril, G.; Comoretto,G.; Garcia-Reinaldos, M.; Lock, T.; Mercier, E.; Altmann, M.; Andrae, R.; Astraatmadja, T. L.; Bellas-Velidis, I.;Benson, K.; Berthier, J.; Blomme, R.; Busso, G.; Carry, B.; Cellino, A.; Clementini, G.; Cowell, S.; Creevey, O.;Cuypers, J.; Davidson, M.; De Ridder, J.; de Torres, A.; Delchambre, L.; Dell’Oro, A.; Ducourant, C.; Fremat, Y.;Garcıa-Torres, M.; Gosset, E.; Halbwachs, J.-L.; Hambly, N. C.; Harrison, D. L.; Hauser, M.; Hestroffer, D.; Hodgkin,S. T.; Huckle, H. E.; Hutton, A.; Jasniewicz, G.; Jordan, S.; Kontizas, M.; Korn, A. J.; Lanzafame, A. C.; Manteiga,M.; Moitinho, A.; Muinonen, K.; Osinde, J.; Pancino, E.; Pauwels, T.; Petit, J.-M.; Recio-Blanco, A.; Robin, A. C.;Sarro, L. M.; Siopis, C.; Smith, M.; Smith, K. W.; Sozzetti, A.; Thuillot, W.; van Reeven, W.; Viala, Y.; Abbas, U.;Abreu Aramburu, A.; Accart, S.; Aguado, J. J.; Allan, P. M.; Allasia, W.; Altavilla, G.; Alvarez, M. A.; Alves, J.;Anderson, R. I.; Andrei, A. H.; Anglada Varela, E.; Antiche, E.; Antoja, T.; Anton, S.; Arcay, B.; Bach, N.; Baker,S. G.; Balaguer-Nunez, L.; Barache, C.; Barata, C.; Barbier, A.; Barblan, F.; Barrado y Navascues, D.; Barros, M.;Barstow, M. A.; Becciani, U.; Bellazzini, M.; Bello Garcıa, A.; Belokurov, V.; Bendjoya, P.; Berihuete, A.; Bianchi,L.; Bienayme, O.; Billebaud, F.; Blagorodnova, N.; Blanco-Cuaresma, S.; Boch, T.; Bombrun, A.; Borrachero, R.;Bouquillon, S.; Bourda, G.; Bouy, H.; Bragaglia, A.; Breddels, M. A.; Brouillet, N.; Brusemeister, T.; Bucciarelli, B.;Burgess, P.; Burgon, R.; Burlacu, A.; Busonero, D.; Buzzi, R.; Caffau, E.; Cambras, J.; Campbell, H.; Cancelliere, R.;Cantat-Gaudin, T.; Carlucci, T.; Carrasco, J. M.; Castellani, M.; Charlot, P.; Charnas, J.; Chiavassa, A.; Clotet, M.;Cocozza, G.; Collins, R. S.; Costigan, G.; Crifo, F.; Cross, N. J. G.; Crosta, M.; Crowley, C.; Dafonte, C.; Damerdji,Y.; Dapergolas, A.; David, P.; David, M.; De Cat, P.; de Felice, F.; de Laverny, P.; De Luise, F.; De March, R.; deMartino, D.; de Souza, R.; Debosscher, J.; del Pozo, E.; Delbo, M.; Delgado, A.; Delgado, H. E.; Di Matteo, P.;Diakite, S.; Distefano, E.; Dolding, C.; Dos Anjos, S.; Drazinos, P.; Duran, J.; Dzigan, Y.; Edvardsson, B.; Enke, H.;Evans, N. W.; Eynard Bontemps, G.; Fabre, C.; Fabrizio, M.; Faigler, S.; Falcao, A. J.; Farras Casas, M.; Federici,L.; Fedorets, G.; Fernandez-Hernandez, J.; Fernique, P.; Fienga, A.; Figueras, F.; Filippi, F.; Findeisen, K.; Fonti,A.; Fouesneau, M.; Fraile, E.; Fraser, M.; Fuchs, J.; Gai, M.; Galleti, S.; Galluccio, L.; Garabato, D.; Garcıa-Sedano,F.; Garofalo, A.; Garralda, N.; Gavras, P.; Gerssen, J.; Geyer, R.; Gilmore, G.; Girona, S.; Giuffrida, G.; Gomes, M.;Gonzalez-Marcos, A.; Gonzalez-Nunez, J.; Gonzalez-Vidal, J. J.; Granvik, M.; Guerrier, A.; Guillout, P.; Guiraud, J.;Gurpide, A.; Gutierrez-Sanchez, R.; Guy, L. P.; Haigron, R.; Hatzidimitriou, D.; Haywood, M.; Heiter, U.; Helmi, A.;Hobbs, D.; Hofmann, W.; Holl, B.; Holland, G.; Hunt, J. A. S.; Hypki, A.; Icardi, V.; Irwin, M.; Jevardat de Fombelle,G.; Jofre, P.; Jonker, P. G.; Jorissen, A.; Julbe, F.; Karampelas, A.; Kochoska, A.; Kohley, R.; Kolenberg, K.;Kontizas, E.; Koposov, S. E.; Kordopatis, G.; Koubsky, P.; Krone-Martins, A.; Kudryashova, M.; Kull, I.; Bachchan,R. K.; Lacoste-Seris, F.; Lanza, A. F.; Lavigne, J.-B.; Le Poncin-Lafitte, C.; Lebreton, Y.; Lebzelter, T.; Leccia,S.; Leclerc, N.; Lecoeur-Taibi, I.; Lemaitre, V.; Lenhardt, H.; Leroux, F.; Liao, S.; Licata, E.; Lindstrøm, H. E. P.;Lister, T. A.; Livanou, E.; Lobel, A.; Loffler, W.; Lopez, M.; Lorenz, D.; MacDonald, I.; Magalhaes Fernandes, T.;Managau, S.; Mann, R. G.; Mantelet, G.; Marchal, O.; Marchant, J. M.; Marconi, M.; Marinoni, S.; Marrese, P. M.;Marschalko, G.; Marshall, D. J.; Martın-Fleitas, J. M.; Martino, M.; Mary, N.; Matijevic, G.; Mazeh, T.; McMillan, P.J.; Messina, S.; Michalik, D.; Millar, N. R.; Miranda, B. M. H.; Molina, D.; Molinaro, R.; Molinaro, M.; Molnar, L.;Moniez, M.; Montegriffo, P.; Mor, R.; Mora, A.; Morbidelli, R.; Morel, T.; Morgenthaler, S.; Morris, D.; Mulone, A.F.; Muraveva, T.; Musella, I.; Narbonne, J.; Nelemans, G.; Nicastro, L.; Noval, L.; Ordenovic, C.; Ordieres-Mere, J.;Osborne, P.; Pagani, C.; Pagano, I.; Pailler, F.; Palacin, H.; Palaversa, L.; Parsons, P.; Pecoraro, M.; Pedrosa, R.;Pentikainen, H.; Pichon, B.; Piersimoni, A. M.; Pineau, F.-X.; Plachy, E.; Plum, G.; Poujoulet, E.; Prsa, A.; Pulone,L.; Ragaini, S.; Rago, S.; Rambaux, N.; Ramos-Lerate, M.; Ranalli, P.; Rauw, G.; Read, A.; Regibo, S.; Reyle, C.;Ribeiro, R. A.; Rimoldini, L.; Ripepi, V.; Riva, A.; Rixon, G.; Roelens, M.; Romero-Gomez, M.; Rowell, N.; Royer, F.;Ruiz-Dern, L.; Sadowski, G.; Sagrista Selles, T.; Sahlmann, J.; Salgado, J.; Salguero, E.; Sarasso, M.; Savietto, H.;Schultheis, M.; Sciacca, E.; Segol, M.; Segovia, J. C.; Segransan, D.; Shih, I.-C.; Smareglia, R.; Smart, R. L.; Solano,E.; Solitro, F.; Sordo, R.; Soria Nieto, S.; Souchay, J.; Spagna, A.; Spoto, F.; Stampa, U.; Steele, I. A.; Steidelmuller,H.; Stephenson, C. A.; Stoev, H.; Suess, F. F.; Suveges, M.; Surdej, J.; Szabados, L.; Szegedi-Elek, E.; Tapiador, D.;Taris, F.; Tauran, G.; Taylor, M. B.; Teixeira, R.; Terrett, D.; Tingley, B.; Trager, S. C.; Turon, C.; Ulla, A.; Utrilla,E.; Valentini, G.; van Elteren, A.; Van Hemelryck, E.; vanLeeuwen, M.; Varadi, M.; Vecchiato, A.; Veljanoski, J.; Via,T.; Vicente, D.; Vogt, S.; Voss, H.; Votruba, V.; Voutsinas, S.; Walmsley, G.; Weiler, M.; Weingrill, K.; Wevers, T.;Wyrzykowski, L.; Yoldas, A.; Zerjal, M.; Zucker, S.; Zurbach, C.; Zwitter, T.; Alecu, A.; Allen, M.; Allende Prieto,C.; Amorim, A.; Anglada-Escude, G.; Arsenijevic, V.; Azaz, S.; Balm, P.; Beck, M.; Bernstein, H.-H.; Bigot, L.;Bijaoui, A.; Blasco, C.; Bonfigli, M.; Bono, G.; Boudreault, S.; Bressan, A.; Brown, S.; Brunet, P.-M.; Bunclark, P.;Buonanno, R.; Butkevich, A. G.; Carret, C.; Carrion, C.; Chemin, L.; Chereau, F.; Corcione, L.; Darmigny, E.; deBoer, K. S.; de Teodoro, P.; de Zeeuw, P. T.; Delle Luche, C.; Domingues, C. D.; Dubath, P.; Fodor, F.; Frezouls,B.; Fries, A.; Fustes, D.; Fyfe, D.; Gallardo, E.; Gallegos, J.; Gardiol, D.; Gebran, M.; Gomboc, A.; Gomez, A.; Grux,E.; Gueguen, A.; Heyrovsky, A.; Hoar, J.; Iannicola, G.; Isasi Parache, Y.; Janotto, A.-M.; Joliet, E.; Jonckheere, A.;Keil, R.; Kim, D.-W.; Klagyivik, P.; Klar, J.; Knude, J.; Kochukhov, O.; Kolka, I.; Kos, J.; Kutka, A.; Lainey, V.;LeBouquin, D.; Liu, C.; Loreggia, D.; Makarov, V. V.; Marseille, M. G.; Martayan, C.; Martinez-Rubi, O.; Massart,B.; Meynadier, F.; Mignot, S.; Munari, U.; Nguyen, A.-T.; Nordlander, T.; O’Flaherty, K. S.; Ocvirk, P.; Olias Sanz,A.; Ortiz, P.; Osorio, J.; Oszkiewicz, D.; Ouzounis, A.; Palmer, M.; Park, P.; Pasquato, E.; Peltzer, C.; Peralta, J.;Peturaud, F.; Pieniluoma, T.; Pigozzi, E.; Poels†, J.; Prat, G.; Prod’homme, T.; Raison, F.; Rebordao, J. M.; Risquez,D.; Rocca-Volmerange, B.; Rosen, S.; Ruiz-Fuertes, M. I.; Russo, F.; Sembay, S.; Serraller Vizcaino, I.; Short, A.;Siebert, A.; Silva, H.; Sinachopoulos, D.; Slezak, E.; Soffel, M.; Sosnowska, D.; Straizys, V.; ter Linden, M.; Terrell,D.; Theil, S.; Tiede, C.; Troisi, L.; Tsalmantza, P.; Tur, D.; Vaccari, M.; Vachier, F.; Valles, P.; Van Hamme, W.;Veltz, L.; Virtanen, J.; Wallut, J.-M.; Wichmann, R.; Wilkinson, M. I.; Ziaeepour, H. and Zschocke, S. (2017). GaiaData Release 1: Open cluster astrometry: performance, limitations, and future prospects. Astronomy & Astrophysics,601, article no. A19.

For guidance on citations see FAQs.
c© [not recorded]
Version: Version of Record
Link(s) to article on publisher’s website:http://dx.doi.org/doi:10.1051/0004-6361/201730552
Copyright and Moral Rights for the articles on this site are retained by the individual authors and/or other copyrightowners. For more information on Open Research Online’s data policy on reuse of materials please consult the policiespage.
oro.open.ac.uk
A&A 601, A19 (2017)DOI: 10.1051/0004-6361/201730552c© ESO 2017
Astronomy&Astrophysics
Gaia Data Release 1 Special issueGaia Data Release 1
Open cluster astrometry: performance, limitations, and future prospects?
Gaia Collaboration, F. van Leeuwen1, A. Vallenari2, C. Jordi3, L. Lindegren4, U. Bastian5, T. Prusti6,J. H. J. de Bruijne6, A. G. A. Brown7, C. Babusiaux8, C. A. L. Bailer-Jones9, M. Biermann5, D. W. Evans1, L. Eyer10,
F. Jansen11, S. A. Klioner12, U. Lammers13, X. Luri3, F. Mignard14, C. Panem15, D. Pourbaix16, 17, S. Randich18,P. Sartoretti8, H. I. Siddiqui19, C. Soubiran20, V. Valette15, N. A. Walton1, C. Aerts21, 22, F. Arenou8, M. Cropper23,
R. Drimmel24, E. Høg25, D. Katz8, M. G. Lattanzi24, W. O’Mullane13, E. K. Grebel5, A. D. Holland26,C. Huc15, X. Passot15, M. Perryman6, L. Bramante27, C. Cacciari28, J. Castañeda3, L. Chaoul15, N. Cheek29,
F. De Angeli1, C. Fabricius3, R. Guerra13, J. Hernández13, A. Jean-Antoine-Piccolo15, E. Masana3,R. Messineo27, N. Mowlavi10, K. Nienartowicz30, D. Ordóñez-Blanco30, P. Panuzzo8, J. Portell3,
P. J. Richards31, M. Riello1, G. M. Seabroke23, P. Tanga14, F. Thévenin14, J. Torra3, S. G. Els32, 5, G. Gracia-Abril32, 3,G. Comoretto19, M. Garcia-Reinaldos13, T. Lock13, E. Mercier32, 5, M. Altmann5, 33, R. Andrae9, T. L. Astraatmadja9,I. Bellas-Velidis34, K. Benson23, J. Berthier35, R. Blomme36, G. Busso1, B. Carry14, 35, A. Cellino24, G. Clementini28,
S. Cowell1, O. Creevey14, 37, J. Cuypers36, M. Davidson38, J. De Ridder21, A. de Torres39, L. Delchambre40,A. Dell’Oro18, C. Ducourant20, Y. Frémat36, M. García-Torres41, E. Gosset40, 17, J.-L. Halbwachs42, N. C. Hambly38,
D. L. Harrison1, 43, M. Hauser5, D. Hestroffer35, S. T. Hodgkin1, H. E. Huckle23, A. Hutton44, G. Jasniewicz45,S. Jordan5, M. Kontizas46, A. J. Korn47, A. C. Lanzafame48, 49, M. Manteiga50, A. Moitinho51, K. Muinonen52, 53,
J. Osinde54, E. Pancino18, 55, T. Pauwels36, J.-M. Petit56, A. Recio-Blanco14, A. C. Robin56, L. M. Sarro57, C. Siopis16,M. Smith23, K. W. Smith9, A. Sozzetti24, W. Thuillot35, W. van Reeven44, Y. Viala8, U. Abbas24, A. Abreu
Aramburu58, S. Accart59, J. J. Aguado57, P. M. Allan31, W. Allasia60, G. Altavilla28, M. A. Álvarez50, J. Alves61,R. I. Anderson62, 10, A. H. Andrei63, 64, 33, E. Anglada Varela54, 29, E. Antiche3, T. Antoja6, S. Antón65, 66, B. Arcay50,
N. Bach44, S. G. Baker23, L. Balaguer-Núñez3, C. Barache33, C. Barata51, A. Barbier59, F. Barblan10,D. Barrado y Navascués67, M. Barros51, M. A. Barstow68, U. Becciani49, M. Bellazzini28,
A. Bello García69, V. Belokurov1, P. Bendjoya14, A. Berihuete70, L. Bianchi60, O. Bienaymé42, F. Billebaud20,N. Blagorodnova1, S. Blanco-Cuaresma10, 20, T. Boch42, A. Bombrun39, R. Borrachero3, S. Bouquillon33, G. Bourda20,
H. Bouy67, A. Bragaglia28, M. A. Breddels71, N. Brouillet20, T. Brüsemeister5, B. Bucciarelli24, P. Burgess1,R. Burgon26, A. Burlacu15, D. Busonero24, R. Buzzi24, E. Caffau8, J. Cambras72, H. Campbell1, R. Cancelliere73,
T. Cantat-Gaudin2, T. Carlucci33, J. M. Carrasco3, M. Castellani74, P. Charlot20, J. Charnas30, A. Chiavassa14,M. Clotet3, G. Cocozza28, R. S. Collins38, G. Costigan7, F. Crifo8, N. J. G. Cross38, M. Crosta24, C. Crowley39,
C. Dafonte50, Y. Damerdji40, 75, A. Dapergolas34, P. David35, M. David76, P. De Cat36, F. de Felice77, P. de Laverny14,F. De Luise78, R. De March27, D. de Martino79, R. de Souza80, J. Debosscher21, E. del Pozo44,
M. Delbo14, A. Delgado1, H. E. Delgado57, P. Di Matteo8, S. Diakite56, E. Distefano49, C. Dolding23, S. Dos Anjos80,P. Drazinos46, J. Durán54, Y. Dzigan81, 82, B. Edvardsson47, H. Enke83, N. W. Evans1, G. Eynard Bontemps59,
C. Fabre84, M. Fabrizio55, 78, S. Faigler85, A. J. Falcão86, M. Farràs Casas3, L. Federici28, G. Fedorets52,J. Fernández-Hernández29, P. Fernique42, A. Fienga87, F. Figueras3, F. Filippi27, K. Findeisen8, A. Fonti27,M. Fouesneau9, E. Fraile88, M. Fraser1, J. Fuchs89, M. Gai24, S. Galleti28, L. Galluccio14, D. Garabato50, F.
García-Sedano57, A. Garofalo28, N. Garralda3, P. Gavras8, 34, 46, J. Gerssen83, R. Geyer12, G. Gilmore1, S. Girona90,G. Giuffrida55, M. Gomes51, A. González-Marcos91, J. González-Núñez29, 92, J. J. González-Vidal3, M. Granvik52,
A. Guerrier59, P. Guillout42, J. Guiraud15, A. Gúrpide3, R. Gutiérrez-Sánchez19, L. P. Guy30, R. Haigron8,D. Hatzidimitriou46, 34, M. Haywood8, U. Heiter47, A. Helmi71, D. Hobbs4, W. Hofmann5, B. Holl10, G. Holland1,
J. A. S. Hunt23, A. Hypki7, V. Icardi27, M. Irwin1, G. Jevardat de Fombelle30, P. Jofré1, 20, P. G. Jonker93, 22,A. Jorissen16, F. Julbe3, A. Karampelas46, 34, A. Kochoska94, R. Kohley13, K. Kolenberg95, 21, 96, E. Kontizas34,
S. E. Koposov1, G. Kordopatis83, 14, P. Koubsky89, A. Krone-Martins51, M. Kudryashova35, I. Kull85, R. K. Bachchan4,F. Lacoste-Seris59, A. F. Lanza49, J.-B. Lavigne59, C. Le Poncin-Lafitte33, Y. Lebreton8, 97, T. Lebzelter61, S. Leccia79,
N. Leclerc8, I. Lecoeur-Taibi30, V. Lemaitre59, H. Lenhardt5, F. Leroux59, S. Liao24, 98, E. Licata60,H. E. P. Lindstrøm25, 99, T. A. Lister100, E. Livanou46, A. Lobel36, W. Löffler5, M. López67, D. Lorenz61,I. MacDonald38, T. Magalhães Fernandes86, S. Managau59, R. G. Mann38, G. Mantelet5, O. Marchal8,
J. M. Marchant101, M. Marconi79, S. Marinoni74, 55, P. M. Marrese74, 55, G. Marschalkó102, 103, D. J. Marshall104,J. M. Martín-Fleitas44, M. Martino27, N. Mary59, G. Matijevic83, T. Mazeh85, P. J. McMillan4, S. Messina49,
Article published by EDP Sciences A19, page 1 of 65
A&A 601, A19 (2017)
D. Michalik4, N. R. Millar1, B. M. H. Miranda51, D. Molina3, R. Molinaro79, M. Molinaro105,L. Molnár102, M. Moniez106, P. Montegriffo28, R. Mor3, A. Mora44, R. Morbidelli24, T. Morel40, S. Morgenthaler107,
D. Morris38, A. F. Mulone27, T. Muraveva28, I. Musella79, J. Narbonne59, G. Nelemans22, 21, L. Nicastro108, L. Noval59,C. Ordénovic14, J. Ordieres-Meré109, P. Osborne1, C. Pagani68, I. Pagano49, F. Pailler15, H. Palacin59,
L. Palaversa10, P. Parsons19, M. Pecoraro60, R. Pedrosa110, H. Pentikäinen52, B. Pichon14, A. M. Piersimoni78,F.-X. Pineau42, E. Plachy102, G. Plum8, E. Poujoulet111, A. Prša112, L. Pulone74, S. Ragaini28, S. Rago24,
N. Rambaux35, M. Ramos-Lerate113, P. Ranalli4, G. Rauw40, A. Read68, S. Regibo21, C. Reylé56, R. A. Ribeiro86,L. Rimoldini30, V. Ripepi79, A. Riva24, G. Rixon1, M. Roelens10, M. Romero-Gómez3, N. Rowell38, F. Royer8,
L. Ruiz-Dern8, G. Sadowski16, T. Sagristà Sellés5, J. Sahlmann13, J. Salgado54, E. Salguero54, M. Sarasso24,H. Savietto114, M. Schultheis14, E. Sciacca49, M. Segol115, J. C. Segovia29, D. Segransan10, I.-C. Shih8,
R. Smareglia105, R. L. Smart24, E. Solano67, 116, F. Solitro27, R. Sordo2, S. Soria Nieto3, J. Souchay33, A. Spagna24,F. Spoto14, U. Stampa5, I. A. Steele101, H. Steidelmüller12, C. A. Stephenson19, H. Stoev117, F. F. Suess1,M. Süveges30, J. Surdej40, L. Szabados102, E. Szegedi-Elek102, D. Tapiador118, 119, F. Taris33, G. Tauran59,
M. B. Taylor120, R. Teixeira80, D. Terrett31, B. Tingley121, S. C. Trager71, C. Turon8, A. Ulla122, E. Utrilla44,G. Valentini78, A. van Elteren7, E. Van Hemelryck36, M. van Leeuwen1, M. Varadi10, 102, A. Vecchiato24,
J. Veljanoski71, T. Via72, D. Vicente90, S. Vogt123, H. Voss3, V. Votruba89, S. Voutsinas38, G. Walmsley15, M. Weiler3,K. Weingrill83, T. Wevers22, Ł. Wyrzykowski1, 124, A. Yoldas1, M. Žerjal94, S. Zucker81, C. Zurbach45, T. Zwitter94,A. Alecu1, M. Allen6, C. Allende Prieto23, 125, 126, A. Amorim51, G. Anglada-Escudé3, V. Arsenijevic51, S. Azaz6,
P. Balm19, M. Beck30, H.-H. Bernstein†5, L. Bigot14, A. Bijaoui14, C. Blasco127, M. Bonfigli78, G. Bono74,S. Boudreault23, 128, A. Bressan129, S. Brown1, P.-M. Brunet15, P. Bunclark†1, R. Buonanno74, A. G. Butkevich12,C. Carret110, C. Carrion57, L. Chemin20, 130, F. Chéreau8, L. Corcione24, E. Darmigny15, K. S. de Boer131, P. deTeodoro29, P. T. de Zeeuw7, 132, C. Delle Luche8, 59, C. D. Domingues133, P. Dubath30, F. Fodor15, B. Frézouls15,A. Fries3, D. Fustes50, D. Fyfe68, E. Gallardo3, J. Gallegos29, D. Gardiol24, M. Gebran3, 134, A. Gomboc94, 135,
A. Gómez8, E. Grux56, A. Gueguen8, 136, A. Heyrovsky38, J. Hoar13, G. Iannicola74, Y. Isasi Parache3, A.-M. Janotto15,E. Joliet39, 137, A. Jonckheere36, R. Keil138, 139, D.-W. Kim9, P. Klagyivik102, J. Klar83, J. Knude25,
O. Kochukhov47, I. Kolka140, J. Kos94, 141, A. Kutka89, 142, V. Lainey35, D. LeBouquin59, C. Liu9, 143, D. Loreggia24,V. V. Makarov144, M. G. Marseille59, C. Martayan36, 145, O. Martinez-Rubi3, B. Massart14, 59, 146, F. Meynadier8, 33,S. Mignot8, U. Munari2, A.-T. Nguyen15, T. Nordlander47, K. S. O’Flaherty147, P. Ocvirk83, 42, A. Olias Sanz148,
P. Ortiz68, J. Osorio65, D. Oszkiewicz52, 149, A. Ouzounis38, M. Palmer3, P. Park10, E. Pasquato16, C. Peltzer1,J. Peralta3, F. Péturaud8, T. Pieniluoma52, E. Pigozzi27, J. Poels†40, G. Prat150, T. Prod’homme7, 151,
F. Raison152, 136, J. M. Rebordao133, D. Risquez7, B. Rocca-Volmerange153, S. Rosen23, 68, M. I. Ruiz-Fuertes30,F. Russo24, S. Sembay68, I. Serraller Vizcaino154, A. Short6, A. Siebert42, 83, H. Silva86, D. Sinachopoulos34,
E. Slezak14, M. Soffel12, D. Sosnowska10, V. Straižys155, M. ter Linden39, 156, D. Terrell157, S. Theil158,C. Tiede9, 159, L. Troisi55, 160, P. Tsalmantza9, D. Tur72, M. Vaccari161, 162, F. Vachier35, P. Valles3, W. Van Hamme163,
L. Veltz83, 37, J. Virtanen52, 53, J.-M. Wallut15, R. Wichmann164, M. I. Wilkinson1, 68, H. Ziaeepour56, and S. Zschocke12
(Affiliations can be found after the references)
Received 3 February 2017 / Accepted 25 February 2017
ABSTRACT
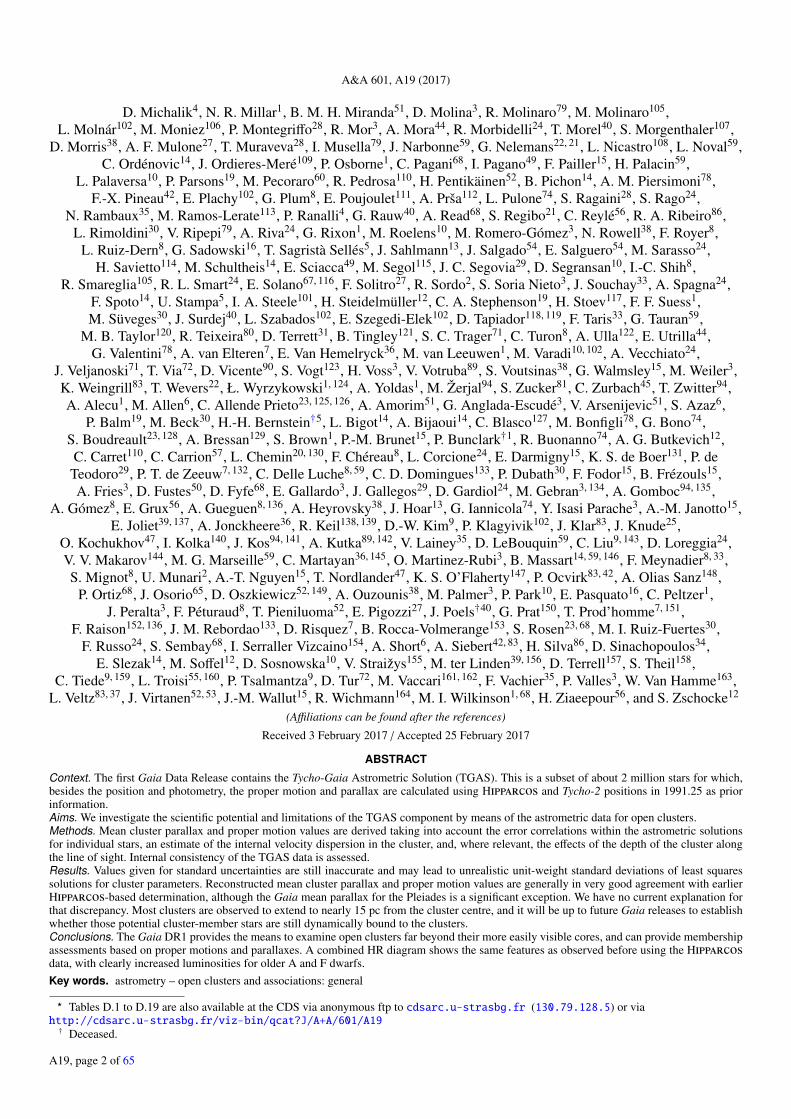
Context. The first Gaia Data Release contains the Tycho-Gaia Astrometric Solution (TGAS). This is a subset of about 2 million stars for which,besides the position and photometry, the proper motion and parallax are calculated using Hipparcos and Tycho-2 positions in 1991.25 as priorinformation.Aims. We investigate the scientific potential and limitations of the TGAS component by means of the astrometric data for open clusters.Methods. Mean cluster parallax and proper motion values are derived taking into account the error correlations within the astrometric solutionsfor individual stars, an estimate of the internal velocity dispersion in the cluster, and, where relevant, the effects of the depth of the cluster alongthe line of sight. Internal consistency of the TGAS data is assessed.Results. Values given for standard uncertainties are still inaccurate and may lead to unrealistic unit-weight standard deviations of least squaressolutions for cluster parameters. Reconstructed mean cluster parallax and proper motion values are generally in very good agreement with earlierHipparcos-based determination, although the Gaia mean parallax for the Pleiades is a significant exception. We have no current explanation forthat discrepancy. Most clusters are observed to extend to nearly 15 pc from the cluster centre, and it will be up to future Gaia releases to establishwhether those potential cluster-member stars are still dynamically bound to the clusters.Conclusions. The Gaia DR1 provides the means to examine open clusters far beyond their more easily visible cores, and can provide membershipassessments based on proper motions and parallaxes. A combined HR diagram shows the same features as observed before using the Hipparcosdata, with clearly increased luminosities for older A and F dwarfs.Key words. astrometry – open clusters and associations: general
? Tables D.1 to D.19 are also available at the CDS via anonymous ftp to cdsarc.u-strasbg.fr (130.79.128.5) or viahttp://cdsarc.u-strasbg.fr/viz-bin/qcat?J/A+A/601/A19† Deceased.
A19, page 2 of 65
Gaia Collaboration (van Leeuwen, F., et al.): Gaia Data Release 1
1. Introduction
The homogeneity in age and composition of stars in open clus-ters makes them unique and very valuable potential tracers ofstellar evolution and galactic structure. However, to reach thispotential it is essential that cluster membership and absolute dis-tances are determined fully independent of assumptions on lumi-nosities. Photometric and spectroscopic data should be obtainedon a single accurate and full-sky-coverage system. To determinedistances for open clusters, a sizeable fraction of the membersneed to be covered, and for the nearby clusters the variationsalong the line of sight, and direction on the sky, in parallaxand proper motion need to be fully accounted for. This is thekind of task that is only possible to achieve with a dedicatedsatellite mission, and was first done using the Hipparcos astro-metric data in conjunction with the Geneva photometric surveys(van Leeuwen 2009, fvl09 from hereon).
The TGAS catalogue in the first Gaia data release(Gaia Collaboration 2016b; DR1 from hereon) provides an orderof magnitude more data than the Hipparcos catalogue did, butat the same time, because of the limitations in its construction, itis more problematic and complicated in its use and interpretation(Lindegren et al. 2016; Gaia Collaboration 2016a; Arenou et al.2017). The combination with the first epoch from the new re-duction of the Hipparcos data (ESA 1997; van Leeuwen 2007)and Tycho-2 (Høg et al. 2000) data, as well as the still very lim-ited scan coverage of the Gaia data in this first data release,creates locally strong and systematic correlations between theastrometric parameters as determined for individual stars. Error-correlation coefficients between the five astrometric parametersstill frequently exceed values as high as 0.8, and need to be takeninto account when determining both mean parallax and meanproper motion data for a cluster. Many details on this can befound in Lindegren et al. (2016).
The way the data had to be processed also plays an impor-tant role. In particular simplifications in the attitude reconstruc-tion (because of low numbers of reference stars) meant that theeffects of clanks1 and minor hits2 were smoothed over, leadingto locally correlated errors on the epoch astrometric data, a prob-lem that should be largely resolved in future releases. This firstrelease on the Gaia star cluster data is therefore a taste of thingsto come, and provides some ideas on how to handle the Gaia as-trometric data for a star cluster. The data derived for the clusterscan still be affected by local systematics in the TGAS catalogue,claimed to be at a level of 0.3 mas (Gaia Collaboration 2016a),and, as we will show, comparisons with the Hipparcos astro-metric data for clusters are consistent with a slightly lower levelof systematics, at 0.25 mas.
The homogeneity of the astrometric data for members ofan open cluster offers possibilities to study some aspects ofthe proper motions and parallaxes as presented in the TGASsection of the Gaia DR1. In particular the reliability of thestandard uncertainties (su from hereon) as quoted in DR1 canbe checked, and localized correlated errors may show up. Dif-ferent roles are there for the nearest cluster (Hyades), eightmedium distance clusters (within 300 pc: Coma Berenices,Pleiades, IC 2391, IC 2602, α Per cluster, Praesepe, Blanco 1,NGC 2451A) and ten more distant clusters (between 300 and500 pc: NGC 6475, NGC 7092, NGC 2516, NGC 2232, IC 4665,NGC 6633, Coll 140, NGC 2422, NGC 3532 and NGC 2547).
1 Discrete adjustments of the satellite structure, and thus telescopepointing, to temperature changes.2 Impacts of external particles, causing discrete rate changes.
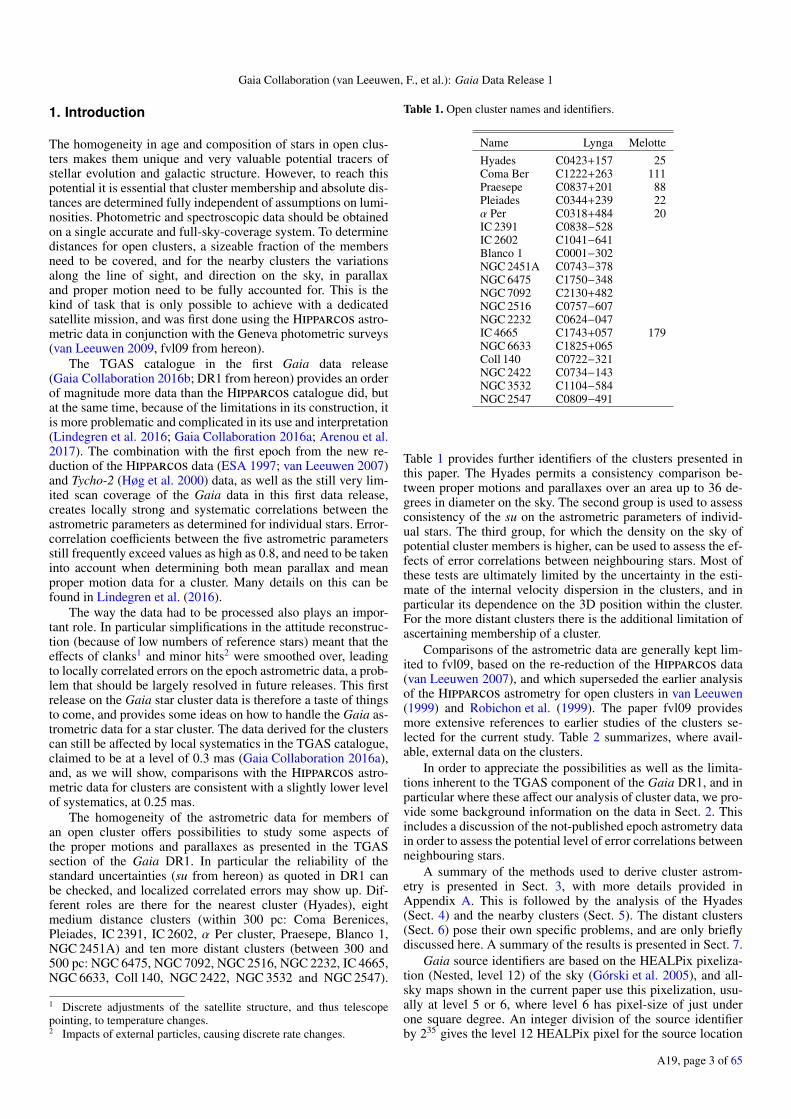
Table 1. Open cluster names and identifiers.
Name Lynga MelotteHyades C0423+157 25Coma Ber C1222+263 111Praesepe C0837+201 88Pleiades C0344+239 22α Per C0318+484 20IC 2391 C0838−528IC 2602 C1041−641Blanco 1 C0001−302NGC 2451A C0743−378NGC 6475 C1750−348NGC 7092 C2130+482NGC 2516 C0757−607NGC 2232 C0624−047IC 4665 C1743+057 179NGC 6633 C1825+065Coll 140 C0722−321NGC 2422 C0734−143NGC 3532 C1104−584NGC 2547 C0809−491
Table 1 provides further identifiers of the clusters presented inthis paper. The Hyades permits a consistency comparison be-tween proper motions and parallaxes over an area up to 36 de-grees in diameter on the sky. The second group is used to assessconsistency of the su on the astrometric parameters of individ-ual stars. The third group, for which the density on the sky ofpotential cluster members is higher, can be used to assess the ef-fects of error correlations between neighbouring stars. Most ofthese tests are ultimately limited by the uncertainty in the esti-mate of the internal velocity dispersion in the clusters, and inparticular its dependence on the 3D position within the cluster.For the more distant clusters there is the additional limitation ofascertaining membership of a cluster.
Comparisons of the astrometric data are generally kept lim-ited to fvl09, based on the re-reduction of the Hipparcos data(van Leeuwen 2007), and which superseded the earlier analysisof the Hipparcos astrometry for open clusters in van Leeuwen(1999) and Robichon et al. (1999). The paper fvl09 providesmore extensive references to earlier studies of the clusters se-lected for the current study. Table 2 summarizes, where avail-able, external data on the clusters.
In order to appreciate the possibilities as well as the limita-tions inherent to the TGAS component of the Gaia DR1, and inparticular where these affect our analysis of cluster data, we pro-vide some background information on the data in Sect. 2. Thisincludes a discussion of the not-published epoch astrometry datain order to assess the potential level of error correlations betweenneighbouring stars.
A summary of the methods used to derive cluster astrom-etry is presented in Sect. 3, with more details provided inAppendix A. This is followed by the analysis of the Hyades(Sect. 4) and the nearby clusters (Sect. 5). The distant clusters(Sect. 6) pose their own specific problems, and are only brieflydiscussed here. A summary of the results is presented in Sect. 7.
Gaia source identifiers are based on the HEALPix pixeliza-tion (Nested, level 12) of the sky (Górski et al. 2005), and all-sky maps shown in the current paper use this pixelization, usu-ally at level 5 or 6, where level 6 has pixel-size of just underone square degree. An integer division of the source identifierby 235 gives the level 12 HEALPix pixel for the source location
A19, page 3 of 65
A&A 601, A19 (2017)
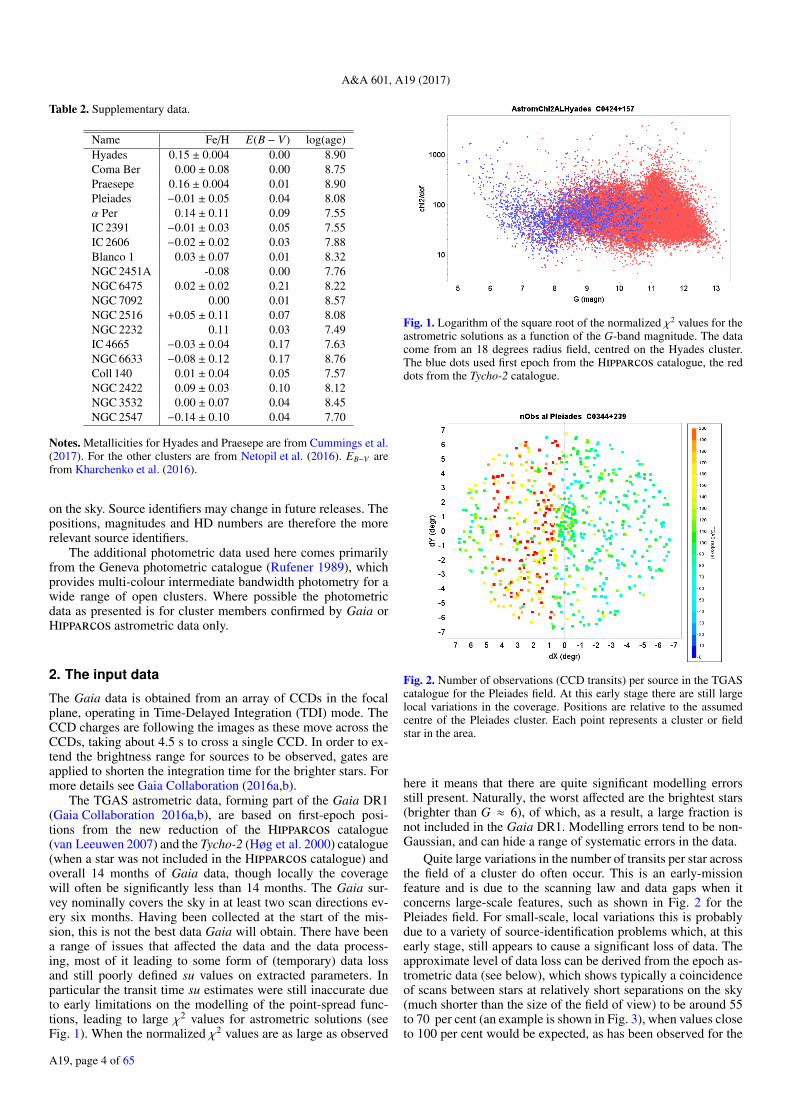
Table 2. Supplementary data.
Name Fe/H E(B − V) log(age)Hyades 0.15 ± 0.004 0.00 8.90Coma Ber 0.00 ± 0.08 0.00 8.75Praesepe 0.16 ± 0.004 0.01 8.90Pleiades −0.01 ± 0.05 0.04 8.08α Per 0.14 ± 0.11 0.09 7.55IC 2391 −0.01 ± 0.03 0.05 7.55IC 2606 −0.02 ± 0.02 0.03 7.88Blanco 1 0.03 ± 0.07 0.01 8.32NGC 2451A -0.08 0.00 7.76NGC 6475 0.02 ± 0.02 0.21 8.22NGC 7092 0.00 0.01 8.57NGC 2516 +0.05 ± 0.11 0.07 8.08NGC 2232 0.11 0.03 7.49IC 4665 −0.03 ± 0.04 0.17 7.63NGC 6633 −0.08 ± 0.12 0.17 8.76Coll 140 0.01 ± 0.04 0.05 7.57NGC 2422 0.09 ± 0.03 0.10 8.12NGC 3532 0.00 ± 0.07 0.04 8.45NGC 2547 −0.14 ± 0.10 0.04 7.70
Notes. Metallicities for Hyades and Praesepe are from Cummings et al.(2017). For the other clusters are from Netopil et al. (2016). EB−V arefrom Kharchenko et al. (2016).
on the sky. Source identifiers may change in future releases. Thepositions, magnitudes and HD numbers are therefore the morerelevant source identifiers.
The additional photometric data used here comes primarilyfrom the Geneva photometric catalogue (Rufener 1989), whichprovides multi-colour intermediate bandwidth photometry for awide range of open clusters. Where possible the photometricdata as presented is for cluster members confirmed by Gaia orHipparcos astrometric data only.
2. The input data
The Gaia data is obtained from an array of CCDs in the focalplane, operating in Time-Delayed Integration (TDI) mode. TheCCD charges are following the images as these move across theCCDs, taking about 4.5 s to cross a single CCD. In order to ex-tend the brightness range for sources to be observed, gates areapplied to shorten the integration time for the brighter stars. Formore details see Gaia Collaboration (2016a,b).
The TGAS astrometric data, forming part of the Gaia DR1(Gaia Collaboration 2016a,b), are based on first-epoch posi-tions from the new reduction of the Hipparcos catalogue(van Leeuwen 2007) and the Tycho-2 (Høg et al. 2000) catalogue(when a star was not included in the Hipparcos catalogue) andoverall 14 months of Gaia data, though locally the coveragewill often be significantly less than 14 months. The Gaia sur-vey nominally covers the sky in at least two scan directions ev-ery six months. Having been collected at the start of the mis-sion, this is not the best data Gaia will obtain. There have beena range of issues that affected the data and the data process-ing, most of it leading to some form of (temporary) data lossand still poorly defined su values on extracted parameters. Inparticular the transit time su estimates were still inaccurate dueto early limitations on the modelling of the point-spread func-tions, leading to large χ2 values for astrometric solutions (seeFig. 1). When the normalized χ2 values are as large as observed
Fig. 1. Logarithm of the square root of the normalized χ2 values for theastrometric solutions as a function of the G-band magnitude. The datacome from an 18 degrees radius field, centred on the Hyades cluster.The blue dots used first epoch from the Hipparcos catalogue, the reddots from the Tycho-2 catalogue.
Fig. 2. Number of observations (CCD transits) per source in the TGAScatalogue for the Pleiades field. At this early stage there are still largelocal variations in the coverage. Positions are relative to the assumedcentre of the Pleiades cluster. Each point represents a cluster or fieldstar in the area.
here it means that there are quite significant modelling errorsstill present. Naturally, the worst affected are the brightest stars(brighter than G ≈ 6), of which, as a result, a large fraction isnot included in the Gaia DR1. Modelling errors tend to be non-Gaussian, and can hide a range of systematic errors in the data.
Quite large variations in the number of transits per star acrossthe field of a cluster do often occur. This is an early-missionfeature and is due to the scanning law and data gaps when itconcerns large-scale features, such as shown in Fig. 2 for thePleiades field. For small-scale, local variations this is probablydue to a variety of source-identification problems which, at thisearly stage, still appears to cause a significant loss of data. Theapproximate level of data loss can be derived from the epoch as-trometric data (see below), which shows typically a coincidenceof scans between stars at relatively short separations on the sky(much shorter than the size of the field of view) to be around 55to 70 per cent (an example is shown in Fig. 3), when values closeto 100 per cent would be expected, as has been observed for the
A19, page 4 of 65
Gaia Collaboration (van Leeuwen, F., et al.): Gaia Data Release 1
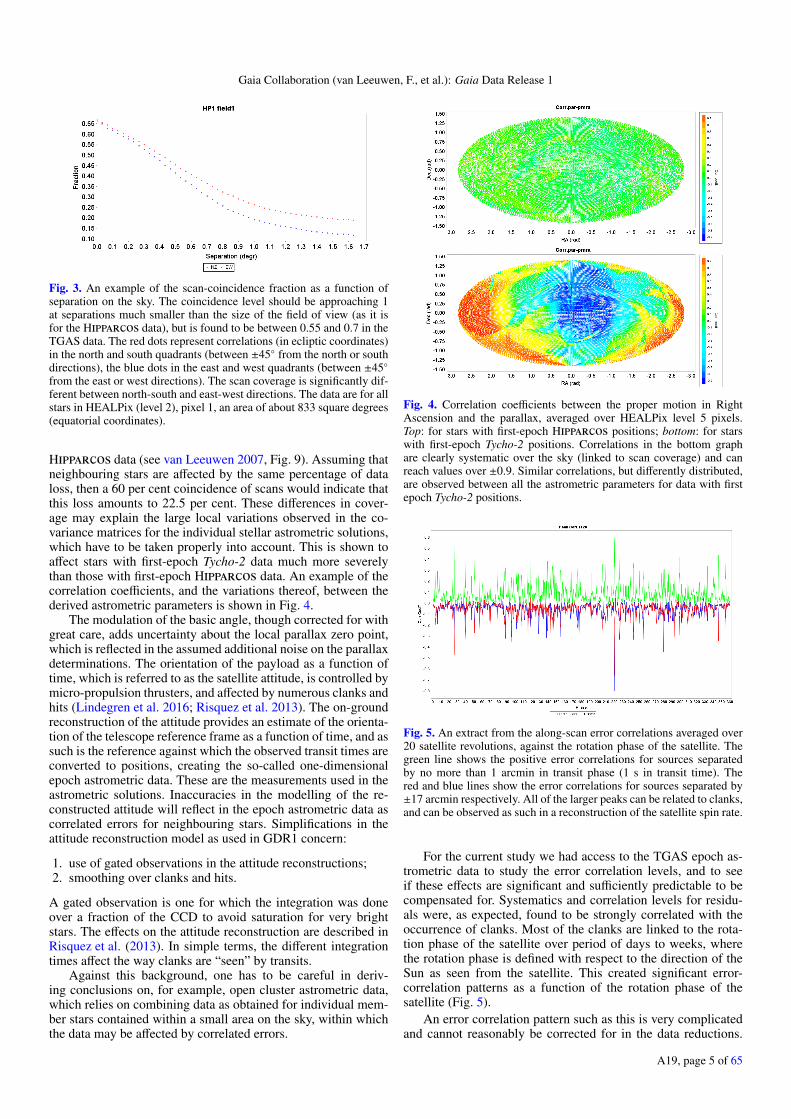
Fig. 3. An example of the scan-coincidence fraction as a function ofseparation on the sky. The coincidence level should be approaching 1at separations much smaller than the size of the field of view (as it isfor the Hipparcos data), but is found to be between 0.55 and 0.7 in theTGAS data. The red dots represent correlations (in ecliptic coordinates)in the north and south quadrants (between ±45◦ from the north or southdirections), the blue dots in the east and west quadrants (between ±45◦from the east or west directions). The scan coverage is significantly dif-ferent between north-south and east-west directions. The data are for allstars in HEALPix (level 2), pixel 1, an area of about 833 square degrees(equatorial coordinates).
Hipparcos data (see van Leeuwen 2007, Fig. 9). Assuming thatneighbouring stars are affected by the same percentage of dataloss, then a 60 per cent coincidence of scans would indicate thatthis loss amounts to 22.5 per cent. These differences in cover-age may explain the large local variations observed in the co-variance matrices for the individual stellar astrometric solutions,which have to be taken properly into account. This is shown toaffect stars with first-epoch Tycho-2 data much more severelythan those with first-epoch Hipparcos data. An example of thecorrelation coefficients, and the variations thereof, between thederived astrometric parameters is shown in Fig. 4.
The modulation of the basic angle, though corrected for withgreat care, adds uncertainty about the local parallax zero point,which is reflected in the assumed additional noise on the parallaxdeterminations. The orientation of the payload as a function oftime, which is referred to as the satellite attitude, is controlled bymicro-propulsion thrusters, and affected by numerous clanks andhits (Lindegren et al. 2016; Risquez et al. 2013). The on-groundreconstruction of the attitude provides an estimate of the orienta-tion of the telescope reference frame as a function of time, and assuch is the reference against which the observed transit times areconverted to positions, creating the so-called one-dimensionalepoch astrometric data. These are the measurements used in theastrometric solutions. Inaccuracies in the modelling of the re-constructed attitude will reflect in the epoch astrometric data ascorrelated errors for neighbouring stars. Simplifications in theattitude reconstruction model as used in GDR1 concern:
1. use of gated observations in the attitude reconstructions;2. smoothing over clanks and hits.
A gated observation is one for which the integration was doneover a fraction of the CCD to avoid saturation for very brightstars. The effects on the attitude reconstruction are described inRisquez et al. (2013). In simple terms, the different integrationtimes affect the way clanks are “seen” by transits.
Against this background, one has to be careful in deriv-ing conclusions on, for example, open cluster astrometric data,which relies on combining data as obtained for individual mem-ber stars contained within a small area on the sky, within whichthe data may be affected by correlated errors.
Fig. 4. Correlation coefficients between the proper motion in RightAscension and the parallax, averaged over HEALPix level 5 pixels.Top: for stars with first-epoch Hipparcos positions; bottom: for starswith first-epoch Tycho-2 positions. Correlations in the bottom graphare clearly systematic over the sky (linked to scan coverage) and canreach values over ±0.9. Similar correlations, but differently distributed,are observed between all the astrometric parameters for data with firstepoch Tycho-2 positions.
Fig. 5. An extract from the along-scan error correlations averaged over20 satellite revolutions, against the rotation phase of the satellite. Thegreen line shows the positive error correlations for sources separatedby no more than 1 arcmin in transit phase (1 s in transit time). Thered and blue lines show the error correlations for sources separated by±17 arcmin respectively. All of the larger peaks can be related to clanks,and can be observed as such in a reconstruction of the satellite spin rate.
For the current study we had access to the TGAS epoch as-trometric data to study the error correlation levels, and to seeif these effects are significant and sufficiently predictable to becompensated for. Systematics and correlation levels for residu-als were, as expected, found to be strongly correlated with theoccurrence of clanks. Most of the clanks are linked to the rota-tion phase of the satellite over period of days to weeks, wherethe rotation phase is defined with respect to the direction of theSun as seen from the satellite. This created significant error-correlation patterns as a function of the rotation phase of thesatellite (Fig. 5).
An error correlation pattern such as this is very complicatedand cannot reasonably be corrected for in the data reductions.
A19, page 5 of 65
A&A 601, A19 (2017)
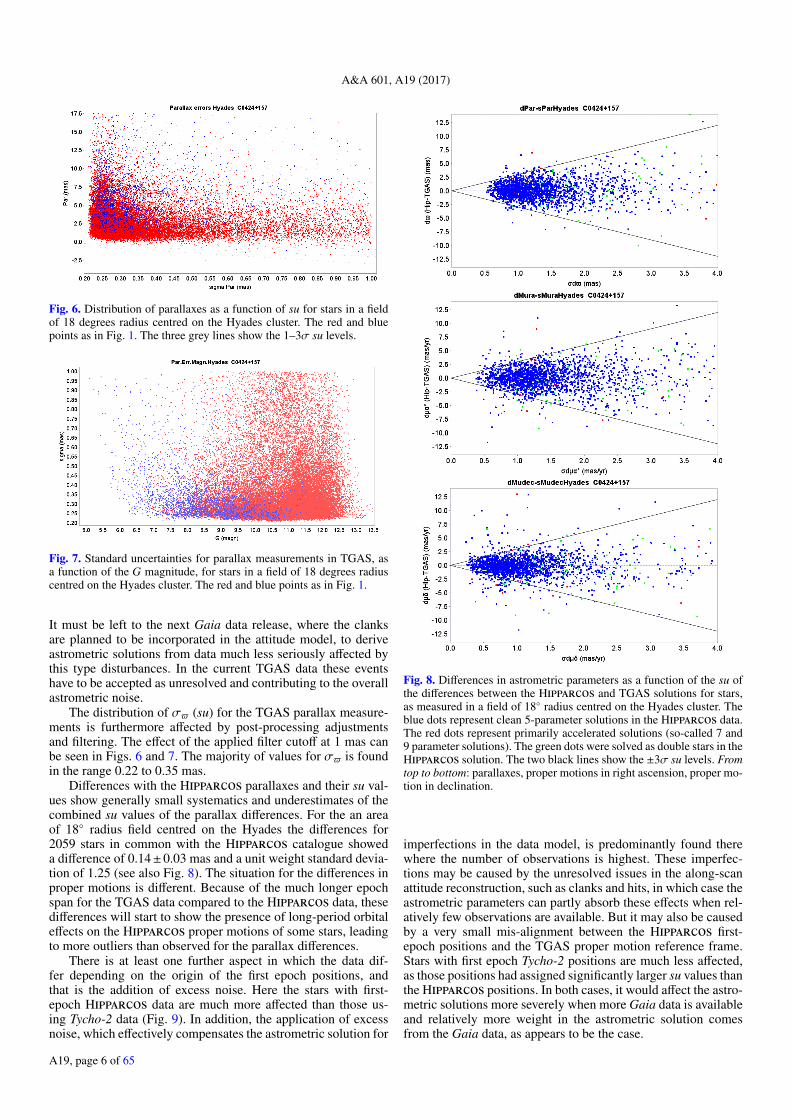
Fig. 6. Distribution of parallaxes as a function of su for stars in a fieldof 18 degrees radius centred on the Hyades cluster. The red and bluepoints as in Fig. 1. The three grey lines show the 1–3σ su levels.
Fig. 7. Standard uncertainties for parallax measurements in TGAS, asa function of the G magnitude, for stars in a field of 18 degrees radiuscentred on the Hyades cluster. The red and blue points as in Fig. 1.
It must be left to the next Gaia data release, where the clanksare planned to be incorporated in the attitude model, to deriveastrometric solutions from data much less seriously affected bythis type disturbances. In the current TGAS data these eventshave to be accepted as unresolved and contributing to the overallastrometric noise.
The distribution of σ$ (su) for the TGAS parallax measure-ments is furthermore affected by post-processing adjustmentsand filtering. The effect of the applied filter cutoff at 1 mas canbe seen in Figs. 6 and 7. The majority of values for σ$ is foundin the range 0.22 to 0.35 mas.
Differences with the Hipparcos parallaxes and their su val-ues show generally small systematics and underestimates of thecombined su values of the parallax differences. For the an areaof 18◦ radius field centred on the Hyades the differences for2059 stars in common with the Hipparcos catalogue showeda difference of 0.14±0.03 mas and a unit weight standard devia-tion of 1.25 (see also Fig. 8). The situation for the differences inproper motions is different. Because of the much longer epochspan for the TGAS data compared to the Hipparcos data, thesedifferences will start to show the presence of long-period orbitaleffects on the Hipparcos proper motions of some stars, leadingto more outliers than observed for the parallax differences.
There is at least one further aspect in which the data dif-fer depending on the origin of the first epoch positions, andthat is the addition of excess noise. Here the stars with first-epoch Hipparcos data are much more affected than those us-ing Tycho-2 data (Fig. 9). In addition, the application of excessnoise, which effectively compensates the astrometric solution for
Fig. 8. Differences in astrometric parameters as a function of the su ofthe differences between the Hipparcos and TGAS solutions for stars,as measured in a field of 18◦ radius centred on the Hyades cluster. Theblue dots represent clean 5-parameter solutions in the Hipparcos data.The red dots represent primarily accelerated solutions (so-called 7 and9 parameter solutions). The green dots were solved as double stars in theHipparcos solution. The two black lines show the ±3σ su levels. Fromtop to bottom: parallaxes, proper motions in right ascension, proper mo-tion in declination.
imperfections in the data model, is predominantly found therewhere the number of observations is highest. These imperfec-tions may be caused by the unresolved issues in the along-scanattitude reconstruction, such as clanks and hits, in which case theastrometric parameters can partly absorb these effects when rel-atively few observations are available. But it may also be causedby a very small mis-alignment between the Hipparcos first-epoch positions and the TGAS proper motion reference frame.Stars with first epoch Tycho-2 positions are much less affected,as those positions had assigned significantly larger su values thanthe Hipparcos positions. In both cases, it would affect the astro-metric solutions more severely when more Gaia data is availableand relatively more weight in the astrometric solution comesfrom the Gaia data, as appears to be the case.
A19, page 6 of 65
Gaia Collaboration (van Leeuwen, F., et al.): Gaia Data Release 1
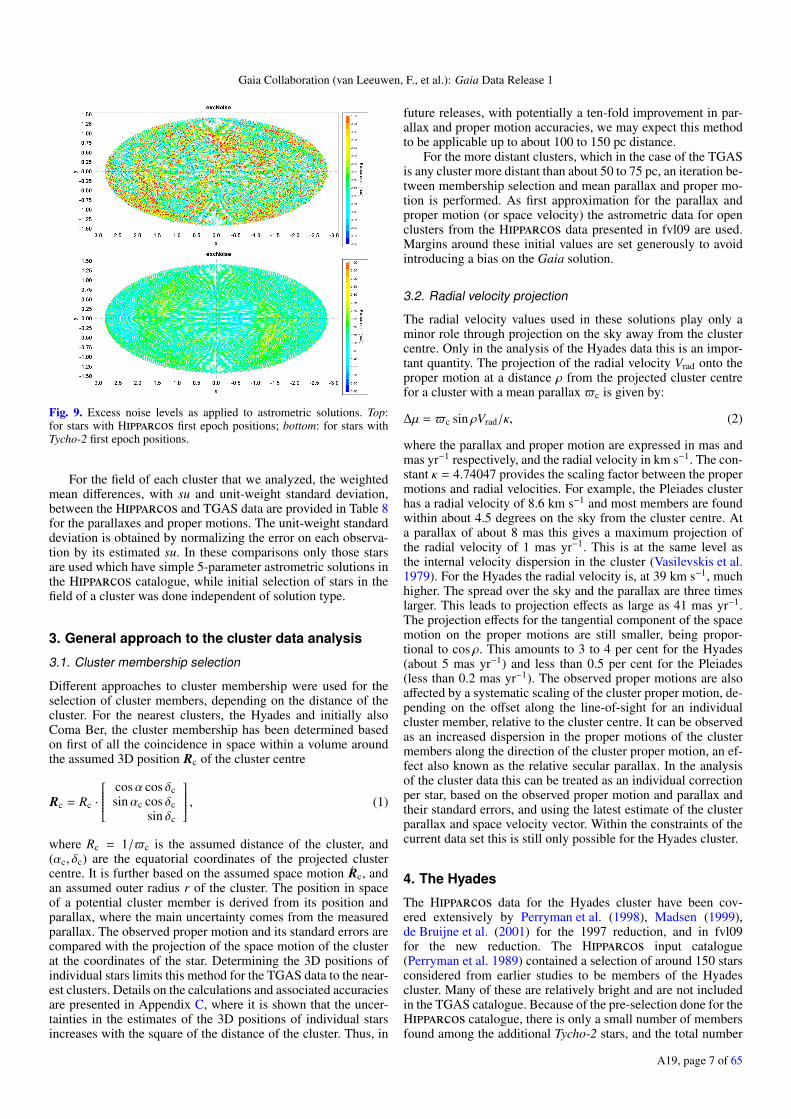
Fig. 9. Excess noise levels as applied to astrometric solutions. Top:for stars with Hipparcos first epoch positions; bottom: for stars withTycho-2 first epoch positions.
For the field of each cluster that we analyzed, the weightedmean differences, with su and unit-weight standard deviation,between the Hipparcos and TGAS data are provided in Table 8for the parallaxes and proper motions. The unit-weight standarddeviation is obtained by normalizing the error on each observa-tion by its estimated su. In these comparisons only those starsare used which have simple 5-parameter astrometric solutions inthe Hipparcos catalogue, while initial selection of stars in thefield of a cluster was done independent of solution type.
3. General approach to the cluster data analysis
3.1. Cluster membership selection
Different approaches to cluster membership were used for theselection of cluster members, depending on the distance of thecluster. For the nearest clusters, the Hyades and initially alsoComa Ber, the cluster membership has been determined basedon first of all the coincidence in space within a volume aroundthe assumed 3D position Rc of the cluster centre
Rc = Rc ·
cosα cos δcsinαc cos δc
sin δc
, (1)
where Rc = 1/$c is the assumed distance of the cluster, and(αc, δc) are the equatorial coordinates of the projected clustercentre. It is further based on the assumed space motion Rc, andan assumed outer radius r of the cluster. The position in spaceof a potential cluster member is derived from its position andparallax, where the main uncertainty comes from the measuredparallax. The observed proper motion and its standard errors arecompared with the projection of the space motion of the clusterat the coordinates of the star. Determining the 3D positions ofindividual stars limits this method for the TGAS data to the near-est clusters. Details on the calculations and associated accuraciesare presented in Appendix C, where it is shown that the uncer-tainties in the estimates of the 3D positions of individual starsincreases with the square of the distance of the cluster. Thus, in
future releases, with potentially a ten-fold improvement in par-allax and proper motion accuracies, we may expect this methodto be applicable up to about 100 to 150 pc distance.
For the more distant clusters, which in the case of the TGASis any cluster more distant than about 50 to 75 pc, an iteration be-tween membership selection and mean parallax and proper mo-tion is performed. As first approximation for the parallax andproper motion (or space velocity) the astrometric data for openclusters from the Hipparcos data presented in fvl09 are used.Margins around these initial values are set generously to avoidintroducing a bias on the Gaia solution.
3.2. Radial velocity projection
The radial velocity values used in these solutions play only aminor role through projection on the sky away from the clustercentre. Only in the analysis of the Hyades data this is an impor-tant quantity. The projection of the radial velocity Vrad onto theproper motion at a distance ρ from the projected cluster centrefor a cluster with a mean parallax $c is given by:
∆µ = $c sin ρVrad/κ, (2)
where the parallax and proper motion are expressed in mas andmas yr−1 respectively, and the radial velocity in km s−1. The con-stant κ = 4.74047 provides the scaling factor between the propermotions and radial velocities. For example, the Pleiades clusterhas a radial velocity of 8.6 km s−1 and most members are foundwithin about 4.5 degrees on the sky from the cluster centre. Ata parallax of about 8 mas this gives a maximum projection ofthe radial velocity of 1 mas yr−1. This is at the same level asthe internal velocity dispersion in the cluster (Vasilevskis et al.1979). For the Hyades the radial velocity is, at 39 km s−1, muchhigher. The spread over the sky and the parallax are three timeslarger. This leads to projection effects as large as 41 mas yr−1.The projection effects for the tangential component of the spacemotion on the proper motions are still smaller, being propor-tional to cos ρ. This amounts to 3 to 4 per cent for the Hyades(about 5 mas yr−1) and less than 0.5 per cent for the Pleiades(less than 0.2 mas yr−1). The observed proper motions are alsoaffected by a systematic scaling of the cluster proper motion, de-pending on the offset along the line-of-sight for an individualcluster member, relative to the cluster centre. It can be observedas an increased dispersion in the proper motions of the clustermembers along the direction of the cluster proper motion, an ef-fect also known as the relative secular parallax. In the analysisof the cluster data this can be treated as an individual correctionper star, based on the observed proper motion and parallax andtheir standard errors, and using the latest estimate of the clusterparallax and space velocity vector. Within the constraints of thecurrent data set this is still only possible for the Hyades cluster.
4. The Hyades
The Hipparcos data for the Hyades cluster have been cov-ered extensively by Perryman et al. (1998), Madsen (1999),de Bruijne et al. (2001) for the 1997 reduction, and in fvl09for the new reduction. The Hipparcos input catalogue(Perryman et al. 1989) contained a selection of around 150 starsconsidered from earlier studies to be members of the Hyadescluster. Many of these are relatively bright and are not includedin the TGAS catalogue. Because of the pre-selection done for theHipparcos catalogue, there is only a small number of membersfound among the additional Tycho-2 stars, and the total number
A19, page 7 of 65
A&A 601, A19 (2017)
of members, with Hipparcos first epoch data, available for thecurrent study is just over half the number that was available forthe Hipparcos studies.
Starting with the cluster centre and parallax as derived infvl09, 285 stars are found within the Gaia DR1 TGAS cataloguefor which the position is likely to be within 16 pc from the as-sumed cluster centre in space, taking into account the su on theparallaxes of the individual stars and their positions as projectedon the sky, relative to the projected cluster centre. The data se-lection has to be limited to relative errors on the parallaxes of atmost 20 per cent, else distances to the individual stars becomeeffectively undetermined. In Appendix C further details are pre-sented on deriving the relative distance and its su for a star fromthe assumed cluster centre.
The next selection step calculates predicted proper motionsfrom the space velocity of the cluster as projected perpendic-ular to the line of sight, and scaled according to the observedparallax. The details for the projection calculations are given inAppendix A.2. These predicted proper motions only account forthe projection of the space motion of the entire cluster at theposition on the sky and the observed parallax of the star. Whencomparing these predicted proper motions with the observed val-ues there are three types of error contributions that need to beconsidered:
1. the su on the observed proper motions;2. the su of the predicted proper motions, mainly resulting
from the errors on the observed parallaxes;3. the internal velocity dispersion and possible systematic mo-
tions in the cluster, estimated to be at a level of about0.6 km s−1.
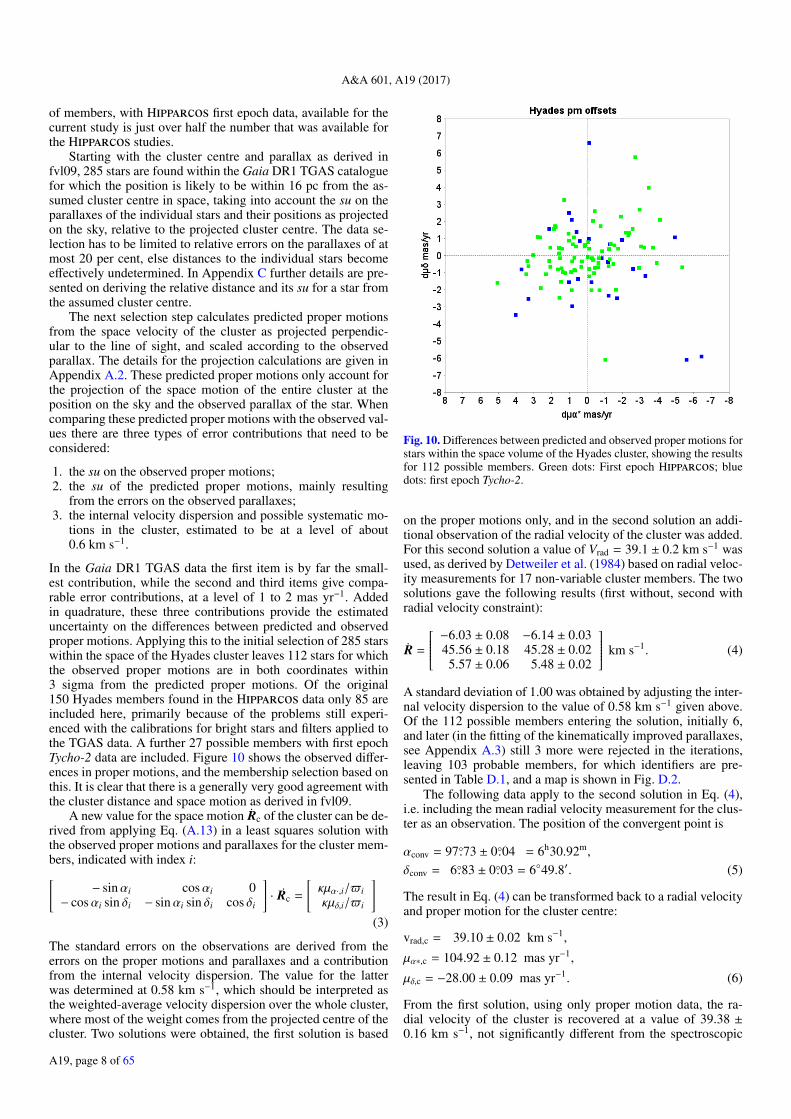
In the Gaia DR1 TGAS data the first item is by far the small-est contribution, while the second and third items give compa-rable error contributions, at a level of 1 to 2 mas yr−1. Addedin quadrature, these three contributions provide the estimateduncertainty on the differences between predicted and observedproper motions. Applying this to the initial selection of 285 starswithin the space of the Hyades cluster leaves 112 stars for whichthe observed proper motions are in both coordinates within3 sigma from the predicted proper motions. Of the original150 Hyades members found in the Hipparcos data only 85 areincluded here, primarily because of the problems still experi-enced with the calibrations for bright stars and filters applied tothe TGAS data. A further 27 possible members with first epochTycho-2 data are included. Figure 10 shows the observed differ-ences in proper motions, and the membership selection based onthis. It is clear that there is a generally very good agreement withthe cluster distance and space motion as derived in fvl09.
A new value for the space motion Rc of the cluster can be de-rived from applying Eq. (A.13) in a least squares solution withthe observed proper motions and parallaxes for the cluster mem-bers, indicated with index i:[
− sinαi cosαi 0− cosαi sin δi − sinαi sin δi cos δi
]· Rc =
[κµα·,i/$iκµδ,i/$i
](3)
The standard errors on the observations are derived from theerrors on the proper motions and parallaxes and a contributionfrom the internal velocity dispersion. The value for the latterwas determined at 0.58 km s−1, which should be interpreted asthe weighted-average velocity dispersion over the whole cluster,where most of the weight comes from the projected centre of thecluster. Two solutions were obtained, the first solution is based
Fig. 10. Differences between predicted and observed proper motions forstars within the space volume of the Hyades cluster, showing the resultsfor 112 possible members. Green dots: First epoch Hipparcos; bluedots: first epoch Tycho-2.
on the proper motions only, and in the second solution an addi-tional observation of the radial velocity of the cluster was added.For this second solution a value of Vrad = 39.1 ± 0.2 km s−1 wasused, as derived by Detweiler et al. (1984) based on radial veloc-ity measurements for 17 non-variable cluster members. The twosolutions gave the following results (first without, second withradial velocity constraint):
R =
−6.03 ± 0.08 −6.14 ± 0.0345.56 ± 0.18 45.28 ± 0.025.57 ± 0.06 5.48 ± 0.02
km s−1. (4)
A standard deviation of 1.00 was obtained by adjusting the inter-nal velocity dispersion to the value of 0.58 km s−1 given above.Of the 112 possible members entering the solution, initially 6,and later (in the fitting of the kinematically improved parallaxes,see Appendix A.3) still 3 more were rejected in the iterations,leaving 103 probable members, for which identifiers are pre-sented in Table D.1, and a map is shown in Fig. D.2.
The following data apply to the second solution in Eq. (4),i.e. including the mean radial velocity measurement for the clus-ter as an observation. The position of the convergent point is
αconv = 97◦.73 ± 0◦.04 = 6h30.92m,
δconv = 6◦.83 ± 0◦.03 = 6◦49.8′. (5)
The result in Eq. (4) can be transformed back to a radial velocityand proper motion for the cluster centre:
vrad,c = 39.10 ± 0.02 km s−1,
µα∗,c = 104.92 ± 0.12 mas yr−1,
µδ,c = −28.00 ± 0.09 mas yr−1. (6)
From the first solution, using only proper motion data, the ra-dial velocity of the cluster is recovered at a value of 39.38 ±0.16 km s−1, not significantly different from the spectroscopic
A19, page 8 of 65
Gaia Collaboration (van Leeuwen, F., et al.): Gaia Data Release 1
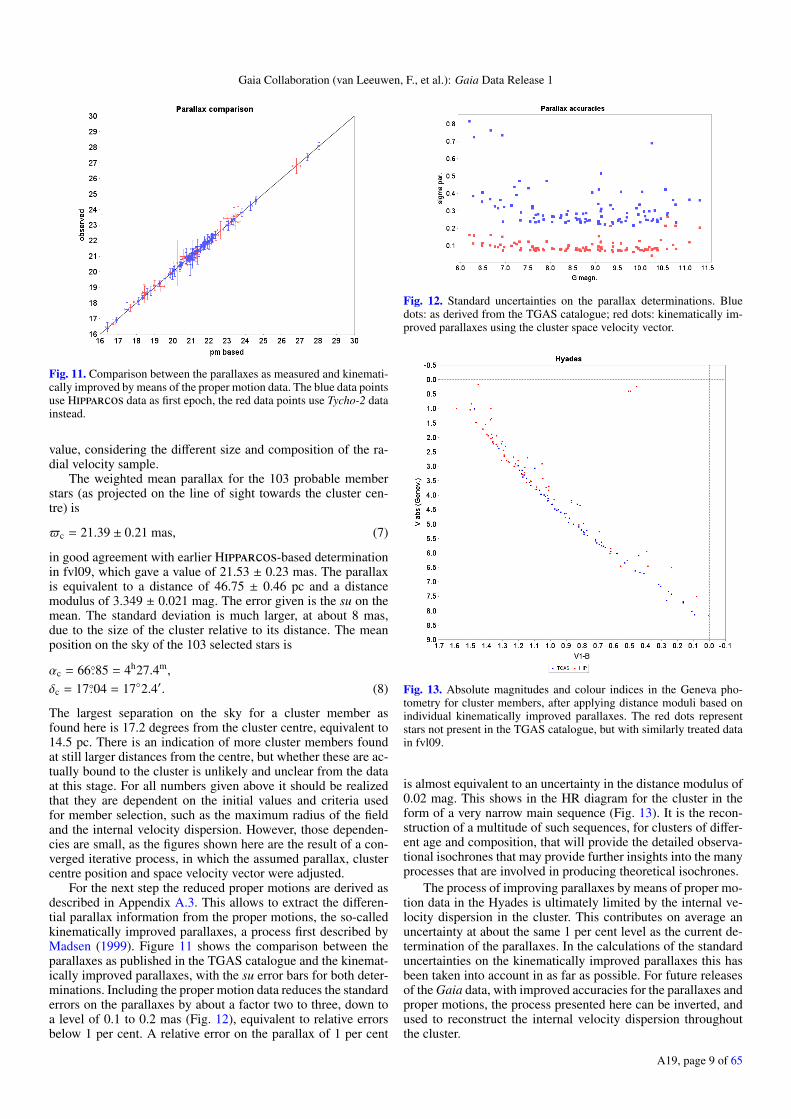
Fig. 11. Comparison between the parallaxes as measured and kinemati-cally improved by means of the proper motion data. The blue data pointsuse Hipparcos data as first epoch, the red data points use Tycho-2 datainstead.
value, considering the different size and composition of the ra-dial velocity sample.
The weighted mean parallax for the 103 probable memberstars (as projected on the line of sight towards the cluster cen-tre) is
$c = 21.39 ± 0.21 mas, (7)
in good agreement with earlier Hipparcos-based determinationin fvl09, which gave a value of 21.53 ± 0.23 mas. The parallaxis equivalent to a distance of 46.75 ± 0.46 pc and a distancemodulus of 3.349 ± 0.021 mag. The error given is the su on themean. The standard deviation is much larger, at about 8 mas,due to the size of the cluster relative to its distance. The meanposition on the sky of the 103 selected stars is
αc = 66◦.85 = 4h27.4m,
δc = 17◦.04 = 17◦2.4′. (8)
The largest separation on the sky for a cluster member asfound here is 17.2 degrees from the cluster centre, equivalent to14.5 pc. There is an indication of more cluster members foundat still larger distances from the centre, but whether these are ac-tually bound to the cluster is unlikely and unclear from the dataat this stage. For all numbers given above it should be realizedthat they are dependent on the initial values and criteria usedfor member selection, such as the maximum radius of the fieldand the internal velocity dispersion. However, those dependen-cies are small, as the figures shown here are the result of a con-verged iterative process, in which the assumed parallax, clustercentre position and space velocity vector were adjusted.
For the next step the reduced proper motions are derived asdescribed in Appendix A.3. This allows to extract the differen-tial parallax information from the proper motions, the so-calledkinematically improved parallaxes, a process first described byMadsen (1999). Figure 11 shows the comparison between theparallaxes as published in the TGAS catalogue and the kinemat-ically improved parallaxes, with the su error bars for both deter-minations. Including the proper motion data reduces the standarderrors on the parallaxes by about a factor two to three, down toa level of 0.1 to 0.2 mas (Fig. 12), equivalent to relative errorsbelow 1 per cent. A relative error on the parallax of 1 per cent
Fig. 12. Standard uncertainties on the parallax determinations. Bluedots: as derived from the TGAS catalogue; red dots: kinematically im-proved parallaxes using the cluster space velocity vector.
Fig. 13. Absolute magnitudes and colour indices in the Geneva pho-tometry for cluster members, after applying distance moduli based onindividual kinematically improved parallaxes. The red dots representstars not present in the TGAS catalogue, but with similarly treated datain fvl09.
is almost equivalent to an uncertainty in the distance modulus of0.02 mag. This shows in the HR diagram for the cluster in theform of a very narrow main sequence (Fig. 13). It is the recon-struction of a multitude of such sequences, for clusters of differ-ent age and composition, that will provide the detailed observa-tional isochrones that may provide further insights into the manyprocesses that are involved in producing theoretical isochrones.
The process of improving parallaxes by means of proper mo-tion data in the Hyades is ultimately limited by the internal ve-locity dispersion in the cluster. This contributes on average anuncertainty at about the same 1 per cent level as the current de-termination of the parallaxes. In the calculations of the standarduncertainties on the kinematically improved parallaxes this hasbeen taken into account in as far as possible. For future releasesof the Gaia data, with improved accuracies for the parallaxes andproper motions, the process presented here can be inverted, andused to reconstruct the internal velocity dispersion throughoutthe cluster.
A19, page 9 of 65
A&A 601, A19 (2017)
Table 3. Spatial densities in the Hyades cluster for 106 selected stars(before the final elimination of 3 possible members).
r1 r2 stars log d
0 1 1 –0.621 2 10 –0.472 3 15 –0.723 4 14 –1.044 5 13 –1.295 6 10 –1.586 8 16 –1.898 11 12 –2.45
11 16 15 –2.89
Notes. r1 and r2 are the inner and outer radius in pc. d gives the densityin number of stars per cubic parsec.
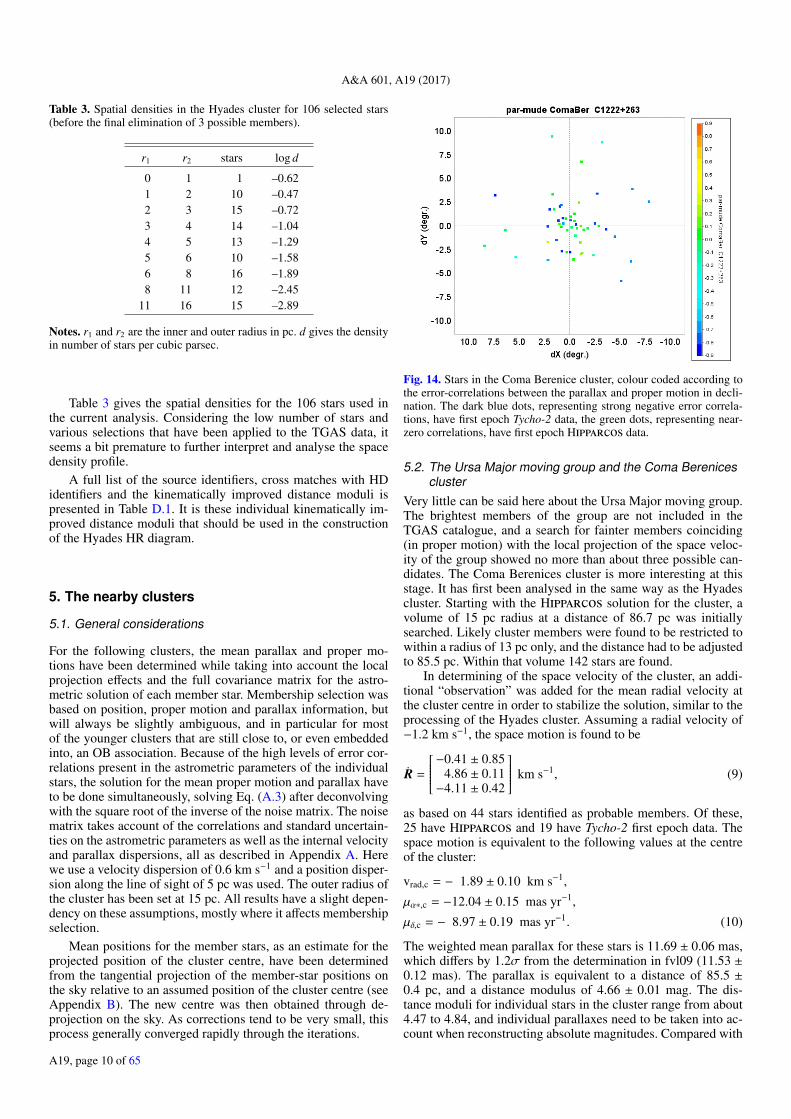
Table 3 gives the spatial densities for the 106 stars used inthe current analysis. Considering the low number of stars andvarious selections that have been applied to the TGAS data, itseems a bit premature to further interpret and analyse the spacedensity profile.
A full list of the source identifiers, cross matches with HDidentifiers and the kinematically improved distance moduli ispresented in Table D.1. It is these individual kinematically im-proved distance moduli that should be used in the constructionof the Hyades HR diagram.
5. The nearby clusters
5.1. General considerations
For the following clusters, the mean parallax and proper mo-tions have been determined while taking into account the localprojection effects and the full covariance matrix for the astro-metric solution of each member star. Membership selection wasbased on position, proper motion and parallax information, butwill always be slightly ambiguous, and in particular for mostof the younger clusters that are still close to, or even embeddedinto, an OB association. Because of the high levels of error cor-relations present in the astrometric parameters of the individualstars, the solution for the mean proper motion and parallax haveto be done simultaneously, solving Eq. (A.3) after deconvolvingwith the square root of the inverse of the noise matrix. The noisematrix takes account of the correlations and standard uncertain-ties on the astrometric parameters as well as the internal velocityand parallax dispersions, all as described in Appendix A. Herewe use a velocity dispersion of 0.6 km s−1 and a position disper-sion along the line of sight of 5 pc was used. The outer radius ofthe cluster has been set at 15 pc. All results have a slight depen-dency on these assumptions, mostly where it affects membershipselection.
Mean positions for the member stars, as an estimate for theprojected position of the cluster centre, have been determinedfrom the tangential projection of the member-star positions onthe sky relative to an assumed position of the cluster centre (seeAppendix B). The new centre was then obtained through de-projection on the sky. As corrections tend to be very small, thisprocess generally converged rapidly through the iterations.
Fig. 14. Stars in the Coma Berenice cluster, colour coded according tothe error-correlations between the parallax and proper motion in decli-nation. The dark blue dots, representing strong negative error correla-tions, have first epoch Tycho-2 data, the green dots, representing near-zero correlations, have first epoch Hipparcos data.
5.2. The Ursa Major moving group and the Coma Berenicescluster
Very little can be said here about the Ursa Major moving group.The brightest members of the group are not included in theTGAS catalogue, and a search for fainter members coinciding(in proper motion) with the local projection of the space veloc-ity of the group showed no more than about three possible can-didates. The Coma Berenices cluster is more interesting at thisstage. It has first been analysed in the same way as the Hyadescluster. Starting with the Hipparcos solution for the cluster, avolume of 15 pc radius at a distance of 86.7 pc was initiallysearched. Likely cluster members were found to be restricted towithin a radius of 13 pc only, and the distance had to be adjustedto 85.5 pc. Within that volume 142 stars are found.
In determining of the space velocity of the cluster, an addi-tional “observation” was added for the mean radial velocity atthe cluster centre in order to stabilize the solution, similar to theprocessing of the Hyades cluster. Assuming a radial velocity of−1.2 km s−1, the space motion is found to be
R =
−0.41 ± 0.854.86 ± 0.11−4.11 ± 0.42
km s−1, (9)
as based on 44 stars identified as probable members. Of these,25 have Hipparcos and 19 have Tycho-2 first epoch data. Thespace motion is equivalent to the following values at the centreof the cluster:
vrad,c = − 1.89 ± 0.10 km s−1,
µα∗,c = −12.04 ± 0.15 mas yr−1,
µδ,c = − 8.97 ± 0.19 mas yr−1. (10)
The weighted mean parallax for these stars is 11.69 ± 0.06 mas,which differs by 1.2σ from the determination in fvl09 (11.53 ±0.12 mas). The parallax is equivalent to a distance of 85.5 ±0.4 pc, and a distance modulus of 4.66 ± 0.01 mag. The dis-tance moduli for individual stars in the cluster range from about4.47 to 4.84, and individual parallaxes need to be taken into ac-count when reconstructing absolute magnitudes. Compared with
A19, page 10 of 65
Gaia Collaboration (van Leeuwen, F., et al.): Gaia Data Release 1
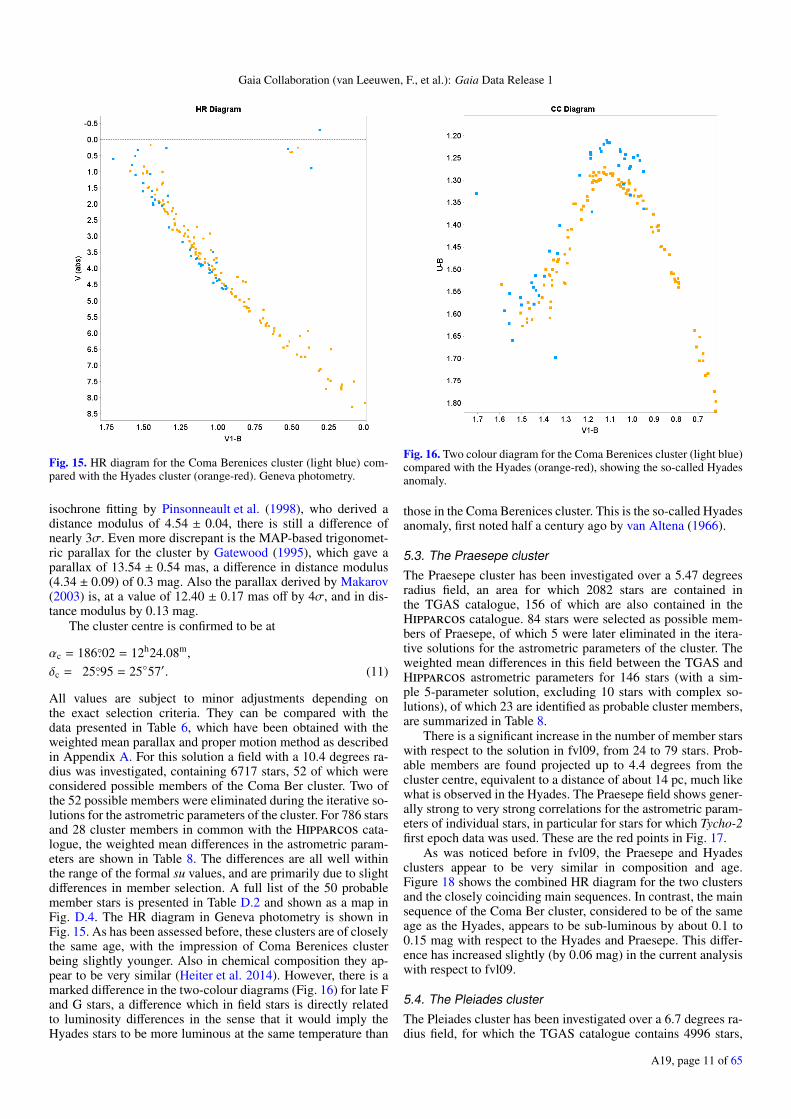
Fig. 15. HR diagram for the Coma Berenices cluster (light blue) com-pared with the Hyades cluster (orange-red). Geneva photometry.
isochrone fitting by Pinsonneault et al. (1998), who derived adistance modulus of 4.54 ± 0.04, there is still a difference ofnearly 3σ. Even more discrepant is the MAP-based trigonomet-ric parallax for the cluster by Gatewood (1995), which gave aparallax of 13.54 ± 0.54 mas, a difference in distance modulus(4.34 ± 0.09) of 0.3 mag. Also the parallax derived by Makarov(2003) is, at a value of 12.40 ± 0.17 mas off by 4σ, and in dis-tance modulus by 0.13 mag.
The cluster centre is confirmed to be at
αc = 186◦.02 = 12h24.08m,
δc = 25◦.95 = 25◦57′. (11)
All values are subject to minor adjustments depending onthe exact selection criteria. They can be compared with thedata presented in Table 6, which have been obtained with theweighted mean parallax and proper motion method as describedin Appendix A. For this solution a field with a 10.4 degrees ra-dius was investigated, containing 6717 stars, 52 of which wereconsidered possible members of the Coma Ber cluster. Two ofthe 52 possible members were eliminated during the iterative so-lutions for the astrometric parameters of the cluster. For 786 starsand 28 cluster members in common with the Hipparcos cata-logue, the weighted mean differences in the astrometric param-eters are shown in Table 8. The differences are all well withinthe range of the formal su values, and are primarily due to slightdifferences in member selection. A full list of the 50 probablemember stars is presented in Table D.2 and shown as a map inFig. D.4. The HR diagram in Geneva photometry is shown inFig. 15. As has been assessed before, these clusters are of closelythe same age, with the impression of Coma Berenices clusterbeing slightly younger. Also in chemical composition they ap-pear to be very similar (Heiter et al. 2014). However, there is amarked difference in the two-colour diagrams (Fig. 16) for late Fand G stars, a difference which in field stars is directly relatedto luminosity differences in the sense that it would imply theHyades stars to be more luminous at the same temperature than
Fig. 16. Two colour diagram for the Coma Berenices cluster (light blue)compared with the Hyades (orange-red), showing the so-called Hyadesanomaly.
those in the Coma Berenices cluster. This is the so-called Hyadesanomaly, first noted half a century ago by van Altena (1966).
5.3. The Praesepe cluster
The Praesepe cluster has been investigated over a 5.47 degreesradius field, an area for which 2082 stars are contained inthe TGAS catalogue, 156 of which are also contained in theHipparcos catalogue. 84 stars were selected as possible mem-bers of Praesepe, of which 5 were later eliminated in the itera-tive solutions for the astrometric parameters of the cluster. Theweighted mean differences in this field between the TGAS andHipparcos astrometric parameters for 146 stars (with a sim-ple 5-parameter solution, excluding 10 stars with complex so-lutions), of which 23 are identified as probable cluster members,are summarized in Table 8.
There is a significant increase in the number of member starswith respect to the solution in fvl09, from 24 to 79 stars. Prob-able members are found projected up to 4.4 degrees from thecluster centre, equivalent to a distance of about 14 pc, much likewhat is observed in the Hyades. The Praesepe field shows gener-ally strong to very strong correlations for the astrometric param-eters of individual stars, in particular for stars for which Tycho-2first epoch data was used. These are the red points in Fig. 17.
As was noticed before in fvl09, the Praesepe and Hyadesclusters appear to be very similar in composition and age.Figure 18 shows the combined HR diagram for the two clustersand the closely coinciding main sequences. In contrast, the mainsequence of the Coma Ber cluster, considered to be of the sameage as the Hyades, appears to be sub-luminous by about 0.1 to0.15 mag with respect to the Hyades and Praesepe. This differ-ence has increased slightly (by 0.06 mag) in the current analysiswith respect to fvl09.
5.4. The Pleiades cluster
The Pleiades cluster has been investigated over a 6.7 degrees ra-dius field, for which the TGAS catalogue contains 4996 stars,
A19, page 11 of 65
A&A 601, A19 (2017)
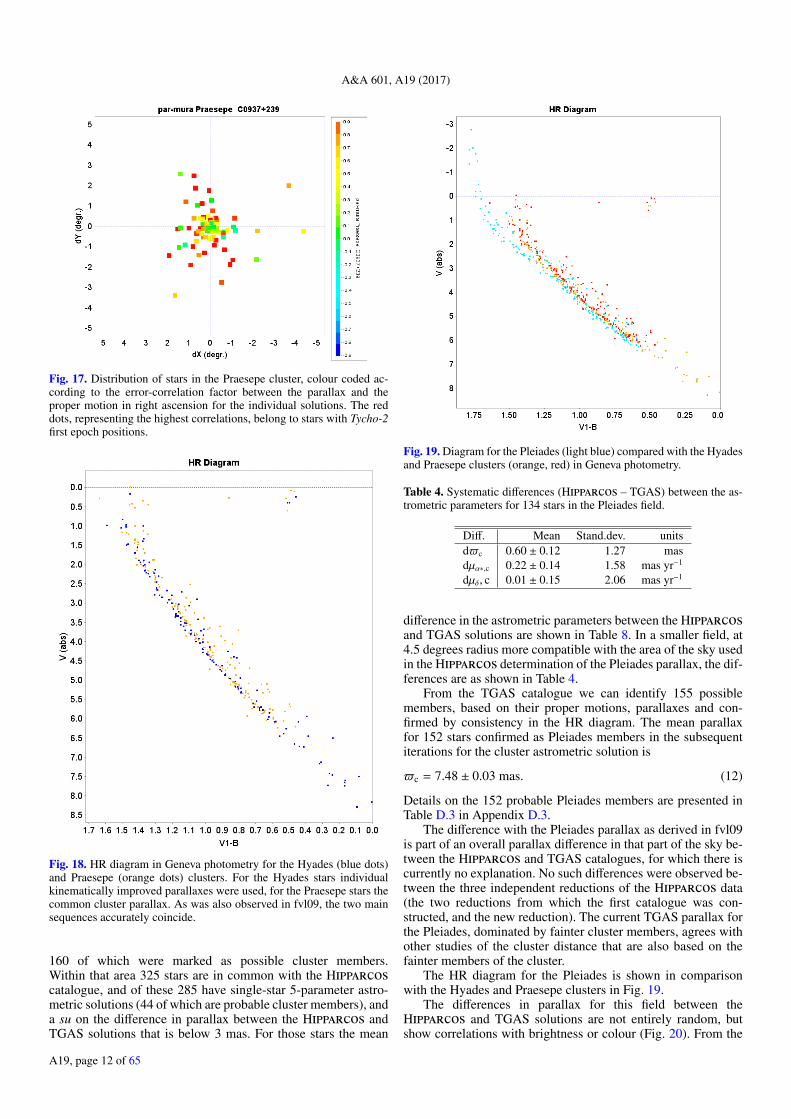
Fig. 17. Distribution of stars in the Praesepe cluster, colour coded ac-cording to the error-correlation factor between the parallax and theproper motion in right ascension for the individual solutions. The reddots, representing the highest correlations, belong to stars with Tycho-2first epoch positions.
Fig. 18. HR diagram in Geneva photometry for the Hyades (blue dots)and Praesepe (orange dots) clusters. For the Hyades stars individualkinematically improved parallaxes were used, for the Praesepe stars thecommon cluster parallax. As was also observed in fvl09, the two mainsequences accurately coincide.
160 of which were marked as possible cluster members.Within that area 325 stars are in common with the Hipparcoscatalogue, and of these 285 have single-star 5-parameter astro-metric solutions (44 of which are probable cluster members), anda su on the difference in parallax between the Hipparcos andTGAS solutions that is below 3 mas. For those stars the mean
Fig. 19. Diagram for the Pleiades (light blue) compared with the Hyadesand Praesepe clusters (orange, red) in Geneva photometry.
Table 4. Systematic differences (Hipparcos – TGAS) between the as-trometric parameters for 134 stars in the Pleiades field.
Diff. Mean Stand.dev. unitsd$c 0.60 ± 0.12 1.27 masdµα∗,c 0.22 ± 0.14 1.58 mas yr−1
dµδ, c 0.01 ± 0.15 2.06 mas yr−1
difference in the astrometric parameters between the Hipparcosand TGAS solutions are shown in Table 8. In a smaller field, at4.5 degrees radius more compatible with the area of the sky usedin the Hipparcos determination of the Pleiades parallax, the dif-ferences are as shown in Table 4.
From the TGAS catalogue we can identify 155 possiblemembers, based on their proper motions, parallaxes and con-firmed by consistency in the HR diagram. The mean parallaxfor 152 stars confirmed as Pleiades members in the subsequentiterations for the cluster astrometric solution is
$c = 7.48 ± 0.03 mas. (12)
Details on the 152 probable Pleiades members are presented inTable D.3 in Appendix D.3.
The difference with the Pleiades parallax as derived in fvl09is part of an overall parallax difference in that part of the sky be-tween the Hipparcos and TGAS catalogues, for which there iscurrently no explanation. No such differences were observed be-tween the three independent reductions of the Hipparcos data(the two reductions from which the first catalogue was con-structed, and the new reduction). The current TGAS parallax forthe Pleiades, dominated by fainter cluster members, agrees withother studies of the cluster distance that are also based on thefainter members of the cluster.
The HR diagram for the Pleiades is shown in comparisonwith the Hyades and Praesepe clusters in Fig. 19.
The differences in parallax for this field between theHipparcos and TGAS solutions are not entirely random, butshow correlations with brightness or colour (Fig. 20). From the
A19, page 12 of 65
Gaia Collaboration (van Leeuwen, F., et al.): Gaia Data Release 1
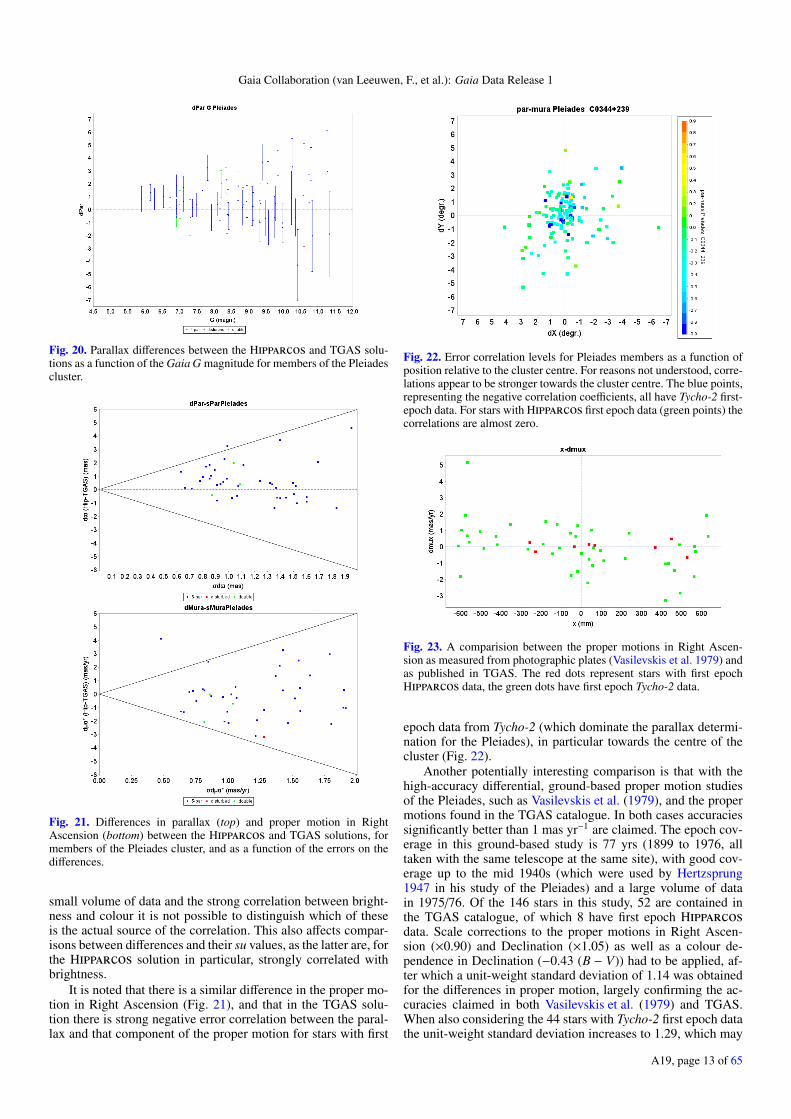
Fig. 20. Parallax differences between the Hipparcos and TGAS solu-tions as a function of the Gaia G magnitude for members of the Pleiadescluster.
Fig. 21. Differences in parallax (top) and proper motion in RightAscension (bottom) between the Hipparcos and TGAS solutions, formembers of the Pleiades cluster, and as a function of the errors on thedifferences.
small volume of data and the strong correlation between bright-ness and colour it is not possible to distinguish which of theseis the actual source of the correlation. This also affects compar-isons between differences and their su values, as the latter are, forthe Hipparcos solution in particular, strongly correlated withbrightness.
It is noted that there is a similar difference in the proper mo-tion in Right Ascension (Fig. 21), and that in the TGAS solu-tion there is strong negative error correlation between the paral-lax and that component of the proper motion for stars with first
Fig. 22. Error correlation levels for Pleiades members as a function ofposition relative to the cluster centre. For reasons not understood, corre-lations appear to be stronger towards the cluster centre. The blue points,representing the negative correlation coefficients, all have Tycho-2 first-epoch data. For stars with Hipparcos first epoch data (green points) thecorrelations are almost zero.
Fig. 23. A comparision between the proper motions in Right Ascen-sion as measured from photographic plates (Vasilevskis et al. 1979) andas published in TGAS. The red dots represent stars with first epochHipparcos data, the green dots have first epoch Tycho-2 data.
epoch data from Tycho-2 (which dominate the parallax determi-nation for the Pleiades), in particular towards the centre of thecluster (Fig. 22).
Another potentially interesting comparison is that with thehigh-accuracy differential, ground-based proper motion studiesof the Pleiades, such as Vasilevskis et al. (1979), and the propermotions found in the TGAS catalogue. In both cases accuraciessignificantly better than 1 mas yr−1 are claimed. The epoch cov-erage in this ground-based study is 77 yrs (1899 to 1976, alltaken with the same telescope at the same site), with good cov-erage up to the mid 1940s (which were used by Hertzsprung1947 in his study of the Pleiades) and a large volume of datain 1975/76. Of the 146 stars in this study, 52 are contained inthe TGAS catalogue, of which 8 have first epoch Hipparcosdata. Scale corrections to the proper motions in Right Ascen-sion (×0.90) and Declination (×1.05) as well as a colour de-pendence in Declination (−0.43 (B − V)) had to be applied, af-ter which a unit-weight standard deviation of 1.14 was obtainedfor the differences in proper motion, largely confirming the ac-curacies claimed in both Vasilevskis et al. (1979) and TGAS.When also considering the 44 stars with Tycho-2 first epoch datathe unit-weight standard deviation increases to 1.29, which may
A19, page 13 of 65
A&A 601, A19 (2017)
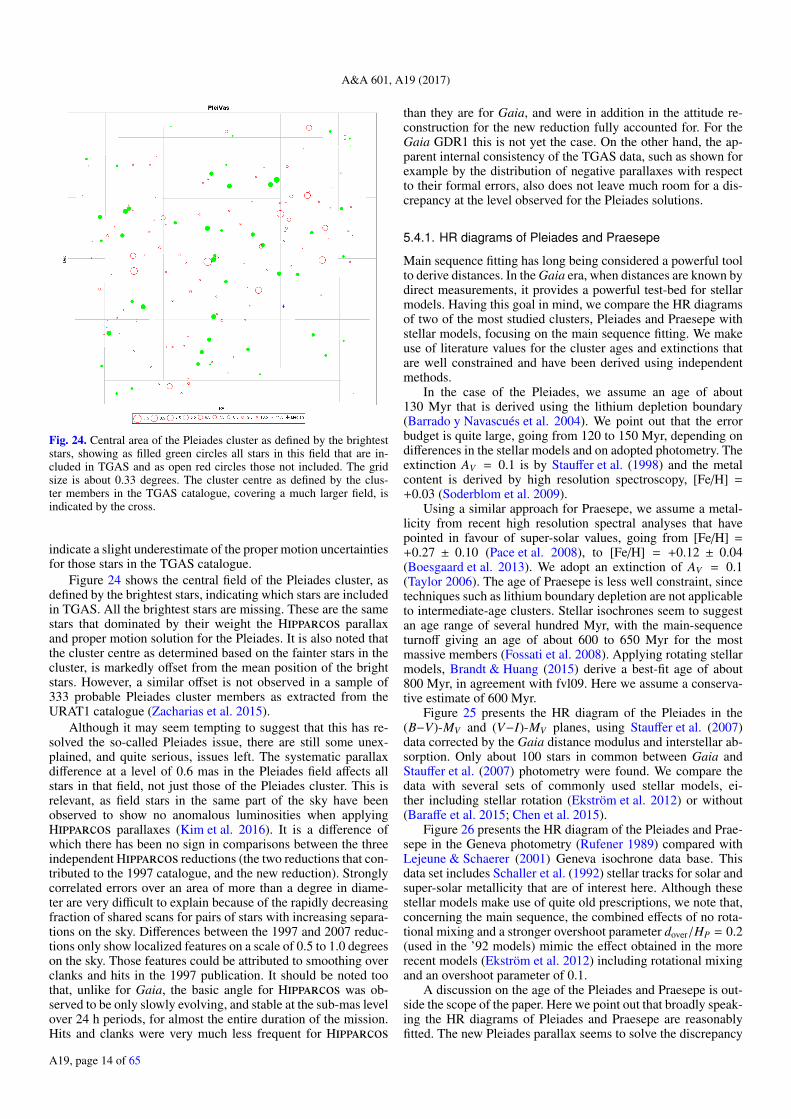
Fig. 24. Central area of the Pleiades cluster as defined by the brighteststars, showing as filled green circles all stars in this field that are in-cluded in TGAS and as open red circles those not included. The gridsize is about 0.33 degrees. The cluster centre as defined by the clus-ter members in the TGAS catalogue, covering a much larger field, isindicated by the cross.
indicate a slight underestimate of the proper motion uncertaintiesfor those stars in the TGAS catalogue.
Figure 24 shows the central field of the Pleiades cluster, asdefined by the brightest stars, indicating which stars are includedin TGAS. All the brightest stars are missing. These are the samestars that dominated by their weight the Hipparcos parallaxand proper motion solution for the Pleiades. It is also noted thatthe cluster centre as determined based on the fainter stars in thecluster, is markedly offset from the mean position of the brightstars. However, a similar offset is not observed in a sample of333 probable Pleiades cluster members as extracted from theURAT1 catalogue (Zacharias et al. 2015).
Although it may seem tempting to suggest that this has re-solved the so-called Pleiades issue, there are still some unex-plained, and quite serious, issues left. The systematic parallaxdifference at a level of 0.6 mas in the Pleiades field affects allstars in that field, not just those of the Pleiades cluster. This isrelevant, as field stars in the same part of the sky have beenobserved to show no anomalous luminosities when applyingHipparcos parallaxes (Kim et al. 2016). It is a difference ofwhich there has been no sign in comparisons between the threeindependent Hipparcos reductions (the two reductions that con-tributed to the 1997 catalogue, and the new reduction). Stronglycorrelated errors over an area of more than a degree in diame-ter are very difficult to explain because of the rapidly decreasingfraction of shared scans for pairs of stars with increasing separa-tions on the sky. Differences between the 1997 and 2007 reduc-tions only show localized features on a scale of 0.5 to 1.0 degreeson the sky. Those features could be attributed to smoothing overclanks and hits in the 1997 publication. It should be noted toothat, unlike for Gaia, the basic angle for Hipparcos was ob-served to be only slowly evolving, and stable at the sub-mas levelover 24 h periods, for almost the entire duration of the mission.Hits and clanks were very much less frequent for Hipparcos
than they are for Gaia, and were in addition in the attitude re-construction for the new reduction fully accounted for. For theGaia GDR1 this is not yet the case. On the other hand, the ap-parent internal consistency of the TGAS data, such as shown forexample by the distribution of negative parallaxes with respectto their formal errors, also does not leave much room for a dis-crepancy at the level observed for the Pleiades solutions.
5.4.1. HR diagrams of Pleiades and Praesepe
Main sequence fitting has long being considered a powerful toolto derive distances. In the Gaia era, when distances are known bydirect measurements, it provides a powerful test-bed for stellarmodels. Having this goal in mind, we compare the HR diagramsof two of the most studied clusters, Pleiades and Praesepe withstellar models, focusing on the main sequence fitting. We makeuse of literature values for the cluster ages and extinctions thatare well constrained and have been derived using independentmethods.
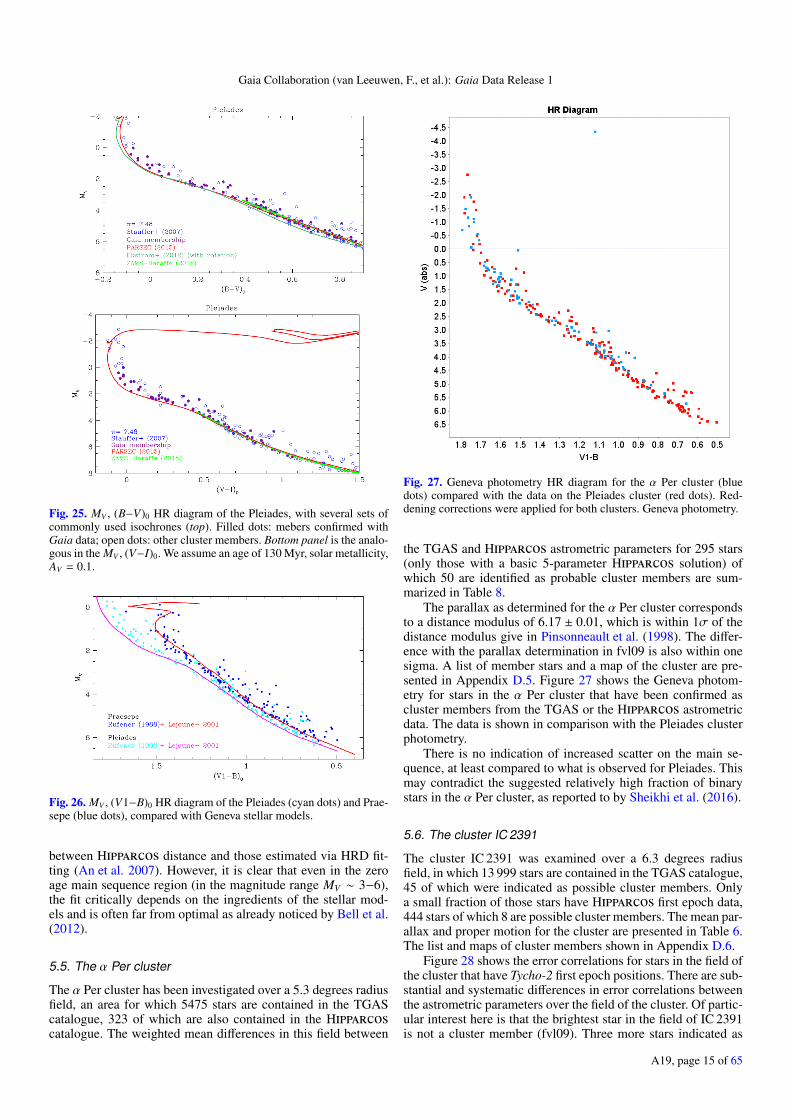
In the case of the Pleiades, we assume an age of about130 Myr that is derived using the lithium depletion boundary(Barrado y Navascués et al. 2004). We point out that the errorbudget is quite large, going from 120 to 150 Myr, depending ondifferences in the stellar models and on adopted photometry. Theextinction AV = 0.1 is by Stauffer et al. (1998) and the metalcontent is derived by high resolution spectroscopy, [Fe/H] =+0.03 (Soderblom et al. 2009).
Using a similar approach for Praesepe, we assume a metal-licity from recent high resolution spectral analyses that havepointed in favour of super-solar values, going from [Fe/H] =+0.27 ± 0.10 (Pace et al. 2008), to [Fe/H] = +0.12 ± 0.04(Boesgaard et al. 2013). We adopt an extinction of AV = 0.1(Taylor 2006). The age of Praesepe is less well constraint, sincetechniques such as lithium boundary depletion are not applicableto intermediate-age clusters. Stellar isochrones seem to suggestan age range of several hundred Myr, with the main-sequenceturnoff giving an age of about 600 to 650 Myr for the mostmassive members (Fossati et al. 2008). Applying rotating stellarmodels, Brandt & Huang (2015) derive a best-fit age of about800 Myr, in agreement with fvl09. Here we assume a conserva-tive estimate of 600 Myr.
Figure 25 presents the HR diagram of the Pleiades in the(B−V)-MV and (V−I)-MV planes, using Stauffer et al. (2007)data corrected by the Gaia distance modulus and interstellar ab-sorption. Only about 100 stars in common between Gaia andStauffer et al. (2007) photometry were found. We compare thedata with several sets of commonly used stellar models, ei-ther including stellar rotation (Ekström et al. 2012) or without(Baraffe et al. 2015; Chen et al. 2015).
Figure 26 presents the HR diagram of the Pleiades and Prae-sepe in the Geneva photometry (Rufener 1989) compared withLejeune & Schaerer (2001) Geneva isochrone data base. Thisdata set includes Schaller et al. (1992) stellar tracks for solar andsuper-solar metallicity that are of interest here. Although thesestellar models make use of quite old prescriptions, we note that,concerning the main sequence, the combined effects of no rota-tional mixing and a stronger overshoot parameter dover/HP = 0.2(used in the ’92 models) mimic the effect obtained in the morerecent models (Ekström et al. 2012) including rotational mixingand an overshoot parameter of 0.1.
A discussion on the age of the Pleiades and Praesepe is out-side the scope of the paper. Here we point out that broadly speak-ing the HR diagrams of Pleiades and Praesepe are reasonablyfitted. The new Pleiades parallax seems to solve the discrepancy
A19, page 14 of 65
Gaia Collaboration (van Leeuwen, F., et al.): Gaia Data Release 1
Fig. 25. MV , (B−V)0 HR diagram of the Pleiades, with several sets ofcommonly used isochrones (top). Filled dots: mebers confirmed withGaia data; open dots: other cluster members. Bottom panel is the analo-gous in the MV , (V−I)0. We assume an age of 130 Myr, solar metallicity,AV = 0.1.
Fig. 26. MV , (V1−B)0 HR diagram of the Pleiades (cyan dots) and Prae-sepe (blue dots), compared with Geneva stellar models.
between Hipparcos distance and those estimated via HRD fit-ting (An et al. 2007). However, it is clear that even in the zeroage main sequence region (in the magnitude range MV ∼ 3−6),the fit critically depends on the ingredients of the stellar mod-els and is often far from optimal as already noticed by Bell et al.(2012).
5.5. The α Per cluster
The α Per cluster has been investigated over a 5.3 degrees radiusfield, an area for which 5475 stars are contained in the TGAScatalogue, 323 of which are also contained in the Hipparcoscatalogue. The weighted mean differences in this field between
Fig. 27. Geneva photometry HR diagram for the α Per cluster (bluedots) compared with the data on the Pleiades cluster (red dots). Red-dening corrections were applied for both clusters. Geneva photometry.
the TGAS and Hipparcos astrometric parameters for 295 stars(only those with a basic 5-parameter Hipparcos solution) ofwhich 50 are identified as probable cluster members are sum-marized in Table 8.
The parallax as determined for the α Per cluster correspondsto a distance modulus of 6.17 ± 0.01, which is within 1σ of thedistance modulus give in Pinsonneault et al. (1998). The differ-ence with the parallax determination in fvl09 is also within onesigma. A list of member stars and a map of the cluster are pre-sented in Appendix D.5. Figure 27 shows the Geneva photom-etry for stars in the α Per cluster that have been confirmed ascluster members from the TGAS or the Hipparcos astrometricdata. The data is shown in comparison with the Pleiades clusterphotometry.
There is no indication of increased scatter on the main se-quence, at least compared to what is observed for Pleiades. Thismay contradict the suggested relatively high fraction of binarystars in the α Per cluster, as reported to by Sheikhi et al. (2016).
5.6. The cluster IC 2391
The cluster IC 2391 was examined over a 6.3 degrees radiusfield, in which 13 999 stars are contained in the TGAS catalogue,45 of which were indicated as possible cluster members. Onlya small fraction of those stars have Hipparcos first epoch data,444 stars of which 8 are possible cluster members. The mean par-allax and proper motion for the cluster are presented in Table 6.The list and maps of cluster members shown in Appendix D.6.
Figure 28 shows the error correlations for stars in the field ofthe cluster that have Tycho-2 first epoch positions. There are sub-stantial and systematic differences in error correlations betweenthe astrometric parameters over the field of the cluster. Of partic-ular interest here is that the brightest star in the field of IC 2391is not a cluster member (fvl09). Three more stars indicated as
A19, page 15 of 65
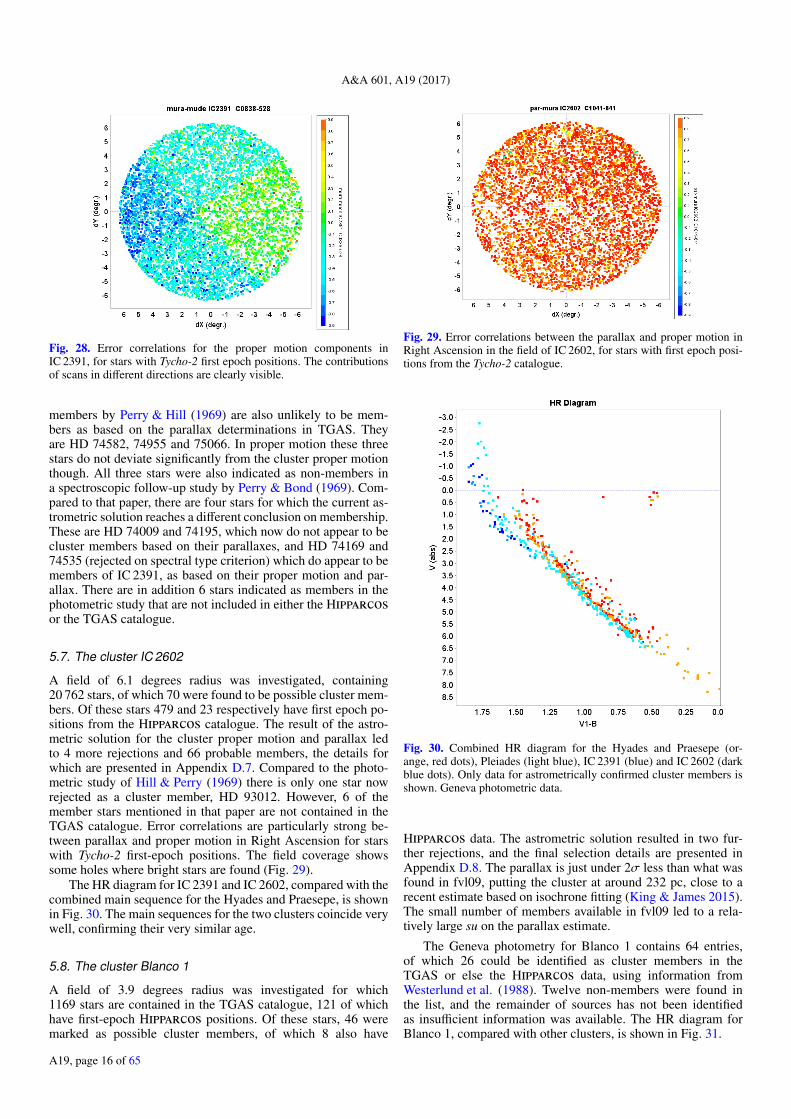
A&A 601, A19 (2017)
Fig. 28. Error correlations for the proper motion components inIC 2391, for stars with Tycho-2 first epoch positions. The contributionsof scans in different directions are clearly visible.
members by Perry & Hill (1969) are also unlikely to be mem-bers as based on the parallax determinations in TGAS. Theyare HD 74582, 74955 and 75066. In proper motion these threestars do not deviate significantly from the cluster proper motionthough. All three stars were also indicated as non-members ina spectroscopic follow-up study by Perry & Bond (1969). Com-pared to that paper, there are four stars for which the current as-trometric solution reaches a different conclusion on membership.These are HD 74009 and 74195, which now do not appear to becluster members based on their parallaxes, and HD 74169 and74535 (rejected on spectral type criterion) which do appear to bemembers of IC 2391, as based on their proper motion and par-allax. There are in addition 6 stars indicated as members in thephotometric study that are not included in either the Hipparcosor the TGAS catalogue.
5.7. The cluster IC 2602
A field of 6.1 degrees radius was investigated, containing20 762 stars, of which 70 were found to be possible cluster mem-bers. Of these stars 479 and 23 respectively have first epoch po-sitions from the Hipparcos catalogue. The result of the astro-metric solution for the cluster proper motion and parallax ledto 4 more rejections and 66 probable members, the details forwhich are presented in Appendix D.7. Compared to the photo-metric study of Hill & Perry (1969) there is only one star nowrejected as a cluster member, HD 93012. However, 6 of themember stars mentioned in that paper are not contained in theTGAS catalogue. Error correlations are particularly strong be-tween parallax and proper motion in Right Ascension for starswith Tycho-2 first-epoch positions. The field coverage showssome holes where bright stars are found (Fig. 29).
The HR diagram for IC 2391 and IC 2602, compared with thecombined main sequence for the Hyades and Praesepe, is shownin Fig. 30. The main sequences for the two clusters coincide verywell, confirming their very similar age.
5.8. The cluster Blanco 1
A field of 3.9 degrees radius was investigated for which1169 stars are contained in the TGAS catalogue, 121 of whichhave first-epoch Hipparcos positions. Of these stars, 46 weremarked as possible cluster members, of which 8 also have
Fig. 29. Error correlations between the parallax and proper motion inRight Ascension in the field of IC 2602, for stars with first epoch posi-tions from the Tycho-2 catalogue.
Fig. 30. Combined HR diagram for the Hyades and Praesepe (or-ange, red dots), Pleiades (light blue), IC 2391 (blue) and IC 2602 (darkblue dots). Only data for astrometrically confirmed cluster members isshown. Geneva photometric data.
Hipparcos data. The astrometric solution resulted in two fur-ther rejections, and the final selection details are presented inAppendix D.8. The parallax is just under 2σ less than what wasfound in fvl09, putting the cluster at around 232 pc, close to arecent estimate based on isochrone fitting (King & James 2015).The small number of members available in fvl09 led to a rela-tively large su on the parallax estimate.
The Geneva photometry for Blanco 1 contains 64 entries,of which 26 could be identified as cluster members in theTGAS or else the Hipparcos data, using information fromWesterlund et al. (1988). Twelve non-members were found inthe list, and the remainder of sources has not been identifiedas insufficient information was available. The HR diagram forBlanco 1, compared with other clusters, is shown in Fig. 31.
A19, page 16 of 65
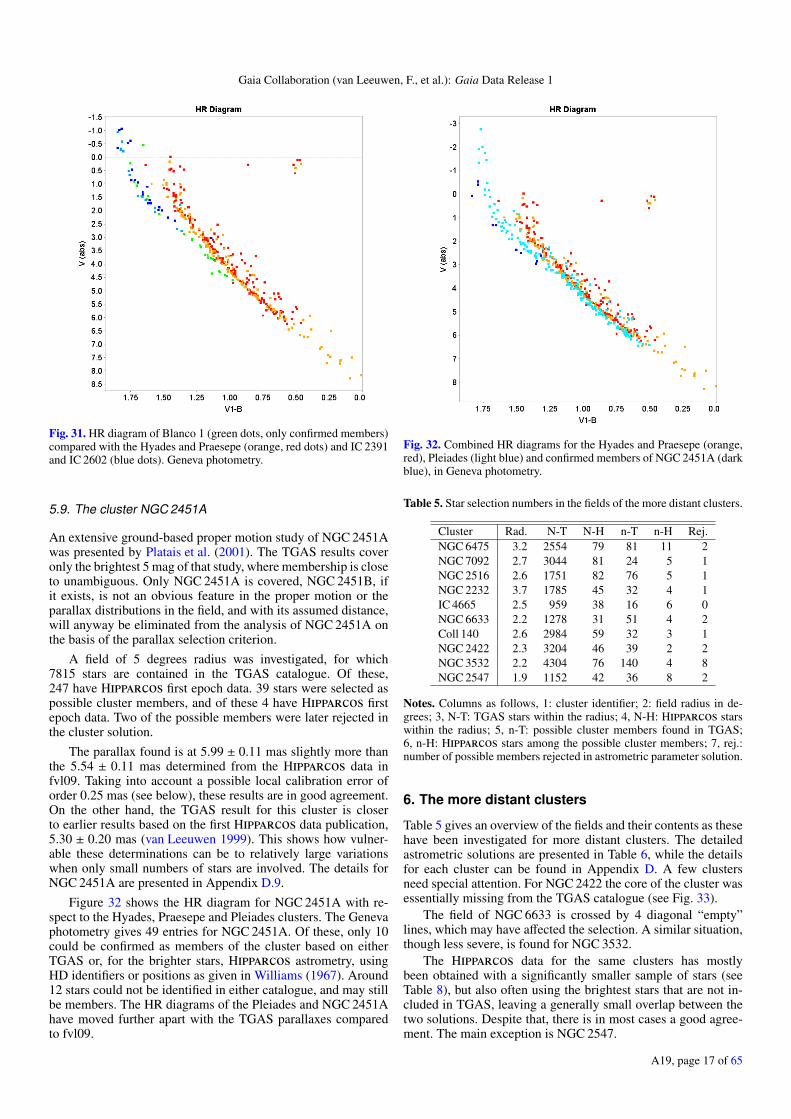
Gaia Collaboration (van Leeuwen, F., et al.): Gaia Data Release 1
Fig. 31. HR diagram of Blanco 1 (green dots, only confirmed members)compared with the Hyades and Praesepe (orange, red dots) and IC 2391and IC 2602 (blue dots). Geneva photometry.
5.9. The cluster NGC 2451A
An extensive ground-based proper motion study of NGC 2451Awas presented by Platais et al. (2001). The TGAS results coveronly the brightest 5 mag of that study, where membership is closeto unambiguous. Only NGC 2451A is covered, NGC 2451B, ifit exists, is not an obvious feature in the proper motion or theparallax distributions in the field, and with its assumed distance,will anyway be eliminated from the analysis of NGC 2451A onthe basis of the parallax selection criterion.
A field of 5 degrees radius was investigated, for which7815 stars are contained in the TGAS catalogue. Of these,247 have Hipparcos first epoch data. 39 stars were selected aspossible cluster members, and of these 4 have Hipparcos firstepoch data. Two of the possible members were later rejected inthe cluster solution.
The parallax found is at 5.99 ± 0.11 mas slightly more thanthe 5.54 ± 0.11 mas determined from the Hipparcos data infvl09. Taking into account a possible local calibration error oforder 0.25 mas (see below), these results are in good agreement.On the other hand, the TGAS result for this cluster is closerto earlier results based on the first Hipparcos data publication,5.30 ± 0.20 mas (van Leeuwen 1999). This shows how vulner-able these determinations can be to relatively large variationswhen only small numbers of stars are involved. The details forNGC 2451A are presented in Appendix D.9.
Figure 32 shows the HR diagram for NGC 2451A with re-spect to the Hyades, Praesepe and Pleiades clusters. The Genevaphotometry gives 49 entries for NGC 2451A. Of these, only 10could be confirmed as members of the cluster based on eitherTGAS or, for the brighter stars, Hipparcos astrometry, usingHD identifiers or positions as given in Williams (1967). Around12 stars could not be identified in either catalogue, and may stillbe members. The HR diagrams of the Pleiades and NGC 2451Ahave moved further apart with the TGAS parallaxes comparedto fvl09.
Fig. 32. Combined HR diagrams for the Hyades and Praesepe (orange,red), Pleiades (light blue) and confirmed members of NGC 2451A (darkblue), in Geneva photometry.
Table 5. Star selection numbers in the fields of the more distant clusters.
Cluster Rad. N-T N-H n-T n-H Rej.NGC 6475 3.2 2554 79 81 11 2NGC 7092 2.7 3044 81 24 5 1NGC 2516 2.6 1751 82 76 5 1NGC 2232 3.7 1785 45 32 4 1IC 4665 2.5 959 38 16 6 0NGC 6633 2.2 1278 31 51 4 2Coll 140 2.6 2984 59 32 3 1NGC 2422 2.3 3204 46 39 2 2NGC 3532 2.2 4304 76 140 4 8NGC 2547 1.9 1152 42 36 8 2
Notes. Columns as follows, 1: cluster identifier; 2: field radius in de-grees; 3, N-T: TGAS stars within the radius; 4, N-H: Hipparcos starswithin the radius; 5, n-T: possible cluster members found in TGAS;6, n-H: Hipparcos stars among the possible cluster members; 7, rej.:number of possible members rejected in astrometric parameter solution.
6. The more distant clusters
Table 5 gives an overview of the fields and their contents as thesehave been investigated for more distant clusters. The detailedastrometric solutions are presented in Table 6, while the detailsfor each cluster can be found in Appendix D. A few clustersneed special attention. For NGC 2422 the core of the cluster wasessentially missing from the TGAS catalogue (see Fig. 33).
The field of NGC 6633 is crossed by 4 diagonal “empty”lines, which may have affected the selection. A similar situation,though less severe, is found for NGC 3532.
The Hipparcos data for the same clusters has mostlybeen obtained with a significantly smaller sample of stars (seeTable 8), but also often using the brightest stars that are not in-cluded in TGAS, leaving a generally small overlap between thetwo solutions. Despite that, there is in most cases a good agree-ment. The main exception is NGC 2547.
A19, page 17 of 65
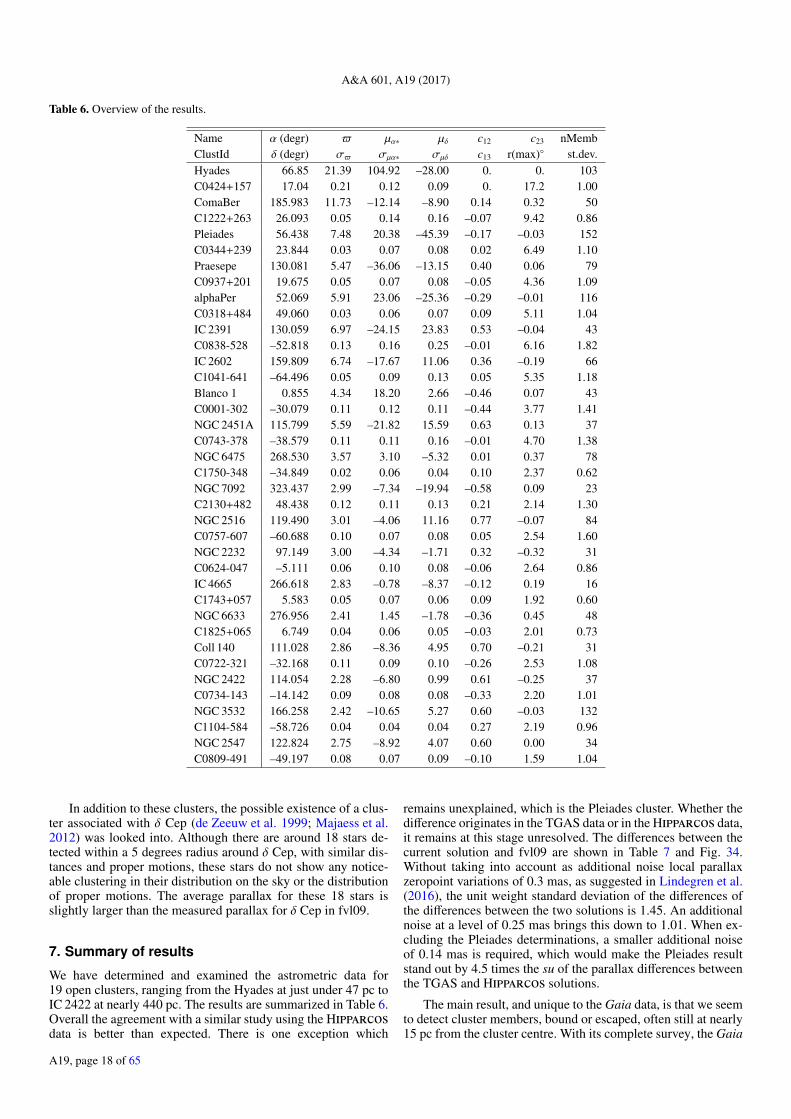
A&A 601, A19 (2017)
Table 6. Overview of the results.
Name α (degr) $ µα∗ µδ c12 c23 nMembClustId δ (degr) σ$ σµα∗ σµδ c13 r(max)◦ st.dev.Hyades 66.85 21.39 104.92 –28.00 0. 0. 103C0424+157 17.04 0.21 0.12 0.09 0. 17.2 1.00ComaBer 185.983 11.73 –12.14 –8.90 0.14 0.32 50C1222+263 26.093 0.05 0.14 0.16 –0.07 9.42 0.86Pleiades 56.438 7.48 20.38 –45.39 –0.17 –0.03 152C0344+239 23.844 0.03 0.07 0.08 0.02 6.49 1.10Praesepe 130.081 5.47 –36.06 –13.15 0.40 0.06 79C0937+201 19.675 0.05 0.07 0.08 –0.05 4.36 1.09alphaPer 52.069 5.91 23.06 –25.36 –0.29 –0.01 116C0318+484 49.060 0.03 0.06 0.07 0.09 5.11 1.04IC 2391 130.059 6.97 –24.15 23.83 0.53 –0.04 43C0838-528 –52.818 0.13 0.16 0.25 –0.01 6.16 1.82IC 2602 159.809 6.74 –17.67 11.06 0.36 –0.19 66C1041-641 –64.496 0.05 0.09 0.13 0.05 5.35 1.18Blanco 1 0.855 4.34 18.20 2.66 –0.46 0.07 43C0001-302 –30.079 0.11 0.12 0.11 –0.44 3.77 1.41NGC 2451A 115.799 5.59 –21.82 15.59 0.63 0.13 37C0743-378 –38.579 0.11 0.11 0.16 –0.01 4.70 1.38NGC 6475 268.530 3.57 3.10 –5.32 0.01 0.37 78C1750-348 –34.849 0.02 0.06 0.04 0.10 2.37 0.62NGC 7092 323.437 2.99 –7.34 –19.94 –0.58 0.09 23C2130+482 48.438 0.12 0.11 0.13 0.21 2.14 1.30NGC 2516 119.490 3.01 –4.06 11.16 0.77 –0.07 84C0757-607 –60.688 0.10 0.07 0.08 0.05 2.54 1.60NGC 2232 97.149 3.00 –4.34 –1.71 0.32 –0.32 31C0624-047 –5.111 0.06 0.10 0.08 –0.06 2.64 0.86IC 4665 266.618 2.83 –0.78 –8.37 –0.12 0.19 16C1743+057 5.583 0.05 0.07 0.06 0.09 1.92 0.60NGC 6633 276.956 2.41 1.45 –1.78 –0.36 0.45 48C1825+065 6.749 0.04 0.06 0.05 –0.03 2.01 0.73Coll 140 111.028 2.86 –8.36 4.95 0.70 –0.21 31C0722-321 –32.168 0.11 0.09 0.10 –0.26 2.53 1.08NGC 2422 114.054 2.28 –6.80 0.99 0.61 –0.25 37C0734-143 –14.142 0.09 0.08 0.08 –0.33 2.20 1.01NGC 3532 166.258 2.42 –10.65 5.27 0.60 –0.03 132C1104-584 –58.726 0.04 0.04 0.04 0.27 2.19 0.96NGC 2547 122.824 2.75 –8.92 4.07 0.60 0.00 34C0809-491 –49.197 0.08 0.07 0.09 –0.10 1.59 1.04
In addition to these clusters, the possible existence of a clus-ter associated with δ Cep (de Zeeuw et al. 1999; Majaess et al.2012) was looked into. Although there are around 18 stars de-tected within a 5 degrees radius around δ Cep, with similar dis-tances and proper motions, these stars do not show any notice-able clustering in their distribution on the sky or the distributionof proper motions. The average parallax for these 18 stars isslightly larger than the measured parallax for δ Cep in fvl09.
7. Summary of results
We have determined and examined the astrometric data for19 open clusters, ranging from the Hyades at just under 47 pc toIC 2422 at nearly 440 pc. The results are summarized in Table 6.Overall the agreement with a similar study using the Hipparcosdata is better than expected. There is one exception which
remains unexplained, which is the Pleiades cluster. Whether thedifference originates in the TGAS data or in the Hipparcos data,it remains at this stage unresolved. The differences between thecurrent solution and fvl09 are shown in Table 7 and Fig. 34.Without taking into account as additional noise local parallaxzeropoint variations of 0.3 mas, as suggested in Lindegren et al.(2016), the unit weight standard deviation of the differences ofthe differences between the two solutions is 1.45. An additionalnoise at a level of 0.25 mas brings this down to 1.01. When ex-cluding the Pleiades determinations, a smaller additional noiseof 0.14 mas is required, which would make the Pleiades resultstand out by 4.5 times the su of the parallax differences betweenthe TGAS and Hipparcos solutions.
The main result, and unique to the Gaia data, is that we seemto detect cluster members, bound or escaped, often still at nearly15 pc from the cluster centre. With its complete survey, the Gaia
A19, page 18 of 65
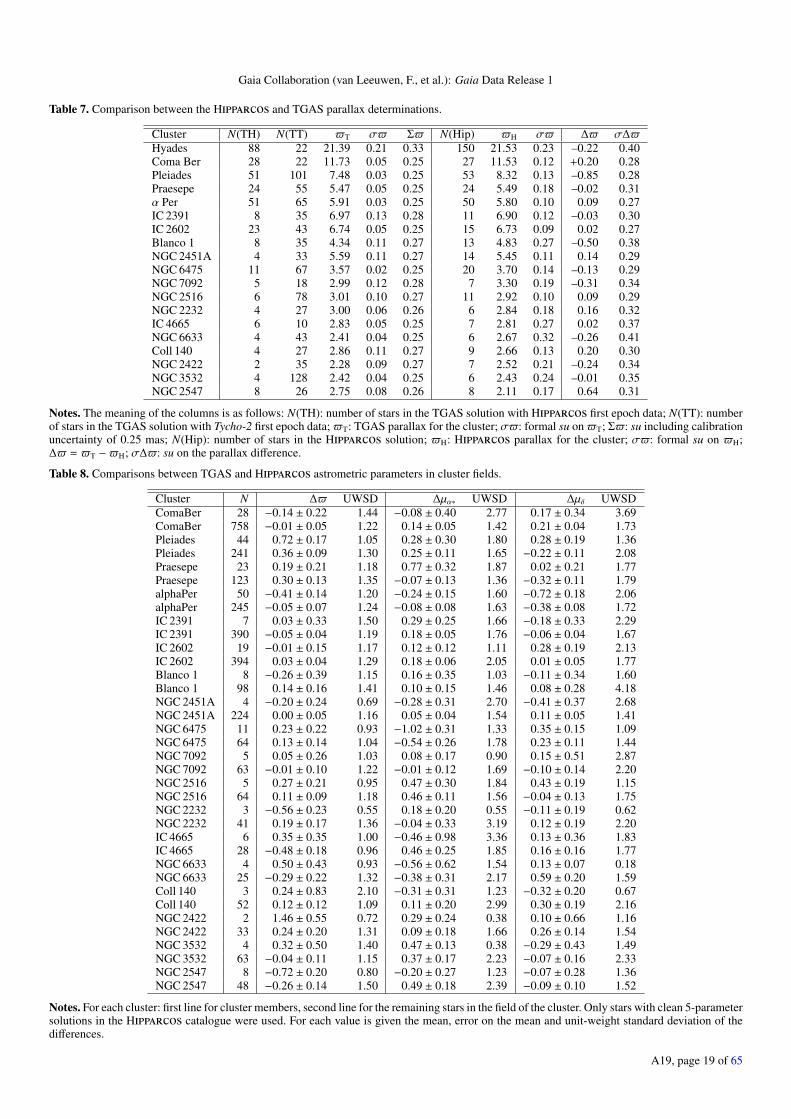
Gaia Collaboration (van Leeuwen, F., et al.): Gaia Data Release 1
Table 7. Comparison between the Hipparcos and TGAS parallax determinations.
Cluster N(TH) N(TT) $T σ$ Σ$ N(Hip) $H σ$ ∆$ σ∆$Hyades 88 22 21.39 0.21 0.33 150 21.53 0.23 –0.22 0.40Coma Ber 28 22 11.73 0.05 0.25 27 11.53 0.12 +0.20 0.28Pleiades 51 101 7.48 0.03 0.25 53 8.32 0.13 –0.85 0.28Praesepe 24 55 5.47 0.05 0.25 24 5.49 0.18 –0.02 0.31α Per 51 65 5.91 0.03 0.25 50 5.80 0.10 0.09 0.27IC 2391 8 35 6.97 0.13 0.28 11 6.90 0.12 –0.03 0.30IC 2602 23 43 6.74 0.05 0.25 15 6.73 0.09 0.02 0.27Blanco 1 8 35 4.34 0.11 0.27 13 4.83 0.27 –0.50 0.38NGC 2451A 4 33 5.59 0.11 0.27 14 5.45 0.11 0.14 0.29NGC 6475 11 67 3.57 0.02 0.25 20 3.70 0.14 –0.13 0.29NGC 7092 5 18 2.99 0.12 0.28 7 3.30 0.19 –0.31 0.34NGC 2516 6 78 3.01 0.10 0.27 11 2.92 0.10 0.09 0.29NGC 2232 4 27 3.00 0.06 0.26 6 2.84 0.18 0.16 0.32IC 4665 6 10 2.83 0.05 0.25 7 2.81 0.27 0.02 0.37NGC 6633 4 43 2.41 0.04 0.25 6 2.67 0.32 –0.26 0.41Coll 140 4 27 2.86 0.11 0.27 9 2.66 0.13 0.20 0.30NGC 2422 2 35 2.28 0.09 0.27 7 2.52 0.21 –0.24 0.34NGC 3532 4 128 2.42 0.04 0.25 6 2.43 0.24 –0.01 0.35NGC 2547 8 26 2.75 0.08 0.26 8 2.11 0.17 0.64 0.31
Notes. The meaning of the columns is as follows: N(TH): number of stars in the TGAS solution with Hipparcos first epoch data; N(TT): numberof stars in the TGAS solution with Tycho-2 first epoch data; $T: TGAS parallax for the cluster; σ$: formal su on $T; Σ$: su including calibrationuncertainty of 0.25 mas; N(Hip): number of stars in the Hipparcos solution; $H: Hipparcos parallax for the cluster; σ$: formal su on $H;∆$ = $T −$H; σ∆$: su on the parallax difference.
Table 8. Comparisons between TGAS and Hipparcos astrometric parameters in cluster fields.
Cluster N ∆$ UWSD ∆µα∗ UWSD ∆µδ UWSDComaBer 28 −0.14 ± 0.22 1.44 −0.08 ± 0.40 2.77 0.17 ± 0.34 3.69ComaBer 758 −0.01 ± 0.05 1.22 0.14 ± 0.05 1.42 0.21 ± 0.04 1.73Pleiades 44 0.72 ± 0.17 1.05 0.28 ± 0.30 1.80 0.28 ± 0.19 1.36Pleiades 241 0.36 ± 0.09 1.30 0.25 ± 0.11 1.65 −0.22 ± 0.11 2.08Praesepe 23 0.19 ± 0.21 1.18 0.77 ± 0.32 1.87 0.02 ± 0.21 1.77Praesepe 123 0.30 ± 0.13 1.35 −0.07 ± 0.13 1.36 −0.32 ± 0.11 1.79alphaPer 50 −0.41 ± 0.14 1.20 −0.24 ± 0.15 1.60 −0.72 ± 0.18 2.06alphaPer 245 −0.05 ± 0.07 1.24 −0.08 ± 0.08 1.63 −0.38 ± 0.08 1.72IC 2391 7 0.03 ± 0.33 1.50 0.29 ± 0.25 1.66 −0.18 ± 0.33 2.29IC 2391 390 −0.05 ± 0.04 1.19 0.18 ± 0.05 1.76 −0.06 ± 0.04 1.67IC 2602 19 −0.01 ± 0.15 1.17 0.12 ± 0.12 1.11 0.28 ± 0.19 2.13IC 2602 394 0.03 ± 0.04 1.29 0.18 ± 0.06 2.05 0.01 ± 0.05 1.77Blanco 1 8 −0.26 ± 0.39 1.15 0.16 ± 0.35 1.03 −0.11 ± 0.34 1.60Blanco 1 98 0.14 ± 0.16 1.41 0.10 ± 0.15 1.46 0.08 ± 0.28 4.18NGC 2451A 4 −0.20 ± 0.24 0.69 −0.28 ± 0.31 2.70 −0.41 ± 0.37 2.68NGC 2451A 224 0.00 ± 0.05 1.16 0.05 ± 0.04 1.54 0.11 ± 0.05 1.41NGC 6475 11 0.23 ± 0.22 0.93 −1.02 ± 0.31 1.33 0.35 ± 0.15 1.09NGC 6475 64 0.13 ± 0.14 1.04 −0.54 ± 0.26 1.78 0.23 ± 0.11 1.44NGC 7092 5 0.05 ± 0.26 1.03 0.08 ± 0.17 0.90 0.15 ± 0.51 2.87NGC 7092 63 −0.01 ± 0.10 1.22 −0.01 ± 0.12 1.69 −0.10 ± 0.14 2.20NGC 2516 5 0.27 ± 0.21 0.95 0.47 ± 0.30 1.84 0.43 ± 0.19 1.15NGC 2516 64 0.11 ± 0.09 1.18 0.46 ± 0.11 1.56 −0.04 ± 0.13 1.75NGC 2232 3 −0.56 ± 0.23 0.55 0.18 ± 0.20 0.55 −0.11 ± 0.19 0.62NGC 2232 41 0.19 ± 0.17 1.36 −0.04 ± 0.33 3.19 0.12 ± 0.19 2.20IC 4665 6 0.35 ± 0.35 1.00 −0.46 ± 0.98 3.36 0.13 ± 0.36 1.83IC 4665 28 −0.48 ± 0.18 0.96 0.46 ± 0.25 1.85 0.16 ± 0.16 1.77NGC 6633 4 0.50 ± 0.43 0.93 −0.56 ± 0.62 1.54 0.13 ± 0.07 0.18NGC 6633 25 −0.29 ± 0.22 1.32 −0.38 ± 0.31 2.17 0.59 ± 0.20 1.59Coll 140 3 0.24 ± 0.83 2.10 −0.31 ± 0.31 1.23 −0.32 ± 0.20 0.67Coll 140 52 0.12 ± 0.12 1.09 0.11 ± 0.20 2.99 0.30 ± 0.19 2.16NGC 2422 2 1.46 ± 0.55 0.72 0.29 ± 0.24 0.38 0.10 ± 0.66 1.16NGC 2422 33 0.24 ± 0.20 1.31 0.09 ± 0.18 1.66 0.26 ± 0.14 1.54NGC 3532 4 0.32 ± 0.50 1.40 0.47 ± 0.13 0.38 −0.29 ± 0.43 1.49NGC 3532 63 −0.04 ± 0.11 1.15 0.37 ± 0.17 2.23 −0.07 ± 0.16 2.33NGC 2547 8 −0.72 ± 0.20 0.80 −0.20 ± 0.27 1.23 −0.07 ± 0.28 1.36NGC 2547 48 −0.26 ± 0.14 1.50 0.49 ± 0.18 2.39 −0.09 ± 0.10 1.52
Notes. For each cluster: first line for cluster members, second line for the remaining stars in the field of the cluster. Only stars with clean 5-parametersolutions in the Hipparcos catalogue were used. For each value is given the mean, error on the mean and unit-weight standard deviation of thedifferences.
A19, page 19 of 65
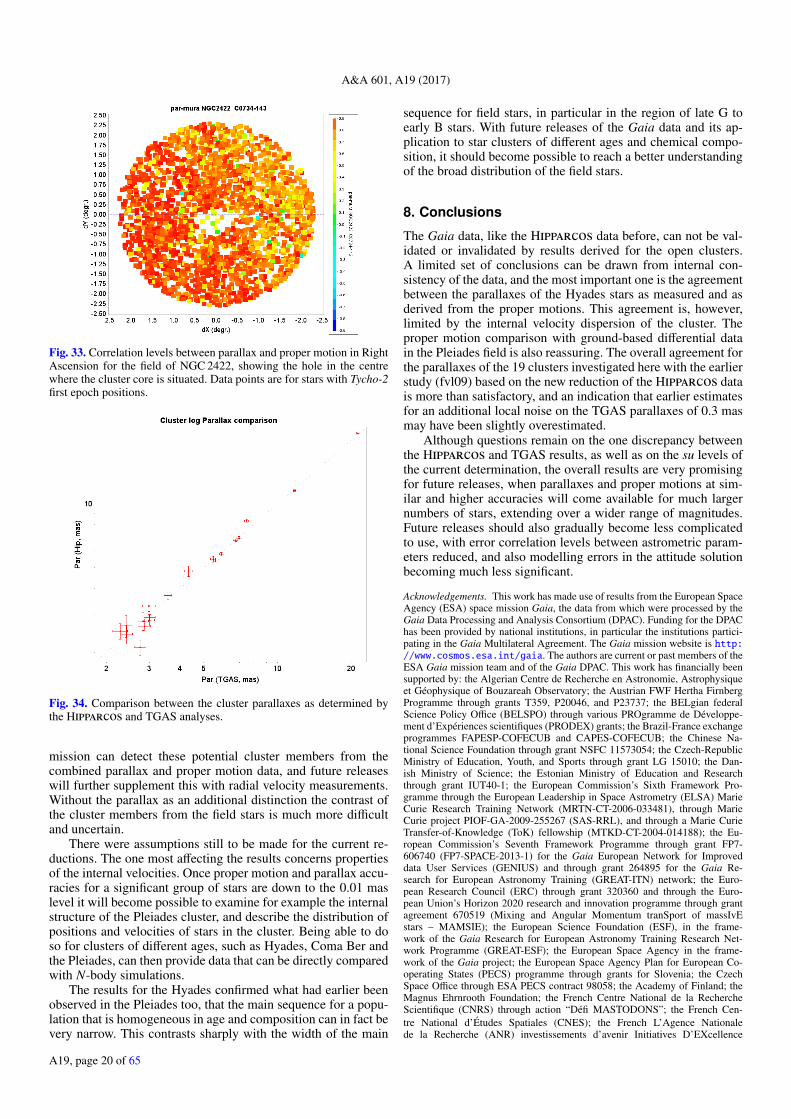
A&A 601, A19 (2017)
Fig. 33. Correlation levels between parallax and proper motion in RightAscension for the field of NGC 2422, showing the hole in the centrewhere the cluster core is situated. Data points are for stars with Tycho-2first epoch positions.
Fig. 34. Comparison between the cluster parallaxes as determined bythe Hipparcos and TGAS analyses.
mission can detect these potential cluster members from thecombined parallax and proper motion data, and future releaseswill further supplement this with radial velocity measurements.Without the parallax as an additional distinction the contrast ofthe cluster members from the field stars is much more difficultand uncertain.
There were assumptions still to be made for the current re-ductions. The one most affecting the results concerns propertiesof the internal velocities. Once proper motion and parallax accu-racies for a significant group of stars are down to the 0.01 maslevel it will become possible to examine for example the internalstructure of the Pleiades cluster, and describe the distribution ofpositions and velocities of stars in the cluster. Being able to doso for clusters of different ages, such as Hyades, Coma Ber andthe Pleiades, can then provide data that can be directly comparedwith N-body simulations.
The results for the Hyades confirmed what had earlier beenobserved in the Pleiades too, that the main sequence for a popu-lation that is homogeneous in age and composition can in fact bevery narrow. This contrasts sharply with the width of the main
sequence for field stars, in particular in the region of late G toearly B stars. With future releases of the Gaia data and its ap-plication to star clusters of different ages and chemical compo-sition, it should become possible to reach a better understandingof the broad distribution of the field stars.
8. Conclusions
The Gaia data, like the Hipparcos data before, can not be val-idated or invalidated by results derived for the open clusters.A limited set of conclusions can be drawn from internal con-sistency of the data, and the most important one is the agreementbetween the parallaxes of the Hyades stars as measured and asderived from the proper motions. This agreement is, however,limited by the internal velocity dispersion of the cluster. Theproper motion comparison with ground-based differential datain the Pleiades field is also reassuring. The overall agreement forthe parallaxes of the 19 clusters investigated here with the earlierstudy (fvl09) based on the new reduction of the Hipparcos datais more than satisfactory, and an indication that earlier estimatesfor an additional local noise on the TGAS parallaxes of 0.3 masmay have been slightly overestimated.
Although questions remain on the one discrepancy betweenthe Hipparcos and TGAS results, as well as on the su levels ofthe current determination, the overall results are very promisingfor future releases, when parallaxes and proper motions at sim-ilar and higher accuracies will come available for much largernumbers of stars, extending over a wider range of magnitudes.Future releases should also gradually become less complicatedto use, with error correlation levels between astrometric param-eters reduced, and also modelling errors in the attitude solutionbecoming much less significant.
Acknowledgements. This work has made use of results from the European SpaceAgency (ESA) space mission Gaia, the data from which were processed by theGaia Data Processing and Analysis Consortium (DPAC). Funding for the DPAChas been provided by national institutions, in particular the institutions partici-pating in the Gaia Multilateral Agreement. The Gaia mission website is http://www.cosmos.esa.int/gaia. The authors are current or past members of theESA Gaia mission team and of the Gaia DPAC. This work has financially beensupported by: the Algerian Centre de Recherche en Astronomie, Astrophysiqueet Géophysique of Bouzareah Observatory; the Austrian FWF Hertha FirnbergProgramme through grants T359, P20046, and P23737; the BELgian federalScience Policy Office (BELSPO) through various PROgramme de Développe-ment d’Expériences scientifiques (PRODEX) grants; the Brazil-France exchangeprogrammes FAPESP-COFECUB and CAPES-COFECUB; the Chinese Na-tional Science Foundation through grant NSFC 11573054; the Czech-RepublicMinistry of Education, Youth, and Sports through grant LG 15010; the Dan-ish Ministry of Science; the Estonian Ministry of Education and Researchthrough grant IUT40-1; the European Commission’s Sixth Framework Pro-gramme through the European Leadership in Space Astrometry (ELSA) MarieCurie Research Training Network (MRTN-CT-2006-033481), through MarieCurie project PIOF-GA-2009-255267 (SAS-RRL), and through a Marie CurieTransfer-of-Knowledge (ToK) fellowship (MTKD-CT-2004-014188); the Eu-ropean Commission’s Seventh Framework Programme through grant FP7-606740 (FP7-SPACE-2013-1) for the Gaia European Network for Improveddata User Services (GENIUS) and through grant 264895 for the Gaia Re-search for European Astronomy Training (GREAT-ITN) network; the Euro-pean Research Council (ERC) through grant 320360 and through the Euro-pean Union’s Horizon 2020 research and innovation programme through grantagreement 670519 (Mixing and Angular Momentum tranSport of massIvEstars – MAMSIE); the European Science Foundation (ESF), in the frame-work of the Gaia Research for European Astronomy Training Research Net-work Programme (GREAT-ESF); the European Space Agency in the frame-work of the Gaia project; the European Space Agency Plan for European Co-operating States (PECS) programme through grants for Slovenia; the CzechSpace Office through ESA PECS contract 98058; the Academy of Finland; theMagnus Ehrnrooth Foundation; the French Centre National de la RechercheScientifique (CNRS) through action “Défi MASTODONS”; the French Cen-tre National d’Études Spatiales (CNES); the French L’Agence Nationalede la Recherche (ANR) investissements d’avenir Initiatives D’EXcellence
A19, page 20 of 65
Gaia Collaboration (van Leeuwen, F., et al.): Gaia Data Release 1
(IDEX) programme PSL∗ through grant ANR-10-IDEX-0001-02; the RégionAquitaine; the Université de Bordeaux; the French Utinam Institute of theUniversité de Franche-Comté, supported by the Région de Franche-Comtéand the Institut des Sciences de l’Univers (INSU); the German AerospaceAgency (Deutsches Zentrum für Luft- und Raumfahrt e.V., DLR) throughgrants 50QG0501, 50QG0601, 50QG0602, 50QG0701, 50QG0901, 50QG1001,50QG1101, 50QG140, 50QG1401, 50QG1402, and 50QG1404; the Hun-garian Academy of Sciences through Lendület Programme LP2014-17; theHungarian National Research, Development, and Innovation Office throughgrants NKFIH K-115709 and PD-116175; the Israel Ministry of Scienceand Technology through grant 3-9082; the Agenzia Spaziale Italiana (ASI)through grants I/037/08/0, I/058/10/0, 2014-025-R.0, and 2014-025-R.1.2015to INAF and contracts I/008/10/0 and 2013/030/I.0 to ALTEC S.p.A.; theItalian Istituto Nazionale di Astrofisica (INAF); the Netherlands Organisa-tion for Scientific Research (NWO) through grant NWO-M-614.061.414 andthrough a VICI grant to A. Helmi; the Netherlands Research School for As-tronomy (NOVA); the Polish National Science Centre through HARMONIAgrant 2015/18/M/ST9/00544; the Portugese Fundação para a Ciência e a Tec-nologia (FCT) through grants PTDC/CTE-SPA/118692/2010, PDCTE/CTE-AST/81711/2003, and SFRH/BPD/74697/2010; the Strategic Programmes PEst-OE/AMB/UI4006/2011 for SIM, UID/FIS/00099/2013 for CENTRA, andUID/EEA/00066/2013 for UNINOVA; the Slovenian Research Agency; theSpanish Ministry of Economy MINECO-FEDER through grants AyA2014-55216, AyA2011-24052, ESP2013-48318-C2-R, and ESP2014-55996-C2-R andMDM-2014-0369 of ICCUB (Unidad de Excelencia María de Maeztu); theSwedish National Space Board (SNSB/Rymdstyrelsen); the Swiss State Sec-retariat for Education, Research, and Innovation through the ESA PRODEXprogramme, the Mesures d’Accompagnement, and the Activités NationalesComplémentaires; the Swiss National Science Foundation, including an EarlyPostdoc.Mobility fellowship; the United Kingdom Rutherford Appleton Labora-tory; the United Kingdom Science and Technology Facilities Council (STFC)through grants PP/C506756/1 and ST/I00047X/1; and the United KingdomSpace Agency (UKSA) through grants ST/K000578/1 and ST/N000978/1.
ReferencesAn, D., Terndrup, D. M., Pinsonneault, M. H., et al. 2007, ApJ, 655, 233Arenou, F., Luri, X., Babusiaux, C., et al. 2017, A&A, 599, A50 (Gaia SI)Baraffe, I., Homeier, D., Allard, F., & Chabrier, G. 2015, A&A, 577, A42Barrado y Navascués, D., Stauffer, J. R., & Jayawardhana, R. 2004, ApJ, 614,
386Bell, C. P. M., Naylor, T., Mayne, N. J., Jeffries, R. D., & Littlefair, S. P. 2012,
MNRAS, 424, 3178Boesgaard, A. M., Roper, B. W., & Lum, M. G. 2013, ApJ, 775, 58Brandt, T. D., & Huang, C. X. 2015, ApJ, 807, 24Chen, Y., Bressan, A., Girardi, L., et al. 2015, MNRAS, 452, 1068Cummings, J. D., Deliyannis, C. P., Maderak, R. M., & Steinhauer, A. 2017, AJ,
153, 128de Bruijne, J. H. J., Hoogerwerf, R., & de Zeeuw, P. T. 2001, A&A, 367, 111de Zeeuw, P. T., Hoogerwerf, R., de Bruijne, J. H. J., Brown, A. G. A., & Blaauw,
A. 1999, AJ, 117, 354Detweiler, H. L., Yoss, K. M., Radick, R. R., & Becker, S. A. 1984, AJ, 89, 1038Ekström, S., Georgy, C., Eggenberger, P., et al. 2012, A&A, 537, A146ESA 1997, The HIPPARCOS and Tycho catalogues, Astrometric and photomet-
ric star catalogues derived from the ESA HIPPARCOS Space AstrometryMission (Noordwijk, Netherlands: ESA Publications Division), ESA SP, 1200
Fabricius, C., Makarov, V. V., Knude, J., & Wycoff, G. L. 2002, A&A, 386, 709Fossati, L., Bagnulo, S., Landstreet, J., et al. 2008, A&A, 483, 891Gaia Collaboration (Brown, A. G. A., et al.) 2016a, A&A, 595, A2 (Gaia SI)Gaia Collaboration (Prusti, T., et al.) 2016b, A&A, 595, A1 (Gaia SI)Gatewood, G. 1995, ApJ, 445, 712Górski, K. M., Hivon, E., Banday, A. J., et al. 2005, ApJ, 622, 759Heiter, U., Soubiran, C., Netopil, M., & Paunzen, E. 2014, A&A, 561, A93Hertzsprung, E. 1947, Annalen van de Sterrewacht te Leiden, 19, A1Hill, G., & Perry, C. L. 1969, AJ, 74, 1011Høg, E., Fabricius, C., Makarov, V. V., et al. 2000, A&A, 355, L27Kharchenko, N. V., Piskunov, A. E., Schilbach, E., Röser, S., & Scholz, R.-D.
2016, A&A, 585, A101Kim, B., An, D., Stauffer, J. R., et al. 2016, ApJS, 222, 19King, P. A. S., & James, D. 2015, in AAS Meeting Abstracts, 225, 247.26Lejeune, T., & Schaerer, D. 2001, A&A, 366, 538Lindegren, L., Lammers, U., Bastian, U., et al. 2016, A&A, 595, A4Madsen, S. 1999, in Harmonizing Cosmic Distance Scales in a Post-Hipparcos
Era, eds. D. Egret, & A. Heck, ASP Conf. Ser., 167, 78Majaess, D., Turner, D., & Gieren, W. 2012, ApJ, 747, 145Makarov, V. V. 2003, AJ, 126, 2408
Netopil, M., Paunzen, E., Heiter, U., & Soubiran, C. 2016, A&A, 585, A150Pace, G., Pasquini, L., & François, P. 2008, A&A, 489, 403Perry, C. L., & Bond, H. E. 1969, PASP, 81, 629Perry, C. L., & Hill, G. 1969, AJ, 74, 899Perryman, M. A. C., Turon, C., Arenou, F., et al. 1989, in The Hipparcos mis-
sion, Pre-launch status, Vol. II: The Input Catalogue, 2Perryman, M. A. C., Brown, A. G. A., Lebreton, Y., et al. 1998, A&A, 331, 81Pinsonneault, M. H., Stauffer, J., Soderblom, D. R., King, J. R., & Hanson, R. B.
1998, ApJ, 504, 170Platais, I., Kozhurina-Platais, V., Barnes, S., et al. 2001, AJ, 122, 1486Risquez, D., van Leeuwen, F., & Brown, A. G. A. 2013, A&A, 551, A19Robichon, N., Arenou, F., Mermilliod, J.-C., & Turon, C. 1999, A&A, 345, 471Rufener, F. 1989, A&AS, 78, 469Schaller, G., Schaerer, D., Meynet, G., & Maeder, A. 1992, A&AS, 96, 269Sheikhi, N., Hasheminia, M., Khalaj, P., et al. 2016, MNRAS, 457, 1028Soderblom, D. R., Laskar, T., Valenti, J. A., Stauffer, J. R., & Rebull, L. M. 2009,
AJ, 138, 1292Stauffer, J. R., Schild, R., Barrado y Navascués, D., et al. 1998, ApJ, 504, 805Stauffer, J. R., Hartmann, L. W., Fazio, G. G., et al. 2007, ApJS, 172, 663Taylor, B. J. 2006, AJ, 132, 2453van Altena, W. F. 1966, AJ, 71, 482van Leeuwen, F. 1999, A&A, 341, L71van Leeuwen, F. 2007, A&A, 474, 653van Leeuwen, F. 2009, A&A, 497, 209Vasilevskis, S., van Leeuwen, F., Nicholson, W., & Murray, C. A. 1979, A&AS,
37, 333Westerlund, B. E., Lundgren, K., Pettersson, B., Garnier, R., & Breysacher, J.
1988, A&AS, 76, 101Williams, P. M. 1967, Monthly Notes of the Astronomical Society of South
Africa, 26, 30Zacharias, N., Finch, C., Subasavage, J., et al. 2015, AJ, 150, 101
1 Institute of Astronomy, University of Cambridge, Madingley Road,Cambridge CB3 0HA, UKe-mail: [email protected]
2 INAF–Osservatorio astronomico di Padova, Vicolo Osservatorio 5,35122 Padova, Italy
3 Institut de Ciències del Cosmos, Universitat de Barcelona (IEEC-UB), Martí Franquès 1, 08028 Barcelona, Spain
4 Lund Observatory, Department of Astronomy and TheoreticalPhysics, Lund University, Box 43, 22100 Lund, Sweden
5 Astronomisches Rechen-Institut, Zentrum für Astronomie derUniversität Heidelberg, Mönchhofstr. 12–14, 69120 Heidelberg,Germany
6 Scientific Support Office, Directorate of Science, European SpaceResearch and Technology Centre (ESA/ESTEC), Keplerlaan 1,2201 AZ Noordwijk, The Netherlands
7 Leiden Observatory, Leiden University, Niels Bohrweg 2,2333 CA Leiden, The Netherlands
8 GEPI, Observatoire de Paris, PSL Research University, CNRS,Univ. Paris Diderot, Sorbonne Paris Cité, 5 Place Jules Janssen,92190 Meudon, France
9 Max Planck Institute for Astronomy, Königstuhl 17,69117 Heidelberg, Germany
10 Department of Astronomy, University of Geneva, Chemin desMaillettes 51, 1290 Versoix, Switzerland
11 Mission Operations Division, Operations Department, Direc-torate of Science, European Space Research and Technol-ogy Centre (ESA/ESTEC), Keplerlaan 1, 2201 AZ Noordwijk,The Netherlands
12 Lohrmann Observatory, Technische Universität Dresden, Momm-senstraße 13, 01062 Dresden, Germany
13 European Space Astronomy Centre (ESA/ESAC), Camino bajo delCastillo, s/n, Urbanizacion Villafranca del Castillo, Villanueva dela Cañada, 28692 Madrid, Spain
14 Laboratoire Lagrange, Université Nice Sophia-Antipolis, Observa-toire de la Côte d’Azur, CNRS, CS 34229, 06304 Nice Cedex,France
15 CNES Centre Spatial de Toulouse, 18 avenue Edouard Belin,31401 Toulouse Cedex 9, France
16 Institut d’Astronomie et d’Astrophysique, Université Libre deBruxelles CP 226, Boulevard du Triomphe, 1050 Brussels, Belgium
A19, page 21 of 65
A&A 601, A19 (2017)
17 F.R.S.-FNRS, rue d’Egmont 5, 1000 Brussels, Belgium18 INAF–Osservatorio Astrofisico di Arcetri, Largo Enrico Fermi 5,
50125 Firenze, Italy19 Telespazio Vega UK Ltd for ESA/ESAC, Camino bajo del Castillo,
s/n, Urbanizacion Villafranca del Castillo, Villanueva de la Cañada,28692 Madrid, Spain
20 Laboratoire d’astrophysique de Bordeaux, Université de Bor-deaux, CNRS, B18N, allée Geoffroy Saint-Hilaire, 33615 Pessac,France
21 Instituut voor Sterrenkunde, KU Leuven, Celestijnenlaan 200D,3001 Leuven, Belgium
22 Department of Astrophysics/IMAPP, Radboud University Ni-jmegen, PO Box 9010, 6500 GL Nijmegen, The Netherlands
23 Mullard Space Science Laboratory, University College London,Holmbury St Mary, Dorking, Surrey RH5 6NT, UK
24 INAF–Osservatorio Astrofisico di Torino, via Osservatorio 20,10025 Pino Torinese (TO), Italy
25 Niels Bohr Institute, University of Copenhagen, Juliane MariesVej 30, 2100 Copenhagen Ø, Denmark
26 Centre for Electronic Imaging, Department of Physical Sciences,The Open University, Walton Hall MK7 6AA Milton Keynes,UK
27 ALTEC S.p.a, Corso Marche, 79, 10146 Torino, Italy28 INAF–Osservatorio Astronomico di Bologna, via Ranzani 1,
40127 Bologna, Italy29 Serco Gestión de Negocios for ESA/ESAC, Camino bajo del
Castillo, s/n, Urbanizacion Villafranca del Castillo, Villanueva dela Cañada, 28692 Madrid, Spain
30 Department of Astronomy, University of Geneva, Chemind’Ecogia 16, 1290 Versoix, Switzerland
31 STFC, Rutherford Appleton Laboratory, Harwell, Didcot,OX11 0QX, UK
32 Gaia DPAC Project Office, ESAC, Camino bajo del Castillo, s/n,Urbanizacion Villafranca del Castillo, Villanueva de la Cañada,28692 Madrid, Spain
33 SYRTE, Observatoire de Paris, PSL Research University, CNRS,Sorbonne Universités, UPMC Univ. Paris 06, LNE, 61 avenue del’Observatoire, 75014 Paris, France
34 National Observatory of Athens, I. Metaxa and Vas. Pavlou, PalaiaPenteli, 15236 Athens, Greece
35 IMCCE, Observatoire de Paris, PSL Research University, CNRS,Sorbonne Universités, UPMC Univ. Paris 06, Univ. Lille, 77 av.Denfert-Rochereau, 75014 Paris, France
36 Royal Observatory of Belgium, Ringlaan 3, 1180 Brussels,Belgium
37 Institut d’Astrophysique Spatiale, Université Paris XI, UMR 8617,CNRS, Bâtiment 121, 91405 Orsay Cedex, France
38 Institute for Astronomy, Royal Observatory, University of Edin-burgh, Blackford Hill, Edinburgh EH9 3HJ, UK
39 HE Space Operations BV for ESA/ESAC, Camino bajo delCastillo, s/n, Urbanizacion Villafranca del Castillo, Villanueva dela Cañada, 28692 Madrid, Spain
40 Institut d’Astrophysique et de Géophysique, Université de Liège,19c, Allée du 6 Août, 4000 Liège, Belgium
41 Área de Lenguajes y Sistemas Informáticos, Universidad Pablo deOlavide, Ctra. de Utrera, km 1. 41013 Sevilla, Spain
42 Observatoire Astronomique de Strasbourg, Université deStrasbourg, CNRS, UMR 7550, 11 rue de l’Université,67000 Strasbourg, France
43 Kavli Institute for Cosmology, University of Cambridge, Mading-ley Road, Cambride CB3 0HA, UK
44 Aurora Technology for ESA/ESAC, Camino bajo del Castillo, s/n,Urbanizacion Villafranca del Castillo, Villanueva de la Cañada,28692 Madrid, Spain
45 Laboratoire Univers et Particules de Montpellier, UniversitéMontpellier, Place Eugène Bataillon, CC72, 34095 MontpellierCedex 05, France
46 Department of Astrophysics, Astronomy and Mechanics, Na-tional and Kapodistrian University of Athens, Panepistimiopolis,Zografos, 15783 Athens, Greece
47 Department of Physics and Astronomy, Division of Astronomyand Space Physics, Uppsala University, Box 516, 75120 Uppsala,Sweden
48 Università di Catania, Dipartimento di Fisica e Astronomia,Sezione Astrofisica, via S. Sofia 78, 95123 Catania, Italy
49 INAF–Osservatorio Astrofisico di Catania, via S. Sofia 78,95123 Catania, Italy
50 Universidade da Coruña, Facultade de Informática, Campus deElviña S/N, 15071 A Coruña, Spain
51 CENTRA, Universidade de Lisboa, FCUL, Campo Grande,Edif. C8, 1749-016 Lisboa, Portugal
52 University of Helsinki, Department of Physics, PO Box 64, Univer-sity of Helsinki, 00014 Helsinki, Finland
53 Finnish Geospatial Research Institute FGI, Geodeetinrinne 2,02430 Masala, Finland
54 Isdefe for ESA/ESAC, Camino bajo del Castillo, s/n, UrbanizacionVillafranca del Castillo, Villanueva de la Cañada, 28692 Madrid,Spain
55 ASI Science Data Center, via del Politecnico SNC, 00133 Roma,Italy
56 Institut UTINAM UMR 6213, CNRS, OSU THETA Franche-Comté Bourgogne, Université Bourgogne Franche-Comté,25000 Besançon, France
57 Dpto. de Inteligencia Artificial, UNED, c/ Juan del Rosal 16,28040 Madrid, Spain
58 Elecnor Deimos Space for ESA/ESAC, Camino bajo del Castillo,s/n, Urbanizacion Villafranca del Castillo, Villanueva de la Cañada,28692 Madrid, Spain
59 Thales Services for CNES Centre Spatial de Toulouse, 18 avenueEdouard Belin, 31401 Toulouse Cedex 9, France
60 EURIX S.r.l., via Carcano 26, 10153 Torino, Italy61 University of Vienna, Department of Astrophysics, Türkenschanzs-
traße 17, 1180 Vienna, Austria62 Department of Physics and Astronomy, The Johns Hopkins Univer-
sity, 3400 N Charles St, Baltimore, MD 21218, USA63 ON/MCTI-BR, rua Gal. José Cristino 77, 20921-400 Rio de
Janeiro, RJ, Brazil64 OV/UFRJ-BR, Ladeira Pedro Antônio 43, 20080-090 Rio de
Janeiro, RJ, Brazil65 Faculdade Ciencias, Universidade do Porto, Departamento Matem-
atica Aplicada, rua do Campo Alegre, 687 4169-007 Porto,Portugal
66 Instituto de Astrofísica e Ciências do Espa co, Universidade deLisboa Faculdade de Ciências, Campo Grande, 1749-016 Lisboa,Portugal
67 Departamento de Astrofísica, Centro de Astrobiología (CSIC-INTA), ESA-ESAC. Camino Bajo del Castillo s/n., 28692Villanueva de la Cañada, Madrid, Spain
68 Department of Physics and Astronomy, University of Leicester,University Road, Leicester LE1 7RH, UK
69 University of Oviedo, Campus Universitario, 33203 Gijón, Spain70 University of Cádiz, Avd. De la universidad, Jerez de la Frontera,
11002 Cádiz, Spain71 Kapteyn Astronomical Institute, University of Groningen,
Landleven 12, 9747 AD Groningen, The Netherlands72 Consorci de Serveis Universitaris de Catalunya, C/ Gran Capità,
2-4 3rd floor, 08034 Barcelona, Spain73 University of Turin, Department of Computer Sciences, Corso
Svizzera 185, 10149 Torino, Italy74 INAF–Osservatorio Astronomico di Roma, via di Frascati 33,
00078 Monte Porzio Catone (Roma), Italy75 CRAAG – Centre de Recherche en Astronomie, Astrophysique et
Géophysique, Route de l’Observatoire, BP 63 Bouzareah, 16340Algiers, Algeria
76 Universiteit Antwerpen, Onderzoeksgroep Toegepaste Wiskunde,Middelheimlaan 1, 2020 Antwerpen, Belgium
77 Department of Physics and Astronomy, University of Padova, viaMarzolo 8, 35131 Padova, Italy
78 INAF–Osservatorio Astronomico di Teramo, via Mentore Maggini,64100 Teramo, Italy
A19, page 22 of 65
Gaia Collaboration (van Leeuwen, F., et al.): Gaia Data Release 1
79 INAF–Osservatorio Astronomico di Capodimonte, via Moiariello16, 80131 Napoli, Italy
80 Instituto de Astronomia, Geofìsica e Ciências Atmosféricas, Uni-versidade de São Paulo, rua do Matão, 1226, Cidade Universitaria,05508-900 São Paulo, SP, Brazil
81 Department of Geosciences, Tel Aviv University, 6997801Tel Aviv, Israel
82 Astronomical Institute Anton Pannekoek, University of Amster-dam, PO Box 94249, 1090 GE Amsterdam, The Netherlands
83 Leibniz Institute for Astrophysics Potsdam (AIP), An der Stern-warte 16, 14482 Potsdam, Germany
84 ATOS for CNES Centre Spatial de Toulouse, 18 avenue EdouardBelin, 31401 Toulouse Cedex 9, France
85 School of Physics and Astronomy, Tel Aviv University, 6997801Tel Aviv, Israel
86 UNINOVA – CTS, Campus FCT-UNL, Monte da Caparica,2829-516 Caparica, Portugal
87 Laboratoire Géoazur, Université Nice Sophia-Antipolis,UMR 7329, CNRS, Observatoire de la Côte d’Azur, 250 rueA. Einstein, 06560 Valbonne, France
88 RHEA for ESA/ESAC, Camino bajo del Castillo, s/n, UrbanizacionVillafranca del Castillo, Villanueva de la Cañada, 28692 Madrid,Spain
89 Astronomical Institute, Academy of Sciences of the Czech Repub-lic, Fricova 298, 25165 Ondrejov, Czech Republic
90 Barcelona Supercomputing Center – Centro Nacional de Super-computación, c/ Jordi Girona 29, Ed. Nexus II, 08034 Barcelona,Spain
91 Department of Mechanical Engineering, University of La Rioja,c/San José de Calasanz, 31, 26004 Logroño, La Rioja, Spain
92 ETSE Telecomunicación, Universidade de Vigo, Campus Lagoas-Marcosende, 36310 Vigo, Galicia, Spain
93 SRON, Netherlands Institute for Space Research, Sorbonnelaan 2,3584CA Utrecht, The Netherlands
94 Faculty of Mathematics and Physics, University of Ljubljana,Jadranska ulica 19, 1000 Ljubljana, Slovenia
95 Physics Department, University of Antwerp, Groenenborgerlaan171, 2020 Antwerp, Belgium
96 Harvard-Smithsonian Center for Astrophysics, 60 Garden Street,Cambridge, MA 02138, USA
97 Institut de Physique de Rennes, Université de Rennes 1,35042 Rennes, France
98 Shanghai Astronomical Observatory, Chinese Academy of Sci-ences, 80 Nandan Rd, 200030 Shanghai, PR China
99 CSC Danmark A/S, Retortvej 8, 2500 Valby, Denmark100 Las Cumbres Observatory Global Telescope Network, Inc.,
6740 Cortona Drive, Suite 102, Goleta, CA 93117, USA101 Astrophysics Research Institute, Liverpool John Moores Univer-
sity, L3 5RF, UK102 Konkoly Observatory, Research Centre for Astronomy and Earth
Sciences, Hungarian Academy of Sciences, Konkoly Thege Miklósút 15-17, 1121 Budapest, Hungary
103 Baja Observatory of University of Szeged, Szegedi út III/70,6500 Baja, Hungary
104 Laboratoire AIM, IRFU/Service d’Astrophysique, CEA/DSM,CNRS, Université Paris Diderot, Bât 709, CEA-Saclay,91191 Gif-sur-Yvette Cedex, France
105 INAF–Osservatorio Astronomico di Trieste, via G.B. Tiepolo 11,34143 Trieste, Italy
106 Laboratoire de l’Accélérateur Linéaire, Université Paris-Sud,CNRS/IN2P3, Université Paris-Saclay, 91898 Orsay Cedex, France
107 École polytechnique fédérale de Lausanne, SB MATHAA STAP,MA B1 473 (Bâtiment MA), Station 8, 1015 Lausanne, Switzerland
108 INAF/IASF-Bologna, via P. Gobetti 101, 40129 Bologna, Italy109 Technical University of Madrid, José Gutiérrez Abascal 2,
28006 Madrid, Spain110 EQUERT International for CNES Centre Spatial de Toulouse,
18 avenue Edouard Belin, 31401 Toulouse Cedex 9, France111 AKKA for CNES Centre Spatial de Toulouse, 18 avenue Edouard
Belin, 31401 Toulouse Cedex 9, France
112 Villanova University, Dept. of Astrophysics and Planetary Science,800 E Lancaster Ave, Villanova, PA 19085, USA
113 Vitrociset Belgium for ESA/ESAC, Camino bajo del Castillo, s/n,Urbanizacion Villafranca del Castillo, Villanueva de la Cañada,28692 Madrid, Spain
114 Fork Research, rua do Cruzado Osberno, Lt. 1, 9 esq., 1900-174Lisboa, Portugal
115 APAVE SUDEUROPE SAS for CNES Centre Spatial de Toulouse,18 avenue Edouard Belin, 31401 Toulouse Cedex 9, France
116 Spanish Virtual Observatory, 2869 Madrid, Spain117 Fundación Galileo Galilei – INAF, Rambla José Ana Fernández
Pérez 7, 38712 Breña Baja, Santa Cruz de Tenerife, Spain118 INSA for ESA/ESAC, Camino bajo del Castillo, s/n, Urbanizacion
Villafranca del Castillo, Villanueva de la Cañada, 28692 Madrid,Spain
119 Dpto. Arquitectura de Computadores y Automática, Facultad deInformática, Universidad Complutense de Madrid, C/ Prof. JoséGarcía Santesmases s/n, 28040 Madrid, Spain
120 H H Wills Physics Laboratory, University of Bristol, TyndallAvenue, Bristol BS8 1TL, UK
121 Stellar Astrophysics Centre, Aarhus University, Department ofPhysics and Astronomy, 120 Ny Munkegade, Building 1520,8000 Aarhus C, Denmark
122 Applied Physics Department, University of Vigo, 36310 Vigo,Spain
123 HE Space Operations BV for ESA/ESTEC, Keplerlaan 1, 2201AZNoordwijk, The Netherlands
124 Warsaw University Observatory, Al. Ujazdowskie 4, 00-478Warszawa, Poland
125 Instituto de Astrofísica de Canarias, 38205 La Laguna, Tenerife,Spain
126 Universidad de La Laguna, Departamento de Astrofísica,38206 La Laguna, Tenerife, Spain
127 RHEA for ESA/ESTEC, Keplerlaan 1, 2201AZ Noordwijk,The Netherlands
128 Max Planck Institute for Solar System Research, Justus-von-Liebig-Weg 3, 37077 Göttingen, Germany
129 SISSA (Scuola Internazionale Superiore di Studi Avanzati), viaBonomea 265, 34136 Trieste, Italy
130 Instituto Nacional de Pesquisas Espaciais/Ministério da CienciaTecnologia, Avenida dos Astronautas 1758, 12227-010 São JoséDos Campos, Brazil
131 Argelander Institut für Astronomie der Universität Bonn, Auf demHügel 71, 53121 Bonn, Germany
132 European Southern Observatory (ESO), Karl-Schwarzschild-Straße 2, 85748 Garching bei München, Germany
133 Laboratory of Optics, Lasers and Systems, Faculty of Sciences,University of Lisbon, Campus do Lumiar, Estrada do Paço do Lu-miar, 22, 1649-038 Lisboa, Portugal
134 Department of Physics and Astronomy, Notre Dame University,Louaize, PO Box 72, Zouk Mikaël, Lebanon
135 University of Nova Gorica, Vipavska 13, 5000 Nova Gorica,Slovenia
136 Max Planck Institute for Extraterrestrial Physics, OPINAS,Gießenbachstraße, 85741 Garching, Germany
137 NASA/IPAC Infrared Science Archive, California Institute of Tech-nology, Mail Code 100-22, 770 South Wilson Avenue, Pasadena,CA 91125, USA
138 Center of Applied Space Technology and Microgravity (ZARM),c/o Universität Bremen, Am Fallturm 1, 28359 Bremen, Germany
139 RHEA System for ESA/ESOC, Robert Bosch Straße 5, 64293Darmstadt, Germany
140 Tartu Observatory, 61602 Tõravere, Estonia141 Sydney Institute for Astronomy, School of Physics A28, The Uni-
versity of Sydney, 2006 Sydney, Australia142 Slovak Organisation for Space Activities, Zamocka 18, 85101
Bratislava, Slovak Republic143 National Astronomical Observatories, CAS, 100012 Beijing,
PR China
A19, page 23 of 65
A&A 601, A19 (2017)
144 US Naval Observatory, Astrometry Department, 3450 Mas-sachusetts Ave. NW, Washington, DC 20392-5420, USA
145 European Southern Observatory (ESO), Alonso de Córdova 3107,Vitacura, Casilla 19001, Santiago de Chile, Chile
146 Airbus Defence and Space SAS, 31 rue des Cosmonautes, 31402Toulouse Cedex 4, France
147 EJR-Quartz BV for ESA/ESTEC, Keplerlaan 1, 2201 AZNoordwijk, The Netherlands
148 The Server Labs for ESA/ESAC, Camino bajo del Castillo, s/n,Urbanizacion Villafranca del Castillo, Villanueva de la Cañada,28692 Madrid, Spain
149 Astronomical Observatory Institute, Faculty of Physics, A.Mickiewicz University, ul. Słoneczna 36, 60-286 Poznan,Poland
150 CS Systèmes d’Information for CNES Centre Spatial de Toulouse,18 avenue Edouard Belin, 31401 Toulouse Cedex 9, France
151 Directorate of Science, European Space Research and Technol-ogy Centre (ESA/ESTEC), Keplerlaan 1, 2201 AZ Noordwijk,The Netherlands
152 Praesepe BV for ESA/ESAC, Camino bajo del Castillo, s/n, Ur-banizacion Villafranca del Castillo, Villanueva de la Cañada,28692 Madrid, Spain
153 Sorbonne Universités UPMC et CNRS, UMR 7095, Institutd’Astrophysique de Paris, 75014 Paris, France
154 GMV for ESA/ESAC, Camino bajo del Castillo, s/n, UrbanizacionVillafranca del Castillo, Villanueva de la Cañada, 28692 Madrid,Spain
155 Institute of Theoretical Physics and Astronomy, Vilnius University,Sauletekio al. 3, 10222 Vilnius, Lithuania
156 S[&]T Corporation, PO Box 608, 2600 AP Delft, The Netherlands157 Department of Space Studies, Southwest Research Institute
(SwRI), 1050 Walnut Street, Suite 300, Boulder, Colorado 80302,USA
158 Deutsches Zentrum für Luft- und Raumfahrt, Institute of SpaceSystems, Am Fallturm 1, 28359 Bremen, Germany
159 University of Applied Sciences Munich, Karlstr. 6, 80333 Munich,Germany
160 Dipartimento di Fisica, Università di Roma Tor Vergata, via dellaRicerca Scientifica 1, 00133 Rome, Italy
161 Department of Physics and Astronomy, University of the WesternCape, Robert Sobukwe Road, 7535 Bellville, Cape Town, SouthAfrica
162 INAF – Istituto di Radioastronomia, via Gobetti 101, 40129Bologna, Italy
163 Department of Physics, Florida International University, 11200 SW8th Street, Miami, FL 33199, USA
164 Hamburger Sternwarte, Gojenbergsweg 112, 21029 Hamburg,Germany
A19, page 24 of 65
Gaia Collaboration (van Leeuwen, F., et al.): Gaia Data Release 1
Appendix A: Combined astrometric solutions
A.1. Observations and noise contributions
In the combined astrometric solution the observed parallaxesand proper motions are compared with predicted ones, basedon the assumed parallax and space motion of the cluster centre,and the position of the star on the sky relative to the projectionof the cluster centre. This forms the common solution which pro-vides an update to the proper motion of the cluster.
The correction for the parallax offset d$i along the line ofsight of the observed parallax is reflected in the proper motionfor each star i: 1µα∗,c/$cµδ,c/$c
· d$i. (A.1)
In reality this contribution is only significant for the nearby clus-ters. The complete observation equations for the cluster parallaxand proper motion corrections are as follows: 1 0 0 1
0 1 0 µα∗,c/$c0 0 1 µδ,c/$c
·
d$cdµα∗,cdµδ,cd$i
=
δ$iδµα∗,iδµδ,i
+ √Ni ε. (A.2)
Where the index c refers to the cluster parameters, Ni is the noisecovariance matrix for the astrometric parameters of star i (see be-low), and each element of the vector ε has expectation value 0and sigma of one. The value of δ$i is the difference betweenthe assumed cluster parallax and the observed parallax for star i.The values of δµα∗,i and δµδ,i are the differences between the ob-served and predicted proper motion assuming the parallax to bethe same as the cluster. This way, the expression in Eq. (A.1)allows for a compensation of the relative distance of a star, asbased on the parallax and proper motion measurements. How-ever, due to the still fairly limited accuracies of both proper mo-tions and parallaxes for individual stars, the inclusion of the rel-ative parallax corrections (Eq. (A.1)) creates a near-singularityin the solution when also the cluster parallax is solved for. Thereare therefore, at this stage, two types of solutions, one for thecluster parallax,
[I3]·
d$cdµα∗,cdµδ,c
=
δ$iδµα∗,iδµδ,i
+ √Ni ε, (A.3)
and one for the differential parallaxes within the cluster, 0 0 11 0 µα∗,c/$c0 1 µδ,c/$c
· dµα∗,cdµδ,c
d$i
=
δ$iδµα∗,iδµδ,i
+ √Ni ε. (A.4)
Only when both the parallaxes and proper motions reach a higheraccuracy it may become possible to combine the two solutions.
Two noise matrices are associated with the observations. Thefirst is the covariance matrix Na for the astrometric parameter de-termination as applicable to each individual member. The secondis the noise on the proper motions introduced by the internal ve-locity dispersion, Nv. The sum of these two contributions is givenby Ni. If the matrix Ui is an upper-triangular square root of Ni,then we can normalize the noise on the observation equationsby multiplying both sides of Eq. (A.3) by the upper-triangularinverse of Ui:[U−1
i
]·
d$cdµα∗,cdµδ,c
= U−1i ·
δ$iδµα∗δµδ
+ ε. (A.5)
Equations of the type Eq. (A.5) are the input observation equa-tions for the cluster astrometric parameters solution. The ma-trix U−1 is referred to as the weight matrix, and is a square root ofthe normal equations. It has the same dimensions as the observa-tion equations. A similar procedure can be applied to Eq. (A.4).
The first component of Ni can be reconstructed from the dataprovided in the Gaia DR1 TGAS records, where the standard er-rorsσ and correlation coefficients c for the astrometric parametersolution are given. Here we are only concerned about the paral-lax and proper motion determinations. The 3 by 3 matrix Na isthen given as:
Na =
σ21 c12σ1σ2 c13σ1σ3
c12σ1σ2 σ22 c23σ2σ3
c13σ1σ3 c23σ2σ3 σ23
, (A.6)
where the indices 1–3 stand for parallax, proper motion in rightascension and proper motion in declination respectively. The val-ues for ci, j are provided with the astrometric data as the correla-tion coefficients for the astrometric parameters.
The noise matrix for the internal velocity dispersion is givenby:
Nv =
0 0 00 σ2
v 00 0 σ2
v
, (A.7)
where σv is equivalent to an internal velocity dispersion of0.6 km s−1 (κ = 4.74047, the transformation factor frommas yr−1 to km s−1):
σv = 0.6 ·$c/κ mas s−1, (A.8)
which is roughly equivalent to what has been observed in thePleiades and Hyades. The assumptions concerning this internalvelocity dispersion can significantly affect the outcome of thecluster parallax due to the strong correlation coefficients in Na.It is a value that is going to be dependent on stellar mass anddistance from the cluster centre, but these are considerations thatbecome possible to implement with future releases of the Gaiadata. The current data is still too complicated to determine andimplement such dependencies.
When solving Eq. (A.3) the parallax dispersion has to betaken into account. This again is a somewhat uncertain quantity,that will differ from cluster to cluster. The dispersion in actualdistance for an “average cluster” is assumed to be 0.003 kpc.In first approximation this will give a parallax dispersion σ$ ≈$2σr. At a parallax of, say, 8 mas, this implies a parallax dis-persion of just under 0.2 mas. The noise matrix contribution issimply
N$ =
σ2$ 0 00 0 00 0 0
. (A.9)
For any individual star the measured proper motion may be fur-ther disturbed by unresolved orbital motion, but these have to beresolved with increase in the data volume and epoch coverage.
A.2. Projection effects
If we consider the centre of the cluster to be represented by thevector R, then the cluster space velocity is given by the deriva-tive of this vector, R. Expressed in equatorial coordinates, thesevectors have the following familiar expressions:
R = R ·
cosα cos δsinα cos δ
sin δ
(A.10)
A19, page 25 of 65
A&A 601, A19 (2017)
and
R =
cosα cos δ − sinα − cosα sin δsinα cos δ cosα − sinα sin δ
sin δ 0 cos δ
· RR α cos δ
R δ
. (A.11)
The vector on the right-hand side of Eq. (A.11) relates directlyto the proper motion and radial velocity of the cluster: R
R α cos δR δ
=
Vradκµα∗/$κµδ/$
. (A.12)
Similarly, the projection of the cluster space motion on the ob-served parameters of a cluster member (index i) can be expressedas:Vrad,iκ µα∗,i/$iκ µδ,i/$i
=
cosαi cos δi sinαi cos δi sin δi− sinαi cosαi 0
− cosαi sin δi − sinαi sin δi cos δi
· R. (A.13)
An approximation of these equations for distant clusters, withsmall differences between the position of the cluster centreand those of the member stars, can be found in fvl09. Equa-tion (A.13) is used to provide predicted values for the propermotions.
A.3. Transformation to reduced proper motions
For further analysis the reference system can be rotated such thatone component of the proper motion is aligned with the clusterproper motion, while the other is perpendicular to it. This systemof reduced proper motions is particularly useful for analysing theHyades and other nearby systems. The shared cluster motion forany cluster member is in the direction of the convergent point(αt, δt), the position of which is set by the direction of the spacemotion vector R of the cluster:
ˆR =
cosαt cos δtsinαt cos δt
sin δt
. (A.14)
The transformation of the positional reference system to the newcoordinates (ρ, τ), with the pole at the convergent point, is givenby: cos ρ cos τ
sin ρ cos τsin τ
=
cosαt sin δt sinαt sin δt − cos δt− sinαt cosαt 0
cosαt cos δt sinαt cos δt sin δt
· R. (A.15)
For the rotation of the proper motions to the new systemthe local orientation of the equatorial coordinates needs to bereconstructed.
The vector product of the direction to the source, R and thedirection of the convergent point is a vector u in the plane tan-gential to the direction of source and perpendicular to the direc-tion of the convergent point as seen from the source. In that sameplane the vectors
p =
− sinαcosα
0
(A.16)
and
q =
− cosα sin δ− sinα sin δ
cos δ
(A.17)
describe the direction, from the source, of right ascension anddeclination respectively (see also Eq. (A.11)). Thus, the innerproducts
cos φ = u · p (A.18)
and
cos(90 − φ) = sin φ = u · q (A.19)
define the orientation angle φ needed for the transformation ofthe proper motions. The proper motions in the new coordinatesystem are
µρ cos τ = cos φ µα cos δ − sin φ µδµτ = sin φ µα cos δ + cos φ µδ. (A.20)
The transformation of the weight matrix U−1 is having the sameform:
W = U−1 ·
1 0 00 cos φ sin φ0 − sin φ cos φ
, (A.21)
which transforms the application of the standard errors and cor-relations to the new system. Note that the weight matrix W is nolonger upper triangular. The predicted projected cluster propermotion has only one component, in the τ direction. It is zero inthe ρ direction. Thus, the vector s in Eq. (A.4) is simplified to
s′ · d$i =
10
µτ,c/$c
· d$i (A.22)
and the observation equations become
Wi ·
0 0 11 0 00 1 µτ,c/$c
· dµρ cos τ,c
dµτ,cd$i
= Wi ·
δ$iδµρ·δµτ
+ ε. (A.23)
The proper motion in the τ direction is primarily a function ofthe parallax of the star (relative to the mean cluster parallax)and the angular separation from the convergent point, and canas such be used to derive differential parallaxes of cluster mem-bers (Madsen 1999). These are referred to as the kinematicallyimproved parallaxes. The added uncertainty is in the internal ve-locity dispersion of the cluster members.
The observed proper motion dispersion in the ρ direction,after correcting for observational standard errors, provides a po-tential measure for the internal velocity dispersion in the clus-ter. This reduced proper motion solution, which can be seen asthe inverse of the convergent point cluster parallax determination(see also see Madsen 1999; van Leeuwen 2009), is only usefulin that context. For solving the cluster parallax and proper mo-tion it is better to use Eq. (A.3) and staying that way closer to theoriginal observations.
Appendix B: Tangential projectionand de-projection
The tangential projection is used here as a simple tool to deter-mine cluster centre positions, based on the average of the posi-tions of all selected member stars. Just for reference, the equa-tions are given here. Using the subscripts i and c for the star and
A19, page 26 of 65
Gaia Collaboration (van Leeuwen, F., et al.): Gaia Data Release 1
the cluster centre respectively, and ∆αi ≡ (αi − αc), the projec-tion is:
xi =sin ∆αi cos δi
sin δi sin δc + cos δi cos δc cos ∆αi,
yi =sin δi cos δc − cos δi sin δc cos ∆αi
sin δi sin δc + cos δi cos(δc) cos ∆αi· (B.1)
For the inverse derivation, first derive
wi = sin δi sin δc + cos δi cos δc cos ∆αi
=1√
1 + x2i + y2
i
(B.2)
and similarly
ui = sin δi cos δc − cos δi sin δc cos ∆αi
= yi · wi (B.3)
and
vi = sin ∆αi cos δi
= xiwi. (B.4)
Combine Eqs. (B.2) and (B.3) to give
sin δi = ui cos δc + wi sin δc
cos δi cos ∆αi = −ui sin δc + wi cos δc. (B.5)
Equations (B.4) and (B.5) are all that is needed to recover(αc, δc).
Appendix C: Three-dimensional distancefrom cluster centre
If the vector towards the star is given by Rs and for the clustercentre as Rc, then the position of the star within the cluster isgiven by
r = Rs − Rc. (C.1)
The angular separation ρ of the star from the centre of the clusteris given by
cos ρ = $c$sRc · Rs, (C.2)
where $c is the assumed parallax for the cluster centre, and $sthe observed parallax for the star. The length of r is given by
r = ||r|| =
√1$2
c+
1$2
s−
2 cos ρ$c$s
· (C.3)
Along the line of sight, the su on r is dominated by the relativeerror on the stellar parallax:
σr =∂r∂$s
σ$,s =|$s cos ρ/$c − 1|
r$3s
σ$,s. (C.4)
The su σr leads to a “stretched out” appearance of the clusteralong the line of sight. For clusters much more distant than theHyades, the parallax of the star can be expressed as $s = $c +∆$s, with ∆$s � $c. In addition, cos ρ ≈ 1, which gives infirst approximation (expressed in the parallax of the cluster):
σr ≈σ$,s
r$3c
|∆$s|
$c· (C.5)
Also, ∆$s ≈ $2cr cos θ, where θ is measured from the line of
sight through the cluster centre. Substituting gives
σr ≈σ$,s cos θ
$2c· (C.6)
Thus, in Eq. (C.4) the error σr effectively scales with the dis-tance of the cluster squared, which makes it at this stage onlyjust applicable to the Hyades.
Appendix D: Selected stars
Here we present the tables with the selected members for thedifferent clusters, and other information that may be of interest.Cross identifications with HD numbers were obtained from theHipparcos or Tycho-2 identifiers in the TGAS records, and thecross matches of those identifiers with the HD catalogue as pro-vided by ESA (1997) and Fabricius et al. (2002). Positions in thetables are in the ICRS, at epoch 2015.0. Further Gaia data on thesources in the tables can be extracted from the Gaia archive3, us-ing the option “file”, providing a file with source identifiers. Theoption “Tycho-Gaia Astrometric Solution” should be selected.
3 https://gea.esac.esa.int/archive/
A19, page 27 of 65
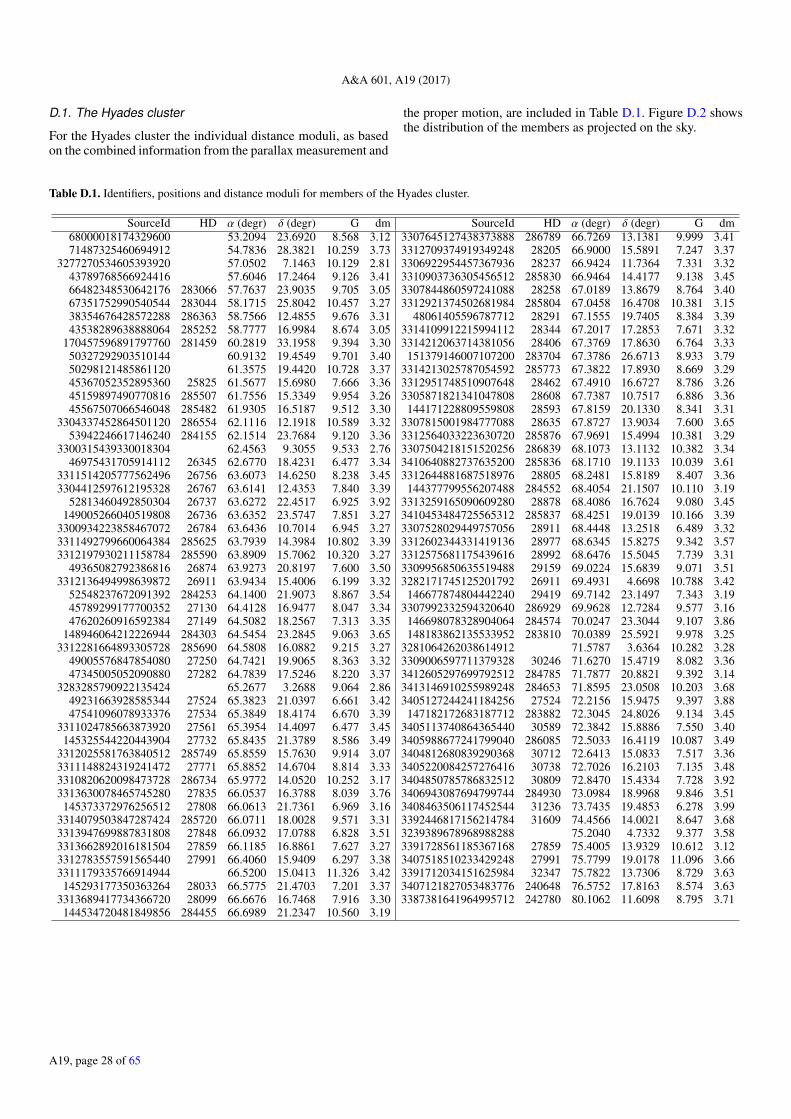
A&A 601, A19 (2017)
D.1. The Hyades cluster
For the Hyades cluster the individual distance moduli, as basedon the combined information from the parallax measurement and
the proper motion, are included in Table D.1. Figure D.2 showsthe distribution of the members as projected on the sky.
Table D.1. Identifiers, positions and distance moduli for members of the Hyades cluster.
SourceId HD α (degr) δ (degr) G dm SourceId HD α (degr) δ (degr) G dm68000018174329600 53.2094 23.6920 8.568 3.12 3307645127438373888 286789 66.7269 13.1381 9.999 3.4171487325460694912 54.7836 28.3821 10.259 3.73 3312709374919349248 28205 66.9000 15.5891 7.247 3.37
3277270534605393920 57.0502 7.1463 10.129 2.81 3306922954457367936 28237 66.9424 11.7364 7.331 3.3243789768566924416 57.6046 17.2464 9.126 3.41 3310903736305456512 285830 66.9464 14.4177 9.138 3.4566482348530642176 283066 57.7637 23.9035 9.705 3.05 3307844860597241088 28258 67.0189 13.8679 8.764 3.4067351752990540544 283044 58.1715 25.8042 10.457 3.27 3312921374502681984 285804 67.0458 16.4708 10.381 3.1538354676428572288 286363 58.7566 12.4855 9.676 3.31 48061405596787712 28291 67.1555 19.7405 8.384 3.3943538289638888064 285252 58.7777 16.9984 8.674 3.05 3314109912215994112 28344 67.2017 17.2853 7.671 3.32
170457596891797760 281459 60.2819 33.1958 9.394 3.30 3314212063714381056 28406 67.3769 17.8630 6.764 3.3350327292903510144 60.9132 19.4549 9.701 3.40 151379146007107200 283704 67.3786 26.6713 8.933 3.7950298121485861120 61.3575 19.4420 10.728 3.37 3314213025787054592 285773 67.3822 17.8930 8.669 3.2945367052352895360 25825 61.5677 15.6980 7.666 3.36 3312951748510907648 28462 67.4910 16.6727 8.786 3.2645159897490770816 285507 61.7556 15.3349 9.954 3.26 3305871821341047808 28608 67.7387 10.7517 6.886 3.3645567507066546048 285482 61.9305 16.5187 9.512 3.30 144171228809559808 28593 67.8159 20.1330 8.341 3.31
3304337452864501120 286554 62.1116 12.1918 10.589 3.32 3307815001984777088 28635 67.8727 13.9034 7.600 3.6553942246617146240 284155 62.1514 23.7684 9.120 3.36 3312564033223630720 285876 67.9691 15.4994 10.381 3.29
3300315439330018304 62.4563 9.3055 9.533 2.76 3307504218151520256 286839 68.1073 13.1132 10.382 3.3446975431705914112 26345 62.6770 18.4231 6.477 3.34 3410640882737635200 285836 68.1710 19.1133 10.039 3.61
3311514205777562496 26756 63.6073 14.6250 8.238 3.45 3312644881687518976 28805 68.2481 15.8189 8.407 3.363304412597612195328 26767 63.6141 12.4353 7.840 3.39 144377799556207488 284552 68.4054 21.1507 10.110 3.19
52813460492850304 26737 63.6272 22.4517 6.925 3.92 3313259165090609280 28878 68.4086 16.7624 9.080 3.45149005266040519808 26736 63.6352 23.5747 7.851 3.27 3410453484725565312 285837 68.4251 19.0139 10.166 3.39
3300934223858467072 26784 63.6436 10.7014 6.945 3.27 3307528029449757056 28911 68.4448 13.2518 6.489 3.323311492799660064384 285625 63.7939 14.3984 10.802 3.39 3312602344331419136 28977 68.6345 15.8275 9.342 3.573312197930211158784 285590 63.8909 15.7062 10.320 3.27 3312575681175439616 28992 68.6476 15.5045 7.739 3.31
49365082792386816 26874 63.9273 20.8197 7.600 3.50 3309956850635519488 29159 69.0224 15.6839 9.071 3.513312136494998639872 26911 63.9434 15.4006 6.199 3.32 3282171745125201792 26911 69.4931 4.6698 10.788 3.42
52548237672091392 284253 64.1400 21.9073 8.867 3.54 146677874804442240 29419 69.7142 23.1497 7.343 3.1945789299177700352 27130 64.4128 16.9477 8.047 3.34 3307992332594320640 286929 69.9628 12.7284 9.577 3.1647620260916592384 27149 64.5082 18.2567 7.313 3.35 146698078328904064 284574 70.0247 23.3044 9.107 3.86
148946064212226944 284303 64.5454 23.2845 9.063 3.65 148183862135533952 283810 70.0389 25.5921 9.978 3.253312281664893305728 285690 64.5808 16.0882 9.215 3.27 3281064262038614912 71.5787 3.6364 10.282 3.28
49005576847854080 27250 64.7421 19.9065 8.363 3.32 3309006597711379328 30246 71.6270 15.4719 8.082 3.3647345005052090880 27282 64.7839 17.5246 8.220 3.37 3412605297699792512 284785 71.7877 20.8821 9.392 3.14
3283285790922135424 65.2677 3.2688 9.064 2.86 3413146910255989248 284653 71.8595 23.0508 10.203 3.6849231663928585344 27524 65.3823 21.0397 6.661 3.42 3405127244241184256 27524 72.2156 15.9475 9.397 3.8847541096078933376 27534 65.3849 18.4174 6.670 3.39 147182172683187712 283882 72.3045 24.8026 9.134 3.45
3311024785663873920 27561 65.3954 14.4097 6.477 3.45 3405113740864365440 30589 72.3842 15.8886 7.550 3.40145325544220443904 27732 65.8435 21.3789 8.586 3.49 3405988677241799040 286085 72.5033 16.4119 10.087 3.49
3312025581763840512 285749 65.8559 15.7630 9.914 3.07 3404812680839290368 30712 72.6413 15.0833 7.517 3.363311148824319241472 27771 65.8852 14.6704 8.814 3.33 3405220084257276416 30738 72.7026 16.2103 7.135 3.483310820620098473728 286734 65.9772 14.0520 10.252 3.17 3404850785786832512 30809 72.8470 15.4334 7.728 3.923313630078465745280 27835 66.0537 16.3788 8.039 3.76 3406943087694799744 284930 73.0984 18.9968 9.846 3.51
145373372976256512 27808 66.0613 21.7361 6.969 3.16 3408463506117452544 31236 73.7435 19.4853 6.278 3.993314079503847287424 285720 66.0711 18.0028 9.571 3.31 3392446817156214784 31609 74.4566 14.0021 8.647 3.683313947699887831808 27848 66.0932 17.0788 6.828 3.51 3239389678968988288 75.2040 4.7332 9.377 3.583313662892016181504 27859 66.1185 16.8861 7.627 3.27 3391728561185367168 27859 75.4005 13.9329 10.612 3.123312783557591565440 27991 66.4060 15.9409 6.297 3.38 3407518510233429248 27991 75.7799 19.0178 11.096 3.663311179335766914944 66.5200 15.0413 11.326 3.42 3391712034151625984 32347 75.7822 13.7306 8.729 3.63
145293177350363264 28033 66.5775 21.4703 7.201 3.37 3407121827053483776 240648 76.5752 17.8163 8.574 3.633313689417734366720 28099 66.6676 16.7468 7.916 3.30 3387381641964995712 242780 80.1062 11.6098 8.795 3.71
144534720481849856 284455 66.6989 21.2347 10.560 3.19
A19, page 28 of 65
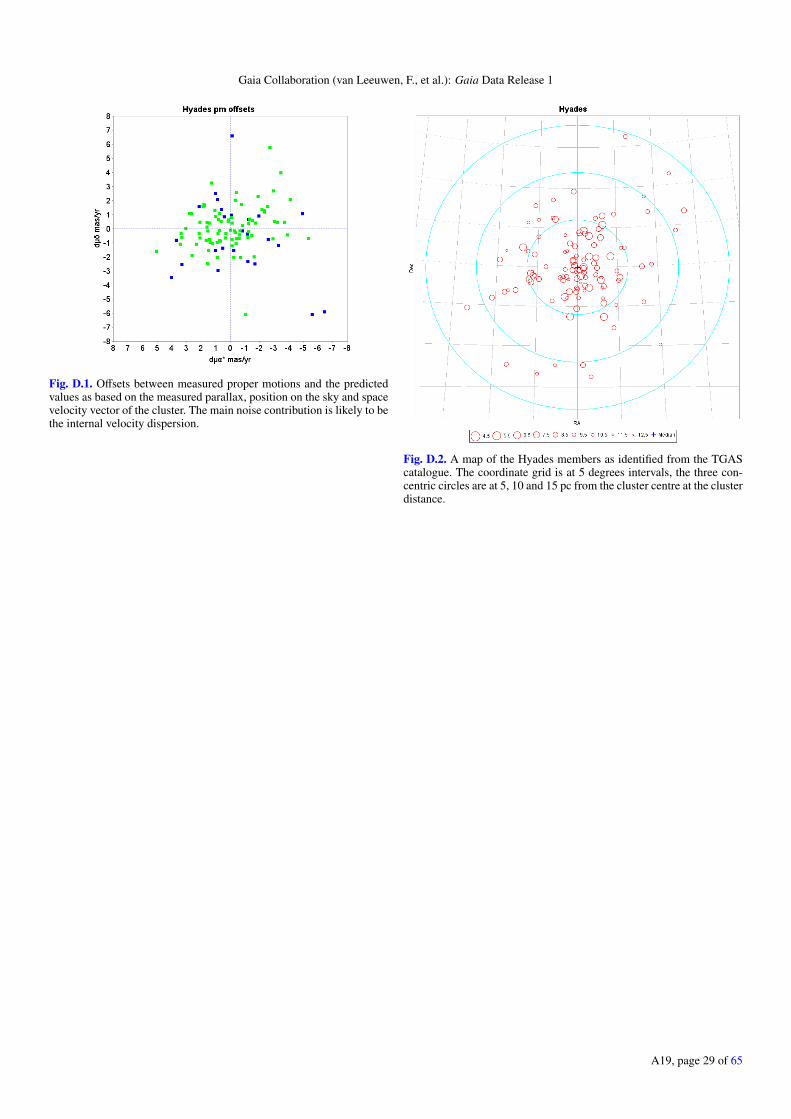
Gaia Collaboration (van Leeuwen, F., et al.): Gaia Data Release 1
Fig. D.1. Offsets between measured proper motions and the predictedvalues as based on the measured parallax, position on the sky and spacevelocity vector of the cluster. The main noise contribution is likely to bethe internal velocity dispersion.
Fig. D.2. A map of the Hyades members as identified from the TGAScatalogue. The coordinate grid is at 5 degrees intervals, the three con-centric circles are at 5, 10 and 15 pc from the cluster centre at the clusterdistance.
A19, page 29 of 65
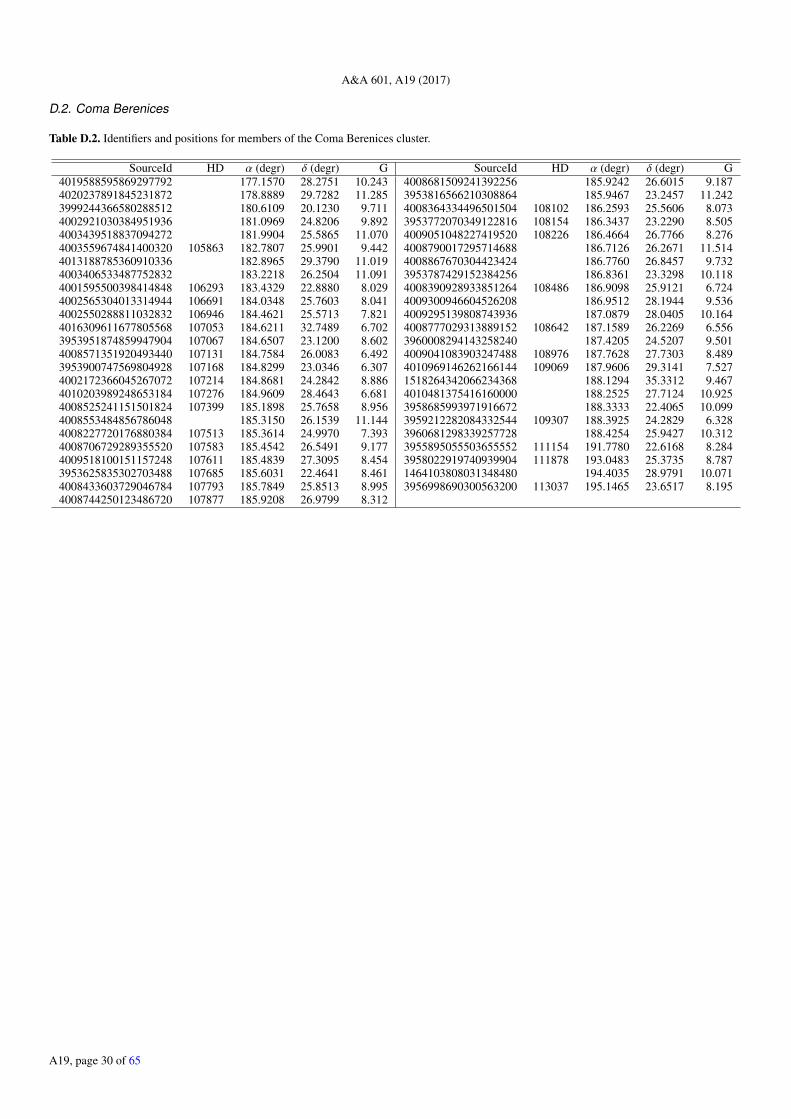
A&A 601, A19 (2017)
D.2. Coma Berenices
Table D.2. Identifiers and positions for members of the Coma Berenices cluster.
SourceId HD α (degr) δ (degr) G SourceId HD α (degr) δ (degr) G4019588595869297792 177.1570 28.2751 10.243 4008681509241392256 185.9242 26.6015 9.1874020237891845231872 178.8889 29.7282 11.285 3953816566210308864 185.9467 23.2457 11.2423999244366580288512 180.6109 20.1230 9.711 4008364334496501504 108102 186.2593 25.5606 8.0734002921030384951936 181.0969 24.8206 9.892 3953772070349122816 108154 186.3437 23.2290 8.5054003439518837094272 181.9904 25.5865 11.070 4009051048227419520 108226 186.4664 26.7766 8.2764003559674841400320 105863 182.7807 25.9901 9.442 4008790017295714688 186.7126 26.2671 11.5144013188785360910336 182.8965 29.3790 11.019 4008867670304423424 186.7760 26.8457 9.7324003406533487752832 183.2218 26.2504 11.091 3953787429152384256 186.8361 23.3298 10.1184001595500398414848 106293 183.4329 22.8880 8.029 4008390928933851264 108486 186.9098 25.9121 6.7244002565304013314944 106691 184.0348 25.7603 8.041 4009300946604526208 186.9512 28.1944 9.5364002550288811032832 106946 184.4621 25.5713 7.821 4009295139808743936 187.0879 28.0405 10.1644016309611677805568 107053 184.6211 32.7489 6.702 4008777029313889152 108642 187.1589 26.2269 6.5563953951874859947904 107067 184.6507 23.1200 8.602 3960008294143258240 187.4205 24.5207 9.5014008571351920493440 107131 184.7584 26.0083 6.492 4009041083903247488 108976 187.7628 27.7303 8.4893953900747569804928 107168 184.8299 23.0346 6.307 4010969146262166144 109069 187.9606 29.3141 7.5274002172366045267072 107214 184.8681 24.2842 8.886 1518264342066234368 188.1294 35.3312 9.4674010203989248653184 107276 184.9609 28.4643 6.681 4010481375416160000 188.2525 27.7124 10.9254008525241151501824 107399 185.1898 25.7658 8.956 3958685993971916672 188.3333 22.4065 10.0994008553484856786048 185.3150 26.1539 11.144 3959212282084332544 109307 188.3925 24.2829 6.3284008227720176880384 107513 185.3614 24.9970 7.393 3960681298339257728 188.4254 25.9427 10.3124008706729289355520 107583 185.4542 26.5491 9.177 3955895055503655552 111154 191.7780 22.6168 8.2844009518100151157248 107611 185.4839 27.3095 8.454 3958022919740939904 111878 193.0483 25.3735 8.7873953625835302703488 107685 185.6031 22.4641 8.461 1464103808031348480 194.4035 28.9791 10.0714008433603729046784 107793 185.7849 25.8513 8.995 3956998690300563200 113037 195.1465 23.6517 8.1954008744250123486720 107877 185.9208 26.9799 8.312
A19, page 30 of 65
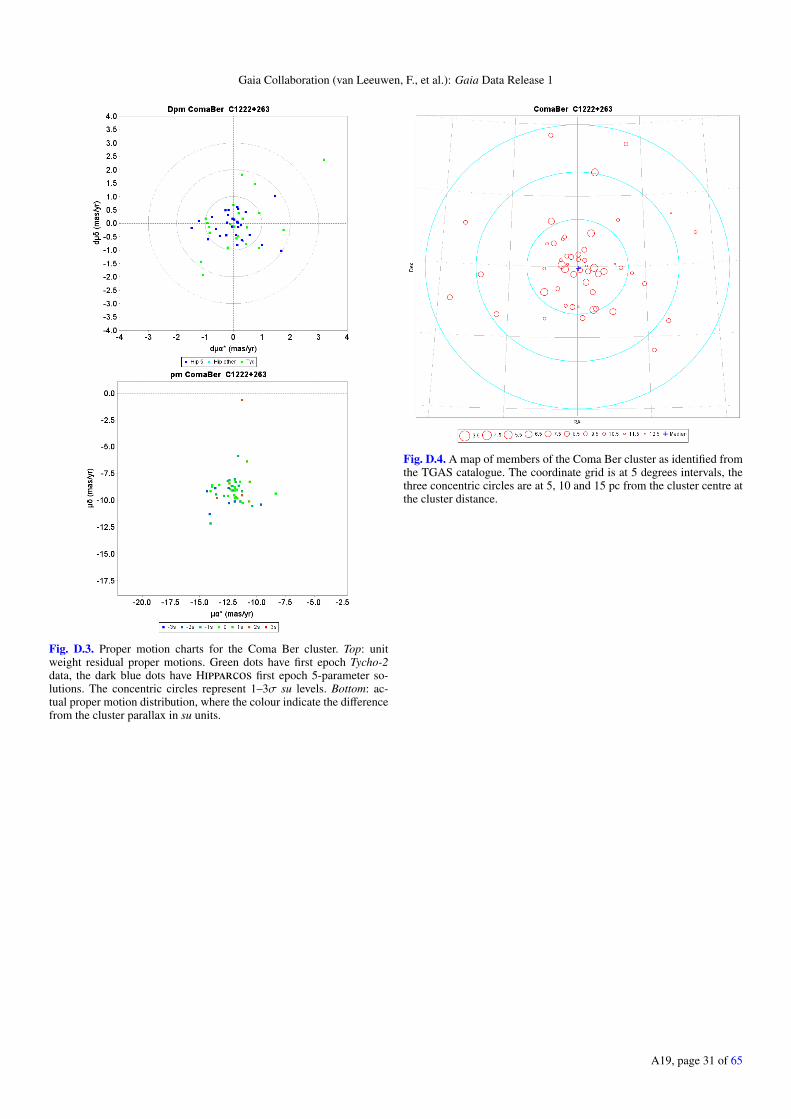
Gaia Collaboration (van Leeuwen, F., et al.): Gaia Data Release 1
Fig. D.3. Proper motion charts for the Coma Ber cluster. Top: unitweight residual proper motions. Green dots have first epoch Tycho-2data, the dark blue dots have Hipparcos first epoch 5-parameter so-lutions. The concentric circles represent 1–3σ su levels. Bottom: ac-tual proper motion distribution, where the colour indicate the differencefrom the cluster parallax in su units.
Fig. D.4. A map of members of the Coma Ber cluster as identified fromthe TGAS catalogue. The coordinate grid is at 5 degrees intervals, thethree concentric circles are at 5, 10 and 15 pc from the cluster centre atthe cluster distance.
A19, page 31 of 65
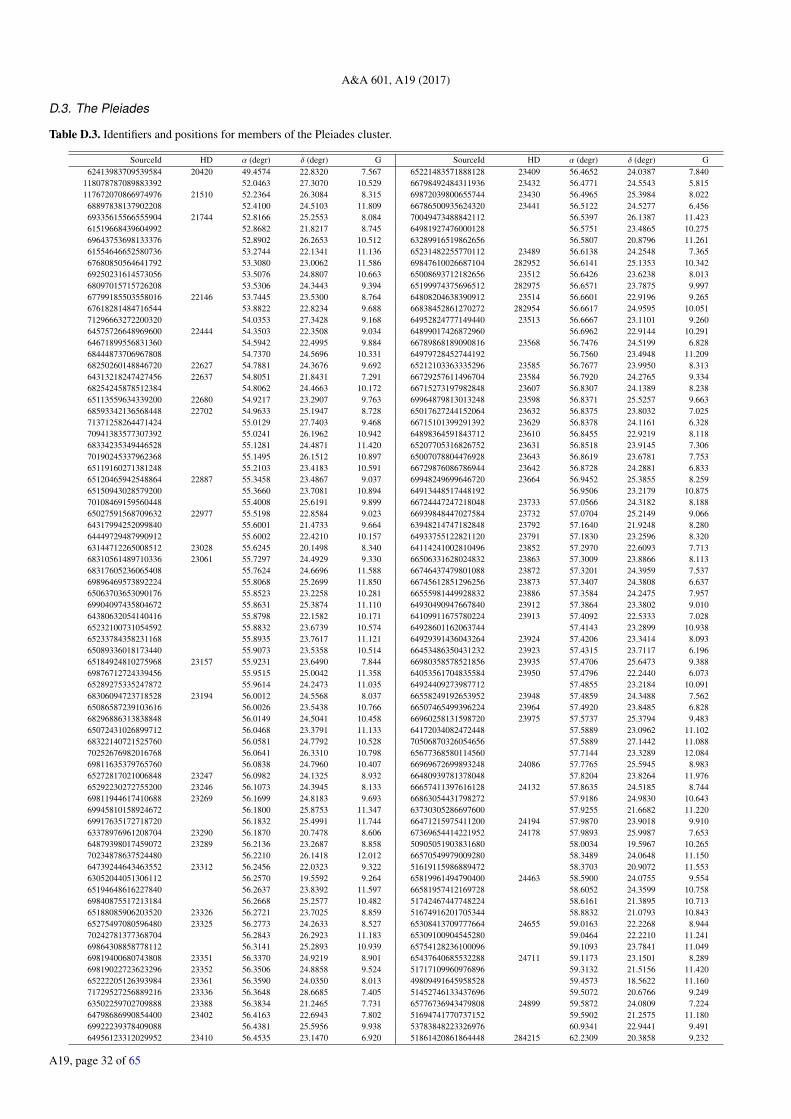
A&A 601, A19 (2017)
D.3. The Pleiades
Table D.3. Identifiers and positions for members of the Pleiades cluster.
SourceId HD α (degr) δ (degr) G SourceId HD α (degr) δ (degr) G62413983709539584 20420 49.4574 22.8320 7.567 65221483571888128 23409 56.4652 24.0387 7.840
118078787089883392 52.0463 27.3070 10.529 66798492484311936 23432 56.4771 24.5543 5.815117672070866974976 21510 52.2364 26.3084 8.315 69872039800655744 23430 56.4965 25.3984 8.02268897838137902208 52.4100 24.5103 11.809 66786500935624320 23441 56.5122 24.5277 6.45669335615566555904 21744 52.8166 25.2553 8.084 70049473488842112 56.5397 26.1387 11.42361519668439604992 52.8682 21.8217 8.745 64981927476000128 56.5751 23.4865 10.27569643753698133376 52.8902 26.2653 10.512 63289916519862656 56.5807 20.8796 11.26161554646652580736 53.2744 22.1341 11.136 65231482255770112 23489 56.6138 24.2548 7.36567680850564641792 53.3080 23.0062 11.586 69847610026687104 282952 56.6141 25.1353 10.34269250231614573056 53.5076 24.8807 10.663 65008693712182656 23512 56.6426 23.6238 8.01368097015715726208 53.5306 24.3443 9.394 65199974375696512 282975 56.6571 23.7875 9.99767799185503558016 22146 53.7445 23.5300 8.764 64808204638390912 23514 56.6601 22.9196 9.26567618281484716544 53.8822 22.8234 9.688 66838452861270272 282954 56.6617 24.9595 10.05171296663272200320 54.0353 27.3428 9.168 64952824777149440 23513 56.6667 23.1101 9.26064575726648969600 22444 54.3503 22.3508 9.034 64899017426872960 56.6962 22.9144 10.29164671899556831360 54.5942 22.4995 9.884 66789868189090816 23568 56.7476 24.5199 6.82868444873706967808 54.7370 24.5696 10.331 64979728452744192 56.7560 23.4948 11.20968250260148846720 22627 54.7881 24.3676 9.692 65212103363335296 23585 56.7677 23.9950 8.31364313218247427456 22637 54.8051 21.8431 7.291 66729257611496704 23584 56.7920 24.2765 9.33468254245878512384 54.8062 24.4663 10.172 66715273197982848 23607 56.8307 24.1389 8.23865113559634339200 22680 54.9217 23.2907 9.763 69964879813013248 23598 56.8371 25.5257 9.66368593342136568448 22702 54.9633 25.1947 8.728 65017627244152064 23632 56.8375 23.8032 7.02571371258264471424 55.0129 27.7403 9.468 66715101399291392 23629 56.8378 24.1161 6.32870941383577307392 55.0241 26.1962 10.942 64898364591843712 23610 56.8455 22.9219 8.11868334235349446528 55.1281 24.4871 11.420 65207705316826752 23631 56.8518 23.9145 7.30670190245337962368 55.1495 26.1512 10.897 65007078804476928 23643 56.8619 23.6781 7.75365119160271381248 55.2103 23.4183 10.591 66729876086786944 23642 56.8728 24.2881 6.83365120465942548864 22887 55.3458 23.4867 9.037 69948249699646720 23664 56.9452 25.3855 8.25965150943028579200 55.3660 23.7081 10.894 64913448517448192 56.9506 23.2179 10.87570108469159560448 55.4008 25.6191 9.899 66724447247218048 23733 57.0566 24.3182 8.18865027591568709632 22977 55.5198 22.8584 9.023 66939848447027584 23732 57.0704 25.2149 9.06664317994252099840 55.6001 21.4733 9.664 63948214747182848 23792 57.1640 21.9248 8.28064449729487990912 55.6002 22.4210 10.157 64933755122821120 23791 57.1830 23.2596 8.32063144712265008512 23028 55.6245 20.1498 8.340 64114241002810496 23852 57.2970 22.6093 7.71368310561489710336 23061 55.7297 24.4929 9.330 66506331628024832 23863 57.3009 23.8866 8.11368317605236065408 55.7624 24.6696 11.588 66746437479801088 23872 57.3201 24.3959 7.53769896469573892224 55.8068 25.2699 11.850 66745612851296256 23873 57.3407 24.3808 6.63765063703653090176 55.8523 23.2258 10.281 66555981449928832 23886 57.3584 24.2475 7.95769904097435804672 55.8631 25.3874 11.110 64930490947667840 23912 57.3864 23.3802 9.01064380632054140416 55.8798 22.1582 10.171 64109911675780224 23913 57.4092 22.5333 7.02865232100731054592 55.8832 23.6739 10.574 64928601162063744 57.4143 23.2899 10.93865233784358231168 55.8935 23.7617 11.121 64929391436043264 23924 57.4206 23.3414 8.09365089336018173440 55.9073 23.5358 10.514 66453486350431232 23923 57.4315 23.7117 6.19665184924810275968 23157 55.9231 23.6490 7.844 66980358578521856 23935 57.4706 25.6473 9.38869876712724339456 55.9515 25.0042 11.358 64053561704835584 23950 57.4796 22.2440 6.07365289275335247872 55.9614 24.2473 11.035 64924409273987712 57.4855 23.2184 10.09168306094723718528 23194 56.0012 24.5568 8.037 66558249192653952 23948 57.4859 24.3488 7.56265086587239103616 56.0026 23.5438 10.766 66507465499396224 23964 57.4920 23.8485 6.82868296886313838848 56.0149 24.5041 10.458 66960258131598720 23975 57.5737 25.3794 9.48365072431026899712 56.0468 23.3791 11.133 64172034082472448 57.5889 23.0962 11.10268322140721525760 56.0581 24.7792 10.528 70506870326054656 57.5889 27.1442 11.08870252676982016768 56.0641 26.3310 10.798 65677368580114560 57.7144 23.3289 12.08469811635379765760 56.0838 24.7960 10.407 66969672699893248 24086 57.7765 25.5945 8.98365272817021006848 23247 56.0982 24.1325 8.932 66480939781378048 57.8204 23.8264 11.97665292230272755200 23246 56.1073 24.3945 8.133 66657411397616128 24132 57.8635 24.5185 8.74469811944617410688 23269 56.1699 24.8183 9.693 66863054431798272 57.9186 24.9830 10.64369945810158924672 56.1800 25.8753 11.347 63730305286697600 57.9255 21.6682 11.22069917635172718720 56.1832 25.4991 11.744 66471215975411200 24194 57.9870 23.9018 9.91063378976961208704 23290 56.1870 20.7478 8.606 67369654414221952 24178 57.9893 25.9987 7.65364879398017459072 23289 56.2136 23.2687 8.858 50905051903831680 58.0034 19.5967 10.26570234878637524480 56.2210 26.1418 12.012 66570549979009280 58.3489 24.0648 11.15064739244643463552 23312 56.2456 22.0323 9.322 51619115986889472 58.3703 20.9072 11.55363052044051306112 56.2570 19.5592 9.264 65819961494790400 24463 58.5900 24.0755 9.55465194648616227840 56.2637 23.8392 11.597 66581957412169728 58.6052 24.3599 10.75869840875517213184 56.2668 25.2577 10.482 51742467447748224 58.6161 21.3895 10.71365188085906203520 23326 56.2721 23.7025 8.859 51674916201705344 58.8832 21.0793 10.84365275497080596480 23325 56.2773 24.2633 8.527 65308413709777664 24655 59.0163 22.2268 8.94470242781377368704 56.2843 26.2923 11.183 65309100904545280 59.0464 22.2210 11.24169864308858778112 56.3141 25.2893 10.939 65754128236100096 59.1093 23.7841 11.04969819400680743808 23351 56.3370 24.9219 8.901 65437640685532288 24711 59.1173 23.1501 8.28969819022723623296 23352 56.3506 24.8858 9.524 51717109960976896 59.3132 21.5156 11.42065222205126393984 23361 56.3590 24.0350 8.013 49809491645958528 59.4573 18.5622 11.16071729527256889216 23336 56.3648 28.6685 7.405 51452746133437696 59.5072 20.6766 9.24963502259702709888 23388 56.3834 21.2465 7.731 65776736943479808 24899 59.5872 24.0809 7.22464798686990854400 23402 56.4163 22.6943 7.802 51694741770737152 59.5902 21.2575 11.18069922239378409088 56.4381 25.5956 9.938 53783848223326976 60.9341 22.9441 9.49164956123312029952 23410 56.4535 23.1470 6.920 51861420861864448 284215 62.2309 20.3858 9.232
A19, page 32 of 65
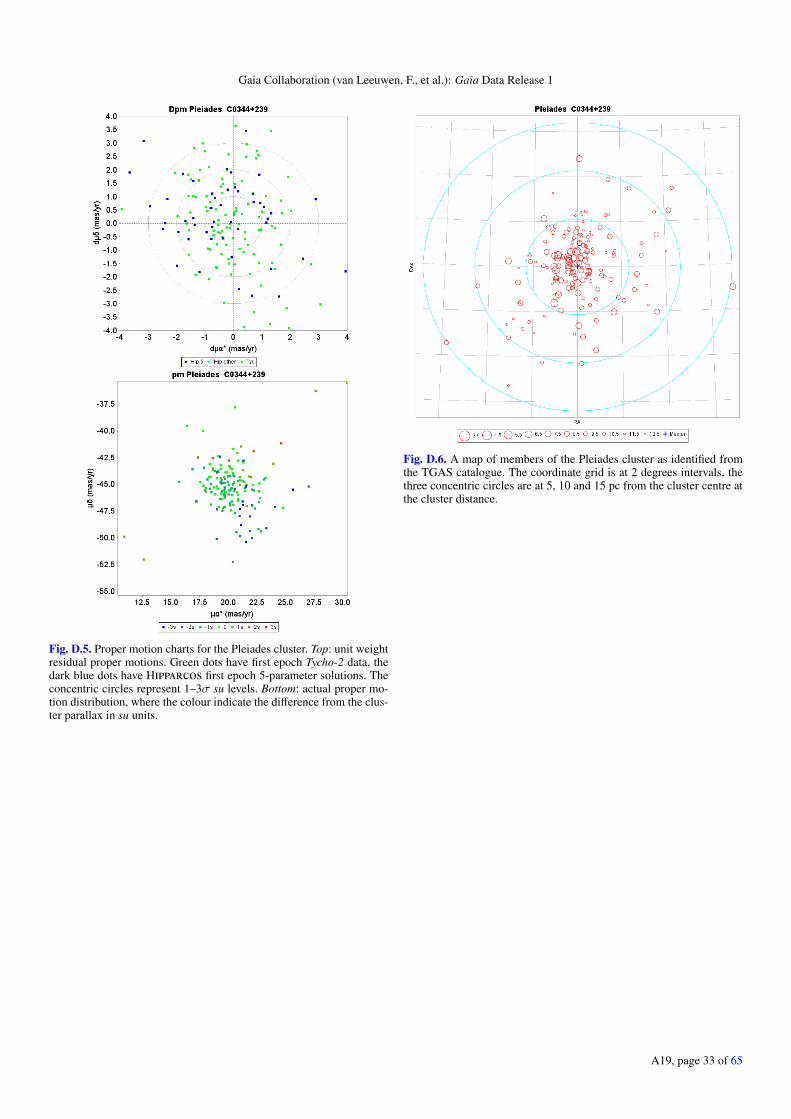
Gaia Collaboration (van Leeuwen, F., et al.): Gaia Data Release 1
Fig. D.5. Proper motion charts for the Pleiades cluster. Top: unit weightresidual proper motions. Green dots have first epoch Tycho-2 data, thedark blue dots have Hipparcos first epoch 5-parameter solutions. Theconcentric circles represent 1–3σ su levels. Bottom: actual proper mo-tion distribution, where the colour indicate the difference from the clus-ter parallax in su units.
Fig. D.6. A map of members of the Pleiades cluster as identified fromthe TGAS catalogue. The coordinate grid is at 2 degrees intervals, thethree concentric circles are at 5, 10 and 15 pc from the cluster centre atthe cluster distance.
A19, page 33 of 65
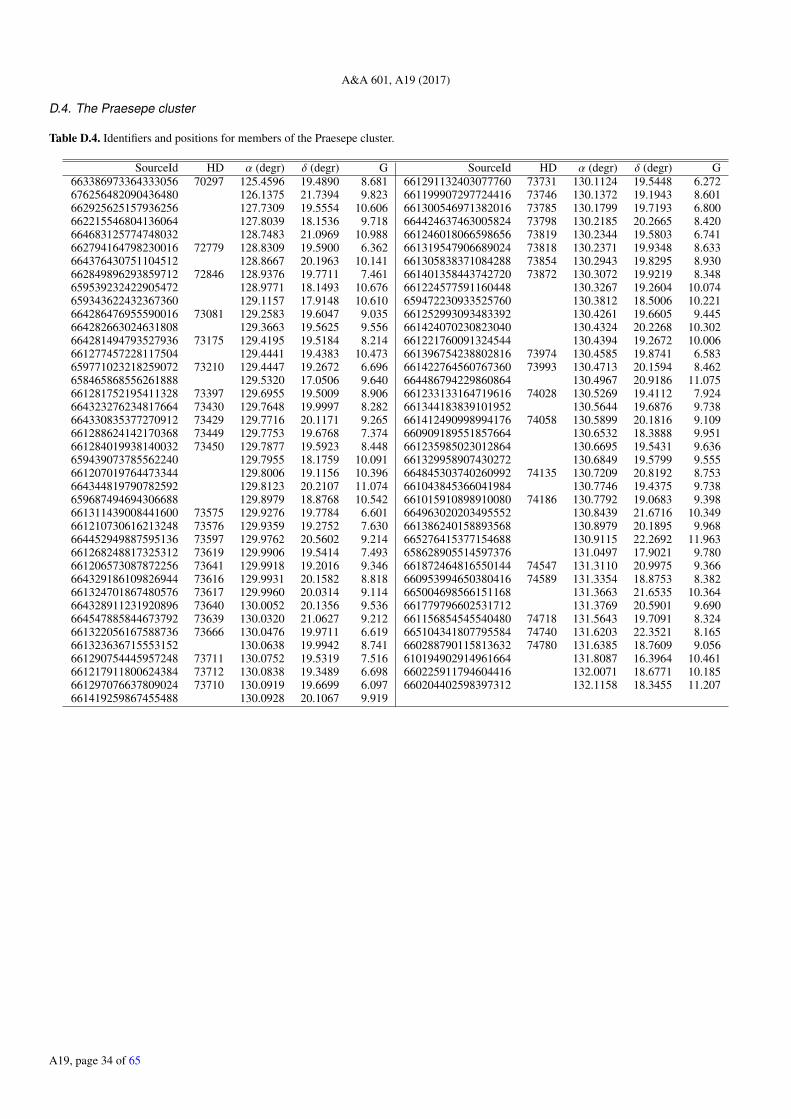
A&A 601, A19 (2017)
D.4. The Praesepe cluster
Table D.4. Identifiers and positions for members of the Praesepe cluster.
SourceId HD α (degr) δ (degr) G SourceId HD α (degr) δ (degr) G663386973364333056 70297 125.4596 19.4890 8.681 661291132403077760 73731 130.1124 19.5448 6.272676256482090436480 126.1375 21.7394 9.823 661199907297724416 73746 130.1372 19.1943 8.601662925625157936256 127.7309 19.5554 10.606 661300546971382016 73785 130.1799 19.7193 6.800662215546804136064 127.8039 18.1536 9.718 664424637463005824 73798 130.2185 20.2665 8.420664683125774748032 128.7483 21.0969 10.988 661246018066598656 73819 130.2344 19.5803 6.741662794164798230016 72779 128.8309 19.5900 6.362 661319547906689024 73818 130.2371 19.9348 8.633664376430751104512 128.8667 20.1963 10.141 661305838371084288 73854 130.2943 19.8295 8.930662849896293859712 72846 128.9376 19.7711 7.461 661401358443742720 73872 130.3072 19.9219 8.348659539232422905472 128.9771 18.1493 10.676 661224577591160448 130.3267 19.2604 10.074659343622432367360 129.1157 17.9148 10.610 659472230933525760 130.3812 18.5006 10.221664286476955590016 73081 129.2583 19.6047 9.035 661252993093483392 130.4261 19.6605 9.445664282663024631808 129.3663 19.5625 9.556 661424070230823040 130.4324 20.2268 10.302664281494793527936 73175 129.4195 19.5184 8.214 661221760091324544 130.4394 19.2672 10.006661277457228117504 129.4441 19.4383 10.473 661396754238802816 73974 130.4585 19.8741 6.583659771023218259072 73210 129.4447 19.2672 6.696 661422764560767360 73993 130.4713 20.1594 8.462658465868556261888 129.5320 17.0506 9.640 664486794229860864 130.4967 20.9186 11.075661281752195411328 73397 129.6955 19.5009 8.906 661233133164719616 74028 130.5269 19.4112 7.924664323276234817664 73430 129.7648 19.9997 8.282 661344183839101952 130.5644 19.6876 9.738664330835377270912 73429 129.7716 20.1171 9.265 661412490998994176 74058 130.5899 20.1816 9.109661288624142170368 73449 129.7753 19.6768 7.374 660909189551857664 130.6532 18.3888 9.951661284019938140032 73450 129.7877 19.5923 8.448 661235985023012864 130.6695 19.5431 9.636659439073785562240 129.7955 18.1759 10.091 661329958907430272 130.6849 19.5799 9.555661207019764473344 129.8006 19.1156 10.396 664845303740260992 74135 130.7209 20.8192 8.753664344819790782592 129.8123 20.2107 11.074 661043845366041984 130.7746 19.4375 9.738659687494694306688 129.8979 18.8768 10.542 661015910898910080 74186 130.7792 19.0683 9.398661311439008441600 73575 129.9276 19.7784 6.601 664963020203495552 130.8439 21.6716 10.349661210730616213248 73576 129.9359 19.2752 7.630 661386240158893568 130.8979 20.1895 9.968664452949887595136 73597 129.9762 20.5602 9.214 665276415377154688 130.9115 22.2692 11.963661268248817325312 73619 129.9906 19.5414 7.493 658628905514597376 131.0497 17.9021 9.780661206573087872256 73641 129.9918 19.2016 9.346 661872464816550144 74547 131.3110 20.9975 9.366664329186109826944 73616 129.9931 20.1582 8.818 660953994650380416 74589 131.3354 18.8753 8.382661324701867480576 73617 129.9960 20.0314 9.114 665004698566151168 131.3663 21.6535 10.364664328911231920896 73640 130.0052 20.1356 9.536 661779796602531712 131.3769 20.5901 9.690664547885844673792 73639 130.0320 21.0627 9.212 661156854545540480 74718 131.5643 19.7091 8.324661322056167588736 73666 130.0476 19.9711 6.619 665104341807795584 74740 131.6203 22.3521 8.165661323636715553152 130.0638 19.9942 8.741 660288790115813632 74780 131.6385 18.7609 9.056661290754445957248 73711 130.0752 19.5319 7.516 610194902914961664 131.8087 16.3964 10.461661217911800624384 73712 130.0838 19.3489 6.698 660225911794604416 132.0071 18.6771 10.185661297076637809024 73710 130.0919 19.6699 6.097 660204402598397312 132.1158 18.3455 11.207661419259867455488 130.0928 20.1067 9.919
A19, page 34 of 65
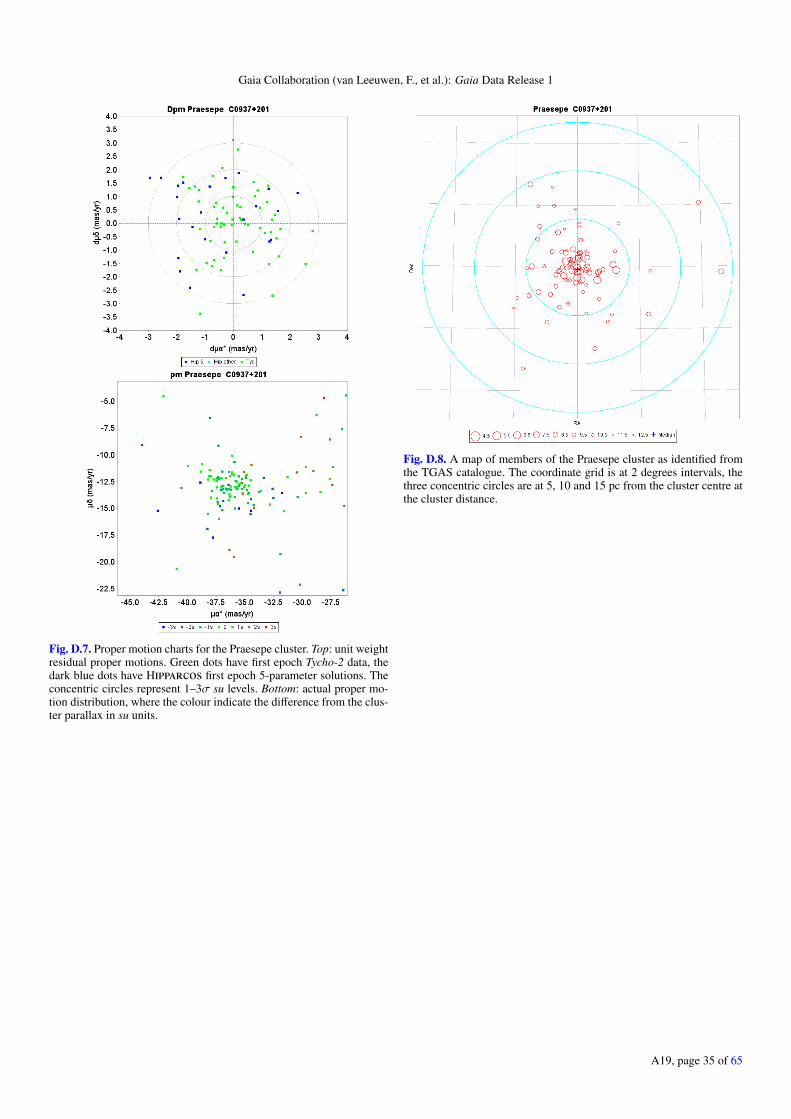
Gaia Collaboration (van Leeuwen, F., et al.): Gaia Data Release 1
Fig. D.7. Proper motion charts for the Praesepe cluster. Top: unit weightresidual proper motions. Green dots have first epoch Tycho-2 data, thedark blue dots have Hipparcos first epoch 5-parameter solutions. Theconcentric circles represent 1–3σ su levels. Bottom: actual proper mo-tion distribution, where the colour indicate the difference from the clus-ter parallax in su units.
Fig. D.8. A map of members of the Praesepe cluster as identified fromthe TGAS catalogue. The coordinate grid is at 2 degrees intervals, thethree concentric circles are at 5, 10 and 15 pc from the cluster centre atthe cluster distance.
A19, page 35 of 65
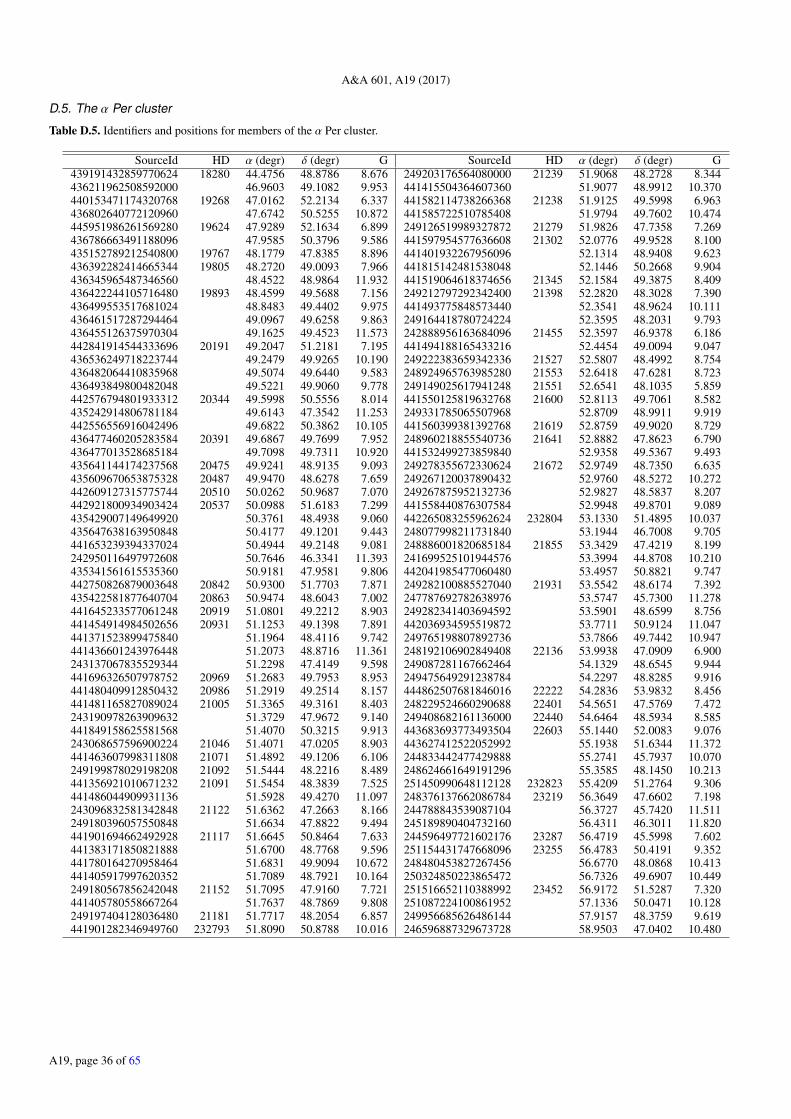
A&A 601, A19 (2017)
D.5. The α Per cluster
Table D.5. Identifiers and positions for members of the α Per cluster.
SourceId HD α (degr) δ (degr) G SourceId HD α (degr) δ (degr) G439191432859770624 18280 44.4756 48.8786 8.676 249203176564080000 21239 51.9068 48.2728 8.344436211962508592000 46.9603 49.1082 9.953 441415504364607360 51.9077 48.9912 10.370440153471174320768 19268 47.0162 52.2134 6.337 441582114738266368 21238 51.9125 49.5998 6.963436802640772120960 47.6742 50.5255 10.872 441585722510785408 51.9794 49.7602 10.474445951986261569280 19624 47.9289 52.1634 6.899 249126519989327872 21279 51.9826 47.7358 7.269436786663491188096 47.9585 50.3796 9.586 441597954577636608 21302 52.0776 49.9528 8.100435152789212540800 19767 48.1779 47.8385 8.896 441401932267956096 52.1314 48.9408 9.623436392282414665344 19805 48.2720 49.0093 7.966 441815142481538048 52.1446 50.2668 9.904436345965487346560 48.4522 48.9864 11.932 441519064618374656 21345 52.1584 49.3875 8.409436422244105716480 19893 48.4599 49.5688 7.156 249212797292342400 21398 52.2820 48.3028 7.390436499553517681024 48.8483 49.4402 9.975 441493775848573440 52.3541 48.9624 10.111436461517287294464 49.0967 49.6258 9.863 249164418780724224 52.3595 48.2031 9.793436455126375970304 49.1625 49.4523 11.573 242888956163684096 21455 52.3597 46.9378 6.186442841914544333696 20191 49.2047 51.2181 7.195 441494188165433216 52.4454 49.0094 9.047436536249718223744 49.2479 49.9265 10.190 249222383659342336 21527 52.5807 48.4992 8.754436482064410835968 49.5074 49.6440 9.583 248924965763985280 21553 52.6418 47.6281 8.723436493849800482048 49.5221 49.9060 9.778 249149025617941248 21551 52.6541 48.1035 5.859442576794801933312 20344 49.5998 50.5556 8.014 441550125819632768 21600 52.8113 49.7061 8.582435242914806781184 49.6143 47.3542 11.253 249331785065507968 52.8709 48.9911 9.919442556556916042496 49.6822 50.3862 10.105 441560399381392768 21619 52.8759 49.9020 8.729436477460205283584 20391 49.6867 49.7699 7.952 248960218855540736 21641 52.8882 47.8623 6.790436477013528685184 49.7098 49.7311 10.920 441532499273859840 52.9358 49.5367 9.493435641144174237568 20475 49.9241 48.9135 9.093 249278355672330624 21672 52.9749 48.7350 6.635435609670653875328 20487 49.9470 48.6278 7.659 249267120037890432 52.9760 48.5272 10.272442609127315775744 20510 50.0262 50.9687 7.070 249267875952132736 52.9827 48.5837 8.207442921800934903424 20537 50.0988 51.6183 7.299 441558440876307584 52.9948 49.8701 9.089435429007149649920 50.3761 48.4938 9.060 442265083255962624 232804 53.1330 51.4895 10.037435647638163950848 50.4177 49.1201 9.443 248077998211731840 53.1944 46.7008 9.705441653239394337024 50.4944 49.2148 9.081 248886001820685184 21855 53.3429 47.4219 8.199242950116497972608 50.7646 46.3341 11.393 241699525101944576 53.3994 44.8708 10.210435341561615535360 50.9181 47.9581 9.806 442041985477060480 53.4957 50.8821 9.747442750826879003648 20842 50.9300 51.7703 7.871 249282100885527040 21931 53.5542 48.6174 7.392435422581877640704 20863 50.9474 48.6043 7.002 247787692782638976 53.5747 45.7300 11.278441645233577061248 20919 51.0801 49.2212 8.903 249282341403694592 53.5901 48.6599 8.756441454914984502656 20931 51.1253 49.1398 7.891 442036934595519872 53.7711 50.9124 11.047441371523899475840 51.1964 48.4116 9.742 249765198807892736 53.7866 49.7442 10.947441436601243976448 51.2073 48.8716 11.361 248192106902849408 22136 53.9938 47.0909 6.900243137067835529344 51.2298 47.4149 9.598 249087281167662464 54.1329 48.6545 9.944441696326507978752 20969 51.2683 49.7953 8.953 249475649291238784 54.2297 48.8285 9.916441480409912850432 20986 51.2919 49.2514 8.157 444862507681846016 22222 54.2836 53.9832 8.456441481165827089024 21005 51.3365 49.3161 8.403 248229524660290688 22401 54.5651 47.5769 7.472243190978263909632 51.3729 47.9672 9.140 249408682161136000 22440 54.6464 48.5934 8.585441849158625581568 51.4070 50.3215 9.913 443683693773493504 22603 55.1440 52.0083 9.076243068657596900224 21046 51.4071 47.0205 8.903 443627412522052992 55.1938 51.6344 11.372441463607998311808 21071 51.4892 49.1206 6.106 244833442477429888 55.2741 45.7937 10.070249199878029198208 21092 51.5444 48.2216 8.489 248624661649191296 55.3585 48.1450 10.213441356921010671232 21091 51.5454 48.3839 7.525 251450990648112128 232823 55.4209 51.2764 9.306441486044909931136 51.5928 49.4270 11.097 248376137662086784 23219 56.3649 47.6602 7.198243096832581342848 21122 51.6362 47.2663 8.166 244788843539087104 56.3727 45.7420 11.511249180396057550848 51.6634 47.8822 9.494 245189890404732160 56.4311 46.3011 11.820441901694662492928 21117 51.6645 50.8464 7.633 244596497721602176 23287 56.4719 45.5998 7.602441383171850821888 51.6700 48.7768 9.596 251154431747668096 23255 56.4783 50.4191 9.352441780164270958464 51.6831 49.9094 10.672 248480453827267456 56.6770 48.0868 10.413441405917997620352 51.7089 48.7921 10.164 250324850223865472 56.7326 49.6907 10.449249180567856242048 21152 51.7095 47.9160 7.721 251516652110388992 23452 56.9172 51.5287 7.320441405780558667264 51.7637 48.7869 9.808 251087224100861952 57.1336 50.0471 10.128249197404128036480 21181 51.7717 48.2054 6.857 249956685626486144 57.9157 48.3759 9.619441901282346949760 232793 51.8090 50.8788 10.016 246596887329673728 58.9503 47.0402 10.480
A19, page 36 of 65
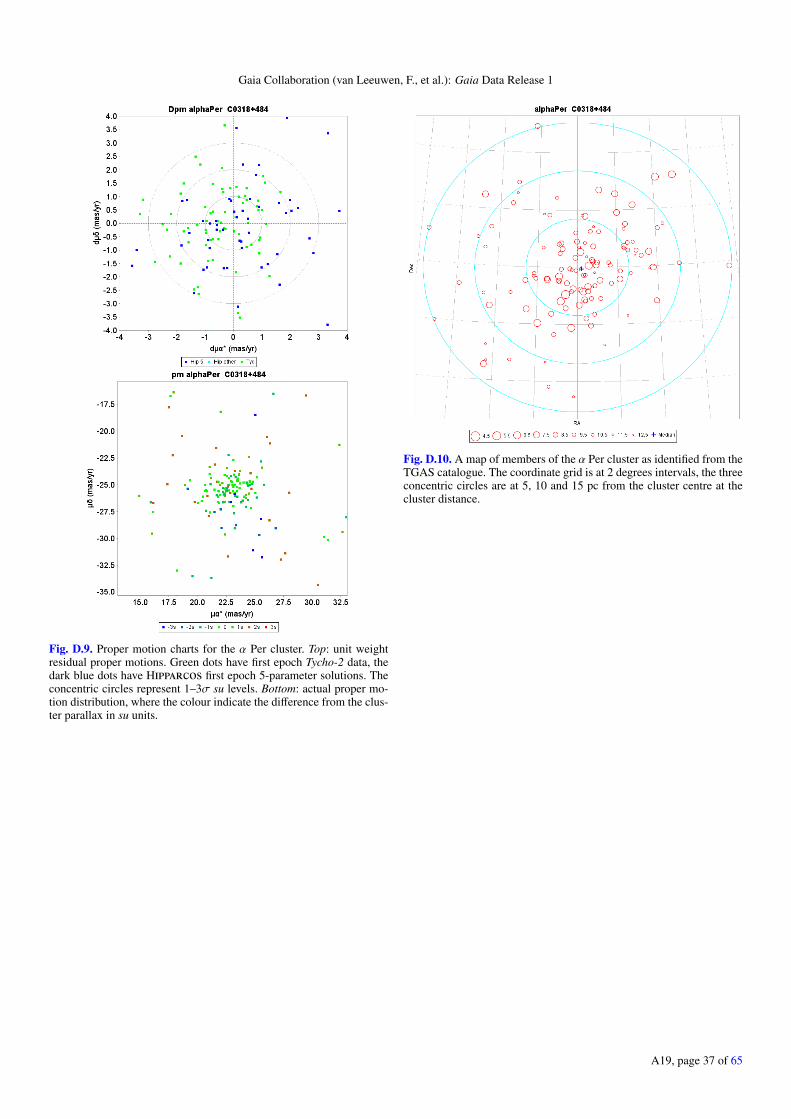
Gaia Collaboration (van Leeuwen, F., et al.): Gaia Data Release 1
Fig. D.9. Proper motion charts for the α Per cluster. Top: unit weightresidual proper motions. Green dots have first epoch Tycho-2 data, thedark blue dots have Hipparcos first epoch 5-parameter solutions. Theconcentric circles represent 1–3σ su levels. Bottom: actual proper mo-tion distribution, where the colour indicate the difference from the clus-ter parallax in su units.
Fig. D.10. A map of members of the α Per cluster as identified from theTGAS catalogue. The coordinate grid is at 2 degrees intervals, the threeconcentric circles are at 5, 10 and 15 pc from the cluster centre at thecluster distance.
A19, page 37 of 65
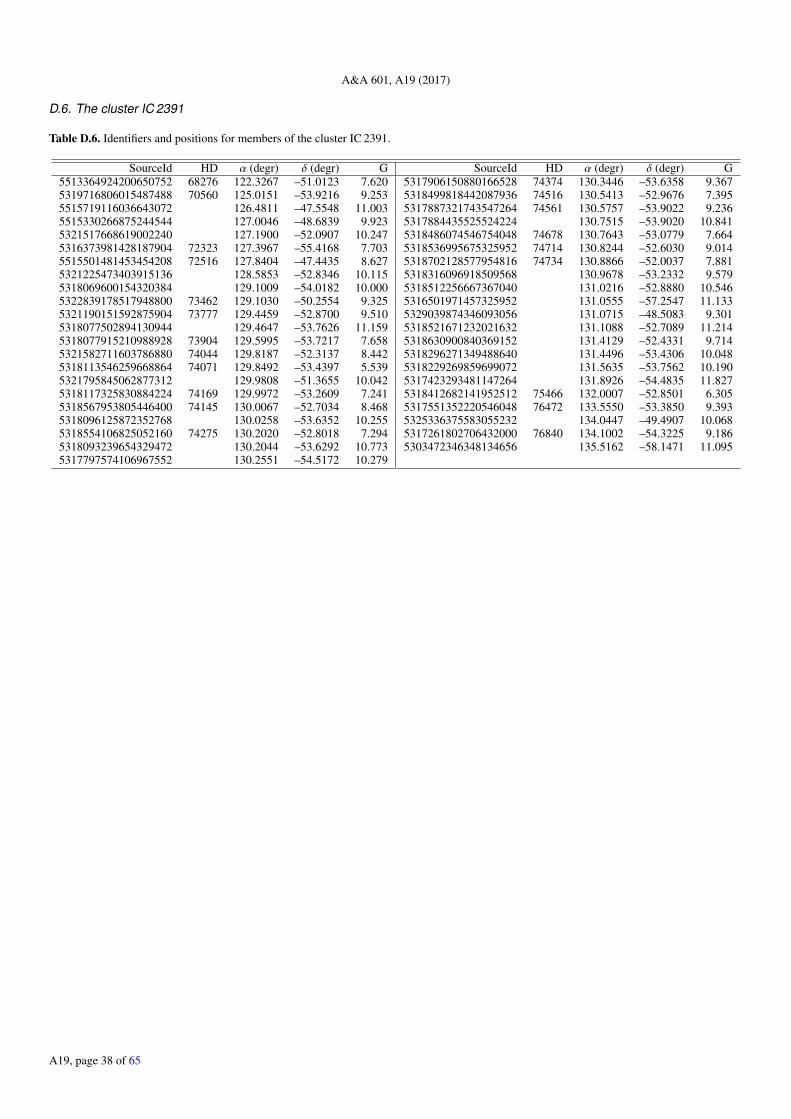
A&A 601, A19 (2017)
D.6. The cluster IC 2391
Table D.6. Identifiers and positions for members of the cluster IC 2391.
SourceId HD α (degr) δ (degr) G SourceId HD α (degr) δ (degr) G5513364924200650752 68276 122.3267 –51.0123 7.620 5317906150880166528 74374 130.3446 –53.6358 9.3675319716806015487488 70560 125.0151 –53.9216 9.253 5318499818442087936 74516 130.5413 –52.9676 7.3955515719116036643072 126.4811 –47.5548 11.003 5317887321743547264 74561 130.5757 –53.9022 9.2365515330266875244544 127.0046 –48.6839 9.923 5317884435525524224 130.7515 –53.9020 10.8415321517668619002240 127.1900 –52.0907 10.247 5318486074546754048 74678 130.7643 –53.0779 7.6645316373981428187904 72323 127.3967 –55.4168 7.703 5318536995675325952 74714 130.8244 –52.6030 9.0145515501481453454208 72516 127.8404 –47.4435 8.627 5318702128577954816 74734 130.8866 –52.0037 7.8815321225473403915136 128.5853 –52.8346 10.115 5318316096918509568 130.9678 –53.2332 9.5795318069600154320384 129.1009 –54.0182 10.000 5318512256667367040 131.0216 –52.8880 10.5465322839178517948800 73462 129.1030 –50.2554 9.325 5316501971457325952 131.0555 –57.2547 11.1335321190151592875904 73777 129.4459 –52.8700 9.510 5329039874346093056 131.0715 –48.5083 9.3015318077502894130944 129.4647 –53.7626 11.159 5318521671232021632 131.1088 –52.7089 11.2145318077915210988928 73904 129.5995 –53.7217 7.658 5318630900840369152 131.4129 –52.4331 9.7145321582711603786880 74044 129.8187 –52.3137 8.442 5318296271349488640 131.4496 –53.4306 10.0485318113546259668864 74071 129.8492 –53.4397 5.539 5318229269859699072 131.5635 –53.7562 10.1905321795845062877312 129.9808 –51.3655 10.042 5317423293481147264 131.8926 –54.4835 11.8275318117325830884224 74169 129.9972 –53.2609 7.241 5318412682141952512 75466 132.0007 –52.8501 6.3055318567953805446400 74145 130.0067 –52.7034 8.468 5317551352220546048 76472 133.5550 –53.3850 9.3935318096125872352768 130.0258 –53.6352 10.255 5325336375583055232 134.0447 –49.4907 10.0685318554106825052160 74275 130.2020 –52.8018 7.294 5317261802706432000 76840 134.1002 –54.3225 9.1865318093239654329472 130.2044 –53.6292 10.773 5303472346348134656 135.5162 –58.1471 11.0955317797574106967552 130.2551 –54.5172 10.279
A19, page 38 of 65
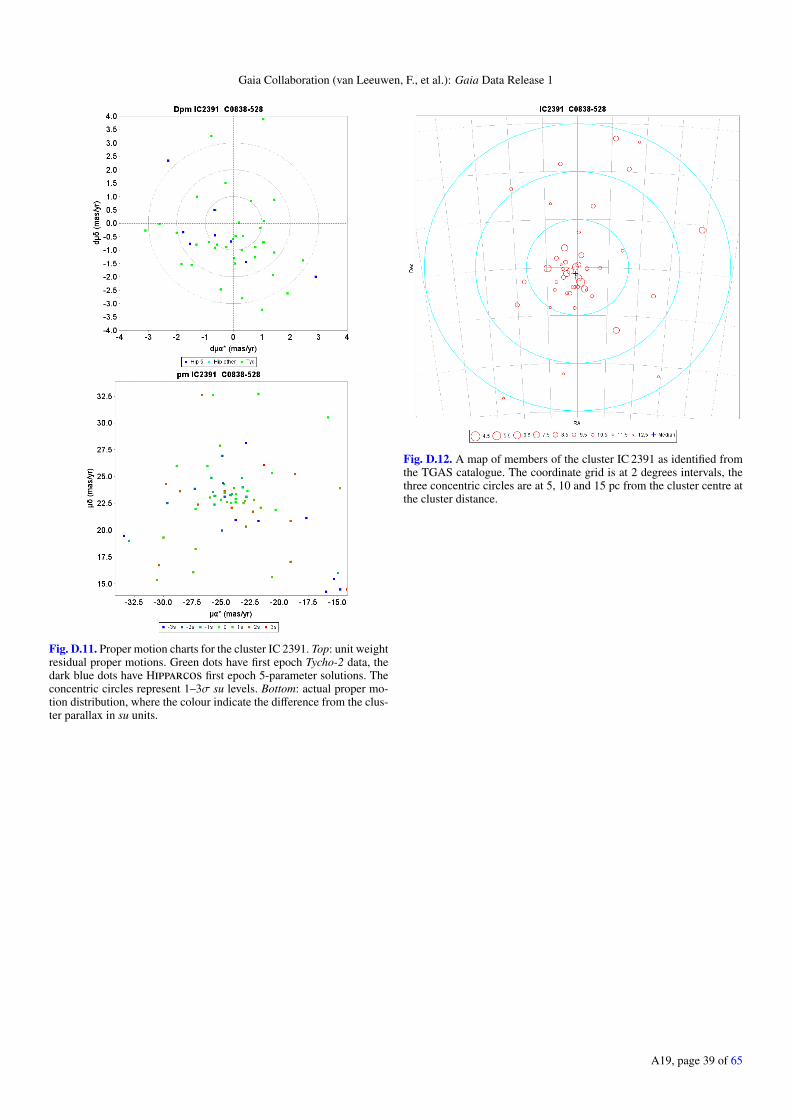
Gaia Collaboration (van Leeuwen, F., et al.): Gaia Data Release 1
Fig. D.11. Proper motion charts for the cluster IC 2391. Top: unit weightresidual proper motions. Green dots have first epoch Tycho-2 data, thedark blue dots have Hipparcos first epoch 5-parameter solutions. Theconcentric circles represent 1–3σ su levels. Bottom: actual proper mo-tion distribution, where the colour indicate the difference from the clus-ter parallax in su units.
Fig. D.12. A map of members of the cluster IC 2391 as identified fromthe TGAS catalogue. The coordinate grid is at 2 degrees intervals, thethree concentric circles are at 5, 10 and 15 pc from the cluster centre atthe cluster distance.
A19, page 39 of 65
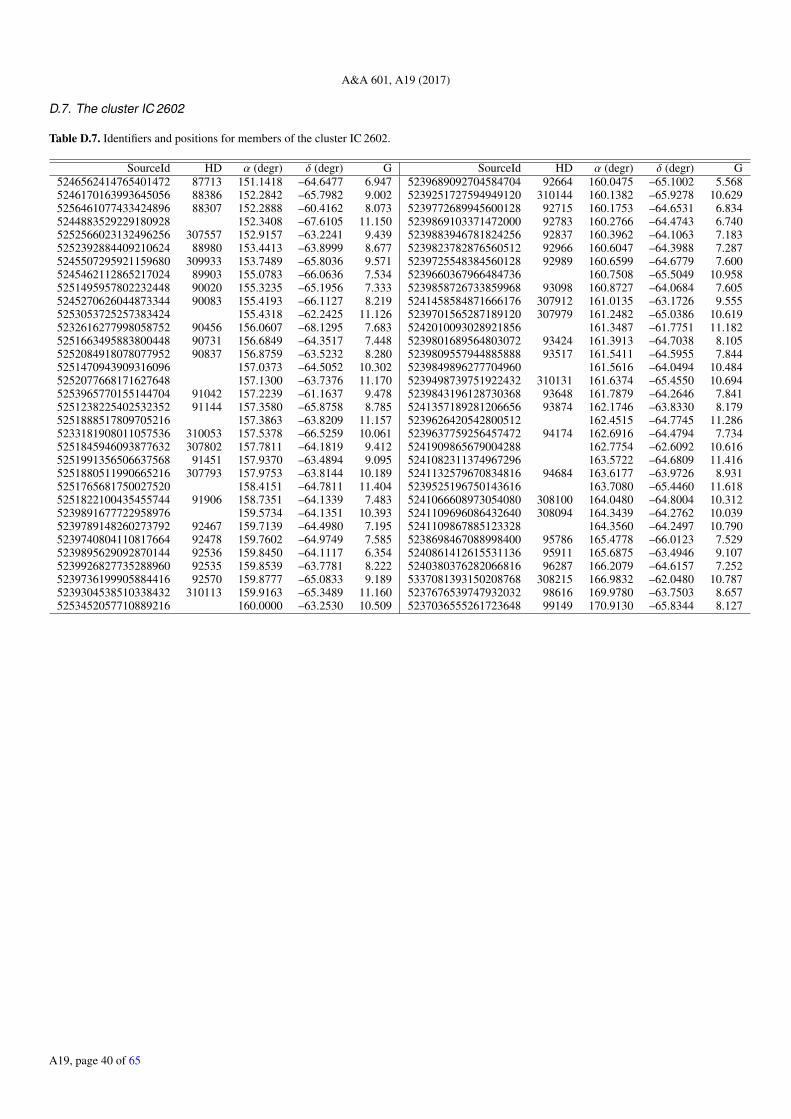
A&A 601, A19 (2017)
D.7. The cluster IC 2602
Table D.7. Identifiers and positions for members of the cluster IC 2602.
SourceId HD α (degr) δ (degr) G SourceId HD α (degr) δ (degr) G5246562414765401472 87713 151.1418 –64.6477 6.947 5239689092704584704 92664 160.0475 –65.1002 5.5685246170163993645056 88386 152.2842 –65.7982 9.002 5239251727594949120 310144 160.1382 –65.9278 10.6295256461077433424896 88307 152.2888 –60.4162 8.073 5239772689945600128 92715 160.1753 –64.6531 6.8345244883529229180928 152.3408 –67.6105 11.150 5239869103371472000 92783 160.2766 –64.4743 6.7405252566023132496256 307557 152.9157 –63.2241 9.439 5239883946781824256 92837 160.3962 –64.1063 7.1835252392884409210624 88980 153.4413 –63.8999 8.677 5239823782876560512 92966 160.6047 –64.3988 7.2875245507295921159680 309933 153.7489 –65.8036 9.571 5239725548384560128 92989 160.6599 –64.6779 7.6005245462112865217024 89903 155.0783 –66.0636 7.534 5239660367966484736 160.7508 –65.5049 10.9585251495957802232448 90020 155.3235 –65.1956 7.333 5239858726733859968 93098 160.8727 –64.0684 7.6055245270626044873344 90083 155.4193 –66.1127 8.219 5241458584871666176 307912 161.0135 –63.1726 9.5555253053725257383424 155.4318 –62.2425 11.126 5239701565287189120 307979 161.2482 –65.0386 10.6195232616277998058752 90456 156.0607 –68.1295 7.683 5242010093028921856 161.3487 –61.7751 11.1825251663495883800448 90731 156.6849 –64.3517 7.448 5239801689564803072 93424 161.3913 –64.7038 8.1055252084918078077952 90837 156.8759 –63.5232 8.280 5239809557944885888 93517 161.5411 –64.5955 7.8445251470943909316096 157.0373 –64.5052 10.302 5239849896277704960 161.5616 –64.0494 10.4845252077668171627648 157.1300 –63.7376 11.170 5239498739751922432 310131 161.6374 –65.4550 10.6945253965770155144704 91042 157.2239 –61.1637 9.478 5239843196128730368 93648 161.7879 –64.2646 7.8415251238225402532352 91144 157.3580 –65.8758 8.785 5241357189281206656 93874 162.1746 –63.8330 8.1795251888517809705216 157.3863 –63.8209 11.157 5239626420542800512 162.4515 –64.7745 11.2865233181908011057536 310053 157.5378 –66.5259 10.061 5239637759256457472 94174 162.6916 –64.4794 7.7345251845946093877632 307802 157.7811 –64.1819 9.412 5241909865679004288 162.7754 –62.6092 10.6165251991356506637568 91451 157.9370 –63.4894 9.095 5241082311374967296 163.5722 –64.6809 11.4165251880511990665216 307793 157.9753 –63.8144 10.189 5241132579670834816 94684 163.6177 –63.9726 8.9315251765681750027520 158.4151 –64.7811 11.404 5239525196750143616 163.7080 –65.4460 11.6185251822100435455744 91906 158.7351 –64.1339 7.483 5241066608973054080 308100 164.0480 –64.8004 10.3125239891677722958976 159.5734 –64.1351 10.393 5241109696086432640 308094 164.3439 –64.2762 10.0395239789148260273792 92467 159.7139 –64.4980 7.195 5241109867885123328 164.3560 –64.2497 10.7905239740804110817664 92478 159.7602 –64.9749 7.585 5238698467088998400 95786 165.4778 –66.0123 7.5295239895629092870144 92536 159.8450 –64.1117 6.354 5240861412615531136 95911 165.6875 –63.4946 9.1075239926827735288960 92535 159.8539 –63.7781 8.222 5240380376282066816 96287 166.2079 –64.6157 7.2525239736199905884416 92570 159.8777 –65.0833 9.189 5337081393150208768 308215 166.9832 –62.0480 10.7875239304538510338432 310113 159.9163 –65.3489 11.160 5237676539747932032 98616 169.9780 –63.7503 8.6575253452057710889216 160.0000 –63.2530 10.509 5237036555261723648 99149 170.9130 –65.8344 8.127
A19, page 40 of 65
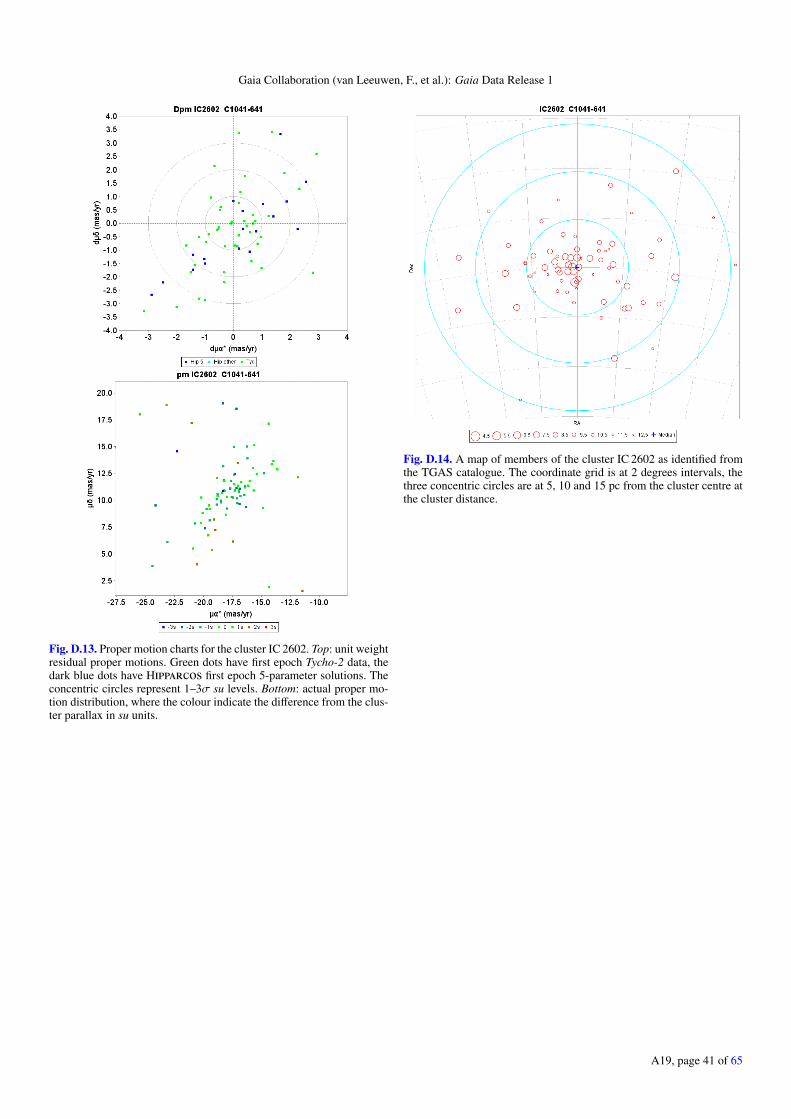
Gaia Collaboration (van Leeuwen, F., et al.): Gaia Data Release 1
Fig. D.13. Proper motion charts for the cluster IC 2602. Top: unit weightresidual proper motions. Green dots have first epoch Tycho-2 data, thedark blue dots have Hipparcos first epoch 5-parameter solutions. Theconcentric circles represent 1–3σ su levels. Bottom: actual proper mo-tion distribution, where the colour indicate the difference from the clus-ter parallax in su units.
Fig. D.14. A map of members of the cluster IC 2602 as identified fromthe TGAS catalogue. The coordinate grid is at 2 degrees intervals, thethree concentric circles are at 5, 10 and 15 pc from the cluster centre atthe cluster distance.
A19, page 41 of 65
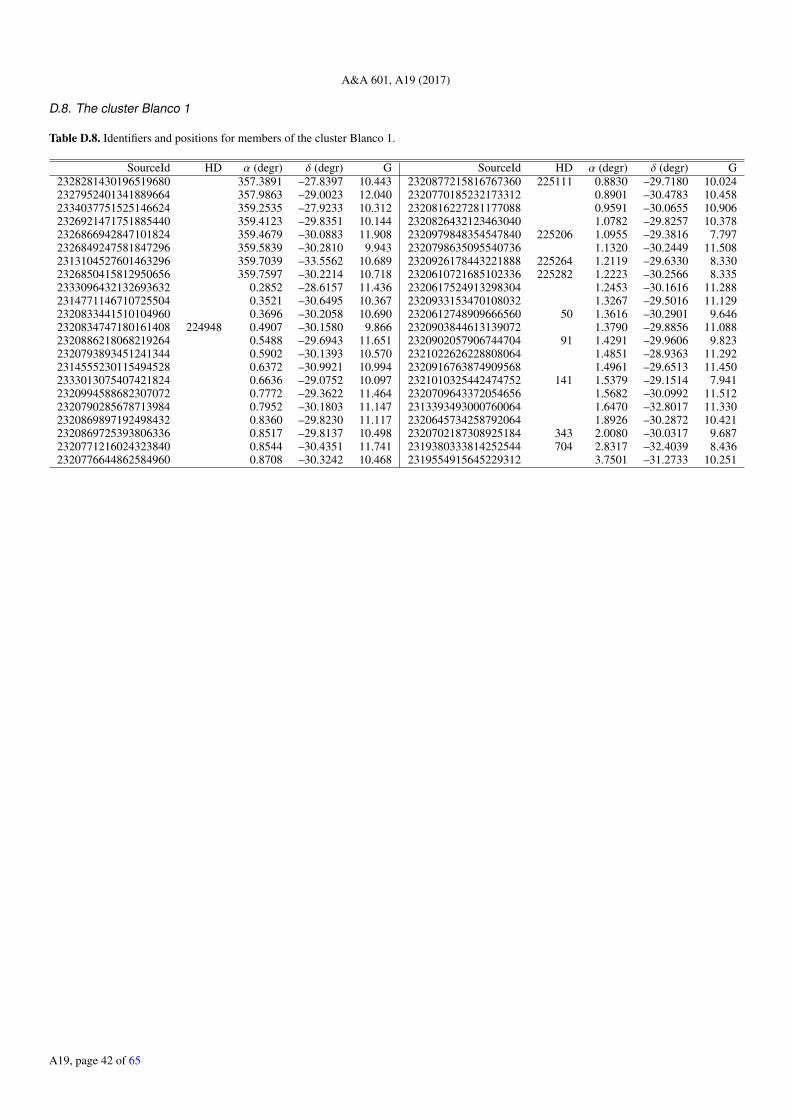
A&A 601, A19 (2017)
D.8. The cluster Blanco 1
Table D.8. Identifiers and positions for members of the cluster Blanco 1.
SourceId HD α (degr) δ (degr) G SourceId HD α (degr) δ (degr) G2328281430196519680 357.3891 –27.8397 10.443 2320877215816767360 225111 0.8830 –29.7180 10.0242327952401341889664 357.9863 –29.0023 12.040 2320770185232173312 0.8901 –30.4783 10.4582334037751525146624 359.2535 –27.9233 10.312 2320816227281177088 0.9591 –30.0655 10.9062326921471751885440 359.4123 –29.8351 10.144 2320826432123463040 1.0782 –29.8257 10.3782326866942847101824 359.4679 –30.0883 11.908 2320979848354547840 225206 1.0955 –29.3816 7.7972326849247581847296 359.5839 –30.2810 9.943 2320798635095540736 1.1320 –30.2449 11.5082313104527601463296 359.7039 –33.5562 10.689 2320926178443221888 225264 1.2119 –29.6330 8.3302326850415812950656 359.7597 –30.2214 10.718 2320610721685102336 225282 1.2223 –30.2566 8.3352333096432132693632 0.2852 –28.6157 11.436 2320617524913298304 1.2453 –30.1616 11.2882314771146710725504 0.3521 –30.6495 10.367 2320933153470108032 1.3267 –29.5016 11.1292320833441510104960 0.3696 –30.2058 10.690 2320612748909666560 50 1.3616 –30.2901 9.6462320834747180161408 224948 0.4907 –30.1580 9.866 2320903844613139072 1.3790 –29.8856 11.0882320886218068219264 0.5488 –29.6943 11.651 2320902057906744704 91 1.4291 –29.9606 9.8232320793893451241344 0.5902 –30.1393 10.570 2321022626228808064 1.4851 –28.9363 11.2922314555230115494528 0.6372 –30.9921 10.994 2320916763874909568 1.4961 –29.6513 11.4502333013075407421824 0.6636 –29.0752 10.097 2321010325442474752 141 1.5379 –29.1514 7.9412320994588682307072 0.7772 –29.3622 11.464 2320709643372054656 1.5682 –30.0992 11.5122320790285678713984 0.7952 –30.1803 11.147 2313393493000760064 1.6470 –32.8017 11.3302320869897192498432 0.8360 –29.8230 11.117 2320645734258792064 1.8926 –30.2872 10.4212320869725393806336 0.8517 –29.8137 10.498 2320702187308925184 343 2.0080 –30.0317 9.6872320771216024323840 0.8544 –30.4351 11.741 2319380333814252544 704 2.8317 –32.4039 8.4362320776644862584960 0.8708 –30.3242 10.468 2319554915645229312 3.7501 –31.2733 10.251
A19, page 42 of 65
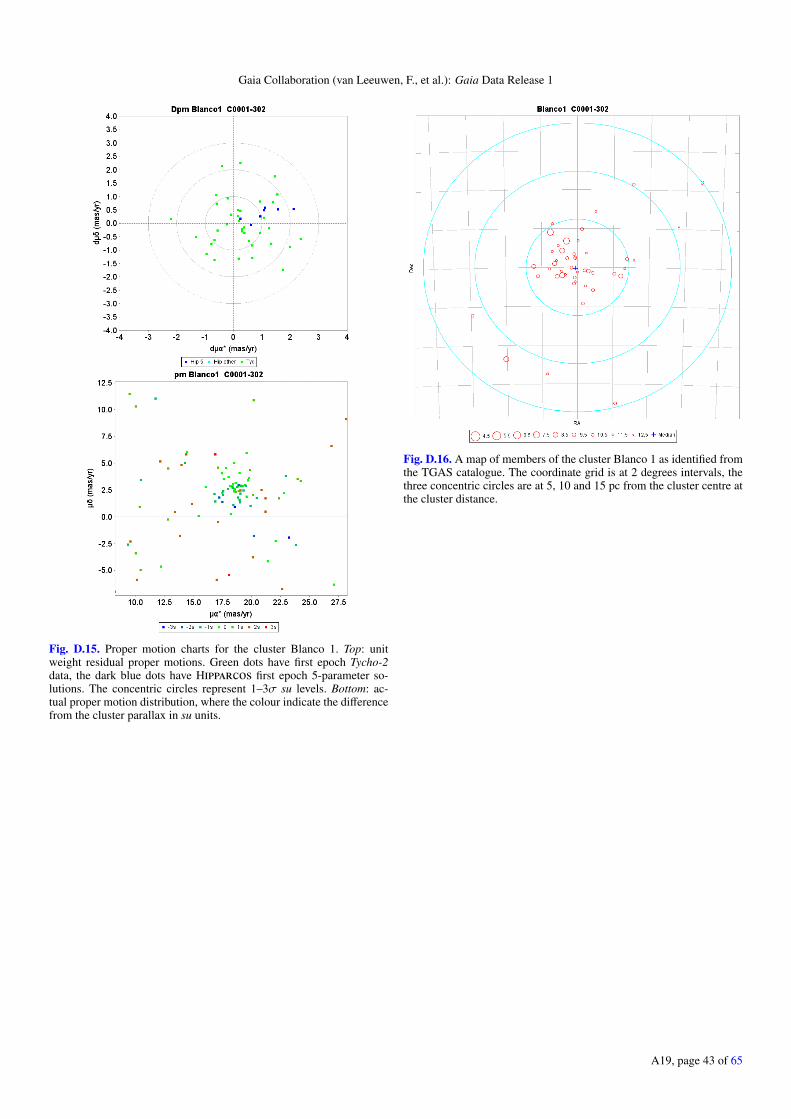
Gaia Collaboration (van Leeuwen, F., et al.): Gaia Data Release 1
Fig. D.15. Proper motion charts for the cluster Blanco 1. Top: unitweight residual proper motions. Green dots have first epoch Tycho-2data, the dark blue dots have Hipparcos first epoch 5-parameter so-lutions. The concentric circles represent 1–3σ su levels. Bottom: ac-tual proper motion distribution, where the colour indicate the differencefrom the cluster parallax in su units.
Fig. D.16. A map of members of the cluster Blanco 1 as identified fromthe TGAS catalogue. The coordinate grid is at 2 degrees intervals, thethree concentric circles are at 5, 10 and 15 pc from the cluster centre atthe cluster distance.
A19, page 43 of 65
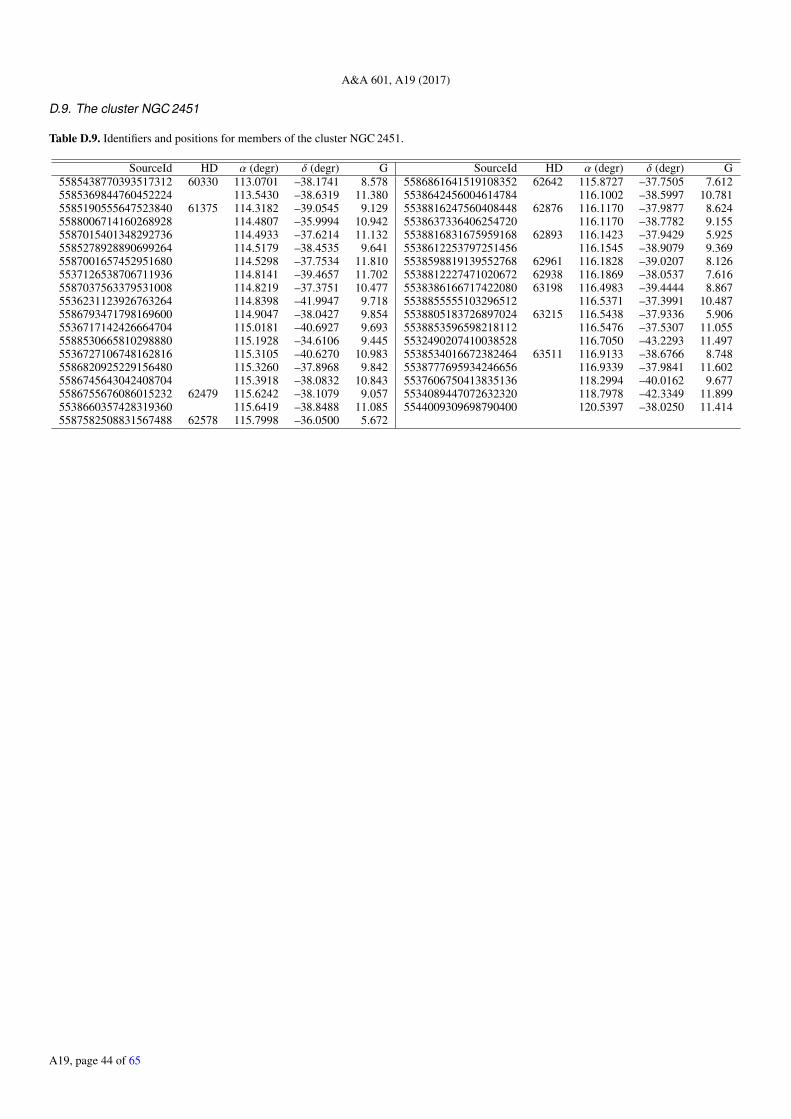
A&A 601, A19 (2017)
D.9. The cluster NGC 2451
Table D.9. Identifiers and positions for members of the cluster NGC 2451.
SourceId HD α (degr) δ (degr) G SourceId HD α (degr) δ (degr) G5585438770393517312 60330 113.0701 –38.1741 8.578 5586861641519108352 62642 115.8727 –37.7505 7.6125585369844760452224 113.5430 –38.6319 11.380 5538642456004614784 116.1002 –38.5997 10.7815585190555647523840 61375 114.3182 –39.0545 9.129 5538816247560408448 62876 116.1170 –37.9877 8.6245588006714160268928 114.4807 –35.9994 10.942 5538637336406254720 116.1170 –38.7782 9.1555587015401348292736 114.4933 –37.6214 11.132 5538816831675959168 62893 116.1423 –37.9429 5.9255585278928890699264 114.5179 –38.4535 9.641 5538612253797251456 116.1545 –38.9079 9.3695587001657452951680 114.5298 –37.7534 11.810 5538598819139552768 62961 116.1828 –39.0207 8.1265537126538706711936 114.8141 –39.4657 11.702 5538812227471020672 62938 116.1869 –38.0537 7.6165587037563379531008 114.8219 –37.3751 10.477 5538386166717422080 63198 116.4983 –39.4444 8.8675536231123926763264 114.8398 –41.9947 9.718 5538855555103296512 116.5371 –37.3991 10.4875586793471798169600 114.9047 –38.0427 9.854 5538805183726897024 63215 116.5438 –37.9336 5.9065536717142426664704 115.0181 –40.6927 9.693 5538853596598218112 116.5476 –37.5307 11.0555588530665810298880 115.1928 –34.6106 9.445 5532490207410038528 116.7050 –43.2293 11.4975536727106748162816 115.3105 –40.6270 10.983 5538534016672382464 63511 116.9133 –38.6766 8.7485586820925229156480 115.3260 –37.8968 9.842 5538777695934246656 116.9339 –37.9841 11.6025586745643042408704 115.3918 –38.0832 10.843 5537606750413835136 118.2994 –40.0162 9.6775586755676086015232 62479 115.6242 –38.1079 9.057 5534089447072632320 118.7978 –42.3349 11.8995538660357428319360 115.6419 –38.8488 11.085 5544009309698790400 120.5397 –38.0250 11.4145587582508831567488 62578 115.7998 –36.0500 5.672
A19, page 44 of 65
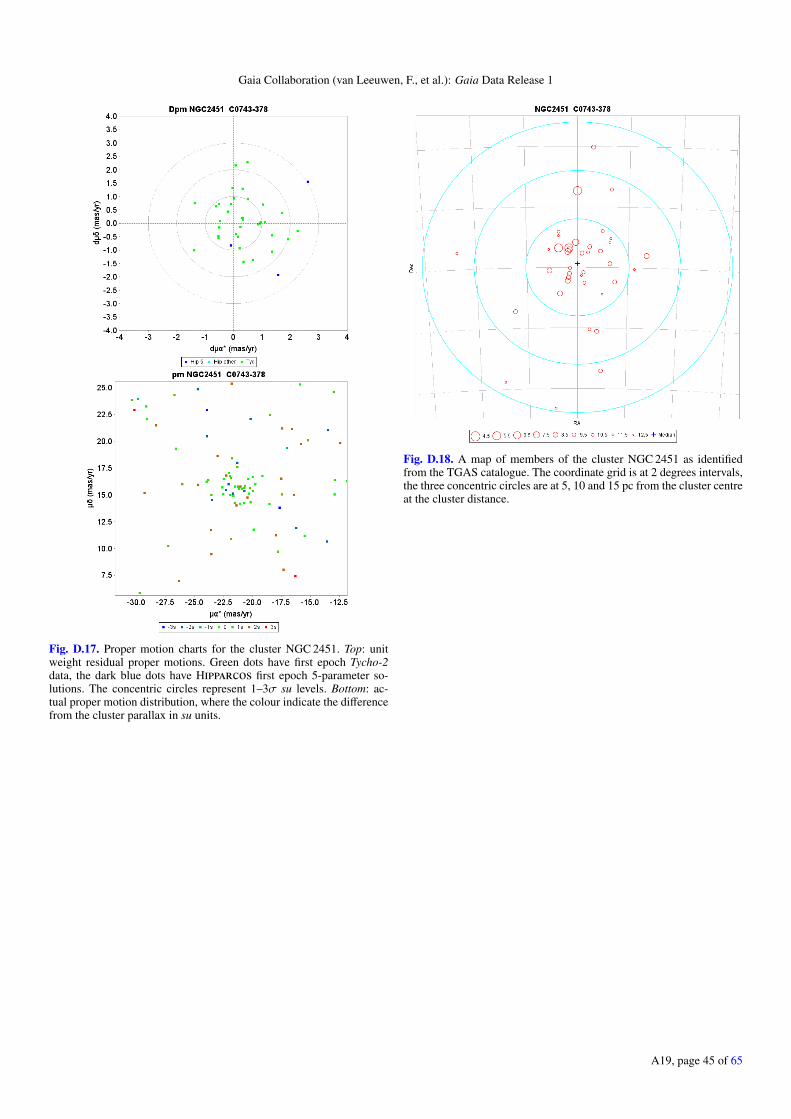
Gaia Collaboration (van Leeuwen, F., et al.): Gaia Data Release 1
Fig. D.17. Proper motion charts for the cluster NGC 2451. Top: unitweight residual proper motions. Green dots have first epoch Tycho-2data, the dark blue dots have Hipparcos first epoch 5-parameter so-lutions. The concentric circles represent 1–3σ su levels. Bottom: ac-tual proper motion distribution, where the colour indicate the differencefrom the cluster parallax in su units.
Fig. D.18. A map of members of the cluster NGC 2451 as identifiedfrom the TGAS catalogue. The coordinate grid is at 2 degrees intervals,the three concentric circles are at 5, 10 and 15 pc from the cluster centreat the cluster distance.
A19, page 45 of 65
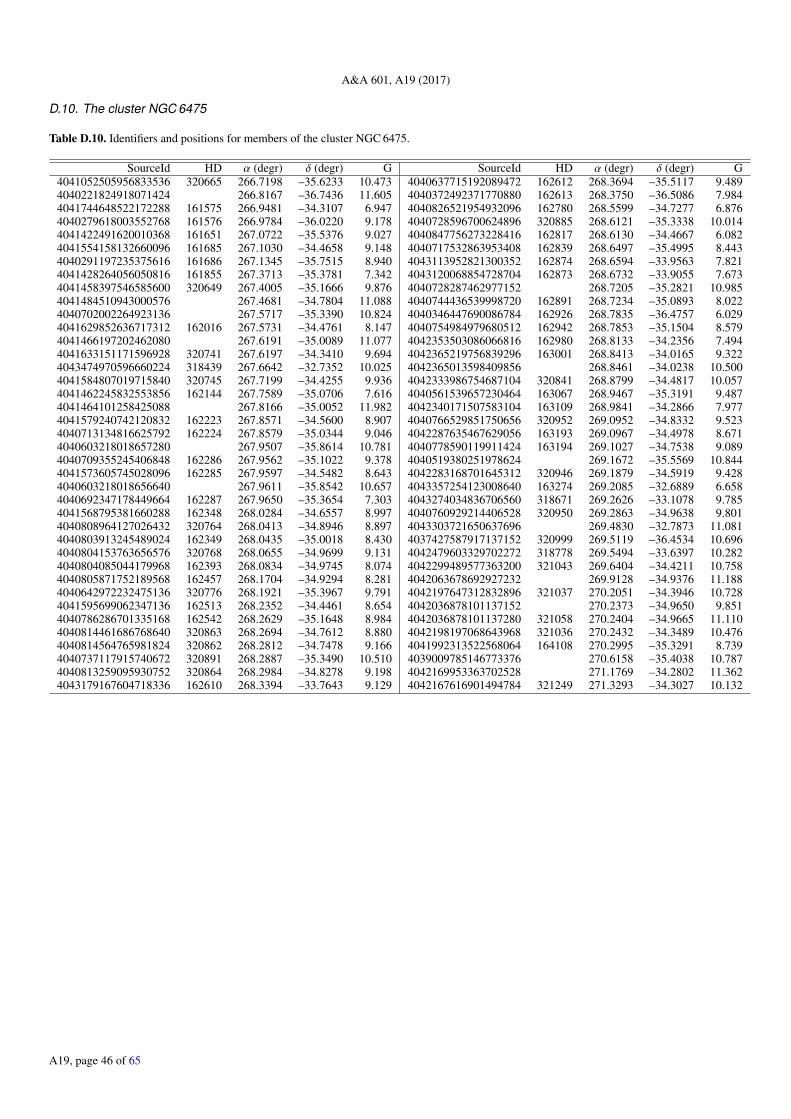
A&A 601, A19 (2017)
D.10. The cluster NGC 6475
Table D.10. Identifiers and positions for members of the cluster NGC 6475.
SourceId HD α (degr) δ (degr) G SourceId HD α (degr) δ (degr) G4041052505956833536 320665 266.7198 –35.6233 10.473 4040637715192089472 162612 268.3694 –35.5117 9.4894040221824918071424 266.8167 –36.7436 11.605 4040372492371770880 162613 268.3750 –36.5086 7.9844041744648522172288 161575 266.9481 –34.3107 6.947 4040826521954932096 162780 268.5599 –34.7277 6.8764040279618003552768 161576 266.9784 –36.0220 9.178 4040728596700624896 320885 268.6121 –35.3338 10.0144041422491620010368 161651 267.0722 –35.5376 9.027 4040847756273228416 162817 268.6130 –34.4667 6.0824041554158132660096 161685 267.1030 –34.4658 9.148 4040717532863953408 162839 268.6497 –35.4995 8.4434040291197235375616 161686 267.1345 –35.7515 8.940 4043113952821300352 162874 268.6594 –33.9563 7.8214041428264056050816 161855 267.3713 –35.3781 7.342 4043120068854728704 162873 268.6732 –33.9055 7.6734041458397546585600 320649 267.4005 –35.1666 9.876 4040728287462977152 268.7205 –35.2821 10.9854041484510943000576 267.4681 –34.7804 11.088 4040744436539998720 162891 268.7234 –35.0893 8.0224040702002264923136 267.5717 –35.3390 10.824 4040346447690086784 162926 268.7835 –36.4757 6.0294041629852636717312 162016 267.5731 –34.4761 8.147 4040754984979680512 162942 268.7853 –35.1504 8.5794041466197202462080 267.6191 –35.0089 11.077 4042353503086066816 162980 268.8133 –34.2356 7.4944041633151171596928 320741 267.6197 –34.3410 9.694 4042365219756839296 163001 268.8413 –34.0165 9.3224043474970596660224 318439 267.6642 –32.7352 10.025 4042365013598409856 268.8461 –34.0238 10.5004041584807019715840 320745 267.7199 –34.4255 9.936 4042333986754687104 320841 268.8799 –34.4817 10.0574041462245832553856 162144 267.7589 –35.0706 7.616 4040561539657230464 163067 268.9467 –35.3191 9.4874041464101258425088 267.8166 –35.0052 11.982 4042340171507583104 163109 268.9841 –34.2866 7.9774041579240742120832 162223 267.8571 –34.5600 8.907 4040766529851750656 320952 269.0952 –34.8332 9.5234040713134816625792 162224 267.8579 –35.0344 9.046 4042287635467629056 163193 269.0967 –34.4978 8.6714040603218018657280 267.9507 –35.8614 10.781 4040778590119911424 163194 269.1027 –34.7538 9.0894040709355245406848 162286 267.9562 –35.1022 9.378 4040519380251978624 269.1672 –35.5569 10.8444041573605745028096 162285 267.9597 –34.5482 8.643 4042283168701645312 320946 269.1879 –34.5919 9.4284040603218018656640 267.9611 –35.8542 10.657 4043357254123008640 163274 269.2085 –32.6889 6.6584040692347178449664 162287 267.9650 –35.3654 7.303 4043274034836706560 318671 269.2626 –33.1078 9.7854041568795381660288 162348 268.0284 –34.6557 8.997 4040760929214406528 320950 269.2863 –34.9638 9.8014040808964127026432 320764 268.0413 –34.8946 8.897 4043303721650637696 269.4830 –32.7873 11.0814040803913245489024 162349 268.0435 –35.0018 8.430 4037427587917137152 320999 269.5119 –36.4534 10.6964040804153763656576 320768 268.0655 –34.9699 9.131 4042479603329702272 318778 269.5494 –33.6397 10.2824040804085044179968 162393 268.0834 –34.9745 8.074 4042299489577363200 321043 269.6404 –34.4211 10.7584040805871752189568 162457 268.1704 –34.9294 8.281 4042063678692927232 269.9128 –34.9376 11.1884040642972232475136 320776 268.1921 –35.3967 9.791 4042197647312832896 321037 270.2051 –34.3946 10.7284041595699062347136 162513 268.2352 –34.4461 8.654 4042036878101137152 270.2373 –34.9650 9.8514040786286701335168 162542 268.2629 –35.1648 8.984 4042036878101137280 321058 270.2404 –34.9665 11.1104040814461686768640 320863 268.2694 –34.7612 8.880 4042198197068643968 321036 270.2432 –34.3489 10.4764040814564765981824 320862 268.2812 –34.7478 9.166 4041992313522568064 164108 270.2995 –35.3291 8.7394040737117915740672 320891 268.2887 –35.3490 10.510 4039009785146773376 270.6158 –35.4038 10.7874040813259095930752 320864 268.2984 –34.8278 9.198 4042169953363702528 271.1769 –34.2802 11.3624043179167604718336 162610 268.3394 –33.7643 9.129 4042167616901494784 321249 271.3293 –34.3027 10.132
A19, page 46 of 65
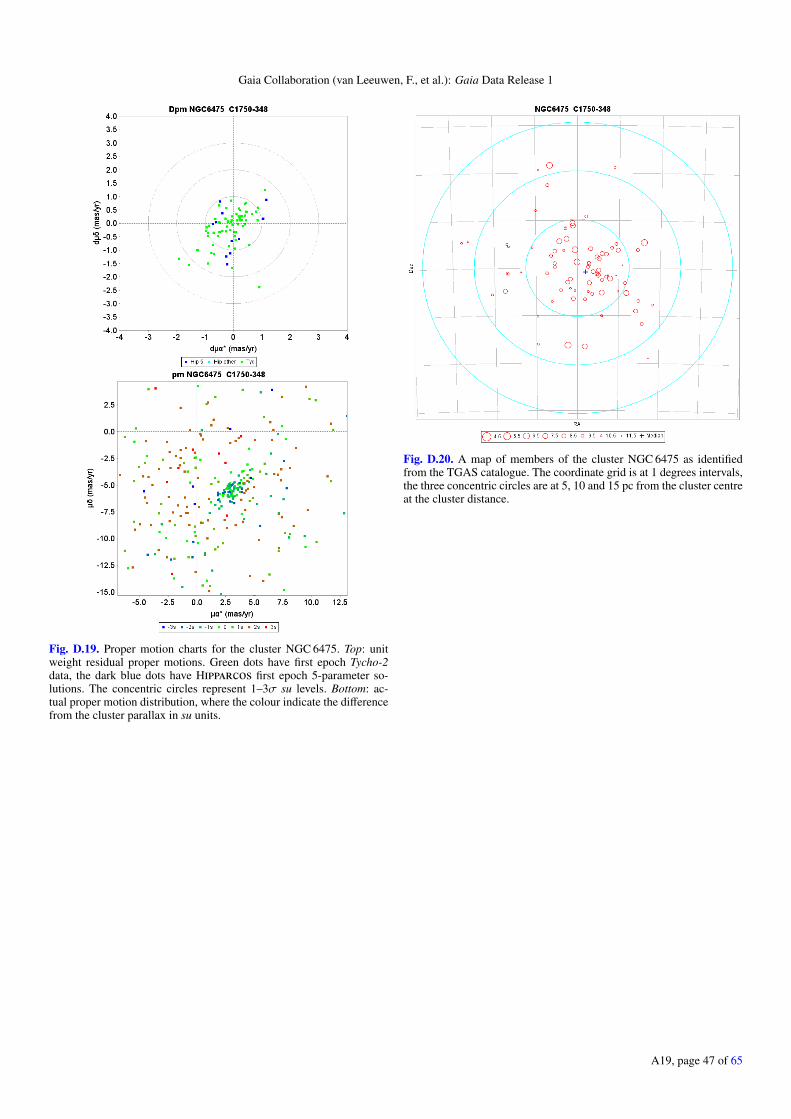
Gaia Collaboration (van Leeuwen, F., et al.): Gaia Data Release 1
Fig. D.19. Proper motion charts for the cluster NGC 6475. Top: unitweight residual proper motions. Green dots have first epoch Tycho-2data, the dark blue dots have Hipparcos first epoch 5-parameter so-lutions. The concentric circles represent 1–3σ su levels. Bottom: ac-tual proper motion distribution, where the colour indicate the differencefrom the cluster parallax in su units.
Fig. D.20. A map of members of the cluster NGC 6475 as identifiedfrom the TGAS catalogue. The coordinate grid is at 1 degrees intervals,the three concentric circles are at 5, 10 and 15 pc from the cluster centreat the cluster distance.
A19, page 47 of 65
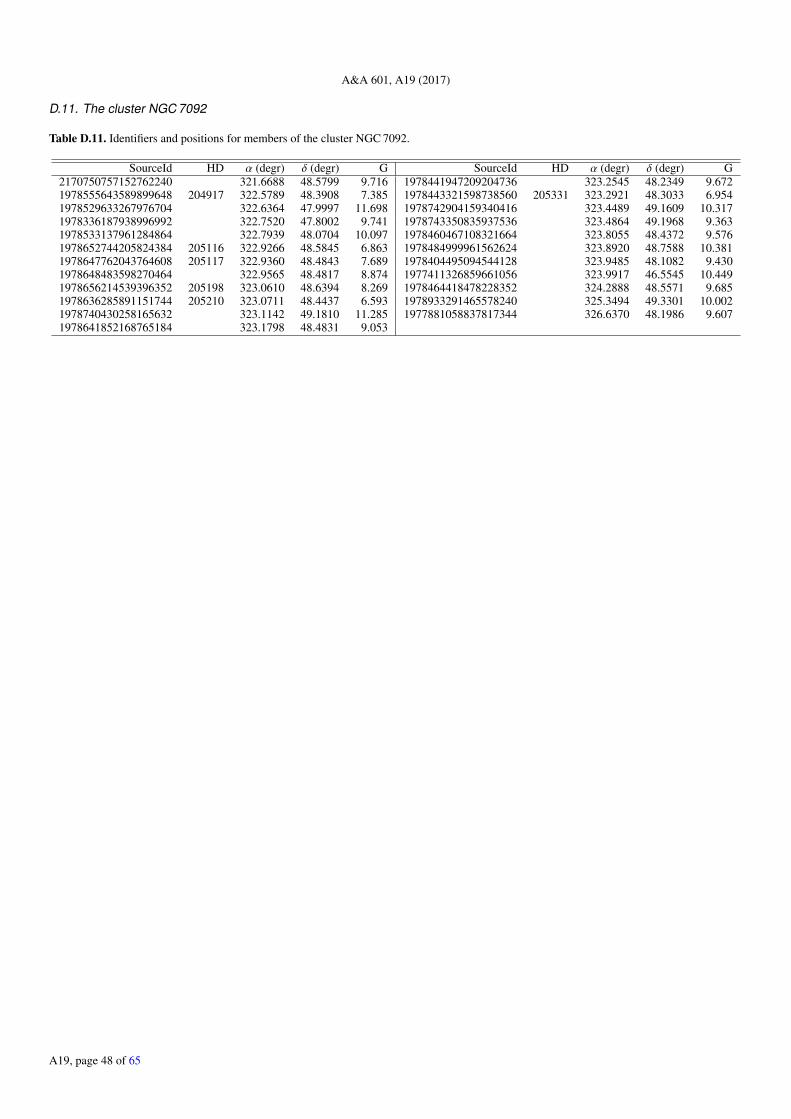
A&A 601, A19 (2017)
D.11. The cluster NGC 7092
Table D.11. Identifiers and positions for members of the cluster NGC 7092.
SourceId HD α (degr) δ (degr) G SourceId HD α (degr) δ (degr) G2170750757152762240 321.6688 48.5799 9.716 1978441947209204736 323.2545 48.2349 9.6721978555643589899648 204917 322.5789 48.3908 7.385 1978443321598738560 205331 323.2921 48.3033 6.9541978529633267976704 322.6364 47.9997 11.698 1978742904159340416 323.4489 49.1609 10.3171978336187938996992 322.7520 47.8002 9.741 1978743350835937536 323.4864 49.1968 9.3631978533137961284864 322.7939 48.0704 10.097 1978460467108321664 323.8055 48.4372 9.5761978652744205824384 205116 322.9266 48.5845 6.863 1978484999961562624 323.8920 48.7588 10.3811978647762043764608 205117 322.9360 48.4843 7.689 1978404495094544128 323.9485 48.1082 9.4301978648483598270464 322.9565 48.4817 8.874 1977411326859661056 323.9917 46.5545 10.4491978656214539396352 205198 323.0610 48.6394 8.269 1978464418478228352 324.2888 48.5571 9.6851978636285891151744 205210 323.0711 48.4437 6.593 1978933291465578240 325.3494 49.3301 10.0021978740430258165632 323.1142 49.1810 11.285 1977881058837817344 326.6370 48.1986 9.6071978641852168765184 323.1798 48.4831 9.053
A19, page 48 of 65
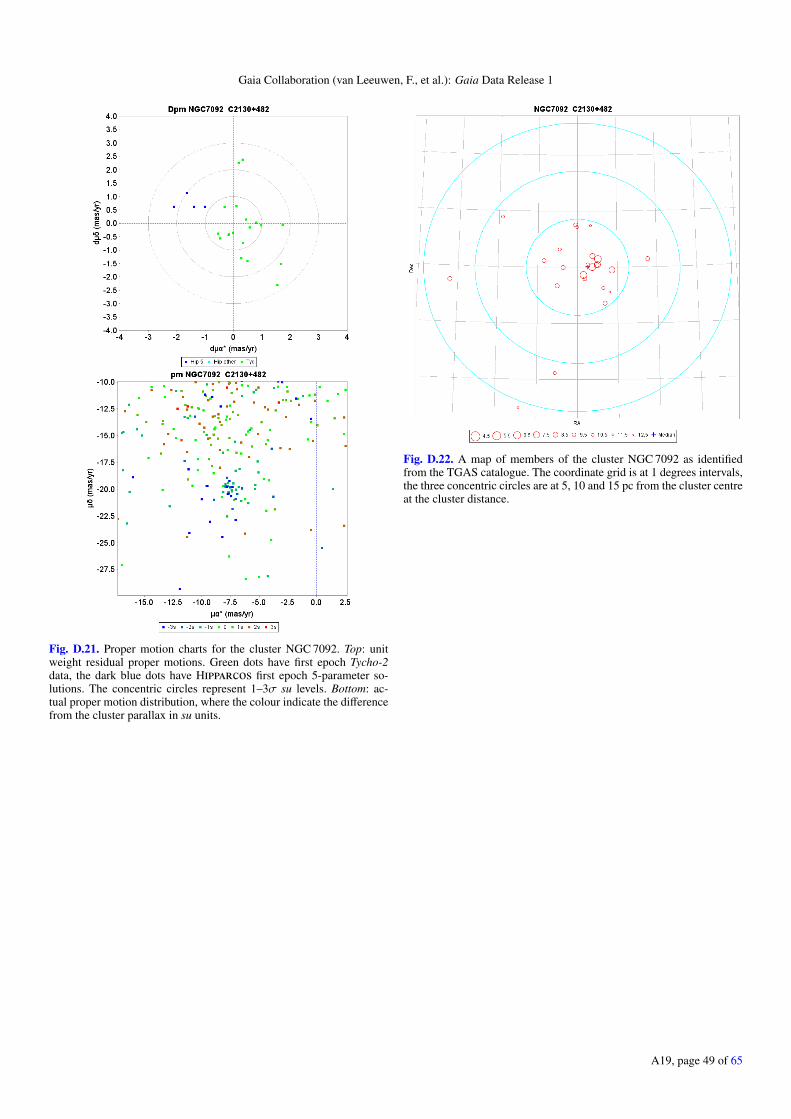
Gaia Collaboration (van Leeuwen, F., et al.): Gaia Data Release 1
Fig. D.21. Proper motion charts for the cluster NGC 7092. Top: unitweight residual proper motions. Green dots have first epoch Tycho-2data, the dark blue dots have Hipparcos first epoch 5-parameter so-lutions. The concentric circles represent 1–3σ su levels. Bottom: ac-tual proper motion distribution, where the colour indicate the differencefrom the cluster parallax in su units.
Fig. D.22. A map of members of the cluster NGC 7092 as identifiedfrom the TGAS catalogue. The coordinate grid is at 1 degrees intervals,the three concentric circles are at 5, 10 and 15 pc from the cluster centreat the cluster distance.
A19, page 49 of 65
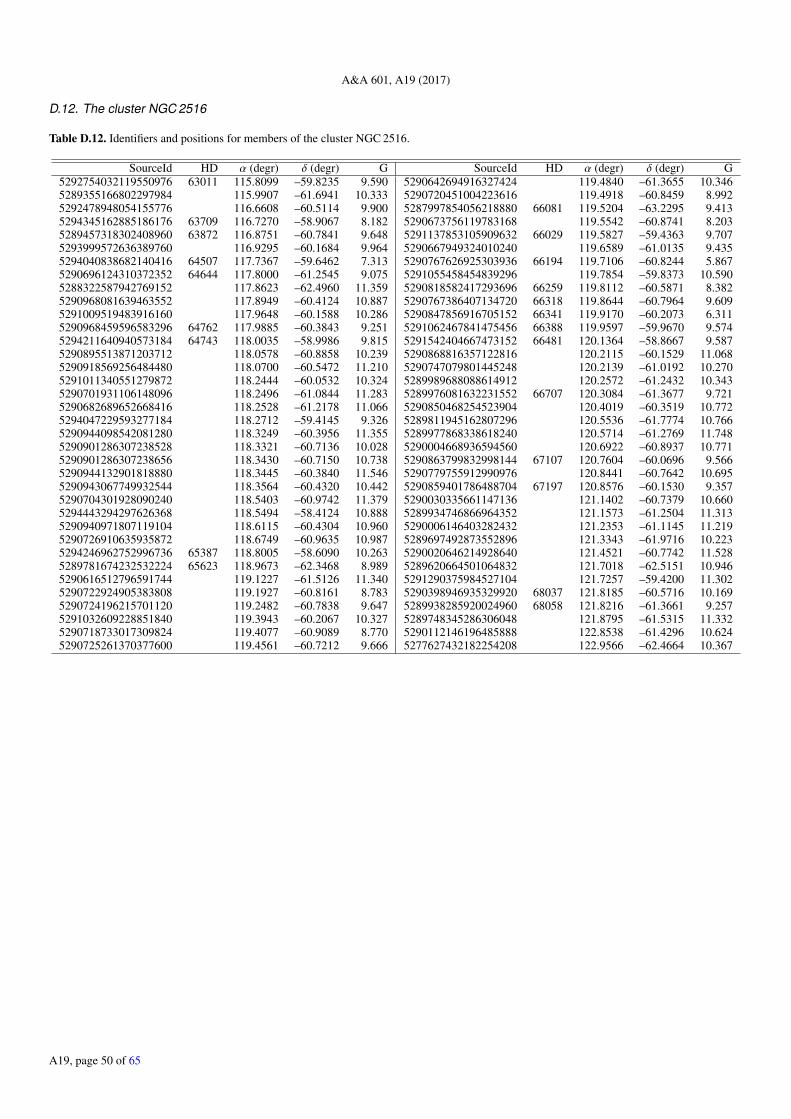
A&A 601, A19 (2017)
D.12. The cluster NGC 2516
Table D.12. Identifiers and positions for members of the cluster NGC 2516.
SourceId HD α (degr) δ (degr) G SourceId HD α (degr) δ (degr) G5292754032119550976 63011 115.8099 –59.8235 9.590 5290642694916327424 119.4840 –61.3655 10.3465289355166802297984 115.9907 –61.6941 10.333 5290720451004223616 119.4918 –60.8459 8.9925292478948054155776 116.6608 –60.5114 9.900 5287997854056218880 66081 119.5204 –63.2295 9.4135294345162885186176 63709 116.7270 –58.9067 8.182 5290673756119783168 119.5542 –60.8741 8.2035289457318302408960 63872 116.8751 –60.7841 9.648 5291137853105909632 66029 119.5827 –59.4363 9.7075293999572636389760 116.9295 –60.1684 9.964 5290667949324010240 119.6589 –61.0135 9.4355294040838682140416 64507 117.7367 –59.6462 7.313 5290767626925303936 66194 119.7106 –60.8244 5.8675290696124310372352 64644 117.8000 –61.2545 9.075 5291055458454839296 119.7854 –59.8373 10.5905288322587942769152 117.8623 –62.4960 11.359 5290818582417293696 66259 119.8112 –60.5871 8.3825290968081639463552 117.8949 –60.4124 10.887 5290767386407134720 66318 119.8644 –60.7964 9.6095291009519483916160 117.9648 –60.1588 10.286 5290847856916705152 66341 119.9170 –60.2073 6.3115290968459596583296 64762 117.9885 –60.3843 9.251 5291062467841475456 66388 119.9597 –59.9670 9.5745294211640940573184 64743 118.0035 –58.9986 9.815 5291542404667473152 66481 120.1364 –58.8667 9.5875290895513871203712 118.0578 –60.8858 10.239 5290868816357122816 120.2115 –60.1529 11.0685290918569256484480 118.0700 –60.5472 11.210 5290747079801445248 120.2139 –61.0192 10.2705291011340551279872 118.2444 –60.0532 10.324 5289989688088614912 120.2572 –61.2432 10.3435290701931106148096 118.2496 –61.0844 11.283 5289976081632231552 66707 120.3084 –61.3677 9.7215290682689652668416 118.2528 –61.2178 11.066 5290850468254523904 120.4019 –60.3519 10.7725294047229593277184 118.2712 –59.4145 9.326 5289811945162807296 120.5536 –61.7774 10.7665290944098542081280 118.3249 –60.3956 11.355 5289977868338618240 120.5714 –61.2769 11.7485290901286307238528 118.3321 –60.7136 10.028 5290004668936594560 120.6922 –60.8937 10.7715290901286307238656 118.3430 –60.7150 10.738 5290863799832998144 67107 120.7604 –60.0696 9.5665290944132901818880 118.3445 –60.3840 11.546 5290779755912990976 120.8441 –60.7642 10.6955290943067749932544 118.3564 –60.4320 10.442 5290859401786488704 67197 120.8576 –60.1530 9.3575290704301928090240 118.5403 –60.9742 11.379 5290030335661147136 121.1402 –60.7379 10.6605294443294297626368 118.5494 –58.4124 10.888 5289934746866964352 121.1573 –61.2504 11.3135290940971807119104 118.6115 –60.4304 10.960 5290006146403282432 121.2353 –61.1145 11.2195290726910635935872 118.6749 –60.9635 10.987 5289697492873552896 121.3343 –61.9716 10.2235294246962752996736 65387 118.8005 –58.6090 10.263 5290020646214928640 121.4521 –60.7742 11.5285289781674232532224 65623 118.9673 –62.3468 8.989 5289620664501064832 121.7018 –62.5151 10.9465290616512796591744 119.1227 –61.5126 11.340 5291290375984527104 121.7257 –59.4200 11.3025290722924905383808 119.1927 –60.8161 8.783 5290398946935329920 68037 121.8185 –60.5716 10.1695290724196215701120 119.2482 –60.7838 9.647 5289938285920024960 68058 121.8216 –61.3661 9.2575291032609228851840 119.3943 –60.2067 10.327 5289748345286306048 121.8795 –61.5315 11.3325290718733017309824 119.4077 –60.9089 8.770 5290112146196485888 122.8538 –61.4296 10.6245290725261370377600 119.4561 –60.7212 9.666 5277627432182254208 122.9566 –62.4664 10.367
A19, page 50 of 65
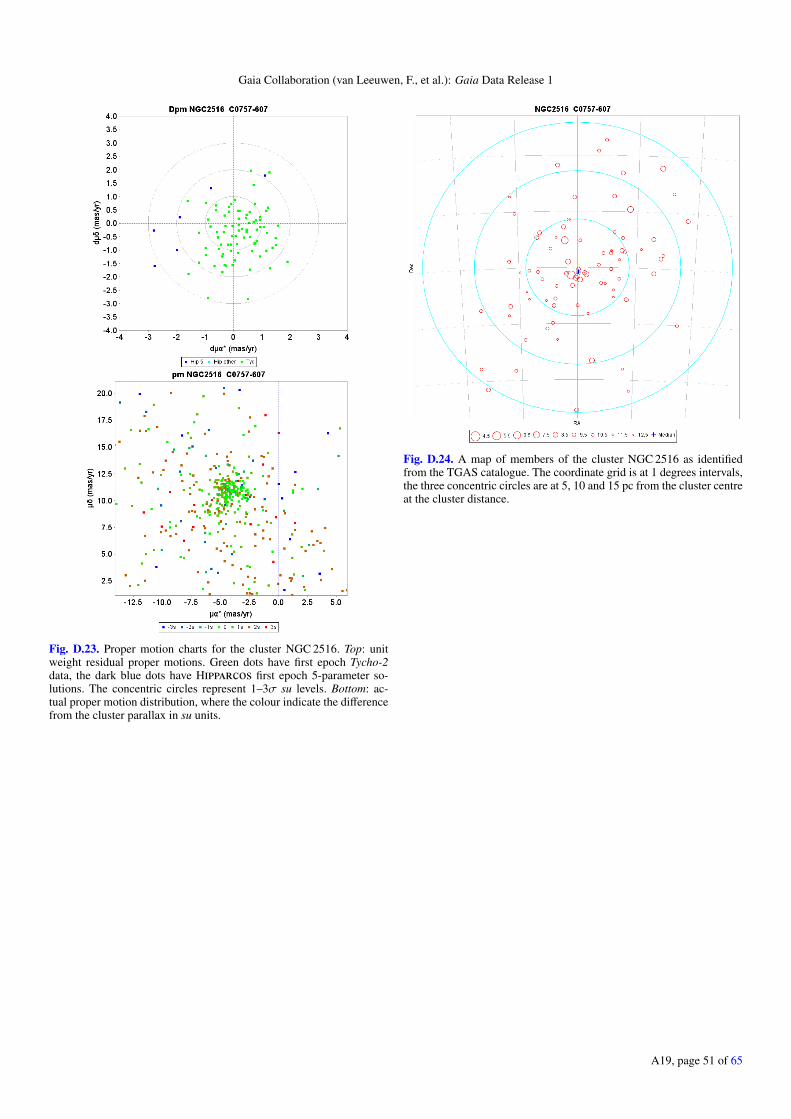
Gaia Collaboration (van Leeuwen, F., et al.): Gaia Data Release 1
Fig. D.23. Proper motion charts for the cluster NGC 2516. Top: unitweight residual proper motions. Green dots have first epoch Tycho-2data, the dark blue dots have Hipparcos first epoch 5-parameter so-lutions. The concentric circles represent 1–3σ su levels. Bottom: ac-tual proper motion distribution, where the colour indicate the differencefrom the cluster parallax in su units.
Fig. D.24. A map of members of the cluster NGC 2516 as identifiedfrom the TGAS catalogue. The coordinate grid is at 1 degrees intervals,the three concentric circles are at 5, 10 and 15 pc from the cluster centreat the cluster distance.
A19, page 51 of 65
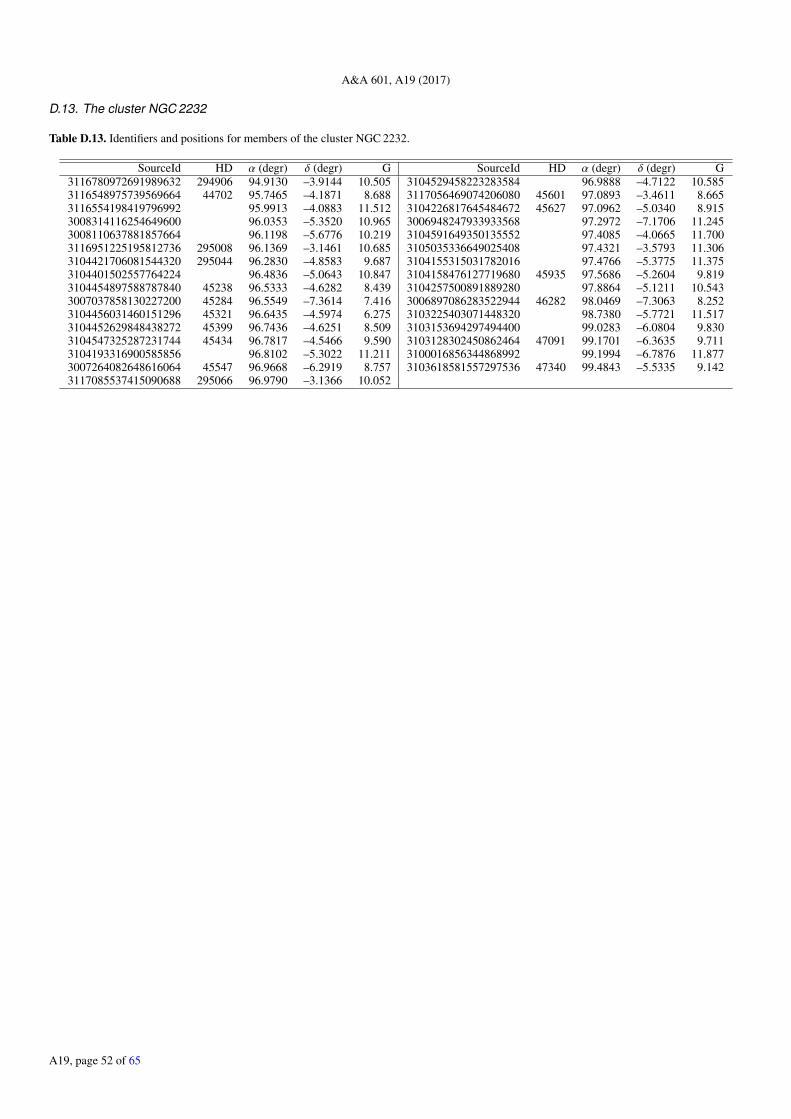
A&A 601, A19 (2017)
D.13. The cluster NGC 2232
Table D.13. Identifiers and positions for members of the cluster NGC 2232.
SourceId HD α (degr) δ (degr) G SourceId HD α (degr) δ (degr) G3116780972691989632 294906 94.9130 –3.9144 10.505 3104529458223283584 96.9888 –4.7122 10.5853116548975739569664 44702 95.7465 –4.1871 8.688 3117056469074206080 45601 97.0893 –3.4611 8.6653116554198419796992 95.9913 –4.0883 11.512 3104226817645484672 45627 97.0962 –5.0340 8.9153008314116254649600 96.0353 –5.3520 10.965 3006948247933933568 97.2972 –7.1706 11.2453008110637881857664 96.1198 –5.6776 10.219 3104591649350135552 97.4085 –4.0665 11.7003116951225195812736 295008 96.1369 –3.1461 10.685 3105035336649025408 97.4321 –3.5793 11.3063104421706081544320 295044 96.2830 –4.8583 9.687 3104155315031782016 97.4766 –5.3775 11.3753104401502557764224 96.4836 –5.0643 10.847 3104158476127719680 45935 97.5686 –5.2604 9.8193104454897588787840 45238 96.5333 –4.6282 8.439 3104257500891889280 97.8864 –5.1211 10.5433007037858130227200 45284 96.5549 –7.3614 7.416 3006897086283522944 46282 98.0469 –7.3063 8.2523104456031460151296 45321 96.6435 –4.5974 6.275 3103225403071448320 98.7380 –5.7721 11.5173104452629848438272 45399 96.7436 –4.6251 8.509 3103153694297494400 99.0283 –6.0804 9.8303104547325287231744 45434 96.7817 –4.5466 9.590 3103128302450862464 47091 99.1701 –6.3635 9.7113104193316900585856 96.8102 –5.3022 11.211 3100016856344868992 99.1994 –6.7876 11.8773007264082648616064 45547 96.9668 –6.2919 8.757 3103618581557297536 47340 99.4843 –5.5335 9.1423117085537415090688 295066 96.9790 –3.1366 10.052
A19, page 52 of 65
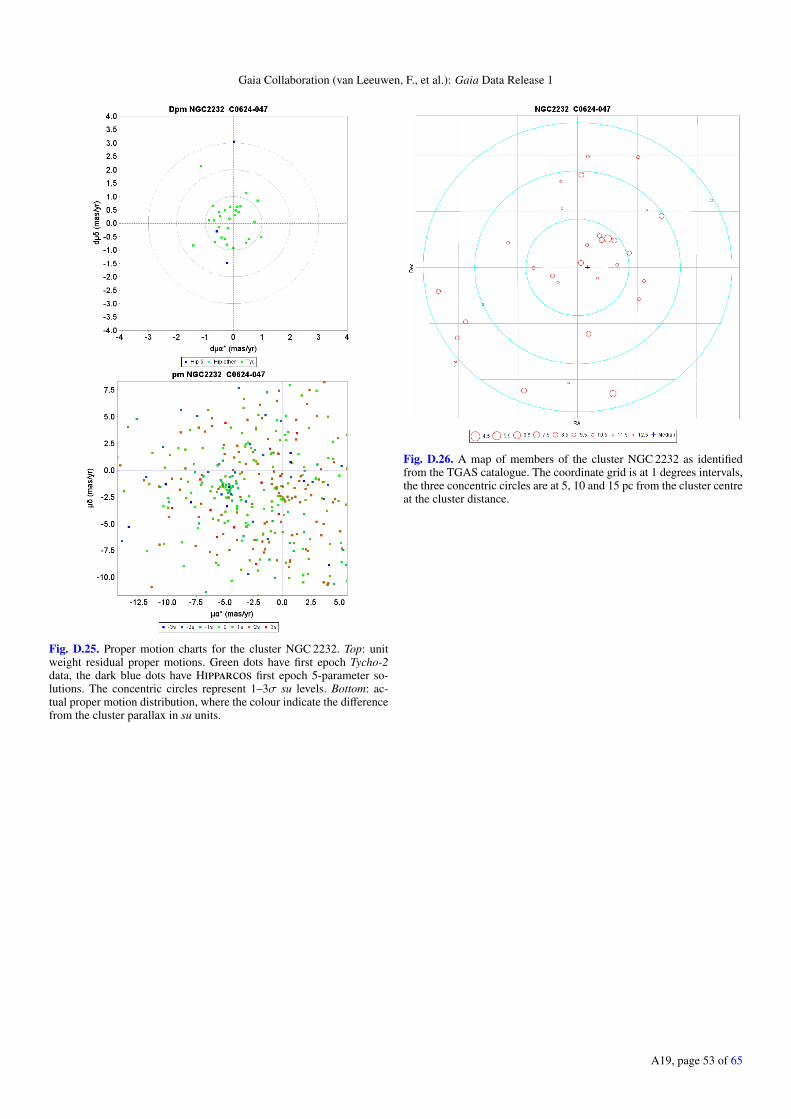
Gaia Collaboration (van Leeuwen, F., et al.): Gaia Data Release 1
Fig. D.25. Proper motion charts for the cluster NGC 2232. Top: unitweight residual proper motions. Green dots have first epoch Tycho-2data, the dark blue dots have Hipparcos first epoch 5-parameter so-lutions. The concentric circles represent 1–3σ su levels. Bottom: ac-tual proper motion distribution, where the colour indicate the differencefrom the cluster parallax in su units.
Fig. D.26. A map of members of the cluster NGC 2232 as identifiedfrom the TGAS catalogue. The coordinate grid is at 1 degrees intervals,the three concentric circles are at 5, 10 and 15 pc from the cluster centreat the cluster distance.
A19, page 53 of 65
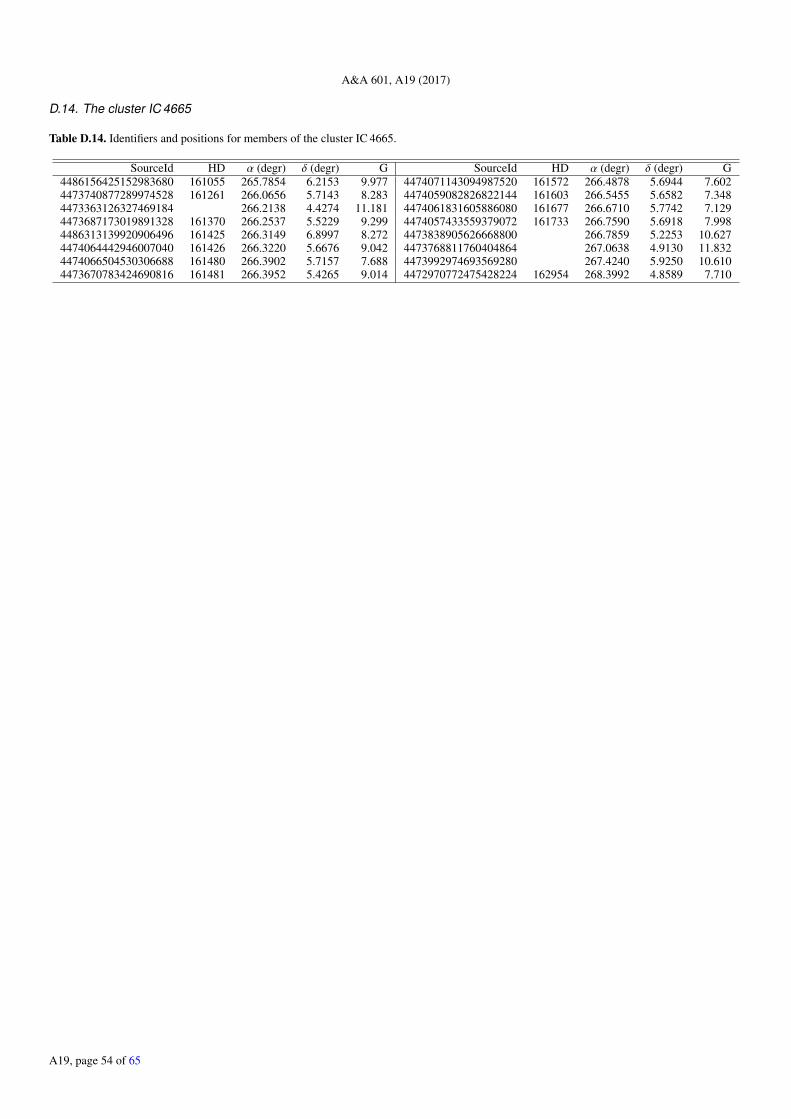
A&A 601, A19 (2017)
D.14. The cluster IC 4665
Table D.14. Identifiers and positions for members of the cluster IC 4665.
SourceId HD α (degr) δ (degr) G SourceId HD α (degr) δ (degr) G4486156425152983680 161055 265.7854 6.2153 9.977 4474071143094987520 161572 266.4878 5.6944 7.6024473740877289974528 161261 266.0656 5.7143 8.283 4474059082826822144 161603 266.5455 5.6582 7.3484473363126327469184 266.2138 4.4274 11.181 4474061831605886080 161677 266.6710 5.7742 7.1294473687173019891328 161370 266.2537 5.5229 9.299 4474057433559379072 161733 266.7590 5.6918 7.9984486313139920906496 161425 266.3149 6.8997 8.272 4473838905626668800 266.7859 5.2253 10.6274474064442946007040 161426 266.3220 5.6676 9.042 4473768811760404864 267.0638 4.9130 11.8324474066504530306688 161480 266.3902 5.7157 7.688 4473992974693569280 267.4240 5.9250 10.6104473670783424690816 161481 266.3952 5.4265 9.014 4472970772475428224 162954 268.3992 4.8589 7.710
A19, page 54 of 65
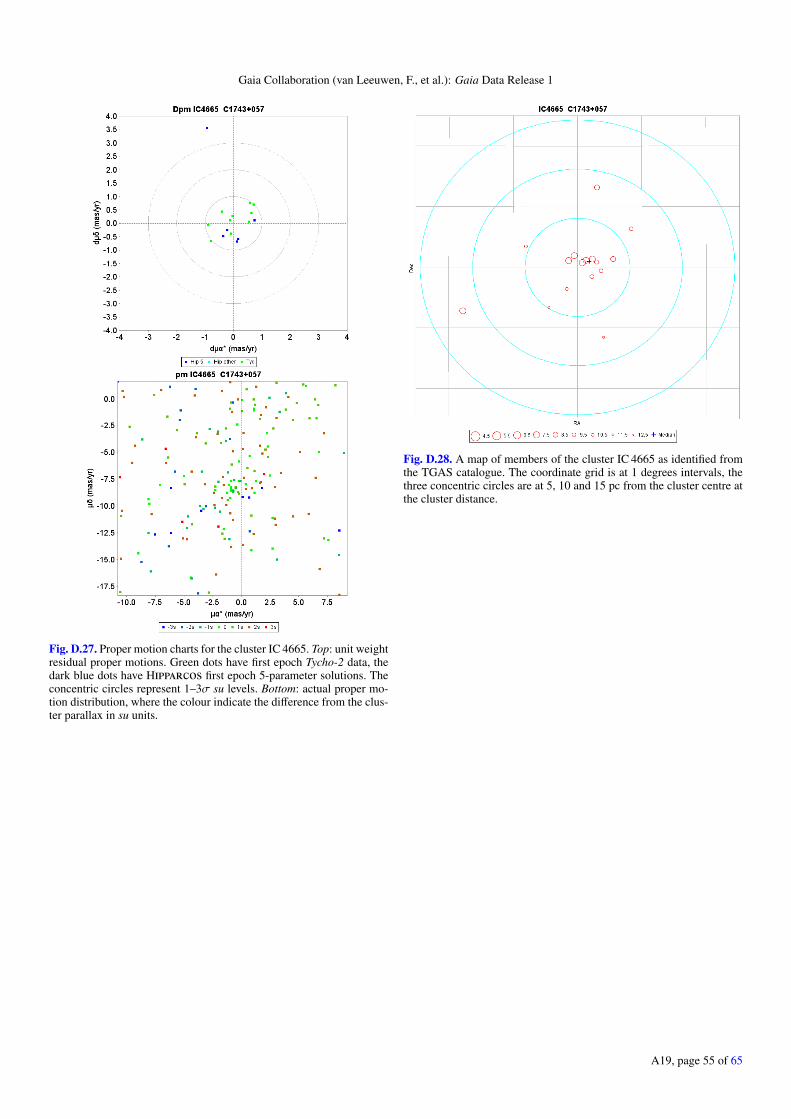
Gaia Collaboration (van Leeuwen, F., et al.): Gaia Data Release 1
Fig. D.27. Proper motion charts for the cluster IC 4665. Top: unit weightresidual proper motions. Green dots have first epoch Tycho-2 data, thedark blue dots have Hipparcos first epoch 5-parameter solutions. Theconcentric circles represent 1–3σ su levels. Bottom: actual proper mo-tion distribution, where the colour indicate the difference from the clus-ter parallax in su units.
Fig. D.28. A map of members of the cluster IC 4665 as identified fromthe TGAS catalogue. The coordinate grid is at 1 degrees intervals, thethree concentric circles are at 5, 10 and 15 pc from the cluster centre atthe cluster distance.
A19, page 55 of 65
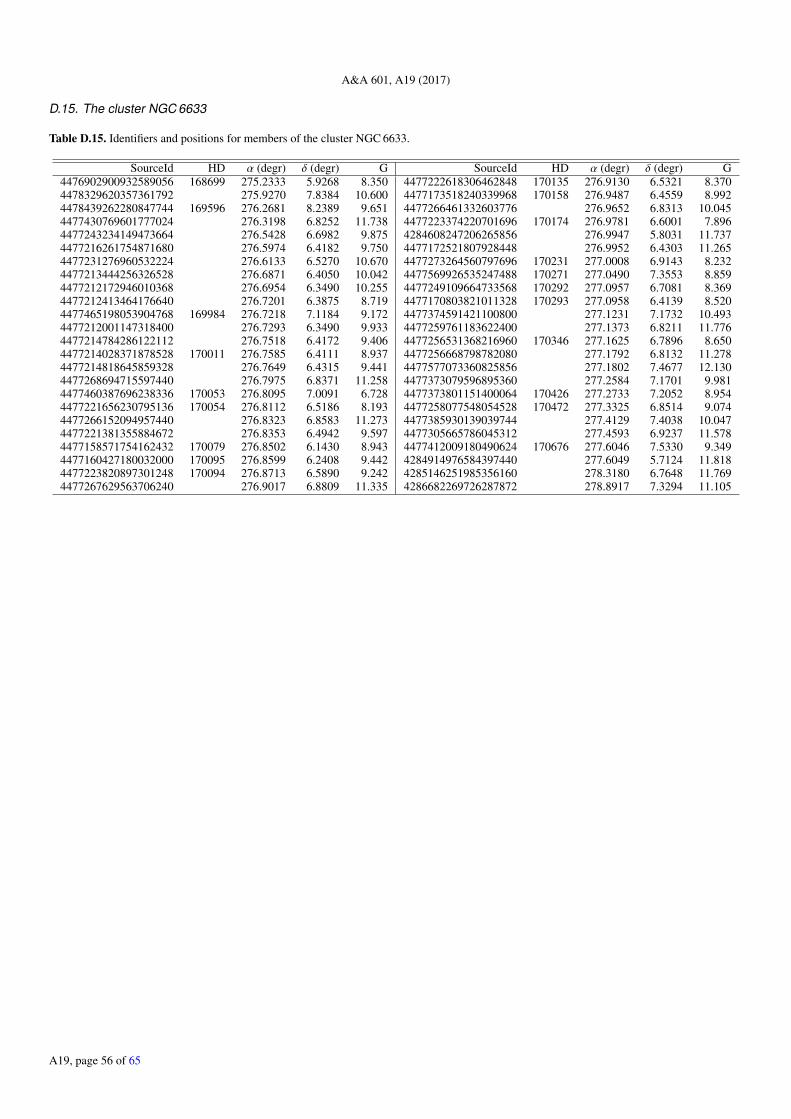
A&A 601, A19 (2017)
D.15. The cluster NGC 6633
Table D.15. Identifiers and positions for members of the cluster NGC 6633.
SourceId HD α (degr) δ (degr) G SourceId HD α (degr) δ (degr) G4476902900932589056 168699 275.2333 5.9268 8.350 4477222618306462848 170135 276.9130 6.5321 8.3704478329620357361792 275.9270 7.8384 10.600 4477173518240339968 170158 276.9487 6.4559 8.9924478439262280847744 169596 276.2681 8.2389 9.651 4477266461332603776 276.9652 6.8313 10.0454477430769601777024 276.3198 6.8252 11.738 4477223374220701696 170174 276.9781 6.6001 7.8964477243234149473664 276.5428 6.6982 9.875 4284608247206265856 276.9947 5.8031 11.7374477216261754871680 276.5974 6.4182 9.750 4477172521807928448 276.9952 6.4303 11.2654477231276960532224 276.6133 6.5270 10.670 4477273264560797696 170231 277.0008 6.9143 8.2324477213444256326528 276.6871 6.4050 10.042 4477569926535247488 170271 277.0490 7.3553 8.8594477212172946010368 276.6954 6.3490 10.255 4477249109664733568 170292 277.0957 6.7081 8.3694477212413464176640 276.7201 6.3875 8.719 4477170803821011328 170293 277.0958 6.4139 8.5204477465198053904768 169984 276.7218 7.1184 9.172 4477374591421100800 277.1231 7.1732 10.4934477212001147318400 276.7293 6.3490 9.933 4477259761183622400 277.1373 6.8211 11.7764477214784286122112 276.7518 6.4172 9.406 4477256531368216960 170346 277.1625 6.7896 8.6504477214028371878528 170011 276.7585 6.4111 8.937 4477256668798782080 277.1792 6.8132 11.2784477214818645859328 276.7649 6.4315 9.441 4477577073360825856 277.1802 7.4677 12.1304477268694715597440 276.7975 6.8371 11.258 4477373079596895360 277.2584 7.1701 9.9814477460387696238336 170053 276.8095 7.0091 6.728 4477373801151400064 170426 277.2733 7.2052 8.9544477221656230795136 170054 276.8112 6.5186 8.193 4477258077548054528 170472 277.3325 6.8514 9.0744477266152094957440 276.8323 6.8583 11.273 4477385930139039744 277.4129 7.4038 10.0474477221381355884672 276.8353 6.4942 9.597 4477305665786045312 277.4593 6.9237 11.5784477158571754162432 170079 276.8502 6.1430 8.943 4477412009180490624 170676 277.6046 7.5330 9.3494477160427180032000 170095 276.8599 6.2408 9.442 4284914976584397440 277.6049 5.7124 11.8184477223820897301248 170094 276.8713 6.5890 9.242 4285146251985356160 278.3180 6.7648 11.7694477267629563706240 276.9017 6.8809 11.335 4286682269726287872 278.8917 7.3294 11.105
A19, page 56 of 65
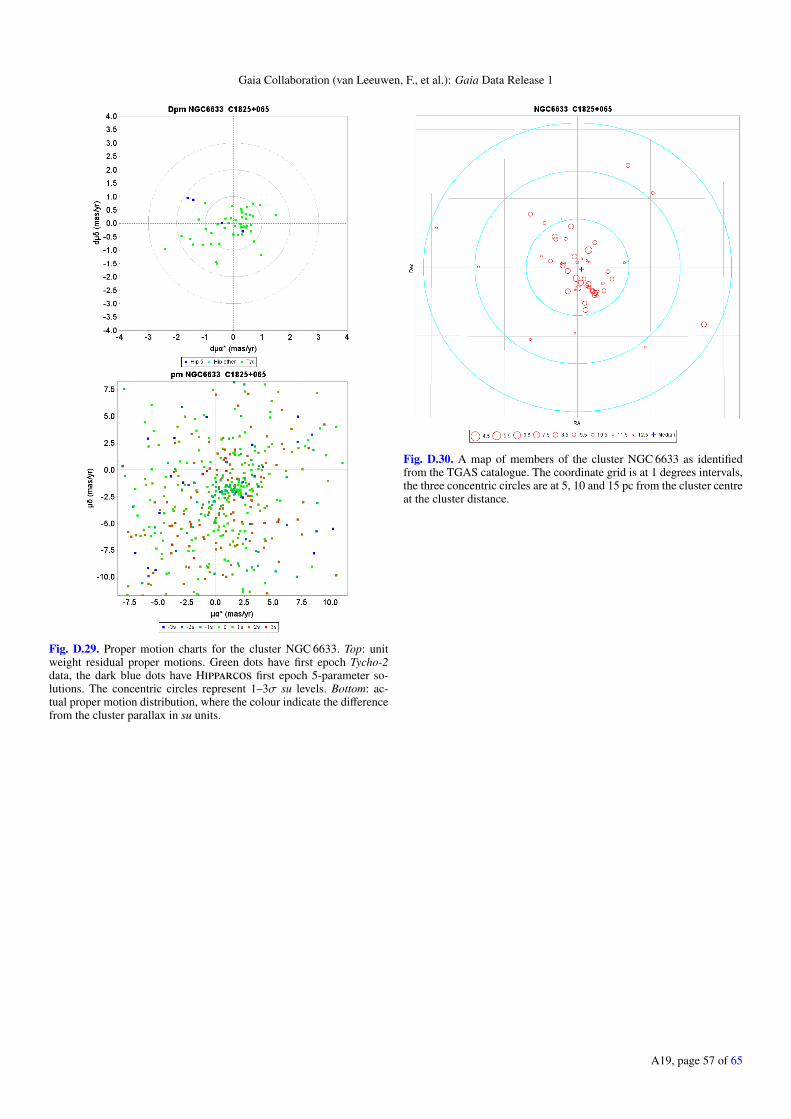
Gaia Collaboration (van Leeuwen, F., et al.): Gaia Data Release 1
Fig. D.29. Proper motion charts for the cluster NGC 6633. Top: unitweight residual proper motions. Green dots have first epoch Tycho-2data, the dark blue dots have Hipparcos first epoch 5-parameter so-lutions. The concentric circles represent 1–3σ su levels. Bottom: ac-tual proper motion distribution, where the colour indicate the differencefrom the cluster parallax in su units.
Fig. D.30. A map of members of the cluster NGC 6633 as identifiedfrom the TGAS catalogue. The coordinate grid is at 1 degrees intervals,the three concentric circles are at 5, 10 and 15 pc from the cluster centreat the cluster distance.
A19, page 57 of 65
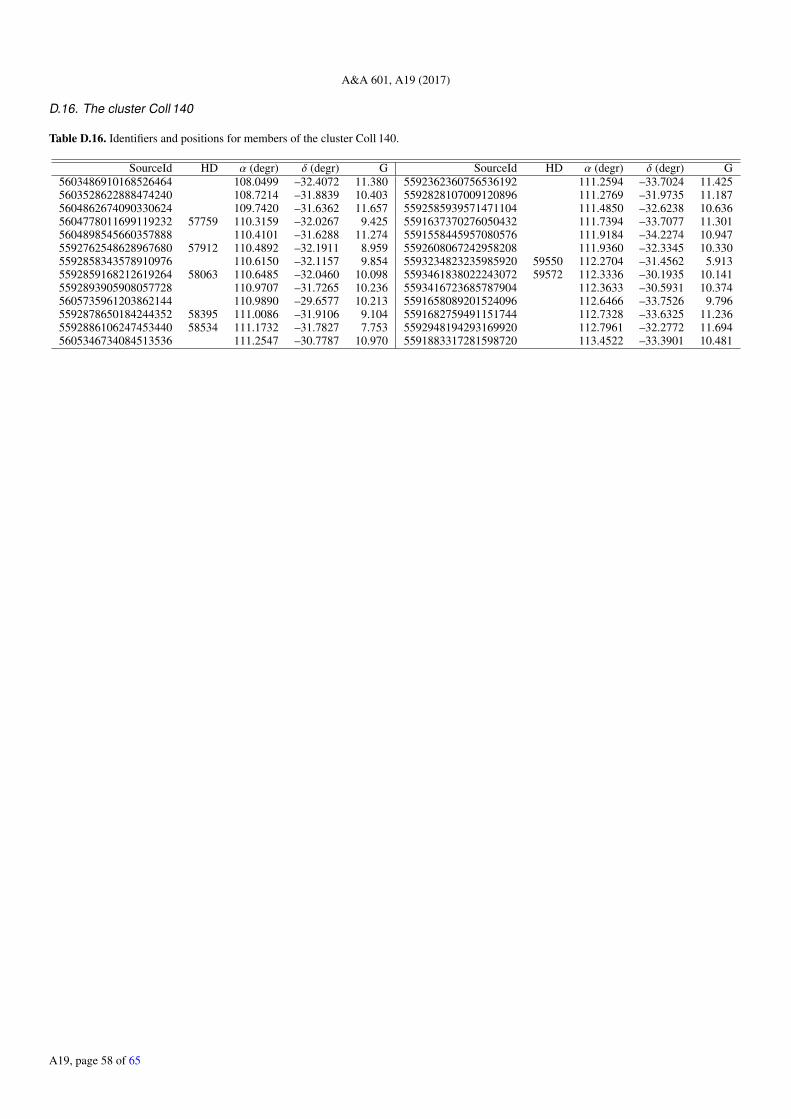
A&A 601, A19 (2017)
D.16. The cluster Coll 140
Table D.16. Identifiers and positions for members of the cluster Coll 140.
SourceId HD α (degr) δ (degr) G SourceId HD α (degr) δ (degr) G5603486910168526464 108.0499 –32.4072 11.380 5592362360756536192 111.2594 –33.7024 11.4255603528622888474240 108.7214 –31.8839 10.403 5592828107009120896 111.2769 –31.9735 11.1875604862674090330624 109.7420 –31.6362 11.657 5592585939571471104 111.4850 –32.6238 10.6365604778011699119232 57759 110.3159 –32.0267 9.425 5591637370276050432 111.7394 –33.7077 11.3015604898545660357888 110.4101 –31.6288 11.274 5591558445957080576 111.9184 –34.2274 10.9475592762548628967680 57912 110.4892 –32.1911 8.959 5592608067242958208 111.9360 –32.3345 10.3305592858343578910976 110.6150 –32.1157 9.854 5593234823235985920 59550 112.2704 –31.4562 5.9135592859168212619264 58063 110.6485 –32.0460 10.098 5593461838022243072 59572 112.3336 –30.1935 10.1415592893905908057728 110.9707 –31.7265 10.236 5593416723685787904 112.3633 –30.5931 10.3745605735961203862144 110.9890 –29.6577 10.213 5591658089201524096 112.6466 –33.7526 9.7965592878650184244352 58395 111.0086 –31.9106 9.104 5591682759491151744 112.7328 –33.6325 11.2365592886106247453440 58534 111.1732 –31.7827 7.753 5592948194293169920 112.7961 –32.2772 11.6945605346734084513536 111.2547 –30.7787 10.970 5591883317281598720 113.4522 –33.3901 10.481
A19, page 58 of 65
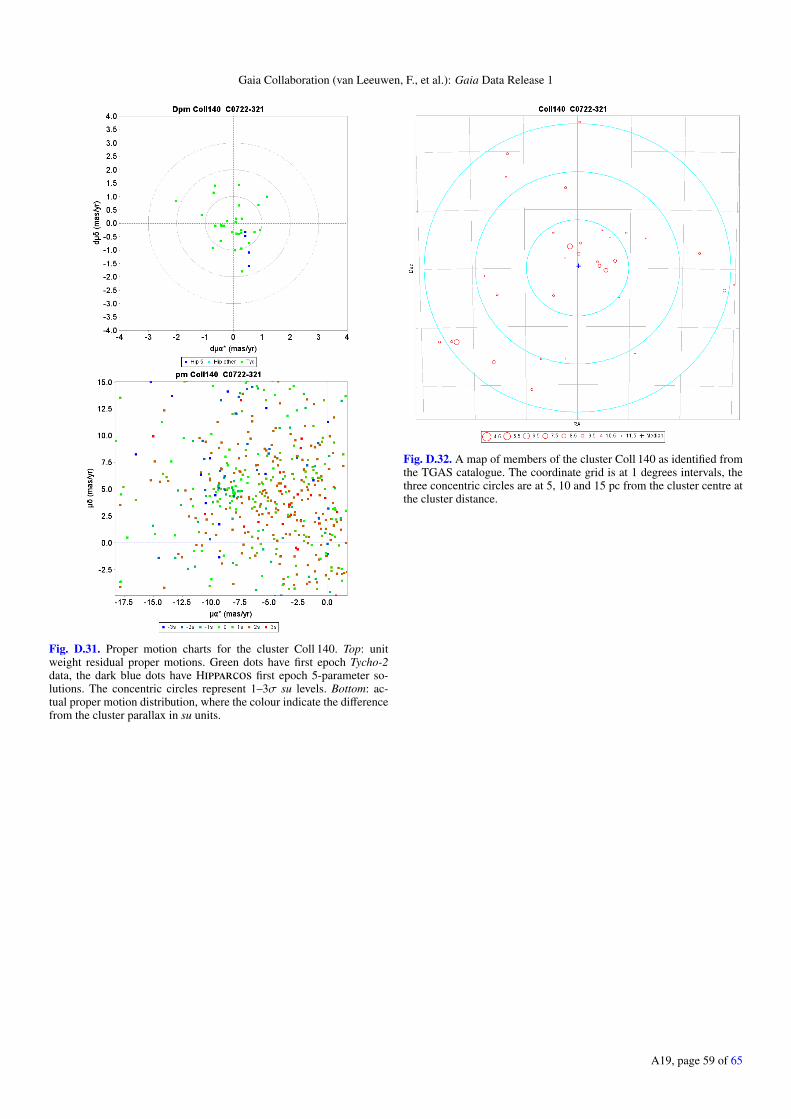
Gaia Collaboration (van Leeuwen, F., et al.): Gaia Data Release 1
Fig. D.31. Proper motion charts for the cluster Coll 140. Top: unitweight residual proper motions. Green dots have first epoch Tycho-2data, the dark blue dots have Hipparcos first epoch 5-parameter so-lutions. The concentric circles represent 1–3σ su levels. Bottom: ac-tual proper motion distribution, where the colour indicate the differencefrom the cluster parallax in su units.
Fig. D.32. A map of members of the cluster Coll 140 as identified fromthe TGAS catalogue. The coordinate grid is at 1 degrees intervals, thethree concentric circles are at 5, 10 and 15 pc from the cluster centre atthe cluster distance.
A19, page 59 of 65
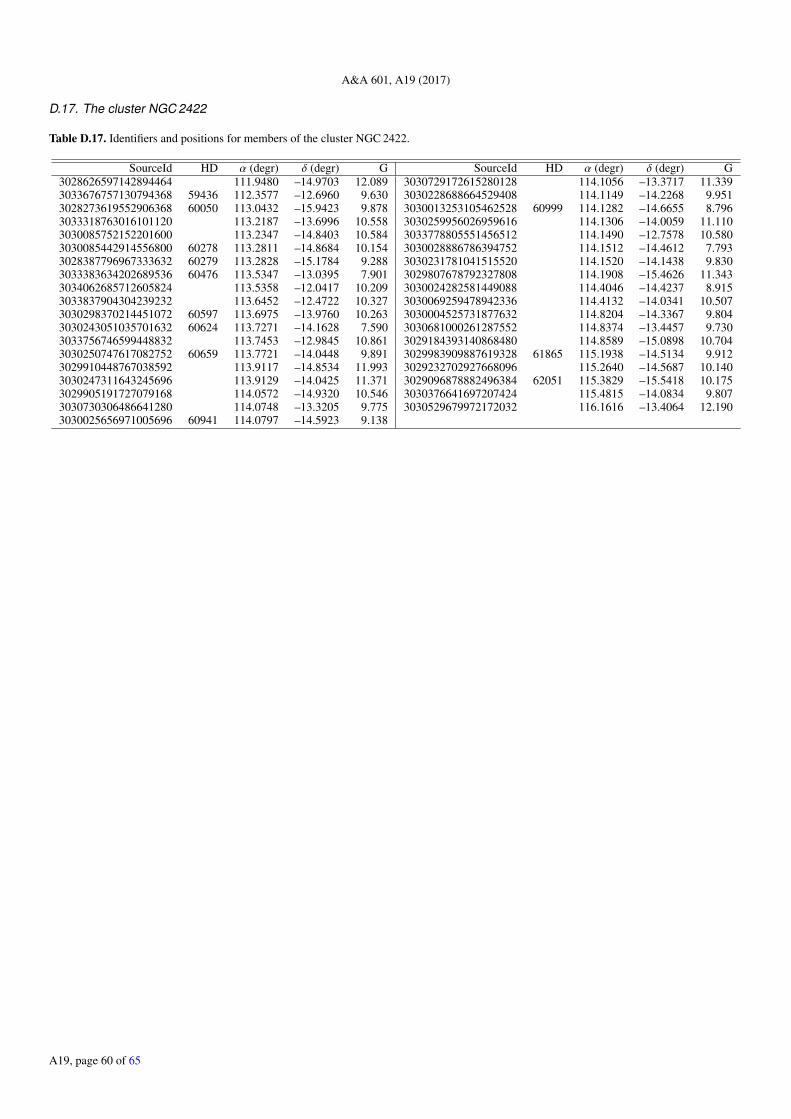
A&A 601, A19 (2017)
D.17. The cluster NGC 2422
Table D.17. Identifiers and positions for members of the cluster NGC 2422.
SourceId HD α (degr) δ (degr) G SourceId HD α (degr) δ (degr) G3028626597142894464 111.9480 –14.9703 12.089 3030729172615280128 114.1056 –13.3717 11.3393033676757130794368 59436 112.3577 –12.6960 9.630 3030228688664529408 114.1149 –14.2268 9.9513028273619552906368 60050 113.0432 –15.9423 9.878 3030013253105462528 60999 114.1282 –14.6655 8.7963033318763016101120 113.2187 –13.6996 10.558 3030259956026959616 114.1306 –14.0059 11.1103030085752152201600 113.2347 –14.8403 10.584 3033778805551456512 114.1490 –12.7578 10.5803030085442914556800 60278 113.2811 –14.8684 10.154 3030028886786394752 114.1512 –14.4612 7.7933028387796967333632 60279 113.2828 –15.1784 9.288 3030231781041515520 114.1520 –14.1438 9.8303033383634202689536 60476 113.5347 –13.0395 7.901 3029807678792327808 114.1908 –15.4626 11.3433034062685712605824 113.5358 –12.0417 10.209 3030024282581449088 114.4046 –14.4237 8.9153033837904304239232 113.6452 –12.4722 10.327 3030069259478942336 114.4132 –14.0341 10.5073030298370214451072 60597 113.6975 –13.9760 10.263 3030004525731877632 114.8204 –14.3367 9.8043030243051035701632 60624 113.7271 –14.1628 7.590 3030681000261287552 114.8374 –13.4457 9.7303033756746599448832 113.7453 –12.9845 10.861 3029184393140868480 114.8589 –15.0898 10.7043030250747617082752 60659 113.7721 –14.0448 9.891 3029983909887619328 61865 115.1938 –14.5134 9.9123029910448767038592 113.9117 –14.8534 11.993 3029232702927668096 115.2640 –14.5687 10.1403030247311643245696 113.9129 –14.0425 11.371 3029096878882496384 62051 115.3829 –15.5418 10.1753029905191727079168 114.0572 –14.9320 10.546 3030376641697207424 115.4815 –14.0834 9.8073030730306486641280 114.0748 –13.3205 9.775 3030529679972172032 116.1616 –13.4064 12.1903030025656971005696 60941 114.0797 –14.5923 9.138
A19, page 60 of 65
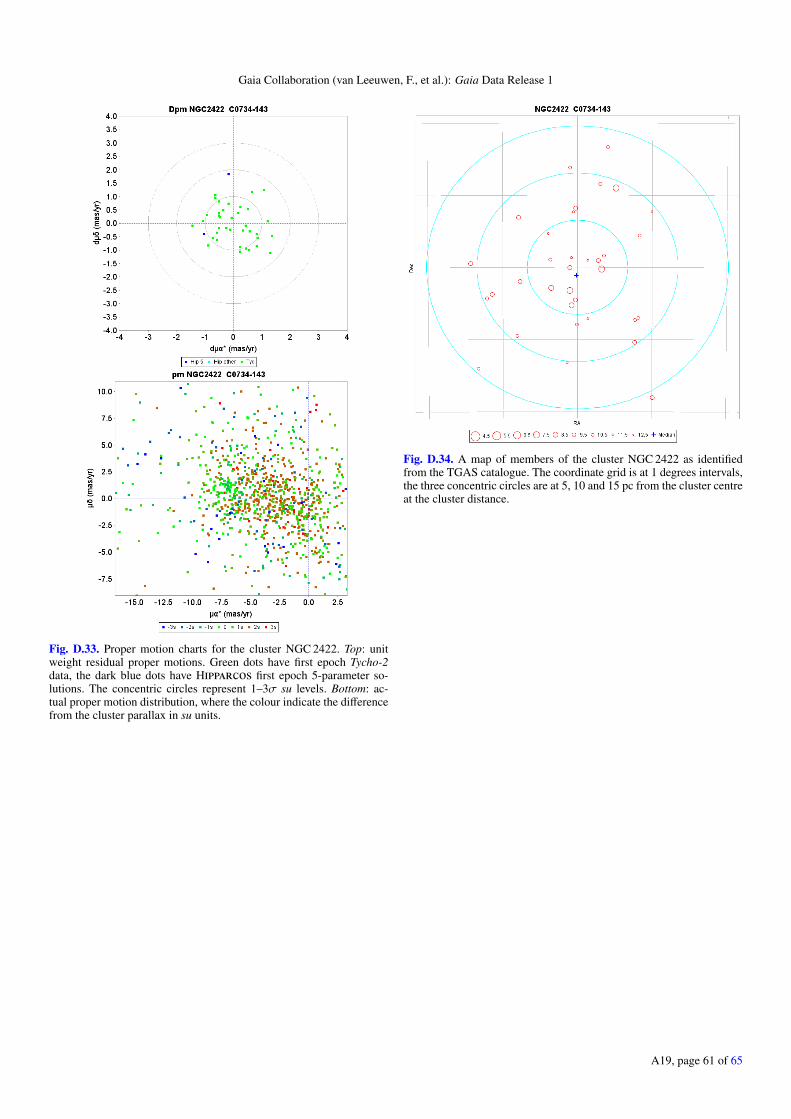
Gaia Collaboration (van Leeuwen, F., et al.): Gaia Data Release 1
Fig. D.33. Proper motion charts for the cluster NGC 2422. Top: unitweight residual proper motions. Green dots have first epoch Tycho-2data, the dark blue dots have Hipparcos first epoch 5-parameter so-lutions. The concentric circles represent 1–3σ su levels. Bottom: ac-tual proper motion distribution, where the colour indicate the differencefrom the cluster parallax in su units.
Fig. D.34. A map of members of the cluster NGC 2422 as identifiedfrom the TGAS catalogue. The coordinate grid is at 1 degrees intervals,the three concentric circles are at 5, 10 and 15 pc from the cluster centreat the cluster distance.
A19, page 61 of 65
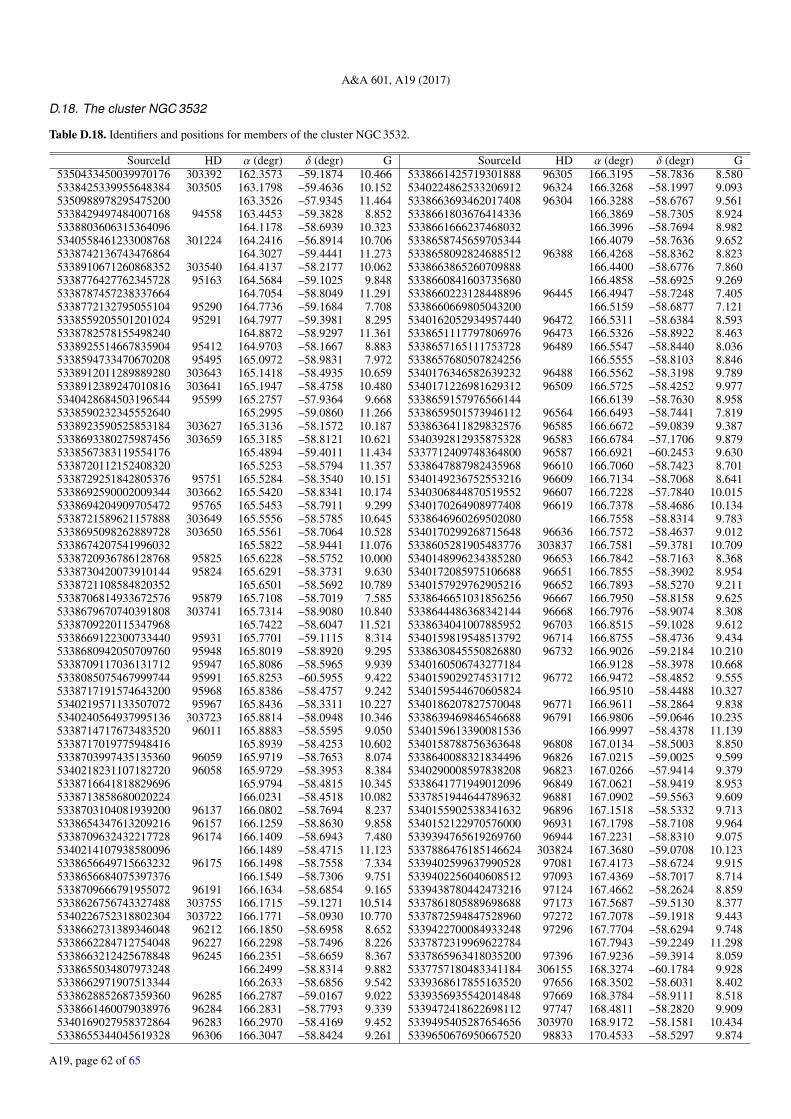
A&A 601, A19 (2017)
D.18. The cluster NGC 3532
Table D.18. Identifiers and positions for members of the cluster NGC 3532.
SourceId HD α (degr) δ (degr) G SourceId HD α (degr) δ (degr) G5350433450039970176 303392 162.3573 –59.1874 10.466 5338661425719301888 96305 166.3195 –58.7836 8.5805338425339955648384 303505 163.1798 –59.4636 10.152 5340224862533206912 96324 166.3268 –58.1997 9.0935350988978295475200 163.3526 –57.9345 11.464 5338663693462017408 96304 166.3288 –58.6767 9.5615338429497484007168 94558 163.4453 –59.3828 8.852 5338661803676414336 166.3869 –58.7305 8.9245338803606315364096 164.1178 –58.6939 10.323 5338661666237468032 166.3996 –58.7694 8.9825340558461233008768 301224 164.2416 –56.8914 10.706 5338658745659705344 166.4079 –58.7636 9.6525338742136743476864 164.3027 –59.4441 11.273 5338658092824688512 96388 166.4268 –58.8362 8.8235338910671260868352 303540 164.4137 –58.2177 10.062 5338663865260709888 166.4400 –58.6776 7.8605338776427762345728 95163 164.5684 –59.1025 9.848 5338660841603735680 166.4858 –58.6925 9.2695338787457238337664 164.7054 –58.8049 11.291 5338660223128448896 96445 166.4947 –58.7248 7.4055338772132795055104 95290 164.7736 –59.1684 7.708 5338660669805043200 166.5159 –58.6877 7.1215338559205501201024 95291 164.7977 –59.3981 8.295 5340162052934957440 96472 166.5311 –58.6384 8.5935338782578155498240 164.8872 –58.9297 11.361 5338651117797806976 96473 166.5326 –58.8922 8.4635338925514667835904 95412 164.9703 –58.1667 8.883 5338657165111753728 96489 166.5547 –58.8440 8.0365338594733470670208 95495 165.0972 –58.9831 7.972 5338657680507824256 166.5555 –58.8103 8.8465338912011289889280 303643 165.1418 –58.4935 10.659 5340176346582639232 96488 166.5562 –58.3198 9.7895338912389247010816 303641 165.1947 –58.4758 10.480 5340171226981629312 96509 166.5725 –58.4252 9.9775340428684503196544 95599 165.2757 –57.9364 9.668 5338659157976566144 166.6139 –58.7630 8.9585338590232345552640 165.2995 –59.0860 11.266 5338659501573946112 96564 166.6493 –58.7441 7.8195338923590525853184 303627 165.3136 –58.1572 10.187 5338636411829832576 96585 166.6672 –59.0839 9.3875338693380275987456 303659 165.3185 –58.8121 10.621 5340392812935875328 96583 166.6784 –57.1706 9.8795338567383119554176 165.4894 –59.4011 11.434 5337712409748364800 96587 166.6921 –60.2453 9.6305338720112152408320 165.5253 –58.5794 11.357 5338647887982435968 96610 166.7060 –58.7423 8.7015338729251842805376 95751 165.5284 –58.3540 10.151 5340149236752553216 96609 166.7134 –58.7068 8.6415338692590002009344 303662 165.5420 –58.8341 10.174 5340306844870519552 96607 166.7228 –57.7840 10.0155338694204909705472 95765 165.5453 –58.7911 9.299 5340170264908977408 96619 166.7378 –58.4686 10.1345338721589621157888 303649 165.5556 –58.5785 10.645 5338646960269502080 166.7558 –58.8314 9.7835338695098262889728 303650 165.5561 –58.7064 10.528 5340170299268715648 96636 166.7572 –58.4637 9.0125338674207541996032 165.5822 –58.9441 11.076 5338605281905483776 303837 166.7581 –59.3781 10.7095338720936786128768 95825 165.6228 –58.5752 10.000 5340148996234385280 96653 166.7842 –58.7163 8.3685338730420073910144 95824 165.6291 –58.3731 9.630 5340172085975106688 96651 166.7855 –58.3902 8.9545338721108584820352 165.6501 –58.5692 10.789 5340157929762905216 96652 166.7893 –58.5270 9.2115338706814933672576 95879 165.7108 –58.7019 7.585 5338646651031856256 96667 166.7950 –58.8158 9.6255338679670740391808 303741 165.7314 –58.9080 10.840 5338644486368342144 96668 166.7976 –58.9074 8.3085338709220115347968 165.7422 –58.6047 11.521 5338634041007885952 96703 166.8515 –59.1028 9.6125338669122300733440 95931 165.7701 –59.1115 8.314 5340159819548513792 96714 166.8755 –58.4736 9.4345338680942050709760 95948 165.8019 –58.8920 9.295 5338630845550826880 96732 166.9026 –59.2184 10.2105338709117036131712 95947 165.8086 –58.5965 9.939 5340160506743277184 166.9128 –58.3978 10.6685338085075467999744 95991 165.8253 –60.5955 9.422 5340159029274531712 96772 166.9472 –58.4852 9.5555338717191574643200 95968 165.8386 –58.4757 9.242 5340159544670605824 166.9510 –58.4488 10.3275340219571133507072 95967 165.8436 –58.3311 10.227 5340186207827570048 96771 166.9611 –58.2864 9.8385340240564937995136 303723 165.8814 –58.0948 10.346 5338639469846546688 96791 166.9806 –59.0646 10.2355338714717673483520 96011 165.8883 –58.5595 9.050 5340159613390081536 166.9997 –58.4378 11.1395338717019775948416 165.8939 –58.4253 10.602 5340158788756363648 96808 167.0134 –58.5003 8.8505338703997435135360 96059 165.9719 –58.7653 8.074 5338640088321834496 96826 167.0215 –59.0025 9.5995340218231107182720 96058 165.9729 –58.3953 8.384 5340290008597838208 96823 167.0266 –57.9414 9.3795338716641818829696 165.9794 –58.4815 10.345 5338641771949012096 96849 167.0621 –58.9419 8.9535338713858680020224 166.0231 –58.4518 10.082 5337851944644789632 96881 167.0902 –59.5563 9.6095338703104081939200 96137 166.0802 –58.7694 8.237 5340155902538341632 96896 167.1518 –58.5332 9.7135338654347613209216 96157 166.1259 –58.8630 9.858 5340152122970576000 96931 167.1798 –58.7108 9.9645338709632432217728 96174 166.1409 –58.6943 7.480 5339394765619269760 96944 167.2231 –58.8310 9.0755340214107938580096 166.1489 –58.4715 11.123 5337886476185146624 303824 167.3680 –59.0708 10.1235338656649715663232 96175 166.1498 –58.7558 7.334 5339402599637990528 97081 167.4173 –58.6724 9.9155338656684075397376 166.1549 –58.7306 9.751 5339402256040608512 97093 167.4369 –58.7017 8.7145338709666791955072 96191 166.1634 –58.6854 9.165 5339438780442473216 97124 167.4662 –58.2624 8.8595338626756743327488 303755 166.1715 –59.1271 10.514 5337861805889698688 97173 167.5687 –59.5130 8.3775340226752318802304 303722 166.1771 –58.0930 10.770 5337872594847528960 97272 167.7078 –59.1918 9.4435338662731389346048 96212 166.1850 –58.6958 8.652 5339422700084933248 97296 167.7704 –58.6294 9.7485338662284712754048 96227 166.2298 –58.7496 8.226 5337872319969622784 167.7943 –59.2249 11.2985338663212425678848 96245 166.2351 –58.6659 8.367 5337865963418035200 97396 167.9236 –59.3914 8.0595338655034807973248 166.2499 –58.8314 9.882 5337757180483341184 306155 168.3274 –60.1784 9.9285338662971907513344 166.2633 –58.6856 9.542 5339368617855163520 97656 168.3502 –58.6031 8.4025338628852687359360 96285 166.2787 –59.0167 9.022 5339356935542014848 97669 168.3784 –58.9111 8.5185338661460079038976 96284 166.2831 –58.7793 9.339 5339472418622698112 97747 168.4811 –58.2820 9.9095340169027958372864 96283 166.2970 –58.4169 9.452 5339495405287654656 303970 168.9172 –58.1581 10.4345338655344045619328 96306 166.3047 –58.8424 9.261 5339650676950667520 98833 170.4533 –58.5297 9.874
A19, page 62 of 65
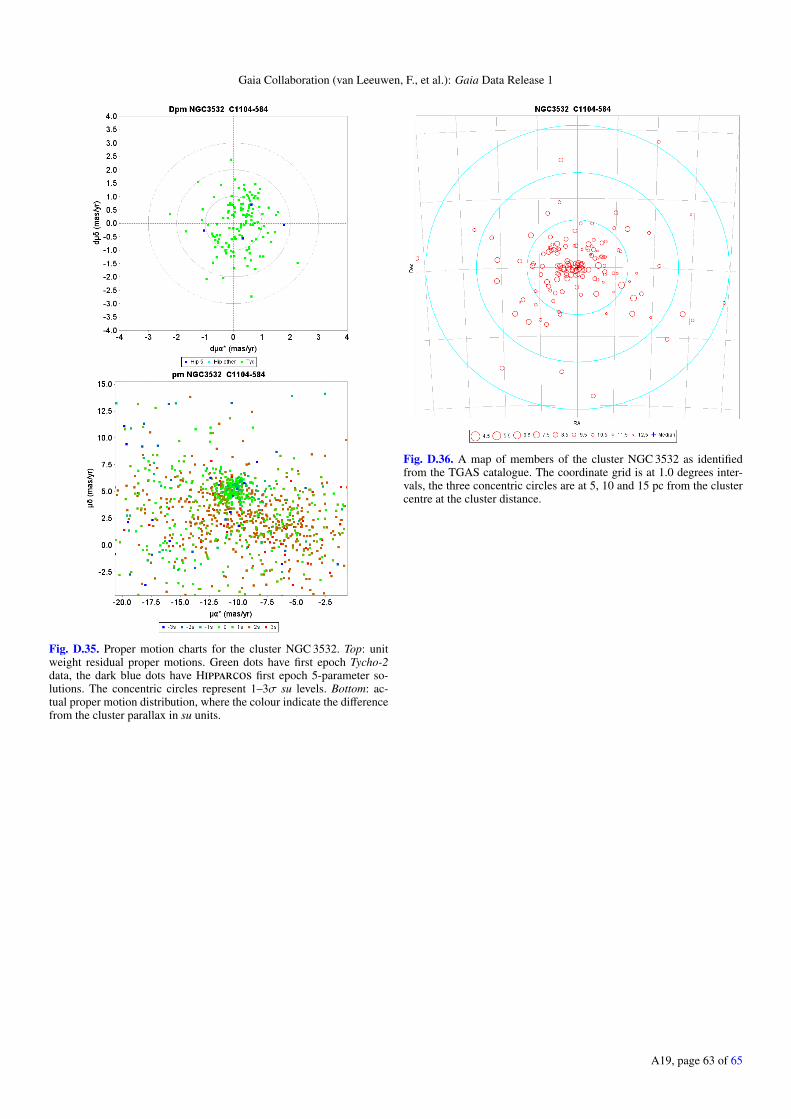
Gaia Collaboration (van Leeuwen, F., et al.): Gaia Data Release 1
Fig. D.35. Proper motion charts for the cluster NGC 3532. Top: unitweight residual proper motions. Green dots have first epoch Tycho-2data, the dark blue dots have Hipparcos first epoch 5-parameter so-lutions. The concentric circles represent 1–3σ su levels. Bottom: ac-tual proper motion distribution, where the colour indicate the differencefrom the cluster parallax in su units.
Fig. D.36. A map of members of the cluster NGC 3532 as identifiedfrom the TGAS catalogue. The coordinate grid is at 1.0 degrees inter-vals, the three concentric circles are at 5, 10 and 15 pc from the clustercentre at the cluster distance.
A19, page 63 of 65
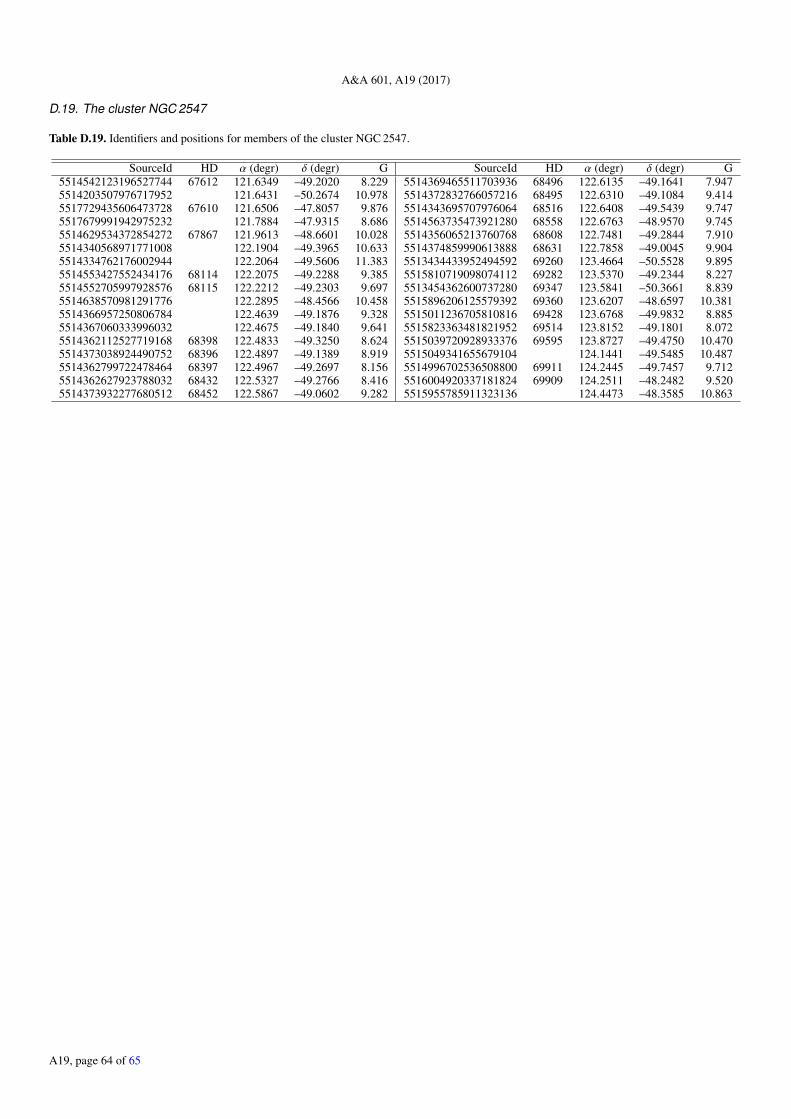
A&A 601, A19 (2017)
D.19. The cluster NGC 2547
Table D.19. Identifiers and positions for members of the cluster NGC 2547.
SourceId HD α (degr) δ (degr) G SourceId HD α (degr) δ (degr) G5514542123196527744 67612 121.6349 –49.2020 8.229 5514369465511703936 68496 122.6135 –49.1641 7.9475514203507976717952 121.6431 –50.2674 10.978 5514372832766057216 68495 122.6310 –49.1084 9.4145517729435606473728 67610 121.6506 –47.8057 9.876 5514343695707976064 68516 122.6408 –49.5439 9.7475517679991942975232 121.7884 –47.9315 8.686 5514563735473921280 68558 122.6763 –48.9570 9.7455514629534372854272 67867 121.9613 –48.6601 10.028 5514356065213760768 68608 122.7481 –49.2844 7.9105514340568971771008 122.1904 –49.3965 10.633 5514374859990613888 68631 122.7858 –49.0045 9.9045514334762176002944 122.2064 –49.5606 11.383 5513434433952494592 69260 123.4664 –50.5528 9.8955514553427552434176 68114 122.2075 –49.2288 9.385 5515810719098074112 69282 123.5370 –49.2344 8.2275514552705997928576 68115 122.2212 –49.2303 9.697 5513454362600737280 69347 123.5841 –50.3661 8.8395514638570981291776 122.2895 –48.4566 10.458 5515896206125579392 69360 123.6207 –48.6597 10.3815514366957250806784 122.4639 –49.1876 9.328 5515011236705810816 69428 123.6768 –49.9832 8.8855514367060333996032 122.4675 –49.1840 9.641 5515823363481821952 69514 123.8152 –49.1801 8.0725514362112527719168 68398 122.4833 –49.3250 8.624 5515039720928933376 69595 123.8727 –49.4750 10.4705514373038924490752 68396 122.4897 –49.1389 8.919 5515049341655679104 124.1441 –49.5485 10.4875514362799722478464 68397 122.4967 –49.2697 8.156 5514996702536508800 69911 124.2445 –49.7457 9.7125514362627923788032 68432 122.5327 –49.2766 8.416 5516004920337181824 69909 124.2511 –48.2482 9.5205514373932277680512 68452 122.5867 –49.0602 9.282 5515955785911323136 124.4473 –48.3585 10.863
A19, page 64 of 65
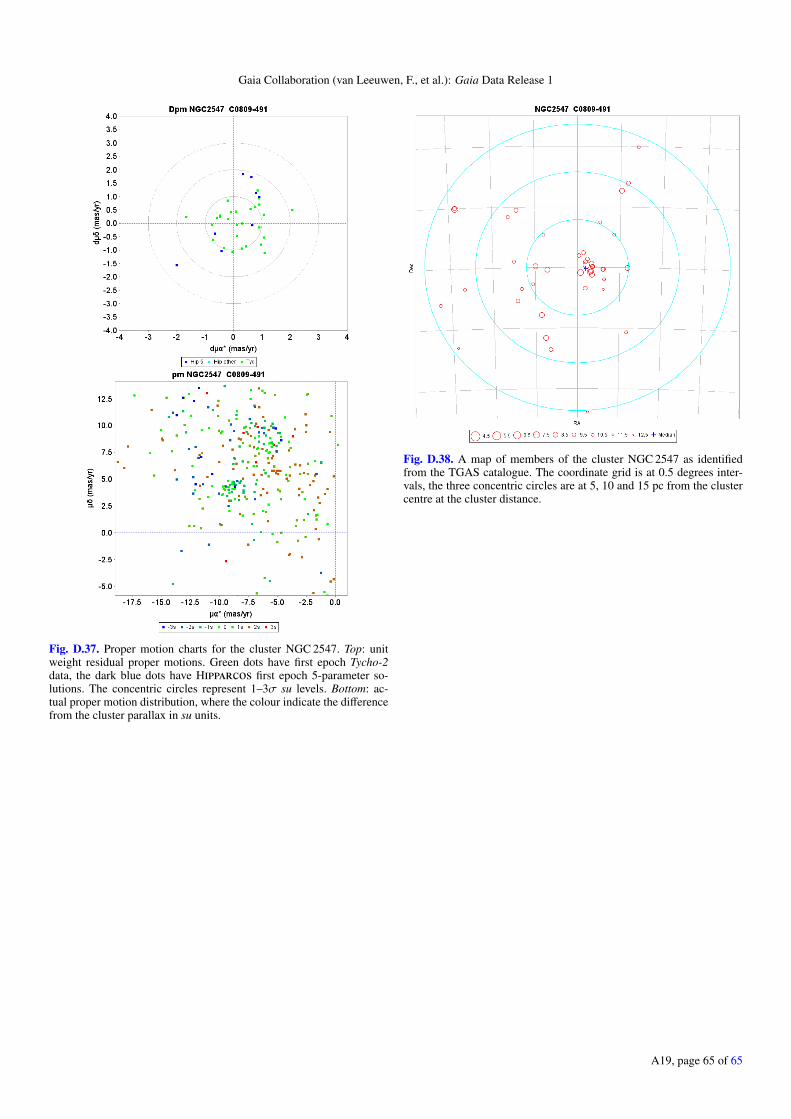
Gaia Collaboration (van Leeuwen, F., et al.): Gaia Data Release 1
Fig. D.37. Proper motion charts for the cluster NGC 2547. Top: unitweight residual proper motions. Green dots have first epoch Tycho-2data, the dark blue dots have Hipparcos first epoch 5-parameter so-lutions. The concentric circles represent 1–3σ su levels. Bottom: ac-tual proper motion distribution, where the colour indicate the differencefrom the cluster parallax in su units.
Fig. D.38. A map of members of the cluster NGC 2547 as identifiedfrom the TGAS catalogue. The coordinate grid is at 0.5 degrees inter-vals, the three concentric circles are at 5, 10 and 15 pc from the clustercentre at the cluster distance.
A19, page 65 of 65