Embed Size (px)
Citation preview
University of Montana University of Montana
ScholarWorks at University of Montana ScholarWorks at University of Montana
Chemistry and Biochemistry Faculty Publications Chemistry and Biochemistry
9-20-1996
Open-Path Fourier Transform Infrared Studies of Large-Scale Open-Path Fourier Transform Infrared Studies of Large-Scale
Laboratory Biomass Fires Laboratory Biomass Fires
Robert J. Yokelson University of Montana - Missoula, [email protected]
David W. T. Griffith University of Wollongong
Darold E. Ward USDA Forest Service - Rocky Mountain Research Station
Follow this and additional works at: https://scholarworks.umt.edu/chem_pubs
Part of the Biochemistry Commons, and the Chemistry Commons
Let us know how access to this document benefits you.
Recommended Citation Recommended Citation Yokelson, Robert J.; Griffith, David W. T.; and Ward, Darold E., "Open-Path Fourier Transform Infrared Studies of Large-Scale Laboratory Biomass Fires" (1996). Chemistry and Biochemistry Faculty Publications. 44. https://scholarworks.umt.edu/chem_pubs/44
This Article is brought to you for free and open access by the Chemistry and Biochemistry at ScholarWorks at University of Montana. It has been accepted for inclusion in Chemistry and Biochemistry Faculty Publications by an authorized administrator of ScholarWorks at University of Montana. For more information, please contact [email protected].
JOURNAL OF GEOPHYSICAL RESEARCH, VOL. 101, NO. D15, PAGES 21,067-21,080, SEPTEMBER 20, 1996
Open-path Fourier transform infrared studies of large-scale laboratory biomass fires
Robert J. Yokelson
Department of Chemistry, University of Montana, Missoula
David w. T. Griffi•
Department of Chemistry, University of Wollongong, Wollongong, New South Wales, Australia
Darold E. Ward
USDA Forest Servioe, Intermountain Researoh Station, Missoula, Montana
Abstract. A series of nine large-scale, open fires was conducted in the Intermountain Fire Sciences Laboratory (IFSL) controlled-environment combustion facility. The fuels were pure pine needles or sagebrush or mixed fuels simulating forest-floor, ground fires; crown fires; broadcast burns; and slash pile burns. Mid-infrared spectra of the smoke were recorded throughout each fire by open path Fourier transform infrared (FTIR) spectroscopy at 0.12 cm 4 resolution over a 3 m cross-stack pathlength and analyzed to provide pseudocontinuous, simultaneous concentrations of up to 16 compounds. Simultaneous measurements were made of fuel mass loss, stack gas temperature, and total mass flow up the stack. The products detected are classified by the type of process that dominates in producing them. Carbon dioxide is the dominant emission of (and primarily produced by) flaming combustion, from which we also measure nitric oxide, nitrogen dioxide, sulfitr dioxide, and most of the water vapor from combustion and fuel moisture. Carbon monoxide is the dominant emission formed primarily by smoldering combustion from which we also measure carbon dioxide, methane, ammonia, and ethane. A significant fraction of the total emissions is unoxidized pyrolysis products; examples are methanol, formaldehyde, acetic and formic acid, ethene (ethylene), ethyne (acetylene), and hydrogen cyanide. Relatively few previous data exist for many of these compounds and they are likely to have an important but as yet poorly understood role in plume chemistry. Large differences in emissions occur from different fire and fuel types, and the observed temporal behavior of the emissions is found to depend strongly on the fuel bed and product type.
Introduction
Biomass burning injects significant amounts of trace gases and particles into the regional and global atmosphere [Crutzen and Andreae, 1990]. Quantification of representative emis- sions fi'om fires is difficult, and different configurations of analysis techniques and sampling platforms have been util- ized. Aircraft can probe a large area of well-mixed, integrated emissions, investigate secondary chemistry, and provide details on transport [Andreae et al., 1988a, b]. How- ever, airborne sampling is expensive; it is difficult to monitor a single fire continuously fi'om beginning to end; and specific knowledge of the fuels and fire types are difficult to correlate with measurements. Ground-based measurements provide the opporttmity for more detail on the fire and fuels [Delmas et al., 1991 ] but may tend to incorrectly estimate the emissions in the convection column above the fire [Andreae et al., 1988a]. Tower-based measurements have been implemented
Copyright 1996 by the American Geophysical Union.
Paper number 96J-D01800. 0148-0227/96/96JD-01800509.00
as a means of more representative ground-based sampling [Ward et al., 1992].
There are a number of advantages in studying biomass fires in the laboratory. They include burning under controlled conditions, where the chemical and physical properties of the fuel and environment may be known in detail, and capture of all the smoke for the entire course of the fire so that emission
factors for any measurable airborne species can be determined accurately. The laboratory characterization of the products of biomass burning began with work to assess the contribution of forest fires in the southeastern United States to regional air pollution [Ryan and McMahon, 1976] and the emissions due to burning agricultural waste [Darley et al., 1966] or wood for heat [Dasch, 1982]. This early work often distinguished be- tween flaming and smoldering combustion, distillation and pyrolysis, and normally featured detection of CO2, CO, and NOx. Formic acid and acetic acid were later added to the range of products detected in laboratory fires [Talbot et al., 1988]. The laboratory experimental fires of Loberr et al. [ 1991] were the first to characterize a wide variety of emission products of particular importance to atmospheric chemistry.
In addition to the challenges presented by the need to sam- ple fires representatively, there is the additional challenge of
21,067
21,068 YOKELSON ET AL.: FTIR STUDIES OF BIOMASS FIRE EMISSIONS
identifying insmental techniques that can cope with hot, re- active samples where the potential for chemical interference and the dynamic range of concentrations is very high. The companion work to the study described here was the first application of open-path FTIR spectroscopy to the analysis of smoke from biomass burning and focused on prescribed fires in sagebrush and forestry operations in the western United States [Griffith et al., 1991 ]. This paper demonstrated the ad- vantages of an FTIR-based study of biomass fires: (1) Simultaneous measurements can be made of a wide variety of species with good selectivity (i.e., resistance to interference ) over a -vide range of concentrations with detection limits in the low parts per billion range. (2) Measurements can be made pseudocontinuously in real time so that dynamic pro- cesses can be followed. (3) There is no need to take samples and no possibility of sampling- or storage-related artifacts so that reactive gases can be quantified. (4) The measurement is path integrated, ' averaging over small-scale local variations. It is thus relatively immune to spatial variation compared with point sampling.
This work extends the open-path FTIR field studies of Griffith et al. [ 1991 ] to controlled fires in a large-scale com- bustion laboratory at the Intermountain Fire Sciences Laboratory (IFSL). This paper describes a preliminai3t study in which measurements of smoke composition for up to 16 chemical species from 9 biomass fires were made in October 1989. The study demonstrates the potential of the open-path FTIR technique for laboratory fires and provides a sufficient body of data to yield significant insights into biomass fire emissions. The technique will be further developed and ap- plied with a dedicated FTIR system recently installed in the IFSL combustion laboratory.
Methods
Fire and Fuel Types
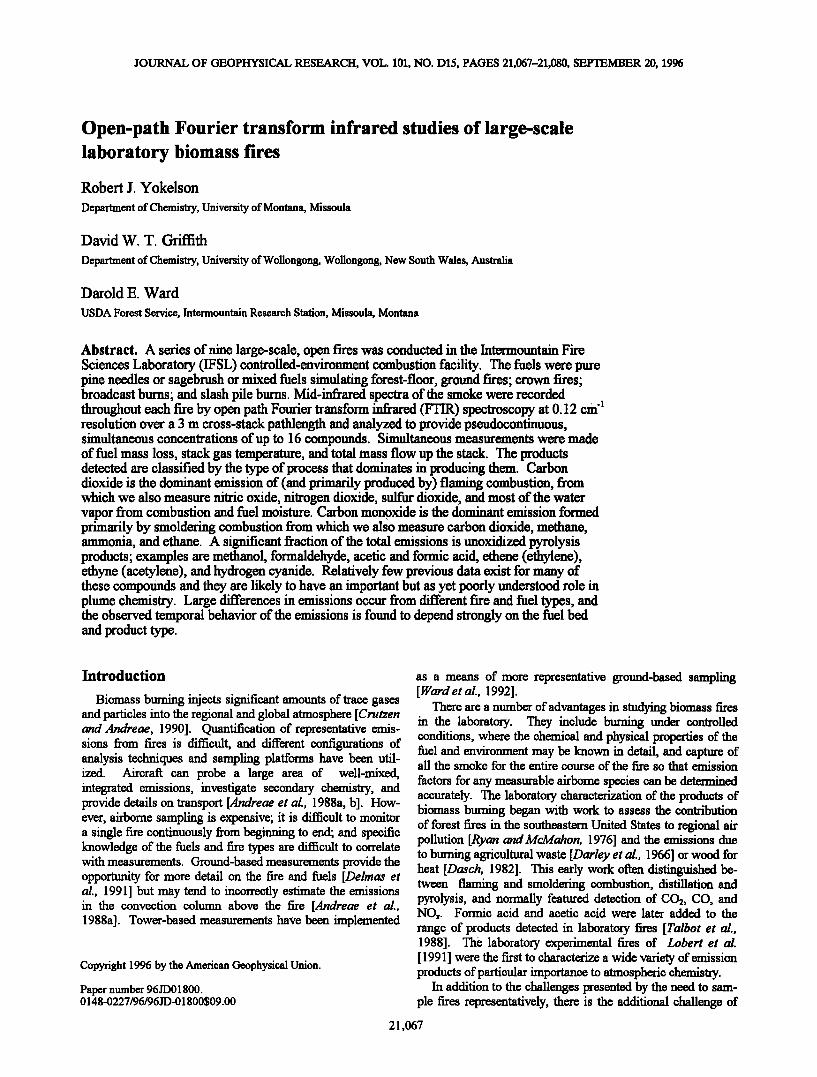
Table 1 summarizes the fuels burnt in each of nine experi- mental fires. The fuels were selected for the fires with sevei'al objectives in mind. There were two fires each of brown pon- derosa pine needles (fires 3 and 5) and freshly cut sagebrush (fires 8 and 12), which offered the oppommity to measure separately the products of important fuel components in west- em United States land management fkes, to qualitatively investigate the natural variation in nominally identical fkes and, especially from the pine needles, to investigate the tem- poral behavior of fire emissions in a relatively simple fuel bed.
Many important biomass fires bum in an inhomogeneous mixture of several fuels [Kauffman et al., 1994; $eavoy, 1973]. We therefore included preliminary simulations of widely occumng natural and anthropogenic fke types. Two of the fuel beds (fires 9 and 10) contained litter and "duff' (partially decomposed organic matter) and represent attempts to simulate a typical forest-floor groUnd fke in a coniferous forest. A tinther common type of wfidfire is the crown fire which, along with the ground fuels, consumes the foliage of live, mature trees. A low-intensity crown fke was simulated by fire 11, which featured vertically oriented green pine limbs over a base of litter, dry needles, and small woody fuel. Fi- nally, the two main fke types used to dispose of "activity fuels" (logging waste or harvesting residues also termed "slash") were also simulated. Unpiled, scattered fuels were burned in fke 6, a broadcast bum simulation, and fire 7 simulated burning piled, woody logging waste.
Fuel contents were not systematically determined due to malfunction of the CHN analyzer. Where required in calcula-
Table 1. Fuel Components and Amount Used for Fire-Type Simulations
Fire Type Number Fuel Bed Composition Mass Percent Comment
Pine needle 1 3 pine needles 100 Pine nccdlc 2 5 pine needles 100 Sagebrush 1 8 sagebrush 100 Sagebrush 2 12 sagebrush 100
Broadcast 6 duff 44 pine needles 14 twigs 18 wood 24
pinus ponderosa pinus ponderosa artemisia tridentata artemisia tridentata
pinus ponderosa
Slash 7
Ground 1 9
Ground 2 10
Crown 11
twigs and needles 10 small branches 90
pine needles 27 pine needles and duff 73
duff 39
tvi. 'gs and needles 35 pine needles 26
twigs and needles 26 wood < 30mm 19 pine needles 19 green needles and twigs 36
pinus ponderosa
pinus ponderosa
pinus contorta pinus ponderosa
pinus contorta pseudotsuga menziesii
pinus ponderosa
YOKELSON ET AL.' FTIR STUDIES OF BIOMASS FIRE EMISSIONS 21,069
tions, carbon content is assumed to be the commonly accepted value of 45% of dry matter for all fuels except brown ponder- osa pine needles. For this fuel, 51% was assumed based on Klemmedson [1975] and a small number of measurements of the composition of subsamples with a Perkin-Elmer 2400 CHN analyzer. The N:C ratio determined from these meas- urements was 0.6%.
Experiment
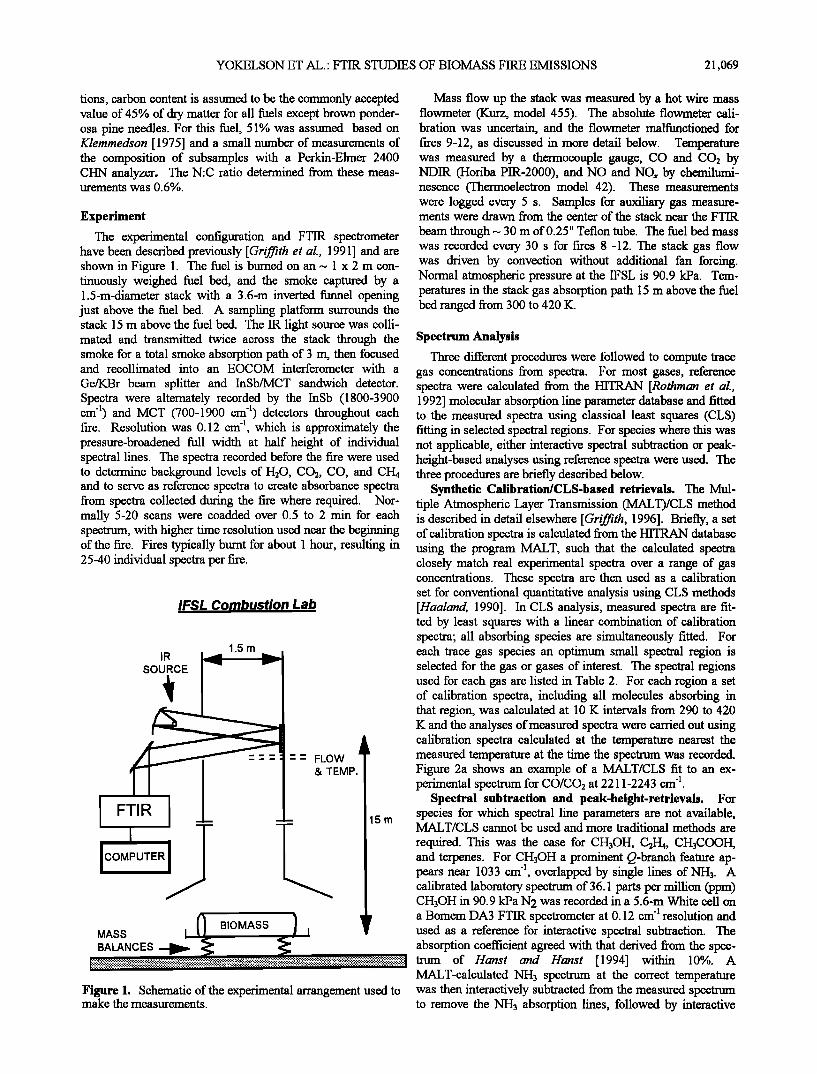
The experimental configuration and FTIR spectrometer have been described previously [Griffith et al., 1991] and are shown in Figure 1. The fuel is burned on an -• 1 x 2 m con- tinuously weighed fuel bed, and the smoke captured by a 1.5-m-diameter stack with a 3.6-m inverted funnel opening just above the fuel bed. A sampling platform surrounds the stack 15 m above the fuel bed. The IR light source was colli- mated and transmitted twice across the stack through the smoke for a total smoke absorption path of 3 m, then focused and recollimated into an EOCOM interferometer with a
Ge/KBr beam splitter and InSb/MCT sandwich detector. Spectra were alternately recorded by the InSb (1800-3900 cm 4) and MCT (700-1900 cm 4) detectors throughout each fire. Resolution was 0.12 cm 4, which is approximately the pressure-broadened full width at half height of individual spectral lines. The spectra recorded before the fire were used to determine background levels of H20, CO2, CO, and CH4 and to serve as reference spectra to create absorbance spectra from spectra collected during the fire where required. Nor- mally 5-20 scans were coadded over 0.5 to 2 min for each spectrum, with higher time resolution used near the beginning of the fire. Fires typically burnt for about 1 hour, resulting in 25-40 individual spectra per fire.
IFSL Combustion Lab
IR
SOURCE
1.5 m
FTIR
COMPUTER
-- FLOW & TEMP.
15m
Mass flow up the stack was measured by a hot wire mass flowmeter (Kmz, model 455). The absolute flowmeter cali- bration was uncertain, and the flowmeter malfunctioned for fires 9-12, as discussed in more detail below. Temperature was measured by a thermocouple gauge, CO and CO2 by NDIR (Horiba PIR-2000), and NO and NOx by chemilumi- nesence (Thermoelectron model 42). These measurements were logged every 5 s. Samples for auxiliary gas measure- ments were drawn from the center of the stack near the FTIR
beam through • 30 m of 0.25" Teflon tube. The fuel bed mass was recorded every 30 s for fires 8 -12. The stack gas flow was driven by convection without additional fan forcing. Normal atmospheric pressure at the IFSL is 90.9 kPa. Tem- peratures in the stack gas absorption path 15 m above the fuel bed ranged from 300 to 420 K.
Spectrum Analysis
Three different procedures were followed to compute trace gas concentrations from spectra. For most gases, reference spectra were calculated from the HITRAN [Rothrnan et al., 1992] molecular absorption line parameter database and fitted to the measured spectra using classical least squares (CLS) fitting in selected spectral regions. For species where this was not applicable, either interactive spectral subtraction or peak- height-based analyses using reference spectra were used. The three procedures are briefly described below.
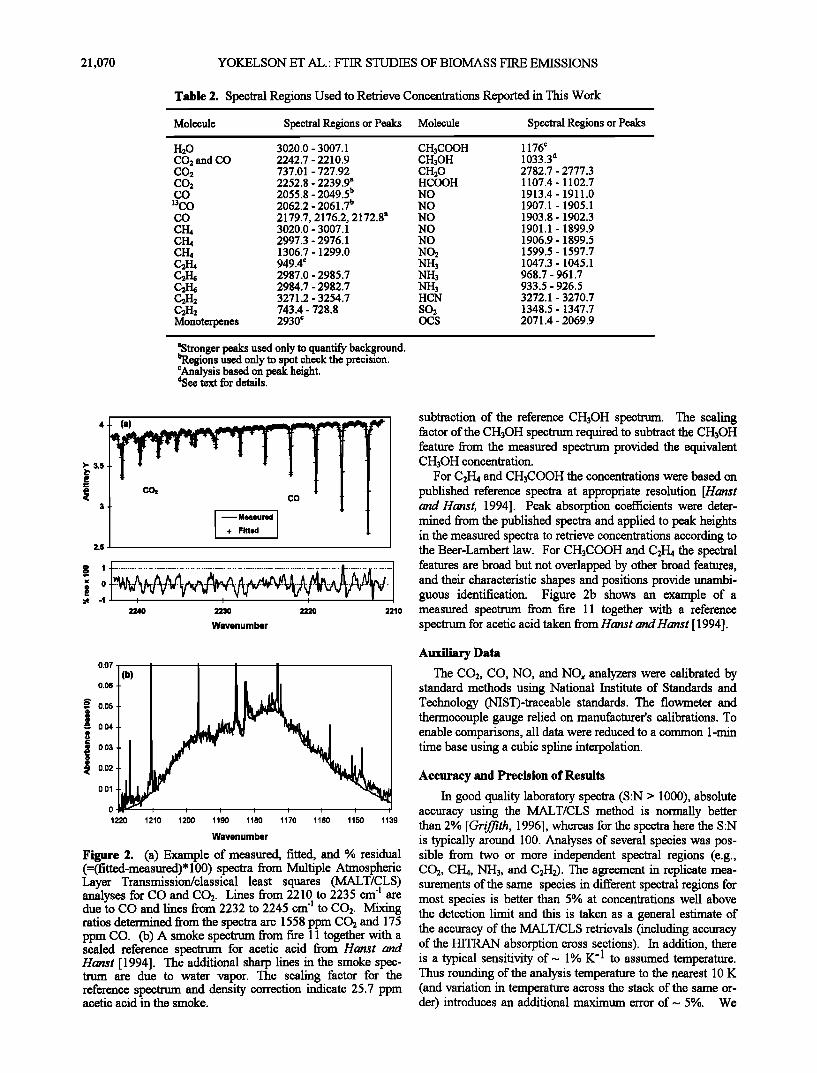
Synthetic Calibration/CLS-based retrievals. The Mul- tiple Atmospheric Layer Transmission (MALT)/CLS method is described in detail elsewhere [Griffith, 1996]. Briefly, a set of calibration spectra is calculated from the HITRAN database using the program MALT, such that the calculated spectra closely match real experimental spectra over a range of gas concentrations. These spectra are then used as a calibration set for conventional quantitative analysis using CLS methods [Hadland, 1990]. In CLS analysis, measured spectra are fit- ted by least squares with a linear combination of calibration spectra; all absorbing species are simultaneously fitted. For each trace gas species an optimum small spectral region is selected for the gas or gases of interest. The spectral regions used for each gas are listed in Table 2. For each region a set of calibration spectra, including all molecules absorbing in that region, was calculated at 10 K intervals from 290 to 420 K and the analyses of measured spectra were carded out using calibration spectra calculated at the temperature nearest the measured temperature at the time the spectrum was recorded. Figure 2a shows an example of a MALT/CLS fit to an ex- perimental spectrum for CO/CO2 at 2211-2243 cm 4.
Spectral subtraction and peak-height-retrievals. For species for which spectral line parameters are not available, MALT/CLS cannot be used and more traditional methods are
required. This was the case for CH3OH, C2I-In, CH3COOH, and terpenes. For CH3OH a prominent Q-branch feature ap- pears near 1033 cm 4, overlapped by single lines of NH3. A calibrated laboratory spectrum of 36.1 parts per million (ppm) CH3OH in 90.9 kPa N2 was recorded in a 5.6-m White cell on
! • • a Bomem DA3 FTIR spectrometer at 0.12 cm 4 resolution and BIOMASS MASS • . used as a reference for interactive spectral subtraction. The
BALANCES • -.•.., • absorption coefficient agreed with that derived from the spec- •::::::::::::::::::::::::::::::::::::::::::•::::::::::::::::::::::•[:::•::::::::::::::::::::::::::•::::::::::::::::::::::::::::::::::::::::::::::::::::::::::::::::::•:•::::•::[::::::•::•::[::[[::[::::•::::::::::::::::::::::::[•::::::::::::::::•::•:::::::::•::::::::::•::•::::::::•::::::::::::::::[•::::::::::::::[::::::::::•:::::::::::::::::::::•::::::::::::::::•::::::::::::::::•:::::::::[[[::::::::::::::::::::•::::::::::::::[::::::::::::::::[[• tram of Hanst and Hanst [1994] within 10%. A
MALT-calculated NH3 spectrum at the correct temperature Figure 1. Schematic of the experimental arrangement used to was then interactively subtracted from the measured spectrum make the measurements. to remove the NH3 absorption lines, followed by interactive
21,070 YOKELSON ET AL.' FTIR STUDIES OF BIOMASS FIRE EMISSIONS
Table 2. Spectral Regions Used to Retrieve Concentrations Reported in This Work
Molecule Spectral Regions or Peaks Molecule Spectral Regions or Peaks
H20 3020.0 - 3007.1 CH3COOH 1176 c CO2 and CO 2242.7 - 2210.9 CH3OH 1033.3 a CO• 737.01 - 727.92 CH20 2782.7 - 2777.3 CO2 2252.8 - 2239.9 a HCOOH 1107.4 - 1102.7 CO 2055.8 - 2049.5 b NO 1913.4 - 1911.0 •3CO 2062.2 - 2061.7 b NO 1907.1 - 1905.1 CO 2179.7, 2176.2, 2172.8 a NO 1903.8 - 1902.3 CI-h 3020.0 - 3007.1 NO 1901.1 - 1899.9 CI-In 2997.3 - 2976.1 NO 1906.9 - 1899.5 CI-h 1306.7 - 1299.0 NO• 1599.5 - 1597.7 C2I-I4 949.4 c NH3 1047.3 - 1045.1 C•H6 2987.0 - 2985.7 NH3 968.7 - 961.7 C•H6 2984.7 - 2982.7 NH3 933.5 - 926.5 C•H• 3271.2- 3254.7 HCN 3272.1 - 3270.7 C2H• 743.4- 728.8 SO• 1348.5 - 1347.7 Monoterpenes 2930 • OCS 2071.4 - 2069.9
nStronger peaks used only to quantify background. bRegions used only to spot check the precision. •Analysis based on peak height. aSee text for details.
>' 3.5
._
3
2.5
(a)
co•
-- Measured
+ Fitted
CO
o 1
.• -1 2240 2230 2220 2210
Wavenumber
0.07
0.06
0.05
0.04 0.03
0.02 0.01
0
1220 1210 1200 1190 1180 1170 1160 1150 1139
Wavenumber
Figure 2. (a) Example of measured, fitted, and % residual (=(fitted-measured)* 100) spectra from Multiple Atmospheric Layer Transmission/classical least squares (MALT/CLS) analyses for CO and CO2. Lines from 2210 to 2235 cm 'l are due to CO and lines from 2232 to 2245 cm 'l to CO2. Mixing ratios determined from the spectra are 1558 ppm CO2 and 175 ppm CO. (b) A smoke spectrum from fire 11 together with a scaled reference spectrum for acetic acid from Hanst and Hanst [ 1994]. The additional sharp lines in the smoke spec- trum are due to water vapor. The scaling factor for the reference spectrum and density correction indicate 25.7 ppm acetic acid in the smoke.
subtraction of the reference CH3OH spectrum. The scaling factor of the CH3OH spectrum required to subtract the CH3OH feature from the measured spectrum provided the equivalent CH3OH concentration.
For C2H4 and CH3COOH the concentrations were based on published reference spectra at appropriate resolution [Hanst and Hanst, 1994]. Peak absorption coefficients were deter- mined from the published spectra and applied to peak heights in the measured spectra to retrieve concentrations according to the Beer-Lambert law. For CH3COOH and C2H4 the spectral features are broad but not overlapped by other broad features, and their characteristic shapes and positions provide unambi- guous identification. Figure 2b shows an example of a measured spectrum from fire 11 together with a reference spectrum for acetic acid taken from Hanst and Hanst [1994].
Auxiliary Data
The CO2, GO, NO, and NOx analyzers were calibrated by standard methods using National Institute of Standards and Technology (NIST)-traceable standards. The flowmeter and thermocouple gauge relied on manufacturer's calibrations. To enable comparisons, all data were reduced to a common 1-min time base using a cubic spline interpolation.
Accuracy and Precision of Results
In good quality laboratory spectra (S:N > 1000), absolute accuracy using the MALT/CLS method is normally better than 2% [Griffith, 1996], whereas for the spectra here the S:N is typically around 100. Analyses of several species was pos- sible from two or more independent spectral regions (e.g., CO2, CH4, NI-t3, and C2H2). The agreement in replicate mea- surements of the same species in different spectral regions for most species is better than 5% at concentrations well above the detection limit and this is taken as a general estimate of the accuracy of the MALT/CLS retrievals (including accuracy of the HITRAN absorption cross sections). In addition, there is a typical sensitivity of- 1% K -1 to assumed temperature. Thus rounding of the analysis temperature to the nearest 10 K (and variation in temperature across the stack of the same or- der) introduces an additional maximum error of- 5%. We
YOKELSON ET AL.: FTIR STUDIES OF BIOMASS FIRE EMISSIONS 21,071
allow a further 4% error for variations in pathlength and background absorption outside the stack due to smoke leakage through the viewing port. In summary, a general estimate of total error in single gas concentration measurements is -• 8% (lc•) or 1 ppmv, whichever is higher. This implies an accu- racy of 11% (1 c•) for emission ratios of compounds due to the same combustion process.
For the specific case of H20, a significant part (-• 20%) of the total absorption is due to H20 at room temperature in the 3-m optical path outside the stack. To avoid large errors due to temperature dependence of the absorption line strengths, for the water analysis we used lines in the spectral window near 3010 cm 'l which were found to be only weakly temperature dependent.
For some species, comparisons are possible with simulta- neous measurements by other instruments. Comparisons of FTIR and non-dispersive infrared (NDIR) measurements of CO and CO2 show excellent relative agreement but with FTIR measurements systematically-• 7% higher than NDIR. Simi- lar comparison of NO by FTIR and chemiluminescence show agreement within 10%. For consistency the NDIR and chemiluminescence measurements have not been used in cal-
culating emission ratios or other derived quantities. Measurement of total mass flow in the stack by the hot
wire flowmeter is subject to error due to the inhomogenous flow profile and the absolute flowmeter calibration. The er- rors in fuel bed mass and temperature measurement are assumed to be negligible relative to those in concentrations and flow.
Derived Quantities
The raw data from each fire consist of time series of con-
centrations, fuel mass, temperature, and stack gas flow. Concentrations are converted to equivalent mixing ratios at the temperature and pressure of the sample. A number of de- rived quantities are of use in discussing the following results:
Emission ratio is the ratio of (molar) concentrations of two species, normally as the excess concentrations above back- ground.
Emission factor is the ratio of the amount of a species emitted to the amount of fuel burned in grams per kilogram or moles per kilogram.
Molar emission factor is the ratio of the amount of a par- ticular element in a species emitted to the amount of that element in the fuel burnt, in units of mole per mole. Emission factors are integrated over time and may be defined for the whole fire or for separate fire processes such as flaming and smoldering. Calculation of emission factors from the experi- mental data is described below.
Combustion efficiency (CE) is the molar ratio of CO2 emitted to the carbon burned and should be 1.0 for complete combustion. For practical purposes we use modified combus- tion efficiency (MCE) as the ratio of measured emitted CO2 to the sum of emitted CO2 + CO:
MCE = [CO2] / [CO2 + CO]
on the grounds that [CO2 + CO] correlates well with the total carbon bumt [Ward and Radke, 1993]. MCE can be calcu- lated on an instantaneous or time-integrated basis.
Calculation of Emission Factors
The molar emission factor for species x relative to fuel car- bon is determined as the molar flow of x up the stack (flow(x)) divided by the molar flow of C in all carbon-containing spe- cies up the stack (flow(C)):
molar EF(x) = flow(x) / flow(C) (2)
The molar emission factor relative to fuel mass (grams dry matter), EF(x), requires the fuel carbon mass fraction, C(fuel):
EF(x) = molar EF(x) x C(fuel) / 12 (3)
Flow(x) is the product of the total molar flow (determined by the flowmeter) times the mixing ratio of x (determined by FTIR). For flow(C) we take the sum of flows of all measured C-containing species as a close approximation to total C. The molar emission factor for species x times the molecular weight of species x gives the emission factor on a mass ratio basis. This method provides the most reliable emission factors be- cause absolute errors in the flow measurement cancel. It is
only important that the relative shape of the flow versus time profile be correct to ensure the correct weightings in calculat- ing time-averaged emission factors.
For fires 9-12 the flowmeter malfunctioned and an inde-
pendent measurement of flow was required. In principle, the stack flow can also be determined from the measured total
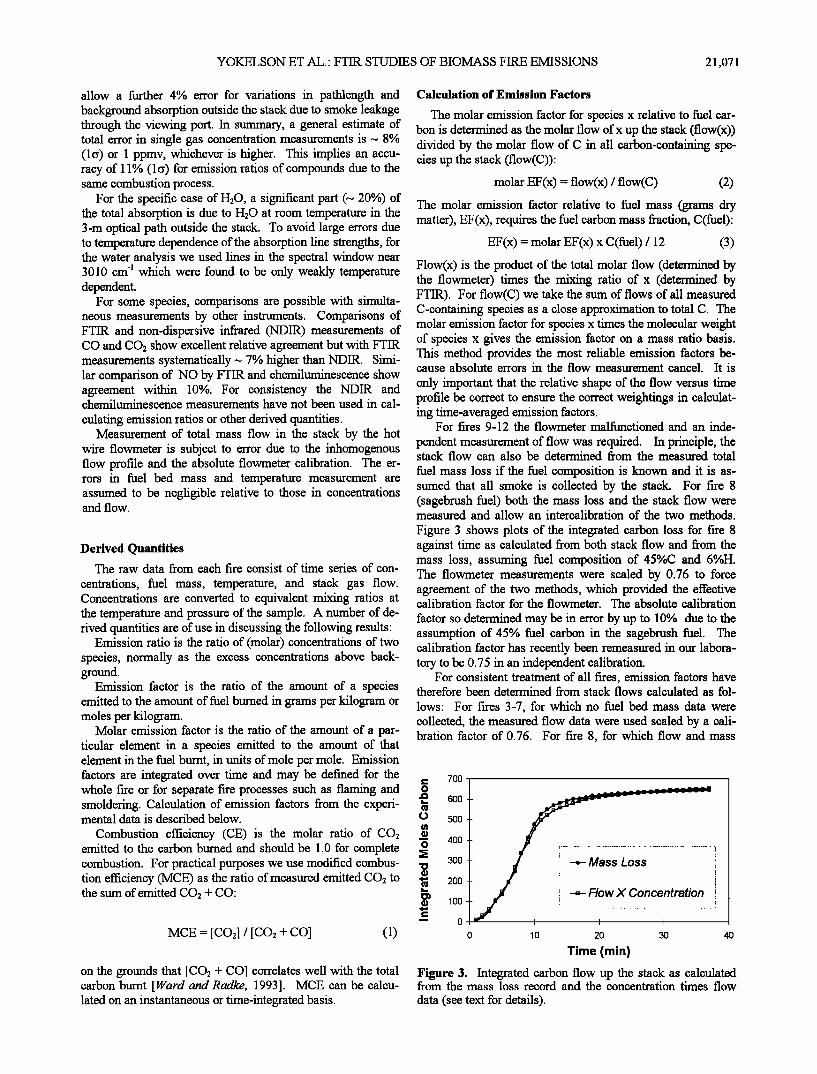
fuel mass loss if the fuel composition is known and it is as- sumed that all smoke is collected by the stack. For fire 8 (sagebrush fuel) both the mass loss and the stack flow were measured and allow an intercalibration of the two methods.
Figure 3 shows plots of the integrated carbon loss for fire 8 against time as calculated from both stack flow and from the mass loss, assuming fuel composition of 45%C and 6%H. The flowmeter measurements were scaled by 0.76 to force agreement of the two methods, which provided the effective calibration factor for the flowmeter. The absolute calibration
factor so determined may be in error by up to 10% due to the assumption of 45% fuel carbon in the sagebrush fuel. The calibration factor has recently been remeasured in our labora- tory to be 0.75 in an independent calibration.
For consistent treatment of all fires, emission factors have therefore been determined from stack flows calculated as fol-
lows: For fires 3-7, for which no fuel bed mass data were collected, the measured flow data were used scaled by a cali- bration factor of 0.76. For fire 8, for which flow and mass
700 0 ,13 600
o 500
'5 4oo • 300
00./ ! •,1 100
0 10 20 30 40
Tirue (ruin)
Figure 3. Integrated carbon flow up the stack as calculated from the mass loss record and the concentration times flow
data (see text for details).
21,072 YOKELSON ET AL.' FTIR STUDIES OF BIOMASS FIRE EMISSIONS
'E
ooo
,,--, o
•.o.•.• 00o•00 . . o• ooo ,.4•,-4 • • •
ooo
YOKELSON ET AL.' FTIR STUDIES OF BIOMASS FIRE EMISSIONS 21,073
loss data were forced to agree, flow data scaled by 0.76 were also used. For fires 9-12 the flows implied by the measured fuel mass loss were calculated, assuming 45%C and 6%H, and were used in place of actual flow measurements.
We estimate that the relative weighting of compounds due to the flow profile used in detemaining fire-averaged emission factors is accurate to 10% (1 c•). We estimate the probable er- ror due to assuming the %C as < 10% and that due to unmeasured carbon species as < 2%. In summary the data are presented in compact form as emission factors in Table 3 with an estimated accuracy of 16% (1 c•).
Results and Discussion
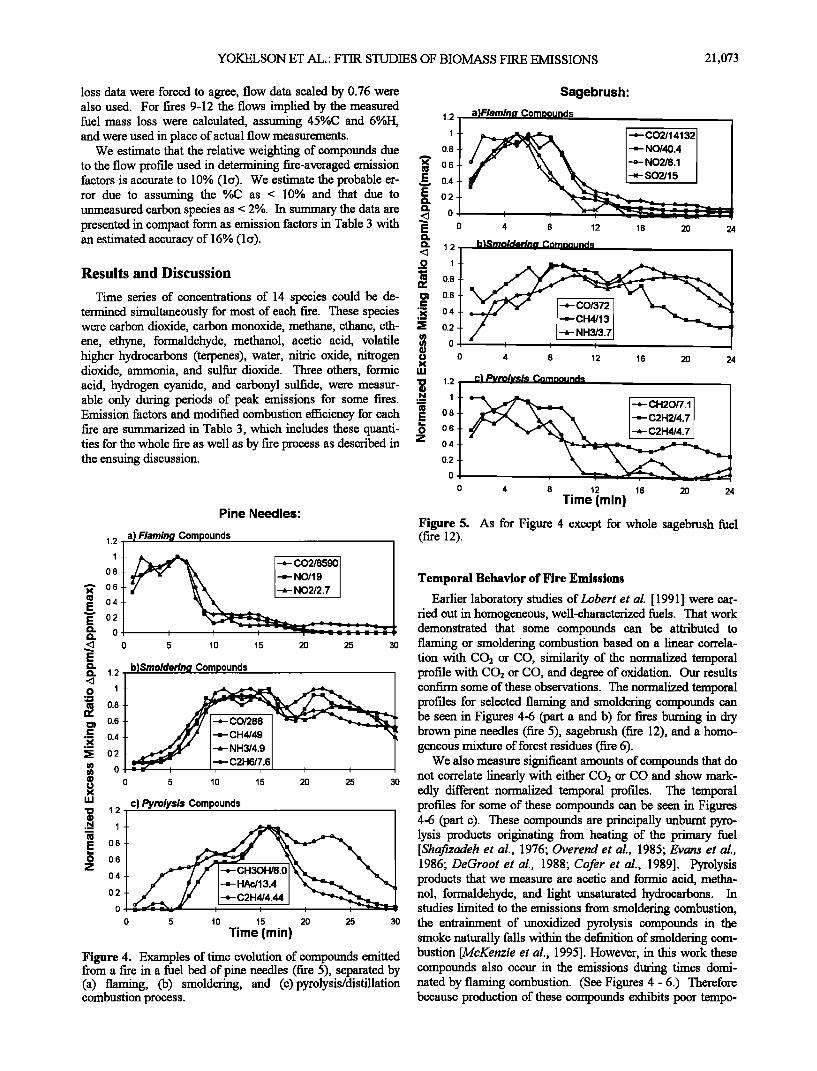
Time series of concentrations of 14 species could be de- termined simultaneously for most of each fire. These species were carbon dioxide, carbon monoxide, methane, ethane, eth- ene, ethyne, formaldehyde, methanol, acetic acid, volatile higher hydrocarbons (terpenes), water, nitric oxide, nitrogen dioxide, ammonia, and sulfur dioxide. Three others, formic acid, hydrogen cyanide, and carbonyl sulfide, were measur- able only during periods of peak emissions for some fires. Emission factors and modified combustion efficiency for each fire are summarized in Table 3, which includes these quanti- ties for the whole fire as well as by fire process as described in the ensuing discussion.
Pine Needles:
1.2 a) Flamin(• Compounds
1 • --*- CO2/8590 0.8 •' k•kx -'-NO/19
' 0.6 • • . ,•E 0.4 Sl• 0.:2 • o • o
131 0.6 ß -- 0.4
• 0.2
u• o m o
5 10 15 20 25 30
b )Smolder•ng Compounds
_-_ , ,--e- C2H6/7, .6 , , 5 10 15 20 25 30
c) Pyrolysis Compounds
E 0.8 o 0.6
z
0.4 '-•- HAc/13.4 o.2 -e- C2H4/4.44
_
0 5 10 15 20 25 30
Time (min)
Figure 4. Examples of time evolution of compounds emitted from a fire in a fuel bed of pine needles (fire 5), separated by (a) flaming, (b) smoldering, and (c)pyrolysis/distillation combustion process.
Sagebrush:
1.2 a)Flamin_½l Compounds
• -*- CO2/14132 --=- NO/40.4 -e-- NO2/8.1
0 4 8 12 16 20 24
b )$moldeHn_• Com.nound•
'- : - '-'-CH4/13
0 4 8 12 16 20 24
c) P_vrol_vsis Corntmunds
• -*- CH20/7.1 '-=- C2H2/417
0 4 8 12 16 20 24 Time (min)
Figure 5. As for Figure 4 except for whole sagebrush fuel (fire 12).
1
0.8
•' 0.6
• 13.4 0.2
..• o E
13. 1.2
o 1
i• 13.8 131 0.6
• 0.2
u• o
'o 1.2
N 1
• 0.8 • 0.6 Z 0.4
0.2
0
Temporal Behavior of Fire Emissions
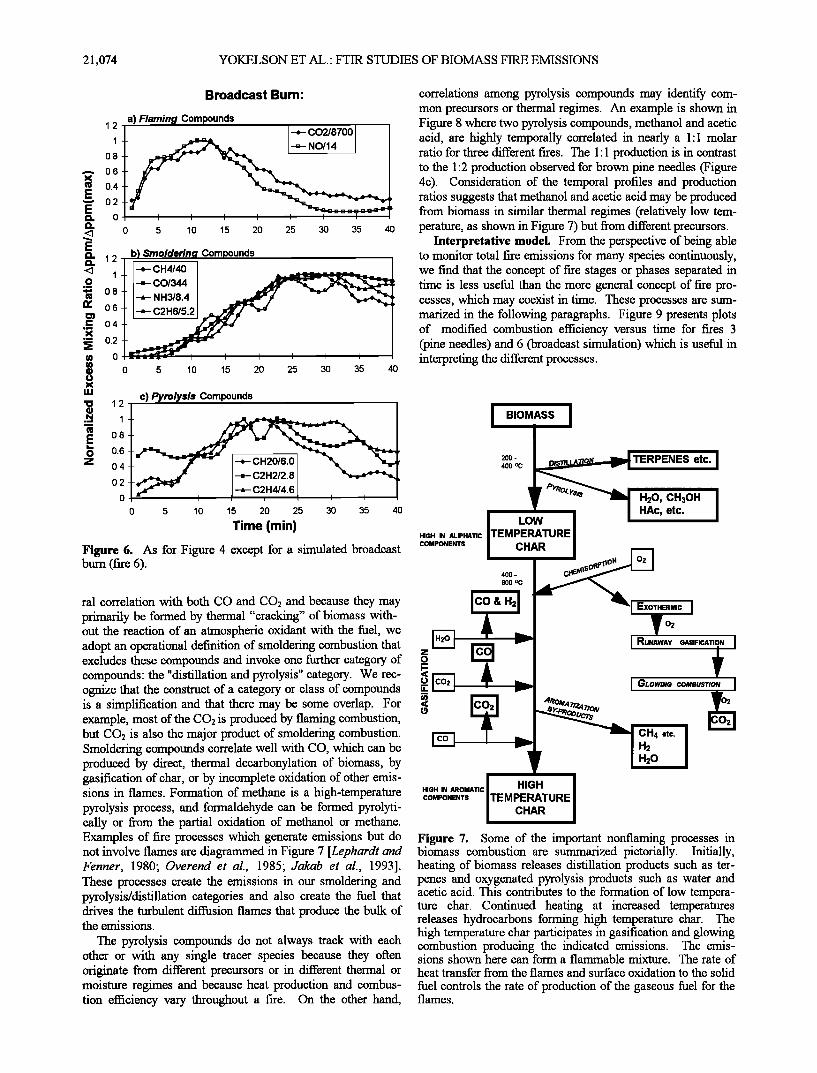
Earlier laboratory studies of Lobert et el. [1991] were car- ried out in homogeneous, well-characterized fuels. That work demonstrated that some compounds can be attributed to flaming or smoldering combustion based on a linear correla- tion with CO2 or CO, similarity of the normalized temporal profile with CO2 or CO, and degree of oxidation. Our results confirm some of these observations. The normalized temporal profiles for selected flaming and smoldering compounds can be seen in Figures 4-6 (part a and b) for fires burning in dry brown pine needles (fire 5), sagebrush (fire 12), and a homo- geneous mixture of forest residues (fire 6).
We also measure significant amounts of compounds that do not correlate linearly with either CO2 or CO and show mark- edly different normalized temporal' profiles. The temporal profiles for some of these compounds can be seen in Figures 4-6 (part c). These compounds are principally unbumt pyro- lysis products originating from heating of the primary fuel [Shefizadeh et el., 1976; Overend et el., 1985; Evans et el., 1986; DeGroot et el., 1988; Cofer et el., 1989]. Pyrolysis products that we measure are acetic and formic acid, metha- nol, formaldehyde, and light unsaturated hydrocarbons. In studies limited to the emissions from smoldering combustion, the entrainment of unoxidized pyrolysis compounds in the smoke naturally falls within the definition of smoldering com- bustion [McKenzie et el., 1995]. However, in this work these compounds also occur in the emissions during times domi- nated by flaming combustion. (See Figures 4 - 6.) Therefore because production of these compounds exhibits poor tempo-
21,074 YOKELSON ET AL.' FTIR STUDIES OF BIOMASS FIRE EMISSIONS
Broadcast Bum:
a) Flaming Compounds
1.2 / -,- CO2/8700 I 1
0.8
0.6
0.4
0.2 oi
12 .
1
0.8 0.6 0.4
0.2
0 5 10 15 20 25 30 35 40
b) Smoldering Compounds -,- CH4/40
--=-- C0/344 • -*- NH3/8.4 • - •
0 5 10 15 20 25 30 35 40
c) Pyrolysis Compounds 1.2
E 0.8 O 0.6 Z 0.4
0.2
0 i •
0 5 10 15 20 25 30 35 40
Time (rain)
•i•ure •. As for 7igure 4 except for a simulated broadcast bum (fire 6).
ral correlation with both CO and CO2 and because they may primarily be formed by thermal "cracking" of biomass with- out the reaction of an atmospheric oxidant with the fuel, we adopt an operational definition of smoldering combustion that excludes these compounds and invoke one further category of compounds: the "distillation and pyrolysis" category. We rec-
correlations among pyrolysis compounds may identify com- mon precursors or thermal regimes. An example is shown in Figure 8 where two pyrolysis compounds, methanol and acetic acid, are highly temporally correlated in nearly a 1:1 molar ratio for three different fires. The 1:1 production is in contrast to the 1:2 production observed for brown pine needles (Figure 4c). Consideration of the temporal profiles and production ratios suggests that methanol and acetic acid may be produced from biomass in similar thermal regimes (relatively low tem- perature, as shown in Figure 7) but from different precursors.
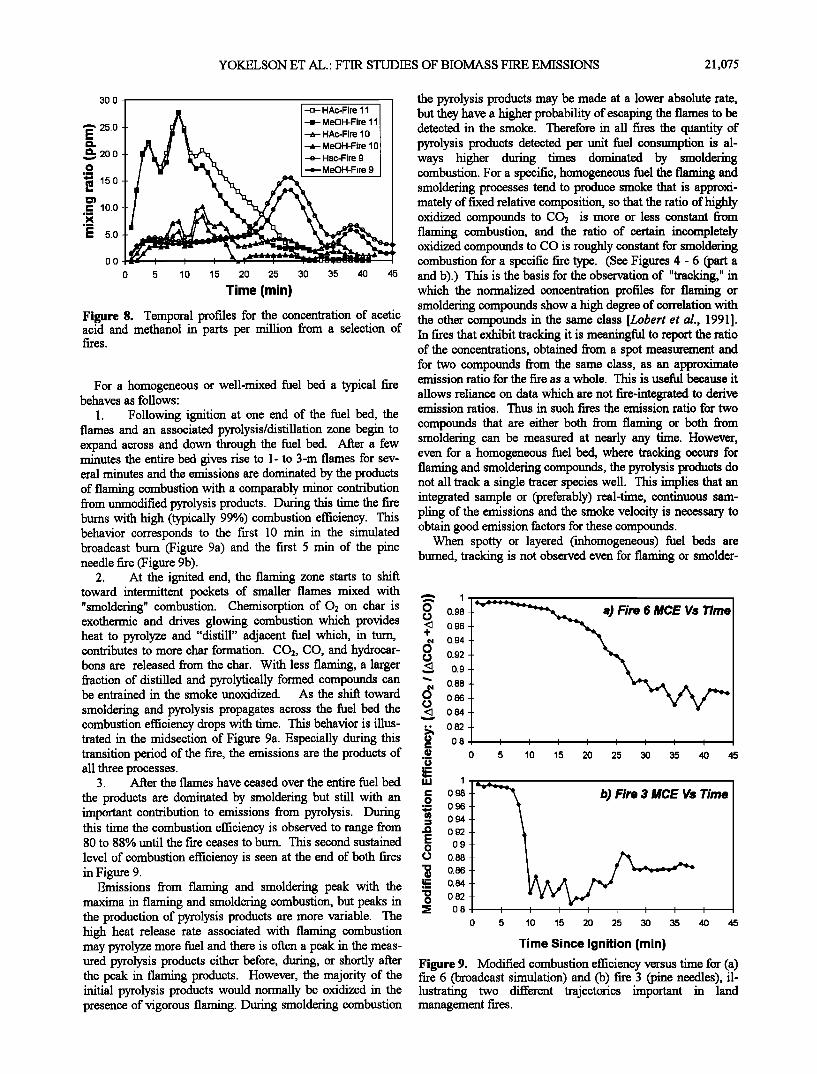
Interpretative model. From the perspective of being able to monitor total fire emissions for many species continuously, we find that the concept of fire stages or phases separated in time is less useful than the more general concept of fire pro- cesses, which may coexist in time. These processes are sum- marized in the following paragraphs. Figure 9 presents plots of modified combustion efficiency versus time for fires 3 (pine needles) and 6 (broadcast simulation) which is useful in interpreting the different processes.
BIOMASS
2oo- TERPENES etc. 400 øC
LOW
H•GH •N •.•PUAT•C TEMPERATURE COMPONENTS
H20, CHaOH HAc, etc.
CHAR
I I 400 - CHI•NIISU•"_.• •'•"•"• •
600 øC ••"'• • i EXOTHERMIC I
I GLOWtarO co•ausrlolv I
Figure 7. Some of the important nonflaming processes in biomass combustion are summarized pictorially. Initially, heating of biomass releases distillation products such as ter- penes and oxygenated pyrolysis products such as water and acetic acid. This contributes to the formation of low tempera- ture char. Continued heating at increased temperatures releases hydrocarbons forming high temperature char. The high temperature char participates in gasification and glowing combustion producing the indicated emissions. The emis- sions shown here can form a flammable mixture. The rate of heat transfer from the flames and surface oxidation to the solid
fuel controls the rate of production of the gaseous fuel for the flames.
sions in flames. Formation of methane is a high-temperature pyrolysis process, and formaldehyde can be formed pyrolyti- cally or from the partial oxidation of methanol or methane. Examples of fire processes which generate emissions but do not involve flames are diagrammed in Figure 7 [Lephardt and Fenner, 1980; Overend et al., 1985; Jakab et al., 1993]. These processes create the emissions in our smoldering and pyrolysis/distillation categories and also create the fuel that drives the turbulent diffusion flames that produce the bulk of the emissions.
The pyrolysis compounds do not always track with each other or with any single tracer species because they often originate from different precursors or in different thermal or moisture regimes and because heat production and combus- tion efficiency vary throughout a fire. On the other hand,
HIGH
TEMPERATURE
CHAR
HIGH IN AROMATIC
COMPONENTS
ognize that the construct of a category or class of compounds
is a simplification and that there may be some overlap. For '•t •J l•ø•.za.o • example, most of the CO2 is produced by flaming combustion, o - but CO2 is also the major product of smoldering combustion. •. Smoldering compounds correlate well with CO, which can be - produced by direct, thermal decarbonylation of biomass, by gasification of char, or by incomplete oxidation of other emis-
YOKELSON ET AL.' FTIR STUDIES OF BIOMASS FIRE EMISSIONS 21,075
30.0
•-• 25.0
• 20.0
0
• 15.0 c lO.O
I• 5.0
0.0
-o- HAc-Fire 11 I -•- MeOH-Fire 11 I • HAc-Fire 10 I + MeOH-Fire 10 I -e- Hac-Fire 9 I -e- MeOH-Fire 9 I
0 5 10 15 20 25 30 35 40 45
Time (min)
Figure 8. Temporal profiles for the concentration of acetic acid and methanol in parts per million from a selection of fircs.
For a homogeneous or well-mixed fuel bed a typical fire behaves as follows:
1. Following ignition at one end of the fuel bed, the flames and an associated pyrolysis/distillation zone begin to expand across and down through the fuel bed. After a few minutes the entire bed gives rise to 1- to 3-m flames for sev- eral minutes and the emissions are dominated by the products of flaming combustion with a comparably minor contribution from unmodified pyrolysis products. During this time the fire bums with high (typically 99%) combustion efficiency. This behavior corresponds to the first 10 min in the simulated broadcast bum (Figure 9a) and the first 5 min of the pine needle fire (Figure 9b).
2. At the ignited end, the flaming zone starts to shift toward intermittent pockets of smaller flames mixed with "smoldering" combustion. Chemisorption of 02 on char is
the pyrolysis products may be made at a lower absolute rate, but they have a higher probability of escaping the flames to be detected in the smoke. Therefore in all fares the quantity of pyrolysis products detected per unit fuel consumption is al- ways higher during times dominated by smoldering combustion. For a specific, homogeneous fuel the flaming and smoldering processes tend to produce smoke that is approxi- mately of fixed relative composition, so that the ratio of highly oxidized compounds to CO2 is more or less constant from flaming combustion, and the ratio of certain incompletely oxidized compounds to CO is roughly constant for smoldering combustion for a specific fare type. (See Figures 4 - 6 (part a and b).) This is the basis for the observation of "tracking," in which the normalized concentration profiles for flaming or smoldering compounds show a high degree of correlation with the other compounds in the same class [Lobert et al., 1991]. In fires that exhibit tracking it is meaningful to report the ratio of the concentrations, obtained from a spot measurement and for two compounds from the same class, as an approximate emission ratio for the fare as a whole. This is useful because it
allows reliance on data which are not fire-integrated to derive emission ratios. Thus in such fires the emission ratio for two
compounds that are either both from flaming or both from smoldering can be measured at nearly any time. However, even for a homogeneous fuel bed, where tracking occurs for flaming and smoldering compounds, the pyrolysis products do not all track a single tracer species well. This implies that an integrated sample or (preferably) real-time, continuous sam- pling of the emissions and the smoke velocity is necessary to obtain good emission factors for these compounds.
When spotty or layered (inhomogeneous) fuel beds are burned, tracking is not observed even for flaming or smolder-
0.98
exothermic and drives glowing combustion which provides <• 0.96
heat to pyrolyze and "distill" adjacent fuel which, in ttan, + 0.94 contributes to more char formation. CO2, CO, and hydrocar- O o 0.92 bons are released from the char. With less flaming, a larger • 0.9 fraction of distilled and pyrolytically formed compounds can "' 0.88 be entrained in the smoke unoxidized. As the shift toward 1• 0.86 smoldering and pyrolysis propagates across the fuel bed the 0 • 0.84
combustion efficiency drops with time. This behavior is illus- '" 0.82
ß
trated in the midsection of Figure 9a. Especially during this 0 0.8
transition period of the fire, the emissions are the products of • 0 5 40 45 20 25 30 35 uJ 1
g 0.98 During • 0.96 0.94
-• 0.92 O• 0.9 0 0.88
'• 0.86 •- 0.84
• 0.82 • 0.8
all three processes. 3. After the flames have ceased over the entire fuel bed
the products are dominated by smoldering but still with an important contribution to emissions from pyrolysis. this time the combustion efficiency is observed to range from 80 to 88% until the fare ceases to bum. This second sustained
level of combustion efficiency is seen at the end of both fares in Figure 9.
Emissions from flaming and smoldering peak with the maxima in flaming and smoldering combustion, but peaks in the production of pyrolysis products are more variable. The high heat release rate associated with flaming combustion may pyrolyze more fuel and there is often a peak in the meas- ured pyrolysis products either before, during, or shortly after the peak in flaming products. However, the majority of the initial pyrolysis products would normally be oxidized in the presence of vigorous flaming. During smoldering combustion
40 45
b) Fire 3 MCE Vs Time
0 5 10 15 20 25 30 35 40 45
Time Since Ignition (min)
Figure 9. Modified combustion efficiency versus time for (a) fire 6 (broadcast simulation) and (b) fare 3 (pine needles), il- lustrating two different trajectories important in land management fares.
21,076 YOKELSON ET AL.: FTIR STUDIES OF BIOMASS FIRE EMISSIONS
ing compounds. As different fuels dominate fuel consumption during the course of the fire, the tracking may go away. An example of this type of temporal behavior is shown in Figure 10 which shows the ratio of CHdCO during fire 11. During this fire the ratio changes by a factor of 5 from an initial value of 0.2, which is characteristic of pine needles which bum early in the fire, to a value of 0.04 which is characteristic of woody material. In practice, virtually all real fires run in such com- plex fuel beds, the one possible exception being pure grassland fires. A general approach to quantifying fire emis- sions is thus preferred, in which time-resolved concentrations and flow are measured and integrated to obtain total emis- sions.
Relative fuel consumption by various combustion pro- cesses. Because the three major fire processes produce differ- ent products, it is of use to be able to estimate the fuel consumption by process. Flaming and smoldering would normally account for most emissions by mass, but pyrolysis is important from an emissions standpoint because the sum of its products is similar to total methane emission. Essentially 90-99% of the fuel carbon is converted to either CO2 or CO from flaming and smoldering. Therefore for the purposes of estimating fuel consumption by process, we make the arith- metic approximation that all the fuel consumption is due to flaming or smoldering combustion. During the initial stages of a fire, emissions are dominated by flaming combustion and we may measure the emissions of nearly pure flaming com- bustion. For many fires it is also true that near the end of the fire the emissions are dominated by smoldering combustion and we can measure the products of this process. For each fire that featured time periods dominated by pure flaming or smoldering combustion we have computed the emissions per unit amount of fuel for those pure processes. By also quantify- ing the average emissions per unit amount of fuel for the whole fire, we can then determine the relative importance of each process in consuming fuel in an accurate manner follow- ing Ward andRadke [ 1993]. For smoldering
%S = [EF(flame) - EF(tota!)]* 100 [EF(flame) - EF(smolder)] (4)
We can calculate the percentage fuel consumption by smol- dering combustion (%S) for each species individually. For CO2 and CO, which are measured with excellent S/N
0.25
0.2
0 0.15 o
:]::: 0.1 o
0.05
I I I
0 10 20 30
Time (min)
4O
Figure 10. Data from fire 11, illustrating smoldering com- pounds appearing in a nonconstant ratio over the course of a bum in a heterogeneous fuel bed.
throughout the entire fire, the agreement is usually within 1%. For other flaming or smoldering emissions there is also nor- mally good agreement. However, if the emitted species is a distillation or pyrolysis product, for example, methanol, for- maldehyde, acetic or formic acid, good agreement is not normally found using such an analysis based on only flaming and smoldering.
Emission factors and combustion efficiencies for examples of nearly pure flaming and smoldering processes, and the per- cent fuel consumption by smoldering combustion determined as above, are included in Table 3 for all applicable fires. For the compounds listed as in the pyrolysis/distillation category the total emission factors are more accurate than the process emission factors.
We can contrast our process approach to that of Lobert et al. [1991] which distinguishes flaming and smoldering phases in time. In Lobert's work, CO is considered a tracer for smoldering combustion and the time of maximum rate of in- crease of CO emission is taken as the beginning of the smoldering stage. The results from the two approaches are compared for each fire as entries in Table 3. We find that the calculated fuel consumption for a "smoldering phase" is larger than the calculated fuel consumption by a smoldering process. The agreement between the two approaches is best when the fire makes a rapid transition between periods domi- nated by the two types of combustion, as in fire 3 (see Figure 9b). The difference between these approaches is more signifi- cant to understanding the combustion chemistry than it is in emission estimates. In emission estimates the fuel consump- tion by a smoldering "phase" may be overestimated, but in these cases, the emission factor for a smoldering "phase" will be underestimated and the resulting emission estimate should be nearly the same.
Production of Oxygenated Organic Compounds
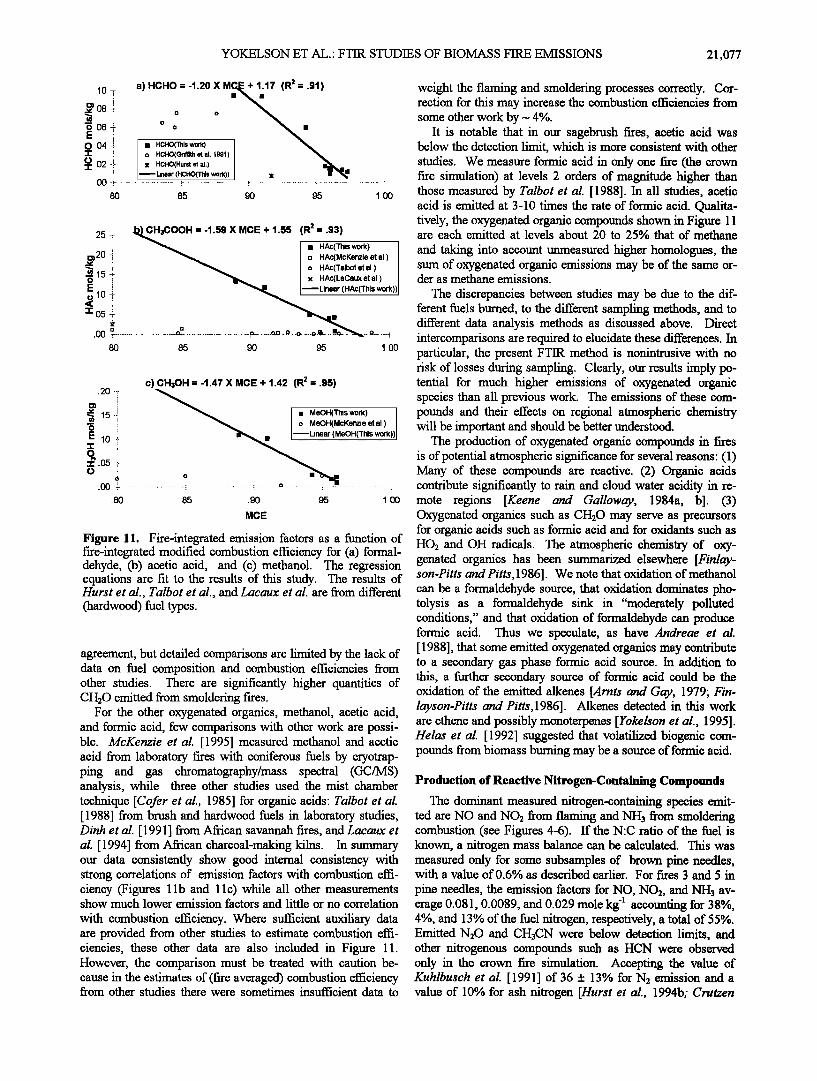
The oxygenated organic compounds measured in this work are formaldehyde, methanol, and acetic acid, with appreciable amounts of formic acid in one fire. Our data are included in
Table 3 and plotted as emission factors versus modified com- bustion efficiency in Figure 11. To date, relatively little information has been available on the direct fire emissions of
these difficult to measure compounds, but it is possible to make a limited comparison between our measurements and results obtained earlier. Cooper [1980] reports molar emission factors in the range 1- 5 x 10 '4 moles total aldehyde production per mole C burnt from residential firewood combustion with formaldehyde accounting for most of this. In our six most comparable fires (3,5,6,7,8,12), in which most of the fuel con- sumption was due to flaming combustion, we report a median molar emission factor of 4.0 x 10 '4 for formaldehyde. Hurst et al. [1994a] sampled Australian savanna fires from aircraft followed by laboratory matrix isolation-FTIR analysis and re- port average molar emission factors of (2.0_+ 1.2) x 10 '4 for formaldehyde and (5.5 q-3.4) X10 -4 for acetaldehyde. The field study of Griffith et al. [1991] reports much higher levels of formaldehyde with an emission ratio ACH20/ACO2 of 2.2 x 10 '3, corresponding to an emission factor of- 1.9 x 10 '3. The field study probed mainly smoldering combustion. The present laboratory study featured two ground fire simulations dominated by smoldering combustion (fires 9 and 10) and for these fires our average molar emission factor for formaldehyde was comparable at 2.0 x 10 '3. In summary, there is broad
YOKELSON ET AL.' FTIR STUDIES OF BIOMASS FIRE EMISSIONS 21,077
• 08-•- ffi ',
ß • o6 4 E '• 0 04-•-
o 02 -i-' :
a) HCHO -- -1.20 X M=•'17 (R 2 -- .9'1)
o HCHO(Griffith et al. 1991) • x HCHO(Hurst et al.)
• Linear (HCHO(This work)) x • • O0 • ................... ! .............................. • ................................. • .............................. •
.80 .85 .90 .95 1.00
.I;•H3COOH = -1.59 X MCE + 1.55 (R 2 = .93) .25 -:- '•- •' •A-•is work) m 20 '!' • I n HAc(acKenzie et al.) • i • I o HAc(Talbot et al.) •. 15 -f. • I x HAc(LaCaux et al.) o
ß 00 -'r .............................. •- ............................... ,o ......... on.. o ---o--- .. o ......... i r• n .80 .85 .90 .95 1.00
c) CH3OH = -1.47 X MCE + 1.42 (R 2 = .95)
• • MM:oO HH((TMh•;Fnzil•i et al,) near (bleOH(This work))
o ß
.80 .85 .90 .95 1.00
MCE
Figure 11. Fire-integrated emission factors as a function of fire-integrated modified combustion efficiency for (a) formal- dehyde, (b) acetic acid, and (c) methanol. The regression equations are fit to the results of this study. The results of Hurst et al., Talbot et al., and Lacaux et al. are from diff'erent (hardwood) fuel types.
agreement, but detailed comparisons are limited by the lack of data on fuel composition and combustion efficiencies from other studies. There are significantly higher quantities of CH20 emitted from smoldering fires.
For the other oxygenated organics, methanol, acetic acid, and formic acid, few comparisons with other work are possi- ble. McKenzie et al. [1995] measured methanol and acetic acid from laboratory fires with coniferous fuels by cryotrap- ping and gas chromatography/mass spectral (GC/MS) analysis, while three other studies used the mist chamber technique [Cofer et al., 1985] for organic acids: Talbot et al. [1988] from brush and hardwood fuels in laboratory studies, Dinh et al. [ 1991 ] from African savannah fires, and Lacaux et al. [1994] from Aft/can charcoal-making kilns. In summary our data consistently show good internal consistency with strong correlations of emission factors with combustion effi- ciency (Figures 1 lb and 1 l c) while all other measurements show much lower emission factors and little or no correlation
with combustion efficiency. Where sufficient auxiliary data are provided from other studies to estimate combustion effi- ciencies, these other data are also included in Figure 11. However, the comparison must be treated with caution be- cause in the estimates of (fire averaged) combustion efficiency from other studies there were sometimes insufficient data to
weight the flaming and smoldering processes correctly. Cor- rection for this may increase the combustion efficiencies from some other work by -- 4%.
It is notable that in our sagebrush fires, acetic acid was below the detection limit, which is more consistent with other studies. we measure formic acid in only one fire (the crown fire simulation) at levels 2 orders of magnitude higher than those measured by Talbot et al. [1988]. In all studies, acetic acid is emitted at 3-10 times the rate of formic acid. Qualita- tively, the oxygenated organic compounds shown in Figure 11 are each emitted at levels about 20 to 25% that of methane
and taking into account unmeasured higher homologues, the sum of oxygenated organic emissions may be of the same or- der as methane emissions.
The discrepancies between studies may be due to the dif- ferent fuels burned, to the different sampling methods, and to different data analysis methods as discussed above. Direct intercomparisons are required to elucidate these differences. In particular, the present FTIR met.hod is nonintrusive with no risk of losses during sampling. Clearly, our results imply po- tential for much higher emissions of oxygenated organic species than all previous work. The emissions of these com- pounds and their effects on regional atmospheric chemistry will be important and should be better understood.
The production of oxygenated organic compounds in fires is of potential atmospheric significance for several reasons: (1) Many of these compounds are reactive. (2) Organic acids contribute significantly to rain and cloud water acidity in re- mote regions [Keene and Galloway, 1984a, b]. (3) Oxygenated organics such as CH20 may serve as precursors for organic acids such as formic acid and for oxidants such as HO2 and OH radicals. The atmospheric chemistry of oxy- genated organics has been summarized elsewhere [Finlay- son-Pitts and Pitts, 1986]. We note that oxidation of methanol can be a formaldehyde source, that oxidation dominates pho- tolysis as a formaldehyde sink in "moderately polluted conditions," and that oxidation of formaldehyde can produce formic acid. Thus we speculate, as have Andreae et al. [1988], that some emitted oxygenated organics may contribute to a secondary gas phase formic acid source. In addition to this, a further secondary source of formic acid could be the oxidation of the emitted alkenes [Arnts and Gay, 1979; Fin- layson-Pitts and Pitts, 1986]. Alkenes detected in this work are ethene and possibly monoterpenes [Yokelson et al., 1995]. Helas et al. [1992] suggested that volatilized biogenic com- pounds from biomass burning may be a source of formic acid.
Production of Reactive Nitrogen-Containing Compounds
The dominant measured nitrogen-containing species emit- ted are NO and NO2 from flaming and NH3 from smoldering combustion (see Figures 4-6). If the N:C ratio of the fuel is known, a nitrogen ma'ss balance can be calculated. This was measured only for some subsamples of brown pine needles, with a value of 0.6% as described earlier. For fires 3 and 5 in
pine needles, the emission factors for NO, NO2, and NH3 av- erage 0.081, 0.0089, and 0.029 mole kg '] accounting for 38%, 4%, and 13% of the fuel nitrogen, respectively, a total of 55%. Emitted N20 and CH3CN were below detection limits, and other nitrogenous compounds such as HCN were observed only in the crown fire simulation. Accepting the value of Kuhlbusch et al. [1991] of 36 + 13% for N2 emission and a value of 10% for ash nitrogen [Hurst et al., 1994b; Crutzen
21,078 YOKELSON ET AL.' FTIR STUD•S OF BIOMASS FIRE EMISSIONS
and Andreae, 1990], these emission factors account for all the fuel nitrogen within the experimental uncertainties. These findings are in general agreement with Hurst et al. [1994a, b] who report high levels of for NO, NO2, and NH3 and that N20, HCN, and CH3CN each account for less than 1% of the fuel nitrogen.
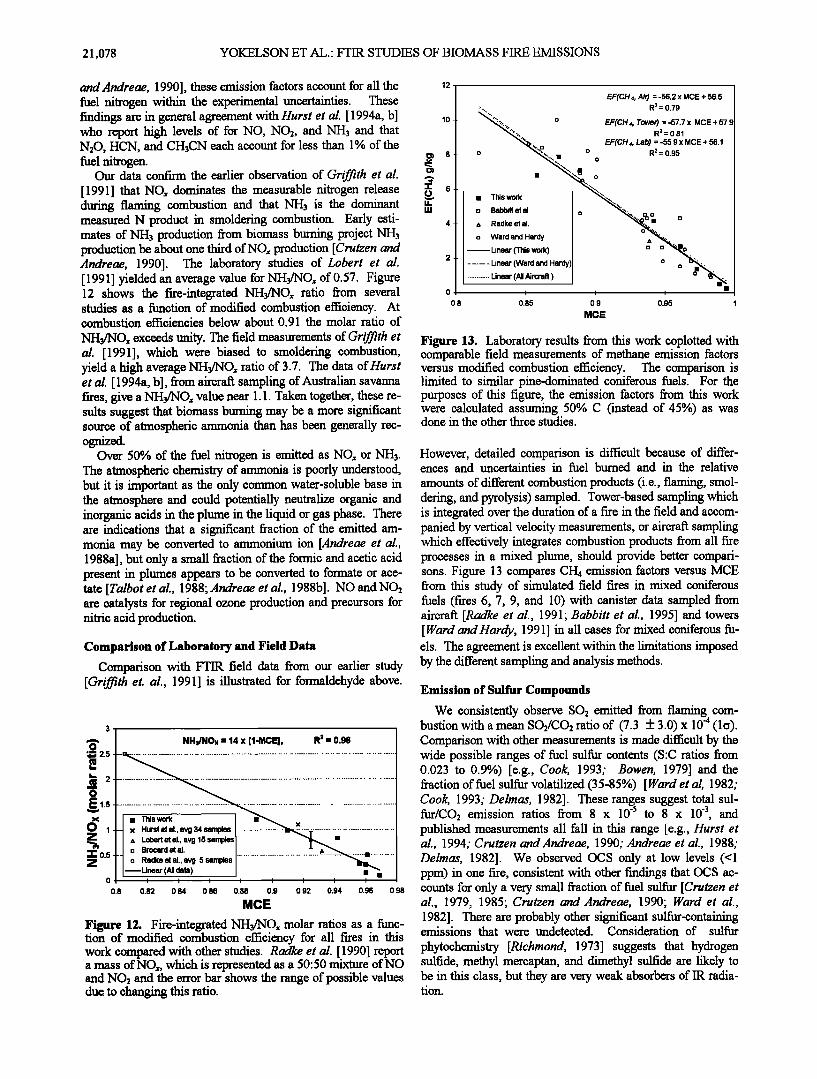
Our data confirm the earlier observation of Griffith et al. [ 1991 ] that NOx dominates the measurable nitrogen release during flaming combustion and that NH3 is the dominant measured N product in smoldering combustion. Early esti- mates of NH3 production from biomass burning project NH3 production be about one third of NOx production [Crutzen and Andreae, 1990]. The laboratory studies of Lobert et al. [ 1991 ] yielded an average value for NH3/NO, of 0.57. Figure 12 shows the fire-integrated NH3/NO, ratio from several studies as a function of modified combustion efficiency. At combustion efficiencies below about 0.91 the molar ratio of
NH•/NO, exceeds unity. The field measurements of Griffith et al. [1991], which were biased to smoldering combustion, yield a high average NH3/NO, ratio of 3.7. The data of Hurst et al. [ 1994a, b], from aircraft sampling of Australian savanna fires, give a NH3/NOx value near 1.1. Taken together, these re- suits suggest that biomass burning may be a more significant source of atmospheric ammonia than has been generally rec- ognized.
Over 50% of the fuel nitrogen is emitted as NO, or NH3. The atmospheric chemistry of ammonia is poorly understood, but it is important as the only common water-soluble base in the atmosphere and could potentially neutralize organic and inorganic acids in the plume in the liquid or gas phase. There are indications that a significant fraction of the emitted am- monia may be converted to ammonium ion [Andreae et al., 1988a], but only a small fraction of the formic and acetic acid present in plumes appears to be converted to formate or ace- tate [Talbot et al., 1988; Andreae et al., 1988b]. NO and NO2 are catalysts for regional ozone production and precursors for nitric acid production.
Comparison of Laboratory and Field Data
Comparison with FTIR field data from our earlier study [Griffith et. al., 1991] is illustrated for formaldehyde above.
z
:2:: 0.5 Z
0
0.8
NH•/NOx = t4 x [t-MCE], R 2 = 0.96
•o•e. et al ,. av• •5 samples I • ß Brocard et al. I ß • •-•------• ....... ß Ra•e et al.. a•. 5 samples • .................................................................................
I• Linear (• da•) • I m I I I I I I I I
0.82 0.84 0.86 0.88 0.9 0.92 0.94 0.96 0.98
MCE
Figure 12. Fire-integrated NH•/NO, molar ratios as a func- tion of modified combustion efficiency for all fires in this work compared with other studies. Radke et al. [1990] report a mass of NO,, which is represented as a 50:50 mixture of NO and NO2 and the error bar shows the range of possible values due to changing this ratio.
8
0
0.8
EF(CH,•, Air) = -56.2 x MCE + 56.5
,-,• R 2 = 0.79
"'•..x. o EF(CH 4, Tower) = -57.7 x MCE + 57.9 '• R 2 = 0.81
'"•,,. [] EF(CH 4, Lab) = -55.9 x MCE + 56.1 o '-,,,•,,, ß o o R• = 0.95
ß This work a Babbi ettt la o••'•;,,•, o ........ . -,%,.,,% ß [] , Radke et al.
o Ward and Hardy o-•*,•.•.,A .... m Linear (This work) [] [] -"'•., ---- Linear (Ward and Hardy) o o "'•.,
............ Linear (All Aircraft ) o "'-..•,. 0.85 0.9 0.95 1
MCE
Figure 13. Laboratory results from this work coplotted with comparable field measurements of methane emission factors versus modified combustion efficiency. The comparison is limited to similar pine-dominated coniferous fuels. For the purposes of this figure, the emission factors from this work were calculated assuming 50% C (instead of 45%) as was done in the other three studies.
However, detailed comparison is difficult because of differ- ences and uncertainties in fuel burned and in the relative
amounts of different combustion products (i.e., flaming, smol- dering, and pyrolysis) sampled. Tower-based sampling which is integrated over the duration of a fire in the field and accom- panied by vertical velocity measurements, or aircraft sampling which effectively integrates combustion products from all fare processes in a mixed plume, should provide better compari- sons. Figure 13 compares CH4 emission factors versus MCE from this study of simulated field fires in mixed coniferous fuels (fares 6, 7, 9, and 10) with canister data sampled from aircraft [Radke et al., 1991; Babbitt et al., 1995] and towers [Ward and Hardy, 1991] in all cases for mixed coniferous fu- els. The agreement is excellent within the limitations imposed by the different sampling and analysis methods.
Emission of Sulfur Compounds
We consistently observe SO2 emitted from flaming com- bustion with a mean SO2/CO: ratio of (7.3 _-/- 3.0) x 10 '4 (1 Comparison with other measurements is made difficult by the wide possible ranges of fuel sulfur contents (S:C ratios from 0.023 to 0.9%) [e.g., Cook, 1993; Bowen, 1979] and the fraction of fuel sulfur volatilized (35-85%) [Ward et al, 1982;
Cook, 1993; Delmas, 1982]. These tangles suggest total sul- fur/CO• emission ratios from 8 x 10' to 8 x 10 '3, and published measurements all fall in this range [e.g., Hurst et al., 1994; Crutzen and Andreae, 1990; Andreae et al., 1988; Delmas, 1982]. We observed OCS only at low levels (<1 ppm) in one fare, consistent with other findings that OCS ac- counts for only a very small fraction of fuel sulfur [Crutzen et al., 1979, 1985; Crutzen and Andreae, 1990; Ward et al., 1982]. There are probably other significant sulfur-containing emissions that were undetected. Consideration of sulfur
phytochemistry [Richmond, 1973] suggests that hydrogen sulfide, methyl mercaptan, and dimethyl sulfide are likely to be in this class, but they are very weak absorbers of IR radia- tion.
YOKELSON ET AL.: FTIR STUDIES OF BIOMASS FIRE EMISSIONS 21,079
Conclusions
This work establishes the open-path FTIR technique as a valuable diagnostic tool for continuous, real-time analyses of many gases in smoke, providing an improved understanding of smoke composition and chemistry, fire behavior, carbon and nitrogen cycles, and biomass burning impacts on atmos- pheric chemistry. The observations in this study with the most relevance to projecting impacts on atmospheric chemis- try are summarized as follows:
1. The concept of dividing a large fire into two stages sepa- rated in time is insufficient to categorize the temporal behavior of the emissions. There are at least three "processes" that should considered, namely flaming, smoldering, and pyroly- sis/distillation. One consequence of this is that a representative sample cannot always be taken at any arbitrary time during a fire. To measure, for example, oxygenated or- ganics or any compound from heterogeneous fuels requires continuous sampling along with flow measurements or isoki- netic integrated sampling to weight the relative contributions of the different combustion processes correctly. Only for simple, homogeneous fuels do many compounds "track" one another throughout a fire and allow representative single samples to be collected.
2. Although a lot is known about the combustion chemistry of light alkanes, the gaseous fuel that supplies flaming com- bustion of biomass is likely to contain large amounts of volatile plant constituents and oxygenated organics. The com- bustion chemistry of these materials is less well understood and will influence the emissions. The simplest example of this is that the smoke from biomass fires may contain levels of unbumt oxygenated organics and volatilized biogenic com- pounds that are high enough to have a significant impact on local and regional atmospheric chemistry. The emission lev- els and their impacts deserve more attention than they have received to date.
3. There is increasing evidence that the fate of nearly all the fuel nitrogen may be accounted for by NO, NO2, NH3, N2, and ash and that of these quantities the amount of NH3 is likely to be more significant than previously assumed, especially for fires with low combustion efficiency.
4. Determination of integrated emissions from real fires in the field by application of emission factors determined from laboratory studies depends on determining the relative impor- tance of the flaming, smoldering, pyrolysis, and distillation combustion processes (or at least the combustion efficiency) in the real fire.
Acknowledgments. The authors would like to thank Bill Mankin for the use of the FTIR spectrometer, staff of the IFSL for support in measurements and informative discussions; Ron Susott, Ron Babbitt, Gerald Olbu, Patrick Boyd, and Lynn Weger, Andy McCann of Ontar Corporation, for assistance in blending databases, Aaron Goldman for providing molecular parameters for formic acid and ethene, and Geoff Richards, Bill Herget, and Rei Rasmussen for informative discus- sions. This research was supported in part by the USFS RJVA93847.
References
Andreae, M. O., et al., Biomass-burning emissions and associated haze layers over Amazonia, J. Geophys. Res., 93, 1509-1527, 1988a.
Andreae, M. O., R. W. Talbot, T. W. Andreae, and R. C. Harriss, Formic and acetic acid over the central Amazon region, Brazil, 1, Dry season, J. Geophys. Res., 93, 1616-1624, 1988b.
Arnts, R. R. and B. W. Gay Jr., Photochemistry of some naturally emitted hydrocarbons, EPA Rep. EPA-600/3-79-081, Environ. Prot. Agency, Research Triangle Park, N. C., 1979.
Babbitt, R. E., D. E. Ward, R. A. Susott, W. M. Hao, and S. P. Baker, Smoke from western wildfires, 1994, Paper presented at the 1994 Meeting of the Interior West Fire Council, Cour D'Alene, Idaho, 1995.
Bowen, H. J. M., Environmental Chemistry of the Elements, Aca- demic, San Diego, Calif., 1979.
Brocard, D., (2. Lacaux, and J-P Lacaux, Emissions from the combus- tion of biofuels in western Africa, in Biomass Burning and Global Change, edited by J. S. Levine, MIT Press, Cambridge, Mass., 1995.
(2ofer, W. R. III, V. G. Collins, and R. W. Talbot, Improved aqueous scrubber for collection of soluble atmospheric trace gases, Environ. Sci. Technol., 19, 557-560, 1985.
Cook, G.D., The fate of nutrients during fires in a tropical savanna, Aust. J. Ecol., 19, 359 - 365, 1993.
Cooper, J. A., Environmental impact of residential wood combustion emissions and its implications, J. Air Pollut. Control Assoc., 30, 855-861, 1980.
Crutzen, P. J., and M. O. Andreae, Biomass burning in the tropics: Impact on atmospheric chemistry and biogeochemical cycles, Sci- ence, 250, 1669, 1990.
Crutzen, P. J., L. E. Heidt, J.P. Krasnec, W. H. Pollock, and W. Seiler, Biomass burning as a source of atmospheric gases CO, H2, N20, NO, CH3C1 and COS, Nature, 282, 253, 1979.
Crutzen, P. J., A. (2. Delany, J. Greenberg, P. Haagenson, I. Heidt, R. Lueb, W. Pollock, W. Seiler, A. Wartburg, and P. Zimmerman, Tropospheric chemical composition measurements in Brazil during the dry season, J. Atmos. Chem., 2, 233-256, 1985.
Darley, E. F., F. R. Burieson, E. H. Mateer, J. T. Middleton, and V. P. Osterli, Contribution of burning of agricultural wastes to photo- chemical air pollution, J. Air Pollut. Control Assoc., 12, 685, 1966.
Dasch, J. M., Particulate and gaseous emissions from wood-burning fireplaces, Environ. Sci. Technol., 16, 639, 1982.
DeGroot, W. F., W. Pan, M.D. Rahman, and G. N. Richards, First chemical events in pyrolysis of wood, J. Anal. Appl. Pyrolysis, 13, 221-231, 1988.
Delmas, R., On the emission of C, N and S in the atmosphere during bushfires in intertropical savannah zones, Geophys. Res. Lett., 7, 761-764, 1982.
Delmas, R. A., A. Mareco, J.P. Tathy, B. (2ros, and J. G. R. Baudet, Sources and sinks of methane in the African savanna, CI44 emis- sions from biomass burning, J. Geophys. Res., 96, 7287-7299, 1991.
Dinh, P. V., V. Yoboue, J.P. Lacaux, L. Schafer, and G. Helas, Or- ganic acids from savannah fires experiment in Ivory Coast, Trans. AGU, 72(44), FallMeet. Suppl., 86, 1991.
Evans, R. J., T. A. Milne, and M. N. Soltys, Direct mass-spectrometric studies of the pyrolysis of carbonaceous fuels, III, Primary pyroly- sis oflignin, J. Anal. Appl. Pyrolysis, 9, 207-236, 1986.
Finlayson-Pitts, B. J., and J. N. Pitts Jr., Atmospheric Chemistry: Fundamentals and Experimental Techniques, 1098 pp., John Wiley, New York, 1986.
Griffith, D. W. T.. Synthetic calibration and quantitative analysis of gas-phase FTIR spectra, Appl. Spectr., 50, 59-70, 1996.
Griffith, D. W. T., W. G. Mankin, M. T. Coffey, D. E. Ward, and A. Riebau, FTIR remote sensing of biomass burning emissions of CO2, CO, CH4, CH20, NO, NO2, NH3 and N20, in Global Biomass Burning: Atmospheric, Climatic, and Biospheric Implications, edited by J. S. Levine, pp. 230 - 239, MIT Press, Cambridge, Mass., 1991.
Haaland, D. M., Multivariate calibration methods applied to quantita- tive FT-IR analyses, in Practical Fourier Transform Infrared Spectroscopy, Industrial and Laboratory Chemical Analysis ed- ited by J. R. Ferraro and K. Krishnan, Academic, San Diego, Calif., 1990.
Hanst, P. L. and S. T. Hanst, Gas measurement in the fundamental in- frared region, in Air monitoring by Spectroscopic Techniques, edited by M.W. Sigrist, John Wiley, New York, 1994.
Helas, G., H. Bingemer, and M. O. Andreae, Organic acids over equatorial Africa: Results from DECAFE 88, J. Geophys. Res., 97, 6187-6193, 1992.
21,080 YOKELSON ET AL.: FTIR STUDIES OF BIOMASS FIRE EMISSIONS
Hurst, D. F., D. W. T. Griffith, J. N. Carras, D. J. Williams, and P. J. Fraser, Measurements of trace gases emitted by Australian savanna fires during the 1990 dry season, J. Atmos. Chem, 18, 33-56, 1994a.
Hurst, D. F., D. W. T. Griffith, and G. D. Cool Trace gas emissions from biomass burning in tropical Australian savannas, J. Geophys. Res., 99, 16,441-16,456, 1994b.
Jakab, E., O. Faix, F. Till, and T. Szekely, The effect of cations on the thermal decomposition of lignins, J. Anal. Appl. Pyrolysis, 25, 185-194, 1993.
Kauffman, J. B., D. L. Cummings, and D. E. Ward, Relationships of fire, biomass and nutrient dynamics along a vegetation gradient in the Brazilian cerrado, J. Ecol., 84, 519-531, 1994.
Keene, W. C., and J. N. Galloway, A note on acid rain in an Amazon rain forest, Tellus, 36B, 137-138, 1984a.
Keene, W. C., and J. N. Galloway, Organic acidity in precipitation of North America, Atmos. Environ., 18, 2491-2497, 1984b.
Klemmedson, J. O., Nitrogen and carbon regimes in an ecosystem of young dense ponderosa pine in Arizona, For. $ci., 21, 163 - 168, 1975.
Kuhlbusch, T. A., J. M. Lobert, P. J. Crutzen, and P. Warneck, Mo- lecular nitrogen emissions from denitrification during biomass burning, Nature, 351, 135-137, 1991.
Lacaux, J.P., D. Brocard, C. Lacaux, R. Delmas, A. Brou, V. Yoboue, and M. Koffi, Traditional charcoal making: An important source of atmospheric pollution in the African tropics, Atmos. Res., 35, 71-76, 1994.
Lephardt, J. O., and R. A. Fenner, Characterization of pyrolysis and combustion of complex systems using Fourier transform infrared spectroscopy, Appl. Spectr., 34, 174- 185, 1980.
Lobeft, J. M., D. H. Scharffe, W. M. Hao, T. A. Kuhlbusch, R. Seu- wen, P. Warneck, and P. J. Crutzen, Experimental evaluation of biomass burning emissions: Nitrogen and carbon containing com- pounds. in Global Biomass Burning: Atmospheric, Climatic, and Biospheric Implications, edited by J. S. Levine, MIT Press, Cam- bridge, Mass., 1991.
McKenzie, L. M., W. M. Hao, G. N. Richards, and D. E. Ward, Measurement and modeling of air toxins from smoldering com- bustion of biomass, Environ. Sci. Technol., 29, 2047 - 2054, 1995.
Overend, R. P., T. A. Milne, and L. K. Mudge (Eds.), Fundamentals of Thermochemical Biomass Conversion, Elsevier, New York, 1985.
Radke, L. F., J. H. Lyons, P. V. Hobbs, D. A. Hegg, D. V. Sandberg, and D. E. Ward, Airborne monitoring and smoke characterization of prescribed fires on forest lands in western Washington and Ore- gon, Gen. Tech. Rep. PNlY-GTR-251, U.S. Dep. of Agric. For. Serv. Pacific Northwest Res. Stat., Seattle, Wash., 1990.
Radke, L. F., D. A. Hegg, P. V. Hobbs, J. D. Nance, J. H. Lyons, K. K. Laursen, R. E. Weiss, P. J. Riggan, and D. E. Ward, Particulate and trace gas emissions from large biomass fires in North America in Global Biomass Burning: Atmospheric, Climatic, and Bio- spheric Implications, edited by J. S. Levine, MIT Press, Cambridge, Mass., 1991.
Richmond, D. V., Sulfur Compounds, in Phytochemistry: Inorganic elements and special groups of chemicals; vol. III, edited by L. P. Miller, Van Nostrand Reinhold, New York, 1973.
Rothman, L. S., et al., The HITRAN molecular database: Editions of 1991 and 1992, J. Quant. Spectr. Radiat. Transfer, 48, 469-507, 1992.
Ryan, P. W., and C. K. McMahon, Some chemical and physical char- acteristics of emissions from forest fires, in 69th APCA Annual Meeting, Air Pollut. Control Assoc., Portland, Or., June 27 - July 1, 1976.
Seavoy, R. E., The shading cycle in shifting cultivation, Ann. Assoc. Am Geogr., 63, 522, 1973.
Shafizadeh, F., K. V. Sarkanen, and D. A. Tillman (Eds.), Thermal Uses and Properties of Carbohydrates and Lignins, Academic, San Diego, Calif., 1976.
Talbot, R. W., K. M. Beecher, R. C. Harriss, and W. R. Corer III, Atmospheric geochemistry of formic and acetic acids at a mid- latitude temperate site, J. Geophys. Res., 93, 1638-1652, 1988.
Ward, D. E., and C. C. Hardy, Smoke emissions from wildland fires, Environ. Int., 17, 117-134, 1991.
Ward, D. E., and L. F. Radke, Emission measurements from vegeta- tion fires: A comparative evaluation of methods and results, in Fire in the Environment: The Ecological, Atmospheric and Climatic Importance of Vegetation Fires edited by P. J. Crutzen and J. G. Goldammer, John Wiley, Chichester, England, 1993.
Ward, D. E., C. K. McMahon, and D. F. Adams, Laboratory meas- urements of carbonyl sulfide and total sulfur emissions from open burning of forest biomass, in 75th APCA Annual Meeting, Air Pollut. Control Assoc., New Orleans, La., June 20-24, 1982.
Ward, D. E., R. A. Susott, J. B. Kauffman, R. E. Babbitt, D. L. Cummings, B. Dias, B. N. Holben, Y. J. Kaufman, R. A. Ras- mussen, and A. W. Setzer, Smoke and fire characteristics for cerrado and deforestation burns in Brazil: BASE B experiment, J. Geophys. Res., 97, 14,601-14,619, 1992.
Yokelson, R. J., D. W. T. Griffith, J. B. Burkholder, and D. E. Ward, Accuracy and advantages of synthetic calibration of smoke spectra, in Proceedings of the AIYMA Conference on Optical Remote Sensing for Environmental and Process Monitoring, Air Waste and Manage. Assoc., San Francisco, Sept. 25-27, 1995.
R. J. Yokelson (corresponding author), Department of Chemistry, University of Montana, Missoula, MT 59812. (e-mail: [email protected])
D. W. T. Griffith, Department of Chemistry, University of Wollon- gong, Wollongong NSW 2522 Australia. (e-mail: Dave_Griffith@ uow.edu.au)
D. E. Ward, USDA Forest Service, Intermountain Research Sta- tion, P. O. Box 8089, Missoula, MT 59807. (e-mail: [email protected]. edu)
(Received September 2, 1995; revised February 29, 1996; accepted June 6, 1996.)


![FOURIER -TRANSFORM INFRARED SPECTROMETER [FTIR]](https://img.pdfslide.us/doc/110x75/587539961a28abe7728b6867/fourier-transform-infrared-spectrometer-ftir.jpg)