Embed Size (px)
Citation preview

Open-File Report
Site Characterization for Stations 6 & 7,
El Centro Strong Motion Array,
Imperial Valley, California
A. T. F. Chen
M. J. Bennett
U.S. Geological Survey
Menlo Park, California 94025
Open-File Report 82-1040
This report is preliminary and has not been reviewed for conformity with U.S. Geological Survey editorial standards. Any use of trade names is for descriptive purposes only and does not imply endorsement by the USGS.
August, 1982

TABLE OF CONTENTS
INTRODUCTION..............................................................1
REGIONAL AND LOCAL GEOLOGY................................................2
FIELD PROCEDURES..........................................................5Cone penetration testSamplingSeismic recording
LABORATORY PROCEDURES.....................................................7Density Grain size Atterberg limits Strength
SITE DESCRIPTIONS.........................................................9Sediment characteristics Effective stress
SHEAR MODULUS PROFILES...................................................11
SHEAR STRENGTH PROFILES..................................................12
ADDITONAL REMARKS........................................................16
ACKNOWLEDGMENTS..........................................................18
REFERENCES CITED.........................................................19

ILLUSTRATIONS
Figure page
1. Location of strong motion stations ..................................21
2. Geographic features of the Imperial Valley region....................22
3. Generalized geologic map.............................................23
4. Log of station 6.....................................................24
5. Log of station 7.....................................................25
6. Relative density determined from CRT and vertical effective stress...26
7. Unified soil classification of sediment .............................27
8. Shepard classification of sediment...................................27
9. Vertical effective stress versus depth...............................28
10. Low strain shear modulus versus depth station 6......................29
11. Low strain shear modulus versus depth station 7......................30
12. Normalized (Su/0- 1 ) ratio versus OCR.................................31
13. Friction angle versus relative density...............................32
14. Estimated shear strength profile at station 6........................33
15. Estimated shear strength profile at station 7........................34
TABLES page
1 Sediment description of stations 6 and 7.............................35
2 Unit description of station 6........................................36
3 Unit description of station 7........................................37

INTRODUCTION
The Imperial Valley earthquake of October 15, 1979 triggered no less than
30 accelerographs within 100 km of the epicenter and produced many valuable
close-in strong-motion records. The earthquake also generated a 1.7g vertical
acceleration reading which is the largest ground-motion acceleration ever
measured.
It is not by accident that there were so many accelerograph stations in
the close-in region of the earthquake. Both the El Centro strong motion array
and the El Centro differential motion array were installed with specific types
of studies in mind. The strong motion array was installed to collect close-in
strong motion records and the differential motion array was designed to study
the effect of seismic wave on long structures. That the earthquake occurred
after both arrays had been installed and operational makes the earthquake
itself even more scientifically significant.
Because of the scientific significance of the earthquake ground motions,
additional field studies were conducted to attain a better understanding of
the local, near surface geology of the strong motion station sites. Geologic,
geotechnical, and geophysical profiles were made at the strong motion stations
to determine the stratigraphy and seismic characteristics of the sediments.
We used cone penetration tests, samples and the drillers logs to define the
stratigraphy and a down-hole seismic survey to make shear wave velocity
profiles. The locations of the seismic stations are shown in figure 1.
The ground motion data from the earthquake indicate that the variation in
peak surface acceleration cannot be solely attributed to the radiation pattern
(Muller and others, 1982). The effect of local geology is also believed to
have played an important role. To analyze the effect of local geology at the
accelerograph station, certain engineering properties of the surficial

deposits at that station need to be assessed and ground motion analyses need
to be made. Under Intense seismic shaking, most soils exhibit nonlinear
behavior of which the degree of nonllnearity is primarily dictated by their
shear strength. Consequently, in addition to the traditional shear modulus
needed for elastic analysis, the soil properties needed for nonlinear analyses
should also include the shear strength.
This report characterizes the sediments at stations 6 and 7 of the El
Centre strong motion array. We present our best estimates of the shear
modulus vs. depth and shear strength vs. depth profiles. These profiles are
estimated from available field data (wave velocity profiles and cone
penetration records), regional geology, limited laboratory data, and a number
of engineering correlations. We limited our investigation to stations 6 and 7
because wave velocity profiles from these stations were the only ones
available at the time of this study.
REGIONAL AND LOCAL GEOLOGY
The Imperial Valley is located in southern California in the Sal ton
trough geomorphic province (fig. 2). The Sal ton trough is over 1,000 km long
and includes the Coachella and Imperial Valleys in California and the Mexicali
Valley and Gulf of California in Mexico. The terrestrial portion of the
trough has a natural divide created by the delta of the Colorado River. The
Imperial Valley north of the delta has been cut off from the rest of the
trough by the delta and subsequently has turned into a closed basin with
internal drainage. The central part of the Imperial Valley contains the
Salton Sea at an elevation of 70 m below sea level. Today, the part of the
trough occupied by the Imperial Valley is sinking at a rate of 3.5 cm per year
relative to the surrounding mountains (Elders, 1979).

The Gulf of California, including the Salton Trough, began opening during
the Pliocene or Miocene. The late Tertiary-early Quaternary sediments that
have filled the trough consist of alluvial fan boulder gravel, sandy and silty
flood plain sediment, and lacustrine and marine silts and clays. Marine
environments range from brackish to full marine conditions. In the mid-
Pi iestocene the Colorado River created a delta across the basin near Yuma,
Arizona. The delta isolated the Imperial Valley from the southern part of the
trough. The depositional history of the Imperial Valley was significantly
changed by this event. Marine conditons were replaced by alternating
continental valley fill and lacustrine deposits. Total sediment thickness in
the center of the Imperial Valley is between 6 and 7 km (Elders, 1979). Most
of this sediment may have accumulated in Quaternary time (Sharp, 1972). The
Imperial Valley has been the site of numerous lakes created by channel shifts
of the Colorado River. The river naturally moves its distributary channels
during flood stage. Between 300 and 1600 years ago natural flooding from the
Colorado River filled the Imperial Valley and created Lake Cahuilla (Van De
Kamp, 1973, p. 829). The present Salton Sea was created in 1905 by man
induced flooding from the Colorado River (Mendenhall, 1909). The lake that
was created has remained relatively stable because of continued run-off from
irrigation water.
The sediments within the basin are folded and faulted with these
processes continuing at the present time (Sharp, 1972, and Elders, 1979).
Folded layers of older sediment can be seen along the margins of the trough.
Younger sediments show the effects of erosional truncations caused by recent
warping. Folding is most pronounced in sediment bordering faults or bounded
by faults (Sharp, 1972).

Major bounding faults in the Imperial Valley include the San Andreas, San
Jacinto and Elsinore fault zones. The Imperial and Brawley fault zones are
located in the center of the valley. The relationship between the major fault
zones and those in the center of the valley are uncertain. Except for the
Brawley fault all of the above named faults show San Andreas type
characteristics such as, linearity, northwest-southeast trend, right lateral
offset, and evidence of recent activity. The Brawley and Imperial faults
bound an area called the Mesquite depression. The depression is being formed
as a result of right lateral offset along the faults and pull-apart between
the faults.
Strong motion stations 6 and 7 are located in a portion of the valley
underlain by a veneer of Lake Cahuilla clay and beds of sand from channels and
the Colorado River delta (Van De Kamp, 1972). Subsurface correlation of
sediment in this area is difficult because of rapid changes in thickness and
lithology. Fine-grained lacustrine deposits are cut by channels and filled
with fine sand or clayey silt depending on the method of filling. The
generalized geology of the study area is shown in figure 3.
Stations 6 and 7 are about 2 kms apart and lie on opposite sides of the
Imperial fault (fig. 1). Station 6 is located between the Imperial and
Brawley faults within the Mesquite depression at an elevation of -30 m.
Station 7 lies to the west of the Mesquite depression at an elevation of -20
m. Both stations are located on the clay fades part of Lake Cahuilla (Van De
Kamp, 1972). Sand beds within the clay facies were deposited in channels that
meandered across the lake bottom surface during low water stands.
The New River and the Alamo River provide the principle means of
transporting sediment in the valley today, but in the recent past many small
distributaries also transported sediment within the valley. Van De Kamp

(1972) shows several buried channels associated with the Mesquite
depression. Youd and Wieczorek (1982) describe a 11-km-long relict channel
that runs from the Mexican border to just south of Holtville. Channels such
as this channel provide the numerous discontinuous sand beds within the
lacustrine sediment.
Stations 6 and 7 are located in areas with different tectonic conditions
even though they are only 2 km apart. Station 6 is located between the
Imperial and Brawley faults and is moving downward relative to station 7 which
is on the west side of the Imperial fault.
FIELD PROCEDURES
The first step in the field investigation was to profile the sediment
using the cone penetration test (CPT). These tests were made by Ertec
Western, Inc., Long Beach, California, under purchase order numbers 54556 and
54560. The CPT profiles were used to determine soil types and bed
thickness. The profiles were also used to select sampling intervals. The
second part of the field investigation involved drilling holes for sampling
and for placing casing to be used for seismic measurements. Samples were
taken using thin-walled tubes and split spoons. The split spoon sampling
method also provides estimates of soil density. After profiling and sampling
were completed down-hole P- and S-wave velocity measurements were made.
Cone penetration test. The cone penetration test (ASTM D 3441-75T)
measures the forces required to push a cone into the sediment. The cone
contains strain gauges at the tip and above the tip that measure soil
resistance at the tip (qc ) and the soil friction on a sleeve above the tip
(fs ). The ratio between side friction and tip resistance, expressed as
percent, is termed the friction ratio (Rf). These three measures of cone

penetration resistance were used to construct profiles at sites 6 and 7 (figs.
4 and 5). The tip resistance was used to estimate relative density using fig.
6. Shear strength of clays was estimated from cone records by taking 80 % of
fs as reconnended by Drnevich and others (1974). With the limited sampling
done the CRT became the prime indicator of sediment type. Sediment type is
shown in the log in figs. 4 and 5. Sediment type was interpreted from the
relations between tip resistance and friction ratio. Coarse-grained sediment
has low friction ratios (less than 2) whereas fine-grained sediment has higher
ratios (greater than 4). Classifications using tip resistance and friction
ratio have been developed by Sanglerat (1972), Schmertmann (1978), and Martin
and Douglas (1981). The advantage of the CRT is that a continuous recording
of tip resistance and friction ratio is made from which sediment type and
strength can be interpreted.
Sampling. Samples were obtained using a truck-mounted drill rig that
drilled 12-cm diameter holes to 76 m. The CRT profiles were used to select
sampling intervals. Two methods of sampling were used. One sampling method
used thin-walled tubes of 5-cm and 7.6-cm diameter. The other sampling method
used thick-walled split-spoons of 3.5-cm diameter. Split-spoons are the
sampling tool of the standard penetration test (SPT). In the SPT (ASTM D 1586-
67T), split-spoon samplers are driven into the sediment by dropping a 63.5 kg
hammer 76 cm. The number of blows, N, to advance the sampler 30 cm is a
measure of the sediment strength or relative density (Terzaghi and Peck,
1967). The penetration resistance measured by the SPT was used with the CPT
data to classify the sediment according to density. Samples from the SPT were
placed in plastic bags, tube samples were capped and eventually stored in a
high humidity room. The types and depths of samples are listed below.

Hole & unit no.6-16-16-16-16-26-26-36-57-17-27-37-3
depth (m)2.4-2.92.4-3.03.0-3.76.1-6.911.3-11.713.7-14.521.3-22.128.7-29.12.4-2.913.7-14.522.6-23.026.5-26.7
sample typeSPT5-cm tube5-cm tube7.6-cm tubeSPT7.6-cm tube7.6-cm tubeSPTSPT7.6-cm tubeSPTSPT
After sampling the holes were cased with 7.6-cm diameter PVC tubing to
keep the hole open and provide a uniform and stable surface for the seismic
probe.
Seismic Recording. Seismic waves were generated and recorded using the
technique introduced by Kobayashi (1959), discussed by Warrick (1974), and
used by Fumal and others (1982). Compression and shear waves were generated
by striking an "anvil" with a hammer. Compression waves (P-waves) are
generated by vertically striking a steel plate on the ground. Shear waves (S-
waves) were generated by striking the end of a large horizontal timber held
firmly on the ground by the wheels of a truck. The timing signal for the
recordings, in both cases, is generated by the metal hammer striking the
anvil. The generated seismic waves were monitored by a down hole geophone.
The geophone was moved in 2.5-m increments for testing and locked in place by
an inflatable diaphram. Seismic wave measurements were recorded on
photographic paper by an oscillograph.
LABORATORY PROCEDURES
Samples were tested to classify sediment for descriptive purposes and to
investigate physical properties such as strength, grain size, and bulk
density. Capped tube samples were extruded in the laboratory and stored

vertically in a high-humidity room along with bag samples from the SPT.
Strength tests were made only on tube samples. Testing procedures followed
ASTM recommendations, tests included:
Density. Bulk density measurements were made from undisturbed tube
samples. Length of samples ranged from 7.5 cm to 12 cm, diameter of samples
averaged 5.1 cm and 7.6 cm. After the sample ends were trimmed length and
diameter were determined from the average of 3 measurements. Samples were
weighed to the nearest 0.1 gm and returned to the humidity room or used for
strength tests. Bulk density was used to calculate effective stress.
Grain size. Grain size was determined using procedures outlined in ASTM
D 422-63. Boundaries for size classes are 2 mm, gravel-sand; 0.062 mm, sand-
silt; and 0.004 mm for silt-clay. Grain size greater than 0.062 mm was
determined by sieving, grain size less than 0.062 mm was determined by
hydrometer. Size distribution curves were used to determine sorting and
median grain size. Sediment was classified according to the unified soil
classification (fig. 7) (ASTM D 2487-69). Sediment names such as silty sand
and clayey silt were based on the classification of Shepard (1954) (fig. 8).
Atterberg limits. The liquid and plastic limits represent the water
content at the boundaries between the liquid and plastic states and the
plastic and solid states, respectivly. The limits are a part of the unified
soil classification. Further discussion of the limits is found in Lambe and
Whitman (1969), Seed and others (1964), and Casagrande (1948). We followed
ASTM procedures D 423-66 and D 424-59 in determining the liquid and plastic
limits.
The natural water content is the ratio, expressed as percent, between the
weight of free water and the weight of solid particles in sediment. Samples
were weighed, dried overnight in an oven at 110° C (ASTM D 2216-80) and

reweighed to determined the amount of water loss. The relationship between
the natural water content and the liquid and plastic limits is expressed as
the liquidity index. This index is the ratio of the difference of the natural
water content and the plastic limit to the difference between the liquid and
plastic limits. The liquidity index defines the physical state of the
sediment and serves as a means of estimating the state of consolidation
(Skempton, 1944).
Strength. Sediment strength is used in ground responce calculations that
are discussed later on under the heading SHEAR STRENGTH PROFILES. Sediment
strength was measured in the laboratory by a hand-operated vane shear device
and by unconfined compression tests. The vane shear device was used to
determine the shear strength of tube samples by rotating the top of the vane
at a rate of 90° per minute. The dimension of the vane is 1.2 cm by 1.2 cm.
Unconfined compressive strength was determined on samples with a length to
diameter ratio between 2 and 3. Tests were run at axial strains between 0.5
and 2.0% per minute (ASTM D 2166-66). Sediment strength was also interpreted
from CPT data.
SITE DESCRIPTION
Sediment characteristics. The fine-grained sediments are classified by
the unified soil classification shown in fig. 7. The Shepard classification
used to the name the sediments is shown in fig. 8. Test results and
descriptions are listed in tables 1, 2, and 3. Profiles and interpreted logs
are shown in figs. 4 and 5.
The test results show two general types of sediment. Type 1 is comprised
of very dense very fine sand and silt and is referred to as "sandy". The
upper contacts of the sandy beds are usually sharp, lower contacts are both

sharp and transitional. We believe the sandy beds are channel deposits,
called "shoestring sands" by Van De Kamp (1973).
Type 2 is comprised of reddish brown stiff to very stiff clayey silts to
silty clay and is referred to as "clayey". The clayey sediment generally
contains less than 7% sand, rare gastropods, rare to common gypsum nodules,
and fine sandy to silty laminations. The liquidity index of the clayey
sediments ranges between +0.2 and -0.2. The low index is typical of deeply
buried or desiccated sediment. Because of the relatively shallow depth of the
samples descication is probably the cause of the low liquidity index. These
characteristics indicate that the clayey sediment is lacustrine.
Effective stress. The effective overburden pressure (cr' v ) plays an
important role in the interpretation of cone penetration records for
geotechnical parameters. This vertical effective stress in turn is controlled
by the bulk density of individual soil layers and the local hydrological
condition. In most cases, unrealistic estimates of $ * v are caused by
erroneous assessment of the ground water condition.
The down-hole P-wave survey at both stations indicates that the ground
water table is near the surface at station 7 and at the lithological interface
8 meters below the surface at station 6 (Muller and others, 1982). Drilling
records at station 6 show that the water-bearing sand layer immediately below
that interface is under artesian pressure (Porcella, private communication).
Water eventually seeped to the surface but no blowout or other difficulties
was experienced during drilling.
Laboratory determination of bulk (wet) density of cohesive sediment from
these stations were few and were limited to sediment at relatively shallow
depths. Bulk densities for other soil deposits were assigned as 2.0 or 2.1
gm/cc depending on the cone resistance and driller's description of each
10

deposit. The estimated values of bulk densities at each station are shown in
tables 2 and 3.
The vertical effective stress profiles computed from bulk density
estimates and available ground water table information are shown in figure
9. We have assumed that the ground water table is at the surface at station 7
and 8 meters below the surface with an artesian pressure head that reaches to
the surface at station 6. In assuming the artesian pressure head, we not only
considered the fact that water did reach the surface with no evidence of high
pressure to cause blowout or collapse of the drill hole, but also found that
this estimate of artesian pressure is consistent with the shear strength-
effective stress ratio for the silty clay layer at 15-25 meters depth, as will
be discussed further later in the report.
One other factor that plays a major role in assessing getechnical
parameters is the past loading history which is often expressed in terms of
the overconsolidation ratio, OCR. Consideration of the regional geology led
us to believe that overconsolidation due to an excessive amount of surface
erosion at these two stations is unlikely. Overconsolidation then is caused
either by dessication or lowering of ground water table. Desiccation would
only limit the overconsolidation to near surface cohesive sediments whereas
change of ground water table can only provide slight increase to the OCR.
Consequently, deeper deposits at these two stations are expected to be
normally consolidated to slightly overconsolidated.
SHEAR MODULUS PROFILES
For most soils, shear modulus is a strain-dependent property; its value
decreases with the increasing strain amplitude. In down-hole seismic velocity
measurements, only a limited amount of energy is generated at the ground
11
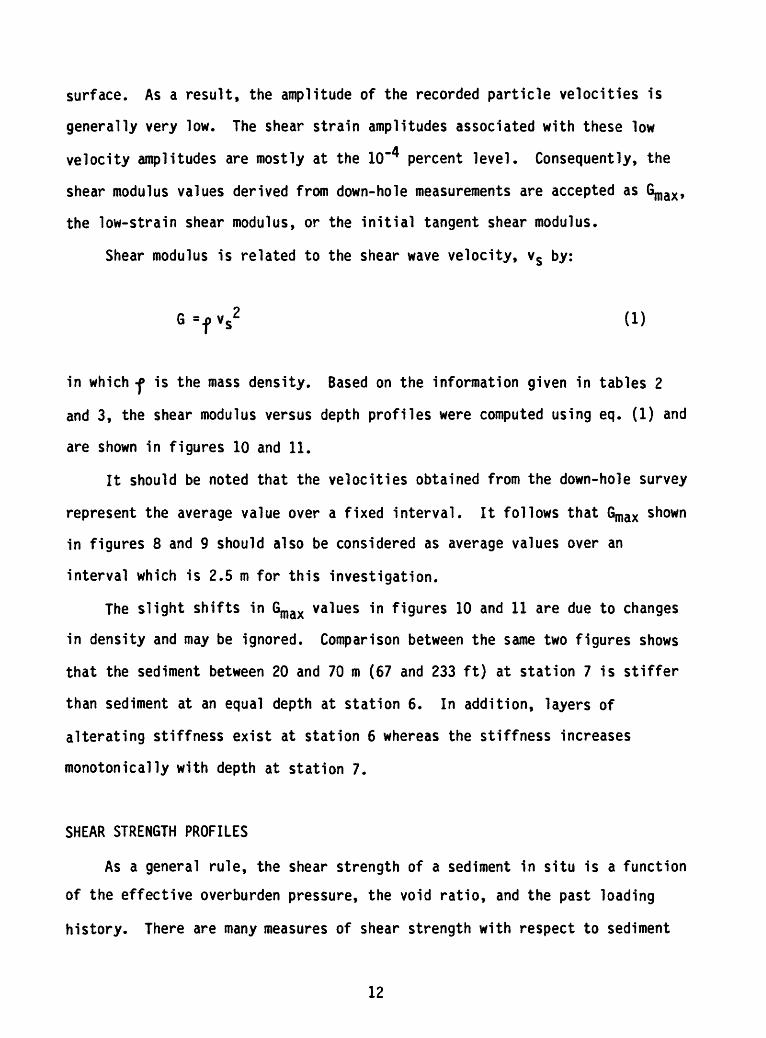
surface. As a result, the amplitude of the recorded particle velocities is
generally very low. The shear strain amplitudes associated with these low
velocity amplitudes are mostly at the 10~4 percent level. Consequently, the
shear modulus values derived from down-hole measurements are accepted as
the low-strain shear modulus, or the initial tangent shear modulus.
Shear modulus is related to the shear wave velocity, vs by:
(1)
in which -P is the mass density. Based on the information given in tables 2
and 3, the shear modulus versus depth profiles were computed using eq. (1) and
are shown in figures 10 and 11.
It should be noted that the velocities obtained from the down-hole survey
represent the average value over a fixed interval. It follows that Gmax shown
in figures 8 and 9 should also be considered as average values over an
interval which is 2.5 m for this investigation.
The slight shifts in Gmax values in figures 10 and 11 are due to changes
in density and may be ignored. Comparison between the same two figures shows
that the sediment between 20 and 70 m (67 and 233 ft) at station 7 is stiffer
than sediment at an equal depth at station 6. In addition, layers of
alterating stiffness exist at station 6 whereas the stiffness increases
monotonically with depth at station 7.
SHEAR STRENGTH PROFILES
As a general rule, the shear strength of a sediment in situ is a function
of the effective overburden pressure, the void ratio, and the past loading
history. There are many measures of shear strength with respect to sediment
12

type, drainage condition and loading path. For one-dimensional seismic
response analysis of a horizontally layered system where shear wave motion
dominates, the measure for shear strength is the maximum applied shear
stress,7fmax » which is simply the maximum shear stress a soil element can
sustain on its vertical or horizontal plane (Hardin and Drnevich, 1972). For
both cohesive and cohesionless sediments under earthquake loading, *"£* max can
be computed from an equation given by Hardin and Drnevich (1972):
I ma*-
in which KQ = coefficient of lateral stress at rest; <$ ' = vertical effective
stress, c is the cohesion intercept, and f is the drained angle of friction.
Existing field procedures do not allow direct conversion from cone
penetration data to individual parameters KQ, c, and ft and therefore, a
direct application of Eq. (2) is not possible. For cohesive sediments such as
silt, clay, or the combination, the CRT results lead to a gross estimate of
the undrained shear strength, Su . For cohesionless sediments, the CRT results
can lead to a reasonable estimate of <f>'> and the possible use of Eq. (2).
However, we failed to find any means of estimating any measure of shear
strength from CRT data for marginally cohesive sediments such as silty sand or
sandy silt. The procedure used for estimating the shear strength of cohesive
and cohesionless sediments is briefly described below.
First, to estimate Su for cohesive sediment, we use the relation proposed
by Drnevich and others (1974):
Su s 0.8*f- (3)
13

where f$ is the sleeve friction resistance registered by the cone. This
equation was based on results of cone penetration testing and triaxial testing
performed on undisturbed samples of a variety of cohesive soils that include
residual silty clays, compacted embankments, and clayey silts. The unconfined
compression tests we conducted showed that Su=0.9 kg/cm2 for soil layer 6-1
whereas Eq. (3) yields Su-0.8 kg/cm2 . We thus believe that Eq. (3) is capable
of predicting Su with adequate accuracy.
The ratio of Su of a sediment to its overburden effective stress, Su/<j-v'
reflects the state of overconsolidation of that sediment. Assuming Su/<fv'
=0.33 for normally consolidated clays and using the empirical relation as
shown in figure 10 (Schmertmann, 1978), we can determine the overconsolidation
ratio, OCR, for a particular cohesive layer.
We further assume that cohesionless sediment immediately below a cohesive
sediment has the same OCR as that cohesive sediment. Once the OCR for a
cohesionless soil is known, the cone bearing resistance is first corrected for
overconsolidation effects by applying the equation suggested by Schmertmann
(1978):
0.75[[oCR) 0 - 42-l] (4)
in which qCQr * s tne cone bearin9 resistance registered by the cone tip from
the overconsoli dated cohesive sediment, and qc^Q is the equivalent cone
bearing resistance if the same sediment were normally consolidated. qcNQ is
then used to predict the relative density, Dr , according to fig. 6. The
drained angle of friction, 0 , can then be estimated from Dr according to
figure 13.
14

Finally, KQ is determined by combining the relationship proposed by
Brooker and Ireland (1965) and by Schmertmann (1978):
K0 = (l-sin^')(OCR)°- 42 (5)
As previously noted, the procedure described above does not work well
with all sediment at these two stations. When a transition zone exists
between layers of cohesive or cohesionless sediment and the sediment type in
the transition zone is between silty sand and sandy silt, we found that the
cone resistance reading for this zone has the typical response of a sand even
though the friction ratio suggests the behavior of a clay or silt.
Consequently, the use of Eq. (3) will result in too high an estimate for Su ,
yet the cone resistance fails to predict a reasonable relative density as
well. For example, layer 6-5 at depths between 30.5 and 32 m has an average
fs close to 5 kg/cm2 with a corresponding Su=4 kg/cm2 . This Su would result
in a Su /<j-' of 1.33 and an OCR of 6, a rather unrealistic occurence considering
the corresponding values of stiff clay immediately below.
Because of the limited thickness of these transition zones and because of
the depositional characteristics at these two stations, we believe that the
shear strength of these layers of silty sands can be approximated by the
strength of their adjacent layers. Although cementation may be a cause for
sediment to have unusually high strength, we have found no evidence to support
this possibility.
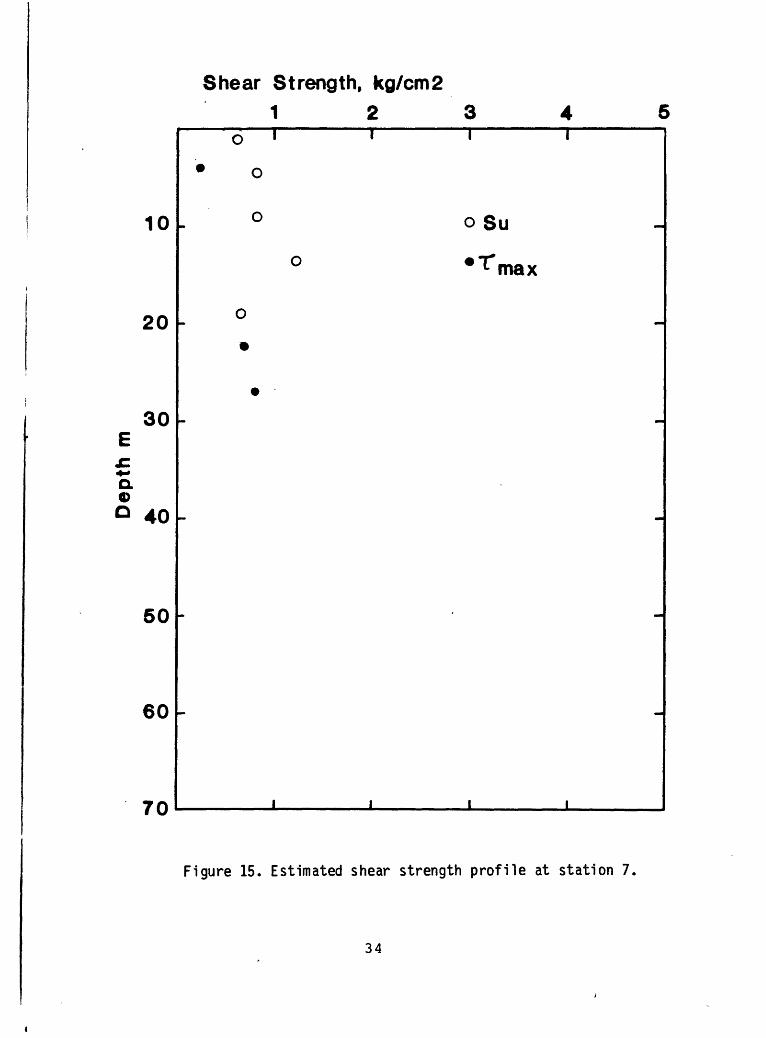
Results of our interpretation are given in figures 14 and 15 for the
strength profiles at stations 6 and 7 respectively. In both figures, the
strength for cohesive sediments are represented by Su and marked in small
circles whereas the strength for cohesionless sediments are represented
15

by *7^max and marked in solid dots. In computing T^max according to Eq. (2)
for cohesionless sediments, we have assumed zero cohesion.
Comparison between figures 14 and 15 indicates that the sediment at
station 7 has higher strength between 10 and 20 m than equally deep sediment
at station 6. Above 10 m, station 7 should be considered weaker because of
the presence of sand lenses near the surface. Below 20 m, both sites can be
considered as normally consolidated. The assumption of an artesian pressure
head of 8 m results in an OCR of 1 for the clayey silt at 20 m. A lower
artesian head would put the same clayey silt in the underconsolidated state
and a higher artesian head would make the clayey silt slightly over-
consolidated but would also reduce the f max value of the sand lenses.
Consequently, the 8-m pressure head appears to be a logical choice.
It was noted earlier that the ground water table is near the surface and
at the depth of 8 m, respectively, at stations 7 and 6, and that station 6 is
moving downward relative to station 7. It follows that the overconsolidation
may be attributed mainly to erosion at station 7 and desiccation at station 6.
ADDITIONAL REMARKS
We have presented field and laboratory data for stations 6 and 7 and
described our attempt to show the type and the extent of information on
sediment parameters that can be established from these data for the purpose of
conducting seismic response analyses. In carrying out this exercise we are
convinced that while cone penetration test alone may be adequate for
settlement prediction and pile design, additional laboratory work is
definitely needed to supplement CPT results for seismic studies. Although we
have demonstrated that shear strength can be interpreted from penetration
tests, there are not sufficient laboratory data to allow us to calibrate the
16

cone results and to assess the applicability of the empirical relations we
used.
Since the downhole seismic survey directly measures the seismic motion in
situ, this method provides the most reliable values of Gmax - It should be
noted, however, that the method based on the average value over a fixed
interval does not provide the fine details on local variation in sediment
properties as can be obtained with the continuous CRT. A compromise has to be
made in applying these field data to decide what extent of local variation in
soil properties is meaningful and should be considered.
In reviewing the procedure for estimating the shear strength, we feel
that the most crucial assumptions made were to treat the ratio, Su/<rv ' as 0-33
for clays with OCR=1 and the validity of figure 12. The OCR resulting from
these assumptions serves as a reference from which the past loading history at
a site is derived. Consequently, any deviation from the 0.33 value or the
plot in figure 12 may have a substantial effect on our estimates ofJJ,,ax . If
and when the opportunity arises, we strongly recommend that consolidation or
triaxial tests be performed on undisturbed samples from selected cohesive
sediments at these two stations. Groundwater conditions at these two stations
also merit confirmation.
Finally, we wish to stress that the strength profiles presented in
figures 14 and 15 only represented our best estimates from presently available
geotechnical data at these two sites. These strength profiles are subject to
further modifications when additional information from the two sites becomes
available. For example, an ongoing field investigation indicates that the
artesian pressure at station 6 may not have originated from the sand layer at
8-15 m but rather from the layer at 25-29 m. If this proves to be true
estimates of shear strength at station 6 have to be revised accordingly based
17

on a totally different vertical effective stress profile. Nevertheless, we
believe that the procedure described is a logical one and that the report is
useful in planning and executing further geotechnical investigations of
similar nature. If the readers are convinced that additional laboratory works
are necessary for this type of investigation, the report would have served its
purpose.
ACKNOWLEDGEMENTS
We thank R. L. Porcella, USGS, for providing us with the wave velocity
profiles at stations 6 and 7, and Elizabeth Turner, Univeristy of Texas at
Austin, for sharing with us some yet-to-be-published laboratory results. Homa
Lee and Les Youd, both at USGS, reviewed the report and offered many
constructive suggestions.
18

REFERENCES CITED
ASTM Standards. Part 19, 1978, Natural building stones; soil and rock, peats, mosses and humus: American Society fo Testing and Materials, Philadelphia, Pennsylvannia
Brooker, E. W., and Ireland, H. 0., 1965, Earthpressures at rest related to stress history: Canadian Geotechnical Journal, Vol. 11, No. 1, February, pp. 1-15.
Casagrande, Arthur, 1948, Classification and identification of soils: Transactions, American Society of Civil Engineers, v. 113, p. 919-922.
Elders, W.A., 1979, The geological background of the geothermal fields of the Salton trough, j£ Elders, W.A., ed., Geology and geothermics of the Salton trough: Geological Society of America, 92n(I Annual Meeting, San Diego, California, Guidebook for field trip no. 7, and University of California, Riverside, Campus Museum Contributions no. 5, p. 1-19
Drnevich, V. P., Gorman, C. T., and Hopkins, T. C., 1974, Shear strength of cohesive soils and friction sleeve resistance: Proceedings, European Symposium on Penetration Testing, Stockholm, Vol. 1, pp. 129-132.
Fumal, T.E., Gibbs, J.F., and Roth, E.F., 1982, In-situ measurements of seismic velocity at 10 strong motion accelerograph stations in central California: U.S. Geological Survey Open File Report 82-407, 76 p.
Hardin, B. 0., and Drnevich, V. P., 1972, Shear modulus and damping -- design equations and curves: Journal of the Soil Mechanics and Foundation Division, ASCE, Vol. 98, No. SM7, July, pp. 667-692.
Kobayashi, N., 1959, A method of determing the underground structure by means of SH waves: Zisin, ser. 2, v. 12, p. 19-24.
Lambe, T.W., and Whitman, R.V., 1969, Soil Mechanics: New York, John Wiley and Sons, 533 p.
Martin, G.R., and Douglas, B.J., 1981, Evaluation of the cone penetrometer for liquefaction hazard assessment: U.S. Geological Survey Open File Report SI- 284, 359 p.
Mendenhall, W.C., 1909, Groundwater of the Indio region, California: U.S. Geological Survey Water-Supply Paper 225, 56 p.
Muller, C. S., Boore, D. M., and Porcella, R. L., 1982, Detailed study of site amplification at El Centre Strong-Motion Array Station #6: Proceedings, 3rd International Earthquake Microzonation Conference, June 28-July 1, 1982, Seattle, U.S.A., Vol. 1, pp. 413-424.
Sanglerat, G., 1972, The Penetrometer and Soil Exploration: Elsevier Publishing Co., New York, 434 p.
19

Schmertmann, J.H., 1978, Guidelines for cone penetration test, performance and design: U.S. Department of Transportation, Federal Highway Administration, FHWA-TS-78-209, 143 p.
Seed, H.B., Woodward, R.J., and Lundgren, Richard, 1964, Clay mineralogical aspects of the Atterberg lin.its: Journal of Soil Mechanics Division, v. 90, p. 107-131.
Sharp, R.V., 1972, Tectonic setting of the Sal ton Trough, in, The Borrego Mountain earthquake of April 9, 1968: U.S. Geological Survey Professional Paper, 787, p.3-15
Shepard, P.P., 1954, Nomenclature based on sand-silt-clay ratios: Journal of Sedimentary Petrology, v. 24, p. 151-158
Skempton, A. W., 1944, Notes on the compressibility of clayes: Geological Society of London Quaterly Journal, v. 50, p. 119-135.
Terzaghi, K., and Peck, R.B., 1967, Soil Mechanics in Engineering Practice: 2na ed., John Wiley and Sons, Inc., New York, 729 p.
Van De Kamp, P.C., 1973, Holocene continental sedimentation in the Salton Basin, California; a Reconnaissance: Geological Society of America Bulletin, v. 84, no. 3, p. 827-848
Warrick, R.E., 1974, Seismic investigation of a San Francisco Bay mud site: Bulletin of the Seismological Society of America, v. 64, p. 375-385.
Youd, T.L., and Wieczorek, G.F., in press, Liquefaction and secondary ground failure: jn_ U.S. Geological Survey Professional Paper 1254.
20

80
- MEXICO
Figure 1. Location of strong motion stations.
21

34°H
Salt on Trough Qeomorphic Province
X
Crest of Delta X
California ^
"Mexico
20 40
km
116
Quit of mCalifornia
Figure 2. Geographic features of the Imperial Valley region.
22

to
lit
«
cla
y !
L
AK
EM
Ot
tak
« C
«fc«
M»«
AL
UU
VU
IM
Atl
MlM
T
Cr«
v«
l
oU
y
t.
«*
t«
m«r»
lil«
(
M
S
T«»
tl«r
y
Figure 3
. Ge
nerali
zed
geol
ogic
map o
f Im
peri
al V
alle
y region

FRICTI6N RESISTANCE T8FC
C8NE RESISTANCE FRICTION RflTIO
.17-
20
21
22
23
24
26
26
27
28
29
30
31
32
33
34
36
100 tOO 900 4110 SIM) 800 700 800
sandy siltor
silty sand
106-
110-
116
7
e
9
10
11
12
13
14
H5
16°
116
20
21
22
23
24
25
26
27
28
29
30
31
32
33
34
36
Figure 4. Log of station 6.
Cone resistance scale changed to 800 24

FRICTION RE8I8TRNCE TBFfKf/CH*),
C8NE RE8I8TRNCE 88IL CflLUfIN
IliO 178 210 (
110
FRICTION RflTie'
sandy siltor
silty sand
7
e
9
10
11
12
13
14
o 162
106
19
20
21
22
23
24
26
26
27
28
29
30
31
32
33
110
Figure 5. Log of station 7.
25

^0.5 oO).*
%h-« *
CO
1.0
0)
I 1.5 o0)
UJ
O .u
2.5
3.0
Cone Resistance qc kg/cm2
100 200 300 400 500
Figure 6. Relative density determined from CRT and vertical effective stress (Schmertmann, 1978).
26

&-S
*»
1>>
4-> H O
50
40
30
20
10
CL
CH
MH
10 20 30 40 50 60
Liquid limit, % water
70 80 90 100
Figure 7. Unified soil classification of fine sediment
no. hole/depth m
1234567891011
6/2.76/6.96/11.66/14.36/22.16/29.07/2.77/13.77/22.97/26.57/26.5
100% clay
test result
7 sample number
100% sand
Figure 8. Shepard classification of sediment.
100% silt
27

Vertical Effective Stress ,<ry , kg/cm2 02468
--station 7
Figure 9. Vertical effective stress versus depth at stations 6 and 7,
28

Low-Strain Shear Modulus, 6mox> MPa 100 200 300 400
10
20
30
£ 40o>O
50
60
70
80
Figure 10. Low-strain shear modulus versus depth at station 6.
29

Low-Strain Shear Modulus, 6max , MPa 100 200 300 400
10
20
30
oQ
50
60
70
60
Figure 11. Low-strain shear modulus versus depth at station 7,
30

6 1 I I I I I
I___I_____I___I__I Jill2 3 4 56789 10
OCR
Figure 12. Normalized (Su/<r/) ratio versus OCR (Schmertmann, 1978).
31

10 30 50 70
Relative Density
Figure 13. Friction angle versus relative density (Schmertmann, 1978)
32

Shear Strength, kg/cm2 2 3 4
10
20
30
a a> a
40
50
60
70
o
o o
° ~
o
oSu
rmax
Figure 14. Estimated shear strength profile at station 6,
33
Shear Strength, kg/cm21 2 3
10
20
30Ex:4-»
a0 40
50
60
70
o
o
o
o Su
Figure 15. Estimated shear strength profile at station 7.
34

Tabl
e 1.
Sediment d
escr
ipti
on o
f st
atio
ns 6
and
7
to Ul
Soil
Layer
No.
6/1
6/1
6/1
6/1
6/2
6/2
6/3
6/5
7/1
7/2
7/3
7/3
7/3
Samp
le
Depth m
2.7
2.8
3.4
6.9
11.6
14.3
22.1
29.0
2.7
13.7
22.9
26.5
26.5
Sand
7 X X 3 66 0 44 1 3 2 0 13 X
Silt
22 X X 33 27 60 48 48 49 25 86 76 X
Clay
71 X X 64 7 40 8 51 48 73 14 11 X
wn 28 32 30 X X X X 28 31 X 31 X 31
Wl 64 X X 57 X 45 X 66 54 76 30 X 49
WP 33 X X 31 X 29 X 30 27 31 26 X 26
D50
.001
X X .002
.080
.006
.056
.004
.004
.001
.014
.027
X
Bulk
De
nsit
y
X 1.93
1.96
X X X X X X X X X X
SPT N 16 X X X 50+
X X 43 10 X 48 X X
Stre
ngth
kg
/cm2
X 0.94
0.86
X X X X X X X X X X
Wn =
nat
ural
wat
er c
ontent,
W1 =
liqu
id l
imit
, Wp
= p
lastic l
imit,
D5Q
* median g
rain
siz
e, N
= b
lows/foot

Table
2 S
ite
Desc
ript
ion
of S
tation 6
Soil
Laye
r No
. Description
Estimated
Ave.
Ave. Sh
ear
Dept
h Bulk D
ensi
ty
Wave
Vel
ocit
yOc
cupi
ed
in g
m/cc
in m
/sRe
mark
s
6-1
Medium s
tiff si
lty
clay
0-8 m
1.95
200
Dens
ity
averaged f
rom
samp
le*
at 2
.5-4m. A
ve.
SUS0.9 k
g/cm
' fr
om s
ame
samples.
to
cr>6-
2 Very d
ense s
and
to s
ilty s
and
8-15 m
2.1
250
Estimated
D =90%,
an a
rtesian
pres
sure
head
of 8m i
s assumed.
medi
um s
tiff c
layey
6-3
and
dens
e sa
nd
6-4
Very d
ense s
and
6-5
dense
silty
sand
and
stiff
clay.
6-6
medi
um t
o stiff
clay
some c
oarse
sand
6-7
medi
um s
tiff
clay
some
fine
sand
15-25
m 2.0
25-2
9 m
2.1
29-34
m 2.
0
34-6
0 m
60-7
5 m
200
280
280
260
400
Dens
e sand le
nses
at 1
6 and
19 m
wi
th e
stimated D
r of
70
& 80
%.
Esti
mated
Dr=85%
CRT
stopped
at 3
4 m.

Table
3 S
ite
Desc
ript
ion
of S
tation 7
Soil
La
yer
No.
Description
Esti
mate
d Av
e.
Ave.
Sh
ear
Dept
h Bulk D
ensi
ty
Wave
Vel
ocit
y Oc
cupi
ed
in g
m/cc
in m
/sRe
mark
s
Inte
rbed
ed m
ed d
ense
7-1
sand an
d me
d st
iff
clay
ey s
ilt
0-7 m
2.0
190
Ground w
ater
tab
le a
t the
surface. Es
tima
ted
Dr=7
8%
for
sand a
t 4
m.
Med
stif
f to
stiff
7-2
clayey s
ilt,
si
lty
clay,
and
sandy
clay
7-21
m1.
919
0De
nsit
y fr
om s
ampl
es a
t at
14
m.
Interbed of
dense
7-3
sand an
d st
iff
clay
ey
21-32
m silt
2.1
320
Sand lenses at 2
2, 27,
and
30"1
with
eat
imat
ed D
r of
67,7
0, an
d 70
%.
Assortment o
f dense
7-4
sand
, sandy
and
silty
32-5
8 m
2.0
clay
320
CRT
stopped
at 3
2 m.
7-5
Asso
rtme
nt o
f sa
ndy
58-7
5 m
and
silty
clay
400


![[MS-RPL]: Report Page Layout (RPL) Binary Stream Format€¦ · MS-RPL] —. stream report. report page. report report report](https://img.pdfslide.us/doc/110x75/5fd9f7a7a90b7c34145fa364/ms-rpl-report-page-layout-rpl-binary-stream-format-ms-rpl-a-stream-report.jpg)


![Settlement Prediction of Footings Using VS · Bazaraa [3], and Burland & Burbidge [4] suggested methods of settlement estimation for footings based on the SPT-N value while Schmertmann](https://img.pdfslide.us/doc/110x75/6100d6a690f05f5e46617d78/settlement-prediction-of-footings-using-vs-bazaraa-3-and-burland-burbidge.jpg)

![For The Region: Report, Report, Report [Eng]](https://img.pdfslide.us/doc/110x75/579079761a28ab6874c751c6/for-the-region-report-report-report-eng.jpg)