Embed Size (px)
Citation preview

N e w M e x i c o B u r e a u o f G e o l o G y a N d M i N e r a l r e s o u r c e s
Overview of Fresh and Brackish Water Quality in New Mexico
open-file report 583 June 2016
Lewis Land

New Mexico Bureau of Geology and Mineral Resources A division of New Mexico Institute of Mining and Technology Socorro, NM 87801(575) 835 5490 Fax (575) 835 6333geoinfo.nmt.edu
Overview of Brackish Water Resources in New Mexico
Lewis Land
open-file report 583 June 2016
New Mexico Bureau of Geology and Mineral resources

P r o J e c t f u N d i N G
New Mexico Environment Department, Drinking Water Bureau, MOU 16 667 3000 0006, Project 4.
The views and conclusions are those of the authors, and should not be interpreted as necessarily representing the official policies, either expressed or implied, of the State of New Mexico.
N E W M E X I C O B U R E A U O F G E O L O G Y A N D M I N E R A L R E S O U R C E S F R E S H A N D B R A C K I S H W A T E R Q U A L I T Y
i. introduction ....................................................................... 1
ii. Methods .................................................................................. 2
i. summary of observations ................................... 5 Variation of salinity as a function of depth ......... 5 Three-dimensional variations in water chemistry .............................................................. 5 Water chemistry outliers ................................................. 5
iV. future work ....................................................................... 6
V. summary of water chemistry data ............ 7 Rio Grande Rift basins .................................................... 7 San Luis Basin ............................................................. 7 Española Basin ........................................................... 9 Albuquerque Basin .................................................11 Socorro-La Jencia Basins ....................................15 San Marcial and Engle Basins .........................17 Palomas Basin ...........................................................17 Mesilla Basin .............................................................19 Basins adjacent to the Rio Grande Rift ................22 Jornada del Muerto Basin ..................................22 Estancia Basin ...........................................................24 Mimbres Basin ..........................................................26 San Agustin Basin ...................................................29 Tularosa Basin ..........................................................31 Lower Pecos Valley aquifers .......................................33 Roswell Artesian Basin ........................................33 Capitan Reef ..............................................................36 Eastern New Mexico – High Plains .......................39 Raton-Las Vegas Basins ......................................39 High Plains Aquifer ...............................................40 Northwestern New Mexico – Colorado Plateau ................................................................................42 San Juan Basin ..........................................................42
references ....................................................................................45
figures1. New Mexico counties, groundwater basins and aquifers, and tectonic regions ........................2–32. San Luis Basin, surface geology and data distribution ......................................................... 83. San Luis Basin plots of TDS and specific conductance vs. depth ........................... 94. Española Basin, surface geology and data distribution .......................................................105. Española Basin plots of TDS and specific conductance vs. depth .........................116. Albuquerque Basin, surface geology and data distribution .......................................................127. Albuquerque Basin plots of TDS and specific conductance vs. depth .........................138. Socorro-La Jencia Basins, surface geology and data distribution .......................................................149. Socorro-La Jencia Basins plots of TDS and specific conductance vs. depth .........................1510. San Marcial and Engle Basins, surface geology and data distribution .......................................................1611. San Marcial and Engle Basins plots of TDS and specific conductance vs. depth .........................1712. Palomas Basin, surface geology and data distribution .......................................................1813. Palomas Basin plots of TDS and specific conductance vs. depth .........................1914. Mesilla Basin, surface geology and data distribution .......................................................2015. Mesilla Basin plots of TDS and specific conductance vs. depth .........................2116. Jornada del Muerto Basin, surface geology and data distribution .......................................................2317. Jornada del Muerto Basin plots of TDS and specific conductance vs. depth .........................2418. Estancia Basin, surface geology and data distribution .......................................................2519. Estancia Basin plots of TDS and specific conductance vs. depth .........................2620. Mimbres Basin, surface geology and data distribution .......................................................27
c o N t e N t s

F R E S H A N D B R A C K I S H W A T E R Q U A L I T YN E W M E X I C O B U R E A U O F G E O L O G Y A N D M I N E R A L R E S O U R C E S
Intentionally blank
21. Mimbres Basin plots of TDS and specific conductance vs. depth .........................2822. San Agustin Basin, surface geology and data distribution .......................................................2923. San Agustin Basin plots of TDS and specific conductance vs. depth .........................3024. Tularosa Basin, surface geology and data distribution .......................................................3225. Tularosa Basin plots of TDS and specific conductance vs. depth .........................3326. Roswell Artesian Basin, surface geology and data distribution .......................................................3427. Roswell Artesian Basin plots of TDS and specific conductance vs. depth .........................3628. Capitan Reef aquifer, surface geology and data distribution .......................................................3729. Raton and Las Vegas Basins, surface geology and data distribution .......................................................3830. Raton and Las Vegas Basins plots of TDS and specific conductance vs. depth .........................4031. High Plains aquifer, surface geology and data distribution .......................................................4132. High Plains aquifer plots of TDS and specific conductance vs. depth .........................4233. San Juan Basin, surface geology and data distribution .......................................................4334. San Juan Basin plots of TDS and specific conductance vs. depth .........................44
tables1. San Luis Basin, summary of water chemistry ..... 72. Española Basin, summary of water chemistry .... 9 3. Albuquerque Basin, summary of water chemistry ................................................................................134. Socorro-La Jencia Basins, summary of water chemistry ..................................................................155. San Marcial and Engle Basins, summary of water chemistry ............................................................17 6. Palomas Basin, summary of water chemistry ...197. MesillaBasin, summary of water chemistry .......218. Jornada del Muerto Basin, summary of water chemistry ..................................................................22 9. Estancia Basin, summary of water chemistry ...2610. Mimbres Basin, summary of water chemistry ..2811. San Agustin Basin, summary of water chemistry ................................................................................30 12. Tularosa Basin, summary of water chemistry ...3313. Roswell Artesian Basin, summary of water chemistry ..................................................................3514. Capitan Reef aquifer, summary of water chemistry, based in part on preliminary analysis of samples collected by Sandia National Labs .....................................................37 15. Raton and Las Vegas Basins, summary of water chemistry ..................................................................3916. High Plains aquifer, summary of water chemistry ................................................................................4017. San Juan Basin, summary of water chemistry ..43
appendix 1. Geologic map unit descriptions

1
F R E S H A N D B R A C K I S H W A T E R Q U A L I T Y
access to adequate supplies of fresh water is becoming an increasingly critical issue in many
parts of the world. In arid regions of the south-western United States, diminishing water supplies and extended periods of drought have generated an interest in non-traditional water resources, and the development of new technologies such as desalina- tion of brackish water to exploit those resources. New Mexico has limited supplies of fresh water, but over the last century there have been claims that the state has very large reserves of brackish groundwater
i . i N t r o d u c t i o N
(e.g., Hood and Kister, 1962; McLean, 1970). However, our knowledge of the quality and volume of these brackish water resources varies significantly across the state. Some aquifers and groundwater basins in more densely populated areas have been very thoroughly investigated by multiple individuals and agencies over time periods of years or decades. Despite this foundation of pre-existing research, our knowledge of the distribution of brackish groundwater in many aquifers in New Mexico is often poorly constrained.

N E W M E X I C O B U R E A U O F G E O L O G Y A N D M I N E R A L R E S O U R C E S
2
in this report, we provide an overview of basic water chemistry parameters in each of the major
groundwater basins and aquifers in New Mexico (Figure 1), based, for the most part, on measurements from drinking water wells. In some basins, data from a limited number of deep monitoring wells and exploratory wells are also included. This overview is derived primarily from reviews of existing literature, and from a compilation of water chemistry records
i i . M e t h o d s
assembled by the New Mexico Bureau of Geology and Mineral Resources (NMBGMR). These data include newly digitized historic regional water qual-ity reports, more recent NMBGMR water chemistry data from the Aquifer Mapping Program, and data from the U.S. Geological Survey (USGS). Data from other sources, such as the New Mexico Environment Department or private consulting firms, were not included in this review because of time constraints of
Figure 1A. New Mexico counties, groundwater basins and aquifers discussed in this report.

3
F R E S H A N D B R A C K I S H W A T E R Q U A L I T Y
this project and/or the limitations of data available. The data were grouped together for this review into the major groundwater basins in the state, and sum-marized in tables listing maximum, minimum, median and mean concentrations of eleven water quality parameters: Calcium, magnesium, sodium, bicarbon-ate, sulfate, chloride, fluoride, arsenic, uranium, total dissolved solids (TDS), and specific conductance. Plots have also been prepared for each basin that show variations in TDS and specific conductance as a function of depth. Much of these data are also available to download and view from the NMBGMR webpage at geoinfo.nmt.edu/maps. The geographic boundaries of a groundwater basin or aquifer will inevitably be somewhat arbi-trary, depending on which factors are used to define the extent of an individual basin. We have chosen not to rely on administrative basin boundaries as defined
by the New Mexico Office of the State Engineer (NM OSE). In most cases, we have chosen to define the lateral extent of a basin or aquifer rather broadly, to insure capturing all the wells in the area of inter-est. Some areas of the state were not included in this study because they do not fall into the category of a specific groundwater basin or aquifer. Some moun-tainous regions of New Mexico were not included because they are areas of groundwater recharge where brackish water resources are not likely to exist. Other sparsely populated areas with limited available data, such as the west-central part of the state, the middle Pecos region between Roswell and Vaughn, and the bootheel region in Hidalgo County, were also excluded. In many cases, multiple water chemistry measure-ments were available for the same well, sometimes over a period of several years. Every effort has been
Figure 1B. Major tectonic regions and the Jemez Linaement as discussed in this report.
10
10
25
25
40
40
0 50 mi
50 km0
N
S
W E
Santa Fe
Las Cruces
Albuquerque
San Juan River
Rio G
rande
Canadian R
iverPecos River
RIO
GR
AN
DE
RI F
T PL
AT
EA
U
CO
LO
RA
D
O
RA
NG
E
BA
SI N
&
D AT I LM O G O L L O N -
F I E L DV O L C A N I C H
I GH
PL
AI N
S
J e m e z L i n e a m e n t
SO
UT
HE
RN
SO
UT
HE
RN
RO
CK
Y M
TN
S.

N E W M E X I C O B U R E A U O F G E O L O G Y A N D M I N E R A L R E S O U R C E S
4
made to eliminate duplication to avoid biasing the results, so only the most recent, or most complete water chemistry record is used for an individual well. In addition, the USGS and NMBGMR data sets include a certain amount of overlap, and this redundancy will influence the results documented in the data tables and plots. Well identifiers are not consistent between the two data sets, thus identifying duplication in this case is a non-trivial task. Although our water chemistry records would be improved by
eliminating that redundancy, such an effort is beyond the scope of the current study. Basin-specific discussions of water chemis-try reference maximum contaminant level (MCL) standards for drinking water established by the U.S. Environmental Protection Agency (EPA) for fluoride (4 mg/l), arsenic (0.01 mg/l, or ten parts per billion), and uranium (0.03 mg/l, or 30 parts per billion); and EPA secondary standards for chloride concentrations (250 mg/l) and TDS (1000 mg/l).

5
F R E S H A N D B R A C K I S H W A T E R Q U A L I T Y
the contents of this report provide a tool for rapid comparison of data availability, water quality and
salinity among the various groundwater regions in New Mexico. This investigation is intended to pro-vide a broad overview of water quality in individual basins, and is by no means comprehensive. However, certain general observations became apparent over the course of the study:
Variation of salinity as a function of depth
P lots of TDS and specific conductance vs. depth were prepared based in part on the assumption
that there is a general increase in salinity of ground-water at greater depths. In fact, in almost every case the data appear to show that the opposite is true. The most saline water is found at shallower depths, and in some basins we observe an almost exponential decrease in dissolved solids at greater depths. There are two reasons for this counter-intuitive phenom-enon: (1) The shallower portions of an aquifer are more likely to have a direct link with the surface water system, receiving recharge by leakage from losing streams and irrigation return flow. These sources of recharge are more subject to processes of evapotranspiration, which in some of the closed basins in New Mexico may be extreme, leading to a concentration of salts in the shallower portions of the aquifer system. (2) Our data set relies on water samples collected from existing wells, which in most cases are water supply wells. For obvious reasons, there are far fewer wells screened in the more saline portions of an aquifer, leading to an inherent bias in the data. In some regions, deep monitoring wells have been deliberately completed in brackish water zones for scientific purposes, but such wells are few in number compared to those completed for fresh water supply. Other lines of evidence such as geophysical surveys, regional investigations of deep aquifer sys-tems, water chemistry from deeply-sourced artesian springs and deep exploratory wells, and comparison
i i i . s u M M a r y o f o B s e r V a t i o N s
with basins in other regions suggest that more saline groundwater probably does exist at greater depths in some areas of New Mexico, and possibly in large quantities. However, in a majority of the basins investigated in this study, such a conceptual model is not supported by the data at hand for the reasons described above.
three-dimensional variations in water chemistry
in many basins, the lateral distribution of groundwa-ter salinity is just as relevant as variations in min-
eral content as a function of depth. And while some basins display well-defined freshwater-saltwater tran-sition zones, the position of the interface will usually vary with depth in the basin. To accurately character-ize the distribution of fresh and saline groundwater in a given basin, it is thus necessary to examine the three-dimensional distribution of groundwater salin-ity. Such an investigation is unfortunately beyond the scope of this study.
water chemistry outliers
several of the basins in this study, even those that contain relatively fresh water, display salinity
extremes that may not be representative of the overall water quality in that region. There are a variety of reasons for these outliers, such as location of a particular well in a salt pan or playa. Well depth may also create outliers, because our records occasion-ally include samples collected in exploratory wells drilled by oil companies, skewing the plots of TDS and specific conductance vs. depth. In some cases we have chosen to exclude outliers from those plots to more effectively illustrate the general distribution of salinity in a given basin. However, these outliers are still included as maximum values in the data table summaries, and their exclusions are discussed in the narrative for that basin.

N E W M E X I C O B U R E A U O F G E O L O G Y A N D M I N E R A L R E S O U R C E S
6
this investigation has assembled available digital water chemistry data for most of the individual
groundwater basins and aquifers in New Mexico, providing a foundation for future, more basin-specific analysis of brackish water resources in the state. The presence of abundant resources of brackish groundwater in New Mexico is a widely held assump-tion by state decision makers, water scientists, and water resource managers. In fact, this study has shown that (1) a detailed and quantitative under-standing of those resources in individual basins is quite limited, and that (2) chemistry data derived only from existing water supply wells is insufficient to provide a thorough understanding of the distribu-tion of groundwater salinity. Additional, and some-times indirect methods must be used to accurately characterize brackish water resources. For example,
i V . f u t u r e w o r k
Kelley et al. (2014) used borehole geophysical logs, coupled with produced water chemistry results from oil and gas wells, to calculate groundwater salinity in their assessment of hydrologic resources in the San Juan Basin. A systematic program of exploratory drilling in selected regions of the state would provide direct information about the presence and volume of brack-ish water at greater depths. Geophysical investiga-tions that supplement our existing water chemistry data probably have the most potential to more precisely evaluate brackish water resources in indi-vidual basins in New Mexico. Continued efforts on reviewing and compiling high quality water chemistry data, such as information found in private consulting reports or complete datasets from other state agen-cies, may also help to improve on this review.

7
F R E S H A N D B R A C K I S H W A T E R Q U A L I T Y
this report is organized into regional aquifers or basins, and presented in groups following the tec-
tonic regime of New Mexico. The complex geology of the state provides the framework and boundaries for the aquifers, and directly influences the avail-ablility of groundwater. These tectonic regimes are depicted in Figure 1B.
rio Grande rift basins
the tectonic framework of New Mexico has been profoundly influenced by late Neogene crustal
extension that formed the Rio Grande Rift. The rift in northern New Mexico consists of a series of oppositely-tilted half grabens flanked by discon-tinuous mountain ranges (Smith, 2004). There is a general southward increase in the width of the rift system, to incorporate basins adjacent to the central rift axis such as the Mimbres and Tularosa Basins (Adams and Keller, 1994). The structure and tectonics of the Rio Grande Rift have been subject to extensive investigations over the past century by many workers too numerous to cite here (many of those workers are cited in discussions of individual basins below). In the context of this report, the significance of the Rio Grande Rift is its role in forming several of the larg-est and most important (in terms of societal impact) groundwater basins in the state of New Mexico
San Luis Basin
The San Luis Basin is the northernmost and largest basin of the Rio Grande Rift system in New Mexico (Figure 2). Most of the basin is located in Colorado, where it merges to the north with the Upper Arkansas River graben (Grauch and Keller, 2004). The basin is
V . s u M M a r y o f w a t e r c h e M i s t r y d a t a
~150 miles long and 55 miles wide, and has the general form of an east-dipping half graben. Basin-fill material is composed of Tertiary-Quaternary sediments of the Santa Fe Group and late Cenozoic volcanics (Kelley et al., 1976). The basin is bounded to the west by the Tusas and San Juan Mountains and to the east by the Sangre de Cristo Mountains and the Sangre de Cristo fault zone. The deepest part of the basin is found in the Taos graben, a narrow zone 6 to 18 miles wide adjacent to the Sangre de Cristo mountain front (Grauch and Keller, 2004). The southern part of the basin is occupied by the Taos Plateau, which is com-posed of Pliocene basalt flows that overlie Santa Fe Group basin fill. The southeastern margin of the basin is defined by the Embudo fault zone, which separates the east-tilted San Luis Basin from the west-tilted Española Basin to the south (Bauer and Kelson, 2004). Both a shallow and a deep aquifer system have been identified in the San Luis Basin. The shallow aquifer system consists of unconsolidated Quaternary fluvial and alluvial fan deposits, overlying and inter-bedded with basalt flows of the Servilleta Formation. A few wells yield water from fractured Paleozoic carbonates and Precambrian crystalline rocks along the Sangre de Cristo mountain front. These local aquifers are hydraulically connected to the shallow alluvial aquifer system. The deeper aquifer system is associated with Tertiary basin-fill material, consisting of weakly to moderately cemented fluvial, alluvial fan and volcaniclastic sediments that underlie the Servilleta Formation (Drakos et al., 2004a; 2004b). The deep aquifer, where investigated, is >2,000 feet thick, but is probably substantially thicker in the Taos graben, which has a depth of ~16,000 feet (Bauer and Kelson, 2004). Our data set includes 300 records for the San Luis Basin, which show that water quality in both
Table 1. San Luis Basin, summary of water chemistry.
Specific Cond. (µS/cm)
TDS (mg/l)
Ca (mg/l)
Mg (mg/l)
Na (mg/l)
HCO3 (mg/l)
SO4 (mg/l)
Cl (mg/l)
F (mg/l)
As (mg/l)
U (mg/l)
Well depth
Maximum 7,140 2,720 630 190 570 620 1,820 415 20 0.06 0.055 3,180Minimum 94 73 0.74 0.012 2.3 1 1.5 0.2 0.05 0.0001 0.0002 10Mean 446.8 330.4 56.3 10.4 34.9 160.3 90.5 13.1 0.99 0.0028 0.0056 424Median 330 245 37.2 8 21 145 31 5.9 0.48 0.001 0.0029 300

N E W M E X I C O B U R E A U O F G E O L O G Y A N D M I N E R A L R E S O U R C E S
8
Figure 2. San Luis Basin, surface geology and data distribution.

9
F R E S H A N D B R A C K I S H W A T E R Q U A L I T Y
Figure 3A. San Luis Basin, Depth vs. TDS. Figure 3B. San Luis Basin, Depth vs. specific conductance.
8,000
6,000
4,000
2,000
0 500 1,000 2,0001,500 2,500 3,5003,0000
Depth (ft)
San Luis Basin: Depth vs. Specific Conductance
Spec
ific C
ondu
ctanc
e (μS
/cm)
3,000
1,500
2,500
2,000
1,000
500
0 500 1,000 1,500 3,0002,5002,000 3,5000
Depth (ft)
San Luis Basin: Depth vs. TDS
TDS
(mg/L
)the shallow and deep aquifers is generally good, with mean and median values of TDS <500 mg/l, and mean chloride concentrations of only 13.1 mg/l (Table 1, Figures 3A, 3B). Locally elevated levels of arsenic and fluoride have been observed in wells completed in the deep aquifer (Drakos et al., 2004b). The data set
These faults are downthrown to the east and are cov-ered by extrusive rocks of the Jemez Mountains volca-nic field. The eastern margin of the basin is defined by the Santa Fe and Sangre de Cristo Mountains and is less structurally complex, characterized by a west-dipping Precambrian surface without major faulting. The SW-NE-trending Embudo fault zone extends obliquely across the basin, decoupling the main Española Basin to the south from the northern and northwestern parts of the basin, including the Abiquiu Embayment north of the Jemez Mountains (Kelley, 1976; Ferguson et al., 1995; Grauch et al., 2009). Primary aquifers in the Española Basin are contained within the Tertiary-Quaternary Santa Fe Group. Basin-fill aquifers of the Santa Fe Group are the principal groundwater resource for the cit-ies of Santa Fe, Española, and six Pueblo nations. The Santa Fe Group thickens to the west and north, ranging from ~250 feet thick south of Santa Fe to greater than 10,000 feet beneath the Pajarito Plateau west of Española (Grauch et al., 2009). The Tesuque
Table 2. Española Basin, summary of water chemistry.
Specific Cond. (µS/cm)
TDS (mg/l)
Ca (mg/l)
Mg (mg/l)
Na (mg/l)
HCO3 (mg/l)
SO4 (mg/l)
Cl (mg/l)
F (mg/l)
As (mg/l)
U (mg/l)
Well depth
Maximum 23,000 30,000 430 3,500 1,000 2,180 20,000 1,000 16.2 0.207 2.5 2,499Minimum 66 92 1 0.025 2.8 35 0.7 0.5 0.042 0.00039 0.0001 5Mean 556.7 389.5 50.01 15.5 47.2 197.01 93.01 21.05 0.72 0.0068 0.129 585Median 383 246 39 5.5 22 158 20 8.8 0.44 0.0033 0.004 397
also show locally elevated levels of uranium. There is little evidence that deep brackish water resources are present in the San Luis Basin. However, the mean well depth in this region is only 424 feet. Considering the very substantial thickness of basin fill, if such a resource is present it remains largely uninvestigated.
Española Basin
The Española Basin is one of the northernmost basins of the Rio Grande Rift in New Mexico (Figure 4), and has been subject to extensive investigations in the past several decades (e.g., Kelley, 1978; Manley, 1979; Cordell, 1979; Golombek, 1983; Biehler et al., 1991; Johnson et al., 2008; Grauch et al., 2009). Although the Española Basin has the general form of a west-dipping half-graben, it exhibits a high level of structural complexity, consisting of a series of narrow, deep axial troughs in an otherwise shallow basin (Ferguson et al., 1995). The basin is ~50 miles long and 18 to 40 miles wide, and is linked to the east-dipping Santo Domingo Basin to the south at the La Bajada constriction. The basin is connected to the north with the east-dipping San Luis basin at the Embudo constriction. The Santa Fe Embayment occupies the southeast corner of the basin. The Española Basin is bounded to the west by high-angle normal faults of the Pajarito fault zone.

N E W M E X I C O B U R E A U O F G E O L O G Y A N D M I N E R A L R E S O U R C E S
10
Figure 4. Española Basin, surface geology and data distribution.

11
F R E S H A N D B R A C K I S H W A T E R Q U A L I T Y
3,000
2,000
1,500
2,500
1,000
500
0 500 1,000 2,0001,500 2,5000
Depth (ft)
Española Basin: Depth vs. TDS
TDS
(mg/L
)Formation comprises the principal aquifer within the Santa Fe Group, and is in hydraulic communica-tion with aquifers within the overlying Ancha and Puye Formations. The highly heterogeneous and complex nature of the Tesuque aquifer reflects its depositional environment of coalescing alluvial fans, a heterogeneity that is compounded by discontinuities created by faulting. The Santa Fe Group aquifers are in hydraulic communication with Precambrian rocks along the eastern margin of the basin where most of the recharge occurs. Paleozoic limestones underly-ing the basin-fill aquifers, fractured Tertiary intrusive rocks, and Tertiary volcanics of the Jemez volcanic field also locally produce water (Lewis and West, 1995; Grauch et al., 2009). A substantial data set is available for the Española Basin, with 612 total data points. Ground-water in the Española Basin is generally of high quality (<1,000 mg/l TDS), but locally can be highly variable (Lewis and West, 1995; Johnson et al., 2008). Fault zones in the basin may focus upflow of
Figure 5A. Española Basin, depth vs. TDS. Figure 5B. Española Basin, depth vs. specific conductance.
5,000
4,000
3,000
2,000
1,000
0 500 1,000 1,500 2,5002,0000
Depth (ft)
Española Basin: Depth vs. Specific Conductance
Spec
ific C
ondu
ctanc
e (μS
/cm)
warm, mineralized groundwater from deep regional aquifers that mixes with the shallow meteoric system. These upwelling geothermal waters degrade shallow water quality and create locally elevated levels of arsenic and other undesireable constituents (Johnson et al., 2008; 2013; Johnson, 2014). However, they also suggest the presence of brackish water resources of unknown volume at greater depths. This phenomenon is reflected in the maximum, mean and median values for total dissolved solids in the Española Basin (Table 2, Figures 5A, 5B). A maxi-mum TDS value of 30,000 mg/l was collected from one well on the southwest margin of the basin, but the basinwide mean and median values are <1,000 mg/l. Arsenic values similarly reflect the localized nature of elevated arsenic concentrations. Arsenic concentrations of 0.207 mg/l were measured in a well at the northern end of the basin, more than 20 times the EPA MCL of 0.01 mg/l. However, the basinwide mean and median arsenic concentrations are well below the MCL for that constituent.
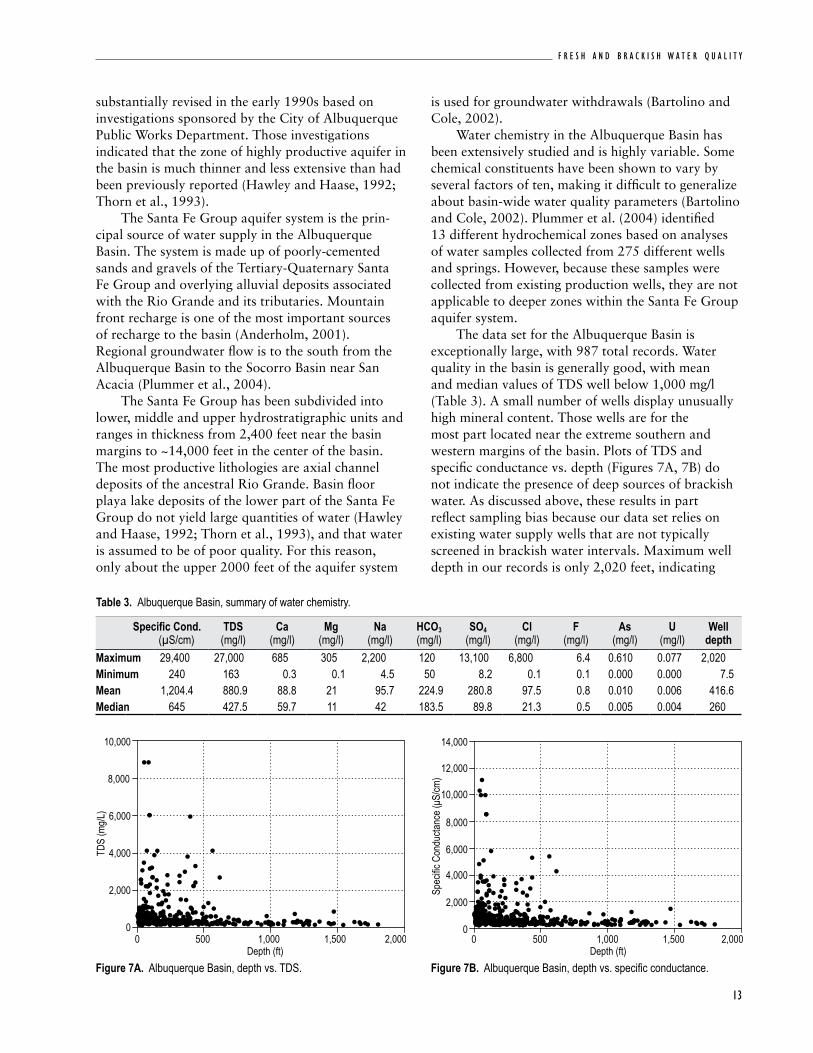
Albuquerque Basin
The Albuquerque Basin, also known as the Middle Rio Grande Basin (MRGB; Plummer et al., 2004), is defined by Thorn et al. (1993) to include the Santo Domingo Basin to the north, the Calabacillas and Belen Sub-Basins to the south, and the Hagan Embayment to the northeast (Figure 6). The Albuquerque Basin as thus defined is the second largest basin in the Rio Grande Rift, extending over more than 3,000 square miles and containing over 14,000 feet of basin-fill deposits. The basin is bounded to the north by the Jemez Mountains, and to the east by the Sandia, Manzanita, Manzano and
Los Piños Mountains. The western margin of the basin is defined by the Ladron Mountains, the Lucero and Nacimiento uplifts, and the Rio Puerco fault zone, a northeast-trending fault belt that separates the Albuquerque Basin from the Colorado Plateau (Plummer et al., 2004). The hydrology, structure, and character of the basin fill in the Albuquerque Basin have been the subject of extensive previous investigations, includ-ing Kelley, 1977; Heywood, 1992; Hawley and Haase, 1992; Thorn et al., 1993; Connell et al., 1998; Grauch, 2001; Grauch et al., 2001; and Plummer et al., 2004. The conceptual model of the hydro-geologic framework of the Albuquerque Basin was

N E W M E X I C O B U R E A U O F G E O L O G Y A N D M I N E R A L R E S O U R C E S
12
Figure 6. Albuquerque Basin, surface geology and data distribution.
13
F R E S H A N D B R A C K I S H W A T E R Q U A L I T Y
substantially revised in the early 1990s based on investigations sponsored by the City of Albuquerque Public Works Department. Those investigations indicated that the zone of highly productive aquifer in the basin is much thinner and less extensive than had been previously reported (Hawley and Haase, 1992; Thorn et al., 1993). The Santa Fe Group aquifer system is the prin-cipal source of water supply in the Albuquerque Basin. The system is made up of poorly-cemented sands and gravels of the Tertiary-Quaternary Santa Fe Group and overlying alluvial deposits associated with the Rio Grande and its tributaries. Mountain front recharge is one of the most important sources of recharge to the basin (Anderholm, 2001). Regional groundwater flow is to the south from the Albuquerque Basin to the Socorro Basin near San Acacia (Plummer et al., 2004). The Santa Fe Group has been subdivided into lower, middle and upper hydrostratigraphic units and ranges in thickness from 2,400 feet near the basin margins to ~14,000 feet in the center of the basin. The most productive lithologies are axial channel deposits of the ancestral Rio Grande. Basin floor playa lake deposits of the lower part of the Santa Fe Group do not yield large quantities of water (Hawley and Haase, 1992; Thorn et al., 1993), and that water is assumed to be of poor quality. For this reason, only about the upper 2000 feet of the aquifer system
is used for groundwater withdrawals (Bartolino and Cole, 2002). Water chemistry in the Albuquerque Basin has been extensively studied and is highly variable. Some chemical constituents have been shown to vary by several factors of ten, making it difficult to generalize about basin-wide water quality parameters (Bartolino and Cole, 2002). Plummer et al. (2004) identified 13 different hydrochemical zones based on analyses of water samples collected from 275 different wells and springs. However, because these samples were collected from existing production wells, they are not applicable to deeper zones within the Santa Fe Group aquifer system. The data set for the Albuquerque Basin is exceptionally large, with 987 total records. Water quality in the basin is generally good, with mean and median values of TDS well below 1,000 mg/l (Table 3). A small number of wells display unusually high mineral content. Those wells are for the most part located near the extreme southern and western margins of the basin. Plots of TDS and specific conductance vs. depth (Figures 7A, 7B) do not indicate the presence of deep sources of brackish water. As discussed above, these results in part reflect sampling bias because our data set relies on existing water supply wells that are not typically screened in brackish water intervals. Maximum well depth in our records is only 2,020 feet, indicating
Table 3. Albuquerque Basin, summary of water chemistry.
10,000
8,000
6,000
4,000
2,000
0 500 1,000 1,500 2,0000
Depth (ft)
TDS
(mg/L
)
14,000
12,000
10,000
8,000
6,000
4,000
2,000
0 500 1,000 1,500 2,0000
Depth (ft)
Spec
ific C
ondu
ctanc
e (μS
/cm)
Figure 7A. Albuquerque Basin, depth vs. TDS. Figure 7B. Albuquerque Basin, depth vs. specific conductance.
Specific Cond. (µS/cm)
TDS (mg/l)
Ca (mg/l)
Mg (mg/l)
Na (mg/l)
HCO3 (mg/l)
SO4 (mg/l)
Cl (mg/l)
F (mg/l)
As (mg/l)
U (mg/l)
Well depth
Maximum 29,400 27,000 685 305 2,200 120 13,100 6,800 6.4 0.610 0.077 2,020Minimum 240 163 0.3 0.1 4.5 50 8.2 0.1 0.1 0.000 0.000 7.5Mean 1,204.4 880.9 88.8 21 95.7 224.9 280.8 97.5 0.8 0.010 0.006 416.6Median 645 427.5 59.7 11 42 183.5 89.8 21.3 0.5 0.005 0.004 260
N E W M E X I C O B U R E A U O F G E O L O G Y A N D M I N E R A L R E S O U R C E S
14
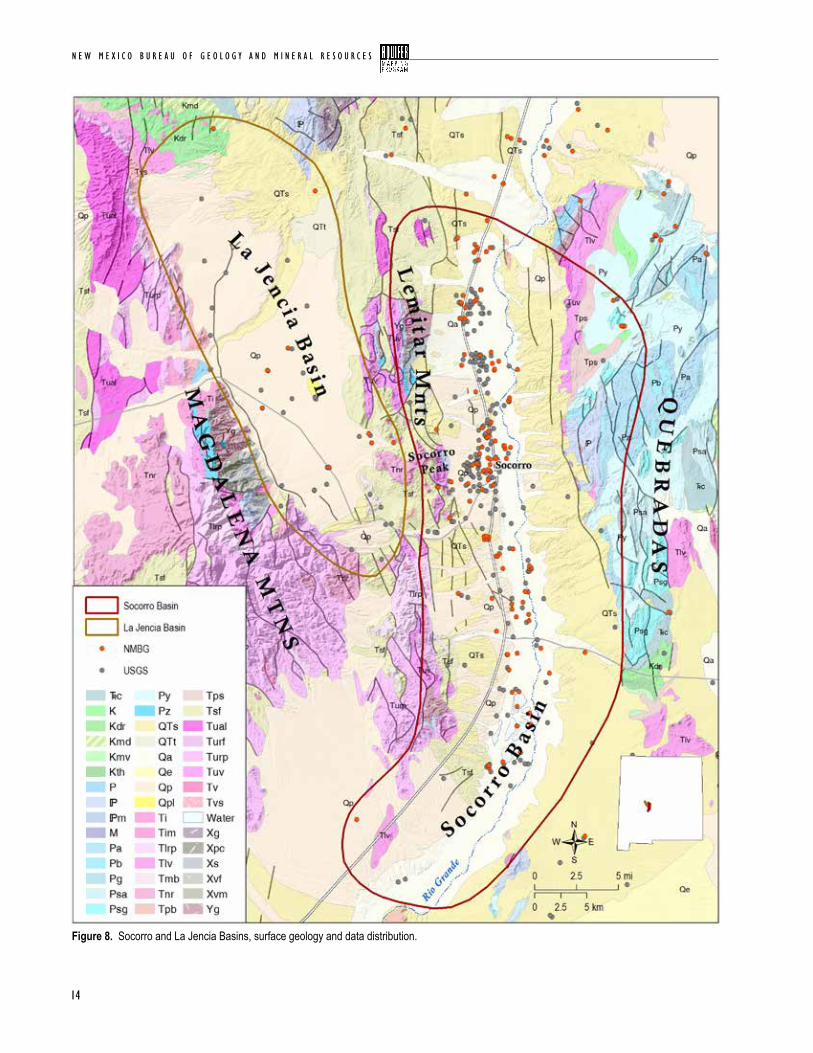
Figure 8. Socorro and La Jencia Basins, surface geology and data distribution.

15
F R E S H A N D B R A C K I S H W A T E R Q U A L I T Y
that the deeper portions of the Albuquerque Basin aquifer system remain unexplored. Naturally-occurring arsenic is the constituent of greatest concern in groundwater of the Albuquerque Basin (Bartolino and Cole, 2002). Our records indicate mean values of arsenic in groundwater
of 0.01 mg/l, which is the maximum contaminant level recommended by the EPA. The highest arsenic concentration was 0.61 mg/l, more than 60 times the recommended MCL, measured in a sample collected ~20 miles west of the Albuquerque South Valley.
Table 4. Socorro-La Jencia Basins, summary of water chemistry.
Specific Cond. (µS/cm)
TDS (mg/l)
Ca (mg/l)
Mg (mg/l)
Na (mg/l)
HCO3 (mg/l)
SO4 (mg/l)
Cl (mg/l)
F (mg/l)
As (mg/l)
U (mg/l)
Well depth
Maximum 7,640 7,590 460 780 1,218 590 5,150 14,20 4.3 0.053 0.141 560Minimum 210 143 6.4 1.2 10.7 86 6.8 4 0.1 0.0005 0.0004 8Mean 1,394.5 1,001.6 99.9 30.5 141.8 276.5 322 152.6 0.58 0.011 0.01 158Median 920 645 73.5 15 80 240 195 58.5 0.41 0.006 0.006 121.5
8,000
2,000
6,000
4,000
0 100 200 500400300 6000
Depth (ft)
Socorro-La Jencia Basins: Depth vs. TDS
TDS
(mg/L
)
8,000
6,000
4,000
2,000
0 100 200 300 400 6005000
Depth (ft)
Spec
ific C
ondu
ctanc
e (μS
/cm)
Figure 9A. Socorro and La Jencia Basins, depth vs. TDS. Figure 9B. Socorro and La Jencia Basins, depth vs. specific cond..
Socorro-La Jencia Basins
The Socorro and La Jencia Basins are located in Socorro Co., New Mexico (Figure 8), and define a transition where the Rio Grande Rift system broad-ens into a series of parallel basins separated by intra-rift horst blocks (Chapin, 1971). This broad-ening represents a general southward increase in crustal extension along the Rio Grande Rift (Adams and Keller, 1994). The Socorro Basin is hydrauli-cally connected to rift basins to the north and south by flow-through drainage of the Rio Grande and southward flow of groundwater through alluvial sediments of the Rio Grande valley. By contrast, the La Jencia Basin has no perennial stream drainage (Anderholm, 1983). The two basins are separated by the Socorro Peak-Lemitar Mountains intra-rift horst, which splits the rift into two semi-parallel halves (Chapin, 1971), and restricts groundwater flow between the basins.
Major water-bearing units in both the Socorro and La Jencia Basins are sands and gravels of the Tertiary-Quaternary Santa Fe Group. That aquifer system can be divided into the Popotosa aquifer, the overlying Popotosa confining bed, and a shallow alluvial aquifer. Other water-bearing zones are con-tained within fractured Mesozoic-Paleozoic bedrock; Tertiary sandstones, conglomerates and volcaniclastic sediments of the Baca and Datil Formations; and a Tertiary volcanic aquifer system composed of ash-flow tuffs (Anderholm, 1983). Water quality in the Socorro Basin is highly variable, and is influenced by mixing of regional groundwater inflow from the north with locally-derived irrigation return flow. High chloride concen-trations are found in both the northern and southern ends of the Socorro Basin, in some cases up to 50 times greater than chloride concentrations in the cen-tral part of the basin. These high chloride concentra-tions may represent both regional flow of deep basin

N E W M E X I C O B U R E A U O F G E O L O G Y A N D M I N E R A L R E S O U R C E S
16
Figure 10. San Marcial and Engle Basins, surface geology and data distribution.
17
F R E S H A N D B R A C K I S H W A T E R Q U A L I T Y
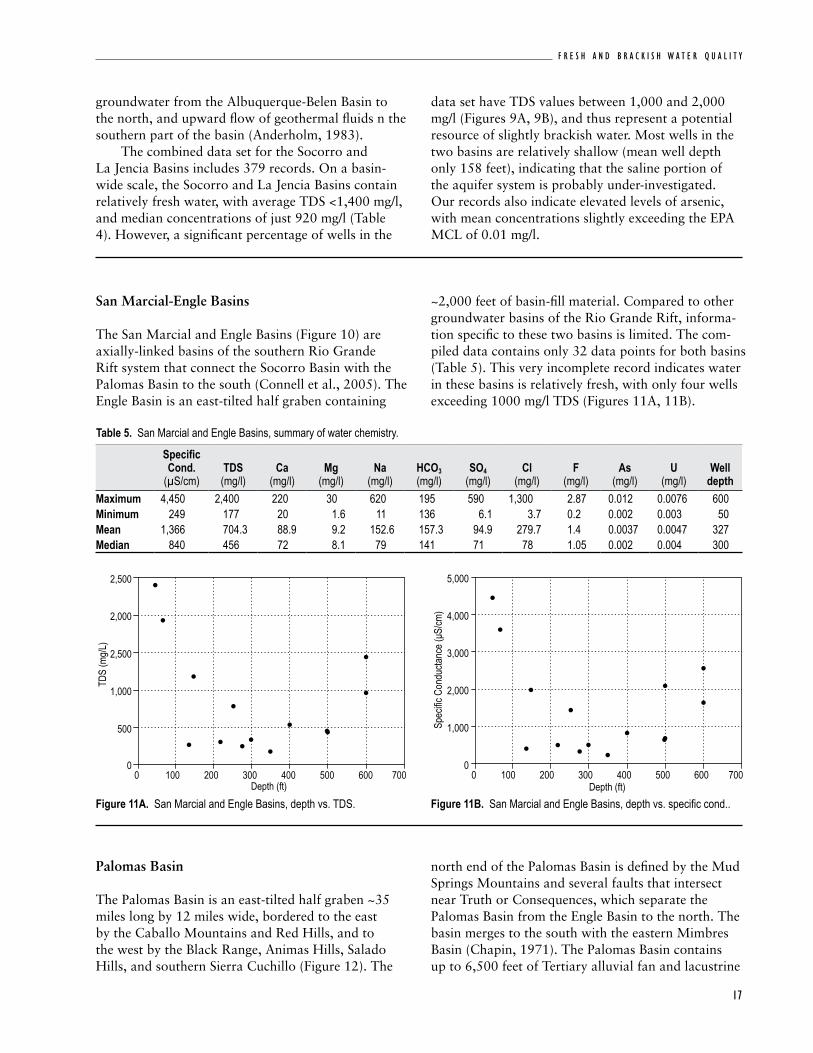
San Marcial-Engle Basins
The San Marcial and Engle Basins (Figure 10) are axially-linked basins of the southern Rio Grande Rift system that connect the Socorro Basin with the Palomas Basin to the south (Connell et al., 2005). The Engle Basin is an east-tilted half graben containing
~2,000 feet of basin-fill material. Compared to other groundwater basins of the Rio Grande Rift, informa-tion specific to these two basins is limited. The com-piled data contains only 32 data points for both basins (Table 5). This very incomplete record indicates water in these basins is relatively fresh, with only four wells exceeding 1000 mg/l TDS (Figures 11A, 11B).
Table 5. San Marcial and Engle Basins, summary of water chemistry.
Specific Cond.
(µS/cm)TDS
(mg/l)Ca
(mg/l)Mg
(mg/l)Na
(mg/l)HCO3 (mg/l)
SO4 (mg/l)
Cl (mg/l)
F (mg/l)
As (mg/l)
U (mg/l)
Well depth
Maximum 4,450 2,400 220 30 620 195 590 1,300 2.87 0.012 0.0076 600Minimum 249 177 20 1.6 11 136 6.1 3.7 0.2 0.002 0.003 50Mean 1,366 704.3 88.9 9.2 152.6 157.3 94.9 279.7 1.4 0.0037 0.0047 327Median 840 456 72 8.1 79 141 71 78 1.05 0.002 0.004 300
2,500
1,000
2,000
2,500
500
0 100 200 300 600500400 7000
Depth (ft)
San Marcial-Engle Basins: Depth vs. TDS
TDS
(mg/L
)
5,000
4,000
3,000
2,000
1,000
0 100 200 400300 500 7006000
Depth (ft)
San Marcial-Engle Basins: Depth vs. Specific Conductance
Spec
ific C
ondu
ctanc
e (μS
/cm)
Figure 11A. San Marcial and Engle Basins, depth vs. TDS. Figure 11B. San Marcial and Engle Basins, depth vs. specific cond..
groundwater from the Albuquerque-Belen Basin to the north, and upward flow of geothermal fluids n the southern part of the basin (Anderholm, 1983). The combined data set for the Socorro and La Jencia Basins includes 379 records. On a basin-wide scale, the Socorro and La Jencia Basins contain relatively fresh water, with average TDS <1,400 mg/l, and median concentrations of just 920 mg/l (Table 4). However, a significant percentage of wells in the
data set have TDS values between 1,000 and 2,000 mg/l (Figures 9A, 9B), and thus represent a potential resource of slightly brackish water. Most wells in the two basins are relatively shallow (mean well depth only 158 feet), indicating that the saline portion of the aquifer system is probably under-investigated. Our records also indicate elevated levels of arsenic, with mean concentrations slightly exceeding the EPA MCL of 0.01 mg/l.
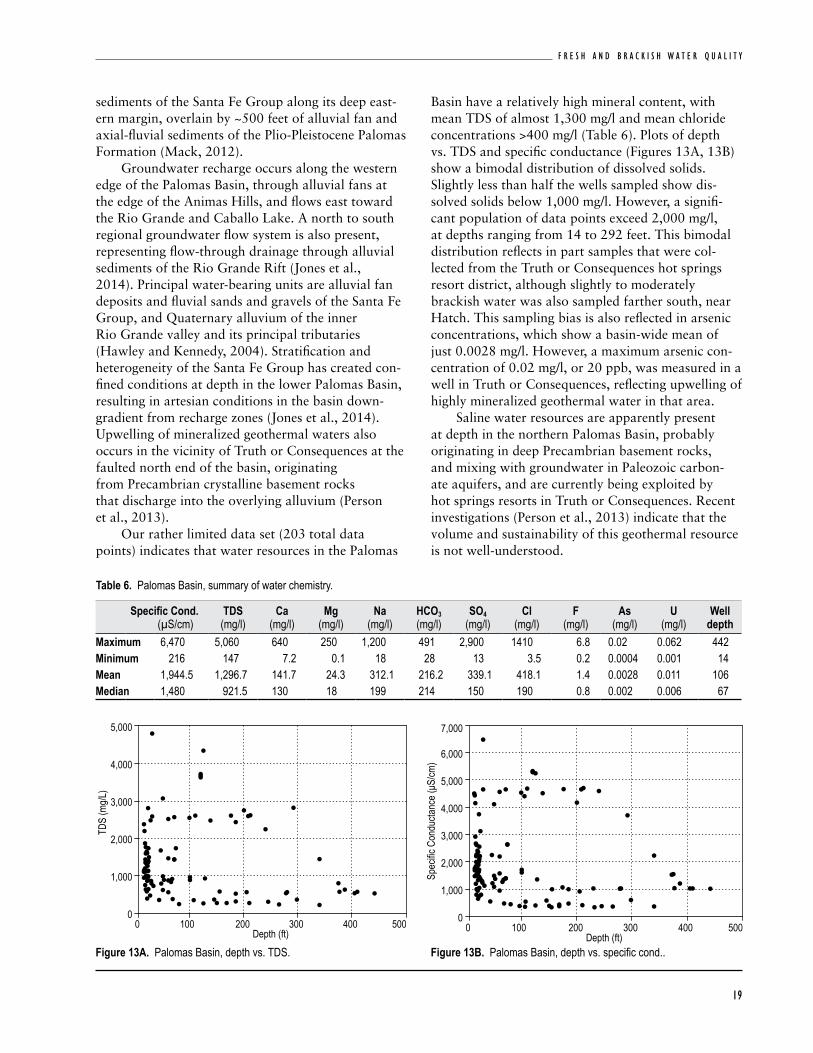
Palomas Basin
The Palomas Basin is an east-tilted half graben ~35 miles long by 12 miles wide, bordered to the east by the Caballo Mountains and Red Hills, and to the west by the Black Range, Animas Hills, Salado Hills, and southern Sierra Cuchillo (Figure 12). The
north end of the Palomas Basin is defined by the Mud Springs Mountains and several faults that intersect near Truth or Consequences, which separate the Palomas Basin from the Engle Basin to the north. The basin merges to the south with the eastern Mimbres Basin (Chapin, 1971). The Palomas Basin contains up to 6,500 feet of Tertiary alluvial fan and lacustrine

N E W M E X I C O B U R E A U O F G E O L O G Y A N D M I N E R A L R E S O U R C E S
18
Figure 12. Palomas Basin, surface geology and data distribution.
19
F R E S H A N D B R A C K I S H W A T E R Q U A L I T Y
sediments of the Santa Fe Group along its deep east-ern margin, overlain by ~500 feet of alluvial fan and axial-fluvial sediments of the Plio-Pleistocene Palomas Formation (Mack, 2012). Groundwater recharge occurs along the western edge of the Palomas Basin, through alluvial fans at the edge of the Animas Hills, and flows east toward the Rio Grande and Caballo Lake. A north to south regional groundwater flow system is also present, representing flow-through drainage through alluvial sediments of the Rio Grande Rift (Jones et al., 2014). Principal water-bearing units are alluvial fan deposits and fluvial sands and gravels of the Santa Fe Group, and Quaternary alluvium of the inner Rio Grande valley and its principal tributaries (Hawley and Kennedy, 2004). Stratification and heterogeneity of the Santa Fe Group has created con-fined conditions at depth in the lower Palomas Basin, resulting in artesian conditions in the basin down-gradient from recharge zones (Jones et al., 2014). Upwelling of mineralized geothermal waters also occurs in the vicinity of Truth or Consequences at the faulted north end of the basin, originating from Precambrian crystalline basement rocks that discharge into the overlying alluvium (Person et al., 2013). Our rather limited data set (203 total data points) indicates that water resources in the Palomas
Basin have a relatively high mineral content, with mean TDS of almost 1,300 mg/l and mean chloride concentrations >400 mg/l (Table 6). Plots of depth vs. TDS and specific conductance (Figures 13A, 13B) show a bimodal distribution of dissolved solids. Slightly less than half the wells sampled show dis-solved solids below 1,000 mg/l. However, a signifi-cant population of data points exceed 2,000 mg/l, at depths ranging from 14 to 292 feet. This bimodal distribution reflects in part samples that were col-lected from the Truth or Consequences hot springs resort district, although slightly to moderately brackish water was also sampled farther south, near Hatch. This sampling bias is also reflected in arsenic concentrations, which show a basin-wide mean of just 0.0028 mg/l. However, a maximum arsenic con-centration of 0.02 mg/l, or 20 ppb, was measured in a well in Truth or Consequences, reflecting upwelling of highly mineralized geothermal water in that area. Saline water resources are apparently present at depth in the northern Palomas Basin, probably originating in deep Precambrian basement rocks, and mixing with groundwater in Paleozoic carbon-ate aquifers, and are currently being exploited by hot springs resorts in Truth or Consequences. Recent investigations (Person et al., 2013) indicate that the volume and sustainability of this geothermal resource is not well-understood.
Table 6. Palomas Basin, summary of water chemistry.
Specific Cond. (µS/cm)
TDS (mg/l)
Ca (mg/l)
Mg (mg/l)
Na (mg/l)
HCO3 (mg/l)
SO4 (mg/l)
Cl (mg/l)
F (mg/l)
As (mg/l)
U (mg/l)
Well depth
Maximum 6,470 5,060 640 250 1,200 491 2,900 1410 6.8 0.02 0.062 442Minimum 216 147 7.2 0.1 18 28 13 3.5 0.2 0.0004 0.001 14Mean 1,944.5 1,296.7 141.7 24.3 312.1 216.2 339.1 418.1 1.4 0.0028 0.011 106Median 1,480 921.5 130 18 199 214 150 190 0.8 0.002 0.006 67
5,000
4,000
3,000
2,000
1,000
0 100 200 300 400 5000
Depth (ft)
Palomas Basin: Depth vs. TDS
TDS
(mg/L
)
7,000
6,000
5,000
4,000
3,000
2,000
1,000
0 100 200 300 400 5000
Depth (ft)
Palomas Basin: Depth vs. Specific Conductance
Spec
ific C
ondu
ctanc
e (μS
/cm)
Figure 13A. Palomas Basin, depth vs. TDS. Figure 13B. Palomas Basin, depth vs. specific cond..

N E W M E X I C O B U R E A U O F G E O L O G Y A N D M I N E R A L R E S O U R C E S
20
Figure 14. Mesilla Basin, surface geology and data distribution.

21
F R E S H A N D B R A C K I S H W A T E R Q U A L I T Y
Table 7. Mesilla Basin, summary of water chemistry.
Specific Cond. (µS/cm)
TDS (mg/l)
Ca (mg/l)
Mg (mg/l)
Na (mg/l)
HCO3 (mg/l)
SO4 (mg/l)
Cl (mg/l)
F (mg/l)
As (mg/l)
U (mg/l)
Well depth
Maximum 42,800 30,800 962 728 8,590 1,400 4,970 15,300 7.9 0.116 0.107 1,880Minimum 393 234 0.5 0.1 34 38 20.4 11 0.1 0.00048 0.00005 12Mean 1,714.4 1,216.5 102.4 23.5 277.4 250.8 309.4 291.3 0.8 0.0101 0.0093 339Median 1050 693 68 14.9 130 201.5 160 100 0.6 0.0032 0.0017 270.5
Mesilla Basin
The Mesilla Basin (Figure 14) is one of the southern-most basins of the Rio Grande Rift system, extending from south-central New Mexico across state and international boundaries into west Texas and northern Chihuahua, Mexico. The hydrology of the Mesilla Basin region has been subject to extensive investigations for over a century (e.g., Slichter, 1905; Theis, 1938; Sayre and Livingston, 1945; Conover, 1954; Leggat et al., 1962; Hawley et al., 1969; King et al., 1971; Wilson and White, 1984; Hawley and Lozinsky, 1992; Nickerson and Myers, 1993; Kennedy et al., 2000), as summarized by Hawley et al. (2001), who is paraphrased here. The eastern margin of the Mesilla Basin is defined by the Organ-Franklin-Juarez mountain chain, and the western margin by fault block and volcanic uplands of the East Potrillo Mountains and West Potrillo basalt field. The Robledo and Doña Ana Mountains define the northern end of the Mesilla Basin. The northeast end of the basin is transitional with the Jornada del Muerto Basin. The southern basin boundary with the Bolson de los Muertos in northern Chihuahua state is less well-defined. The entrenched Mesilla Valley of the Rio Grande crosses the eastern margin of the Mesilla Basin, where the cities of Las Cruces, NM, El Paso, Texas, and Juarez, Mexico exploit groundwater resources from the basin aqui-fers. Regional groundwater and surface water flow is to the southeast toward El Paso, through a gap separating the Franklin Mountains from Sierra Juarez to the south. Poorly consolidated sands and gravels of the Tertiary-Quaternary Santa Fe Group form the principal basin-fill aquifer in the Mesilla Basin, and are overlain by an alluvial aquifer made up of late Quaternary channel and floodplain deposits of the Rio Grande and its tributaries. Fluvial deposits associated with the Rio Grande are ~100 feet thick and may be up to five miles wide. Both aquifers are hydrologically connected to the Rio Grande. The Santa Fe Group basin-fill aquifer attains a maximum saturated thickness of ~3,000 feet, and has been informally subdivided into upper, middle and
lower Santa Fe hydrostratigraphic units (Hawley et al. 2001). Water quality in the upper unit is similar to water chemistry of the shallow valley-fill aquifer, which is the principal source of recharge to the upper part of the basin-fill aquifer system. Water quality in the middle Santa Fe hydrostratigraphic unit is of better quality than in the overlying alluvial and basin fill units. The middle Santa Fe is also the most heav-ily developed aquifer zone for municipal and private drinking water. Water in the lowermost Santa Fe unit is in general of poorer quality than the overlying hydrostratigraphic zones. Spatial variability of water quality throughout the Mesilla Basin is primarily due to the irregular distribution of fine-grained confining beds within the basin fill (Hawley, 2001). There is a significant source of high chloride content geothermal water east of the Mesilla Valley that degrades the water quality in that part of the basin. Hawley et al. (2001) also report a deterioration in water quality near the basin’s southern end. The data set for the Mesilla Basin is relatively large (408 records) but irregulary distributed, with most of the wells sampled concentrated in the Mesilla Valley from north of Las Cruces to the state line. Data distribution in the western part of the basin is very sparse (Figure 14). Previous workers (Hawley et al., 2001; Hawley, 2016) have suggested that signifi-cant resources of slightly brackish water are present in the Mesilla Basin. However, our records are very limited for the deeper portions of the basin, with mean well depth of only 339 feet. Basin-wide mineral content is rather high, with mean TDS values >1,200 mg/l (Table 7; Figure 15A, 15B). However, this mean value is skewed by the presence of two samples with very high mineral content collected from different depths in the same well, located within the city limits of Las Cruces. One sample, collected from 75 feet, reported a TDS value of 19,000 mg/l. A second sample, collected from 165 feet, had a TDS content of 30,800 mg/l. This sampling bias is reflected in the median TDS value for the basin of only 693 mg/l. Our records also indicate elevated levels of arsenic, with a basin-wide mean value .01 mg/l, the maximum EPA MCL for that constituent.

N E W M E X I C O B U R E A U O F G E O L O G Y A N D M I N E R A L R E S O U R C E S
22
Basins adjacent to the rio Grande rift
Jornada del Muerto Basin
the Jornada del Muerto is a north-south trending basin lying to the east of the main Rio Grande Rift
system in Socorro, Sierra, and Doña Ana Counties, New Mexico (Figure 16). The basin is ~160 miles long, averages 20 miles in width, and deepens to the south. The basin is bounded to the east by Chupadera Mesa and the Oscura and San Andres Mountains, and to the west by the Caballo and Fra Cristobal Range and the San Pasqual Platform. The south end of the Jornada del Muerto Basin merges imperceptibly with the northeast end of the Mesilla Basin. Unlike the Rio Grande Rift basins to the west, the Jornada del Muerto is a broad syncline that plunges to the south-southeast, formed between east-dipping Paleozoic and Mesozoic strata along the Caballo-Fra Cristobal Uplift and west-dipping Paleozoic strata in the San Andres Mountains. The basin is thus not part of the late Tertiary Rio Grande Rift extensional system, and Santa Fe Group basin-fill sediments are generally less than 350 feet thick (Chapin, 1971; Lozinsky, 1987; Roybal, 1991). The Jornada Draw fault zone runs from north to south and roughly parallels the hinge of the syncline. This fault zone significantly affects the groundwater system in the central part of the basin (Newton et al., 2015). Principal water-bearing units in the Jornada del Muerto Basin are upper Cretaceous sandstones of the McRae and Gallup Formations, sandstones and con-glomerates of the Eocene Love Ranch Formation, and Quaternary alluvium. Newton et al. (2015) identified two different hydrologic systems in the central part of the basin: a shallow perched system with depth to
water generally <200 feet, and a deeper regional aqui-fer system with water depths >200 feet. The perched system is recharged by runoff of local precipitation that infiltrates through streambeds. The deeper aquifer system is recharged from downward movement of water from the shallow system, and from precipita-tion in the adjacent mountains that infiltrates into the subsurface and moves toward the center of the basin along deep flow paths. Regional movement of ground-water is to the south toward the Mesilla Basin. Data coverage for the Jornada del Muerto is sparse (173 total data points), considering the large aerial extent of the basin, and irregularly distributed, with the majority of wells sampled concentrated at the south end of the basin near Las Cruces. Water quality is highly variable, and basin-wide mineral content is high, with mean TDS >1,300 mg/l (Table 8). Plots of TDS and specific conductance vs. depth show signifi-cant scatter, indicating that those parameters do not vary with depth in a predictable manner (Figures 17A, 17B). This phenomenon probably results from the presence of multiple bedrock aquifers and a shallow alluvial aquifer, as well as the presence of shallow and deep aquifer systems storing groundwater from at least two different sources (Newton et al., 2015). Maximum well depth in the basin is 6,044 feet, in an exploratory well east of the Fra Cristobal range drilled by Sun Oil in 1955, for which very little water chemistry data is available. The deepest well for which a TDS record exists is 1,321 feet, with a dissolved sol-ids content of 1,750 mg/l. This well is located north-east of Las Cruces at the far southern end of the basin, near the transition with the Mesilla Basin. Our limited records thus indicate that the potential for brackish water resources exists in the southern Jornada del Muerto Basin.
8,000
6,000
4,000
2,000
0 500 1,000 1,500 2,0000
Depth (ft)
Mesilla Basin: Depth vs. TDSTD
S (m
g/L)
10,000
8,000
6,000
4,000
2,000
0 500 1,000 1,500 2,0000
Depth (ft)
Mesilla Basin: Depth vs. Specific Conductance
Spec
ific C
ondu
ctanc
e (μS
/cm)
Figure 15A. Mesilla Basin depth vs. TDS. Figure 15B. Mesilla Basin depth vs.specific cond..

23
F R E S H A N D B R A C K I S H W A T E R Q U A L I T Y
Figure 16. Jornada del Muerto Basin, surface geology and data distribution.

N E W M E X I C O B U R E A U O F G E O L O G Y A N D M I N E R A L R E S O U R C E S
24
3,000
2,000
2,500
1,000
0 200 400 600 1,2001,000800 1,4000
Depth (ft)
Jornada del Muerto Basin: Depth vs. TDS
TDS
(mg/L
)
10,000
8,000
6,000
4,000
2,000
0 200 400 800600 1,000 1,4001,2000
Depth (ft)
Jornada del Muerto Basin: Depth vs. Specific Conductance
Spec
ific C
ondu
ctanc
e (μS
/cm)
Figure 17A. Jornada del Muerto Basin, depth vs. TDS. Figure 17B. Jornada del Muerto Basin, depth vs. specific cond..
Table 8. Jornada del Muerto Basin, summary of water chemistry.
Specific Cond.
(µS/cm)TDS
(mg/l)Ca
(mg/l)Mg
(mg/l)Na
(mg/l)HCO3 (mg/l)
SO4 (mg/l)
Cl (mg/l)
F (mg/l)
As (mg/l)
U (mg/l)
Well depth
Maximum 9,750 6,440 570 1,100 810 418 7,300 360 12 0.015 0.0448 6,044Minimum 274 191 3.3 0.2 14 32 14.8 2.42 0.1 0.001 0.0016 40Mean 2,138.7 1,354.2 149.2 75.5 149.4 198.1 1,079.2 61.1 1.37 0.0034 0.0105 489.4Median 1690 729 70 35 93.8 180 622 39.5 1 0.0025 0.0074 350
Estancia Basin
The Estancia Valley is a relatively flat-floored, closed physiographic basin with internal drainage, occupying ~2,000 square miles in central New Mexico (Figure 18). The valley, most of which lies within Torrance County, is bounded to the west by the Manzano Mountains, to the east by the Pedernal Hills, and to the south by Chupadera Mesa. The northern margin of the basin is less well-defined, merging with a high plateau area in southern Santa Fe County (Meinzer, 1911; Smith, 1957; White, 1994). Highest elevations in the Estancia Valley (>9,000 feet) occur along the western rim of the watershed, on the east flank of the Manzano Mountains. Lowest elevations (~5,900 feet) are found along the central topographic axis of the basin, where a north-south trending series of playas formed by deflation are incised into the valley floor (Bachhuber, 1982). Because the Estancia Valley is a topographically-closed basin, the only outlet for pre-cipitation that falls within the basin boundaries is by evapotranspiration, primarily from the playa lakes. The Estancia Basin may be viewed as either a structural basin, containing mostly Paleozoic rock deformed by several tectonic events from late Paleozoic through Tertiary time; or as a Quaternary
depositional basin. This report focuses on the Quaternary basin, which extends beyond the margins of the underlying structural basin (Broadhead, 1997). Regional dip of Paleozoic strata is generally eastward. Pennsylvanian-age Madera Limestone is exposed at the surface in western Torrance County, and Quaternary sediment overlies progressively younger Permian strata from west to east, including Abo and Yeso redbeds and gypsum, and middle-Permian Glorieta Sandstone along the eastern margin of the basin (Smith, 1957). The Quaternary depositional basin is defined by the aerial extent of Quaternary valley fill, which consists of alluvial material, lake and dune deposits, and recent stream sediment. The valley-fill mate-rial reaches a maximum thickness of ~400 feet in the center of the valley, and thins to a feather edge along the margins (White, 1994). The valley fill is the principal aquifer for irrigation, livestock, and domestic and community water supply in the Estancia Valley. Groundwater flows from the basin margins to the area around Willard, where both the water table and land surface are at their lowest elevation (Smith, 1957; Titus, 1973). Along the western margin of the basin, groundwater is stored in solution-enlarged fractures and karstic conduits of the Madera limestone (Titus,

25
F R E S H A N D B R A C K I S H W A T E R Q U A L I T Y
Figure 18. Estancia Basin, surface geology and data distribution.

N E W M E X I C O B U R E A U O F G E O L O G Y A N D M I N E R A L R E S O U R C E S
26
1980). The Glorieta sandstone also provides water for irrigation east of Moriarty (Lewis and West, 1995). The mineral content of groundwater in the valley-fill aquifer increases from west to east. West of Highway 41 the water is generally satisfactory for irrigation, stock, and domestic and community water supply. East of the highway, water quality rapidly deteriorates, and is generally unsatisfactory for irrigation or human consumption (Smith, 1957). The interface between fresh and saline water is relatively sharp, occurring over a distance of less than 3 miles east of Highway 41. Water from some wells south of Moriarty has historically shown a significant increase in specific conductance, indicating a westward migra-tion of the freshwater-saltwater interface within the valley-fill aquifer (White, 1994).
Data coverage for the Estancia Basin is substan-tial, with 561 total data points. Our records show that groundwater in the basin is somewhat brackish, with a mean TDS concentration of almost 1,300 mg/l (Table 9; Figures 19A, 19B). However, this mean value is influenced by water samples collected from three wells located in the central basin playa area with TDS >12,000 mg/l. The median TDS value of 614 mg/l may be more representative of basin-wide water quality. The valley-fill aquifer contains what appear to be significant brackish water resources near the center of the basin. Brackish water is probably also present in the underlying Paleozoic bedrock, although with an average well depth of just 197 feet, that potential resource remains unexplored.
Table 9. Estancia Basin, summary of water chemistry.
Specific Cond.
(µS/cm)TDS
(mg/l)Ca
(mg/l)Mg
(mg/l)Na
(mg/l)HCO3 (mg/l)
SO4 (mg/l)
Cl (mg/l)
F (mg/l)
As (mg/l)
U (mg/l)
Well depth
Maximum 22,300 18,100 1,130 1,350 3,500 1,990 7,600 5,500 6.2 0.006 0.007 1,070Minimum 233 207 1.7 0.3 6 92 9.1 2.7 0.1 0.0002 0.00180 7Mean 1,713.6 1,287.9 183.4 73.5 202.3 312.2 517.4 174.4 0.93 0.0018 0.004 197Median 861 614 120 32 41 274 153 31.9 0.7 0.0012 0.004 180
14,000
8,000
6,000
12,000
10,000
4,000
2,000
0 200 400 1,000800600 1,2000
Depth (ft)
Estancia Basin: Depth vs. TDS
TDS
(mg/L
)
20,000
15,000
10,000
5,000
0 200 400 600 800 1,2001,0000
Depth (ft)
Estancia Basin: Depth vs. Specific Conductance
Spec
ific C
ondu
ctanc
e (μS
/cm)
Figure 19A. Estancia Basin, depth vs. TDS. Figure 19B. Estancia Basin, depth vs. specific cond..
Mimbres Basin
The Mimbres Basin is a structurally complex region in southwestern New Mexico, extending over an area of more than 5,000 square miles in parts of Grant, Luna, Doña Ana and Sierra Counties, and straddling the border with the Mexican Republic (Figure 20). The region has been subject to extensive geologic, geophysical, and hydrologic investigations over a
period of almost a century, including Darton (1916), White (1931), Trauger (1972), Hanson et al. (1994), Hawley et al. (2000), and Kennedy et al. (2000). The Mimbres Basin is located at the intersection of the Basin and Range, southern Rio Grande Rift, and southern Transition Zone tectonic provinces (Mack, 2004). Dominant structural features in the region are northwest trending faults and folds associated with the Laramide orogeny, Tertiary magmatism

27
F R E S H A N D B R A C K I S H W A T E R Q U A L I T Y
Figure 20. Mimbres Basin, surface geology and data distribution.

N E W M E X I C O B U R E A U O F G E O L O G Y A N D M I N E R A L R E S O U R C E S
28
and Quaternary tectonism (Finch et al., 2008). The greater Mimbres Basin is made up of an intercon-nected group of hydrologic sub-basins separated by fault-bounded uplifts, bounded to the east by the Goodsight Mountains, Sierra de las Uvas, and basalt flows and cinder cones of the West Potrillo Mountains. The Continental Divide defines the north-ern and western boundaries of the Mimbres Basin. The only major surface drainage in the basin is the Mimbres River (Hawley et al., 2000; Connell et al., 2005; Finch et al., 2008). Principal water-bearing units in the Mimbres Basin region include Paleozoic carbonate rocks, Cretaceous sedimentary rocks, Tertiary volcanics and volcaniclastic rocks, and a basin-fill aquifer composed of Tertiary to Quaternary Gila Conglomerate and Quaternary alluvium (Finch et al., 2008). Thickness of the basin fill varies from 2,000 to 5,000 feet in the deep structural sub-basins, although productive water-bearing zones usually only occur in the upper 600–1,000 feet of the basin fill sequence (Hawley et al., 2000). Groundwater recharge occurs from direct precipitation, and by mountain-front recharge from infiltration of redistributed runoff through alluvial fans along the basin margins. Regional groundwater
flow is predominantly from the northern highlands to the interior basins, and southward toward the Mexican border (Hawley et al., 2000; Finch et al., 2008). Data distribution in the Mimbres Basin region is sparse (only 265 total data points) and irregularly distributed. A variety of hydrochemical facies have been identified that reflect the complex and varied lithologies that make up the aquifer systems in the basin. This complexity contributes to an irregular distribution of salinity in the Mimbres Basin, varying from fresh to moderately saline (Hawley et al., 2000), with a mean TDS of only 616 mg/l and average chlo-ride concentrations <80 mg/l (Table 10; Figures 21A, 21B). Groundwater in the northern part of the basin is relatively fresh (<500 mg/l), while salinities greater than 1,000 mg/l are found in the southern part of the basin. A maximum TDS value of 14,300 mg/l was measured from an unknown depth in an isolated well located near the Mexican border, near the down-gra-dient end of the system. This distribution of salinity suggests that brackish water resources may be present at depth in the southern Mimbres Basin, but with a mean well depth of only 339 feet those potential resources have been largely uninvestigated.
Table 10. Mimbres Basin, summary of water chemistry.
Specific Cond.
(µS/cm)TDS
(mg/l)Ca
(mg/l)Mg
(mg/l)Na
(mg/l)HCO3 (mg/l)
SO4 (mg/l)
Cl (mg/l)
F (mg/l)
As (mg/l)
U (mg/l)
Well depth
Maximum 21,900 14,300 1,200 140 980 468 2,000 6,900 18 0.038 0.016 2,115Minimum 226 168 2 0.1 10 270 3.9 2.5 0.1 0.00042 0.002 14Mean 852 616.6 48.2 12.9 98.5 343 125.9 76.4 2.3 0.0083 0.0083 339Median 495 360.5 30 8.2 56.5 290 42 16 1.1 0.0051 0.0087 240
2,500
1,500
1,000
2,000
500
0 500 2,0001,5001,000 2,5000
Depth (ft)
Mimbres Basin: Depth vs. TDS
TDS
(mg/L
)
40,000
30,000
20,000
10,000
0 500 1,000 1,500 2,5002,0000
Depth (ft)
Mimbres Basin: Depth vs. Specific Conductance
Spec
ific C
ondu
ctanc
e (μS
/cm)
Figure 21A. Mimbres Basin, depth vs. TDS. Figure 21B. Mimbres Basin, depth vs. specific cond..
29
F R E S H A N D B R A C K I S H W A T E R Q U A L I T Y
Figure 22. San Agustin Basin, surface geology and data distribution.
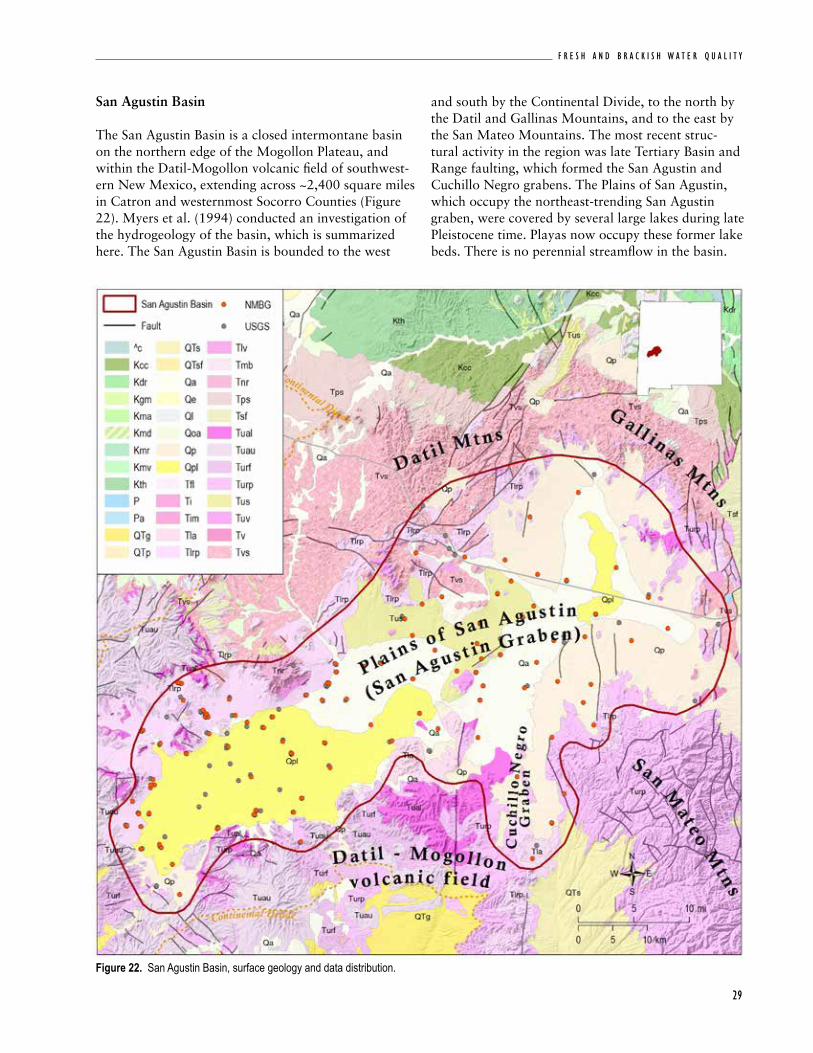
San Agustin Basin
The San Agustin Basin is a closed intermontane basin on the northern edge of the Mogollon Plateau, and within the Datil-Mogollon volcanic field of southwest-ern New Mexico, extending across ~2,400 square miles in Catron and westernmost Socorro Counties (Figure 22). Myers et al. (1994) conducted an investigation of the hydrogeology of the basin, which is summarized here. The San Agustin Basin is bounded to the west
and south by the Continental Divide, to the north by the Datil and Gallinas Mountains, and to the east by the San Mateo Mountains. The most recent struc-tural activity in the region was late Tertiary Basin and Range faulting, which formed the San Agustin and Cuchillo Negro grabens. The Plains of San Agustin, which occupy the northeast-trending San Agustin graben, were covered by several large lakes during late Pleistocene time. Playas now occupy these former lake beds. There is no perennial streamflow in the basin.
N E W M E X I C O B U R E A U O F G E O L O G Y A N D M I N E R A L R E S O U R C E S
30
The principal water-bearing unit in the San Agustin Basin is Quaternary alluvium and basin-fill mate-rial, consisting of unconsolidated clay, silt, sand and gravel derived from the surrounding volcanic uplands. Thickness of the basin fill is variable, with a maxi-mum reported thickness of >4,000 feet. The basin fill is underlain by up to 2,000 feet of Gila Conglomerate, which is in turn underlain by Tertiary basalts and volcaniclastic rocks of the Datil Group. Both the Gila Conglomerate and rocks of the Datil Group yield small to moderate quantities of water to wells. Recharge in the basin occurs through direct precipitation and runoff from the surrounding uplands. The direction of ground-water flow varies from southwest to southeast. The limited data set for the San Agustin Basin (185 total well records) indicates that groundwater in the basin is generally of high quality, with a mean TDS of only 341 mg/l (Table 11). Plots of TDS vs. depth show only one well that exceeds 1000 mg/l dis-solved solids (Figure 23A, 23B). Mean chloride con-centration is also low (155 mg/l); however, one well is reported to have a chloride concentration of 16,000
mg/l, 64 times higher than the EPA secondary stan-dard for chloride. That well is located in the Lake San Agustin playa in the far southwest end of the basin. Myers et al. (1994) reported large concentrations of dissolved solids, sulfate and chloride in groundwater sampled from the Lake San Agustin playa, and sug-gested that it may reflect either residual water from the alkaline Pleistocene Lake San Agustin, or deeply sourced water upwelling along faults. Rinehart et al. (2015) also reported evidence of warm deep brines upwelling along faults or caldera margins in the east-ern San Agustin Basin. The presence of mineralized geothermal waters in some areas suggests there may be a potential for deep brackish water resources in the San Agustin Basin. However, the mean well depth in the basin is only 271 feet, so that potential resource remains largely unexplored. The maximum well depth, 5,327 feet, is from an exploratory well drilled by Sun Oil Co. in 1966. It is interesting to note that a sample collected from that well, possibly from the Datil aquifer, had a TDS of only 174 mg/l.
Table 11. San Agustin Basin, summary of water chemistry.
Specific Cond.
(µS/cm)TDS
(mg/l)Ca
(mg/l)Mg
(mg/l)Na
(mg/l)HCO3 (mg/l)
SO4 (mg/l)
Cl (mg/l)
F (mg/l)
As (mg/l)
U (mg/l)
Well depth
Maximum 40,800 1,440 750 72 410 459 580 16,000 6.7 0.016 0.009 5,327Minimum 150 120 0.8 0.05 6.5 30 1.9 0.4 0.1 0.001 0.0005 11Mean 820.5 341.1 39 8.4 69.4 174.4 37.9 155.2 1.1 0.0046 0.0028 271Median 400 250 21 6 43 163 20 18 0.7 0.004 0.002 180
1,600
1,000
1,200
800
1,400
600
400
200
0 200 400 800600 1,0000
Depth (ft)
TDS
(mg/L
)
6,000
5,000
4,000
3,000
2,000
1,000
0 200 400 600 1,0008000
Depth (ft)
San Agustin Basin: Depth vs. Specific Conductance
Spec
ific C
ondu
ctanc
e (μS
/cm)
Figure 23A. San Agustin Basin, depth vs. TDS. Figure 23B. San Agustin Basin, depth vs. specific cond..

31
F R E S H A N D B R A C K I S H W A T E R Q U A L I T Y
Tularosa Basin
The Tularosa Basin is an elongate, north-trending intermontane basin of the greater Rio Grande Rift system, occupying approximately 6,500 square miles in south-central New Mexico (Figure 24). The basin is bordered by Sierra Blanca and the Sacramento Mountains to the east; and the San Andres, Organ, and Franklin Mountains to the west. The basin merges to the south with the Hueco Bolson, extend-ing into west Texas. Extensive fault systems with several thousand feet of vertical displacement sepa-rate the basin from the east and west-flanking uplifts (Lozinsky and Bauer, 1991). As regional uplift progressed, concurrent erosion of the surrounding highlands has resulted in deposition of more than 6,000 feet of alluvial basin-fill material, consisting of unconsolidated to weakly-cemented gravel, sand, silt and clay deposited in a series of coalescing alluvial fans around the margins of the basin. The basin fill is underlain by consolidated bedrock, thought to consist largely of Paleozoic carbonates. The Tularosa Basin is one of the few rift basins in the state with internal drainage (Meinzer and Hare, 1915; McLean, 1970), a factor that has a profound impact on quality of water resources in the region. Much of the area is desert or semi-desert, with mean annual rainfall ranging from 10 inches/year in the basin proper to ~30 inches/year in the adjacent Sacramento Mountains. The basin is in many respects typical in terms of water resources in New Mexico. It has, on the one hand, very limited access to potable surface water. No major rivers flow through the Tularosa Basin, and the only available surface water supplies are from springs, small streams, and artificial reservoirs in the Sacramento Mountains. On the other hand, the basin contains several mil-lion acre-feet of groundwater in the basin-fill aquifer system. However, over 90% of that groundwater is too saline for human consumption (McLean, 1970; Orr and Myers, 1986). Little is known of the underly-ing bedrock aquifers since very few boreholes have penetrated the entire section, although records from exploratory wells indicate that water contained in those bedrock aquifers is highly mineralized (>10,000 mg/l; McLean, 1970). Recharge of the basin-fill aquifer system occurs primarily by infiltration from ephemeral streams that drain the surrounding mountains and discharge across the permeable alluvial fan material. Regional flow of groundwater on the east side of the basin is to the south and west, away from the Sacramento Mountains (Huff, 2002). Surface flood water that
makes it past the alluvial fans flows into the interior of the basin and evaporates, depositing dissolved solids in playas, with very little infiltration occurring (McLean, 1975). Saline waters contained in low-per-meability playa deposits in the center of the basin are poorly flushed and highly concentrated by evapora-tion, approaching saturated sodium chloride brine in some areas (McLean, 1975). On a basin-wide scale, salinity of groundwater in the alluvial fill is assumed to increase toward the center of the basin and with increasing depth. Significant volumes of fresh water are confined to narrow zones a few miles wide next to the moun-tains on the east and west sides of the basin. In those areas, thickness of the freshwater section ranges from several hundred feet in alluvial fan deposits adjacent to the mountain front to an irregular feather edge toward the basin center. In addition to the basinward increase in salinity, mineral content of groundwater on the east side of the basin increases from south to north, a phenomenon related to the greater abun-dance of Paleozoic evaporites in the drainage areas of mountain streams in the northern Sacramento Mountains (McLean, 1975). Between the extremes of fresh water and brine, slightly saline water (<3,000 mg/l) occurs through-out much of the Tularosa Basin in a transition zone that lies basinward of, and beneath the freshwater wedge (McLean, 1970; 1975). The largest volumes of slightly saline water occur in alluvial fill adjacent to the mountain front north and south of Tularosa. However, the position and thickness of the transition zone are highly variable and not well-constrained, because most wells in the basin tap only a small frac-tion of the saturated thickness of alluvial fill (Garza and McLean, 1977). In some areas, evaporation from the shallow water table will produce a near-surface zone of variable salinity, where more saline water may locally overlie fresh water. Efforts to more precisely characterize the freshwater-saltwater transi-tion zone are complicated by the heterogeneity of the basin-fill aquifer, the irregular distribution of wells, and the limited number of wells that penetrate the more saline portions of the basin fill. A substantial data set is available for the Tularosa Basin, with 959 total records. Basin-wide mineral content is very high, with a mean TDS of almost 4,000 mg/l (Table 12; Figures 25A, 25B). The highest concentrations of dissolved solids are from shallow wells near the center of the basin – for example, the basin-wide maximum TDS is 256,922 mg/l from a well only 15 feet deep on the south-west margin of Lake Lucero. In general, these high

N E W M E X I C O B U R E A U O F G E O L O G Y A N D M I N E R A L R E S O U R C E S
32
Figure 24. Tularosa Basin, surface geology and data distribution.

33
F R E S H A N D B R A C K I S H W A T E R Q U A L I T Y
salinity values reflect the high concentration of salts in playas near the center of the basin, and are not representative of water quality at greater depths. The deepest well in our records, 6,015 feet below ground level, is located east of White Sands Missile Range Headquarters on the west side of the basin, near the toe of one of the large alluvial fans emerging from the Organ Mountains. TDS content in that well is reported to be only 543 mg/l. Although previous regional studies of the hydrology of the Tularosa Basin (e.g., McLean, 1970) suggest that large reserves of brackish groundwater occur at greater depths, this conceptual model is not supported by our data set. As discussed above, the absence of evidence for a deep
brackish water resource is primarily due to the fact that very few wells have penetrated the deeper portions of the basin-fill aquifer. In fact, mean well depth in our records is only 365 feet (Table 12). Evidence from a few deep exploratory wells indicates that brackish water is also present in the underlying Paleozoic bedrock, but that resource remains almost entirely unexplored. The data show elevated levels of uranium in groundwater in the Tularosa Basin, with a mean value 0.034 mg/l, slightly higher than the EPA MCL of 0.3. The highest uranium concentrations in the basin occur in wells north of White Sands Missile Range Headquarters, in an alluvial fan on the east flank of the Organ Mountains.
Table 12. Tularosa Basin, summary of water chemistry.
Specific Cond.
(µS/cm)TDS
(mg/l)Ca
(mg/l)Mg
(mg/l)Na
(mg/l)HCO3 (mg/l)
SO4 (mg/l)
Cl (mg/l)
F (mg/l) As (mg/l)
U (mg/l)
Well depth
Maximum 160,000 256,922 3,070 11,900 73,500 663 87,900 83,000 100 0.1 0.19 6,015Minimum 235 100 2 0.06 7.6 20 0.31 0.1 0.1 0.00006 0.00004 6Mean 3,850.5 3,183.5 229.8 155.9 988.9 195.9 1161.1 826.3 1.4 0.0047 0.034 365Median 1,700 977 126 49 58.8 198 539 130 0.6 0.001 0.02 243
20,000
60,000
40,000
0 500 1,000 2,5002,0001,500 3,0000
Depth (ft)
Tularosa Basin: Depth vs. TDS
TDS
(mg/L
)
80,000
60,000
40,000
20,000
0 500 1,000 1,500 2,000 3,0002,5000
Depth (ft)
Tularosa Basin: Depth vs. Specific Conductance
Spec
ific C
ondu
ctanc
e (μS
/cm)
Figure 25A. Tularosa Basin, depth vs. TDS. Figure 25B. Tularosa Basin, depth vs. specific cond..
lower Pecos Valley aquifers
Roswell Artesian Basin
the Roswell Artesian Basin occupies over 4,000 square miles in the lower Pecos Valley in Chaves
and northern Eddy Counties (Figure 26), and is one of the most intensively farmed regions in the state outside the Rio Grande Valley (Welder, 1983; Land and Newton, 2008). The eastern margin of the basin occurs just east of the Pecos River; the northern
boundary is approximately defined by Macho Draw north of Roswell; and the southern end of the basin is located at the Seven Rivers Hills north of Carlsbad. The western margin of the basin is not as well-defined, but is usually located west of Roswell on the Pecos Slope near the Chaves-Lincoln County Line. The basin derives virtually all of its irrigation and drinking water from groundwater stored in a karstic artesian limestone aquifer contained within the Permian San Andres and Grayburg Formations, and from a shallow unconfined aquifer composed of
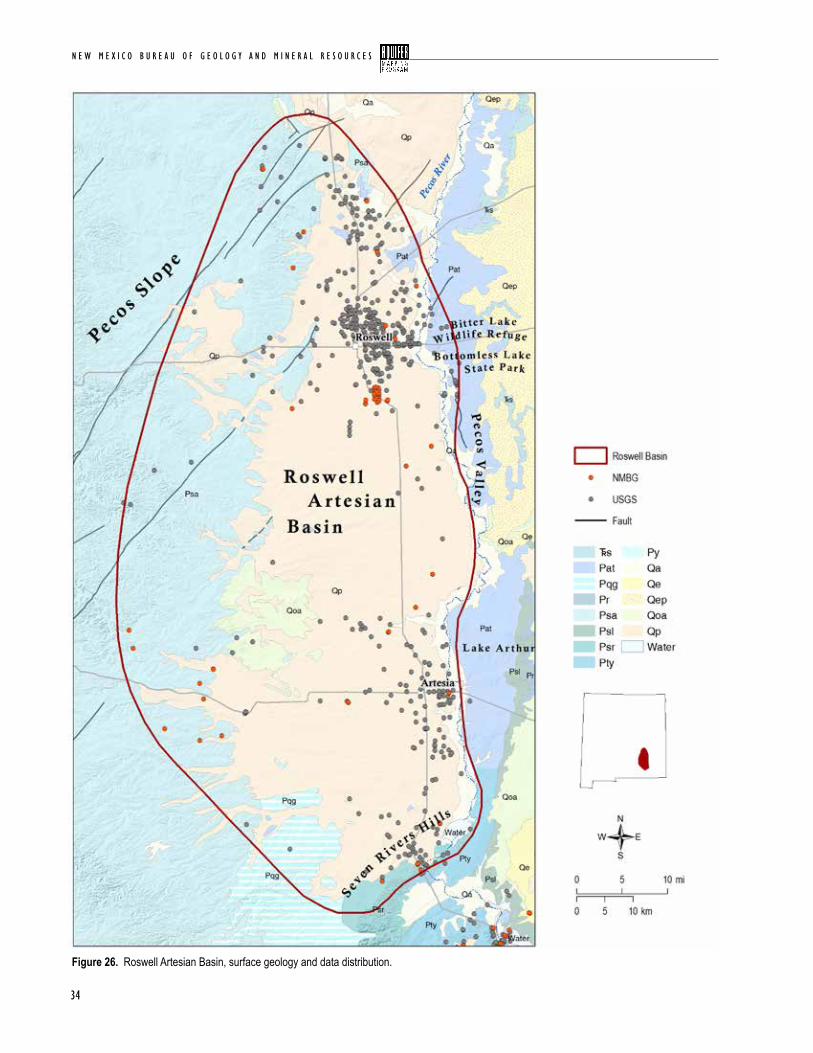
N E W M E X I C O B U R E A U O F G E O L O G Y A N D M I N E R A L R E S O U R C E S
34
Figure 26. Roswell Artesian Basin, surface geology and data distribution.

35
F R E S H A N D B R A C K I S H W A T E R Q U A L I T Y
Tertiary-Quaternary alluvial material deposited by the ancestral Pecos River. The Roswell Basin has been described by many workers as a world-class example of a rechargeable artesian aquifer system (e.g., Fiedler and Nye, 1933; Havenor, 1968). The recharge area for the basin has been con-ventionally located within the San Andres limestone outcrop area, on the Pecos Slope in western Chaves County, where east-flowing streams originating in the Sacramento Mountains lose their water through sinkholes and solution-enlarged fissures. (Fiedler and Nye, 1933; Land and Huff, 2010). However, recent work has shown that a substantial portion of ground-water recharge to the basin originates in the southern Sacramento Mountains to the west, and enters the artesian aquifer by underflow from the underly-ingYeso Formation (Rawling and Newton, 2016; Land and Timmons, 2016). The San Andres aquifer is unconfined in the western outcrop area, and becomes pressurized when it dips into the subsurface west of Roswell and passes beneath gypsum confin-ing beds of the Seven Rivers Formation (Land and Newton, 2008). Most discharge from the artesian and shallow aquifers is from irrigation wells, although substan-tial natural discharge occurs from karstic springs and sinkhole lakes that line both sides of the Pecos River at Bitter Lake National Wildlife Refuge and Bottomless Lakes State Park (Land, 2003; Land and Newton, 2008; Land and Huff, 2010). East of the Pecos River the San Andres limestone is an oil and gas reservoir, and the same interval that produces potable water for the city of Roswell contains oil and brine with chloride concentrations as high as 39,000 mg/l (Havenor, 1968; Gratton and LeMay, 1969). Personnel from the Pecos Valley Artesian Conservancy District (PVACD) measure chloride concentrations and other water quality parameters in selected wells twice a year, thus water quality and salinity distribution in the Roswell Artesian Basin are well-constrained. Mineral content of groundwa-ter in the artesian aquifer increases downgradient to
the east toward the Pecos River, and a well-defined freshwater-saltwater interface has been mapped beneath the city of Roswell (Land and Newton, 2007). Chloride concentrations range from 15 mg/l in the unconfined, western part of the aquifer to as high as 7,000 mg/l in a flowing artesian well east of the city. Discharge from that well was used as feed-stock for a pilot desalination facility in the mid-20th century. That facility is now closed, but legacy water quality data from wells in the vicinity of the plant are included in our water chemistry records. A substantial data set is available for the Roswell Basin, with 632 total records. Our data show that basin-wide salinity is very high, with a mean TDS content >3,500 mg/l (Table 13). However, this mean value is influenced by several samples that were col-lected in the vicinity of the pilot desalination facility in the saline portion of the artesian aquifer. The high-est TDS concentration in the basin (58,300 mg/l) was measured in a well of unknown depth immediately east of the desalination plant. Data collected from oil and gas wells in the region also influence our records. Maximum chloride concentrations were measured in an oil test well south of Artesia drilled in 1957, and maximum well depth (5,506 feet) is from an explor-atory well drilled between Artesia and Lake Arthur in 1950. A substantial volume of brackish water resources is available in the Roswell Artesian Basin, and those resources were exploited in the mid-20th century to evaluate desalination technologies. Previous work has shown that TDS and chloride concentrations increase with depth in the aquifer, although this relationship is not well defined in plots of TDS and specific conductance vs. depth based on our records (Figures 27A, 27B). Hood (1963) reported that in the vicinity of Artesia, a difference of just 100–200 ft in well depth can mean a difference of several hun-dred mg/l in chloride concentration. However, lateral variations in mineral content are more relevant than depth in characterizing the distribution of salinity in the Roswell Basin.
Table 13. Roswell Artesian Basin, summary of water chemistry.
Specific Cond.
(µS/cm)TDS
(mg/l)Ca
(mg/l)Mg
(mg/l)Na
(mg/l)HCO3 (mg/l)
SO4 (mg/l)
Cl (mg/l)
F (mg/l)
As (mg/l)
U (mg/l)
Well depth
Maximum 176,000 58,300 2,560 1,900 9,000 876 9,600 115,000 95 0.01 0.018 5,506Minimum 101 1.33 23 5.5 1.6 126 59 3 0.1 0.001 0.0009 11Mean 4,993.3 3547.9 349.7 132.9 676.8 281.6 1,095.2 1,202 1.8 0.003 0.0084 435.9Median 3,090 2175 304 90 115.5 253.5 854 465 0.7 0.002 0.0085 322

N E W M E X I C O B U R E A U O F G E O L O G Y A N D M I N E R A L R E S O U R C E S
36
Capitan Reef
The Capitan Reef is a fossil limestone reef of middle Permian age that is dramatically exposed along the southeast flank of the Guadalupe Mountains in Eddy County, New Mexico, reaching its maximum eleva-tion in west Texas, in Guadalupe Mountains National Park. In New Mexico, the reef serves as the host rock for the Big Room in Carlsbad Cavern. A few miles northeast of Carlsbad Caverns National Park, the reef dips into the subsurface and passes beneath the city of Carlsbad, where it forms a karstic aquifer that is the principal source of fresh water for that com-munity (Land and Burger, 2008). The Capitan Reef continues in the subsurface east and south into Lea County, then south for ~150 miles to its southeastern-most outcrop in the Glass Mountains of west Texas (Figure 28). Recharge to the Reef Aquifer occurs by direct infiltration into outcropping cavernous zones formed in the Capitan limestone and equivalent backreef units of the Artesia Group. A significant component of this recharge occurs during flood events in Dark Canyon in the Guadalupe Mountains, where the reef crops out in the bed of Dark Canyon arroyo. Groundwater flows northeastward through the reef and discharges from springs along the Pecos River within the city of Carlsbad (Bjorklund and Motts, 1959). Evidence of cavernous porosity and conduit flow is well documented within the Reef aquifer, indicated by blowing wells and bit drops during drilling operations; and by the presence of water in channels and cavities at different horizons within the reef (Hendrickson and Jones, 1952; Motts, 1968). Carlsbad Cavern may thus be thought of as an upper end-member example of cavernous porosity
30,000
15,000
25,000
20,000
10,000
5,000
0 200 400 600 1,2001,000800 1,4000
Depth (ft)
TDS
(mg/L
)
40,000
30,000
20,000
10,000
0 200 400 800600 1,000 1,4001,2000
Depth (ft)
Spec
ific C
ondu
ctanc
e (μS
/cm)
Figure 27A. Roswell Artesian Basin, depth vs. TDS. Figure 27B. Roswell Artesian Basin, depth vs. specific cond..
development within the Capitan Formation (Land and Burger, 2008). Fresh water is present in the aquifer only in the immediate vicinity of its recharge area in the Guadalupe Mountains. Mineral content rapidly increases east of the Pecos River, and throughout most of its extent the Capitan Reef is a brine res-ervoir, with TDS concentrations >100,000 mg/l in some of the deep monitoring wells in Lea County (Hiss, 1975a; 1975b). The data set for the Capitan Reef aquifer is very limited, consisting of only 13 wells, most of which were last sampled almost half a century ago. The small data set is primarily due to the extremely limited amount of fresh water available in the reef aquifer. The city of Carlsbad, because of its proximity to recharge areas in the Guadalupe Mountains, is the only community in the region that is favorably positioned to exploit the fresh-water segment of the reef. Because of the highly saline nature of groundwater in the Capitan Reef east of the Pecos River, very few water supply wells are completed in that portion of the aquifer. Until recently, the only water quality information available for the reef east of the Pecos River was from a network of monitoring wells installed by the U.S. Geological Survey in the mid-20th century (Hiss, 1975a; 1975b). These records confirm the highly mineralized character of groundwater in the eastern segment of the Capitan Reef, resulting in a mean TDS concentration for the entire aquifer of >54,000 mg/l (Table 14). We have chosen not to plot TDS and specific conductance vs. depth for the Capitan Reef because the lateral distribution of dissolved solids most accurately characterizes the distribution of salinity within this aquifer.

37
F R E S H A N D B R A C K I S H W A T E R Q U A L I T Y
Table 14. Capitan Reef aquifer, summary of water chemistry, based in part on preliminary analysis of samples collected by Sandia National Labs.
Figure 28. Capitan Reef aquifer, surface geology and data distribution.
Brackish water resources are clearly available in the Capitan Reef aquifer, although for the most part that water is more accurately described as a brine, and would thus not be suitable for conven-tional desalination technologies. However, this highly saline water is a valuable resource for industrial
applications in southeastern New Mexico and west Texas. Both the petroleum and potash mining indus-tries have recently expressed interest in exploiting brackish water in the reef aquifer for water flooding of mature oil fields in the Permian Basin region and for processing of potash ore.
Specific Cond.
(µS/cm)TDS
(mg/l)Ca
(mg/l)Mg
(mg/l)Na
(mg/l)HCO3 (mg/l)
SO4 (mg/l)
Cl (mg/l)
F (mg/l)
As (mg/l)
U (mg/l)
Well depth
Maximum 196,078 184,227 5,902 2,046 46,700 784 4,970 107,949 1.9 0.001 0.001 5,713Minimum 602 364 48.9 32.6 5.1 56 14.3 10 0.1 0.001 0.001 327Mean 64,412.8 54,046.5 1,555.6 737.5 15,021.1 338.7 2,204 29,959.8 0.69 0.001 0.001 3,285Median 39,000 26,900 1,240 463.4 2,357.5 271 1,862.9 13,800 0.5 0.001 0.001 3,250

N E W M E X I C O B U R E A U O F G E O L O G Y A N D M I N E R A L R E S O U R C E S
38
Figure 29. Raton and Las Vegas Basins, surface geology and data distribution.

39
F R E S H A N D B R A C K I S H W A T E R Q U A L I T Y
eastern New Mexico – high Plains
Raton-Las Vegas Basins
Northeastern New Mexico is a geologically diverse area that includes the upper Pecos and Canadian
river valleys, the eastern margin of the Sangre de Cristo Mountains, and the Raton and Las Vegas Basins, two north-trending assymetric structural basins formed during the late Cretaceous-Paleogene Laramide orogeny (Figure 29). The Raton and Las Vegas Basins are separated by igneous intrusive rocks of the Cimarron Arch, near Cimarron, NM. The gen-tly-dipping eastern margins of these basins are defined by the Sierra Grande Arch and the Raton-Clayton volcanic field (Kelley, 2015; Broadhead, 2015). The Raton-Las Vegas Basin region includes east-ern Colfax County, Mora County, and San Miguel County, New Mexico. Large supplies of groundwater are generally not available in this region. The two largest communities in northeastern New Mexico, Raton and Las Vegas, derive most of their water from surface diversions, although the city of Las Vegas has supplemental water supplies from wells completed in the Permian Glorieta and Triassic Chinle and Santa Rosa sandstones (Lazarus and Drakos, 1997). Wells completed in volcanic rocks near Capulin, New Mexico have also yielded significant volumes of fresh water (Dinwiddie and Cooper, 1966). Most of the groundwater resources in the region occur in Triassic through Cretaceous sandstones, the most prolific of which is the Dakota sandstone in eastern Colfax and Union Counties (Dinwiddie and Cooper, 1966; Kilmer, 1987). The poor quality
of water in the Dakota sandstone aquifer west of the Rio Grande Arch has been attributed to the pres-ence of subsurface dikes that have added dissolved solids such as bicarbonates, chlorides, and sodium to Dakota sandstone waters (Griggs, 1948). TDS content greater than 3,000 mg/l has been reported in some wells screened in the Dakota sandstone in the Las Vegas Basin (Lazarus and Drakos, 1997). Groundwater in northeastern New Mexico has been relatively underinvestigated compared to other regions of the state. Rawling (2014) reported on water resources in the Ogallala and upper Dakota Formations in eastern Union Co. Prior to that report, the most comprehensive investigations of water resources in northeastern New Mexico were con-ducted in the mid-20thcentury by workers with the New Mexico Bureau of Mines and Mineral Resources (Griggs, 1948; Griggs and Hendrickson, 1951; Cooper and Davis, 1967). Data coverage for the Raton and Las Vegas Basins combined is very limited, with a total of only 80 records. Groundwater quality in the region is brackish, with a mean TDS concentration of 2,336 mg/l (Table 15). However, the mean TDS for the region is influenced by one well located adjacent to a saline playa at Maxwell National Wildlife Refuge, with a measured TDS concentration of >65,000 mg/l. The median TDS of 965 mg/l may be more representative of basin-wide mineral content. Plots of TDS and specific conductance vs. depth (Figures 30A, 30B) indicate that brackish water resources are probably present at greater depths in the Raton-Las Vegas Basin region. However, with an average well depth of only 160 feet, this resource is largely unexplored.
Table 15. Raton and Las Vegas Basins, summary of water chemistry.
Specific Cond.
(µS/cm)TDS
(mg/l)Ca
(mg/l)Mg
(mg/l)Na
(mg/l)HCO3 (mg/l)
SO4 (mg/l)
Cl (mg/l)
F (mg/l)
As (mg/l)
U (mg/l)
Well depth
Maximum 9,320 65,300 504 8,100 8,100 1,360 46,000 1,700 7 0.009 0.005 975Minimum 347 230 2.8 0.75 22 183 1 5 0.1 0.001 0.001 6.7Mean 1,788.1 2,335.5 134.9 188.6 639.8 438.2 1,272.2 130.3 1.2 0.0018 0.0016 160Median 1,280 964.5 80 27.5 108.5 353.5 202.5 27.5 0.7 0.001 0.001 82.5

N E W M E X I C O B U R E A U O F G E O L O G Y A N D M I N E R A L R E S O U R C E S
40
High Plains Aquifer
The High Plains aquifer is one of the largest freshwa-ter aquifers in the world, covering more than 170,000 square miles and extending across parts of eight states from South Dakota to the Texas Panhandle (Sophocleous, 2010). The first regional investiga-tion of the High Plains was conducted by the U.S. Geological Survey at the beginning of the 20th century (Johnson, 1901). Since then, several regional stud-ies have been conducted (e.g., Gutentag et al., 1984; Weeks et al., 1988), and a great many more localized investigations (e.g., Joeckel et al., 2014; Chaudhuri and Ale, 2014), reflecting the societal and economic importance of this very extensive aquifer system. The main part of the High Plains aquifer is contained within the Ogallala Formation, a laterally extensive unit composed of Tertiary-age alluvial fan, lacustrine and eolian deposits derived from erosion of the Rocky Mountains (Gustavson and Winkler, 1988). The terms “Ogallala Aquifer” and “High Plains Aquifer” are often used interchangeably. However, Gutentag et al. (1984) advocated for the use of the latter term, since the Ogallala Aquifer is hydrauli-cally connected with adjacent older and younger
formations of Permian, Mesozoic and Quaternary age, and these latter units are effectively a part of the greater High Plains aquifer system. Two lobes of the High Plains aquifer extend into eastern New Mexico—a northern lobe in south-ern Union County, and a larger southern lobe that occupies Curry, Roosevelt, and the northern two-thirds of Lea Counties (Figure 1A and Figure 31). In southern Union County, the lower Cretaceous Dakota sandstone is hydraulically connected to the overly-ing Ogallala Aquifer (Griggs, 1948; Kilmer, 1987). Available data indicate that the conjoined aquifers in Union County generally yield water with TDS values less than 1,000 mg/l (Rawling, 2014). A substantial data set is available for the High Plains aquifer, with 560 records. In general, water in the New Mexico portion of the High Plains aquifer is of high quality, with a median TDS of just 436 mg/l (Table 16). Very few of the wells sampled exceed 2,000 mg/l (Figure 32A, 32B). The maximum TDS value (15,100 mg/l) is from a well located east of Portales, a short distance from the Grulla National Wildlife Refuge. The principal feature of the refuge is an ephemeral salt lake, or saline playa. Because playas are generally regarded as areas of focused
Table 16. High Plains aquifer, summary of water chemistry.
Specific Cond.
(µS/cm)TDS
(mg/l)Ca
(mg/l)Mg
(mg/l)Na
(mg/l)HCO3 (mg/l)
SO4 (mg/l)
Cl (mg/l)
F (mg/l)
As (mg/l)
U (mg/l)
Well depth
Maximum 18,400 15,100 574 1,150 3,100 518 7,530 5,900 33 0.0126 0.139 1,645Minimum 306 203 3.4 0.9 1 138 1.8 1 0.2 0.0006 0.0005 15Mean 1,132.5 995.9 79.9 49.5 116.1 225.2 242.7 137.9 1.9 0.0043 0.011 215.5Median 639.5 436 58.5 24 39.5 220 75 40 1.4 0.0041 0.0058 185.5
6,000
4,000
3,000
5,000
2,000
1,000
0 200 400 800600 1,0000
Depth (ft)
TDS
(mg/L
)
6,000
5,000
4,000
3,000
2,000
1,000
0 200 400 600 1,0008000
Depth (ft)
Spec
ific C
ondu
ctanc
e (μS
/cm)
Figure 30A. Raton and Las Vegas Basins, depth vs. TDS. Figure 30B. Raton and Las Vegas Basins, depth vs. specific cond..

41
F R E S H A N D B R A C K I S H W A T E R Q U A L I T Y
Figure 31. High Plains aquifer, surface geology and data distribution.

N E W M E X I C O B U R E A U O F G E O L O G Y A N D M I N E R A L R E S O U R C E S
42
recharge for the High Plains Aquifer, the well in ques-tion is probably intercepting saline water from that source, resulting in a misleadingly high mean TDS for
16,000
8,000
12,000
4,000
0 200 600 1,4001,000 1,8000
Depth (ft)
High Plains Aquifer: Depth vs. TDS
TDS
(mg/L
)
20,000
15,000
10,000
5,000
0 200 600 1,000 1,8001,4000
Depth (ft)
Spec
ific C
ondu
ctanc
e (μS
/cm)
Figure 32A. High Plains aquifer, depth vs. TDS. Figure 32B. High Plains aquifer, depth vs. specific cond..
the aquifer as a whole. The records indicate that the High Plains Aquifer is unlikely to be a reliable source of brackish water.
Northwestern New Mexico – colorado Plateau
San Juan Basin
the San Juan Basin is a large structural basin in northwestern New Mexico that formed during the
late Cretaceous-Paleogene Laramide orogeny about 75 million years ago. The basin comprises all or parts of San Juan, McKinley, Rio Arriba, and Sandoval Counties, with a northern portion that extends into southwestern Colorado (Figure 33). The basin is bordered by basement-cored Laramide highlands, including the Nacimiento Uplift to the east, the Zuni Mountains to the south, the Defiance uplift to the west, and the San Juan Mountains in Colorado to the north. Laramide-age monoclines form the remaining boundaries of the basin (Kelley et al., 2014). The San Juan Basin region is a major producer of hydrocar-bons, primarily natural gas, and extensive studies of the petroleum geology of the region have been conducted over the past several decades. Basin-wide hydrogeological assessments of the San Juan Basin were conducted by Stone et al. (1983), Craigg et al. (1989; 1990), Kaiser et al. (1994), Kernodle (1996), and Levings et al. (1996). Kelley et al. (2014) con-ducted a thorough hydrologic assessment of oil and gas resource development of the Mancos Shale in the San Juan Basin, which includes detailed discussions of groundwater salinity in the basin by depth and individual aquifers.
The principal water-bearing units in the San Juan Basin are contained in Cretaceous sand-stones that were deposited in a marginal marine setting along the southwest margin of the Western Interior Seaway; non-marine Jurassic sandstones of the Morrison, Entrada and Bluff Formations; and non-marine Tertiary sandstone aquifers. Recharge to these aquifers, some of which are also natural gas reservoirs in the center of the basin, occurs in narrow outcrop belts along the basin margin, and also from the San Juan Mountains and Nacimiento Uplift to the north and east (Kelley et al., 2014). The Permian Glorieta sandstone and San Andres limestone are also important sources of groundwater along the northern margin of the Zuni Mountains (Stone et al., 1983). Kelley et al. (2014) report that groundwater salinity derived from borehole geophysical logs is generally low along the basin margins, where recharge occurs, and high toward the center of the basin for all aquifers considered in their investiga-tion. Some units, such as the Gallup and Morrison Formations, have particularly broad zones of fresher water along the southern and western margins of the basin. However, the distribution of saline water toward the basin center is complex and variable among the different aquifers. We have an exceptionally large data set for the San Juan Basin (1,011 total data points). Some of the wells sampled are apparently natural gas or oil

43
F R E S H A N D B R A C K I S H W A T E R Q U A L I T Y
Table 17. San Juan Basin, summary of water chemistry.
Specific Cond.
(µS/cm)TDS
(mg/l)Ca
(mg/l)Mg
(mg/l)Na
(mg/l)HCO3 (mg/l)
SO4 (mg/l)
Cl (mg/l)
F (mg/l)
As (mg/l)
U (mg/l)
Well depth
Maximum 83,300 57,300 2,200 955 16,000 1,724 15,000 34,000 15 0.058 1.21 9,803Minimum 205 56 0.28 0.01 7.7 220 1.8 0.1 0.1 0.00001 0.0003 5Mean 3,158.2 2,373.3 102.2 30.8 614.2 381.8 822.3 401.7 1.5 0.0017 0.057 765.6Median 1,700 1,125 46 11 240 310 350 23.6 0.8 0.001 0.0055 397.5
Figure 33. San Juan Basin, surface geology and data distribution.
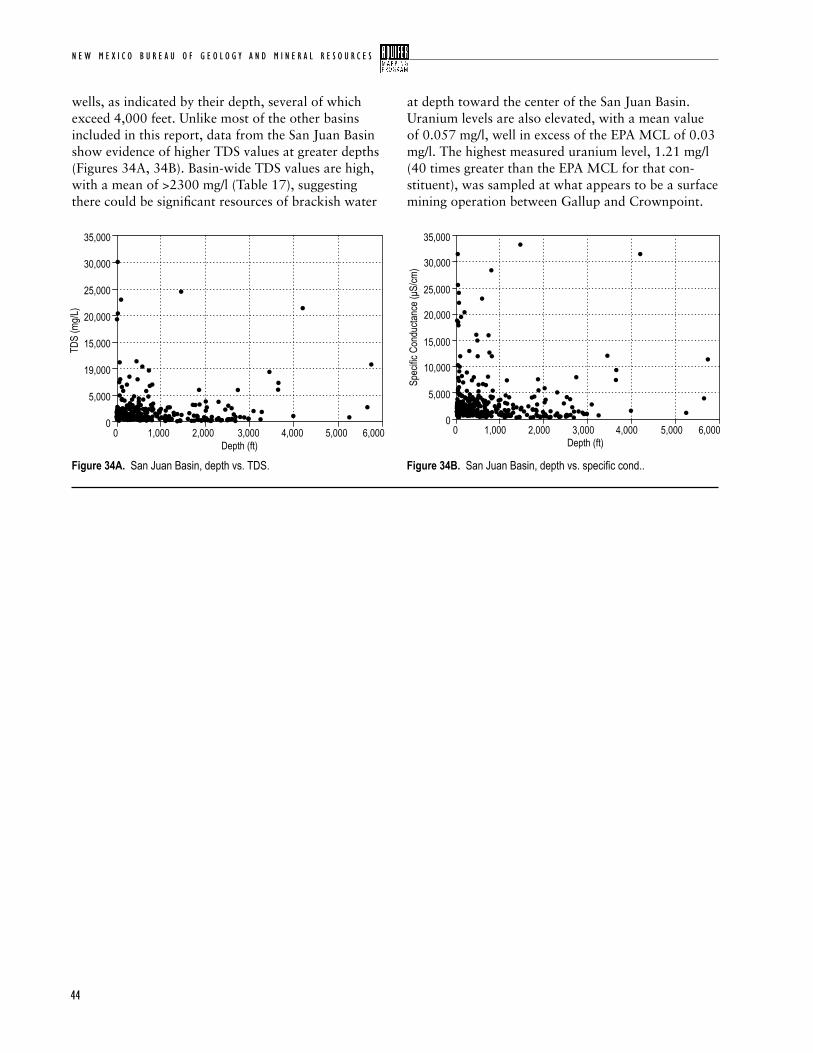
N E W M E X I C O B U R E A U O F G E O L O G Y A N D M I N E R A L R E S O U R C E S
44
wells, as indicated by their depth, several of which exceed 4,000 feet. Unlike most of the other basins included in this report, data from the San Juan Basin show evidence of higher TDS values at greater depths (Figures 34A, 34B). Basin-wide TDS values are high, with a mean of >2300 mg/l (Table 17), suggesting there could be significant resources of brackish water
at depth toward the center of the San Juan Basin. Uranium levels are also elevated, with a mean value of 0.057 mg/l, well in excess of the EPA MCL of 0.03 mg/l. The highest measured uranium level, 1.21 mg/l (40 times greater than the EPA MCL for that con-stituent), was sampled at what appears to be a surface mining operation between Gallup and Crownpoint.
35,000
20,000
15,000
30,000
25,000
19,000
5,000
0 1,000 2,000 5,0004,0003,000 6,0000
Depth (ft)
San Juan Basin: Depth vs. TDS
TDS
(mg/L
)
30,000
20,000
10,000
0 1,000 2,000 3,000 4,000 6,0005,0000
Depth (ft)
Spec
ific C
ondu
ctanc
e (μS
/cm)
35,000
15,000
25,000
5,000
Figure 34A. San Juan Basin, depth vs. TDS. Figure 34B. San Juan Basin, depth vs. specific cond..

F R E S H A N D B R A C K I S H W A T E R Q U A L I T Y
45
r e f e r e N c e s
Adams, D.C., and Keller, G.R., 1994, Crustal structure and basin geometry in south-central New Mexico, in Keller, G.R., Cather, S.M., eds., Basins of the Rio Grande Rift: Structure, stratigra-phy and tectonic setting, Geological Society of America Special Paper 291, p. 241–255.
Anderholm, S.K., 1983, Hydrogeology of the Socorro and La Jencia Basins, Socorro County, New Mexico, in Chapin, C.E., Callender, J.F., eds., Socorro Region II, New Mexico Geological Society, 34th Annual Field Conference, Guidebook, p. 303–310.
Anderholm, S.K., 2001, Mountain-front recharge along the east side of the Albuquerque Basin, central New Mexico, U.S. Geological Survey Water-Resources Investigations Report 00-4010, 36 p.
Bachhuber, F.W., 1982, Quaternary history of the Estancia Valley, central New Mexico, in Grambling, J.A., Wells, S.G., eds., Albuquerque Country II, New Mexico Geological Society, 33rd Annual Field Conference, Guidebook, p. 343–346.
Bartolino, J.R., and Cole, J.C., 2002. Ground-water resources of the middle Rio Grande Basin, New Mexico, US Geological Survey Circular 1222, 132 p.
Bauer, P.W., and Kelson, K.I., 2004, Rift extension and fault slip rates in the southern San Luis Basin, New Mexico, in Brister, B.S., Bauer, P.W., Read, A.S., Lueth, V.W., eds., Geology of the Taos region, New Mexico, New Mexico Geological Society, 55th Annual Field Conference, Guidebook, p. 172–180.
Belzer, W.L., 1999, Gravity and Seismic Studies of the Tularosa graben for Groundwater Studies [MS Thesis]: University of Texas at El Paso, 124 p.
Biehler, S., Ferguson, J., Baldridge, W.S., Jiracek, G.R., Aldern, J.L., Martinez, M., Fernandez, R., Romo, J., Gilpin, B., Braile, L.W., Hersey, D.R., Luyendyk, B.P., and Aiken, C.L.V., 1991, A geophysical model of the Española Basin, Rio Grande Rift, New Mexico. Geophysics 56: 340–353.
Bjorklund, L.J., and Motts, W.S., 1959, Geology and water resources of the Carlsbad area, New Mexico, U.S. Geological Survey Open File Report, 322 p.
Broadhead, R.F., 1997, Subsurface geology and oil and gas potential of Estancia Basin, New Mexico. New Mexico Bureau of Mines and Mineral Resources Bulletin 157, 54 p.
Broadhead, R.F., 2015, Petroleum geology of the Las Vegas Basin, an overview, in Lindline, J., Petronis, M., Zebrowski, J., eds., Geology of the Las Vegas area, New Mexico Geological Society, 66th Annual Field Conference, Guidebook, p. 253–260.
Chapin, C.E., 1971, The Rio Grande Rift part I: Modifications and additions, in James, H.L., ed., San Luis Basin, New Mexico Geological Society, 22nd Annual Field Conference, Guidebook, p. 191–201.
Chaudhuri, S., and Ale, S., 2014, Long term (1960-2010) trends in groundwater contamination and salinization in the Ogallala aquifer in Texas, Journal of Hydrology 513: 376–390.
Connell, S.D., Allen, B.D., and Hawley, J.W., 1998, Subsurface stratigraphy of the Santa Fe Group from borehole geo-physical logs, Albuquerque area, New Mexico. New Mexico Geology 17 (4): 79–87.
Connell, S.D., Hawley, J.W., and Love, D.W., 2005, Late Cenozoic drainage develop-ment in the southeastern Basin and Range of New Mexico, southeasternmost Arizona, and western Texas, in Lucas, S.G., Morgan, G.S., Zeigler, K.E., eds., New Mexico’s Ice Ages, New Mexico Museum of Natural History and Science Bulletin No. 28, p. 125–149.
Conover, C. S., 1954, Ground-water condi-tions in the Rincon and Mesilla Valleys and adjacent areas in New Mexico: U.S. Geological Survey Water-Supply Paper 1230, 200 p.
Cooper, J.B., and Davis, L.V., 1967, General occurrence and quality of ground water in Union County, New Mexico, Ground-Water Report 8, 168 p.
Cordell, L., 1979, Gravimetric expression of graben faulting in Santa Fe County and the Española Basin, New Mexico, in Ingersoll, R.V., Woodward, L.A., James, H.L., eds., Santa Fe Country, New Mexico Geological Society, 30th Annual Field Conference Guidebook, p. 59–64.
Craigg, S.D., Dam, W.L., Kernodle, J.M., Levings, G.W., 1989, Hydrogeology of the Dakota Sandstone in the San Juan structural basin, New Mexico, Colorado, Arizona, and Utah, US Geological Survey Hydrologic Investigations Atlas HA-720-I, 2 sheets.
Craigg, S.D., Dam, W.L., Kernodle, J.M., Thorn, C.R., and Levings, G.W., 1990, Hydrogeology of the Point Lookout Sandstone in the San Juan struc-tural basin, New Mexico, Colorado, Arizona, and Utah, US Geological Survey Hydrologic Investigations Atlas HA-720-G, 2 sheets.
Darton, N.H., 1916, Geology and under-ground water of Luna County, New Mexico, US Geological Survey Bulletin 618, 188 p.
Drakos, P., Lazarus, J., White, B., Banet, C., Hodgins, M., Riesterer, J., and Sandoval, J., 2004a, Hydrologic char-acteristics of basin-fill aquifers in the southern San Luis Basin, New Mexico, in Brister, B.S., Bauer, P.W., Read, A.S., Lueth, V.W., eds., Geology of the Taos region, New Mexico, New Mexico Geological Society, 55th Annual Field Conference Guidebook, p. 391–403.
Drakos, P., Sims, K., Riesterer, J., Blusztajn, J., and Lazarus, J., 2004b, Chemical and isotopic constraints on source-waters and connectivity of basin-fill aquifers in the southern San Luis Basin, New Mexico, in Brister, B.S., Bauer, P.W., Read, A.S., Lueth, V.W., eds., Geology of the Taos region, New Mexico, New Mexico Geological Society, 55th Annual Field Conference Guidebook, p. 405–414.
N E W M E X I C O B U R E A U O F G E O L O G Y A N D M I N E R A L R E S O U R C E S
46
Dinwiddie, G.A., and Cooper, J.B., 1966, Water-bearing characteristics of the rocks of eastern Colfax and western Union Counties, New Mexico, in Northrop SA, Read CB, eds. Taos-Raton-Spanish Peaks Country, New Mexico and Colorado, New Mexico Geological Society, 17th Annual Field Conference Guidebook, p. 76–79.
Ferguson, J.F., Baldridge, W.S., Braile, L.W., Biehler, S., Gilpin, B., and Jiracek, G.R., 1995, Structure of the Española Basin, Rio Grande Rift, New Mexico, from SAGE seismic and gravity data, in Bauer, P.W., Kues, B.S., Dunbar, N.W., Karlstrom, K.E., Harrison, B., eds., Geology of the Santa Fe region, New Mexico, New Mexico Geological Society, 46th Annual Field Conference Guidebook, p. 105–110.
Fiedler, A.G., and Nye, S.S., 1933, Geology and ground-water resources of the Roswell Basin, New Mexico, U.S. Geological Survey Water-Supply Paper 639.
Garza, S., and McLean, J.S., 1977, Fresh-water resources in the southeastern part of the Tularosa basin, New Mexico Office of the State Engineer Technical Report 40, 55 p.
Golombek, M.P., 1983, Geology, structure and tectonics of the Pajarito fault zone in the Española Basin of the Rio Grande Rift, New Mexico, Geological Society of America Bulletin 94 (2): 192–205.
Gratton, P.J.F., and LeMay, W.J., 1969, San Andres oil east of the Pecos, in Summers, W.K., Kottlowski, F.E., eds., The San Andres Limestone, a Reservoir for Oil and Water, New Mexico Geological Society Special Publication No. 3, p. 37–43.
Grauch, V.J.S., 2001, High-resolution aeromagnetic data, a new tool for map-ping intrabasinal faults: Example from the Albuquerque Basin, New Mexico, Geology 29 (4): 367–370.
Grauch, V.J.S., Sawyer, D.A., Keller, G.R., and Gillespie, C.L., 2001, Contributions of gravity and aeromagnetic studies to improving the understanding of subsur-face hydrogeology, Middle Rio Grande Basin, New Mexico, in Cole, J.C., ed., US Geological Survey Middle Rio Grande Basin Study–Proceedings of the fourth annual workshop, Albuquerque, New Mexico, February 15–16, 2000, US Geological Survey Open-File Report 00-488, p. 3–4.
Grauch, V.J.S., and Keller, G.R., 2004, Gravity and aeromagnetic expres-sion of tectonic and volcanic elements of the southern San Luis Basin, New Mexico and Colorado, in Brister, B.S., Bauer, P.W., Read, A.S., Lueth, V.W., eds., Geology of the Taos region, New Mexico. New Mexico Geological Society, 55th Annual Field Conference Guidebook, p. 230–243.
Grauch, V.J.S., Phillips, J.D., Koning, D.J., Johnson, P.S., and Bankey, V.B., 2009, Geophysical interpretations of the southern Española Basin, New Mexico, that contribute to understand-ing its hydrogeologic framework. US Geological Survey Professional Paper 1761.
Griggs, R.L., 1948, Geology and ground-water resources of the eastern part of Colfax County, New Mexico, New Mexico Bureau of Mines and Mineral Resources. Ground-Water Report 1, 180 p.
Griggs, R.L., and Hendrickson, G.E., 1951, Geology and ground-water resources of San Miguel County, New Mexico, Ground-Water Report 2, 121 p.
Gustavson, T.C., and Winkler, D.A., 1988, Depositional facies of the Miocene-Pliocene Ogallala Formation, northwestern Texas and eastern New Mexico, Geology 16: 203–206.
Gutentag, E.D., Heimes, F.J., Krothe, N.C., Luckey, R.R., and Weeks, J.B., 1984, Geohydrology of the High Plains Aquifer in parts of Colorado, Kansas, Nebraska, New Mexico Oklahoma, South Dakota, Texas, and Wyoming, US Geological Survey Professional Paper 1400-B, 63 p.
Hanson, R.T., McLean, J.S., and Miller, R.S., 1994, Hydrogeologic framework and preliminary simulation of ground-water flow in the Mimbres Basin, south-western New Mexico, US Geological Survey, Water-Resources Investigations Report 94-4011, 118 p.
Havenor, K.C., 1968, Structure, stratigra-phy, and hydrogeology of the northern Roswell Artesian Basin, Chaves County, New Mexico, New Mexico Bureau of Mines and Mineral Resources Circular 93, 30 p.
Hawley, J.W., 2016, Challenges and opportunities for brackish groundwater resource development in New Mexico–prediction hydro-science from an octo-genarian hydrogeologist’s perspective, informal “white paper” introduction to PowerPoint™ presentation to the Urban Land Institute-New Mexico section–April 28, 2016 [unpublished].
Hawley, J.W., Kottlowski, F.E., Seager, W.R., King, W.E., Strain, W.S., and LeMone, D.V., 1969, The Santa Fe Group in the south-central New Mexico border region, in Border Stratigraphy Symposium, New Mexico Bureau of Mines and Mineral Resources, Circular 104, p. 52–76.
Hawley, J.W., and Lozinsky, R.P., 1992, Hydrogeologic framework of the Mesilla Basin in New Mexico and western Texas, New Mexico Bureau of Mines and Mineral Resources, Open-File Report 323, 55 p.
Hawley, J.W., and Haase, C.S., 1992, Hydrogeologic framework of the northern Albuquerque Basin. New Mexico Bureau of Mines and Mineral Resources, Open-File Report 387, vari-ously paged.
Hawley, J.W., Hibbs, B.J., Kennedy, J.F., Creel, B.J., Remmenga, M.D., Johnson, M., Lee, M.M., Dinterman, P., 2000, Trans-international boundary aquifers in southwestern New Mexico: New Mexico Water Resources Research Institute, 126 p.
Hawley, J.W., Kennedy, J.F., and Creel, B.J., 2001, The Mesilla Basin aquifer system of New Mexico, West Texas and Chihuahua—an overview of its hydro-geologic framework and related aspects of groundwater flow and chemistry, in Mace, R.E., Mullican, W.F. III, Angle, E.S., eds., Aquifers of West Texas: Texas Water Development Board Report 356, p. 76–99.
Hawley, J.W., and Kennedy, J.F., 2004, Creation of a digital hydrogeologic framework model of the Mesilla Basin and southern Jornada del Muerto Basin, New Mexico Water Resources Research Institute Technical Completion Report No. 332, 105 p.
Hendrickson, G.E., and Jones, R.S., 1952, Geology and ground-water resources of Eddy County, New Mexico, New Mexico Bureau of Mines and Mineral Resources Ground-Water Report 3, 169 p.
Heywood, C.E., 1992, Isostatic residual gravity anomalies of New Mexico, US Geological Survey Water-Resources Investigations Report 91-4065, 27 p.
Hiss, W.L., 1975a, Stratigraphy and ground-water hydrology of the Capitan Aquifer, southeastern New Mexico and western Texas [Ph.D. dissertation], Boulder (CO): University of Colorado, 396 p.

F R E S H A N D B R A C K I S H W A T E R Q U A L I T Y
47
Hiss, W.L., 1975b, Chloride ion concen-tration in ground water in Permian Guadalupian rocks, southeast New Mexico and west Texas, New Mexico Bureau of Mines and Mineral Resources, Resource Map 4.
Hood, J.W., 1963, Saline ground water in the Roswell Basin, Chaves and Eddy Counties, New Mexico, 1958–1959, US Geological Survey Water-Supply Paper 1539-M, 46 p.
Hood, J.W., and Kister, L.R., 1962, Saline-water resources in New Mexico, US Geological Survey Water-Supply Paper 1601, 70 p.
Huff, G.F., 2002, Apparent age of ground water near the southeastern margin of the Tularosa Basin, Otero County, New Mexico, in Lueth, V.W., Giles, K.A., Lucas, S.G., Kues, B.S., Myers, R., Ulmer-Scholle, D.S., eds., Geology of White Sands, New Mexico Geological Society, 53rd Annual Field Conference, Guidebook, p. 303–307.
Finch, S.T., Jr., McCoy, A., and Melis, E., 2008, Geologic controls on ground-water flow in the Mimbres Basin, south-western New Mexico, in Mack, G., Witcher, J., Lueth, V.W., eds., Geology of the Gila Wilderness-Silver City area, New Mexico Geological Society, 59th Annual Field Conference, Guidebook, p. 189–198.
Joeckel, R.M., Wooden, S.R., Jr., Korus, J.T., and Garbisch, J.O., 2014, Architecture, heterogeneity, and origin of late Miocene fluvial deposits hosting the most important aquifer in the Great Plains, USA. Sedimentary Geology 311: 75–95.
Johnson, W.D., 1901, The high plains and their utilization. US Geological Survey 21st Annual Report, pt. 4-C, p. 601–741.
Johnson, P.S., 2014, Water quality in basin-fill aquifers of the Rio Grande Rift, northern New Mexico [abstract], National Ground Water Association, Conference on hydrology and water scarcity in the Rio Grande Basin.
Johnson, P.S., Koning, D.J., Felix, B., and Timmons, S.W., 2008, Geochemical characterization of ground water in the southern Española Basin, Santa Fe, New Mexico, New Mexico Bureau of Geology and Mineral Resources Open File Report 511, 61 p.
Johnson, P.S., Koning, D.J., Partey, F.K., 2013, Shallow groundwater geochem-istry in the Española Basin, Rio Grande rift, New Mexico: Evidence for struc-tural control of a deep thermal source, in Hudson, M.R., Grauch, V.J.S., eds., New perspectives on Rio Grande Rift basins; from tectonics to groundwater, Geological Society of America Special Paper 494, p. 261–301.
Jones, M.A., Shomaker, J.W., and Finch, S.T., Jr., 2014, Model of groundwater flow in the Animas Uplift and Palomas Basin, Copper Flat Project, Sierra County, New Mexico, John Shomaker and Associates, unpublished report prepared for New Mexico Copper Corporation, 89 p. with appendices.
Kaiser, W.R., Swartz, T.E., and Hawkins, G.J., 1994, Hydrologic framework of the Fruitland Formation, San Juan Basin, in Ayers, W.B., Jr., and Kaiser, W.R., eds., Coalbed methane in the Upper Cretaceous Fruitland Formation, San Juan Basin, New Mexico and Colorado, New Mexico Bureau of Mines and Mineral Resources Bulletin 146, p. 133–163.
Kelley, V.C., 1977, Geology of Albuquerque Basin, New Mexico, New Mexico Bureau of Mines and Mineral Resources Memoir 33, 60 p.
Kelley, V.C., 1978, Geology of Española Basin, New Mexico, New Mexico Bureau of Mines and Mineral Resources Map 48. 1:125,000.
Kelley, V.C., Woodward, L.A., Kudo, A.M., and Callender, J.F., 1976, Guidebook to Albuquerque Basin of the Rio Grande Rift, New Mexico, New Mexico Bureau of Mines and Mineral Resources, Circular 153.
Kelley, S., 2015, Geothermal potential of the Raton Basin, New Mexico, in Lindline, J., Petronis, M., Zebrowski, J., eds., Geology of the Las Vegas area, New Mexico Geological Society, 66th Annual Field Conference, Guidebook, p. 261–275.
Kelley, S., Engler, T., Cather, M., Pokorny, C., Yang, C.H., Mamer, E., Hoffman, G., Wilch, J., Johnson, P., Zeigler, K., 2014, Hydrologic assessment of oil and gas resource development of the Mancos Shale in the San Juan Basin, New Mexico, New Mexico Bureau of Geology and Mineral Resources Open-File Report 566, 64 p.
Kennedy, J.F., Hawley, J.W., and Johnson, M., 2000, The hydrogeologic frame-work of basin-fill aquifers and associated ground-water-flow systems in southwestern New Mexico–an overview, New Mexico Geological Society, 51st Annual Field Conference, Guidebook, p. 235–244.
Kernodle, J.M., 1996, Simulation analysis of the San Juan Basin ground-water flow system, New Mexico, Colorado, Arizona, and Utah, US Geological Survey Water-Resources Investigations Report 95-4187, 117 p.
Kilmer, L.C., 1987, Water-bearing char-acteristics of geologic formations in northeastern New Mexico-southeastern Colorado, in Lucas, S.G., Hunt, A.P., eds., Northeastern New Mexico, New Mexico Geological Society, 38th Annual Field Conference, Guidebook, p. 275–279.
King, W.E., Harder, V.M., 1985, Oil and gas potential of the Tularosa Basin-Otero platform-Salt Basin graben area, New Mexico and Texas, New Mexico Bureau of Mines and Mineral Resources, Circular 198. 36 p.
King, W.E., Hawley, J.W., Taylor, A.M., and Wilson, R.P., 1971, Geology and ground-water resources of central and western Doña Ana County, New Mexico: New Mexico Bureau of Mines and Mineral Resources, Hydrologic Report 1, 64 p.
Land, L., 2003, Evaporite karst and regional ground water circulation in the lower Pecos Valley, in Johnson, K.S., Neal, J.T., eds. Evaporite Karst and Engineering/Environmental Problems in the United States, Norman (OK): Oklahoma Geological Survey Circular 109. p. 227–232.
Land, L., Newton, B.T., 2007, Seasonal and long-term variations in hydrau-lic head in a karstic aquifer: Roswell Artesian Basin, New Mexico, New Mexico Bureau of Geology and Mineral Resources Open-File Report no. 503.
Land, L., Newton, B.T., 2008, Seasonal and long-term variations in hydraulic head in a karstic aquifer: Roswell Artesian Basin, New Mexico, Journal of the American Water Resources Association 44: 175–191.

N E W M E X I C O B U R E A U O F G E O L O G Y A N D M I N E R A L R E S O U R C E S
48
Land, L., Burger, P., 2008, Rapid recharge events in a karstic aquifer: An exam-ple from Lake of the White Roses, Lechuguilla Cave, New Mexico, in Yuhr, L., Alexander, E.C., Jr., Beck, B., eds., Proceedings of the Eleventh Multidisciplinary Conference on Sinkholes and the Engineering and Environmental Impacts of Karst, Tallahassee, Florida, ASCE Geotechnical Special Publication no. 183, p. 396–403.
Land, L., and Huff, G.F., 2010, Multi-tracer investigation of groundwater resi-dence time in a karstic aquifer: Bitter Lake National Wildlife Refuge, New Mexico, USA, Hydrogeology Journal 18: 455–472.
Land, L., and Timmons, S., 2016, Evaluation of groundwater residence time in a high mountain aquifer system: Insights gained from use of multiple environmental tracers, Hydrogeology Journal. doi 10.1007/s10040-016-1400-4.
Lazarus, J., Drakos, P.G., 1997, Geohydrologic characteristics of the Taylor well field, City of Las Vegas, New Mexico. Water issues of eastern New Mexico: Get your water kicks on Route 66, New Mexico Water Resources Research Institute, p. 59–71.
Leggat, E.R., Lowry, M.E., and Hood, J.W., 1962, Ground-water resources of the lower Mesilla Valley, Texas and New Mexico: Texas Water Commission, Bulletin 6203, 191 p.
Levings, G.W., Kernodle, J.M., and Thorn, C.R., 1996, Summary of the San Juan structural basin Regional Aquifer-System Analysis, New Mexico, Colorado, Arizona, and Utah, US Geological Survey Water-Resources Investigations Report 95-4188, 55 p.
Lewis, A.C., and West, F., 1995, Conceptual hydrologic systems for Santa Fe County, in Bauer, P.W., Kues, B.S., Dunbar, N.W., Karlstrom, K.E., Harrison, B., eds., Geology of the Santa Fe region, New Mexico, New Mexico Geological Society, 46th Annual Field Conference Guidebook, p. 299–306.
Lozinsky, R.P., 1987, Cross-section across the Jornada del Muerto, Engle, and northern Palomas Basins, south-central New Mexico, New Mexico Geology 9 (3), p. 55–57.
Lozinsky, R.P., and Bauer, P.W., 1991, Structure and basin-fill units of the Tularosa Basin: New Mexico Geological Society, 42nd Annual Field Conference, Guidebook, p. 7–9.
Mack, G.H., 2004, Middle and late Cenozoic crustal extension, sedimenta-tion, and volcanism in the southern Rio Grande Rift, Basin and Range, and southern Transition Zone of south-western New Mexico, in Mack, G.H. and Giles, K.A., eds., The geology of New Mexico: A geologic history, New Mexico Geological Society Special Publication 11, p. 389–406.
Mack, G.H., Fostor, R., and Tabor, N.J., 2012, Basin architecture of Pliocene-lower Pleistocene alluvial-fan and axial-fluvial strata adjacent to the Mud Springs and Caballo Mountains, Palomas half graben, southern Rio Grande Rift, in Lucas, S.G., McLemore, V.T., Lueth, V.W., Spielmann, J.A., and Krainer, K., eds., Geology of the warm springs region, New Mexico Geological Society Guidebook 63, p. 431–445.
Manley, K., 1979, Stratigraphy and struc-ture of the Española Basin, Rio Grande Rift, New Mexico, in Riecker, R.E., ed., Rio Grande Rift, Tectonics and mag-matism, Washington (DC): American Geophysical Union, p. 71–86.
McLean, J.S., 1970, Saline ground-water resources of the Tularosa Basin, New Mexico, U.S. Dept. of the Interior, Office of Saline Water Research and Development Progress Report 561. 128 p.
McLean, J.S., 1975, Saline ground water in the Tularosa Basin, New Mexico, in Seager, W.R., Clemons, R.E., Callender, J.F., eds., Las Cruces Country: New Mexico Geological Society 26th Annual Field Conference, Guidebook, p. 237–238.
Meinzer, O.E., 1911, Geology and water resources of Estancia Valley, New Mexico, US Geological Survey Water-Supply Paper 275, 89 p.
Meinzer, O.E., and Hare, R.E., 1915, Geology and water resources of the Tularosa Basin, New Mexico, US Geological Survey Water-Supply Paper 343, 317 p.
Motts, W.S., 1968, The control of ground-water occurrence by lithofacies in the Guadalupian reef complex near Carlsbad, New Mexico, Geological Society of America Bulletin 79: 283–298.
Myers, R.G., Everheart, J.T., and Wilson, C.A., 1994, Geohydrology of the San Agustin Basin, Alamosa Creek Basin upstream from Monticello Box, and upper Gila Basin in parts of Catron, Socorro, and Sierra Counties, New Mexico, US Geological Survey Water Resources Investigations Report 94-4125, 70 p.
Newton, T., Kludt, T., Love, D., and Mamer, E., 2015, Hydrogeology of cen-tral Jornada del Muerto: Implications for travel along El Camino Real de Tierra Adentro, Sierra and Doña Ana Counties, New Mexico, New Mexico Bureau of Geology and Mineral Resources Open-File Report 573, 55 p.
Nickerson, E.L., and Myers, R.G., 1993, Geohydrology of the Mesilla ground-water basin, Doña Ana County, New Mexico and El Paso County, Texas, US Geological Survey Water-Resources Investigations Report 92-4156, 89 p.
Orr, B.R. and Myers, R.G., 1986, Water resources in basin-fill deposits in the Tularosa Basin, New Mexico: U.S. Geological Survey, Water-Resources Investigations Report 85-4219, 94 p.
Person, M., Phillips, F., Kelley, S., Timmons, S., Pepin, J., Blom, L., Haar, K., and Murphy, M., 2013, Assessment of the sustainability of geothermal develop-ment within the Truth or Consequences hot-springs district, New Mexico, New Mexico Tech Open-File Report 551, 65 p.
Plummer, L.N., Bexfield, L.M., Anderholm, S.K., Sanford, W.E., and Busenberg, E., 2004, Geochemical characteriza-tion of ground-water flow in the Santa Fe Group aquifer system, Middle Rio Grande Basin, New Mexico, US Geological Survey Water-Resources Investigations Report 03-4131, 395 p.
Rawling, G.C., 2014, Hydrogeology of eastern Union County, New Mexico, New Mexico Geology 36 (4): 64–81.
Rawling, G.C., and Newton, B.T., 2016, Quantity and location of groundwater recharge in the Sacramento Mountains, south-central New Mexico (USA), and their relation to the adjacent Roswell Artesian Basin, Hydrogeology Journal, doi 10.1007/s10040-016-1399-6.
Rinehart, A., Mamer, E., Timmons, S., and Koning, D., 2015, Preliminary interpre-tation of water chemistry and ground-water levels in the eastern San Agustin Plains and upper Alamosa Creek, New Mexico, New Mexico Geological Society, Annual Spring Meeting, poster with abstract.
Roybal, F.E., 1991, Ground-water resources of Socorro County, New Mexico, US Geological Survey Water-Resources Investigations Report 89-4083, 37 p.
Sayre, A.N., and Livingston, P., 1945, Ground-water resources of the El Paso area, Texas, US Geological Survey Water-Supply Paper 919.

F R E S H A N D B R A C K I S H W A T E R Q U A L I T Y
49
Slichter, C.S., 1905, Observations on ground waters of the Rio Grande valley: U.S. Geological Survey Water-Supply and Irrigation Paper 141, 83 p.
Smith, R.E., 1957, Geology and ground-water resources of Torrance Co., New Mexico, New Mexico Bureau of Mines and Mineral Resources Ground-Water Report 5, 186 p.
Smith, G.A., 2004, Middle to late Cenozoic development of the Rio Grande Rift and adjacent regions in northern New Mexico, in Mack, G.H. and Giles, K.A., eds., The geology of New Mexico: A geologic history, New Mexico Geological Society Special Publication 11, p. 331–358.
Sophocleous, M., 2010, Groundwater management practices, challenges, and innovations in the High Plains aquifer, USA–lessons learned and recommended actions, Hydrogeology Journal 18, 559–575.
Stone, W.J., Lyford, F.P., Frenzel, P.F., Mizell, N.H., and Padgett, E.T., 1983, Hydrogeology and water resources of the San Juan Basin, New Mexico, New Mexico Bureau of Mines and Mineral Resources Hydrologic Report 6, 70 p.
Theis, C.V., 1938, Ground water in the middle Rio Grande valley, in Natural Resources Committee, Regional Planning part VI–the Rio Grande joint investigations in the upper Rio Grande basin in Colorado, New Mexico, and Texas, 1936–1937, v. 1, part 2: 268–291.
Thorn, C.R., McAda, D.P., and Kernodle, J.M., 1993, Geohydrologic frame-work and hydrologic conditions in the Albuquerque Basin, central New Mexico, US Geological Survey Water-Resources Investigations Report 93-4149, 106 p.
Titus, F.B., 1973, Hydrogeologic evalua-tion of Estancia Valley, a closed basin in central New Mexico, New Mexico Bureau of Mines and Mineral Resources Open-File Report OF-69, 184 p.
Titus, F.B., 1980, Ground water in the Sandia and northern Manzano Mountains, New Mexico, New Mexico Bureau of Mines and Mineral Resources Hydrologic Report 5, 66 p.
Trauger, F.D., 1972, Water resources and general geology of Grant County, New Mexico, New Mexico Bureau of Mines and Mineral Resources, Hydrologic Report 2, 211 p.
Weeks, J.B., Gutentag, E.D., Heimes, F.J., and Luckey, R.R., 1988, Summary of the high plains regional aquifer-system analysis in parts of Colorado, Kansas, Nebraska, New Mexico, Oklahoma, South Dakota, Texas, and Wyoming, US Geological Survey Professional Paper 1400-A, 30 p.
Welder, G.E., 1983, Geohydrologic frame-work of the Roswell Ground-Water Basin, Chaves and Eddy Counties, New Mexico: New Mexico State Engineer Technical Report 42, 28 p.
White, R.R., 1994, Hydrology of the Estancia Basin, central New Mexico, US Geological Survey Water-Resources Investigations Report 93-4163, 83 p.
White, W.N., 1931, Preliminary report on the ground-water supply of Mimbres Valley, New Mexico, US Geological Survey Water Supply Paper 637-B, p. 69–90.
Wilson, C.A., and White, R.R., 1984, Geohydrology of the central Mesilla Valley, Doña Ana County, New Mexico, US Geological Survey Water-Resources Investigations Report 82-444, 144 p.

N E W M E X I C O B U R E A U O F G E O L O G Y A N D M I N E R A L R E S O U R C E S
50
Geo ID Name Description
* Pennsylvanian rocks undivided Pennsylvanian rocks undivided
*lc Lead Camp Formation Lead Camp Formation (Atokan to Missourian) - Limestone
*m Madera Group Madera Group (Pennsylvanian)
*ps Panther Seep Formation Panther Seep Formation (VirgilianIn) - In Organ, Franklin, and San Andres Mountains
*s Sandia Formation Sandia Formation (Atokan) - Predominantly clastic unit (commonly arkosic) with minor black shales, and limestone in lower part
^ Triassic rocks, undivided Triassic rocks, undivided - Continental red beds
^b Bull Canyon Formation Bull Canyon Formation (Norian)
^c Chinle Group Chinle Group (Upper Triassic) - Map unit includes Moenkopi Formation (Middle Triassic) at base in many areas
^cu Upper Chinle Group, Garita Creek through Redonda Formations, undivided
Upper Chinle Group, Garita Creek through Redonda Formations, undivided (Upper Triassic)
^g Garita Creek Formation Garita Creek Formation (Carnian)
^m Moenkopi Formation Moenkopi Formation (Middle Triassic)
^r Redonda Formation Redonda Formation (Upper Triassic)
^rp Rock Point Formation of Chinle Group Rock Point Formation of Chinle Group (Upper Triassic) - May locally include Wingate Sandstone (Triassic)
^s Santa Rosa Formation Santa Rosa Formation (Carnian) - Includes Moenkopi Formation (Middle Triassic) at base in most areas
^t Trujillo Formation Trujillo Formation (Norian)
D Devonian rocks undivided Devonian rocks undivided - Includes Percha Shale, Onate, and Sly Gap Formations
J Upper and Middle Jurassic rocks, undivided Upper and Middle Jurassic rocks, undivided - In southwest includes the basalt-bearing Broken Jug Formation
Je Entrada Sandstone Entrada Sandstone (Middle Jurassic)
Jm Morrison Formation Morrison Formation - Upper Jurassic nonmarine rocks
Jmsu Morrison Formation and upper San Rafael Group Morrison Formation and upper San Rafael Group (lowermost Cretaceous? - upper Jurassic)
a P P e N d i x 1
Geologic map unit descriptions
The following table is an explanation of the geologic units (Geo ID) used on the maps within this report. The Geo ID is an abbreviation of the geologic map formation name, including the age of the formation. The table is grouped by age/symbology, for ease of use. The geologic maps were produced from the Geologic Map of New Mexico, New Mexico Bureau of Geology and Mineral Resources, 2003, Scale 1:500,000.
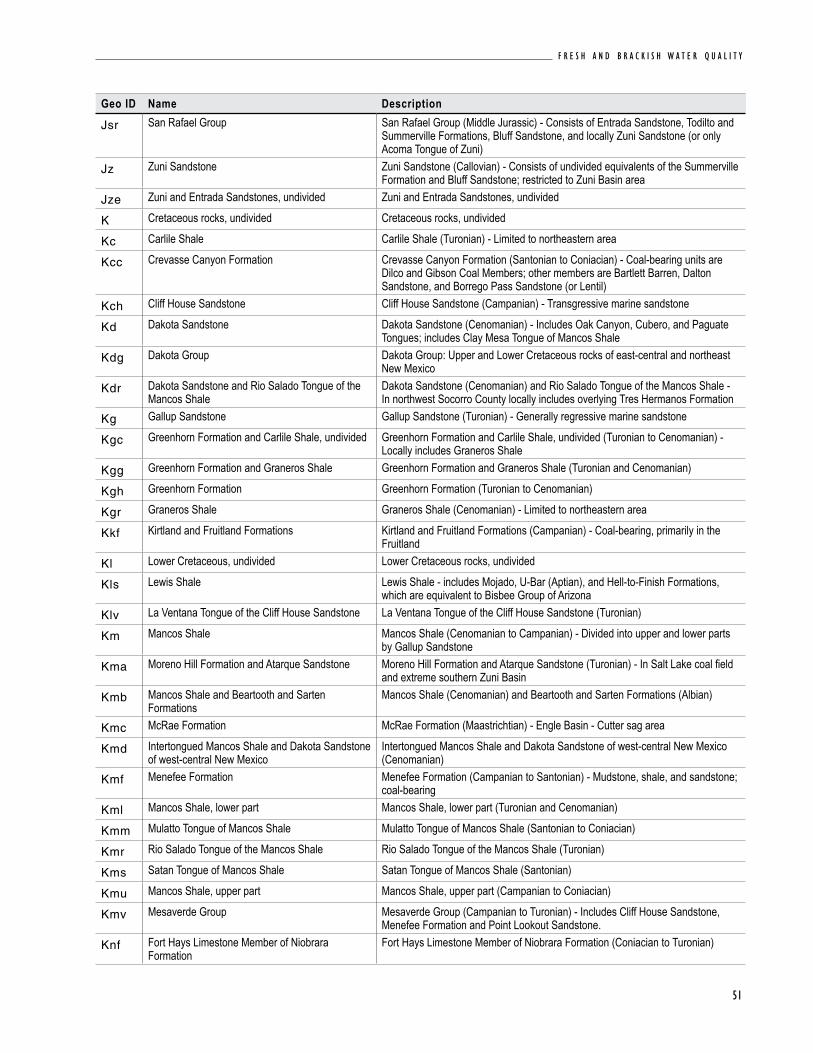
51
F R E S H A N D B R A C K I S H W A T E R Q U A L I T Y
Geo ID Name Description
Jsr San Rafael Group San Rafael Group (Middle Jurassic) - Consists of Entrada Sandstone, Todilto and Summerville Formations, Bluff Sandstone, and locally Zuni Sandstone (or only Acoma Tongue of Zuni)
Jz Zuni Sandstone Zuni Sandstone (Callovian) - Consists of undivided equivalents of the Summerville Formation and Bluff Sandstone; restricted to Zuni Basin area
Jze Zuni and Entrada Sandstones, undivided Zuni and Entrada Sandstones, undivided
K Cretaceous rocks, undivided Cretaceous rocks, undivided
Kc Carlile Shale Carlile Shale (Turonian) - Limited to northeastern area
Kcc Crevasse Canyon Formation Crevasse Canyon Formation (Santonian to Coniacian) - Coal-bearing units are Dilco and Gibson Coal Members; other members are Bartlett Barren, Dalton Sandstone, and Borrego Pass Sandstone (or Lentil)
Kch Cliff House Sandstone Cliff House Sandstone (Campanian) - Transgressive marine sandstone
Kd Dakota Sandstone Dakota Sandstone (Cenomanian) - Includes Oak Canyon, Cubero, and Paguate Tongues; includes Clay Mesa Tongue of Mancos Shale
Kdg Dakota Group Dakota Group: Upper and Lower Cretaceous rocks of east-central and northeast New Mexico
Kdr Dakota Sandstone and Rio Salado Tongue of the Mancos Shale
Dakota Sandstone (Cenomanian) and Rio Salado Tongue of the Mancos Shale - In northwest Socorro County locally includes overlying Tres Hermanos Formation
Kg Gallup Sandstone Gallup Sandstone (Turonian) - Generally regressive marine sandstone
Kgc Greenhorn Formation and Carlile Shale, undivided Greenhorn Formation and Carlile Shale, undivided (Turonian to Cenomanian) - Locally includes Graneros Shale
Kgg Greenhorn Formation and Graneros Shale Greenhorn Formation and Graneros Shale (Turonian and Cenomanian)
Kgh Greenhorn Formation Greenhorn Formation (Turonian to Cenomanian)
Kgr Graneros Shale Graneros Shale (Cenomanian) - Limited to northeastern area
Kkf Kirtland and Fruitland Formations Kirtland and Fruitland Formations (Campanian) - Coal-bearing, primarily in the Fruitland
Kl Lower Cretaceous, undivided Lower Cretaceous rocks, undivided
Kls Lewis Shale Lewis Shale - includes Mojado, U-Bar (Aptian), and Hell-to-Finish Formations, which are equivalent to Bisbee Group of Arizona
Klv La Ventana Tongue of the Cliff House Sandstone La Ventana Tongue of the Cliff House Sandstone (Turonian)
Km Mancos Shale Mancos Shale (Cenomanian to Campanian) - Divided into upper and lower parts by Gallup Sandstone
Kma Moreno Hill Formation and Atarque Sandstone Moreno Hill Formation and Atarque Sandstone (Turonian) - In Salt Lake coal field and extreme southern Zuni Basin
Kmb Mancos Shale and Beartooth and Sarten Formations
Mancos Shale (Cenomanian) and Beartooth and Sarten Formations (Albian)
Kmc McRae Formation McRae Formation (Maastrichtian) - Engle Basin - Cutter sag area
Kmd Intertongued Mancos Shale and Dakota Sandstone of west-central New Mexico
Intertongued Mancos Shale and Dakota Sandstone of west-central New Mexico (Cenomanian)
Kmf Menefee Formation Menefee Formation (Campanian to Santonian) - Mudstone, shale, and sandstone; coal-bearing
Kml Mancos Shale, lower part Mancos Shale, lower part (Turonian and Cenomanian)
Kmm Mulatto Tongue of Mancos Shale Mulatto Tongue of Mancos Shale (Santonian to Coniacian)
Kmr Rio Salado Tongue of the Mancos Shale Rio Salado Tongue of the Mancos Shale (Turonian)
Kms Satan Tongue of Mancos Shale Satan Tongue of Mancos Shale (Santonian)
Kmu Mancos Shale, upper part Mancos Shale, upper part (Campanian to Coniacian)
Kmv Mesaverde Group Mesaverde Group (Campanian to Turonian) - Includes Cliff House Sandstone, Menefee Formation and Point Lookout Sandstone.
Knf Fort Hays Limestone Member of Niobrara Formation
Fort Hays Limestone Member of Niobrara Formation (Coniacian to Turonian)

N E W M E X I C O B U R E A U O F G E O L O G Y A N D M I N E R A L R E S O U R C E S
52
Geo ID Name Description
Kpc Pictured Cliffs Sandstone Pictured Cliffs Sandstone (Campanian) - Prominent, cliff-forming marine sandstone
Kpg Pescado Tongue of the Mancos Shale and Gallup Sandstone
Pescado Tongue of the Mancos Shale and Gallup Sandstone (Turonian) - In Zuni Basin only; Pescado is chronostratigraphic equivalent of Juana Lopez Member of Mancos Shale
Kph Hosta Tongue of Point Lookout Sandstone Hosta Tongue of Point Lookout Sandstone (Santonian) - Transgressive marine sandstone
Kpl Point Lookout Sandstone Point Lookout Sandstone (Campanian to Santonian) - Regressive marine sandstone
Kpn Pierre Shale and Niobrara Formation Pierre Shale and Niobrara Formation (Campanian to Coniacian)
Kth Tres Hermanos Formation Tres Hermanos Formation (Turonian) - Formerly designated as lower Gallup Sandstone in the Zuni Basin
Ku Upper Cretaceous Rocks of southwestern New Mexico, undivided
Upper Cretaceous rocks of southwestern New Mexico, undivided (Maastrichtian to Cenomanian for most part, although Beartooth and Sarten Formations are in part Albian)
Kvt Vermejo Formation and Trinidad Sandstone Vermejo Formation and Trinidad Sandstone (Maastrichtian to Campanian)
M Mississippian rocks, undivided Mississippian rocks, undivided - Arroyo Penasco Group; Lake Valley Limestone in south-central New Mexico
M_ Mississippian through Cambrian rocks, undivided Mississippian through Cambrian rocks, undivided
MD Mississippian and Devonian rocks, undivided Mississippian and Devonian rocks, undivided
O_ Ordovician and Cambrian rocks, undivided Ordovician and Cambrian rocks, undivided - Includes Montoya Formation (or Group), El Paso Formation, and Bliss Sandstone
O_p Ordovician and Cambrian plutonic rocks of Florida Mountains
Ordovician and Cambrian plutonic rocks of Florida Mountains
P Permian rocks, undivided Permian rocks, undivided
P* Permian and Pennsylvanian rocks, undivided Permian and Pennsylvanian rocks, undivided - Includes Concha, Scherrer, Colina, Epitaph, and Earp Formations (Permian) and Horquilla Limestone (Permian to Pennsylvanian)
P*sc Sangre de Cristo Formation Sangre de Cristo Formation (Wolfcampian to Desmoinesian)
Pa Abo Formation Abo Formation (Wolfcampian) - Red beds, arkosic at base, finer and more mature above
Pal Lower part of Abo Formation Lower part of Abo Formation (locally Virgilian to Upper Pennsylvanian)
Pat Artesia Group Artesia Group (Guadalupian) - Shelf facies forming broad south-southeast trending outcrop from Glorieta to Artesia area; includes Tansill, Yates, Seven Rivers, Queen and Grayburg Formations (Guadalupian)
Pau Upper part of Abo Formation Upper part of Abo Formation (Wolfcampian)
Pb Bursum Formation Bursum Formation (lowermost Permian to uppermost Pennsylvanian) - Shale, arkose, and limestone
Pbc Bell Canyon Formation Bell Canyon Formation (Guadalupian) - Basin facies: sandstone, limestone, and shale
Pc Castile Formation Castile Formation (Upper Permian) - Dominantly anhydrite sequence
Pcc Cherry Canyon Formation Cherry Canyon Formation (Guadalupian) - Basin facies: sandstone, limestone, and shale
Pco Cutoff Shale Cutoff Shale (Leonardian) - In Brokeoff Mountains only
Pcp Capitan Formation Capitan Formation (Guadalupian) - Limestone (reef facies)
Pct Cutler Formation Cutler Formation (Wolfcampian to Upper Pennsylvanian) - Used in northern areas and Chama embayment only
Pg Glorieta Sandstone Glorieta Sandstone (Leonardian) - Texturally and mineralogically mature, high-silica quartz sandstone
Ph Hueco Formation (or Group) Hueco Formation or Group (Wolfcampian) - Limestone
Playa Playa deposits Alluvium and evaporite deposits (Holocene)

53
F R E S H A N D B R A C K I S H W A T E R Q U A L I T Y
Geo ID Name Description
Pqg Queen and Grayburg Formations Queen and Grayburg Formations (Guadalupian) - Sandstone, gypsum, anhydrite, dolomite, and red mudstone
Pqm Quartermaster Formation Quartermaster Formation (Upper Permian) - Red sandstone and siltstone
Pqr Quartermaster and Rustler Formations Quartermaster and Rustler Formations (Upper Permian)
Pr Rustler Formation Rustler Formation (Upper Permian) - Siltstone, gypsum, sandstone, and dolomite
Psa San Andres Formation San Andres Formation (Guadalupian in south, in part Leonardian to north) - Limestone and dolomite with minor shale
Psg San Andres Limestone and Glorieta Sandstone San Andres Limestone and Glorieta Sandstone (Guadalupian and Leonardian)
Psl Salado Formation Salado Formation (Upper Permian) - Evaporite sequence, dominantly halite
Psr Seven Rivers Formation Seven Rivers Formation (Guadalupian) - Gypsum, anhydrite, salt, dolomite, and siltstone
Psy San Andres, Glorieta, and Yeso Formations, undivided
San Andres, Glorieta, and Yeso Formations, undivided
Pty Tansill and Yates Formations Sandstone, siltstone, limestone, dolomite, and anhydrite
Pvp Victorio Peak Limestone Victorio Peak Limestone (Leonardian) - In Brokeoff Mountains only
Py Yeso Formation Yeso Formation (Leonardian) - Sandstones, siltstones, anhydrite, gypsum, halite, and dolomite
Pz Paleozoic rocks, undivided Paleozoic rocks, undivided
Qa Alluvium Alluvium (Holocene to upper Pleistocene)
Qb Basaltic to andesitic lava flows Basaltic to andesitic lava flows (Holocene to middle Pleistocene)
Qbo Basaltic to andesitic lava flows Basaltic to andesitic lava flows (middle to lower Pleistocene) - Includes vent deposits
Qbt Bandelier Tuff Bandelier Tuff (lower Pleistocene) - Includes large blocks of older andesite in caldera-collapse breccia facies locally exposed on resurgent dome of the Valles caldera
Qd Glacial deposits; till and outwash Glacial deposits; till and outwash (upper to middle Pleistocene)
Qe Eolian deposits Eolian deposits (Holocene to middle Pleistocene)
Qeg Gypsiferous eolian deposits Gypsiferous eolian deposits (Holocene to middle Pleistocene)
Qep Eolian and piedmont deposits Eolian and piedmont deposits (Holocene to middle Pleistocene) - Interlayed eolian sands and piedmont-slope deposits
Ql Landslide deposits and colluvium Landslide deposits and colluvium (Holocene to Pleistocene) - Landslide deposits on western flanks of Socorro Mountains not shown for clarity
Qoa Older alluvial deposits of upland plains and piedmont areas, and calcic soils and eolian cover sediments of High Plains region
Older alluvial deposits of upland plains and piedmont areas, and calcic soils and eolian cover sediments of High Plains region (middle to lower Pleistocene)
Qp Piedmont alluvial deposits Piedmont alluvial deposits (Holocene to lower Pleistocene)
Qpl Lacustrine and playa deposits Lacustrine and playa deposits (Holocene) - Includes associated alluvial and eolian deposits of major lake basins
Qr "Older rhyolite lavas and early volcaniclastic sedi-mentary fill deposits of the Valles caldera"
Older rhyolite lavas and early volcaniclastic sedimentary fill deposits of the Valles caldera (lower Pleistocene)
QTb Basaltic to andesitic lava flows Basaltic to andesitic lava flows (upper Pleistocene to lower Pliocene) - Includes minor vent deposits
QTg Gila Group, Formation, or Conglomerate Gila Group, Formation, or Conglomerate (middle Pleistocene to uppermost Oligocene?) - Includes Mimbres Formation and several informal units in south-western basins
QTp Older piedmont alluvial deposits and shallow basin fill
Older piedmont alluvial deposits and shallow basin fill (middle Pleistocene to uppermost Pliocene) - Includes Quemado Formation and in northeast, high-level pediment gravels
QTs Upper Santa Fe Group Upper Santa Fe Group (middle Pleistocene to uppermost Miocene)
QTsf Santa Fe Group, undivided Santa Fe Group, undivided (middle Pleistocene to uppermost Oligocene) - Basin fill of the Rio Grande rift

N E W M E X I C O B U R E A U O F G E O L O G Y A N D M I N E R A L R E S O U R C E S
54
Geo ID Name Description
QTt Travertine Travertine (Holocene to Pliocene) - Includes some pedogenic carbonate south of Sierra Ladrones
Qv Basaltic tephra and lavas near vents Basaltic tephra and lavas near vents (upper to middle Pleistocene) - Tuff rings, maars, cinder cones, and minor proximal lavas. Includes maars at Kilbourne Hole and Zuni Salt Lake
Qvr Ring-fracture rhyolite lava domes of the Valles caldera
Ring-fracture rhyolite lava domes of the Valles caldera (uppermost to lower Pleistocene)
SO Silurian and Ordovician rocks, undivided Silurian and Ordovician rocks, undivided
SO_ Silurian through Cambrian rocks, undivided Silurian through Cambrian rocks, undivided
Tc Chuska Sandstone Chuska Sandstone (middle to upper Oligocene) - Restricted to Chuska Mountains
Tfl Fence Lake Formation Fence Lake Formation (Miocene) - Conglomerate and conglomeratic sandstone, coarse fluvial volcaniclastic sediments, minor eolian facies, and pedogenic carbon-ates of the southern Colorado Plateau region
Thb Hinsdale Basalt Hinsdale Basalt (Miocene and upper Oligocene) - Northern Taos and eastern Rio Arriba Counties; basalt flows interbedded with Los Pinos
Ti Tertiary intrusive rocks of intermediate to silicic composition
Tertiary intrusive rocks of intermediate to silicic composition (Pliocene to Eocene)
Tim Tertiary mafic intrusive rocks Tertiary mafic intrusive rocks (Pliocene to upper Eocene)
TKa Animas Formation Animas Formation (Paleocene and Upper Cretaceous) - Volcaniclastic sedimen-tary rocks of intermediate composition in northern San Juan Basin
TKav Tertiary-Cretaceous andesitic to dacitic lavas and pyroclastic breccias
Tertiary-Cretaceous andesitic to dacitic lavas and pyroclastic breccias (Paleocene and Upper Cretaceous)
TKi Tertiary-Cretaceous intrusive rocks Tertiary-Cretaceous intrusive rocks (Paleocene and Upper Cretaceous
TKpc Poison Canyon Formation Poison Canyon Formation (Paleocene and Upper Cretaceous) - Proximal con-glomerates and sandstones
TKpr Poison Canyon and Raton Formations Poison Canyon and Raton Formations (Paleocene and Upper Cretaceous) - Broadly intertonguing conglomeratic sandstones, sandstones and mudstones; minor coal beds
TKr Raton Formation Raton Formation (Paleocene and Upper Cretaceous) - Distal sandstones, mudstones, and coal beds in eastern Raton Basin. Middle barren zone laterally equivalent to Poison Canyon Formation.
Tla Lower middle Tertiary andesitic to dacitic lavas and pyroclastic flow breccias
Lower middle Tertiary andesitic to dacitic lavas and pyroclastic flow breccias (upper to middle Eocene, 33-43 Ma)
Tlp Los Pinos Formation of lower Santa Fe Group Los Pinos Formation of lower Santa Fe Group (Miocene and upper Oligocene)
Tlrf Lower middle Tertiary rhyolitic lavas and local tuffs Lower middle Tertiary rhyolitic lavas and local tuffs (lower Oligocene to upper Eocene, 36-31Ma) - Includes Mimbres Peak Formation, rhyolite of Cedar Hills, and other units in the Bootheel region
Tlrp Lower middle Tertiary rhyolitic to dacitic pyroclastic rocks of the Datil Group, ash-flow tuffs
Lower middle Tertiary rhyolitic to dacitic pyroclastic rocks of the Datil Group, ash-flow tuffs (lower Oligocene to upper Eocene, 31-36 Ma)
Tlv Lower middle Tertiary volcanic rocks Lower middle Tertiary volcanic rocks (lower Oligocene to upper Eocene, older than 31 Ma) - Mostly intermediate lavas of the lower Datil Group and intermediate volcaniclastic sediments of the lower Spears Group (Tla + Tvs)
Tmb Basaltic to andesitic lava flows Basaltic to andesitic lava flows (Miocene) - Includes minor vent deposits. Flows are commonly interbedded in the Santa Fe and Gila Groups
Tn Nacimiento Formation Nacimiento Formation (Paleocene) - San Juan Basin
Tnb Basaltic to andesitic lava flows Basaltic to andesitic lava flows (Neogene) - Includes minor vent deposits. Flows are commonly interbedded in the Santa Fe and Gila Groups
Tnr Silicic to intermediate volcanic rocks Silicic to intermediate volcanic rocks (Neogene, mostly Miocene) - Rhyolite and dacite flows with associated minor tuffs.
Tnv Intermediate to silicic volcanic rocks Intermediate to silicic volcanic rocks (Neogene) - Mostly andesitic to dacitic stratovolcanoes.
To Ogallala Formation Ogallala Formation (lower Pliocene to middle Miocene) - Alluvial and eolian depos-its, and petrocalcic soils of the southern High Plains. Locally includes Qoa

55
F R E S H A N D B R A C K I S H W A T E R Q U A L I T Y
Geo ID Name Description
Toa Ojo Alamo Formation Ojo Alamo Formation (Paleocene) - San Juan Basin
Tpb Basaltic to andesitic lava flows Basaltic to andesitic lava flows (Pliocene) - Includes minor vent deposits and small shield volcanoes. Flows are commonly interbedded in the Santa Fe and Gila Groups
Tps Paleogene sedimentary units Paleogene sedimentary units - Includes Baca, Galisteo, El Rito, Blanco Basin, Hart Mine, Love Ranch, Lobo, Sanders Canyon, Skunk Ranch, Timberlake, and Cub Mountain Formations
Tsf Lower Santa Fe Group Lower Santa Fe Group (upper Miocene to uppermost Oligocene) - Includes Hayner Ranch, Rincon Valley, Popotosa, Cochiti, Tesuque, Chamita, Abiquiu, Zia, and other formations
Tsj San Jose Formation San Jose Formation (Eocene) - San Juan Basin
Tual Lower-upper middle Tertiary basaltic andesites and andesites of the Mogollon Group
Lower-upper middle Tertiary basaltic andesites and andesites of the Mogollon Group (upper Oligocene, 26-29 Ma)
Tuau Upper middle Tertiary basaltic andesites and andesites of the Mogollon Group
Upper middle Tertiary basaltic andesites and andesites of the Mogollon Group (lower Miocene and uppermost Oligocene, 22-26 Ma)
Turf Upper middle Tertiary rhyolitic lavas and local tuffs Upper middle Tertiary rhyolitic lavas and local tuffs (upper Oligocene, 24-29 Ma)
Turp Upper middle Tertiary rhyolitic pyroclastic rocks of the Mogollon Group, ash-flow tuffs
Upper middle Tertiary rhyolitic pyroclastic rocks of the Mogollon Group, ash-flow tuffs (upper Oligocene, 24-30 Ma)
Tus Upper Tertiary sedimentary units Upper Tertiary sedimentary units (Pliocene to upper Oligocene)
Tuv Upper middle Tertiary volcanic rocks Upper middle Tertiary volcanic rocks (lower Miocene to upper Oligocene, younger than 30 Ma) - Mostly a combination of basaltic andesite lavas and rhyolitic ash-flow tuffs
Tv Middle Tertiary volcanic rocks Middle Tertiary volcanic rocks, undifferentiated (lower Miocene to upper Eocene)
Tvs Middle Tertiary volcaniclastic sedimentary units Middle Tertiary volcaniclastic sedimentary units (Oligocene to upper Eocene) - Mostly syneruptive volcaniclastic sedimentary aprons
Water Water Perenial standing water
Xg Paleoproterozoic granitic plutonic rocks Paleoproterozoic granitic plutonic rocks - Variably foliated granites and granitic gneisses; 1.71-1.65 Ga in northern New Mexico; 1.66-1.65 Ga in central and southern New Mexico
Xpc Paleoproterozoic calc-alkaline plutonic rocks Paleoproterozoic calc-alkaline plutonic rocks - Granodiorite, diorite, and gabbro complexes; 1.78-1.71 Ga; interpreted to be intrusive part of juvenile volcanic arc basement
Xps Paleoproterozoic pelitic schist Paleoproterozoic pelitic schist - Includes Rinconada Formation in northern New Mexico and Blue Springs Schist in Manzano Mountains
Xq Paleoproterozoic quartzite Paleoproterozoic quartzite - Includes ~1.70 Ga Ortega Quartzite and equivalents in northern New Mexico and ~1.67 Ga quartzites in central New Mexico
Xs Paleoproterozoic metasedimentary rocks Paleoproterozoic metasedimentary rocks - Pelitic schist, quartz-muscovite schist, immature quartzite, and subordinate amphibolite
Xvf Paleoproterozoic rhyolite and felsic volcanic schist Paleoproterozoic metarhyolite and felsic volcanic schist - Includes 1.70 Ga Vadito Group in northern New Mexico and ~1.68 Ga Sevilleta Metarhyolite in central New Mexico
Xvm Paleoproterozoic mafic metavolcanic rocks with subordinate felsic metavolcanic rocks
Paleoproterozoic mafic metavolcanic rocks with subordinate felsic metavolcanic rocks
Yg Mesoproterozoic granitic plutonic rocks "Mesoproterozoic granitic plutonic rocks - Mainly 1.45-1.35 Ga megacrystic gran-ites, generally weakly foliated except locally at their margins"
Ys Mesoproterozoic sedimentary rocks Mesoproterozoic sedimentary rocks - Exposed in Sacramento Mountains, present in subsurface in southeastern New Mexico as De Baca Group
YXp Mesoproterozoic and Paleoproterozoic plutonic rocks, undivided
Mesoproterozoic and Paleoproterozoic plutonic rocks, undivided

New Mexico Bureau of Geology and Mineral Resources A division of New Mexico Institute of Mining and Technology Socorro, NM 87801(575) 835 5490 Fax (575) 835 6333geoinfo.nmt.edu