Embed Size (px)
Citation preview
Open Cluster Distance Moduli
ARTHUR A. HOAG
U.S. Naval Observatory, Flagstaff Station, Flagstaff, Arizona, U.S.A.
1. INTRODUCTION
Photoelectric observations of H~-line equivalent widths of the brighter stars in a number of open Clusters have been made in a manner described by CRAW~ORD (1958). Intermediate band width (150 A half-width), and narrow band width (30/k half-width), interference filters were used. Details of the observational work are published elsewhere (HoAG and APPLEQUIST, 1965). Absolute magnitudes were derived from the observed equivalent widths and spectral classifications by means of a calibration prepared by PETRIE (1964). These absolute magnitude estimates, together with conventional corrections for absorption, can be used to assign cluster moduli. I t is my purpose to compare moduli derived in this way with moduli est- mated by the standard zero-age main sequence method.
2. COMPARISON OF ESTIMATES OF OPEN CLUSTER MODULI
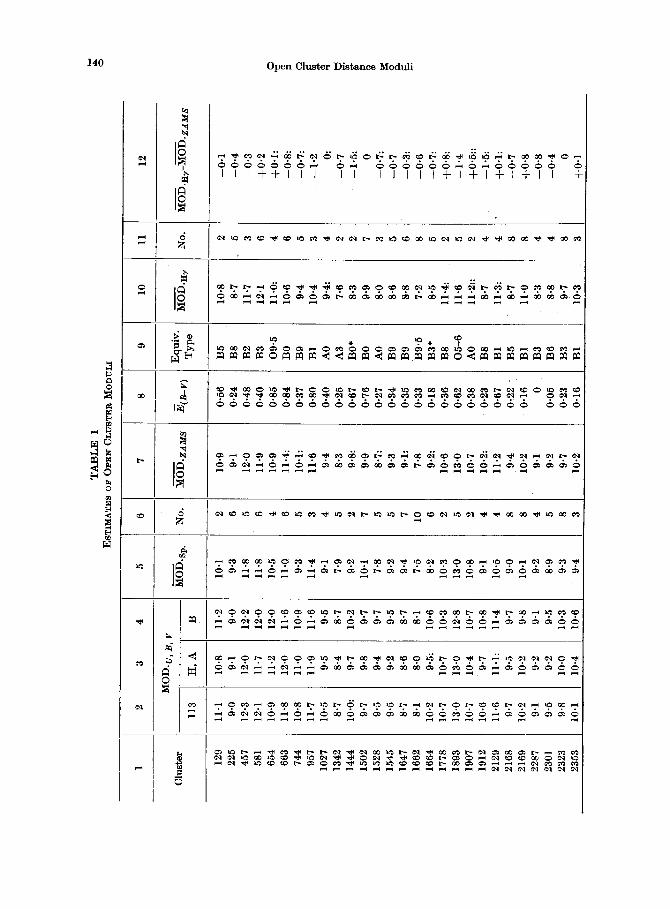
Various estimates of cluster moduli,: together with additional information, are given in Table 1 as follows:
Column 1 Cluster identifieation~ NGC, IC, or Trumpler designation.
Column 2 Zero-age main sequence modulus, JOHNSON et al. (1961) (Lowell Obs. Bull., No. 113).
Column 3 Zero-age main sequence modulus, I-IOAG and APPLEQUIST (1965).
Column 4 Zero-age main sequence modulus, BECKER (1963).
Column 5 Mean modulus derived from two-dimensional classification of spectro- grams and the I~K luminosity calibration published by JOHNSON and IRIARTE (1958).
Column 6 The number of cluster members for which spectrograms were avail- able.
Column 7 The mean zero-age main sequence modulus (ZAMS) derived from the results given in columns 2 through 5. The weighing system used was based on the concord of the U, B, V modulus estimates and the number of individual spectrographic modulus estimates.
Column 8 The mean color excess from U, B, V and spectrographic determina- tions (HoAG and APPLEQUIST, 1965).
Column 9 The equivalent type of the bluest stars on the main sequence, JOHNSON et al. (1961) with revisions from HOAG and APPLEQUIST (1965) marked by asterisks.
139
2 3
4
129
225
457
581
654
663
744
957
1027
13
42
1444
15
02
1528
15
45
1647
16
62
1664
17
78
1893
19
07
1912
21
29
2168
21
69
2287
23
01
2323
23
53
TA
BL
E
1 E
ST
IMA
TE
S O
F O
PE
N C
LU
ST
ER
I~
OD
UL
I
6
MO
D. U
, B,
v ..
...
MO
D. S
p.
113
H,
A
B
11.1
10
.8
11.2
10
.1
9.0
9.1
9-0
9.3
12.3
12
.0
12-2
11
.8
12.1
11
.7
12.0
11
.8
10.9
11
.2
12.0
10
.5
11.8
12
.0
11.6
11
.0
10.8
lI
.O
10.9
9.
3 11
.7
11.9
11
.6
11.4
10
.5
9.5
9.5
9.1
8.7
8-4
8.7
7-9
10.0
: 9-
7 10
.2
9.2
9.7
9.8
9-7
10.1
9.
5 9.
4 9.
7 7.
8 9.
5 9.
2 9.
5 9.
2 8-
7 8.
6 8.
7 9.
4 8.
1 8"
0 8.
1 7.
5 10
.2
9.5:
10
-6
8.2
10.7
10
.7
10.3
10
.3
13.0
13
.0
12.8
13
.0
10-7
10
.4
10.7
10
.8
10.6
9.
7 10
.8
9.1
11.6
li
d:
11.4
10
.5
9.7
9.5
9.7
9.0
10-2
10
.2
9.8
10.1
9.
1 9.
2 9-
1 9.
2 9-
5 9.
2 9.
5 8-
9 9.
8 10
.0
10-3
9.
3 10
.1
10.4
10
.6
9.4
No
.
7 8
9 10
11
MO
D.z
AM
S
E(B-
V)
2 6 5 6 4 6 5 3 4 5 2 7 5 5 7 10 6 2 5 2 4 4 8 8 4 5 8 3
Eq
uiv
. T
yp
e
10.9
0"
56
9.1
0.24
12
.0
0.48
11
.9
0.4
0
10-9
0.
85
11.4
: 0
.84
10
.1:
0"37
11
.6
0.80
9.
4 0.
40
8"3
0.25
9-
8:
0.67
9.
9 0.
76
8.7:
0.
27
9"3
0.34
9.
1:
0.35
7.
8 0.
33
9.2:
0.
18
10.6
0-
36
13.0
0.
62
10.7
0.
38
10-2
:0.2
3 11
.2
0.67
9.
4 0,
22
10.2
0
.16
9.
1 0
9.2
0.05
9-
7 0,
23
10.2
0.
16
MO
D.H
v
B5
B
8
B2
B
3
09
.5
B0
B
9
B1
A0
A
3
B0
*
B0
A
0
B9
B
9
B9
.5
B3
*
B8
0
5-6
A
0
B8
B
1 B
5
B1
B3
B
6
B3
B
1
No
.
10"8
8"
7 11
"7
12"1
11
"0:
10"6
9"
4 10
"4
9"4:
7"
6 8"
3 9
'9
8"0
8"6
8"8
7"2
8"5
11"4
: 11
"6
11"2
:: 8"
7 11
"3:
8"7
11"0
8"
3 8"
8 9"
7 10
"3
12
2 5 3 6 4 6 5 3 4 2 2 7 3 5 6 8 5 2 5 2 4 4 8 8 4 4 8 3
--0
"1
--0
"4
--0
"3
+0
"2
+0
"1:
--0
"8:
--0
"7:
--1
"2 0:
--0
"7
--1
"5: 0
--0
"7:
--0
"7
--0
.3:
--0
.6
--0
.7:
+0
"8:
--1
.4
+0
.5::
--
1.5
: +
0.1
: --
0.7
+
0.8
--0
.8
--0
.4 0
+0
-1
MOD.Hv-MOD.zAM 8
Clu
ster
O
o O
TA
BL
E
1---
--~o
nt~.
Clu
ster
2422
2--
3
4 5
MO
D.u
B
v
l:I,
19
'j
MO
D'g
p"
113
B
8-4
8"
8.4
8.3
I
6475
7.
0 64
94
9.1
6531
10
.5
6611
12
.0
6694
10
-9
6709
9.
8 67
55
11.3
68
02
10.2
68
23
11.I
68
30
11-2
68
34
12.4
68
71
11-2
68
82
8.9
6910
li
d
6913
10
.3
6940
9.
5 70
31
10-3
70
63
9.0
7067
12
.3
7128
12
.0
7160
9.
6 72
09
9.8
7235
12
.4
7380
11
.6
7510
12
.6
7654
11
.6
IC 1
805
11.6
IC
184
8 11
-7
IC 4
996
10.9
T
R2
8.
8
7.1
6"8
6.8
9.1
8.2
8"0
10.6
10
.6
10.8
12
.0
11.2
11
.7
11.0
10
.8
10-6
10
.0
9.8
10.2
10
.7
11-0
]0
.4:
9.8
9-6
9.9
12.4
12
-0
12-1
10
.7
10.8
10
.2
11-9
11
.7
11-2
11
.0
11.9
12
.2
8.6
8.9
8.8
11.0
11
-0
11.4
10
.2
10.5
11
.5
8"8,
9"
8 9"
3 10
"0
9"8
9"0
9"0
9"0
9"5
12.4
13
"0
11.7
12
.1
11.8
12
"5
10.1
9.
2 9"
8 9.
9 9"
6 9.
7 12
-9
12.9
12
.1
11.6
11
.9
12.3
12
.5
12.3
11
.0
11.1
11
.0
9.8
11-4
]1
.9
11.9
11
-7
11.8
11
.2
11.0
11
.2
11-8
9.
1 8.
8 9.
2
6 4 1 9 3 9 5 0 2 1 6 4 2 8 3 6 5 2 3 5 3 4 8 3 7 3 3 7 9 4 4 10
MOD.zAM8
8.4
6.9
8.4:
10
"7
11.8
10
.8
10"0
10
.9
9.9
12.2
10
.6
11.6
11
.6:
8.9
11.2
10
.8:
9"5
9.
8 9"
2 12
.2
12.0
9.
7 9-
8 12
.6
11-9
12
.2
11.0
11
.7
11.6
11
.2
8"9
8 ~(B-V
)
0.07
0.
07
0.34
0.
27
0.78
0.
55
0.28
0-
90
0-83
0.
82
0.51
0.
56
0.46
0.
07
1.08
1-
07
0.21
0.
98
0.07
0.
92
1.05
0.
35
0-18
0-
90
0.58
1.
08
0-67
0.
81
0.62
0.
63
0.30
9
Eq
~v
. T
yp
o
B4
B8
B9
09
-5
05
B
5 B
5 B
8:
B6
O9
B0
B
2 B
0
B5*
B
0 B
0 B
g*
B
6*
B8
B1
B2
0
9.5
A
0 B
0 0
9
09
B
3 0
5
09
B
I*
B6
I0
MOD.Hy
8.0
6.0
7-7
10.0
11
.2:
10.3
10
.0
9.6:
9.
3 11
,5
10'5
9.
3 9.
8 8.
8 10
.1
9.4
8.6
8.5
9.4
11.8
11
.3
9.5
8.5
11,5
11
.0:
11:5
10
-7
11-0
10
.0:
10,3
8.
8
ll
~o.
4 11 8 13 9 5 10 2 1 6 4 2 8 3 6 5 2 3 5 1 3 8 3 7 3 3 7 9 4 4 10
12
MO
D.t
Iy-M
OD
.zA
M8
--0"
4 --
0"9
--0"
7:
--0"
7 --
0"6:
--
0-5 0
--1
.3:
--0"
6 --
0"7
--0"
1 --
2"3
--1"
8 --
0"1
--1-
1 --
1,4
: --
0"9
--1
'3
+0
.2
--0
.4
--0
.7
--0
.2
--1
.3
--1.
1 --
0.9
; --
0.7
--
0.3
--
0-7
--1.
6:
--0
;9
--0.
1
O c~
i42 Open Cluster Distance Moduli
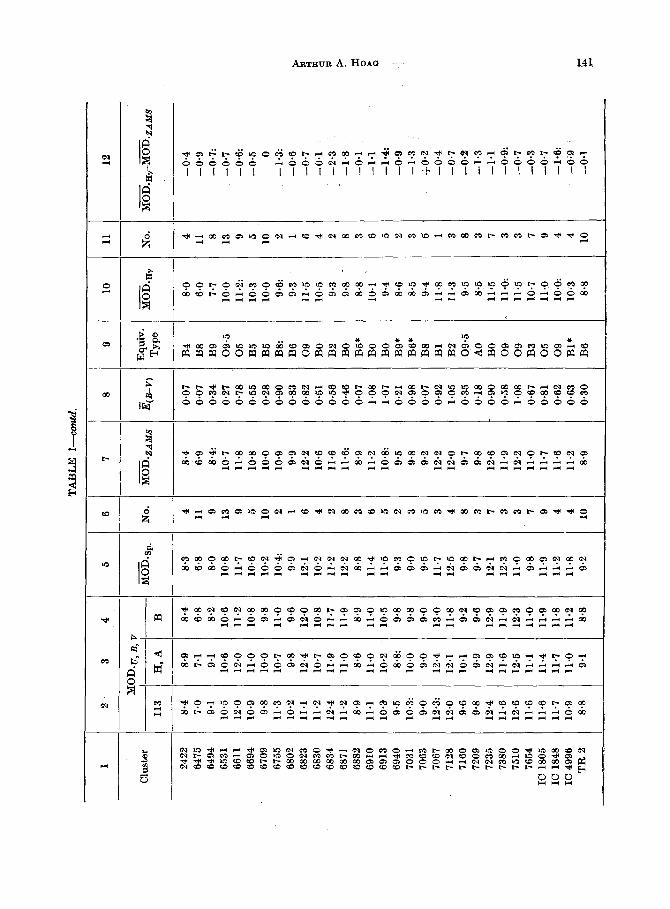
Column 10 Mean moduli based on absolute magnitudes of individual members determined by photoelectric H 7 observations and the calibration b y P E T R I E (1964).
Column 11 Number of members for which WH~ was observed.
Column 12 Column 10 minus Column 7.
Intercomparison of the three separate estimates of moduli in columns 2, 3, and 4 of Table 1 results in the following relations:
MOD.113 -l~IOD.Beck~ ~ +0"03 _+ 0"40 (m.e.)
I~IOD.~,A-I~IOD.B~ke r --: --0"05 + 0'42 (m.e.)
The systematic differences are small and the mean square error for one difference is about what should be expected from the uncertainties of the methods employed.
0 5 - -
Dist"ribution B 0 - - in Equivolen't T y p e B 5 - -
A O - -
=( B - V)
__ Meon Difference
0 5
m • - I
t 7
B
0,21
- 0 , 4 9
0 5
0.52
- 0 . 4 2
0 . 6 9
-- 0 . 8 9
. . . . . r - - - ~ - ~ - l'--.....-- __ " - L ~ •
[ " _
t [ I tl I 8 9 I0 II 12 M O D z A M S
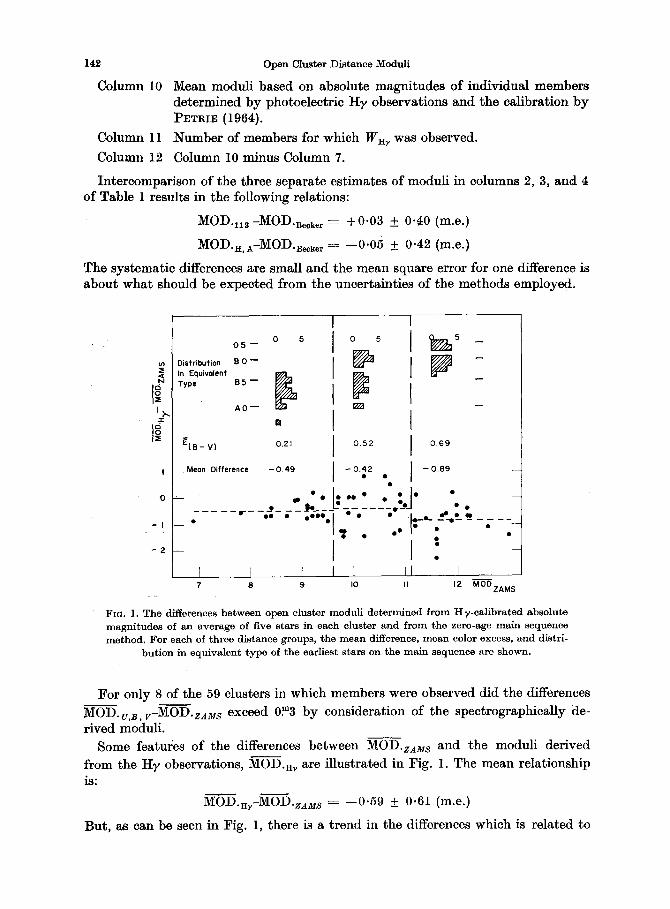
FIo. l. The differences between open cluster moduli determined f rom H~,-calibrated absolute magni tudes of an average of five s tars in each cluster and f rom the zero-age main sequence method. Fo r each of three distance groups, the mean difference, mean color excess, and distri-
but ion in equivalent type of the earliest s tars on the main sequence are shown.
For only 8 of the 59 clusters in which members were observed did the differences
~¢IOD. v,B, v-MOD.z~Ms exceed 0.~3 by consideration of the spectrographically de- rived moduli.
Some features of the differences between MOD.z~Ms and the moduli derived from the Hy observations, MOD.~y are illustrated in Fig. 1. The mean relationship is:
MO]).m,-MOD.zAMs ~-- --0.59 + 0.61 (m.e.)
But, as can be seen in Fig. 1, there is a trend in the differences which is related to
ARTHUR A. HOAO 143
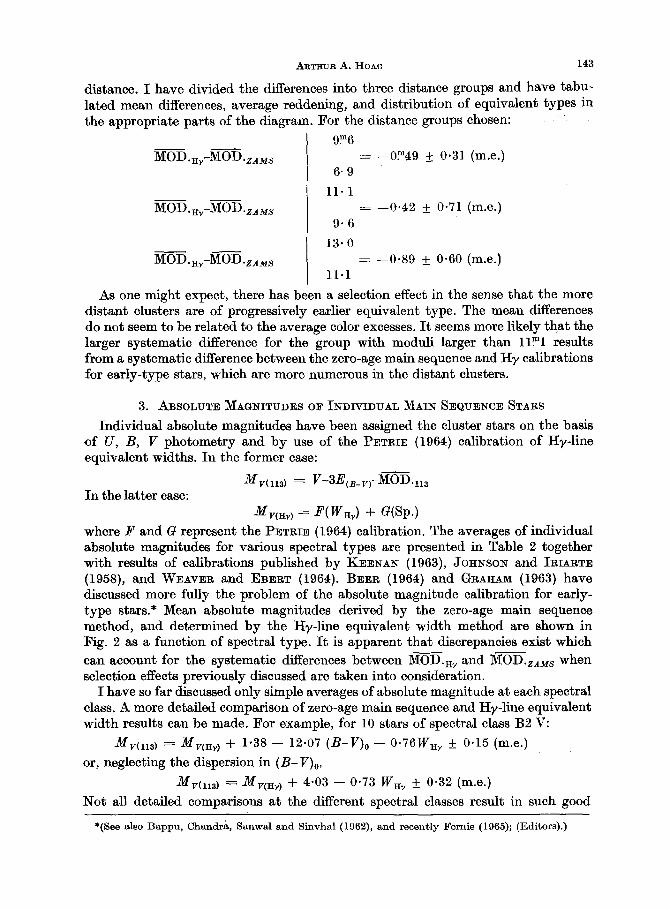
distance. I have divided the differences into three distance groups and have tabu- lated mean differences, average reddening, and distribution of equivalent types in the appropriate parts of the diagram. For the distance groups chosen:
9.m6 ~¢[OD.rt-MOD.zAMS = - -0 .~9 + 0"31 (m.e.)
6.9
]V[OD.Hv-~O:D.zaMS
~¢[O]).m,-MOD.zAMS
11"1
9 .6
13.0
: --0.42 + 0.71 (m.e.)
=- --0.89 +_ 0-60 (m.e.) 11"1
As one might expect, there has been a selection effect in the sense that the more distant clusters are of progressively earlier equivalent type. The mean differences do not seem to be related to the average color excesses. I t seems more likely that the larger systematic difference for the group with moduli larger than 11.~1 results from a systematic difference between the zero-age main sequence and I-Iy calibrations for early-type stars, which arc more numerous in the distant clusters.
3. ABSOLUTE ~AGNITUDES OF I N D M D U A L M A ~ SEQVE~CE STARS
Individual absolute magnitudes have been assigned the cluster stars on the basis of U, B, V photometry and by use of the PETRIE (1964) calibration of H~-line equivalent widths. In the former case:
M v ( l l a ) ~ V-3E(B_v)-~OD.na In the latter case:
Mv(K~) = F(WBy) + G(Sp.)
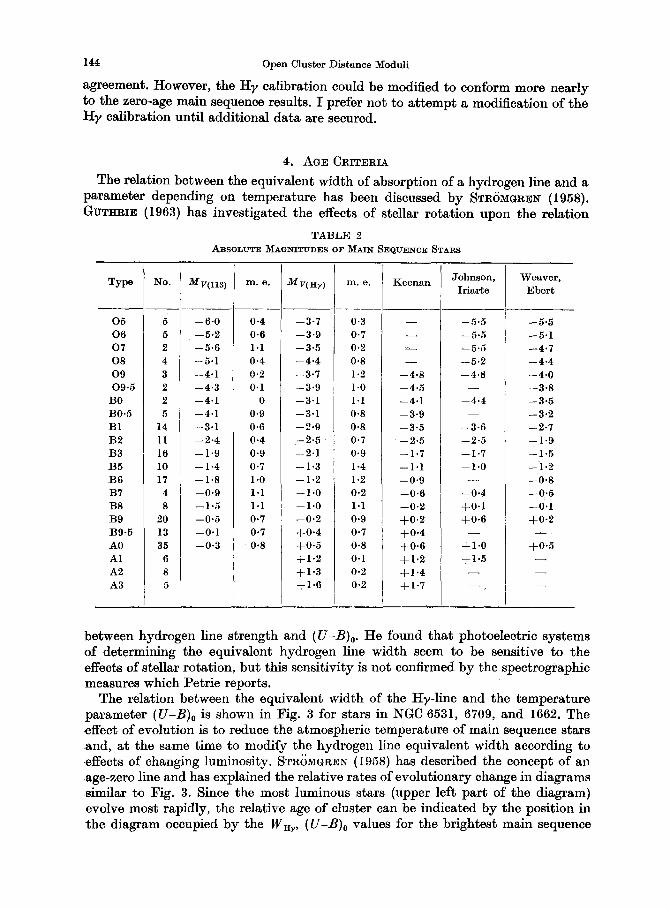
where F and G represent the PETRIE (1964) calibration. The averages of individual absolute magnitudes for various spectral types are presented in Table 2 together with results of calibrations published by KEENAN (1963), JOHNSON and IRr~RTE (1958), and WEAVER and EBERT (1964). BEER (1964) and GRAHAM (1963) have discussed more fully the problem of the absolute magnitude calibration for early- type stars.* l~ean absolute magnitudes derived by the zero-age main sequence method, and determined by the Hr-line equivalent width method are shown in Fig. 2 as a function of spectral type. I t is apparent that discrepancies exist which can account for the systematic differences between MOD.Hv and ~¢[O]).Z~MS when selection effects previously discussed are taken into consideration.
I have so far discussed only simple averages of absolute magnitude at each spectral class. A more detailed comparison of zero-age main sequence and Hy-line equivalent width results can be made. For example, for 10 stars of spectral class B2 V:
Mv(118) = Mv(Hv) + 1"38 -- 12-07 (B-V)o -- 0"76WHy _+ 0"15 (m.e.)
or, neglecting the dispersion in (B-V)0,
Mr(lla) = Mv(H~ ) + 4-03 -- 0.73 W~v + 0"32 (m.e.)
Not all detailed comparisons at the different spectral classes result in such good
*(See also Bappu, Chandra, Sanwal and Sinvhal (1962), and recently Fernie (1965); (Editors).)
144 Open Cluster Distance Moduli
agreement. However, the H~, calibration could be modified to conform more nearly to the zero-age main sequence results. I prefer not to attempt a modification of the H~ calibration until additional data are secured.
4. A G E CRITERIA
The relation between the equivalent width of absorption of a hydrogen line and a parameter depending on temperature has been discussed by STRS~dORE~ (1958). GU~IE (1963) has investigated the effects of stellar rotation upon the relation
TABLE 2 ABSOLUTE I~AGNIT~DES OF ~¢~AI~ SEQUENCE STARS
Type No. MV(113)
05 5 --6-0 0 6 5 --5.2 07 2 --5.6 08 4 --5-1 09 3 --4.1 09.5 2 --4.3
B0 2 --4-1 B0.5 5 --4.1 B1 14 --3.1 B2 11 --2-4 B3 16 --1.9 B5 10 --1.4 B6 17 --1.8 B7 4 --0.9 B8 8 --1-5 B9 20 --0.5 B9-5 13 --0.1 A0 35 --0.3 A1 6 A2 8 A3 5
m . e. M V ( l t v ) m . e . Keenan
-I 0.3 0.7 0.2 0.8 1.2 1.0 1.1 0.8 0-8 0.7 0.9 1-4 1.2 0.2 1.1 0.9 0.7 0.8 0.1 0.2 0.2
0-4 --3-7 0.6 --3.9 1.1 --3.5 0.4 - -4 .4 0.2 --3.7 0.1 --3.9
0 - -3 - I 0.9 --3.1 0.6 --2.9 0-4 --2.5 0-9 --2.1 0.7 --1.3 1-0 --1.2 1-1 --1.0 1-1 --1.0 0.7 --0.2 0-7 + 0 . 4 0.8 + 0 . 5
+1-2 + 1 . 3 +1 -6
--4.8 --4.5 --4.1 --3"9 --3"5 --2.5 --1.7 --1"1 --0"9 --0"6 --0"2 + 0 . 2 + 0 . 4 + 0 . 6 + 1 . 2 + 1 . 4 + 1 . 7
Johnson, Weaver, I r iar te Ebe r t
--5-5 --5-1 --4.7 - -4 .4 --4-0 --3-8 - -3 .5 - -3 .2 --2.7 - -1 .9 - -1 .5 - -1 .2 --0-8 - -0 .5 --0.1 +0-2
+0-5
--5.5 --5.5 --5.5 --5.2 --4.8
--4.4
--3-6 --2-5 --1-7 --1.0
--0"4 +0 .1 + 0 . 6
+ 1 . 0 + 1 . 5
between hydrogen line strength and (U-B)o. He found that photoelectric systems of determining the equivalent hydrogen line width seem to be sensitive to the effects of stellar rotation, but this sensitivity is not confirmed by the spectrographic measures which Petrie reports.
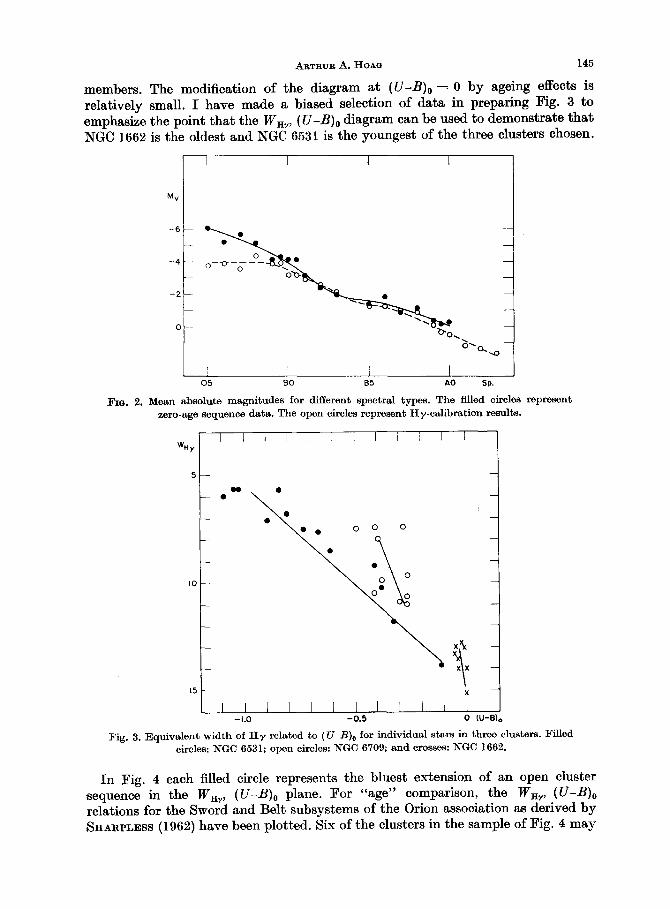
The relation between the equivalent width of the H~-line and the temperature parameter (U-B)o is shown in Fig. 3 for stars in NGC 6531, 6709, and 1662. The ,effect of evolution is to reduce the atmospheric temperature of main sequence stars and, at the same time to modify the hydrogen line equivalent width according to effects of changing luminosity. STROMGREN (1958) has described the concept of an age-zero line and has explained the relative rates of evolutionary change in diagrams similar to Fig. 3. Since the most luminous stars (upper left part of the diagram) evolve most rapidly, the relative age of cluster can be indicated by the position in the diagram occupied by the WH~, (U-B)o values for the brightest main sequence
/~RTfIUR A. HOAG 145
members. The modification of the diagram at (U-B)o = 0 by ageing effects is relatively small. I have made a biased selection of data in preparing Fig. 3 to emphasize the point that the WHy, (U-B)o diagram can be used to demonstrate that NGC 1662 is the oldest and NGC 6531 is the youngest of the three clusters chosen.
M v
- 6
- 4
2
o!
I 1 1 L
' , , 0
05 BO B5 AO Sp.
:FIG. 2. Mean absolute magni tudes for different spectral types. The filled circles represent zero-age sequence data. The open circles represent Hy-ca l ibra t ion results.
I L 1 L L I l I i i I t WHy
5 -- IIO •
• • 0 0 0
I0
15- - x - -
I I I I I [ I L ] I I 1 -I.0 -0.5 0 {U-S)
Fig. 3. Equiva len t wid th of H y related to (U-B) o for individaal s tars in three clusters. Filled circles: NGC 6531; open circles: NGC 6709; and crosses: I~GC 1662.
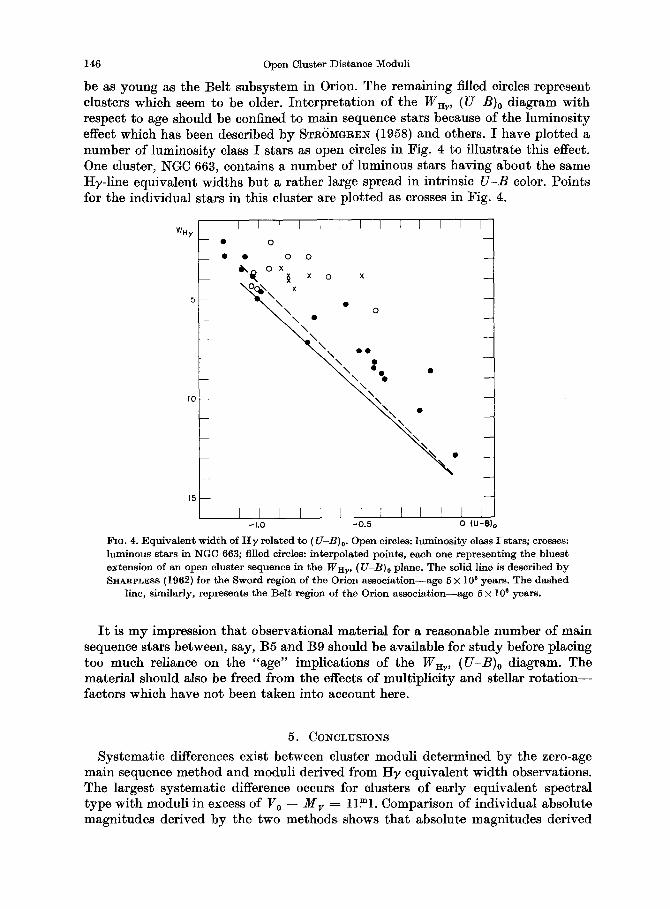
In Fig. 4 each filled circle represents the bluest extension of an open cluster sequence in the W~y, (U-B)o plane. For "age" comparison, the WHy, (U-B)o relations for the Sword and Belt subsystems of the Orion association as derived by SnA~PLESS (1962) have been plotted. Six of the clusters in the sample of Fig. 4 may
146 Open Cluster Distance ~oduli
be as young as the Bel t subsystem in Orion. The remaining filled circles represent clusters which seem to be older. In t e rp re t a t ion of the WHy , (U-B)o diagram with respect to age should be confined to main sequence stars because of the luminosi ty effect which has been described by STR6MO~EN (1958) and others. I have p lo t ted a number of luminos i ty class I stars as open circles in Fig. 4 to i l lustrate this effect. One cluster, lkTGC 663, contains a number of luminous stars having abou t the same HF-line equivalent widths bu t a ra the r large spread in intrinsic U-B color. Points for the individual stars in this cluster are p lo t ted as crosses in Fig. 4.
I [ I r I L J I I I ] I I I WHy
- - • 0
• • 0 0
_ _ ~'~ ° x i × o x \ o ~ \ g
5 -- ~ ' \ \ •
'%x~\ g o
I0 - - - -
_ _
1 5 - - - -
1 I I I T ] I [ I e ] e p I - I . 0 - 0 . 5 0 (U -B ]
FIG. 4. Equivalent w id th of H y related to ( U-B)o. Open eire]es: hlzuinosity class stars; crosses: luminous stars in NGC 663; fi l led circles: interpolated points, each o n e r e p r e s e n t i n g the bluest extension of an open cluster sequence in the WHy , (U-B)o plane. The solid line is described by SHKRPY~ESS (1962) for t h e S w o r d r e g i o n of the Orion association--age 5 × 10⁶ years . T h e d a s h e d
line, similarly, represents the Belt region of the Orion association--age 5 × 10⁶ years.
I t is m y impression t h a t observat ional mater ia l for a reasonable number of main sequence stars between, say, B5 and B9 should be available for s tudy before placing too much reliance on the "age" implications of the W~v , (U-B)o diagram. The mater ia l should also be freed f rom the effects of mult ipl ic i ty and stellar r o t a t i o n - - factors which have no t been t aken into account here.
5. CONCLUSIONS
Sys temat ic differences exist between cluster moduli de termined b y the zero-age main sequence me thod and moduli der ived from H~ equivalent width observations. The largest sys temat ic difference occurs for clusters of ear ly equivalent spectral t ype wi th moduli in excess of V 0 -- M V = 1 lml. Comparison of individual absolute magni tudes der ived by the two methods shows t h a t absolute magni tudes derived
ARI~UIt A. HoAG 147
from the H~ calibration are systematically fainter for 0- type stars than those deter- mined by the zero-age main sequence method. Several factors may enter into this difference:
(a) Difficulties in relating the photoelectric observations of H~ absorption to the system of equivalent widths measured from spectrograms. Slight errors at small equivalent widths can result in large errors in estimating absolute magnitudes.
(b) The photoelectric Hy measures may include spectral features that are smoothed out in the spectrographic analysis of equivalent width.
(c) Incorrect allowance for absorption would influence the comparison of absolute magnitudes. If, for example, the early-type cluster members in my sample have all evolved away from the zero-age main sequence, the systematically too large redden- ing corrections would result in overestimation of the brightnesses.
(d) The sample of 0-stars discussed in this paper may differ in characteristics from that used by Petrie in making his calibration. For example, no corrections for multiplicity were made in the photoelectric data, a factor which is more ade- quately taken into account in the spectrographic analysis made by Petrie. The photoelectric system discussed may also be subject to the effects of stellar rotation.
Because of such difficulties, I feel that the photoelectric H7 system should be calibrated directly rather than by a transformation to the photographic system of equivalent widths.
The zero-point of the PETRIE (1964) calibration does not depend on the concept of a zero-age sequence. Accordingly, it is gratifying to note that the random differ- ences between the moduli determined by the tiT-line equivalent width method, applied to a few stars per cluster, and the zero-age main sequence method are not large for distances up to 1 kpc.
~easures of HT-line equivalent width and a temperature parameter, (U-B)0, may be used to estimate relative ages of clusters. A larger number of stars per cluster than the average number considered here would be desirable.
ACKNOWLEDGMENT
I am greatly indebted to Dr. R. M. Petrie for making his results on the revision of the 1-17 calibration available to me in advance of publication.
BAPPI~, M. K. V., CHANDRA, S., SANW~L, N- B. and SINVHAL, S. D . .
BECKER, W. BEER, A. . CRAWFORD, D. L. FERNIE, J. D. G:RAHA~,,I, J. A.
GUTHRIE, S. N. G. HOAG, A. A. and APPLEQUIST, N. L. JOHNSON, H. L., HOAG, A. A., IRIARTE,
B., MITCHELL, R. I. and HALLA•, K . L .
JOHNSON, H. L. and IRIARTE, B . .
REFERENCES
1962 M.N., 123, 521. 1963 Zs.f. Ap., 57, 117. 1964 _M.N., 128, 261. 1958 Ap. J., 128, 185. 1965 A.J. 70, 575. 1963 Thesis, Australian National University, (coramuni-
cared by Crawford). 1963 Publ. Royal Obs. Edinburgh, 3, 85. 1965 Ap. J., Suppl. 12, 215 (No. 107)
1961 Lowell Obs. Bull., No. 113. 1958 Ibid., No. 91.
148
KEENAN, P.C. • '.
PETRIE, R. M. S ~ P L E S S , S. S~MGIm~, B . . WEAVER, H. and EBERT, A.
Open Cluster Distance Moduli
1963 Basic Astronomical .Data, ed. K. Aa. St rand (Chicago: Uniw of Chicago Press), p. 78.
1964 Publ. D.A.O., Vol. XI I , No. 9. 1962 Ap. J., 136, 767. 1958 Observatory, 78, 137. 1964 Publ. A.S.P., 76, 6.