Embed Size (px)
Citation preview

Prevalence of chronic pain in the UK:a systematic review and meta-analysisof population studies
A Fayaz,1 P Croft,2 R M Langford,3 L J Donaldson,4 G T Jones5
To cite: Fayaz A, Croft P,Langford RM, et al.Prevalence of chronic pain inthe UK: a systematic reviewand meta-analysis ofpopulation studies. BMJOpen 2016;6:e010364.doi:10.1136/bmjopen-2015-010364
▸ Prepublication history andadditional material isavailable. To view please visitthe journal (http://dx.doi.org/10.1136/bmjopen-2015-010364).
Received 24 October 2015Revised 15 March 2016Accepted 22 March 2016
1Department of Surgery andCancer, Imperial CollegeLondon, London, UK2Arthritis Research UKPrimary Care Centre, KeeleUniversity, Keele, Staffs, UK3Pain and AnaesthesiaResearch Centre, Barts HealthNHS Trust, London, UK4Institute of Global HealthInnovation, Imperial CollegeLondon, London, UK5Musculoskeletal ResearchCollaboration (EpidemiologyGroup), Institute of AppliedHealth Sciences, University ofAberdeen, Aberdeen, UK
Correspondence toDr A Fayaz;[email protected]
ABSTRACTObjectives: There is little consensus regarding theburden of pain in the UK. The purpose of this reviewwas to synthesise existing data on the prevalence ofvarious chronic pain phenotypes in order to produceaccurate and contemporary national estimates.Design: Major electronic databases were searched forarticles published after 1990, reporting population-based prevalence estimates of chronic pain (painlasting >3 months), chronic widespread pain,fibromyalgia and chronic neuropathic pain. Pooledprevalence estimates were calculated for chronic painand chronic widespread pain.Results: Of the 1737 articles generated through oursearches, 19 studies matched our inclusion criteria,presenting data from 139 933 adult residents of theUK. The prevalence of chronic pain, derived from 7studies, ranged from 35.0% to 51.3% (pooled estimate43.5%, 95% CIs 38.4% to 48.6%). The prevalence ofmoderate-severely disabling chronic pain (Von Korffgrades III/IV), based on 4 studies, ranged from 10.4%to 14.3%. 12 studies stratified chronic pain prevalenceby age group, demonstrating a trend towardsincreasing prevalence with increasing age from 14.3%in 18–25 years old, to 62% in the over 75 age group,although the prevalence of chronic pain in youngpeople (18–39 years old) may be as high as 30%.Reported prevalence estimates were summarised forchronic widespread pain (pooled estimate 14.2%, 95%CI 12.3% to 16.1%; 5 studies), chronic neuropathicpain (8.2% to 8.9%; 2 studies) and fibromyalgia(5.4%; 1 study). Chronic pain was more common infemale than male participants, across all measuredphenotypes.Conclusions: Chronic pain affects betweenone-third and one-half of the population of the UK,corresponding to just under 28 million adults, basedon data from the best available published studies. Thisfigure is likely to increase further in line with an ageingpopulation.
INTRODUCTIONChronic pain, represented by conditionssuch as low back pain and osteoarthritis, hasrecently been highlighted as one of the mostprominent causes of disability worldwide by
the Global Burden of Disease reviews.1 Atthe same time, national governments havestarted to recognise that chronic pain repre-sents a major priority and challenge for theirpublic health and healthcare systemsthrough production of national strategiesand convening of Pain Summits in countriesincluding the UK, the USA and Australia.2–5
Such initiatives emphasise the importance ofaccurate population-based estimates ofchronic pain in helping to drive and informpolicies of prevention and care, needs assess-ments, and surveillance of the impact ofinterventions, as has happened for otherlong-term conditions such as cancer and car-diovascular disease.Despite several high profile national reports
highlighting the significance of chronic painin the UK,5–8 there is little consensus regard-ing the burden of pain in this country. Oneestimate suggests that up to 8 million peoplein the UK live with chronic pain,5 in keepingwith a telephone survey of residents acrossEurope in which 13% of the UK populationreported pain of moderate-to-severe intensity,lasting for a period of >6 months.9 Estimatesbased on definitions more closely aligned withthat of the International Association of theStudy of Pain: ‘pain that persists beyondnormal tissue healing time, which is assumedto be 3 months’10 have been considerablyhigher than those quoted from the European
Strengths and limitations of this study
▪ Adherence to clearly defined and clinically mean-ingful inclusion criteria.
▪ Use of a risk of bias tool to exclude studies oflow quality.
▪ Use of meta-analysis to quantify the currentburden of chronic pain and chronic widespreadpain in the UK.
▪ Limited number of high-quality studies.▪ High level of heterogeneity among included
studies.
Fayaz A, et al. BMJ Open 2016;6:e010364. doi:10.1136/bmjopen-2015-010364 1
Open Access Research
on 15 July 2018 by guest. Protected by copyright.
http://bmjopen.bm
j.com/
BM
J Open: first published as 10.1136/bm
jopen-2015-010364 on 20 June 2016. Dow
nloaded from
telephone survey.7 11 The purpose of this review was to syn-thesise existing data on the population prevalence ofvarious chronic pain definitions, in order to producemuch needed, accurate and contemporary nationalestimates.
METHODSA protocol for the review was devised in accordance withthe PRISMA guidelines12 and registered on PROSPERO(CRD: 42014012993).13 Searches of MEDLINE (incep-tion to 31 May 2015) and EMBASE (1980 to 31 May2015) electronic databases were performed (via Ovid)for articles reporting the prevalence of chronic pain inthe UK. A list of the medical subject headings and free-text terms used are included under onlinesupplementary appendix A. The results were supplemen-ted by a manual search of the bibliographies of theshortlisted review and original study articles. In addition,a number of field experts were approached in order toidentify additional viable studies from the grey literature.We included all study formats reporting any point or
period prevalence estimates, from a general populationsample, for the following: (1) chronic pain: defined aspain in one or more body locations, lasting for a periodof 3 months or longer; (2) chronic widespread pain:defined in accordance with the American College ofRheumatology (ACR) 1990 guidelines as pain in theaxial skeleton and two contralateral limbs, lasting for aperiod of 3 months or longer;14 (3) fibromyalgia:defined in relation to either the 1990 or 2010 ACR cri-teria as ‘widespread’ pain, lasting for a period of3 months or longer, in association with tender points orsomatic symptoms as described in their respective proto-cols;14 15 and (4) neuropathic pain: defined as pain inone or more body locations, lasting for a period of3 months or longer, with predominantly neuropathicfeatures. Studies presenting data relating exclusively tospecified body regions (eg, chronic pelvic pain only, orchronic lower back pain only) were not included in thereview, as they would likely underestimate the prevalenceof (non-site-specific) chronic pain. Where case–controlstudies were identified, they had to be nested within acohort to allow for calculation of prevalence estimates.Studies based in general practices were included if theyused the population registers of the practices as a sam-pling frame of the general population.In order to provide contemporaneous and representa-
tive estimates, studies were excluded if they (1) pre-sented data collected prior to 1990; (2) presentedinternational prevalence estimates, where data from theUK was not independently retrievable; (3) presenteddata obtained from UK populations that were notdeemed to be representative of the general population(eg, estimates of neuropathic pain in patients with dia-betes, or chronic pain prevalence within specificmigrant populations) or (4) presented data on a studypopulation that had already been included in the
analysis. In the case of follow-up studies, estimates fromthe baseline studies were preferentially included in thereview, unless the follow-up study provided data on add-itional definitions that were not available from theearlier publication.Two authors (AF and GTJ) screened all the articles by
title, and then by abstract. Shortlisted studies were thenanalysed in greater depth by reference to the full textfor assessment of eligibility. Any disagreements regardingthe suitability of individual studies were resolved afterappraisal by a third author (PC). Data were extractedindependently by at least two authors (AF and GTJ orAF and PC), using a collection tool piloted on a smallsample of population studies. AF had not been involvedin any previously published pain prevalence studies; arti-cles describing studies to which one of the secondreviewers (GTJ or PC) had contributed were allocated tothe other reviewer for data extraction and qualityappraisal. Data were extracted on population character-istics, response rate (where possible adjusted to reflectthe viable survey denominator), crude prevalence esti-mates (number of cases divided by the sample size),age-adjusted and/or sex-adjusted prevalence estimatesand, where provided, estimates stratified by age, bygender or by pain severity. Where age-standardised/sex-standardised data were available, these figures were pref-erentially used in the meta-analysis. Authors were notcontacted directly for missing information.The articles were all appraised using a risk of bias tool
developed specifically for prevalence studies.16 The toolconsists of 10 items addressing the external validity (riskof selection and non-response bias), as well as theinternal validity (risk of measurement bias, and biasrelated to the data analysis) of observational studies inorder to generate an overall risk of bias assessment.Studies that were deemed to be at ‘high risk of bias’ byboth reviewers were removed from the review.Estimates for the prevalence of chronic pain and
chronic widespread pain that were not restricted to age-specific or gender-specific cohorts were incorporatedinto a meta-analysis. The SEs for prevalence (p) estimateswere derived from the equation
ffiffiffiffiffiffiffiffiffiffiffiffiffiffiffiffiffiffiffiffiffiffiffiffiffiffiffiffiffiffiffiffiffiffiffiffiffiffiffiffi[( p� (1� p))=n]
p,
where n=number of participants with completed data insurvey. Data were synthesised using StataSE V.13 for Mac.Studies were weighted according to the prevalence effectsize and the inverse of the study variance in order to gen-erate an I2 value, serving as a measure of heterogeneityamong the studies. A random effects model was used togenerate summary prevalence data, displayed (on forestplots) with 95% CIs. Where number of studies and vari-ation in the characteristics was sufficient (calendar yearof survey and geographical location), stratified analysis ofthe survey prevalence figures was presented.
RESULTSAfter removal of duplicates, our initial search generated1726 studies. From this cohort 87 full-text articles were
2 Fayaz A, et al. BMJ Open 2016;6:e010364. doi:10.1136/bmjopen-2015-010364
Open Access
on 15 July 2018 by guest. Protected by copyright.
http://bmjopen.bm
j.com/
BM
J Open: first published as 10.1136/bm
jopen-2015-010364 on 20 June 2016. Dow
nloaded from
reviewed for eligibility assessment; a further 11 articleswere identified from the additional searches describedin the Methods section. Flow charts of the screeningand selection processes are included below under onlinesupplementary appendices B and C.Of the 25 papers shortlisted for detailed analysis, 6
were excluded on the basis of high risk of bias. Articleswere mainly excluded due to the use of non-standardised definitions of chronic pain phenotypes17 18
(case definition and period prevalence risk) or fromsurveying populations that were deemed to be unrep-resentative of the general population19–22 (studypopulation and sampling frame risk). A breakdown ofthe risk of bias scoring, for included and excludedarticles is presented under online supplementaryappendix D.In total, 19 articles were included for synthesis in our
review: 13 cross-sectional studies, 4 cohort studies and 2case–control studies nested in population cohorts.Collectively, the articles present prevalence data on139 933 residents of the UK; baseline characteristics ofincluded studies are presented in table 1. Meta-analysiswas possible for two of the study phenotypes, namelychronic pain and chronic widespread pain.
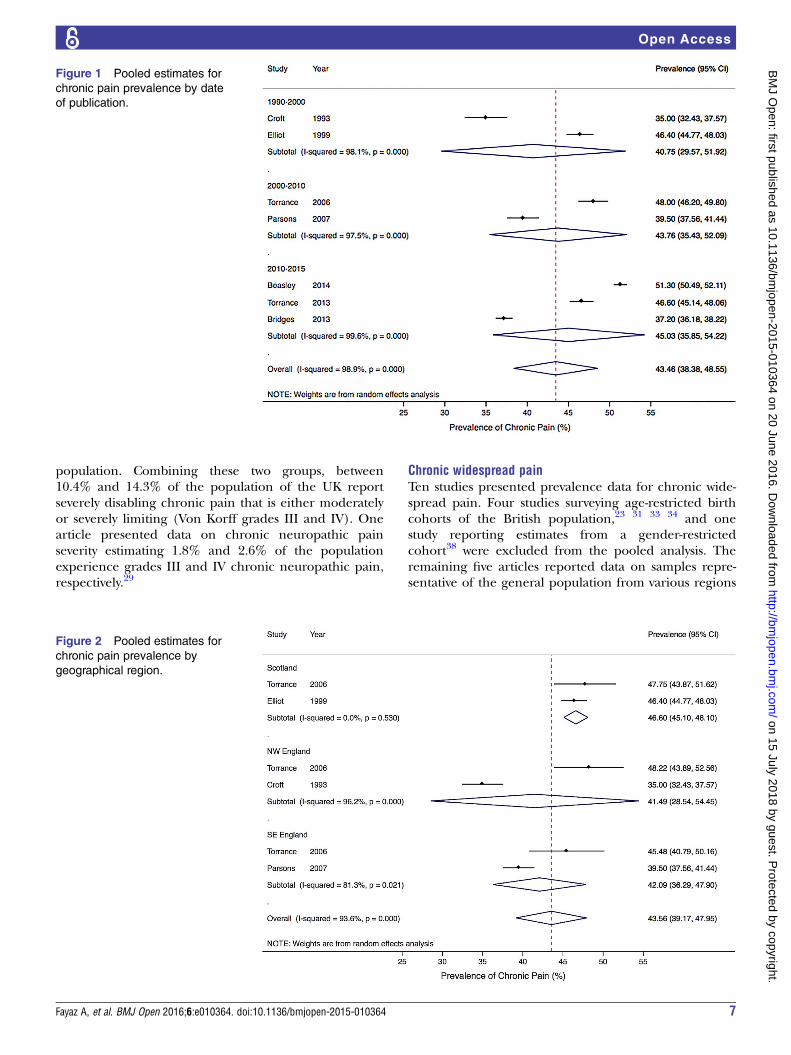
Chronic painTen studies presented prevalence data for chronic pain,two of which were from age-restricted cohorts and aretherefore excluded from our national synthesis; a UK(England, Scotland and Wales) birth cohort of residentsaged 45 years,23 and a survey of 18–25 years old from theNorth Staffordshire region.24 One study drew participantsfrom a cohort of women previously enrolled in a nationalstudy looking at the long-term effects of the contraceptivepill,25 and therefore did not present any pain prevalencedata for males. The remaining seven articles reporteddata on general population samples from various regionsacross the UK;7 11 26–30 male participants comprisedbetween 41.4% and 49.5% of the survey respondents.Reported prevalence of chronic pain in the UK rangedfrom 35.0% to 51.3% (table 2; pooled estimate 43.5%,95% CI 38.4% to 48.5%). A forest plot of thestudies included in the meta-analysis, arranged by dateorder, is presented in figure 1 demonstrating markedvariability among the estimates (I2 98.9%, p=0.00).Where gender-specific data were provided, theprevalence was consistently higher in female participants(37.0% to 51.8%) than in male participants (31.0% to48.9%).
Exploration of heterogeneityPotential sources of heterogeneity were explored usingstratified analysis of the included studies. The gender andage distributions did not really vary enough among thestudies to justify different categories; nor was there signifi-cant variability in survey methodology. However, poolingof estimates according to publication date suggests anincrease in chronic pain prevalence over time: 40.8%
(95% CI 29.8% to 51.9%) across studies publishedbetween 1990 and 2000; 43.8% (95% CI 35.4% to 52.1%)from studies published between 2000 and 2010; increas-ing to 45.0% (95% CI 35.8% to 54.2%) from studies pub-lished after 2010 (figure 1). Differences were alsoapparent with geography: three studies included in thechronic pain meta-analysis presented data from distinctgeographical locations: Scotland (Grampian),11 SEEngland27 and NW England (Cheshire);28 one additionalstudy presented stratified estimates for the same areas.30
There was some evidence of geographical variationranging from 41.5% (95% CI 28.5% to 54.5%) in NWEngland to 46.6% (95% CI 45.1% to 48.1%) in Scotland(figure 2), although there are too few studies to draw anyfirm conclusions.
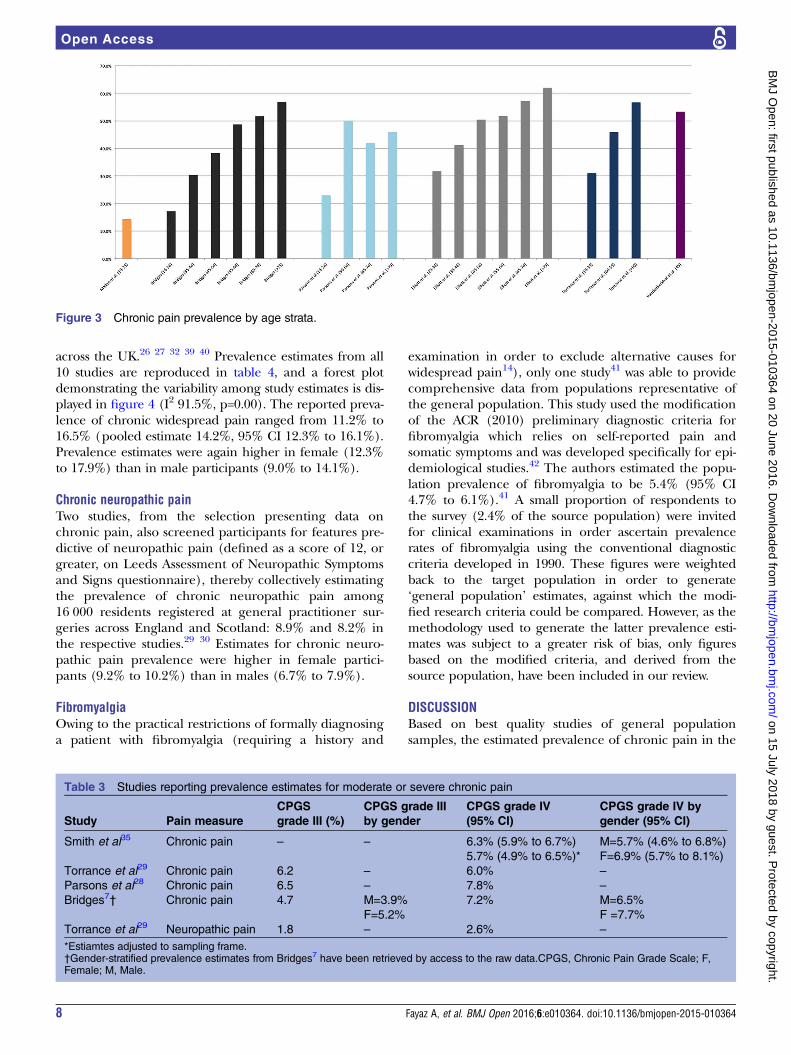
Chronic pain prevalence by ageTwelve studies presented data stratified by age groups:chronic pain in seven studies,7 11 23–25 28 29 chronic wide-spread pain in six studies23 27 31–34 and neuropathicpain in one study.29 Age strata did not overlap preciselyacross the studies, making synthesis of the data impracti-cal. Within studies, chronic pain prevalence increasedsteadily with age from a low of 14.3% in 18–25 yearsold24 to as high as 62% in the over 75 age group.11 Asingle exception to this trend was observed in oneinstance where reported pain prevalence among 50–64 years old was higher than that reported in the olderage strata.28 Two of the five articles presenting data inthe youngest age strata (18–39 years old) reported preva-lence estimates >30%.11 29 The data for chronic painhave been tabulated in figure 3. Similar patterns ofincreasing prevalence with age were demonstrated instudies looking at chronic widespread pain and neuro-pathic pain, with one single exception where the preva-lence of chronic widespread pain in 65–74 years old waslower than the prevalence in the 55–64-year-old bracket;stratification by gender in this study demonstrates thatthis drop is due to reduced pain reporting by male parti-cipants in the 65–74-year-old age bracket.27 The preva-lence of chronic widespread pain ranged from 6.8% in18–32 years old32 to a peak of 21% in the over 75 agegroup.27 Neuropathic pain prevalence by age wasreported in a single study demonstrating increasing painprevalence: 6.3%, 9.7% and 10.4% in 18–39, 40–59 andover 60 years old, respectively.
Chronic pain severityFour articles presented data on chronic pain prevalencein which estimates were stratified according to painseverity,7 28 29 35 using the ‘grading severity of chronicpain’ tool developed by Von Korff et al,36 and validatedfor use in chronic pain research.37 The data have beenreproduced in table 3; the national prevalence of mod-erately limiting, high disability pain (grade III) rangedfrom 4.7% to 6.5%, and that of highly limiting, high dis-ability pain (grade IV) from 5.7% to 7.8% of the total
Fayaz A, et al. BMJ Open 2016;6:e010364. doi:10.1136/bmjopen-2015-010364 3
Open Access
on 15 July 2018 by guest. Protected by copyright.
http://bmjopen.bm
j.com/
BM
J Open: first published as 10.1136/bm
jopen-2015-010364 on 20 June 2016. Dow
nloaded from
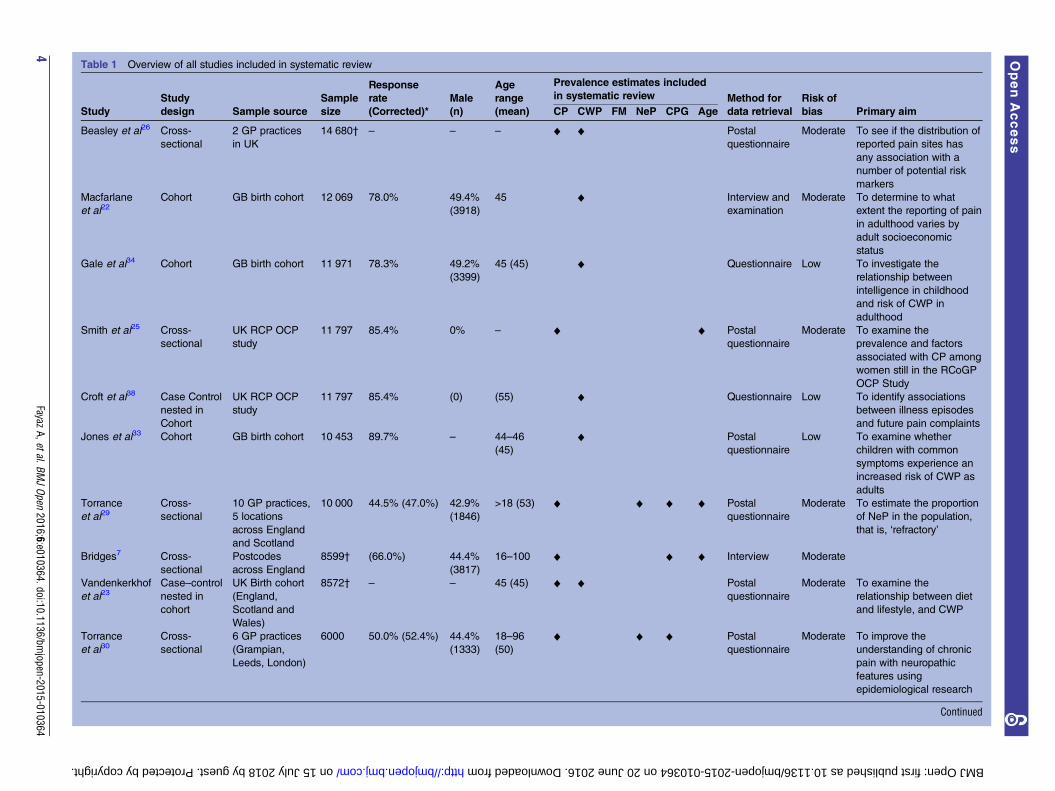
Table 1 Overview of all studies included in systematic review
Study
Study
design Sample source
Sample
size
Response
rate Male
(n)
Age
range
(mean)
Prevalence estimates included
in systematic review Method for
data retrieval
Risk of
bias Primary aim(Corrected)* CP CWP FM NeP CPG Age
Beasley et al26 Cross-
sectional
2 GP practices
in UK
14 680† – – – ♦ ♦ Postal
questionnaire
Moderate To see if the distribution of
reported pain sites has
any association with a
number of potential risk
markers
Macfarlane
et al22Cohort GB birth cohort 12 069 78.0% 49.4%
(3918)
45 ♦ Interview and
examination
Moderate To determine to what
extent the reporting of pain
in adulthood varies by
adult socioeconomic
status
Gale et al34 Cohort GB birth cohort 11 971 78.3% 49.2%
(3399)
45 (45) ♦ Questionnaire Low To investigate the
relationship between
intelligence in childhood
and risk of CWP in
adulthood
Smith et al25 Cross-
sectional
UK RCP OCP
study
11 797 85.4% 0% – ♦ ♦ Postal
questionnaire
Moderate To examine the
prevalence and factors
associated with CP among
women still in the RCoGP
OCP Study
Croft et al38 Case Control
nested in
Cohort
UK RCP OCP
study
11 797 85.4% (0) (55) ♦ Questionnaire Low To identify associations
between illness episodes
and future pain complaints
Jones et al33 Cohort GB birth cohort 10 453 89.7% – 44–46
(45)
♦ Postal
questionnaire
Low To examine whether
children with common
symptoms experience an
increased risk of CWP as
adults
Torrance
et al29Cross-
sectional
10 GP practices,
5 locations
across England
and Scotland
10 000 44.5% (47.0%) 42.9%
(1846)
>18 (53) ♦ ♦ ♦ ♦ Postal
questionnaire
Moderate To estimate the proportion
of NeP in the population,
that is, ‘refractory’
Bridges7 Cross-
sectional
Postcodes
across England
8599† (66.0%) 44.4%
(3817)
16–100 ♦ ♦ ♦ Interview Moderate
Vandenkerkhof
et al23Case–control
nested in
cohort
UK Birth cohort
(England,
Scotland and
Wales)
8572† – – 45 (45) ♦ ♦ Postal
questionnaire
Moderate To examine the
relationship between diet
and lifestyle, and CWP
Torrance
et al30Cross-
sectional
6 GP practices
(Grampian,
Leeds, London)
6000 50.0% (52.4%) 44.4%
(1333)
18–96
(50)
♦ ♦ ♦ Postal
questionnaire
Moderate To improve the
understanding of chronic
pain with neuropathic
features using
epidemiological research
Continued
4Fayaz
A,etal.BMJOpen
2016;6:e010364.doi:10.1136/bmjopen-2015-010364
OpenAccess
on 15 July 2018 by guest. Protected by copyright. http://bmjopen.bmj.com/ BMJ Open: first published as 10.1136/bmjopen-2015-010364 on 20 June 2016. Downloaded from
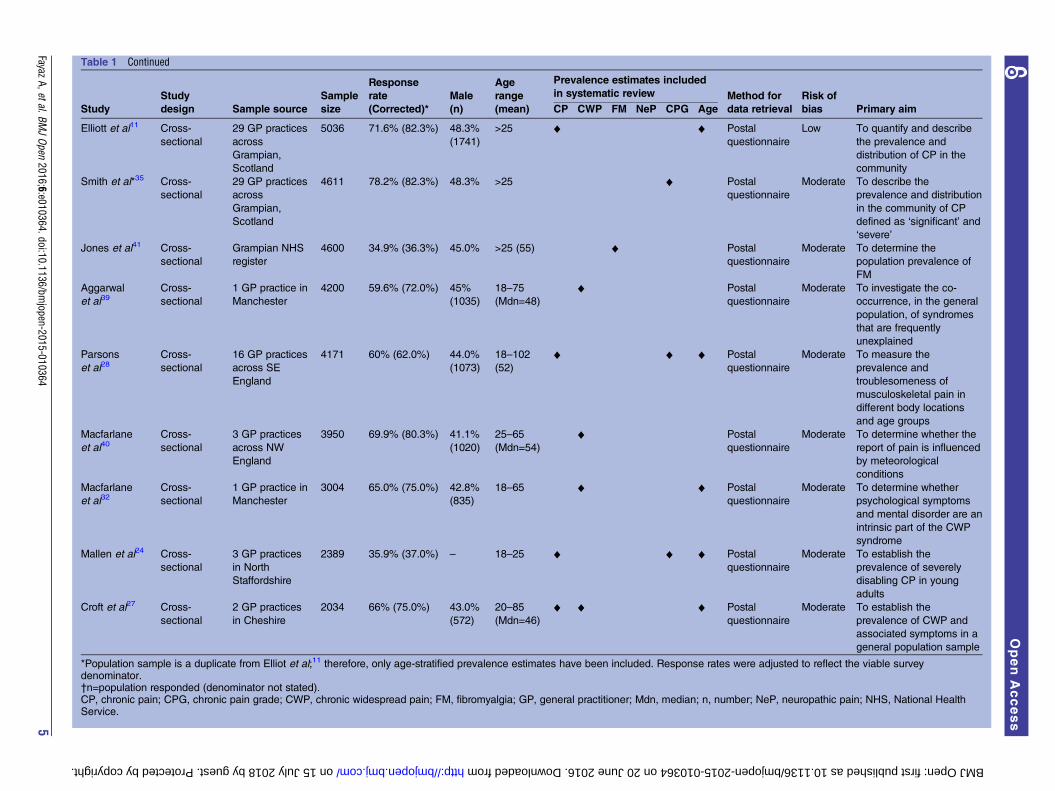
Table 1 Continued
Study
Study
design Sample source
Sample
size
Response
rate Male
(n)
Age
range
(mean)
Prevalence estimates included
in systematic review Method for
data retrieval
Risk of
bias Primary aim(Corrected)* CP CWP FM NeP CPG Age
Elliott et al11 Cross-
sectional
29 GP practices
across
Grampian,
Scotland
5036 71.6% (82.3%) 48.3%
(1741)
>25 ♦ ♦ Postal
questionnaire
Low To quantify and describe
the prevalence and
distribution of CP in the
community
Smith et al*35 Cross-
sectional
29 GP practices
across
Grampian,
Scotland
4611 78.2% (82.3%) 48.3% >25 ♦ Postal
questionnaire
Moderate To describe the
prevalence and distribution
in the community of CP
defined as ‘significant’ and
‘severe’
Jones et al41 Cross-
sectional
Grampian NHS
register
4600 34.9% (36.3%) 45.0% >25 (55) ♦ Postal
questionnaire
Moderate To determine the
population prevalence of
FM
Aggarwal
et al39Cross-
sectional
1 GP practice in
Manchester
4200 59.6% (72.0%) 45%
(1035)
18–75
(Mdn=48)
♦ Postal
questionnaire
Moderate To investigate the co-
occurrence, in the general
population, of syndromes
that are frequently
unexplained
Parsons
et al28Cross-
sectional
16 GP practices
across SE
England
4171 60% (62.0%) 44.0%
(1073)
18–102
(52)
♦ ♦ ♦ Postal
questionnaire
Moderate To measure the
prevalence and
troublesomeness of
musculoskeletal pain in
different body locations
and age groups
Macfarlane
et al40Cross-
sectional
3 GP practices
across NW
England
3950 69.9% (80.3%) 41.1%
(1020)
25–65
(Mdn=54)
♦ Postal
questionnaire
Moderate To determine whether the
report of pain is influenced
by meteorological
conditions
Macfarlane
et al32Cross-
sectional
1 GP practice in
Manchester
3004 65.0% (75.0%) 42.8%
(835)
18–65 ♦ ♦ Postal
questionnaire
Moderate To determine whether
psychological symptoms
and mental disorder are an
intrinsic part of the CWP
syndrome
Mallen et al24 Cross-
sectional
3 GP practices
in North
Staffordshire
2389 35.9% (37.0%) – 18–25 ♦ ♦ ♦ Postal
questionnaire
Moderate To establish the
prevalence of severely
disabling CP in young
adults
Croft et al27 Cross-
sectional
2 GP practices
in Cheshire
2034 66% (75.0%) 43.0%
(572)
20–85
(Mdn=46)
♦ ♦ ♦ Postal
questionnaire
Moderate To establish the
prevalence of CWP and
associated symptoms in a
general population sample
*Population sample is a duplicate from Elliot et al;11 therefore, only age-stratified prevalence estimates have been included. Response rates were adjusted to reflect the viable surveydenominator.†n=population responded (denominator not stated).CP, chronic pain; CPG, chronic pain grade; CWP, chronic widespread pain; FM, fibromyalgia; GP, general practitioner; Mdn, median; n, number; NeP, neuropathic pain; NHS, National HealthService.
FayazA,etal.BM
JOpen
2016;6:e010364.doi:10.1136/bmjopen-2015-010364
5
OpenAccess
on 15 July 2018 by guest. Protected by copyright. http://bmjopen.bmj.com/ BMJ Open: first published as 10.1136/bmjopen-2015-010364 on 20 June 2016. Downloaded from
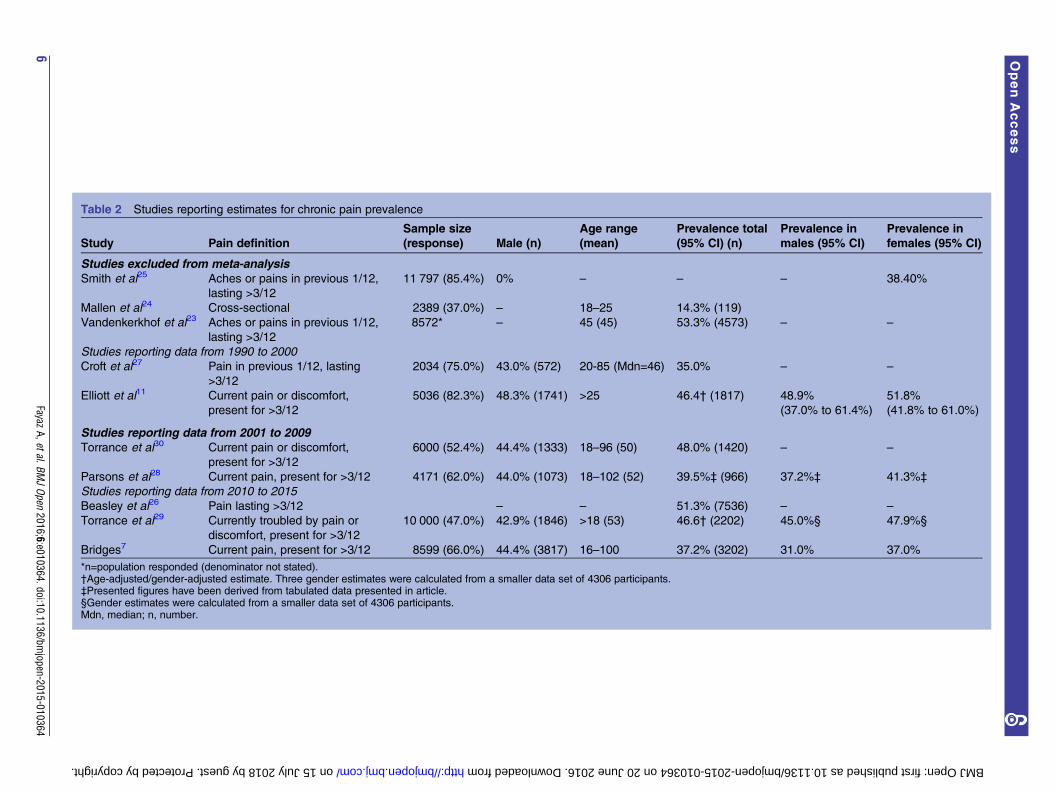
Table 2 Studies reporting estimates for chronic pain prevalence
Study Pain definition
Sample size
(response) Male (n)
Age range
(mean)
Prevalence total
(95% CI) (n)
Prevalence in
males (95% CI)
Prevalence in
females (95% CI)
Studies excluded from meta-analysisSmith et al25 Aches or pains in previous 1/12,
lasting >3/12
11 797 (85.4%) 0% – – – 38.40%
Mallen et al24 Cross-sectional 2389 (37.0%) – 18–25 14.3% (119)
Vandenkerkhof et al23 Aches or pains in previous 1/12,
lasting >3/12
8572* – 45 (45) 53.3% (4573) – –
Studies reporting data from 1990 to 2000Croft et al27 Pain in previous 1/12, lasting
>3/12
2034 (75.0%) 43.0% (572) 20-85 (Mdn=46) 35.0% – –
Elliott et al11 Current pain or discomfort,
present for >3/12
5036 (82.3%) 48.3% (1741) >25 46.4† (1817) 48.9%
(37.0% to 61.4%)
51.8%
(41.8% to 61.0%)
Studies reporting data from 2001 to 2009Torrance et al30 Current pain or discomfort,
present for >3/12
6000 (52.4%) 44.4% (1333) 18–96 (50) 48.0% (1420) – –
Parsons et al28 Current pain, present for >3/12 4171 (62.0%) 44.0% (1073) 18–102 (52) 39.5%‡ (966) 37.2%‡ 41.3%‡
Studies reporting data from 2010 to 2015Beasley et al26 Pain lasting >3/12 – – 51.3% (7536) – –
Torrance et al29 Currently troubled by pain or
discomfort, present for >3/12
10 000 (47.0%) 42.9% (1846) >18 (53) 46.6† (2202) 45.0%§ 47.9%§
Bridges7 Current pain, present for >3/12 8599 (66.0%) 44.4% (3817) 16–100 37.2% (3202) 31.0% 37.0%
*n=population responded (denominator not stated).†Age-adjusted/gender-adjusted estimate. Three gender estimates were calculated from a smaller data set of 4306 participants.‡Presented figures have been derived from tabulated data presented in article.§Gender estimates were calculated from a smaller data set of 4306 participants.Mdn, median; n, number.
6Fayaz
A,etal.BMJOpen
2016;6:e010364.doi:10.1136/bmjopen-2015-010364
OpenAccess
on 15 July 2018 by guest. Protected by copyright. http://bmjopen.bmj.com/ BMJ Open: first published as 10.1136/bmjopen-2015-010364 on 20 June 2016. Downloaded from
population. Combining these two groups, between10.4% and 14.3% of the population of the UK reportseverely disabling chronic pain that is either moderatelyor severely limiting (Von Korff grades III and IV). Onearticle presented data on chronic neuropathic painseverity estimating 1.8% and 2.6% of the populationexperience grades III and IV chronic neuropathic pain,respectively.29
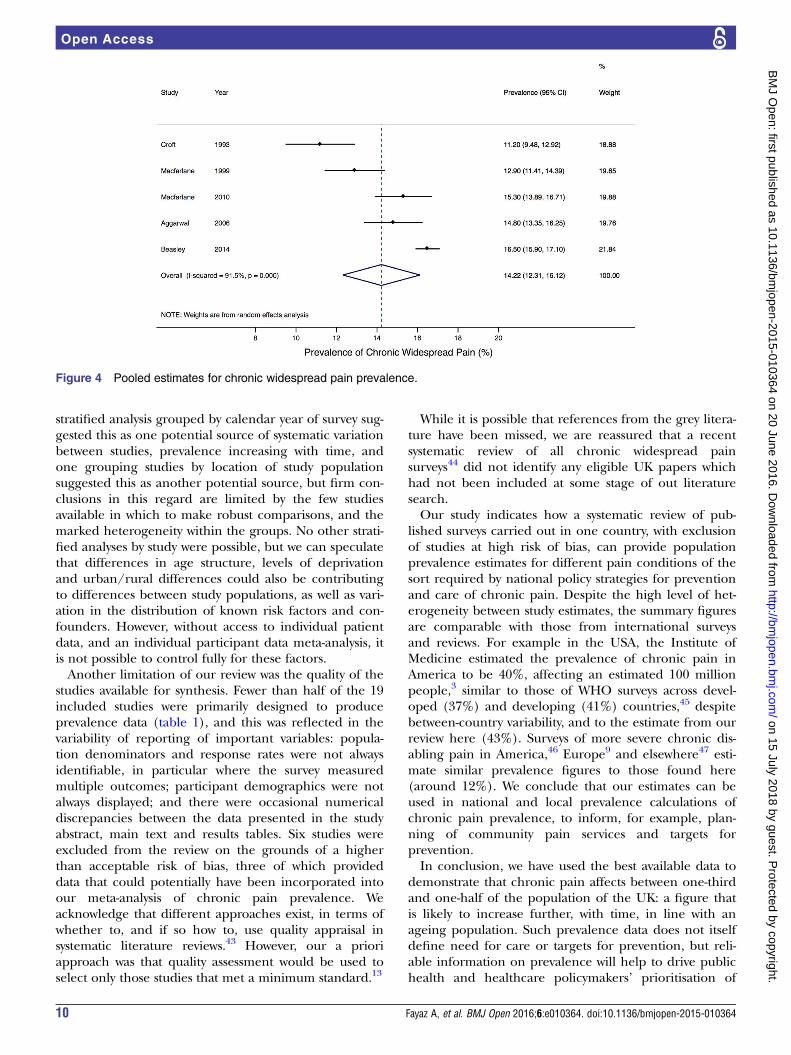
Chronic widespread painTen studies presented prevalence data for chronic wide-spread pain. Four studies surveying age-restricted birthcohorts of the British population,23 31 33 34 and onestudy reporting estimates from a gender-restrictedcohort38 were excluded from the pooled analysis. Theremaining five articles reported data on samples repre-sentative of the general population from various regions
Figure 1 Pooled estimates for
chronic pain prevalence by date
of publication.
Figure 2 Pooled estimates for
chronic pain prevalence by
geographical region.
Fayaz A, et al. BMJ Open 2016;6:e010364. doi:10.1136/bmjopen-2015-010364 7
Open Access
on 15 July 2018 by guest. Protected by copyright.
http://bmjopen.bm
j.com/
BM
J Open: first published as 10.1136/bm
jopen-2015-010364 on 20 June 2016. Dow
nloaded from
across the UK.26 27 32 39 40 Prevalence estimates from all10 studies are reproduced in table 4, and a forest plotdemonstrating the variability among study estimates is dis-played in figure 4 (I2 91.5%, p=0.00). The reported preva-lence of chronic widespread pain ranged from 11.2% to16.5% (pooled estimate 14.2%, 95% CI 12.3% to 16.1%).Prevalence estimates were again higher in female (12.3%to 17.9%) than in male participants (9.0% to 14.1%).
Chronic neuropathic painTwo studies, from the selection presenting data onchronic pain, also screened participants for features pre-dictive of neuropathic pain (defined as a score of 12, orgreater, on Leeds Assessment of Neuropathic Symptomsand Signs questionnaire), thereby collectively estimatingthe prevalence of chronic neuropathic pain among16 000 residents registered at general practitioner sur-geries across England and Scotland: 8.9% and 8.2% inthe respective studies.29 30 Estimates for chronic neuro-pathic pain prevalence were higher in female partici-pants (9.2% to 10.2%) than in males (6.7% to 7.9%).
FibromyalgiaOwing to the practical restrictions of formally diagnosinga patient with fibromyalgia (requiring a history and
examination in order to exclude alternative causes forwidespread pain14), only one study41 was able to providecomprehensive data from populations representative ofthe general population. This study used the modificationof the ACR (2010) preliminary diagnostic criteria forfibromyalgia which relies on self-reported pain andsomatic symptoms and was developed specifically for epi-demiological studies.42 The authors estimated the popu-lation prevalence of fibromyalgia to be 5.4% (95% CI4.7% to 6.1%).41 A small proportion of respondents tothe survey (2.4% of the source population) were invitedfor clinical examinations in order ascertain prevalencerates of fibromyalgia using the conventional diagnosticcriteria developed in 1990. These figures were weightedback to the target population in order to generate‘general population’ estimates, against which the modi-fied research criteria could be compared. However, as themethodology used to generate the latter prevalence esti-mates was subject to a greater risk of bias, only figuresbased on the modified criteria, and derived from thesource population, have been included in our review.
DISCUSSIONBased on best quality studies of general populationsamples, the estimated prevalence of chronic pain in the
Figure 3 Chronic pain prevalence by age strata.
Table 3 Studies reporting prevalence estimates for moderate or severe chronic pain
Study Pain measure
CPGS
grade III (%)
CPGS grade III
by gender
CPGS grade IV
(95% CI)
CPGS grade IV by
gender (95% CI)
Smith et al35 Chronic pain – – 6.3% (5.9% to 6.7%)
5.7% (4.9% to 6.5%)*
M=5.7% (4.6% to 6.8%)
F=6.9% (5.7% to 8.1%)
Torrance et al29 Chronic pain 6.2 – 6.0% –
Parsons et al28 Chronic pain 6.5 – 7.8% –
Bridges7† Chronic pain 4.7 M=3.9%
F=5.2%
7.2% M=6.5%
F =7.7%
Torrance et al29 Neuropathic pain 1.8 – 2.6% –
*Estiamtes adjusted to sampling frame.†Gender-stratified prevalence estimates from Bridges7 have been retrieved by access to the raw data.CPGS, Chronic Pain Grade Scale; F,Female; M, Male.
8 Fayaz A, et al. BMJ Open 2016;6:e010364. doi:10.1136/bmjopen-2015-010364
Open Access
on 15 July 2018 by guest. Protected by copyright.
http://bmjopen.bm
j.com/
BM
J Open: first published as 10.1136/bm
jopen-2015-010364 on 20 June 2016. Dow
nloaded from
UK is 43%. This equates to just under 28 millionpeople (referencing population statistics from 2013).Chronic pain prevalence rises steadily with increasingage, affecting up to 62% of the population over the ageof 75, suggesting that the burden of chronic pain mayincrease further still, in line with an ageing population,if the incidence remains unaltered. The proportion ofpatients reporting severe pain was also summarised.Weighted averages for chronic widespread pain suggestthat 14.2% of the population may be affected. Between10.4% and 14.3% of the population report chronicpain that is either moderately or severely limiting (VonKorff grades III and IV), figures that translate into anestimated median of 7.9 million people in the UKpopulation with this category of chronic pain.The estimate of 43% (28 million people) in the UK
with chronic pain is considerably higher than a previ-ously quoted figure of 7.8 million people with ‘chronicpain’5 based on data from the telephone-based pain inEurope survey.9 However, the European survey lookedonly at moderate-to-severe pain, and figures from thatsurvey are more directly comparable with, and similarto, our summary estimates for moderately or severelylimiting chronic pain.Chronic pain in our review was defined primarily in
terms of symptom duration (pain present for a periodof 3 months or greater), arguably not reflective of thesocietal burden of the condition. It may be that a pro-portion of ‘chronic pain’ reporters are highly function-ing individuals with little restriction of day-to-day activity,and limited reliance on health services; many peopleliving with chronic inflammatory or degenerative condi-tions, in their mildest forms, would fall into this category.However, it is of interest that even in the youngest popu-lation age groups, where these conditions are likely to berare, prevalence estimates for chronic pain are as high as30% (figure 3), suggesting a greater potential burden onthe ‘working’ population than anticipated.To our knowledge, this is the first study attempting to
synthesise prevalence data on chronic pain phenotypesspecifically from the UK. In order to strengthen ourfindings, we have attempted to limit the impact of clin-ical and methodological heterogeneity by imposingfairly strict selection criteria from the outset of ourreview, and by remaining selective about the studiesthat were permitted to enter the meta-analysis. At theexpense of sensitivity, our selection criteria generateddata comparable enough to allow for synthesis andmeta-analysis of the two most prominent pain pheno-types (chronic pain and chronic widespread pain). Thetests for statistical heterogeneity among articlesincluded in the meta-analyses still demonstrated sub-stantial variability between studies however (I2 98.9%and 95.2% for chronic pain and chronic widespreadpain, respectively). There was limited opportunity toinvestigate sources of this variability due to the smallnumber of studies included and the lack of recordedcharacteristics showing variability between studies. A
Table
4Studiesreportingprevalenceestimatesforchronic
widespreadpain
Study
Pain
definition
Sample
size
Male
(n)
Agerange
(mean)
Prevalence
total(n)
Prevalencein
males(%
)
Prevalencein
females(%
)
Stud
iesex
clud
edfro
mmeta-an
alys
isCroftet
al38
ACR
inthepast1/12for>3/12
11797
(0)
(55)
––
12.30
Joneset
al33
ACR
inthepast1/12for>3/12
10453
–44–46(45)
12.2%
11.8
12.7
Macfarlaneet
al22
ACR
inthepast1/12for>3/12
12069
49.4%
(3918)
45
11.8%
––
Vandenkerkhofet
al23
ACR
inthepast1/12for>3/12
8572*
–45(45)
12.3%
(1056)
12.0
13.0
Gale
etal
34
ACR
inthepast1/12for>3/12
11971
49.2%
(3399)
45(45)
14.4%
(993)
14.1
14.7
Stud
iesinclud
edin
meta-an
alys
isMacfarlaneet
al32
ACR
inthepast1/12for>3/12
3004
42.8%
(835)
18–65
12.9%
(252)
10.5
14.7
Croftet
al27
ACR
inthepast1/12for>3/12
2034
43.0%
(572)
20–85(M
dn=46)
11.2†(164)
9.40
15.60
Aggarw
alet
al39
ACR
for>3/12
4200
45%
(1035)
18–75(M
dn=48)
14.8%
(340)
9.0
17.9
Macfarlaneet
al40
ACR
inthepast1/12for>3/12
3950
41.1%
(1020)
25–65(M
dn=54)
15.3%
(381)
––
Beasleyet
al26
ACR
inthepast1/12for>3/12
14680*
––
16.5%
––
*n=populationresponded(denominatornotstated).
†Age-adjusted/gender-adjustedestimate.
ACR,AmericanCollegeofRheumatology;Mdn,median;n,number.
Fayaz A, et al. BMJ Open 2016;6:e010364. doi:10.1136/bmjopen-2015-010364 9
Open Access
on 15 July 2018 by guest. Protected by copyright.
http://bmjopen.bm
j.com/
BM
J Open: first published as 10.1136/bm
jopen-2015-010364 on 20 June 2016. Dow
nloaded from
stratified analysis grouped by calendar year of survey sug-gested this as one potential source of systematic variationbetween studies, prevalence increasing with time, andone grouping studies by location of study populationsuggested this as another potential source, but firm con-clusions in this regard are limited by the few studiesavailable in which to make robust comparisons, and themarked heterogeneity within the groups. No other strati-fied analyses by study were possible, but we can speculatethat differences in age structure, levels of deprivationand urban/rural differences could also be contributingto differences between study populations, as well as vari-ation in the distribution of known risk factors and con-founders. However, without access to individual patientdata, and an individual participant data meta-analysis, itis not possible to control fully for these factors.Another limitation of our review was the quality of the
studies available for synthesis. Fewer than half of the 19included studies were primarily designed to produceprevalence data (table 1), and this was reflected in thevariability of reporting of important variables: popula-tion denominators and response rates were not alwaysidentifiable, in particular where the survey measuredmultiple outcomes; participant demographics were notalways displayed; and there were occasional numericaldiscrepancies between the data presented in the studyabstract, main text and results tables. Six studies wereexcluded from the review on the grounds of a higherthan acceptable risk of bias, three of which provideddata that could potentially have been incorporated intoour meta-analysis of chronic pain prevalence. Weacknowledge that different approaches exist, in terms ofwhether to, and if so how to, use quality appraisal insystematic literature reviews.43 However, our a prioriapproach was that quality assessment would be used toselect only those studies that met a minimum standard.13
While it is possible that references from the grey litera-ture have been missed, we are reassured that a recentsystematic review of all chronic widespread painsurveys44 did not identify any eligible UK papers whichhad not been included at some stage of out literaturesearch.Our study indicates how a systematic review of pub-
lished surveys carried out in one country, with exclusionof studies at high risk of bias, can provide populationprevalence estimates for different pain conditions of thesort required by national policy strategies for preventionand care of chronic pain. Despite the high level of het-erogeneity between study estimates, the summary figuresare comparable with those from international surveysand reviews. For example in the USA, the Institute ofMedicine estimated the prevalence of chronic pain inAmerica to be 40%, affecting an estimated 100 millionpeople,3 similar to those of WHO surveys across devel-oped (37%) and developing (41%) countries,45 despitebetween-country variability, and to the estimate from ourreview here (43%). Surveys of more severe chronic dis-abling pain in America,46 Europe9 and elsewhere47 esti-mate similar prevalence figures to those found here(around 12%). We conclude that our estimates can beused in national and local prevalence calculations ofchronic pain prevalence, to inform, for example, plan-ning of community pain services and targets forprevention.In conclusion, we have used the best available data to
demonstrate that chronic pain affects between one-thirdand one-half of the population of the UK: a figure thatis likely to increase further, with time, in line with anageing population. Such prevalence data does not itselfdefine need for care or targets for prevention, but reli-able information on prevalence will help to drive publichealth and healthcare policymakers’ prioritisation of
Figure 4 Pooled estimates for chronic widespread pain prevalence.
10 Fayaz A, et al. BMJ Open 2016;6:e010364. doi:10.1136/bmjopen-2015-010364
Open Access
on 15 July 2018 by guest. Protected by copyright.
http://bmjopen.bm
j.com/
BM
J Open: first published as 10.1136/bm
jopen-2015-010364 on 20 June 2016. Dow
nloaded from
this important cause of distress and disability in thegeneral population. In the interests of improving thequality and reporting of epidemiological data, we wouldencourage future population studies to adhere to stan-dardised methods for collecting and presenting observa-tional data, such as the guidance produced by theStrengthening the Reporting of Observational Studies inEpidemiology (STROBE) group.48
Acknowledgements The authors are grateful for the input of Professor BlairSmith (University of Dundee): his counsel early in the project, and his adviceand comments regarding the search strategy; and Professor Danielle van derWindt (Keele University) for helpful advice and comments.
Contributors AF was involved with the study design, data collection, analysisand write-up. He is the guarantor. GTJ and PC assisted with the study design,data collection, analysis and revisions. RML and LJD contributed to thedesign of the study and revisions to the article.
Funding The British Pain Society provided financial assistance to AF with thecosts of this project. PC was partly supported by an Arthritis Research UKPrimary Care Centre grant (reference: 18139).
Competing interests RML reports personal fees from Grunenthal, grants andpersonal fees from Napp/Mundipharma, personal fees from Pfizer, personalfees from Astrazeneca, personal fees from BioQuiddity, personal fees fromThe Medicines Co, outside the submitted work.
Provenance and peer review Not commissioned; externally peer reviewed.
Data sharing statement No additional data are available.
Open Access This is an Open Access article distributed in accordance withthe Creative Commons Attribution Non Commercial (CC BY-NC 4.0) license,which permits others to distribute, remix, adapt, build upon this work non-commercially, and license their derivative works on different terms, providedthe original work is properly cited and the use is non-commercial. See: http://creativecommons.org/licenses/by-nc/4.0/
REFERENCES1. Vos T, Flaxman AD, Naghavi M, et al. Years lived with disability
(YLDs) for 1160 sequelae of 289 diseases and injuries 1990–2010:a systematic analysis for the Global Burden of Disease Study 2010.Lancet 2012;380:2163–96.
2. Department of Health and Human Services USG. National PainStrategy: a comprehensive population health strategy for pain, 2015.http://iprcc.nih.gov/docs/DraftHHSNationalPainStrategy.pdf(accessed Feb 2016).
3. Committee on Advancing Pain Research C, and Education; Boardon Health Sciences Policy; Institute of Medicine. Relieving pain inAmerica: a blueprint for transforming prevention, care, education andresearch, 2011. http://www.nap.edu/catalog/13172/relieving-pain-in-america-a-blueprint-for-transforming-prevention-care (accessedFeb 2016).
4. The National Pain Strategy, 2010. http://www.painaustralia.org.au/the-national-pain-strategy/national-pain-strategy.html (accessed Feb2016).
5. Donaldson LJ. Pain: breaking through the barrier. 150 years of theAnnual Report of the Chief Medical Officer: on the state of the publichealth. London, 2008. http://webarchive.nationalarchives.gov.uk/20130107105354/http://www.dh.gov.uk/en/Publicationsandstatistics/Publications/AnnualReports/DH_096206
6. Price C. Putting pain on the agenda: the report of the First EnglishPain Summit. United Kingdom, 2012. https://www.britishpainsociety.org/static/uploads/resources/files/members_articles_putting_pain_agenda.pdf.
7. Bridges S. Chronic pain. Health Survey for England, 2011. https://catalogueicnhsuk/publications/public-health/surveys/heal-surv-eng-2011/HSE2011-Ch9-Chronic-Painpdf 2012. https://catalogue.ic.nhs.uk/publications/public-health/surveys/heal-surv-eng-2011/HSE2011-Ch9-Chronic-Pain.pdf
8. National Pain Audit. Final report 2010–2012. http://www.nationalpainaudit.org/media/files/NationalPainAudit-2012.pdf
9. Breivik H, Collett B, Ventafridda V, et al. Survey of chronic pain inEurope: prevalence, impact on daily life, and treatment. Eur J Pain2006;10:287–333.
10. [No authors listed]. Classification of chronic pain. Descriptions ofchronic pain syndromes and definitions of pain terms. Prepared bythe International Association for the Study of Pain, Subcommittee onTaxonomy. Pain Suppl 1986;3:S1–226.
11. Elliott AM, Smith BH, Penny KI, et al. The epidemiology of chronicpain in the community. Lancet 1999;354:1248–52.
12. Liberati A, Altman DG, Tetzlaff J, et al. The PRISMA statement forreporting systematic reviews and meta-analyses of studies thatevaluate healthcare interventions: explanation and elaboration. BMJ2009;339:b2700.
13. Fayaz A, Croft P, Langford RM, et al. The prevalence of chronic painin the United Kingdom: protocol for systematic review. http://www.crd.york.ac.uk/PROSPERO/display_record.asp?ID=CRD42014012993. PROSPERO International prospectiveregister of systematic reviews, 2014.
14. Wolfe F, Clauw DJ, Fitzcharles MA, et al. The American College ofRheumatology preliminary diagnostic criteria for fibromyalgia andmeasurement of symptom severity. Arthritis Care Res 2010;62:600–10.
15. Wolfe F, Smythe HA, Yunus MB, et al. The American College ofRheumatology 1990 criteria for the classification of fibromyalgia.Report of the Multicenter Criteria Committee. Arthritis Rheum1990;33:160–72.
16. Hoy D, Brooks P, Woolf A, et al. Assessing risk of bias in prevalencestudies: modification of an existing tool and evidence of interrateragreement. J Clin Epidemiol 2012;65:934–9.
17. Gureje O, Von Korff M, Simon GE, et al. Persistent pain andwell-being: a World Health Organization study in primary care. JAMA1998;280:147–51.
18. Gajria C, Murray J, Birger R, et al. Identification of patients withneuropathic pain using electronic primary care records. Inform PrimCare 2011;19:83–90.
19. Martin KR, Beasley M, Macfarlane GJ, et al. Chronic pain predictsreduced physical activity in a large population cohort study. ArthritisRheumatol 2014;66:S434.
20. Nicholl BI, Mackay D, Cullen B, et al. Chronic multisite pain in majordepression and bipolar disorder: cross-sectional study of 149,611participants in UK Biobank. BMC Psychiatry 2014;14:2433.
21. Bowsher D, Rigge M, Sopp L. Prevalence of chronic pain in theBritish population: a telephone survey of 1037 households. PainClinic 1991;4:223–30.
22. Macfarlane GJ, Pye SR, Finn JD, et al. Investigating thedeterminants of international differences in the prevalence of chronicwidespread pain: evidence from the European Male Ageing Study.Ann Rheum Dis 2009;68:690–5.
23. Vandenkerkhof EG, Macdonald HM, Jones GT, et al. Diet, lifestyleand chronic widespread pain: results from the 1958 British BirthCohort Study. Pain Res Manag 2011;16:87–92.
24. Mallen C, Peat G, Thomas E, et al. Severely disabling chronic painin young adults: prevalence from a population-based postal survey inNorth Staffordshire. BMC Musculoskelet Disord 2005;6:42.
25. Smith BH, Elliott AM, Hannaford PC. Is chronic pain a distinctdiagnosis in primary care? Evidence arising from the Royal Collegeof General Practitioners’ Oral Contraception Study. Fam Pract2004;21:66–74.
26. Beasley M, Macfarlane GJ. Chronic widespread pain versusmulti-site pain: does the distribution matter? Arthritis Rheumatol2014;66:S908–S09.
27. Croft P, Rigby AS, Boswell R, et al. The prevalence of chronicwidespread pain in the general population. J Rheumatol1993;20:710–13.
28. Parsons S, Breen A, Foster NE, et al. Prevalence and comparativetroublesomeness by age of musculoskeletal pain in different bodylocations. Fam Pract 2007;24:308–16.
29. Torrance N, Ferguson JA, Afolabi E, et al. Neuropathic pain in thecommunity: more under-treated than refractory? Pain 2013;154:690–9.
30. Torrance N, Smith BH, Bennett MI, et al. The epidemiology ofchronic pain of predominantly neuropathic origin. Results from ageneral population survey. J Pain 2006;7:281–9.
31. Macfarlane GJ, Norrie G, Atherton K, et al. The influence ofsocioeconomic status on the reporting of regional and widespreadmusculoskeletal pain: results from the 1958 British Birth CohortStudy. Ann Rheum Dis 2009;68:1591–5.
32. Macfarlane GJ, Morris S, Hunt IM, et al. Chronic widespread pain inthe community: the influence of psychological symptoms and mentaldisorder on healthcare seeking behavior. J Rheumatol 1999;26:413–19.
Fayaz A, et al. BMJ Open 2016;6:e010364. doi:10.1136/bmjopen-2015-010364 11
Open Access
on 15 July 2018 by guest. Protected by copyright.
http://bmjopen.bm
j.com/
BM
J Open: first published as 10.1136/bm
jopen-2015-010364 on 20 June 2016. Dow
nloaded from
33. Jones GT, Silman AJ, Power C, et al. Are common symptoms inchildhood associated with chronic widespread body pain inadulthood? Results from the 1958 British Birth Cohort Study.Arthritis Rheum 2007;56:1669–75.
34. Gale CR, Deary IJ, Cooper C, et al. Intelligence in childhood andchronic widespread pain in middle age: the National ChildDevelopment Survey. Pain 2012;153:2339–44.
35. Smith BH, Elliott AM, Chambers WA, et al. The impact of chronicpain in the community. Fam Pract 2001;18:292–9.
36. Von Korff M, Ormel J, Keefe FJ, et al. Grading the severity ofchronic pain. Pain 1992;50:133–49.
37. Smith BH, Penny KI, Purves AM, et al. The Chronic Pain Gradequestionnaire: validation and reliability in postal research. Pain1997;71:141–7.
38. Croft P, Lewis M, Hannaford P. Is all chronic pain the same?A 25-year follow-up study. Pain 2003;105:309–17.
39. Aggarwal VR, McBeth J, Zakrzewska JM, et al. The epidemiology ofchronic syndromes that are frequently unexplained: do they havecommon associated factors? Int J Epidemiol 2006;35:468–76.
40. Macfarlane TV, McBeth J, Jones GT, et al. Whether the weatherinfluences pain? Results from the EpiFunD study in North WestEngland. Rheumatology 2010;49:1513–20.
41. Jones GT, Atzeni F, Beasley M, et al. The prevalence of fibromyalgiain the general population: a comparison of the American College ofRheumatology 1990, 2010, and modified 2010 classification criteria.Int J Epidemiol 2015;67:568–75.
42. Wolfe F, Clauw DJ, Fitzcharles MA, et al. Fibromyalgia criteria andseverity scales for clinical and epidemiological studies: a modificationof the ACR Preliminary Diagnostic Criteria for Fibromyalgia.J Rheumatol 2011;38:1113–22.
43. Viswanathan M, Ansari MT, Berkman ND, et al. AHRQ methodsfor effective health care. Assessing the risk of bias of individualstudies in systematic reviews of health care interventions. Methodsguide for effectiveness and comparative effectiveness reviews.Rockville, MD: Agency for Healthcare Research and Quality (US),2008.
44. Mansfield KE, Sim J, Jordan JL, et al. A systematic review andmeta-analysis of the prevalence of chronic widespread pain in thegeneral population. Pain 2016;157:55–64.
45. Tsang A, Von Korff M, Lee S, et al. Common chronic pain conditionsin developed and developing countries: gender and age differencesand comorbidity with depression-anxiety disorders. J Pain2008;9:883–91.
46. Nahin RL. Estimates of pain prevalence and severity in adults:United States, 2012. J Pain 2015;16:769–80.
47. Croft PB, Blyth FM, van der Windt D. Chronic pain epidemiology:from aetiology to public health. Oxford, UK: University Press,2010.
48. Vandenbroucke JP, von Elm E, Altman DG, et al. Strengtheningthe Reporting of Observational Studies in Epidemiology(STROBE): explanation and elaboration. Epidemiology 2007;18:805–35.
12 Fayaz A, et al. BMJ Open 2016;6:e010364. doi:10.1136/bmjopen-2015-010364
Open Access
on 15 July 2018 by guest. Protected by copyright.
http://bmjopen.bm
j.com/
BM
J Open: first published as 10.1136/bm
jopen-2015-010364 on 20 June 2016. Dow
nloaded from