Embed Size (px)
Citation preview
1Bøe T, et al. BMJ Open 2017;7:e017030. doi:10.1136/bmjopen-2017-017030
Open Access
Economic volatility in childhood and subsequent adolescent mental health problems: a longitudinal population-based study of adolescents
Tormod Bøe,1 Jens Christoffer Skogen,2,3 Børge Sivertsen,1,3,4 Mari Hysing,1 Keith J Petrie,5 Eric Dearing,6,7 Henrik Daae Zachrisson7,8
To cite: Bøe T, Skogen JC, Sivertsen B, et al. Economic volatility in childhood and subsequent adolescent mental health problems: a longitudinal population-based study of adolescents. BMJ Open 2017;7:e017030. doi:10.1136/bmjopen-2017-017030
► Prepublication history and additional material are available. To view these files please visit the journal online (http:// dx. doi. org/ 10. 1136/ bmjopen- 2017- 017030).
Received 3 April 2017Revised 3 July 2017Accepted 7 July 2017
For numbered affiliations see end of article.
Correspondence toTormod Bøe; tormod. boe@ uni. no
Research
AbstrACtObjective The aim of the current paper was to investigate the association between the patterns of duration, timing and sequencing of exposure to low family income during childhood, and symptoms of mental health problems in adolescence.setting Survey administered to a large population-based sample of Norwegian adolescents.Participants Survey data from 9154 participants of 16–19 years age (53% participation rate; 52.7% girls) were linked to registry-based information about childhood family income from tax return data.Outcome measures Mental health outcomes were symptoms of emotional, conduct, hyperactivity, peer problems and general mental health problems measured with the Strengths and Difficulties Questionnaire, symptoms of depression measured with Short Mood and Feelings Questionnaire and symptoms of attention-deficit/hyperactivity disorder (ADHD) measured with the Adult ADHD Self-Report Scale.results Latent class analysis and the BCH approach in Mplus were used to examine associations between patterns of poverty exposure and mental health outcomes. Four latent classes of poverty exposure emerged from the analysis. Participants moving into poverty (2.3%), out of poverty (3.5%) or those chronically poor (3.1%) had more symptoms of mental health problems (Cohen’s d=16-.50) than those with no poverty exposure (91.1%). This pattern was, however, not found for symptoms of ADHD. The pattern of results was confirmed in robustness checks using observed data.Conclusions Exposure to poverty in childhood was found to be associated with most mental health problems in adolescence. There was no strong suggestion of any timing or sequencing effects in the patterns of associations.
ECOnOmiC vOlAtility in ChildhOOd And AdOlEsCEnt mEntAl hEAlthChildren who grow up in poverty experience mental health problems to a greater extent than their more affluent peers.1 2 The associa-tions are often modest,3 however, and partic-ularly small when controlling for genetics,
parenting practices and other characteristics likely to influence children’s development.4 Wagmiller et al5 have argued that one reason for the modest association may be that most prior research uses what has been termed a ‘concurrent indicator approach’ where income and the outcome are measured at the same time point. This approach ignores stability and change in income over time, camouflaging improvements and deteriora-tions of economic circumstances. Indeed, an emerging body of research suggests that it is not necessarily the overall level of concur-rent deprivation that is key in understanding how income influences development, but rather, the persistence and timing of poverty, and dynamic changes in families’ economic circumstances over time.6–8 Consistent with this perspective, instability or decline in income can increase parental stress,9 parental depression10 11 and disrupt parent–child
strengths and limitations of this study
► Data on mental health problems obtained from a survey administered to a large population-based sample of Norwegian 16–19 year olds (n=9154) was linked to registry-based information about family income in childhood from tax return data from the Norwegian Tax Administration.
► Using latent class analysis, four trajectories of poverty exposure during childhood were evident.
► The association between trajectories of childhood poverty exposure and symptoms of mental health problems in adolescence was investigated using Mplus and the BCH approach for estimating the means of distal outcomes across latent classes.
► Robustness checks were used to verify the results using observed data.
► High attrition, low levels of poverty in Norway and high school students being over-represented in the sample suggest that care should be taken when generalising the results.
on 24 June 2018 by guest. Protected by copyright.
http://bmjopen.bm
j.com/
BM
J Open: first published as 10.1136/bm
jopen-2017-017030 on 18 Septem
ber 2017. Dow
nloaded from

2 Bøe T, et al. BMJ Open 2017;7:e017030. doi:10.1136/bmjopen-2017-017030
Open Access
relationships.12 In turn, these family stress responses to income volatility play a critical role in mediating the effects of economic disadvantage on child outcomes.13–16
Dissatisfactions with the concurrent indicator approach have led some researchers to find more thorough and ecologically valid estimates of families’ economic circumstances over time, such as averaging over several years of income3 or statistically estimating the perma-nent component of the economic resources available to the family.17 18 Alternative approaches have involved measuring the numbers of year a child is living in poverty (often termed cumulative or persistent poverty) or the number and durations of poverty episodes a child has experienced.19 20 In general, these methodological approaches to capturing income over time produce stronger associations with developmental outcomes than concurrent income indicators.2 3 Still, these approaches do not fully address the possibility that families may expe-rience a variety of transitory patterns of economic circum-stances over time. Indicators of the number of episodes a child has experienced poverty, for example, may ignore the consequences of when those episodes occurred in a child’s life.
The timing of poverty across children’s lives has also been a topic of considerable interest. Different types of mental health problems debut at different ages,21 and investigating the co-occurrence of risk factors such as poverty at potentially vulnerable periods may provide more insight into mediating mechanisms. Research is equivocal about whether poverty occurring at an early or later stage of childhood has the most impact on mental health outcomes. Poverty in early (preschool) child-hood has been emphasised as especially detrimental to development,22 23 as this is a crucial time for brain devel-opment and may disrupt the many core cognitive and social competencies being acquired during this time. In contrast, others have highlighted middle childhood24 and early adolescence as particularly sensitive periods.19
The analytical approach in many studies of timing of poverty is often to investigate the effect of being persistently poor at a particular period during childhood relative to being poor at other times.23 25 26 A potential limitation of some of the studies on timing is that this analytical approach may also obscure sequencing effects, that is, that some children move out of or into poverty between the different periods that are contrasted. In studies of sequencing per se, declines in income have been found to be associated with poorer developmental outcomes.6 13 27 Furthermore, economic fluctuations seem especially consequential for children living in poverty,6 22 and it has been suggested that economic fluctuations may pose even greater risks to development compared with disadvantaged, but stable, economic circumstances.28
The present study was conducted in Norway which is a wealthy country in which absolute deprivation is uncommon29 30 and where there is relatively little income inequality (as indicated by a Gini index of 25). In 2012, for example, only 13.1% of children (aged
<18 years) lived in households in relative poverty. More-over, Norway provides an elaborate social safety net for its residents such as access to unemployment, sickness and family-related benefits; financial assistance; financial advice and debt counselling; temporary accommodation; employment schemes; and health services. These social benefits may buffer children and families with low socio-economic status from exposure to some of the physical hardships and psychosocial stressors associated with poverty. However, even with these social services, poorer economic circumstances do appear to be associated with mental health problems in Norwegian children.27 31 32 Yet, in order to study the relatively small population of poor children with adequate power, large samples, such as in the present study, are required.
In Norway,33 as well as in many other developed econ-omies,30 34 35 the proportion of children that grow up in poverty has risen. The aim of the present study was to investigate different economic trajectories and economic volatility during childhood and subsequent adolescent mental health. We capitalised on historic register-based income information linked to a large population-based study on adolescent mental health. Using latent class analysis (LCA), we classified children into groups based on their similarity in exposure to low income during childhood. Then, we investigated the association between class membership and mental health outcomes among 16–19 year adolescents. The advantage of LCA over alter-native methods of measuring exposure to low income (eg, approaches based on concurrent indicators, cumula-tive poverty exposure, average economic status over time or importance of being poor in some stages of childhood relative to others) is that it allows us to simultaneously consider the effects of duration, timing and sequencing of exposure to low income during childhood.36
mEthOdsProcedure and participantsIn this population-based study, we used data from the youth@hordaland-survey of adolescents conducted in 2012 in the county of Hordaland in Western Norway (n=9154). The main aim of youth@hordaland-survey was to assess mental health problems among all adolescents in Hordaland county aged 16–19 years. All adolescents in upper secondary education received information via e-mail, and one classroom school hour was allocated for them to complete the questionnaire. The questionnaire was web-based and covered a broad range of mental health issues, sleep behaviours and sleep problems, daily life functioning, use of healthcare and social services, demographics, as well as a request for permission to obtain school data, and to link the information with national registries. Those not in school received informa-tion by post to their home address. Uni Research Health collaborated with Hordaland county Council to conduct the study. The study was approved by The Regional Committee for Medical and Health Research Ethics in
on 24 June 2018 by guest. Protected by copyright.
http://bmjopen.bm
j.com/
BM
J Open: first published as 10.1136/bm
jopen-2017-017030 on 18 Septem
ber 2017. Dow
nloaded from
3Bøe T, et al. BMJ Open 2017;7:e017030. doi:10.1136/bmjopen-2017-017030
Open Access
Western Norway. The results from the current obser-vational study are reported according to the STROBE guidelines.
Overall, Hordaland county is considered representative of Norway with regards to gender and rural/urban resi-dence distribution, and the median household income is also similar to that of the national average.37 In the period 2005–2010, the mean proportion of children character-ised as being relative poor (see details below) in Hordaland county was slightly lower (7.3%) than in the country as a whole (8.9%). Official data show that in 2012, 92% of all adolescents in Norway aged 16–19 years attended high school38 compared with 98% in the current sample. The grade point average (GPA) in the current sample was comparable to the national GPA, but somewhat lower than the GPA in Hordaland county.39
mEAsurEsmeasure of relative povertyFamily income was drawn from the Norwegian national income registry and was based on tax return data from the Norwegian Tax Administration. As the information about income is used by the Norwegian government to estimate taxation, it is considered reliable, precise, and of high quality. Using each participant’s personal iden-tification number, we were able to obtain information about the equivalised disposable household income for the period from 2004 when children were 8–11 years, until 2010. Equivalised household income is a measure of household income (ie, the sum of wages and salaries, income from self-employment, property income and transfers received minus total assessed taxes and negative transfers) that is adjusted by an equivalence scale in order to facilitate comparison between households of different size and composition. It may be viewed as an indicator of the economic resources that are available to a stan-dardised household, and accounts for inflation/changes in median income over time. The equivalence scale used in the current study is the European Union scale (a modi-fication of the OECD equivalence scale) where the first adult is given a weight of 1, subsequent adults are given a weight of 0.5 and each child <14 years of age is given the weight 0.3.40 From this measure of family income, we calculated the proportion of adolescents in relative poverty, defined as having an equivalised household income <60% of the equivalised national median income for that partic-ular year (eg, to calculate relative poverty proportions for 2004, we used the median income for 2004). This crite-rion corresponds to the one used in income inequality statistics in the European Union.41 42
symptoms of general mental health problemsIn the youth@hordaland study, adolescents completed the self-report version of the Strengths and Difficulties Questionnaire (SDQ).43 44 The SDQ is available from http://www. sdqinfo. org and can be downloaded freely. It consists of five subscales, each containing five items.
The scales measure emotional symptoms, conduct problems, hyperactivity–inattention, peer relationship problems and prosocial behaviours (not included in the current study). Respondents indicated on a 3-point Likert-type scale to which extent a symptom applied to them, using the options ‘not true’, ‘somewhat true’ or ‘certainly true’. Each of the subscales consists of five items, and all scale scores ranged from 0 to 10 in the current sample. Four of the subscales (emotional, conduct, hyperactivity–inattention and peer relation-ship problems) are summed to provide the SDQ total difficulties scale score (sample range 0–35), with higher scores indicating more problems. Due to the ordinal and categorical nature of the response options, reli-ability was assessed using polychoric correlation-based version of the reliability coefficients.45 These analyses suggested satisfactory internal consistency for the SDQ total difficulties scale (α=0.86) and for all subscales (α emotional problems=0.82, conduct problems=0.71, hyperactivity–inattention=0.76, peer problems=0.75 and prosocial behaviours=0.77). Previous investigations have found the SDQ to be reliable and valid instrument to use in samples of adolescents46
symptoms of depressionThe short version of the Moods and Feelings Ques-tionnaire (SMFQ)47 was used to measure symptoms of depression. The SMFQ consists of 13 statements (eg, ‘I am feeling low’, ‘no one likes me’ and so on) that the participants respond to using Norwegian translations of the response categories ‘not true’, ‘sometimes true’ and ‘true’. The SMFQ is a valid instrument48 with adequate psychometric properties,49 and a previous study based on the youth@hordaland study found the SMFQ to be unidimensional, supporting the use of the sum score of SMFQ.50 Reliability in the current sample was excellent (range=0–26, ordinal α=0.95).
symptoms of attention-deficit/hyperactivity disorderHyperactivity–inattention was measured using a Norwe-gian version of the Adult ADHD Self-report scale (ASRS).51 The ASRS consists of 18 statements about hyperactivity–inattention (eg, ‘I never remember’ and ‘I concentrate easily’), that the participants respond to using options ‘never’, ‘rarely’, ‘sometimes’, ‘often’ or ‘always’. The ASRS was originally constructed for use in adults,52 but has also been validated for use among adolescents.53 The current study used the total score where all 18 items were added together (range=0–72, ordinal α=0.91), the inattention scale consisting of nine items (range=0–36, ordinal α=0.89), and the hyperactivity–impulsivity scale consisting of nine items (range=0–36, ordinal α=0.84). This additional measure of ADHD was included as symp-toms of ADHD are only briefly measured by the SDQ and the age range in the current sample is at the upper end of the norms of the SDQ.
on 24 June 2018 by guest. Protected by copyright.
http://bmjopen.bm
j.com/
BM
J Open: first published as 10.1136/bm
jopen-2017-017030 on 18 Septem
ber 2017. Dow
nloaded from
4 Bøe T, et al. BMJ Open 2017;7:e017030. doi:10.1136/bmjopen-2017-017030
Open Access
demographic variablesGender and date of birth were identified through personal identity number in the Norwegian National Population Register. Exact age was estimated by calculating the interval of time between date of birth and date of study participa-tion. Family structure (ie, single-parent [15%] or two-parent households), parental education levels (elementary [3.7%], intermediate [30.7%] and higher), work affiliation (ie, work [93.4%], benefits [3.8%] or other [including students, retirees and stay-at-home parents]) and ethnicity (Norwe-gian [96.3%] or foreign) were reported by adolescents.
statistical analysisLCA was used to identify subsets of participants who shared a similar pattern of family income across all seven time points (2004–2010). LCA is a person-centred approach that we employed to estimate the number of latent classes that could be established based on the family income. The following criteria were used to decide on the number of classes to retain: Akaike information criterion (AIC), Bayesian information criterion (BIC) and sample-size adjusted BIC (adj BIC).54 Also, we used entropy to assess the quality of classification, as well as the Vuong-Lo-Mendell-Rubin (VLMR) adjusted likelihood ratio test for the hypoth-esis that a model with one less class performs just as well. The LCA was done in an iterative manner, where we started with one class, and increased the number of classes until the fit criteria suggested a good enough model. Deciding on the retained model, statistic criteria, parsimony and mean-ingfulness of the classes was considered. Mplus V.7.4 was
used for the LCA.55 Differences in mental health variables between the identified classes of income were also tested in Mplus using the BCH approach for estimating the means of distal outcomes across latent classes.56 Precursory analysis regressing family income classes on age did not suggest any effect of the age cohort. Missing data were handled by the full information maximum likelihood procedure in Mplus.
We further conducted robustness checks using categorisa-tions based on observed data. In a first set of analyses, those who had ever been below the relative poverty line in any of the years (n=1379) were compared with those who had never been poor (n=7604) using Welch corrected t-tests. In a second analysis, comparisons were made between the never poor participants, and those who experienced rela-tive poverty early (n=811) or late (n=466) using analysis of variance (ANOVA) and Tukey’s honest significant differ-ence (HSD) procedure for pairwise comparisons. The two last groups were made based on having income below the relative poverty line the 2004–2006, but not later (ie, poor early) or in 2007–2010, but not earlier (ie, poor late). R for Mac V.3.3.257 was used for all supplementary analyses.
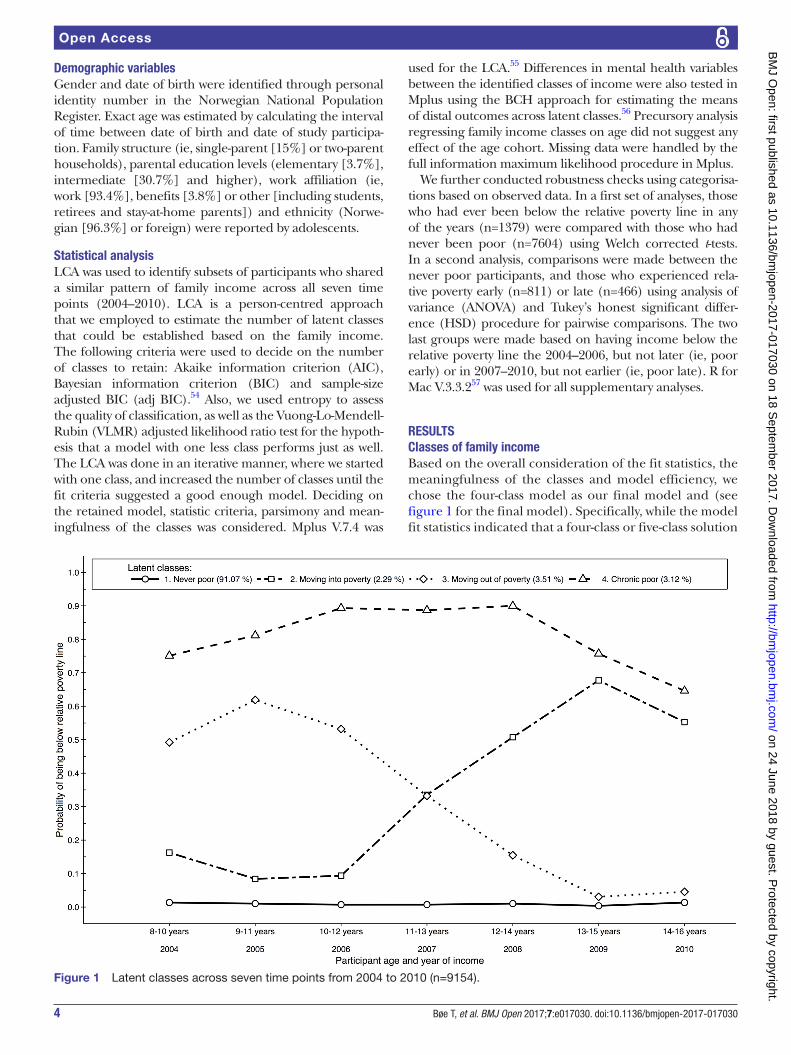
rEsultsClasses of family incomeBased on the overall consideration of the fit statistics, the meaningfulness of the classes and model efficiency, we chose the four-class model as our final model and (see figure 1 for the final model). Specifically, while the model fit statistics indicated that a four-class or five-class solution
Figure 1 Latent classes across seven time points from 2004 to 2010 (n=9154).
on 24 June 2018 by guest. Protected by copyright.
http://bmjopen.bm
j.com/
BM
J Open: first published as 10.1136/bm
jopen-2017-017030 on 18 Septem
ber 2017. Dow
nloaded from

5Bøe T, et al. BMJ Open 2017;7:e017030. doi:10.1136/bmjopen-2017-017030
Open Access
fitted the data best (see table 1), the LMR-LRT test indi-cated that the five-class model was better than the four-class model and the entropy was slightly better (0.939 in the five-class model vs 0.929 the four-class model). Yet, inspection of the information criteria (AIC and BIC) indi-cated that little was gained by allowing for more than four classes. Moreover, comparison of the patterns in the four-class and five-class models did not suggest that the fifth class yielded additional information that was qualitatively important. Finally, it was evident that six or more classes were not supported by the data.
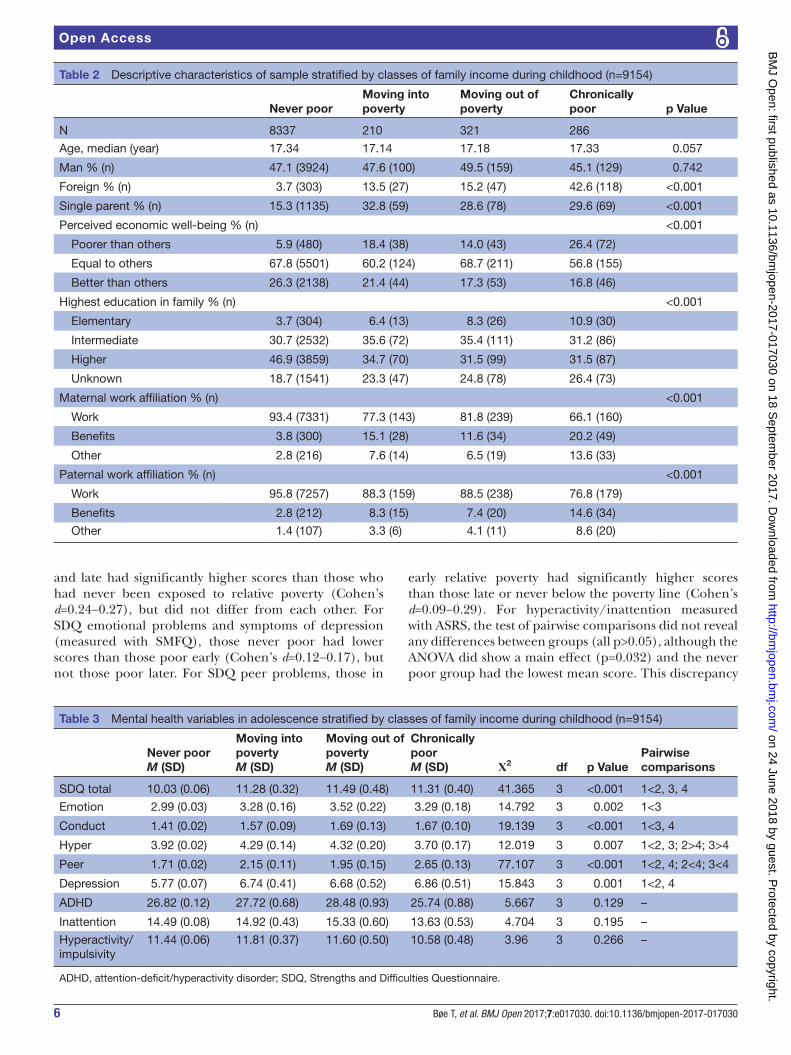
The largest class, by far, we termed ‘never poor’ (class 1; 91.1%). Participants in this class had little exposure to low income throughout childhood, and in any of the years measured, these participants had <5% chance of living in relative poverty. The next two classes were characterised by moving into or out of low income. The ‘moving into poverty’ (class 2) constituted 2.3% of the sample. Participants in this class had low expo-sure in 2004–2006, and increasing exposure from 2007 and onwards, with a decline in 2010. The reverse was observed for the ‘moving out of poverty’ (class 3; 3.5% of the sample), which had relatively high exposure to low income in 2004–2006, before exposure declined towards 2010. The ‘chronically poor’ group (class 4) consisted of 3.1% of the sample, and had a much higher proba-bility of exposure to low income in childhood at 75% or higher for 6 of the 7 years measured, before dropping to around 65% in 2010.Associations with relevant demographic informationThe four classes that emerged from the final model were associated with relevant demographic variables in mean-ingful ways, supporting the validity of the classification. Those in the ‘never poor’ group had parents with higher education levels, were less likely to live in a single-parent household and their parents were also more likely to work, relative to the other classes. Those in the ‘chron-ically poor’ group were more likely to be ethnic minori-ties, have parents with lower education levels and their parents were more likely to not be working. Participants in two classes of transitory poverty were placed in-be-tween these two extremes in their association with demo-graphic variables (see table 2 and online supplementary figure 1).
Associations with mental healthThe results suggested that there was a main effect of class on all mental health measures with the exception of symp-toms of ADHD as measured with the ASRS, see table 3.
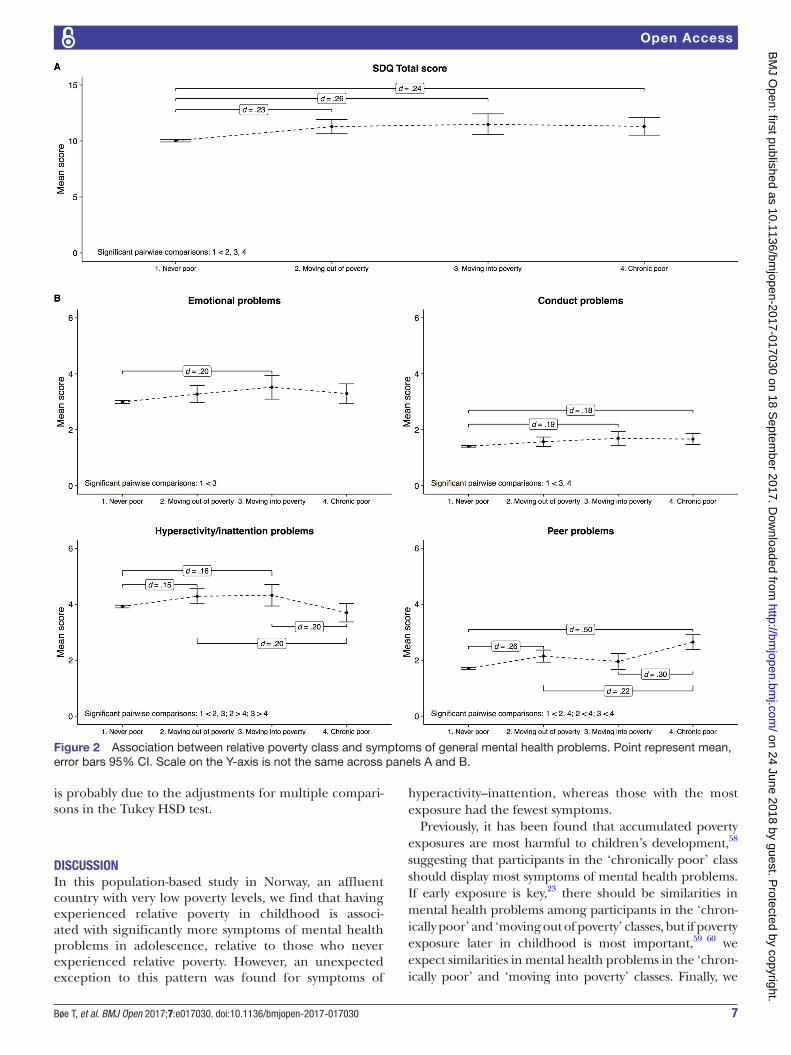
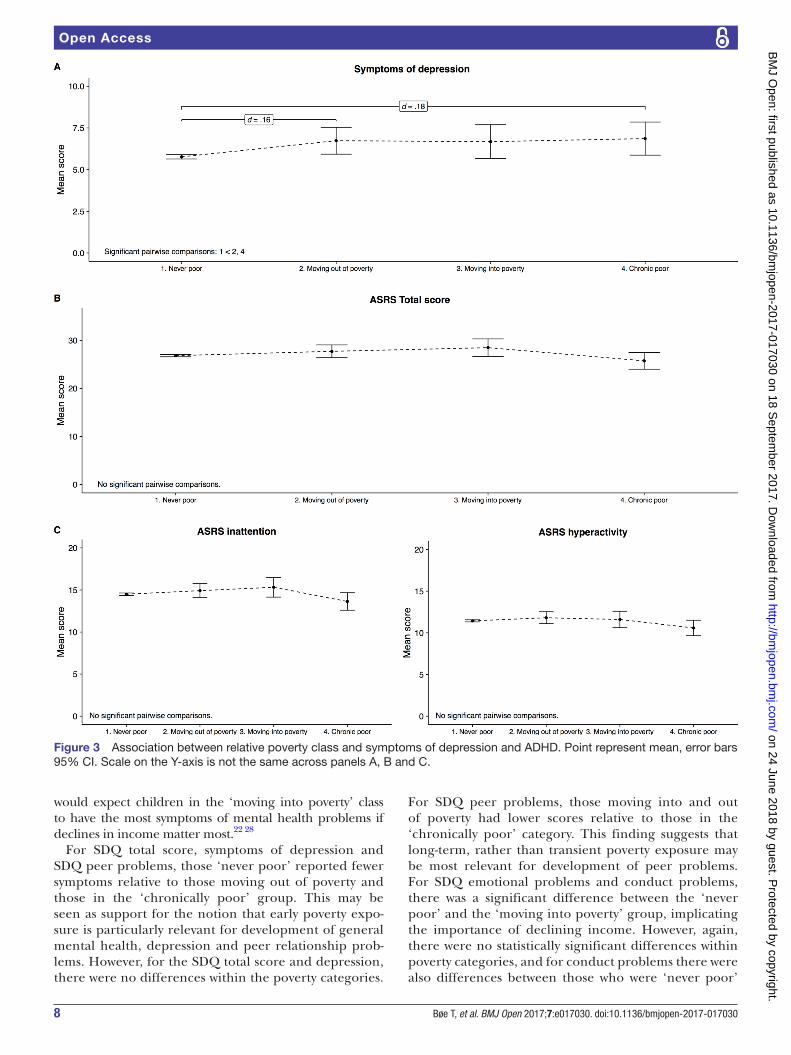
Generally, a pattern emerged where participants with a consistently low probability of being poor scored lower on mental health problems compared with participants with some exposure to relative poverty. For the SDQ total score, participants who were ‘never poor’ scored lower than participants who had experienced poverty, but there was no difference within the poverty exposure categories (see figure 2A). For emotional, conduct and hyperactivity–inattention problems, participants ‘never poor’ scored significantly lower relative to those who were moving into poverty, and for conduct problems, also rela-tive to those ‘chronically poor’ (all p<0.05, see figure 2B). Participants in the ‘never poor' category also scored lower on peer problems and symptoms of depression relative to those ‘chronically poor’ and those ‘moving out of poverty’ (see figure 2B and 3A). For peer problems, there were also significant differences within the poverty categories, where those ‘chronically poor’ had a higher symptom score relative to those moving into or out of poverty. Differences within poverty categories were also observed for symptoms of hyperactivity–inattention, but the pattern was reversed, and ‘chronically poor’ participants had the lowest score. A similar, non-significant, trend was also observed for symptoms of hyperactivity–inattention measured with the ASRS total score and for inattention and hyperactivity/impulsivity (see figure 3B,C).
robustness checksThe results from the robustness checks using observed data were largely consistent with those obtained from the LCA. Those who never had experienced poverty had significantly lower scores on all mental health outcomes (Cohen’s d=0.09-.27, besides symptoms of hyperactivity/inattention measured with the ASRS; Cohen’s d=0.05) compared with those with any poverty exposure. Compar-isons were also made between those categorised as never poor, those poor early and those poor late, and there was a significant main effect of categorisation for all mental health outcomes (all p<0.05). For the SDQ total score, conduct problems and hyperactivity, those poor early
Table 1 Model fit statistics for two through six classes
Number of classes AIC
Sample-size adjusted BIC Entropy LMR-LRT
Parametric bootstrapped likelihood ratio test
2 18 480.168 18 538.862 0.947 <0.001 <0.001
3 18 103.726 18 193.723 0.946 <0.001 <0.001
4 17 808.447 17 929.748 0.929 <0.001 <0.001
5 17 728.302 17 880.907 0.939 <0.001 <0.001
6 17 702.906 17 886.814 0.943 0.078 <0.001
Bold indicates the selected model (n=9154).AIC, Akaike information criterion; BIC, Bayesian information criterion; LMR-LRT, Lo-Mendell-Rubin adjusted likelihood ratio test.
on 24 June 2018 by guest. Protected by copyright.
http://bmjopen.bm
j.com/
BM
J Open: first published as 10.1136/bm
jopen-2017-017030 on 18 Septem
ber 2017. Dow
nloaded from
6 Bøe T, et al. BMJ Open 2017;7:e017030. doi:10.1136/bmjopen-2017-017030
Open Access
and late had significantly higher scores than those who had never been exposed to relative poverty (Cohen’s d=0.24−0.27), but did not differ from each other. For SDQ emotional problems and symptoms of depression (measured with SMFQ), those never poor had lower scores than those poor early (Cohen’s d=0.12−0.17), but not those poor later. For SDQ peer problems, those in
early relative poverty had significantly higher scores than those late or never below the poverty line (Cohen’s d=0.09−0.29). For hyperactivity/inattention measured with ASRS, the test of pairwise comparisons did not reveal any differences between groups (all p>0.05), although the ANOVA did show a main effect (p=0.032) and the never poor group had the lowest mean score. This discrepancy
Table 2 Descriptive characteristics of sample stratified by classes of family income during childhood (n=9154)
Never poorMoving into poverty
Moving out of poverty
Chronically poor p Value
N 8337 210 321 286
Age, median (year) 17.34 17.14 17.18 17.33 0.057
Man % (n) 47.1 (3924) 47.6 (100) 49.5 (159) 45.1 (129) 0.742
Foreign % (n) 3.7 (303) 13.5 (27) 15.2 (47) 42.6 (118) <0.001
Single parent % (n) 15.3 (1135) 32.8 (59) 28.6 (78) 29.6 (69) <0.001
Perceived economic well-being % (n) <0.001
Poorer than others 5.9 (480) 18.4 (38) 14.0 (43) 26.4 (72)
Equal to others 67.8 (5501) 60.2 (124) 68.7 (211) 56.8 (155)
Better than others 26.3 (2138) 21.4 (44) 17.3 (53) 16.8 (46)
Highest education in family % (n) <0.001
Elementary 3.7 (304) 6.4 (13) 8.3 (26) 10.9 (30)
Intermediate 30.7 (2532) 35.6 (72) 35.4 (111) 31.2 (86)
Higher 46.9 (3859) 34.7 (70) 31.5 (99) 31.5 (87)
Unknown 18.7 (1541) 23.3 (47) 24.8 (78) 26.4 (73)
Maternal work affiliation % (n) <0.001
Work 93.4 (7331) 77.3 (143) 81.8 (239) 66.1 (160)
Benefits 3.8 (300) 15.1 (28) 11.6 (34) 20.2 (49)
Other 2.8 (216) 7.6 (14) 6.5 (19) 13.6 (33)
Paternal work affiliation % (n) <0.001
Work 95.8 (7257) 88.3 (159) 88.5 (238) 76.8 (179)
Benefits 2.8 (212) 8.3 (15) 7.4 (20) 14.6 (34)
Other 1.4 (107) 3.3 (6) 4.1 (11) 8.6 (20)
Table 3 Mental health variables in adolescence stratified by classes of family income during childhood (n=9154)
Never poorM (SD)
Moving into povertyM (SD)
Moving out of povertyM (SD)
Chronically poorM (SD) Χ2 df p Value
Pairwise comparisons
SDQ total 10.03 (0.06) 11.28 (0.32) 11.49 (0.48) 11.31 (0.40) 41.365 3 <0.001 1<2, 3, 4
Emotion 2.99 (0.03) 3.28 (0.16) 3.52 (0.22) 3.29 (0.18) 14.792 3 0.002 1<3
Conduct 1.41 (0.02) 1.57 (0.09) 1.69 (0.13) 1.67 (0.10) 19.139 3 <0.001 1<3, 4
Hyper 3.92 (0.02) 4.29 (0.14) 4.32 (0.20) 3.70 (0.17) 12.019 3 0.007 1<2, 3; 2>4; 3>4
Peer 1.71 (0.02) 2.15 (0.11) 1.95 (0.15) 2.65 (0.13) 77.107 3 <0.001 1<2, 4; 2<4; 3<4
Depression 5.77 (0.07) 6.74 (0.41) 6.68 (0.52) 6.86 (0.51) 15.843 3 0.001 1<2, 4
ADHD 26.82 (0.12) 27.72 (0.68) 28.48 (0.93) 25.74 (0.88) 5.667 3 0.129 –
Inattention 14.49 (0.08) 14.92 (0.43) 15.33 (0.60) 13.63 (0.53) 4.704 3 0.195 –
Hyperactivity/ impulsivity
11.44 (0.06) 11.81 (0.37) 11.60 (0.50) 10.58 (0.48) 3.96 3 0.266 –
ADHD, attention-deficit/hyperactivity disorder; SDQ, Strengths and Difficulties Questionnaire.
on 24 June 2018 by guest. Protected by copyright.
http://bmjopen.bm
j.com/
BM
J Open: first published as 10.1136/bm
jopen-2017-017030 on 18 Septem
ber 2017. Dow
nloaded from
7Bøe T, et al. BMJ Open 2017;7:e017030. doi:10.1136/bmjopen-2017-017030
Open Access
is probably due to the adjustments for multiple compari-sons in the Tukey HSD test.
disCussiOnIn this population-based study in Norway, an affluent country with very low poverty levels, we find that having experienced relative poverty in childhood is associ-ated with significantly more symptoms of mental health problems in adolescence, relative to those who never experienced relative poverty. However, an unexpected exception to this pattern was found for symptoms of
hyperactivity–inattention, whereas those with the most exposure had the fewest symptoms.
Previously, it has been found that accumulated poverty exposures are most harmful to children’s development,58 suggesting that participants in the ‘chronically poor’ class should display most symptoms of mental health problems. If early exposure is key,23 there should be similarities in mental health problems among participants in the ‘chron-ically poor’ and ‘moving out of poverty’ classes, but if poverty exposure later in childhood is most important,59 60 we expect similarities in mental health problems in the ‘chron-ically poor’ and ‘moving into poverty’ classes. Finally, we
Figure 2 Association between relative poverty class and symptoms of general mental health problems. Point represent mean, error bars 95% CI. Scale on the Y-axis is not the same across panels A and B.
on 24 June 2018 by guest. Protected by copyright.
http://bmjopen.bm
j.com/
BM
J Open: first published as 10.1136/bm
jopen-2017-017030 on 18 Septem
ber 2017. Dow
nloaded from
8 Bøe T, et al. BMJ Open 2017;7:e017030. doi:10.1136/bmjopen-2017-017030
Open Access
would expect children in the ‘moving into poverty’ class to have the most symptoms of mental health problems if declines in income matter most.22 28
For SDQ total score, symptoms of depression and SDQ peer problems, those ‘never poor’ reported fewer symptoms relative to those moving out of poverty and those in the ‘chronically poor’ group. This may be seen as support for the notion that early poverty expo-sure is particularly relevant for development of general mental health, depression and peer relationship prob-lems. However, for the SDQ total score and depression, there were no differences within the poverty categories.
For SDQ peer problems, those moving into and out of poverty had lower scores relative to those in the ‘chronically poor’ category. This finding suggests that long-term, rather than transient poverty exposure may be most relevant for development of peer problems. For SDQ emotional problems and conduct problems, there was a significant difference between the ‘never poor’ and the ‘moving into poverty’ group, implicating the importance of declining income. However, again, there were no statistically significant differences within poverty categories, and for conduct problems there were also differences between those who were ‘never poor’
Figure 3 Association between relative poverty class and symptoms of depression and ADHD. Point represent mean, error bars 95% CI. Scale on the Y-axis is not the same across panels A, B and C.
on 24 June 2018 by guest. Protected by copyright.
http://bmjopen.bm
j.com/
BM
J Open: first published as 10.1136/bm
jopen-2017-017030 on 18 Septem
ber 2017. Dow
nloaded from
9Bøe T, et al. BMJ Open 2017;7:e017030. doi:10.1136/bmjopen-2017-017030
Open Access
and those ‘chronically poor’, so alternative interpreta-tions cannot be ruled out.
A curious finding was seen for symptoms of hyperac-tivity–inattention measured with the ASRS. Here the ‘never poor’ group had lower scores relative to those moving into or out of poverty, but not relative to the ‘chronically poor’ group. Participants in the ‘chron-ically poor’ group also had lower scores relative to those in the transient poverty groups. A similar trend was also observed when symptoms were measured with the SDQ. Previous studies do suggest that ADHD is associated with a range of socioeconomic indicators, including poor economic well-being and poverty,32 61 62 and as such, this unexpected finding warrants further investigation before firm conclusions can be reached.
In summary, the most consistent pattern of results appeared to be that participants who never experienced any poverty exposure had lower rates of mental health symptoms relative to participants with any exposure to poverty, and this pattern of results was confirmed across latent class analyses and in analyses using observed data. There was little evidence of associations between the timing and sequencing of exposure to low income and participant’s levels or types of mental health problems.
Public health implicationsThe increase in the proportion of children who grow up in poverty is concerning in light of the numerous studies that point to adverse short-term and long-term negative consequences of childhood poverty exposure.16 63 In the current study, poverty exposure was associated with single-parent households and more common among those with low parental education levels and lower parental workforce participation. Studies suggest that reforms or policies that reduce family unemployment in combination with progressive tax and benefit systems may be effective in reducing child poverty rates.64 Based on the findings from the current study, and many others, it is likely that reducing the number of children exposed to poverty will also have positive public health effects.
However, poverty influences on youth mental health are mainly indirect.13–16 This suggests that strategies targeting parental mental health, family conflict and parenting practices may also be viable compensatory strategies, as are interventions targeting many other domains.16 In doing so, however, it is imperative to not oversimplify the complexities of poverty and the stressful environment it produces for children and families.65
strengths and limitationsAmong the main strengths of the current study are the large sample size and use of well-validated measures of mental health problems developed for use with adoles-cents. A particular strength is the register-based informa-tion about income that allowed us to capture fluctuations in family income variation across childhood. This is the same information used by the Norwegian government to
estimate taxation and is considered reliable, precise and of high quality.
The main aim of this study was to investigate associa-tions between trajectories of low income and mental health, and as such, we did not assess the factors associ-ated with the actual trajectories themselves. There are several reasons why families experience fluctuations in income, such as changes in parental work affiliation or education levels, and structural changes in the family like divorce or reconstitution.5 Due to lack of historic infor-mation about such events, factors causally associated with different trajectories were not explicitly investigated in the current study. Information about mental health outcomes is self-reported using relatively brief measures. Although adolescents may provide accurate information about their own mental health,66 there would have been stronger support for the results had more comprehen-sive measures such as clinical evaluations been available. Another potential limitation relates to how we opera-tionalised low income. The below 60% of median income cut-off has received criticism for being arbitrary, and only indirectly reflecting living conditions.67 Still, it is the agreed international measure used throughout the European Union (EU)41 42 and is one of the most prom-inent and most-quoted of the EU social inclusion indica-tors. There are strengths and limitations to both absolute and relative measures of low income, and use of relative measures, such as those used in the current study, have their merits when used within countries to identify those at risk of poverty and social exclusion.30 Still, Norway has low levels of poverty and economic inequality, which may restrict generalisability of these results.
Non-participation in the study could affect general-isability, with a response rate of about 53% and with adolescents in schools over-represented. Unfortunately, non-participation in survey research is on the rise,68 and non-response is found related to lower socioeconomic status,69 that is, official data show that in 2012, 92% of all adolescents in Norway aged 16–19 years attended high school,38 compared with 98% in the current study. Previous research from the former waves of the Bergen Child Study (a longitudinal study nested within youth@hordaland) has also identified psychological problems as a predictor for non-participation.70 As the current sample may be skewed towards better socioeconomic status and psychological health, the results may be a conservative estimate of the number of adolescents growing up in poor families and their associated mental health problems.
Finally, LCA is probabilistic in nature, and the uncer-tainty of classification into the latent classes is expressed in the probability scale of being in either of the poverty trajectories at any given time during the period for which income information was available. As such, the classes may deviate from the results obtained if observed data had been used instead. However, the pattern of results was largely replicated in robustness checks using observed data, and the classes were associated with relevant socioeconomic
on 24 June 2018 by guest. Protected by copyright.
http://bmjopen.bm
j.com/
BM
J Open: first published as 10.1136/bm
jopen-2017-017030 on 18 Septem
ber 2017. Dow
nloaded from
10 Bøe T, et al. BMJ Open 2017;7:e017030. doi:10.1136/bmjopen-2017-017030
Open Access
factors in a meaningful way, increasing our confidence that the LCA has captured meaningful patterns in the income data. Still, the method does not give an indication of the magnitude of the economic transition (eg, moving from affluence to poverty may have greater consequences than moving from relative poverty to poverty).
COnClusiOnWe used LCA to investigate the association between exposure to low income in childhood and mental health problems in a large sample of Norwegian adolescents. No consistent pattern emerged regarding the timing or sequencing of exposure and associations with particular types of mental health problems in adolescence, rather, having any exposure to relative poverty in childhood appeared to be positively associated with mental health problems in adolescence.
Author affiliations1Regional Centre for Child and Youth Mental Health and Child Welfare, Uni Research Health, Bergen, Norway2Alcohol and Drug Research Western Norway, Stavanger University Hospital, Stavanger, Norway3Department of Health Promotion, Norwegian Institute of Public Health, Bergen, Norway4Department of Research and Innovation, Helse Fonna HF, Haugesund, Norway5Department of Psychological Medicine, University of Auckland, Auckland, New Zealand6Department of Counseling, Developmental, and Educational Psychology, Boston college, Boston, USA7Norwegian Center for Child Behavioral Development, University of Oslo, Oslo, Norway8Center for Educational Measurement, Faculty of Educational Sciences, University of Oslo, Oslo, Norway
Contributors TB: made substantial contributions to the conception and design of the work; the acquisition, analysis and interpretation of data for the work; drafted the work, approved the version to be published and is accountable for all aspects of the work. JCS: made substantial contributions to the analysis of data for the work; critically revised the work for important intellectual content, approved the version to be published and is accountable for all aspects of the work. BS and MH: made substantial contributions to the conception and design of the work, the acquisition of data for the work, critically revised the work for important intellectual content, approved the version to be published and is accountable for all aspects of the work. KP, ED and HDZ made substantial contributions to the interpretation of data for the work; critically revised the work for important intellectual content, approved the version to be published and is accountable for all aspects of the work.
Funding This work was supported by the Norwegian Research Council (grant number: 228189).
Competing interests None of the authors have any conflicts of interest, including specific financial interests and relationships and affiliations relevant to the subject matter or materials discussed in the manuscript.
Ethics approval The Regional Committee for Medical and Health Research Ethics in Western Norway.
Provenance and peer review Not commissioned; externally peer reviewed.
data sharing statement No additional data available.
Open Access This is an Open Access article distributed in accordance with the Creative Commons Attribution Non Commercial (CC BY-NC 4.0) license, which permits others to distribute, remix, adapt, build upon this work non-commercially, and license their derivative works on different terms, provided the original work is properly cited and the use is non-commercial. See: http:// creativecommons. org/ licenses/ by- nc/ 4. 0/
© Article author(s) (or their employer(s) unless otherwise stated in the text of the article) 2017. All rights reserved. No commercial use is permitted unless otherwise expressly granted.
rEFErEnCEs 1. Mcleod JD, Shanahan MJ. Trajectories of poverty and children's
mental health. J Health Soc Behav 1996;37:207–20. 2. McLeod JD, Shanahan MJ, Poverty SMJ. Poverty, parenting, and
Children's Mental Health. Am Sociol Rev 1993;58:351–66. 3. Blau DM. The effect of income on Child Development. Rev Econ Stat
1999;81:261–76. 4. Mayer SE. What money can't buy: family income and children's life
chances. Cambridge, Mass: Harvard University Press, 1997. 5. Wagmiller RL, Lennon MC, Kuang L, et al. The Dynamics of
Economic Disadvantage and Children's Life Chances. Am Sociol Rev 2006;71:847–66.
6. Dearing E, McCartney K, Taylor BA. Within-child associations between family income and externalizing and internalizing problems. Dev Psychol 2006;42:237–52.
7. Gennetian LA, Castells N, Morris P. Meeting the Basic Needs of Children: Does Income Matter? Child Youth Serv Rev 2010;32:1138–48.
8. Fletcher JM, Wolfe B. The importance of family income in the formation and evolution of non-cognitive skills in childhood. Econ Educ Rev 2016;54:143–54.
9. Conger RD, Conger KJ, Elder GH, et al. A family process model of economic hardship and adjustment of early adolescent boys. Child Dev 1992;63:526–41.
10. Grunberg L, Moore SY, Greenberg E. Differences in psychological and physical health among layoff survivors: the effect of layoff contact. J Occup Health Psychol 2001;6:15–25.
11. Dearing E, Taylor BA, McCartney K. Implications of family income dynamics for women's depressive symptoms during the first 3 years after childbirth. Am J Public Health 2004;94:1372–7.
12. Elder GH, Nguyen TV, Caspi A. Linking family hardship to children's lives. Child Dev 1985;56:361–75.
13. Yeung WJ, Linver MR, Brooks-Gunn J. How money matters for young children's development: parental investment and family processes. Child Dev 2002;73:1861–79.
14. Gershoff ET, Aber JL, Raver CC, et al. Income is not enough: incorporating material hardship into models of income associations with parenting and child development. Child Dev 2007;78:70–95.
15. Bøe T, Sivertsen B, Heiervang E, et al. Socioeconomic status and child mental health: the role of parental emotional well-being and parenting practices. J Abnorm Child Psychol 2014;42:705–15.
16. Yoshikawa H, Aber JL, Beardslee WR. The effects of poverty on the mental, emotional, and behavioral health of children and youth: implications for prevention. Am Psychol 2012;67:272–84.
17. Duncan GJ, Rodgers W. Has Children's Poverty Become More Persistent? Am Sociol Rev 1991;56:538–50.
18. Devicienti F. Estimating poverty persistence in Britain. Empir Econ 2011;40:657–86.
19. Guo G. The timing of the influences of cumulative poverty on Children's Cognitive Ability and Achievement. Social Forces 1998;77:257–87.
20. Ashworth K, Hill M, Walker R. Patterns of Childhood Poverty: New challenges for policy. Journal of Policy Analysis and Management 1994;13:658–80.
21. National Research Council (US) and Institute of Medicine (US) Committee on the Prevention of Mental Disorders. Using a Developmental Framework to Guide Prevention and Promotion. In: O'Connell ME, Boat T, Warner KE, eds. Preventing mental, emotional, and Behavioral Disorders among Young People Progress and Possibilities. US: National Academies Press, 2009.
22. Dearing E, McCartney K, Taylor BA. Change in family income-to-needs matters more for children with Less. Child Dev 2001;72:1779–93.
23. Duncan GJ, Yeung WJ, Brooks-Gunn J, et al. How much does Childhood Poverty affect the Life chances of Children? Am Sociol Rev 1998;63:406–23.
24. Votruba-Drzal E. Economic disparities in middle childhood development: does income matter? Dev Psychol 2006;42:1154–67.
25. Najman JM, Clavarino A, McGee TR, et al. Timing and chronicity of family poverty and development of unhealthy behaviors in children: a longitudinal study. J Adolesc Health 2010;46:538–44.
26. National Institute of Child Health and Human Development Early Child Care Research Network. Duration and developmental timing of poverty and children's cognitive and social development from birth through third grade. Child Dev 2005;76:795–810.
on 24 June 2018 by guest. Protected by copyright.
http://bmjopen.bm
j.com/
BM
J Open: first published as 10.1136/bm
jopen-2017-017030 on 18 Septem
ber 2017. Dow
nloaded from
11Bøe T, et al. BMJ Open 2017;7:e017030. doi:10.1136/bmjopen-2017-017030
Open Access
27. Zachrisson HD, Dearing E. Family income dynamics, early childhood education and care, and early child behavior problems in Norway. Child Dev 2015;86:425–40.
28. Moore KA, Glei DA, Driscoll AK, et al. Poverty and Welfare patterns: implications for Children. J Soc Policy 2002;31:207–27.
29. OECD. Divided we stand. Why inequality keeps rising. 2011 ht tp:/ /www .oec d.or g/el s/soc/ dividedw estan dwhy ineq uali tyke epsr ising. htm (accessed 6 Jul2016).
30. UNICEF Innocenti Research Center. Report card 10: measuring child poverty. New league tables of child poverty in the world's richest coutries. Florence: UNICEF Innocenti Research Center, 2012.
31. Bøe T, Hysing M, Zachrisson HD. Low Family Income and Behavior Problems in Norwegian Preschoolers. Journal of Developmental & Behavioral Pediatrics 2016;37:213–22.
32. Bøe T, Øverland S, Lundervold AJ, et al. Socioeconomic status and children's mental health: results from the Bergen Child Study. Soc Psychiatry Psychiatr Epidemiol 2012;47:1557–66.
33. Riksrevisjonen. Riksrevisjonens undersøking av barnefattigdom. Dokument 3:11 (2013-2014): Fagbokforlaget AS, 2014.
34. UNICEF Innocenti Research Center. Report card 6: child poverty in rich countries. Florence, 2005.
35. OECD - Social Policy Division - Directorate of Employment, Labour and Social Affairs. CO2.2: Child poverty. http://www. oecd. org/ els/ family/ database. htm. 2016 http://www. oecd. org/ els/ soc/ CO_ 2_ 2_ Child_ Poverty. pdf (accessed 26 Jan 2017).
36. Wagmiller RL. The Temporal Dynamics of Childhood Economic Deprivation and Children's Achievement. Child Dev Perspect 2015;9:158–63.
37. Statistics Norway. Income and wealth statistics for households, 2012. 2012 https://www. ssb. no/ en/ inntekt- og- forbruk/ statistikker/ ifhus/ aar/ 2013- 12- 18
38. The Directorate of Integration and Diversity (IMDi). Education participation in high schools. h ttp ://www.imdi.nono Fak ta-o g-st atis tikk Fakt a-og- stat istik kUtdanningtabchr. http://www. imdi. no/ no/ Fakta- og- statistikk/ Fakta- og- statistikk/ Utdanning/? tab= chr2012 (accessed 12 Jun 2017).
39. Hysing M, Harvey AG, Linton SJ, et al. Sleep and academic performance in later adolescence: results from a large population-based study. J Sleep Res 2016;25:318–24.
40. Vos K, Zaidi MA. Equivalence scale sensitivity of poverty statistics for the member states of the european community. Rev Income Wealth 1997;43:319–33.
41. Bardone B, Guio G. In-Work Poverty: new commonly agreed indicators at the EU level, 2005.
42. EUROSTAT. Glossary: at-risk-of-poverty rate. 2014. http:// ec. europa. eu/ eurostat/ statistics- explained/ index. php/ Glossary: At- risk- of- poverty_ rate (accessed 7 Nov2016).
43. Goodman R. The strengths and difficulties Questionnaire: a research note. J Child Psychol Psychiatry 1997;38:581–6.
44. Goodman R, Ford T, Simmons H, et al. Using the strengths and difficulties questionnaire (SDQ) to screen for child psychiatric disorders in a community sample. Br J Psychiatry 2000;177:534–9.
45. Gadermann AM, Guhn M, Zumbo BD. Estimating ordinal reliability for Likert-type and ordinal item response data: a conceptual, empirical, and practical guide. Practical Assessment. Research Evaluation 2012;17:1–13.
46. Muris P, Meesters C, van den Berg F. The Strengths and Difficulties Questionnaire (SDQ)-further evidence for its reliability and validity in a community sample of Dutch children and adolescents. Eur Child Adolesc Psychiatry 2003;12:1–8.
47. Angold A, Costello EJ, Messer SC, et al. Development of a short questionnaire for use in epidemiological studies of depression in children and adolescents. Int J Methods Psychiatr Res 1995;5.
48. Turner N, Joinson C, Peters TJ, et al. Validity of the short mood and feelings questionnaire in late adolescence. Psychol Assess 2014;26:752–62.
49. Sharp C, Goodyer IM, Croudace TJ. The short mood and feelings questionnaire (SMFQ): a unidimensional item response theory
and categorical data factor analysis of self-report ratings from a community sample of 7-through 11-year-old children. J Abnorm Child Psychol 2006;34:365–77.
50. Lundervold AJ, Breivik K, Posserud MB, et al. Symptoms of depression as reported by norwegian adolescents on the short mood and feelings questionnaire. Front Psychol 2013;4:613.
51. Kessler RC, Adler L, Ames M, et al. The World Health Organization Adult ADHD Self-Report Scale (ASRS): a Short screening scale for use in the General population. Psychol Med 2005;35:245–56.
52. Kessler RC, Adler LA, Gruber MJ, et al. Validity of the World Health Organization Adult ADHD Self-Report Scale (ASRS) Screener in a Representative sample of health plan members. Int J Methods Psychiatr Res 2007;16:52–65.
53. Adler LA, Shaw DM, Spencer TJ, et al. Preliminary examination of the reliability and concurrent validity of the attention-deficit/hyperactivity disorder self-report scale v1.1 symptom checklist to rate symptoms of attention-deficit/hyperactivity disorder in adolescents. J Child Adolesc Psychopharmacol 2012;22:238–44.
54. Collins LM, Lanza ST. Latent class and latent transition analysis. Hoboken, NJ, USA: John Wiley & Sons, Inc, 2009.
55. Muthén LK, Muthén BO. Mplus user's Guide. 7 ed. Los Angeles, CA: Muthén & Muthén, 2012.
56. Asparouhov T, Muthen B. Auxiliary Variables in Mixture Modeling: Using the BCH Method in Mplus to Estimate a Distal Outcome Model and an Arbitrary Secondary Model. statmodel. com. 2015. http://www. statmodel. com/ examples/ webnotes/ webnote21. pdf (accessed 6 Jul 2016).
57. R Core Team. R: a language and environment for Statistical Computing. Vienna, Austria: R Foundation for Statistical Computing, 2016.
58. Duncan GJ, Brooks-Gunn J, Klebanov PK. Economic deprivation and early childhood development. Child Dev 1994;65:296–318.
59. Galambos NL, Silbereisen RK. Income Change, Parental Life Outlook, and Adolescent Expectations for Job Success. J Marriage Fam 1987;49:141.
60. National Institute of Child Health and Human Development Early Child Care Research Network. Duration and developmental timing of poverty and children's cognitive and social development from birth through third grade. Child Dev 2005;76:795–810.
61. Russell G, Ford T, Rosenberg R, et al. The association of attention deficit hyperactivity disorder with socioeconomic disadvantage: alternative explanations and evidence. J Child Psychol Psychiatry 2014;55:436–45.
62. Webb E. Poverty, maltreatment and attention deficit hyperactivity disorder. Arch Dis Child 2013;98:397–400.
63. Duncan GJ, Ziol-Guest KM, Kalil A. Early-childhood poverty and adult attainment, behavior, and health. Child Dev 2010;81:306–25.
64. Whiteford P, Adema W. What Works best in reducing Child Poverty: a Benefit or Work Strategy? OECD: Directorate for Employment, Labour and Social Affairs, 2007. http://www. oecd. org/ els
65. Wadsworth ME, Ahlkvist JA. Inequality Begins Outside the Home: Putting Parental Educational Investments into Context. Families in an era of increasing inequality. Cham: Springer International Publishing, 2015:95–103.
66. Bevans KB, Forrest CB. The reliability and validity of children’s and adolescents’ self-reported health. Economic evaluation in Child Health: Oxford University Press, 2010:33–54. doi.
67. Bradshaw J, Mayhew E. The measurement of extreme poverty in the European Union: Directorate-General for Employment, Social Affairs and Inclusion, European Union, 2011.
68. Morton SM, Bandara DK, Robinson EM, et al. In the 21st Century, what is an acceptable response rate? Aust N Z J Public Health 2012;36:106–8.
69. Galea S, Tracy M. Participation rates in epidemiologic studies. Ann Epidemiol 2007;17:643–53.
70. Stormark KM, Heiervang E, Heimann M, et al. Predicting nonresponse bias from teacher ratings of mental health problems in primary school children. J Abnorm Child Psychol 2008;36:411–9.
on 24 June 2018 by guest. Protected by copyright.
http://bmjopen.bm
j.com/
BM
J Open: first published as 10.1136/bm
jopen-2017-017030 on 18 Septem
ber 2017. Dow
nloaded from