Embed Size (px)
Citation preview

52 The Open Construction & Building Technology Journal, 2009, 3, 52-67
1874-8368/09 2009 Bentham Open
Open Access
R/C Existing Structures with Smooth Reinforcing Bars: Experimental Behaviour of Beam-Column Joints Subject to Cyclic Lateral Loads
Franco Braga2, Rosario Gigliotti
2 and Michelangelo Laterza
*,1
1Department of Structural and Geotechnical Engineering, University of Rome, La Sapienza, Italy;
2Department of
Structural, Geotechnical and Geological Engineering, University of Basilicata, Potenza, Italy
Abstract: The paper illustrates the results of experimental tests performed on sub-assemblages of R/C (Reinforced
Concrete) existing structures, designed only for gravity loads In order to estimate failure mechanisms and ductility
properties, four internal and external R/C beam-column joints were built and tested. The specimens were built by using
concrete with low strength and smooth reinforcing bars, without hoops into the panel zone. The tests were performed by
increasing cyclic horizontal displacements up to the collapse. The experimental results show that seismic response of
these kind of structures is mainly influenced by bond slips of longitudinal bars, and that the shear collapse regards
external joints rather the internal ones. Failure mechanisms observed (column plastic hingings for internal joints, shear
failure for external joints) point out the vulnerability of these structures due to the soft storey mechanism. The study is
significant for better understanding of the inelastic seismic behavior of the R/C existing buildings with smooth bars, and
for evaluating the effectiveness of the model classical assumptions.
Keywords: R/C structures, beam-column joints, smooth bars, joint shear strength, bond-slips, experimental tests.
INTRODUCTION
Evaluation of the seismic response of existing R/C. structures designed only for gravity loads requires the know-ledge of failure mechanisms and their interactions.
In particular, as conspicuously shown by the past earthquakes and especially by the last severe Turkish seismic event [1], the main failure mechanisms are: plastic hinging of lower and upper columns; joint shear cracking, beams plastic hinges not only at the ends; longitudinal bar bond-slips, both in beams and in columns (particularly with smooth bars [1]).
Limited informations are available in literature to date concerning R/C beam-column sub-assemblages reinforced with smooth bars. Many researchers have been carried out experimental tests on typical beam-column joints of existing R/C structures and have developed relevant behavioural models [2-12]. However, the majority of these sub-assem-blages are referred to structures that are significantly different from the built existing structures with smooth reinforcing bars until the ‘70s in the Mediterranean area and particularly in Italy.
In order to investigate the failure mechanisms and their interactions, lateral displacement cyclic tests have been carried out on four beam-column joints, one external (T-Joint) and three internal (C-Joint). The sub-assemblages are
*Address correspondence to this author at the Department of Structural and
Geotechnical Engineering, University of Rome, La Sapienza, Italy;
Department of Structural, Geotechnical and Geological Engineering,
University of Basilicata, Potenza, Italy; Fax: +39 0971 205070; Tel: +39
0971 205057;
E-mail: [email protected] and laterza.home@gmail
similar to the specimens tested in [8], except for the presence of inclined shear bars into the specimen beams tested in this work. This similarity is due to the same 2D frame (Fig. 1) designed only for gravity loads and used as prototype frame during a co-ordinate research activity on seismic behavior of existing R/C structures in Italy (National project “PRIN 1998”, funded by the Italian Ministry of University).
Fig. (1). Prototype R/C frame (all dimensions are in cm).
EXPERIMENTAL INVESTIGATION
The experimental study, object of the present paper, refers to a prototype structure, which is a representative example of an inadequate seismic design. The prototype frame, whose geometry was chosen from a structural

R/C Existing Structures with Smooth Reinforcing Bars The Open Construction & Building Technology Journal, 2009, Volume 3 53
typology, consists of 3 floors and 3 spans (Fig. 1). It repre-sents a tipical structure built in Italy in the '50s-'70s and designed to resist only to vertical loads in according to the regulations in force during that period [13, 14].
The tested sub-assemblages represent an external and an internal joint of the frame described above.
Test Specimens and Materials
The beam-column specimens are named as follows: internal joints (C-Joints) as C11-1, C23-1 and C23-2 (two joints with the same details); and the external ones (T-Joint) as T23-1 (11 is the full scale and 23 represents the 2:3 scale). The specimens are reinforced with smooth bars whose diameters are 18 mm and 12 mm for the longitudinal reinforcements and 6 mm for the stirrups. These values are reduced to 12 mm, 8 mm and 4 mm in the case of 2:3 scale. The Fig. (2) shows the joint reinforcement details, while the Fig. (3) represents some steps of the manufacturing process, such as the preparation of the formwork, the reinforcement details and the concrete cast. As it is clearly visible from the figures, the specimens are built horizontally and monoli-thically, and this does not allow neither the effects evaluation of the construction of each joint nor the possible different concrete consolidation along the columns. On the other hand, this way of building up the specimens avoids the influence on the test of other secondary variables. The frame shows the same typical structural characteristics of the existing buil-dings designed only for gravity loads. They can be summa-rized as follows:
1) Inadequate confinement at the critical regions of the elements;
2) Lack of transverse reinforcement in the joint panel;
3) Inadequate longitudinal reinforcements of the columns;
4) Low quality of materials (such as concrete and steel) if one has to compare them with the properties required currently in seismic areasin particular:
a) use of smooth bars in both longitudinal and transverse reinforcements;
b) use of concrete with low strength values.
Fig. (3). Beam-column joints manufacturing process.
All specimens were cast at the same time using a concrete having average cubic compressive strength, after 30 curing days, equal to 17.5 MPa. The yield strength of the steel bars were 350 MPa, 325 MPa and 345 MPa, for the 8 mm, 12 mm and 18 mm diameter bars, respectively.
Fig. (2). External T-Joint and Internal C-Joint reinforcements (all dimensions are in cm and diameter of bars are in mm).
L = 162 (pos. 0)
C-Joint
2:3 Scale
T-Joint
2:3 Scale
L =
11
4
L =
11
4
L =
11
4
L =
11
4
2 Ø
12
2 Ø
12
2 Ø
12
2 Ø
12
L =
17
9
L =
17
9
L = 162 (0)
L = 168 (1 - 3)
L = 145 (1)
84
2 Ø 8
2 Ø 8
1 Ø 12
1 Ø 12
1 Ø 12
1 Ø 12
141
4Ø4/512Ø4/10
16
40.5L = 97 (3)
141
10
30L = 180 (2)
13816
40.5
40.5
79
58
14
8
84
148
1 Ø 12
L = 230 (1)1 Ø 12
2 Ø 8
2 Ø
12
2 Ø
12
2 Ø
12
2 Ø
12
L =
17
9
L =
17
9
84
14
8
84
148
L = 211 (pos. 0)
40.5
3Ø4/5
4Ø4/1012Ø4/104Ø4/5
190
40.5
L = 154 (2)1 Ø 12
L = 211 (0)
L = 230 (3)
L = 191 (2)1 Ø 12
2 Ø 8
L = 157 (1)
1 Ø 12
35
87
7042
72
16016
2035
17
117
40.5
16190
20.0 132.0
152.0
19
9.3
72
.73
3.3
93.3
132.0 20.0 48.7
200.7
72
.73
3.3
93
.3
19
9.3
1,3
cm
Ø12bars diamØ410 cmHoop Space
Hoop diam
03 1,3
cm
10pos.
2
Column
20 cm
andbars diamØ8
20 c
m
Ø12
Beam20 cm
33,3
cm

54 The Open Construction & Building Technology Journal, 2009, Volume 3 Braga et al.
Tests Set-up and Instrumentation
The way of carrying out this kind of tests, that is most commonly used, has the aim to reproduce, in the beam-column subset (ABC = T-Joint; CDEF = C-Joint), the same deformed shape that it would have in the whole structure under the effect of horizontal actions (Fig. 4).
It is useful to underline that such a test does not effectively describe the real behavior of the beam-column subset, because the illustrated outline gives the same shear value on both the upper and lower column. On the contrary, the shears are different because of the inertia force acting at the floor level. The described method of carrying out the test,
however, gives detailed informations about the response mechanisms of the beam-column joints. The tests, object of this paper, have been carried out in a quasi-static way applying to the upper column a time-history of displace-ments, composed by groups of three cycles with an increasing magnitude and a constant rate (equal to 1 mm/sec and 1.5 mm/sec for the 2:3 scale joints (Fig. 4) and for the full-scale C11-1 joint, respectively). It is worth to underline that the values of the displacements and of the vertical loads applied to the specimens in scale 2:3 were chosen in order to determine the same stress state of beam-column joints in scale 1:1. The applied vertical load is equal to 120 kN for the joints in the 2:3 scale and to 270 kN for the C11-1 joint. It
Fig. (4). Seismic deformation of prototype frame and displacement pattern applied to tested joints.
Nodo a T
Nodo a C
A
B
C
E
D
F
C-Joint
T-Joint
-140
-120
-100
-80
-60
-40
-20
0
20
40
60
80
100
120
140
0 1500 3000 4500 6000 7500 9000 10500
Hor
izon
tal
Dis
plac
emen
t (m
m)
Time (sec)
vs = 1 mm/sec
1%
2%
3%
4%
5%
6% 7%

R/C Existing Structures with Smooth Reinforcing Bars The Open Construction & Building Technology Journal, 2009, Volume 3 55
Fig. (5). C-Joints test setup: (a) (C23-1, C11-1) P axial; (b) (C23-2)
P vertical (P ).
represents the gravity load which acts on the base columns of the prototype structure, and was approximately equal to 0.15 Ag fc’, where Ag is the cross-section and fc’ is the compressive strength of concrete. The vertical load was applied at the head of the upper column, following two distinct directions
(Fig. 5): axially, for the C23-1 and C11-1 joints, as well as for the external T23-1 joint; and along the vertical one, for the C23-2 joint in order to simulate the P- effect Fig. (10) shows the test setup. The control on the horizontal displace-ments was performed using an actuator of +490 kN / -290 kN, connected to a R/C reaction wall and to the column head by hinges. The gravity load was applied using a jack with a capacity of 1500 kN. The system used to apply the gravity load is made of two steel plates and four bars behaving as ties. The system is internally self-equilibrated in case of gravity load axially applied. Therefore only the column shear is transmitted to the base hinge.
In the test with P- effect, whereas, the basic hinge also absorbs the axial force of the column, while the contrast system acts as a hinged parallelogram. In order to gauge the significant strains of the beam-column joints, a system of linear transducers (LVDT) was used. It was arranged according to the Fig. (6) layout.
Fig. (6). Local and global displacement transducers (all dimensions are in cm).
(a)
(b)
hF
P
hF
P
33
,3
20
15
11,5
11,5
11,5
11,5
11
,5
11
,5
24
,3
11
,5
11
,5
5
1
3
6
2
4
15 16
17 18
19
11 12
20
14
7 8 9 10
13
11
,5
11
,5
27
,5
11
,5
11
,5
33
,3
20
33 15,3
11,5
11,5
11,5
11,5
7
5
1
3
6
2
4
8 9 10 11
12
13 14
15 16 17 18
19 20
TF1
TF2
TF3 TF4

56 The Open Construction & Building Technology Journal, 2009, Volume 3 Braga et al.
The horizontal displacement at the top of the upper column was measured by a transducer with a stroke of 300 mm. The same kind of transducer was used to measure the horizontal and vertical displacements next to the steel rods. Six linear transducers of 25 mm and ±50 mm were arranged on a side of the joint panel, in order to gauge any deformation due to diagonal cracks. At a distance of 35 mm from the upper and lower beam edges, starting from the joint panel, several linear transducers were arranged to quantify the flexural strains. Similarly, some transducers of ±10 mm were arranged in the upper and lower columns to quantify the flexural strains.
The rules adopted to evaluate rotations and curvatures are shown in Fig. (7). The clockwise joint rotation and the cor-responding curvatures of the members (beams or columns) are assumed to be positive. The rotation between the ends (ij and hk faces) of the column element ijhk is given by the equation (1):
c=
ij hk
dp
(1)
where dp is the distance between the left and the right transducers. The average curvature is given by the equation (2):
c
=c
lc
(2)
where lc is the length of the examined column block. Thus, the element average moment is referred to the midway section m-m between the ends. Just for the first element of the columns it was assumed to refer the moment to the AB section (Fig. 7). In order to control the axial load applied to the column and to quantify the rod reaction (shear in beams), load cells of ±200 kN were used. One cell was located between the vertical jack and the top of the column, while the following two were located between the hinge and the steel rod, at the end of the beams. A cell of ±500 kN was used to quantify the applied horizontal force (floor shear).
EXPERIMENTAL RESULTS AND DISCUSSION
As highlighted by the performed tests, in the existing structures, that are not designed to resist to horizontal actions, the small size of the column cross section and the poor longitudinal reinforcement are the main failure cause. The “soft storey mechanism”, shown by the C-Joints, is governed by the bond-slip of the columns longitudinal bars and the yielding is concentrated at the end of the columns. Moreover, the low flexural stiffness of the columns, and the decreasing secant stiffness in the cyclic behavior, do not permit the activation of other mechanisms. The response of the external joint (T-Joint) to horizontal displacements, besides, is governed by the joint panel failure.
Specimen C23-1
Fig. (8) shows the experimental relation occurring between the imposed horizontal displacement and the force applied by the actuator to the C23-1 joint, and moment-curvature diagram at the base of the top column. All cracks in the beam-column joint occurred during the first three cycle groups (max inter-storey drift = 0.75%). The Fig. (9) shows the cracks pattern, specified as follows:
• diagonal micro-cracks within the joint panel;
• flexural cracking of the columns at the interface with the joint panel;
• flexural cracks in the columns at approximately 12 cm from the joint panel;
• flexural crack of the long beam at the interface with the joint panel;
• flexural crack of the long beam at the last longitudinal barbend.
Starting from the fourth group of cycles (drift 1%) the yielding is concentrated in both the upper and the lower columns, with a sub-sequential increase of the curvatures and a progressive loss of the cover. The hysteresis loops show a low dissipative capacity due to the slips of the
Fig. (7). Rotation and curvature measurements in the columns.
jhM
i
2H
hF
th
ph
pd
td
k
j h
ijijl δ+
ik
j
h
pd
hkhkl δ−
ikMvR
ABM
AiAil δ+
A B
ik
A B
C D
md
BkBkl δ+
m-m
R/C Existing Structures with Smooth Reinforcing Bars The Open Construction & Building Technology Journal, 2009, Volume 3 57
longitudinal bars. The loss of bond determines a progressive decrease of the secant stiffness at each displacement incre-ment, reducing the positive effects of the steel yielding on the energy dissipation.
The presence of consistent slips is also confirmed by the limited number of the cracks and by their amplitude. The maximum strengths measured, in terms of horizontal force, are: 21.22 kN at the 2.5% drift, and 22.71 kN at the -2.5% drift. The maximum displacement reached during the test was equal to 140 mm (7% drift); at this displacement the strength was equal to 10 kN in the first cycle and 5.35 kN ( 25% of maximum strength) in the third cycle. From the force-displacement relationship can be observed that, except for the last group of the cycles, the strength reduction between one cycle and the following one tends to decrease. This fact highlights a trend towards the stabilization of the degrade mechanisms that is the source of the ductile
behavior shown by the columns. This behavior discriminates considerably the members reinforced with smooth bars, from the ones reinforced with deformed bars in which the slips occurs with a much more remarkable bonddegradation. As the plastic strains were concentrated at the column ends, the curvatures (Fig. 8) were calculated by using the displacement values of the 3-5 and 4-6 transducers for the upper column, and the 13-19 and 14-20 transducers for the lower one. The moments calculated at the interface with the joint panel,
which are equal for both columns, are given by the relation:
MPs
= MPi
= Fh
H
2 (3)
where H is the inter-storey height. The average curvatures in the elements at the column ends were measured by the relations (1) and (2).
Fig. (8). C23-1 specimen: Force-Displacement experimental relationship and Moment-Curvature of the upper column.
-25
-20
-15
-10
-5
0
5
10
15
20
25
-150 -100 -50 0 50 100 150
Forc
e (
kN)
Displacement (mm)
Drift = 7 %
-20
-15
-10
-5
0
5
10
15
20
-0,0006 -0,0004 -0,0002 0 0,0002 0,0004 0,0006 0,0008
Mom
ent
(kN
m)
Curvature (1/mm)
Drift - 5%
Drift + 5%
58 The Open Construction & Building Technology Journal, 2009, Volume 3 Braga et al.
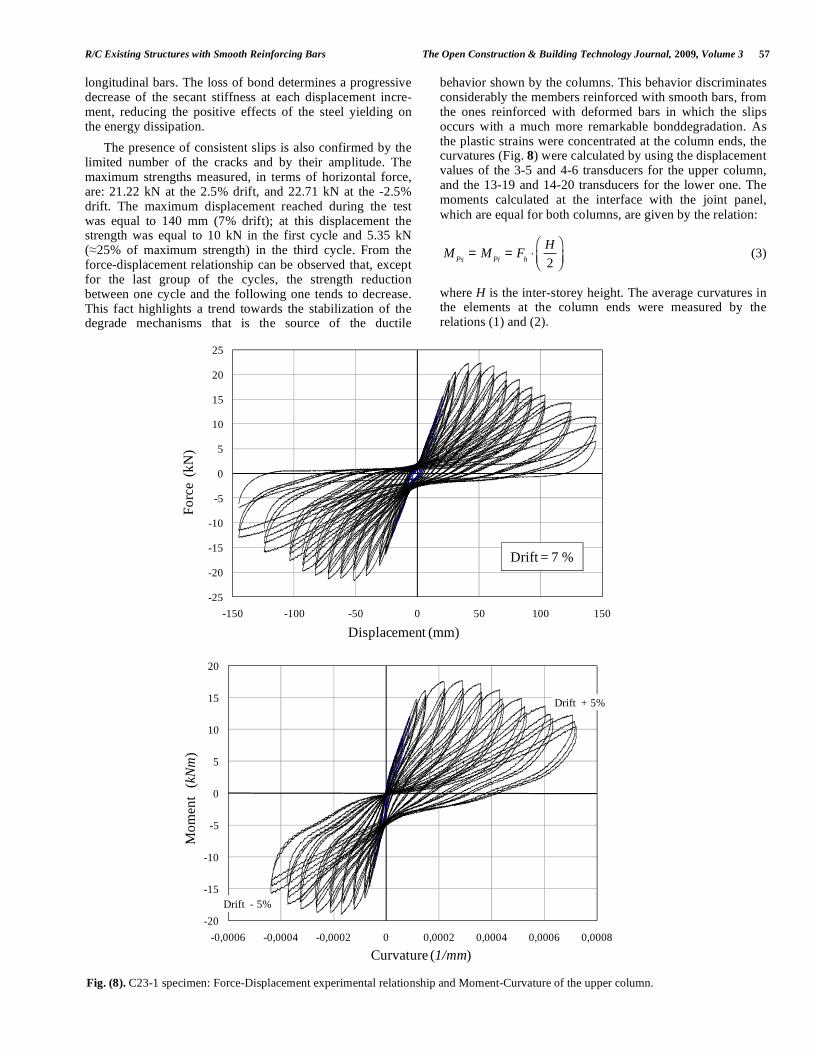
Specimen C23-2
The structural beam-column joint C23-2 (Fig. 10) has an initial behavior similar to the C23-1 joint.
The differences between the two specimens increase, as predictable, in the groups of cycles with large imposed displacement, in which the moment contribution due to the
vertical load (P- effect) determines a significant stiffness
and strength reduction (Fig. 11).
For the C23-2 joint the curvatures were measured by using the displacement values of the 3-5 and 4-6 transducers for the upper column (Fig. 11), and the displacement values of the 13-19 and 14-20 transducers for the lower column.
Fig. (9). Crack pattern of C23-1 specimen.
Fig. (10). C23-2 test.

R/C Existing Structures with Smooth Reinforcing Bars The Open Construction & Building Technology Journal, 2009, Volume 3 59
The moments acting on the columns at the interface with the joint panel are given by the equation (4):
MP
= Fh
H
2+ P (4)
where P is equal to the axial load applied to the upper column and the vertical component of the base hinge reaction for the lower column, is the drift of the upper column or of the lower column. Comparing the responses of the C23-1 and C23-2 joints (Fig. 12) it was observed a lower strength reduction to the horizontal action due to the P- effect than the theoretically expected value (which was equal to the P- moment divided by the column length). This is probably due to the non-perfectly-vertical jack axis, which occurred during the test and also visible with the naked eye (Fig. 10).
Specimen C11-1
Fig. (13) shows the experimental relation between the force applied by the actuator and the imposed horizontal displacement, which was observed during the test carried out on the C11-1 joint. The first diagonal micro-cracks within the specimen already appeared during the first cycle (0.25% drift), as well as a flexural crack at the fix-end of the beam. During the first cycle of the second group (0.50% drift), the lower column began to show flexural cracking.
The second flexural crack in the long beam appeared at approximately 15 cm from the joint during the first cycle of the third group (0.75% drift). The upper column started to show flexural cracking as well. At the 0.75% drift, two more flexural cracks appeared in the beam, one in the middle section and the other at approximately 20 cm from the joint panel. These two cracks, both due to the negative moment,
Fig. (11). C23-2 specimen: Force-Displacement experimental relation and Moment-Curvature of top column.
Fig. (12). Force-Displacement envelope curves of C23-1 and C23-2 joints.
-25
-20
-15
-10
-5
0
5
10
15
20
25
-150 -100 -50 0 50 100 150
Forc
e (
kN)
Displacement (mm)
Drift 7 %
-25
-20
-15
-10
-5
0
5
10
15
20
25
-0,0006 -0,0004 -0,0002 0 0,0002 0,0004 0,0006 0,0008
Mom
ent
(kN
m)
Curvature (1/mm)
Drift +3,5%
Drift -3,5%
-25
-20
-15
-10
-5
0
5
10
15
20
25
-7 -6 -5 -4 -3 -2 -1 0 1 2 3 4 5 6 7
For
ce (
kN)
Drift (%)
C23-1
C23-2-19,64 kN
21,22 kN
20,04 kN
-13,95 kN
-7,12 kN
10,08 kN
7,59 kN
-22,71 kN

60 The Open Construction & Building Technology Journal, 2009, Volume 3 Braga et al.
are located at the longitudinal bars bent which cause a significant reduction of the steel area in the section. During the third cycle of the third group, the upper column shows a second crack at approximately 20 cm from the joint. Starting from the fourth group of cycles (1% drift) the yielding was concentrated in the upper and lower columns, with an increasing curvature and a progressive loss of concrete cover.
Fig. (14) shows the experimental moment-curvatures diagrams of the upper and lower columns, respectively, at the interface of the joint panel. It is important to outline that for the positive horizontal displacements the upper column curvature is higher than the one of the lower column. On the contrary, for the negative horizontal displacements the upper column curvature is less than the one of the lower column. The examined mechanism is due to the changing axial load applied to the lower column. As described in Fig. (15), when the horizontal force is positive, the reaction of the right rod (long beam) goes up while the reaction of the left rod (short beam) goes down. From the equilibrium derives an increasing axial force acting on the lower column and, consequently, greater flexural stiffness of the lower column in comparison with the upper one. Similarly, when the floor
shear is negative, a reduction of the axial force acting on the lower column occurs, causing an increase of the curvature at the interface with the joint panel. A critical issue, related to the slip of the bars, is the possible decay of the bond and the consequent reduction of the section flexural strength. This is mainly due to the cracking induced by the bar slip on the surrounding concrete, especially in presence of deformed bars. Accordingly with previous results, the failure flexural mechanisms, ruled by the smooth bar slip, put into evidence a minor strength decay of the force-displacement curve in the softening branch, mainly due to the progressive loss of the concrete cover followed by a reduction of the distance between the inner forces. Unlike the normal behavior of the members subjected to flexure and axial load with enhanced bond bars (deformed bars), the first two tests highlight a reduced decay of the cyclic response. This is further confirmed by the test performed on the C11-1 joint. At the 3.5% drift eight cycles in addition to the three programmed ones were imposed to the specimen (Fig. 14). Among the eight cycles, the two central ones (the fourth and fifth) were carried out at a displacement speed of 15 mm/sec, equal to ten times the speed used for the other cycles. In the groups of cycles at 3,5% drift, it can be observed that the reduction of strength is more evident between the first cycle and the
Fig. (13). C11-1 specimen: Force-Displacement experimental relationship and Additional groups of cycles (Drift: 3, 50%).
Fig. (14). C11-1 specimen: Moment-Curvature relation of top and bottom columns.
-50
-25
0
25
50
-125 -100 -75 -50 -25 0 25 50 75 100 125
For
ce
(kN
)
Displacement (mm)
Drift 3,50 %
-50
-25
0
25
50
-125 -100 -75 -50 -25 0 25 50 75 100 125
Forc
e (
kN)
Displacement (mm)
Drift 3,50 %Drift 3,50 %
-60
-40
-20
0
20
40
60
-0,01 -0,005 0 0,005 0,01 0,015 0,02 0,025 0,03
Mom
ent
(kN
m)
Curvature (1/mm)
-60
-40
-20
0
20
40
60
-0,02 -0,015 -0,01 -0,005 0 0,005 0,01
Mom
ent
(kN
m)
Curvature (1/mm)

R/C Existing Structures with Smooth Reinforcing Bars The Open Construction & Building Technology Journal, 2009, Volume 3 61
second one (equal to 8.56%). It must be pointed out the tendency of the cyclic flexural mechanisms to become steady. During the last cycle, the reduction of strength is equal to 1,2% of the previous value.
In the two cycles with higher speed, the reduction of strength is equal to 1,5%. The total strength reduction between the first and eleventh cycles is therefore equal to 32%. The 27% of the total reduction occurred, however, between the first and the second of the eleven cycles with equal maximum displacement. So, the limited energy dissipation and the significant stiffness reduction on one hand and the good cyclic stability on the other, as shown in the tests carried out, are the main characteristics of the flexural mechanisms in R/C structures with smooth bars.
Specimen T23-1
External joint T23-1, tested under the above mentioned
cyclic actions (Fig. 4), showed two failure mechanisms:
• in the initial step (up to the 1.25 % drift), the yielding took place, mainly, in the beam that showed a flexural
cracking;
• starting from the 1.25% drift, the increase of the shear cracking within the joint panel was a “fuse” with respect
to the other failure mechanisms.
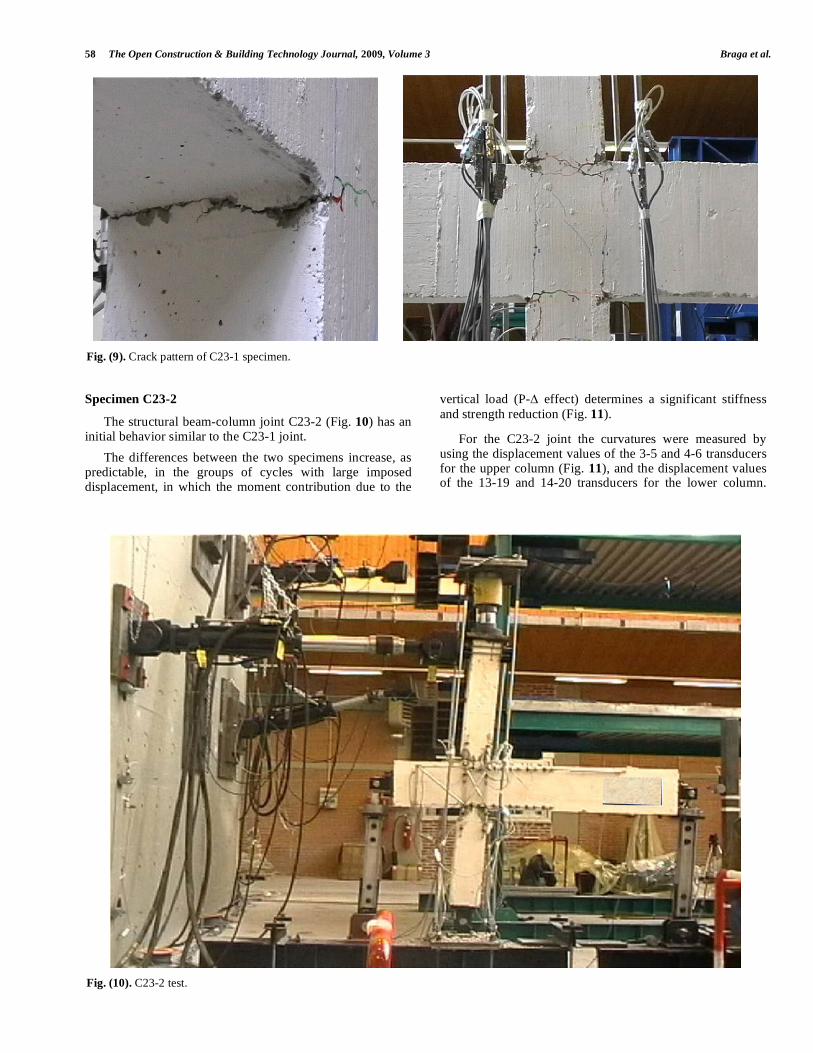
Evolution of cracks both in the joint panel and the beam is represented in Fig. (16), as highlighted by the test. Fig. (17) represents the experimental relation between floor shear and horizontal displacement and the beam moment-curvature diagram. The analysis of the hysteresis loops and the related cracking frame allows a more detailed description of the mechanisms mentioned above. The first group of cycles (0.25% drift) underlines a significant stiffness reduction for positive displacement, due to the concrete cracking at the beam intrados. During the second group of cycles, (0.5% drift), the beam cracked at the extrados, for negative displacement. The first yielding of the lower steel bars of the
Fig. (15). C-Joint panel equilibring forces.
Fig. (16). T23-1 specimen: evolution of cracks pattern.
PsN
PsPi NN >
TsT
TsM
TdM
TdT
PT
PT
PM
PM
PsPi NN <
PsN
TsT
TsM
TdM
TdT
PT
PT
PM
PM
Fessura n. 1Fessura n. 2
Fessura n. 3
Fessura n. 4
Fessura n. 5
Crack
Crack
Crack
Crack
Crack FessuraCrack
FessuraCrack
FessuraCrack
FessuraCrack
62 The Open Construction & Building Technology Journal, 2009, Volume 3 Braga et al.
beam takes place in the fourth group of cycles (1% drift). The value of the maximum force applied is, approximately, equal to 13 kN. During the first cycle of the fifth group, joint shear cracking began to occur causing a whole sharp reduction of strength and stiffness. Diagonal cracks in the joint panel appeared in both directions during the first cycle
at the ±1.25% drift. The shear value in the upper column that causes the diagonal cracks is equal to 12.46 kN for positive displacement and to 12.65 kN for negative displacement. Between the fifth and sixth groups of cycles, the strength slightly increased. From the sixth group onwards strength and stiffness decreased more and more, and the reductions
Fig. (17). T23-1 specimen: Force-Displacement experimental relation (max inter-storey drift = 3%) and Beam Moment-curvature relation.
Fig. (18). Cracks Amplitude in the beam and in the joint panel.
-15
-10
-5
0
5
10
15
-75 -50 -25 0 25 50 75
For
ce (
kN)
Displacement (mm)
Drift 3 %
-25
-20
-15
-10
-5
0
5
10
15
20
25
Mom
ent
(kN
m)
Curvature (1/mm)
Drift 3 %
-25
-20
-15
-10
-5
0
5
10
15
20
25
Mom
ent
(kN
m)
Curvature (1/mm)
Drift 1 %
-25
-20
-15
-10
-5
0
5
10
15
20
25
Mom
ent
(kN
m)
Curvature (1/mm)
Drift 1.25 %
0
0,5
1
1,5
2
2,5
3
3,5
4
4,5
5
0 300 600 900 1200 1500 1800
Cra
cks A
mpl
itude
(m
m)
Time (sec)
Beam transducer 7-8Joint transducer 5-12
1° cycle - V group (drift 1,25%):Shear crack into the Joint PanelBeginning of the cracks closure into the Beam

R/C Existing Structures with Smooth Reinforcing Bars The Open Construction & Building Technology Journal, 2009, Volume 3 63
became even more remarkable within the same group of
cycles (at the same maximum displacement).
The hysteresis loops tend to become tighter in the central area (pinching) and show a minor joint dissipative capability. At the end of the ninth group of cycles (3% drift) joint strength appeared to be more than halved. The cracking therefore involved the beam in the first place at the joint panel interface, creating a yield hinge. Then cracks had origin in the beam sections in which the upper bars bends were placed. Afterwards, cracking involved the lower and upper columns at the joint panel interface; finally diagonal cracks took place in the joint panel, allowing to flexural cracks of the beam to heal (Fig. 18).
The first cracking of the beam occurred during the first loading step with a displacement on top of the column of 1.64 mm (0.08% drift, horizontal force = 4.59 kN, bending moment in the beam = 7.5 kNm). The steel yielding in the beam (Fig. 19) occurred during the first cycle of the fourth group with a displacement of 17.3 mm (0.85% drift, horizontal force = 12.7 kN, bending moment in the beam = 19.5 kNm). The steel yielding effect only involved the lower bars, as the beam section reinforcement was dissymmetric. The width of the cracks in the beam and in the joint panel allows to detect quite clearly the relation between flexural cracking in the beam and cracking in the joint panel.
Fig. (18) shows, in detail, that starting from the second cycle of the fifth group (1.25% drift), the beam cracks began
to heal because of the cracking in the joint panel. This is highlighted by the increasing diagonal cracks that reached a maximum width of 20 mm at the end of the test. It can be observed that joint shear cracking progressively occurred, while it amplified quickly during the last 3 cycles (3% drift). The moment-curvature diagram of the beam can appro-priately describe the above mentioned mechanisms and gives the relation between flexural and shear failure. It can be noted the stiffness reduction, due to the beam cracking, that occurred during the first cycle. Fig. (17) shows the most significant group of cycles. In particular, the moment-curvature diagram of the fourth group (1% drift) clearly shows the steel yielding point and the following yielding branch. The healing of flexural cracks in the beam is explained by the moment-curvature diagram, starting from the fifth group (1.25% drift), where can be observed a moment reduction switching from one cycle to another with the same drift. A progressive pinching, which implies a lower energy dissipation related to beam flexural cracking, can also be observed. The pictures of the various steps in the test allows the check of both the qualitative descriptions and numerical results.
In particular, Fig. (20) shows the cracking trend in the beam and in the joint panel. First cracks in the span of the beam and the one close to the column are clear, and the following opening of the diagonal cracks in the joint panel. The two mechanisms show similar level of yielding strength and yet, as the joint panel mechanism is more brittle, it
Fig. (19). T-Joint specimen: IV (drift 1%) and V (drift 1,25%) groups of Force-Displacement cycles.
Fig. (20). T-Joint specimen: Beam and joint panel cracks pattern at failure.
-15
-10
-5
0
5
10
15
-30 -20 20 30
For
ce "
T"
(kN
)
Steel YeldingT = 12,74 kN; S = 17,3
Shear craking (+)T = 12,46 kN; S = 21,6
Shear craking (-)T = -12,65 kN; S = -24,4 mm
Drift 1,25 %
-15
-10
-5
0
5
10
15
-30 -20 -10 0 10 20 30
For
ce "
T"
(kN
)
Displacement "S" (mm)
Steel YeldingT = 12,74 kN; S = 17,3
Shear craking (+)T = 12,46 kN; S = 21,6
Shear craking (-)T = -12,65 kN; S = -24,4 mm
Drift 1,25 %

64 The Open Construction & Building Technology Journal, 2009, Volume 3 Braga et al.
prevails over the other failure mechanisms. The opening of diagonal cracks, due to the overcoming of concrete tensile strength, enabled a mechanism the lowest strength governed by bond slips of columns longitudinal bars. This mechanism shows an unexpected yielding stability occurring before a sudden strength reduction due to the joint panel internal shifts and subsequent deterioration of concrete. The last two pictures illustrate the progress of the mechanisms related to joint panel cracking.
In Fig. (21), the two rigid body mechanisms are described in the case of a positive displacement (left to right) and of a negative displacement. These two mechanisms are characterized by the rotation around the compressed zone of the column on the beam side: the A area for positive disp-lacements, and the lower B area for negative displacements. The above mentioned mechanisms determine the cracking spreading towards the columns and the inflection of the external longitudinal bars of the columns passing the joint panel. These bars, being not linked by transverse reinforce-
ments in the joint, push the concrete triangular block outwards.
It must be pointed out that the tests carried out did not highlight any significant slip of the hook either outwards orinwards. As a consequence the ejection of the above-mentioned block cannot be considered as an effect of the hook slip, which, however, remains inside the internal concrete section as it is shown in the last picture of the Fig. (20).
C and T Joints Comparisons
One of the objectives of the tests carried out on sub-assemblages of the prototype frame is to establish relations between the response of the whole structure and the one of the two kinds of beam-column joints: the internal joint (C-Joint) and the external one (T-Joint). From this point of view, it is interesting to compare the response of the T23-1 joint with the C23-1 joint (Fig. 22).
B
A
Fig. (21). T-Joint specimen: Observed failure mechanism.
Fig. (22). Force-Displacement envelope curves of T23-1 and C23-1 joints.
cycle
cycle
cycle
cycle
0,00
5,00
10,00
15,00
20,00
25,00
0 1 2 3 4 5 6 7
Hor
izon
tal F
orce
(kN
)
Drift (%)
1°cycle - C
2° cycle - C
3° cycle - C
1° cycle - T
2° cycle - T
3° cycle - T
22,21 kN
12,74 kN
cycle
cycle

R/C Existing Structures with Smooth Reinforcing Bars The Open Construction & Building Technology Journal, 2009, Volume 3 65
It must be underlined that the same displacements and the same axial load were applied on both joints. It can also be observed that the comparison becomes significant from the characteristics of the failures shown by the two joints. Even though the geometry and the stiffness ratio between the elements determine the kind of failure, the comparison between the two structural sub-assemblages is not related to their geometry. From the two tests it is possible, in fact, to deduct the comparison between the different failure mechanisms ruling the response to lateral actions. In Fig. (22), the experimental envelope diagrams of the hysteresis loops in the two joints are shown. Firstly, it can be observed the difference between the maximum lateral strength values related to the two failure mechanisms. For the C-joint, the maximum value of the floor shear is 22.21 kN, while for the T-joint, the value is 12.74 kN. The drift levels corresponding to these strength values are 2.5% and 1%, respectively. The
drift level where the two tests were stopped is equal to 7% in the C-joint and to 3% in the T-joint and, as measured at the end of the test (third cycle), the corresponding strength values were, respectively, equal to 25% and 45% of the maximum strength. At the end of the test, the external joint showed a more noticeable loss of integrity in comparison with the internal joint, even though the test were stopped at a much lower drift level (3% against 7%) and the remaining percentage strength was higher than the internal joint. Nevertheless the percentage level of the remaining strength (in the first cycle at the test end) was higher in the T- joint than in the C-joint, the former showed a more marked loss of integrity with a significant cyclic reduction of strength (Fig. 23) than the internal joint (Fig. 24).
At the end of the test, the strength of the third cycle was approximately halved in comparison with the first cycle in
Fig. (23). T23-1 specimen: Cyclic strength reduction (drift max = 3%).
Fig. (24). C23-1 specimen: Cyclic strength reduction (drift max = 7%).
cycles 1
cycles 1
cycles 1
0%
10%
20%
30%
40%
50%
-7 -6 -5 -4 -3 -2 -1 0C
ycli
c st
reng
th re
duct
ion
(F
i-F1+
1)/F
iDrift (%)
0 1 2 3 4 5 6 7
Cyc
lic
stre
ngth
redu
ctio
n (
Fi-F
1+1)
/Fi
Drift (%)
cycles 1-2
cycles 1-3
0%
10%
20%
30%
40%
50%
-7 -6 -5 -4 -3 -2 -1 0
Cyc
lic
stre
ngth
redu
ctio
n (
Fi-F
1+1)
/Fi
Drift (%)0 1 2 3 4 5 6 7
Cyc
lic
stre
ngth
redu
ctio
n (
Fi-F
1+1)
/Fi
Drift (%)
cycles 1-2
cycles 1-3

66 The Open Construction & Building Technology Journal, 2009, Volume 3 Braga et al.
both joints. The main difference was that it was reached more quickly in the T-joint. Fig. (25), illustrates the com-parison between the two joints in terms of variation in the secant stiffness evaluated at the second and at the third cycles, in relation with the one evaluated at the first cycle, as the drift increases. While the C-joint stiffness remained basically unchanged in comparison with the initial stiffness up to a drift level of 1.25%, in the T-joint it decreased to 40% at the same drift. With a drift level equal to 3% the T-joint secant stiffness was equal to 14.4% of the initial value, whereas the C-joint stiffness was still equal to 43.7%.
CONCLUSIONS
The tests performed on beam-column joints, built in according to old codes considering only gravity loads, allow to point put the peculiarities of the seismic behavior of existing R/C structures reinforced with smooth bars.
The internal C-Joints show a “soft storey mechanism”, governed by the bond-slips between the longitudinal bars and the surrounding concrete of the columns and by lumped yielding of the columns near to the joint panel.
Unlike the normal behavior of the members subjected to flexure and axial load with deformed bars, the specimens reinforced with smooth bars show a reduced degradation of the cyclic response.
The response of the external T-joint, besides, is governed by the joint panel failure.
Usually, shear failure of the joint panel is considered a brittle mechanism. Also in the present research, strength of external joints degrades more quickly of the internal joints strength. But the inelastic external joint mechanism observed after the shear failure of joint panel shows a ductility not so marginal.
The rigid body mechanism observed during the external T-joint specimens tests (Fig. 21) is characterized by the rotation around the compressed zone of the column on the beam side and by the traction-inflection of the external longitudinal bars of the columns. Also in this case the bond-
slips of the smooth bars helps the stability of the cycles because of the low bond stress between bars and concrete does not increase damage of the joint panel.
In conclusion, as mentioned above, the limited energy dissipation and the significant stiffness reduction on one hand and the good cyclic stability on the other, appear to be the main characteristics of the flexural mechanisms in R/C existing frames with smooth bars.
The study and modeling of bond and of inelastic joint panel mechanism are therefore particularly important in order to lead reliable evaluation of the seismic response of such existing R/C structures.
REFERENCES
[1] H. Sezen, A. S. Whittaker, K. J. Elwood and K. M. Mosalam,
“Performance of reinforced concrete buildings during the August 17, 1999 Kocaeli, Turkey earthquake, and seismic design and
construction practice in Turkey”, Engineering Structures, vol. 25, pp. 103-114, 2003.
[2] S. Hakuto, R. Park and Tanaka H, Retrofitting of Reinforced Concrete Moment-Resisting Frames, Research Report, Department
of Civil Engineering, University of Canterbury, New Zealand, 1995.
[3] L. Aycardi, J.B. Mander and A.M. Reinhorn, “Seismic resistance of reinforced concrete frame structures designed only for gravity
loads: experimental performance of subassemblies”, ACI/ Structural Journal, vol. 91(5), pp. 552-563, 1994.
[4] S. S. Kunnath, G. H. Hoffman, A. M. Reinhorn and J.B. Mander, “Gravity-Load-Designed Reinforced Concrete Buildings- Part I:
Seismic Evaluation of Existing Construction”, ACI Structural Journal, vol. 92, pp. 343-354, 1995.
[5] J. M. Bracci, A. M. Reinhorn and J. B. Mander, “Seismic resistance of concrete reinforced frame structures designed for gravity loads:
performance of structural system”, ACI Structural Journal, vol. 92, pp. 597-609, 1995.
[6] S. Hakuto, R. Park and H. Tanaka, “Seismic load tests on interior and exterior beam-column joints with substandard reinforcing
details”, ACI Structural Journal, vol. 97, pp. 11-25, 2000. [7] T. El-Amoury and A. Ghobarah, “Seismic rehabilitation of beam-
column joint using GFRP sheets”, Engineering Structures, vol. 24, pp. 1397-1407, 2002.
[8] G. M. Calvi, G. Magenes and S. Pampanin, “Relevance of beam-column joint damage and collapse in rc frame assessment”, Journal
of Earthquake Engineering, vol. 6, pp. 75-100, 2002.
Fig. (25). Cyclic stiffness reduction of T23-1 and C23-1 joints.
0,000
0,200
0,400
0,600
0,800
1,000
0 1 2 3 4 5 6 7
Cyc
lic
stif
fnes
s red
uctio
n (
k i/k
0,25
)
Drift (%)
C-Joint
T-Joint

R/C Existing Structures with Smooth Reinforcing Bars The Open Construction & Building Technology Journal, 2009, Volume 3 67
[9] S. Pampanin, U. Akguzel and G. Attanasi, Seismic Upgrading of 3-
D Exterior R.C. Beam Column Joints Subjected To Bi-Directional Cyclic Loading Using GFP Composites, Patras, Greece: 8th
International Symposium on Fiber Reinforced Polymer Reinforce-ment for Concrete Structures, 2007, pp. 16-18.
[10] Y. A. Al-Salloum and T. H. Almusallam, “Seismic response of interior RC beam-column joints upgraded with FRP sheets. I:
experimental study”, Journal of Composites for Construction, vol. 11, pp. 575-589, 2007.
[11] M. J. Favvata, B. A. Izzuddin and C.G. Karayannis, “Modeling exterior beam-column joints for seismic analysis of RC frame
structures”, Earthquake Engineering and Structural Dynamics, vol.
37, pp. 1527-1548, 2008. [12] T. G. Alexander, “Effectiveness of CFRP-jackets and RC-jackets in
post-earthquake and pre-earthquake retrofitting of beam-column subassemblages”, Engineering Structures, vol. 30, pp. 777-793,
2008. [13] Norme per l'esecuzione delle opere in conglomerato cementizio
semplice od armato. 1939. R. Decreto-Legge 16 novembre 1939-XVIII, n.2229. (Old Italian code for the design of RC structures).
[14] Armature delle strutture in cemento armato. 1957. Circolare 23 maggio 1957 n.1472. (Old Italian code for the design of RC
structures).
Received: February 17, 2008 Revised: January 15, 2009 Accepted: March 16, 2009
© Braga et al.; Licensee Bentham Open.
This is an open access article licensed under the terms of the Creative Commons Attribution Non-Commercial License (http: //creativecommons.org/licenses/by-
nc/3.0/), which permits unrestricted, non-commercial use, distribution and reproduction in any medium, provided the work is properly cited.


![Load Test on Existing Structures[1]](https://img.pdfslide.us/doc/110x75/5525878e4a795968498b4be1/load-test-on-existing-structures1.jpg)