Embed Size (px)
Citation preview
The Open Magnetic Resonance Journal, 2010, 3, 15-26 15
1874-7698/10 2010 Bentham Open
Open Access
Proton Nuclear Magnetic Resonance (NMR) Relaxometry in Soil Science Applications
Julia V. Bayer*, Fabian Jaeger and Gabriele E. Schaumann
Department of Environmental and Soil Chemistry, Institute of Environmental Sciences, University of Koblenz-Landau,
Fortstraße 7, 76829 Landau, Germany
Abstract: Proton NMR relaxometry is a very powerful tool for investigating porous media and their interaction with wa-
ter or other liquids and the mobility and interaction of organic molecules in solution. It is commonly used in material sci-
ence or earth science. However, it is only scarcely applied in soil science although it shows great potential for helping to
understand water uptake into the soil matrix and processes occurring at the solid-liquid interface at soil particle surfaces.
This review introduces proton NMR relaxometry in the context of soil science and discusses the most important applica-
tions of the method in this field. Relevant results from different applications of NMR relaxometry in soils are described
and research gaps identified. Some original data is presented concerning biofilm formation in soils, which was investi-
gated using proton NMR relaxometry. NMR relaxometry is a sensitive, informative and promising method to study pore
size distribution in soils as well as many kinds of soil physicochemical processes, among which are wetting, swelling or
changes in macromolecular status. It is further a very helpful method to study interactions between molecules in soil or-
ganic matter and can serve to study the state of binding of water or organic chemicals to soil organic matter. Relaxation
times determined by NMR relaxometry are sensitive to various factors that play a role in soil-water interaction which is
both an advantage and shortcoming of the method: NMR relaxometry can be applied to numerous investigations in soil
science, but at the same time interpretation of the results may be very difficult in such complex and heterogeneous sys-
tems like soils.
Keywords: NMR relaxometry, soil, porous media, water, swelling, wetting.
INTRODUCTION
Proton NMR relaxometry is commonly used in geo-sciences, e.g. in oil exploration, and material sciences [1, 2]. It is a powerful tool for non-destructive investigations of pore size distributions of porous media, water content, water uptake and re-distribution as well as molecule mobility and non-covalent binding mechanisms. The technique can be adapted for use in soil investigations, but so far has only been used sparsely. More frequently used for structural analysis is NMR spectroscopy which is able to give insight into the molecular structure of soil organic matter (SOM). It has been used extensively for the determination of humic acid (HA) and fulvic acid (FA) structures and other organic constituents in SOM in either liquid or solid state. Detailed reviews of the state of the art of NMR spectroscopy in natu-ral organic matter NOM, heterogeneous material and poly-mers are given elsewhere [3-5]. More specific details of NMR spectroscopy applications in soil, SOM and biological systems, including several other NMR techniques like mag-netic resonance imaging (MRI) and the investigation of mo-bility of deuterated or fluorinated compounds, can be found e.g. in [6-11].
This review focuses mainly on the application of proton NMR relaxometry in soil science, especially
1H NMR
*Address correspondence to this author at the Department of Environmental
and Soil Chemistry, Institute of Environmental Sciences, University of
Koblenz-Landau, Fortstraße 7, 76829 Landau, Germany; Tel: +49 (0)6341-
280-565; Fax: +49 (0)6341-280-576; E-mail: [email protected]
relaxometry, including some relevant studies on other porous media and magnetic resonance imaging (MRI) studies of soils. Unfortunately, NMR relaxometry as used for studies in geosciences cannot be transferred one to one for studying soils, as e.g. the pore system differs from that found in rock formations. The main challenge for application to soil is, in this context, its huge complexity and heterogeneity and the up to now only scarcely understood soil organic matter [12, 13]. Nevertheless, efforts have been made to use NMR re-laxometry to describe pore size distributions in soils, as well as processes occurring during water uptake, i.e. wetting, swelling of organic matter and re-distribution of water.
Apart from pure NMR relaxometry, MRI studies, based on the same measurement principle as NMR relaxometry, may help to get insight into soil water interactions as they provide spatial resolution additional to the temporal resolu-tion. Many studies employ MRI for understanding water uptake into soils or similar porous media and gain qualitative and quantitative information about local water distribution: Theoretical considerations about formation of preferential flow pathways have been confirmed by MRI; water and hy-drocarbon distribution and displacement have been evaluated and water distribution within the pore system can be ob-served, e.g. [14-22]. However, the resolution of MRI is much lower than that of NMR relaxometry and no detailed infor-mation about the pore size distribution or water properties within the pores can be determined from such measurements. Apart from
1H NMR relaxometry, other nuclei such as
13C or
19F can be used for relaxation studies of liquids in porous
media giving insight into distribution of those liquids [23,
16 The Open Magnetic Resonance Journal, 2010, Volume 3 Bayer et al.
24] and the pore size distribution of the porous media, e.g. [25, 26].
Gaining insight into water distribution in soils is espe-
cially important for nutrient and contaminant distribution,
which is of interest for agricultural applications and in rela-
tion to aquifer contamination [27]. Any substance entering
the soil pore system interacts with the solid surface and,
therefore, depends on solution distribution and interaction
with the matrix. Water uptake in soils is not a simple distri-
bution problem as e.g. preferential pathways form due to the
existence of macropores and different surface wettabilities of
the solid surface influence the wetting process [28]. Also,
water does not only enter pores, but interacts with the or-
ganic matter coatings and organic colloids present in the
pore system. This changes the solid surface and, hence, the
pore system itself. Model calculations are often inadequate
in describing water uptake into and the interaction of water
with the soil matrix [27, 28]. NMR relaxometry, therefore,
offers a great potential for investigating soil water interac-
tions without the need for modelling or sample destruction.
The method can be used in-situ, especially with more recent
developments in mobile NMR techniques that could be used directly in the field [29-37].
Addressing both soil scientists interested in the use of
these techniques for their own purpose and NMR specialists
providing new promising NMR relaxometry tools which
help to obtain further insights into soil processes, the objec-
tive of this contribution is to outline and discuss fields of
application of this technique in soil science. Although, dif-
ferent NMR methods are commonly used in soil science ap-
plications, this review focuses mainly on proton NMR re-laxometry, due to the complexity of the field.
BASICS OF NMR RELAXOMETRY
This section is addressed mainly to the reader unfamiliar
with the field of NMR. Many atomic nuclei posses a non-
zero spin and an intrinsic magnetic moment parallel or anti-
parallel to the spin. The spin is associated with a non-zero
magnetic moment (μ) via the relation μ = J, where is the
gyromagnetic ratio and J the spin angular momentum. is
constant, but assumes different values for different nuclei.
When placed in an outer magnetic field B (conventionally
along the z-axis), the spins orientate and precess about the
external field with the Larmor frequency, which is character-
istic for each nucleus and dependent on the strength of the
outer magnetic field (e.g. hydrogen nucleus 42.6 MHz at 1 Tesla): f= B/2 (e.g., [1]).
A radio frequency (RF) pulse with the characteristic
Larmor frequency is applied and the spins are flipped into an
angle to the external magnetic field (B0) causing a magneti-
sation (M0). In most applications the RF pulse turns the spins
in 90° or 180° direction (in a certain pulse sequence). After
the RF pulse is switched off the spins relax to their equilib-
rium orientation and the apparent magnetisation induced by
the RF pulse decays. The measured signal is called the free
induction decay (FID) [2]. The relaxation process generally
is a first order process. It is characterized by the relaxation
time, which is the reciprocal of the relaxation rate constant.
Two different relaxation mechanisms are involved in the
magnetisation decay, which are the longitudinal or spin-lattice and transverse or spin-spin relaxation [2].
The spin-lattice relaxation time T1 depends mainly on the interaction of the spins with their environment often referred to as the lattice, hence the name. T1 describes how effective interactions between the spin system and the environment are in exchanging magnetic energy. If strong interactions between the spin system and the environment lead to a fast exchange of energy, the equilibrium state is reached fast and T1 is short. Measuring T1 can be very time consuming and is, so far, not often used in soil science applications, although it may be the more appropriate measure than T2 in many cases [1, 2].
The spin-spin relaxation time T2 normally refers to the relaxation due to variable molecular interactions or diffusion in the slightly inhomogeneous magnetic field. The transver-sal relaxation process is not based on energy exchange, but originates from a dephasing of the precessing spins, e.g., due to slight differences in Larmor frequency due to local field inhomogeneity [2]. Variations in the magnetic field caused by neighbouring nuclei are stronger in solids than in liquids where spins can move freely and inhomogeneities due to neighbouring spins are small. As the dephasing of the spins can only take place in the presence of a longitudinal mag-netisation T2 can be smaller than or equal to T1, but it can never be longer [1].
While bulk liquids lacking additional means of interac-tion reveal long proton relaxation times in the range of sec-onds, limitation of mobility can reduce T2. Contrary to T2, T1 can be either increased or reduced by a reduction in mobility, depending on the Larmor frequency and the correlation time for the relaxation-relevant interaction [2]. Molecular diffu-sion in field gradients affects T2 but not T1, because no en-ergy exchange is involved in this relaxation mechanism [38]. The relaxation rate due to diffusion in field gradients is pro-portional to the diffusion coefficient and the square of local field gradients [2]. The local field gradients increase with increasing external field strength. Therefore, measurements in systems like soils, where local field gradients are the rule, are to be carried out preferentially in low fields up to 10-50 MHz. Field cycling NMR explicitly investigates the field and frequency dependency of T1 and T2 at proton Larmor frequencies between 10 kHz and 40 MHz or higher and is, therefore, a promising tool to study dynamic molecular in-teractions and to distinguish between the molecular effects and effects of local field gradients or sample heterogeneity [39]. In traditional high-resolution NMR spectroscopy, where Larmor frequencies are generally above 250 MHz, large T1/T2 ratios are the rule.
Relaxation Times T1 and T2 in Porous Systems
With T1 and T2 of protons of bulk water in the range of 1-3 seconds, bulk relaxation processes are very slow. If con-fined in porous media, relaxation is often controlled by solid-fluid-interactions at the surfaces of the pore space. Water molecules diffuse and eventually reach a pore wall surface where there is a finite probability that their spins are relaxed due to interactions with fixed spins, paramagnetic ions or paramagnetic crystal defects. Further transversal relaxation occurs via diffusion in local field gradients. The total relaxa-
Proton Nuclear Magnetic Resonance (NMR) Relaxometry The Open Magnetic Resonance Journal, 2010, Volume 3 17
tion rate is, therefore, the sum of bulk relaxation (B) and surface relaxation (S) and, for T2, of relaxation due to diffu-sion in field gradients [1]:
FGdiffSBtotal
SBtotal
TTTT
TTT
++=
+=
2222
111
1111
111
(1)
The surface relaxation term contains information of the pore system and is, therefore, further analysed. Relaxation time at the surface is determined by the residence time of the spin at the surface. The longer the residence time the higher the probability for interaction with the surface and, therefore, relaxation. As long as this surface relaxation is slower than the transport of unrelaxed spins to the surface the fast-diffusion or surface-limited regime [40] is fulfilled. Water molecules can transit the pore several times before being relaxed and the magnetization decay in an individual pore is, therefore, spatially uniform and depends on the surface-to-volume ratio. Surface relaxation is then related to the internal surface area S, internal pore volume V and the surface relax-ivity [1] which is strongly influenced by paramagnetic ions on the surface like Mn
2+ or Fe
3+:
surface-limited: rV
S
TS
2,12,1
2,1
1= (2)
where r is the pore radius and is the shape factor (1, 2, 3 for planar, cylindrical and spherical pore geometry) [41].
If, in contrast, the magnetic decay is controlled by the transport of the molecules to the surface the conditions of the slow-diffusion or diffusion-limited regime [40] are met. This may be the case if pores are large or surface relaxation is strong, e.g., due to the presence of effective paramagnetic centres.
diffusion-limited: 2
21
11
r
cD
TTSS
== (3)
where D is the diffusion coefficient and c is a shape-dependent factor. Note that in the case of diffusion limitation T1S and T2S are equal. Relaxation times in the diffusion-limited regime depend on temperature in the same way as the diffusion coefficient. In this case, relaxation times are not spatially uniform, which results in a multiexponential mag-netic decay, even within a single pore, and relaxation is addi-tionally dependent on pore shape [1]:
Converting NMR Signals into Relaxation Time Distribu-tions
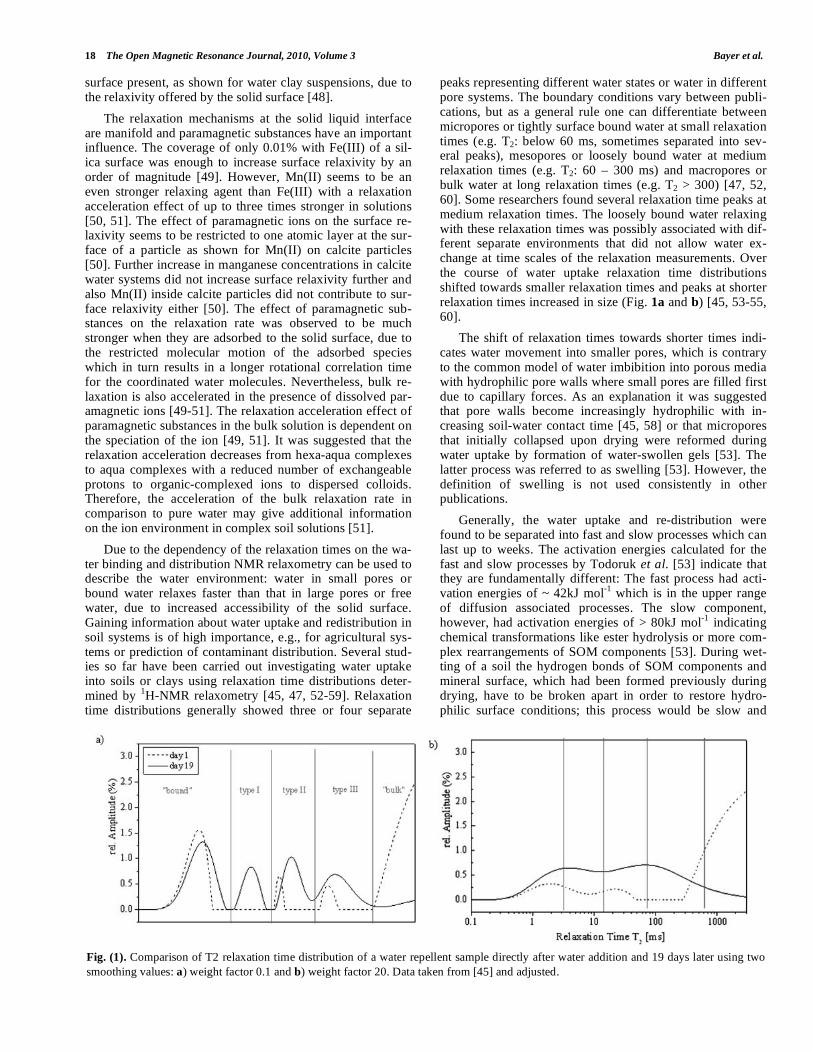
For data analysis in NMR relaxometry several different algorithms and software is applied. These are, e.g., the soft-ware ‘WinDXP’ from Resonance Instruments (UK) or ‘Con-tin’ used by Bruker (USA) [42], which are device specific, or UPEN, a software developed at the University of Bologna [43, 44]. Depending on the chosen program and parameters, the analyses may lead to differently strongly separated peaks in the relaxation distribution. One such parameter is the
weight factor used in WinDXP to account for different signal to noise ratios. An example is given in Fig. (1) for a water repellent soil sample using a weight factor of 0.1 (Fig. 1a) and 20 (Fig. 1b). The differences in peak separation and peak number clearly demonstrate the importance to consider the effect of evaluation parameters on the resulting relaxa-tion time distribution [45]. Samples can only be compared to each other on the basis of comparable evaluation parameters using the same software.
WATER IN SOILS AND PEATS
Water uptake and redistribution in soils as well as inter-action of water with SOM is of great importance for, e.g., contaminant sorption or nutrient availability. The availability of water for plants itself is important in agricultural sciences and is determined by the water content, the matric potential ( ) and the water retention curve of a soil. Hereby, a matric potential of -1.5 MPa is defined as the permanent wilting point where plant growths is limited due to water shortage; a matric potential of -0.03 MPa is defined as the field capacity which is the amount of water held in a soil after excess water was drained due to gravitation [28]. Measurement of water retention curves by standard soil science methods is time consuming and cannot be carried out in situ.
A first effort to use low-field NMR relaxometry for analysis of water in soils was made by Prebble and Currie already in 1970 by measuring T1 (at 2.7 MHz) [46]. They used several sands, soils and a vermiculite as sample mate-rial and added different amounts of water. Three states of water in soils were identified: i) At very low water contents water was tightly bound to the clay or sand interface, but no relationship with plant unavailable water was found ( = -1.5 MPa); ii) with increasing water content the water seemed to be independent of the clay lattice and water content calcula-tions resulted in values close to the real amount of water added and iii) further addition of water lead to an incomplete relaxation during the measurement time indicating the pres-ence of bulk water ( = -0.03 MPa). The presence of various states of water was confirmed for peat samples by McBrierty et al. [47]. In a detailed study using high field NMR re-laxometry (300 MHz), differential scanning calorimetry (DSC) and thermogravimetric analysis (TGA) the binding of water in peat was investigated and up to four different water states were found, with two forms of loosely bound water, bulk water and tightly bound water that did not freeze at temperatures down to 160 K. The loosely bound water froze around 210 K and bulk water at 273 K, indicating also the temperature range above which each water form became mobile. Drying and re-watering of peat samples did shrink and swell the peat matrix and with that changed the amount of loosely bound water, but the amount of strongly surface associated water was similar after each change in moisture status. Non-freezing water was associated with hydration water, i.e. water in a gel like layer at the solid surface or wa-ter that chemically interacts with the hydrophilic moieties on the surface [47]. Therefore, the amount of non-freezing wa-ter could be an indicator for surface properties. The interac-tions of water molecules at the surface of particles is respon-sible for the thickness of the bound water layer or phy-sisorbed water, which can be up to 3 molecular layers. The relaxation rate increases (linearly) with the amount of solid
18 The Open Magnetic Resonance Journal, 2010, Volume 3 Bayer et al.
surface present, as shown for water clay suspensions, due to the relaxivity offered by the solid surface [48].
The relaxation mechanisms at the solid liquid interface are manifold and paramagnetic substances have an important influence. The coverage of only 0.01% with Fe(III) of a sil-ica surface was enough to increase surface relaxivity by an order of magnitude [49]. However, Mn(II) seems to be an even stronger relaxing agent than Fe(III) with a relaxation acceleration effect of up to three times stronger in solutions [50, 51]. The effect of paramagnetic ions on the surface re-laxivity seems to be restricted to one atomic layer at the sur-face of a particle as shown for Mn(II) on calcite particles [50]. Further increase in manganese concentrations in calcite water systems did not increase surface relaxivity further and also Mn(II) inside calcite particles did not contribute to sur-face relaxivity either [50]. The effect of paramagnetic sub-stances on the relaxation rate was observed to be much stronger when they are adsorbed to the solid surface, due to the restricted molecular motion of the adsorbed species which in turn results in a longer rotational correlation time for the coordinated water molecules. Nevertheless, bulk re-laxation is also accelerated in the presence of dissolved par-amagnetic ions [49-51]. The relaxation acceleration effect of paramagnetic substances in the bulk solution is dependent on the speciation of the ion [49, 51]. It was suggested that the relaxation acceleration decreases from hexa-aqua complexes to aqua complexes with a reduced number of exchangeable protons to organic-complexed ions to dispersed colloids. Therefore, the acceleration of the bulk relaxation rate in comparison to pure water may give additional information on the ion environment in complex soil solutions [51].
Due to the dependency of the relaxation times on the wa-ter binding and distribution NMR relaxometry can be used to describe the water environment: water in small pores or bound water relaxes faster than that in large pores or free water, due to increased accessibility of the solid surface. Gaining information about water uptake and redistribution in soil systems is of high importance, e.g., for agricultural sys-tems or prediction of contaminant distribution. Several stud-ies so far have been carried out investigating water uptake into soils or clays using relaxation time distributions deter-mined by
1H-NMR relaxometry [45, 47, 52-59]. Relaxation
time distributions generally showed three or four separate
peaks representing different water states or water in different pore systems. The boundary conditions vary between publi-cations, but as a general rule one can differentiate between micropores or tightly surface bound water at small relaxation times (e.g. T2: below 60 ms, sometimes separated into sev-eral peaks), mesopores or loosely bound water at medium relaxation times (e.g. T2: 60 – 300 ms) and macropores or bulk water at long relaxation times (e.g. T2 > 300) [47, 52, 60]. Some researchers found several relaxation time peaks at medium relaxation times. The loosely bound water relaxing with these relaxation times was possibly associated with dif-ferent separate environments that did not allow water ex-change at time scales of the relaxation measurements. Over the course of water uptake relaxation time distributions shifted towards smaller relaxation times and peaks at shorter relaxation times increased in size (Fig. 1a and b) [45, 53-55, 60].
The shift of relaxation times towards shorter times indi-cates water movement into smaller pores, which is contrary to the common model of water imbibition into porous media with hydrophilic pore walls where small pores are filled first due to capillary forces. As an explanation it was suggested that pore walls become increasingly hydrophilic with in-creasing soil-water contact time [45, 58] or that micropores that initially collapsed upon drying were reformed during water uptake by formation of water-swollen gels [53]. The latter process was referred to as swelling [53]. However, the definition of swelling is not used consistently in other publications.
Generally, the water uptake and re-distribution were found to be separated into fast and slow processes which can last up to weeks. The activation energies calculated for the fast and slow processes by Todoruk et al. [53] indicate that they are fundamentally different: The fast process had acti-vation energies of ~ 42kJ mol
-1 which is in the upper range
of diffusion associated processes. The slow component, however, had activation energies of > 80kJ mol
-1 indicating
chemical transformations like ester hydrolysis or more com-plex rearrangements of SOM components [53]. During wet-ting of a soil the hydrogen bonds of SOM components and mineral surface, which had been formed previously during drying, have to be broken apart in order to restore hydro-philic surface conditions; this process would be slow and
Fig. (1). Comparison of T2 relaxation time distribution of a water repellent sample directly after water addition and 19 days later using two
smoothing values: a) weight factor 0.1 and b) weight factor 20. Data taken from [45] and adjusted.
Proton Nuclear Magnetic Resonance (NMR) Relaxometry The Open Magnetic Resonance Journal, 2010, Volume 3 19
energetically unfavourable, leading to high activation ener-gies [53]. Other authors distinguished more clearly between wetting and swelling as two separate more or less independ-ent processes [54]. Wetting was suggested to be considerably faster (indicated by a shorter time constant of relaxation time changes) than swelling in hydrophilic soils and primarily associated with the properties of the solid surface (whether mineral or organic). In order to wet a surface it needs to be hydrophilic, however, prolonged contact of water with an organic hydrophobic soil particle surface could render it wet-table and, hence, would allow further processes like swelling to take place. This is displayed in NMR measurements as a slow change in relaxation times towards shorter relaxation times. Swelling here was defined as the hydration of SOM which increases the thickness of the SOM coating or SOM particle. This in turn would lead to a decrease in interparticu-lar pore size [45, 54]. The process of swelling may be of high relevance for contaminant fixation in soils as it may influence interactions of contaminants with SOM by e.g. increasing the available sorption site, forming new sorption domains or changing its rigidity [54, 61].
As described above it is necessary to have a hydrophilic surface in order to enable instant wetting. However, in sys-tems like soil, surfaces change when in contact with water and originally hydrophobic surfaces become wettable after prolonged contact with water. The breakdown of a hydro-phobic surface during wetting is thought to be fast in com-parison to swelling. It was suggested to exploit that fact and use low-field
1H-NMR relaxometry for soil wettability de-
terminations [56, 57, 62]. In order for a liquid in porous me-dia to be relaxed efficiently it needs to be in contact with the solid surface. Theoretical considerations suggest that relaxa-tion times of hydrophobic samples are longer than that of wettable samples enabling a better proton exchange [56, 57]. T2 of water repellent soil samples and model systems was found to be larger than 1000 ms, but that of wettable samples ~100 ms [56, 57]. As described above water repellency of organic coatings on particle surfaces normally breaks down after contact with water, therefore, relaxation times of water repellent and wettable sample should eventually reach the same equilibrium. The decrease of relaxation time and ap-proach of a similar equilibrium was confirmed in two studies and the time for reaching the equilibrium was dependent on the sample [56, 57].
Proton NMR relaxometry studies of water in soil systems allow to distinguish processes taking place during water up-take. It is also possible to differentiate between water in sev-eral environments, i.e., bound, loosely bound and free bulk water. Furthermore, influences of factors like paramagnetic substances in solution and on the solid surface have been characterised and partly quantified. However, it is still nec-essary to quantitatively describe the processes occurring dur-ing water uptake into soils, such as wetting and swelling and evaluate their environmental impact like their involvement in nutrient or contaminant distribution.
PORE SIZE DISTRIBUTION IN SOILS
It is well established that porosity and pores size distribu-tions can be derived from relaxation time distribution of geo-logical formations, like rocks, sandstones or permafrost and gas hydrate sediments, or materials such as ceramics (e.g. [2,
63-65]). However, even in rocks comparison of pore size distributions from different samples has to be considered carefully. The iron concentrations in rock formations are probably high enough to ensure constant surface relaxivity (compare section “water and porous media”), nevertheless, shifts in relaxation time distributions may not only be due to differences in pore size distributions, but differences in the amount of paramagnetic substances present in the sample [41, 49]. The presence of paramagnetic substances on a coated silica gel reduced the relaxation time of water close to the surface so much that the monomodal relaxation time dis-tributions were changed to bimodal distributions, thereby identifying microporosity of the surface [49].With increasing SOM content the number of identified water compartments increased from three to four suggesting a correlation between pore system and organic matter [52]. An even more detailed relationship between soil components and pore sizes was identified in another study: The relaxation time of soil sam-ples was found to be dependent on sand, silt, clay and SOM content, but the degree of correlation was dependent on the pore system, i.e. micro-or mesopores. The transverse relaxa-tion times of micropores correlate with clay and SOM con-tents, but those of mesopores with silt, sand and SOM [66].
In another study the influence of kaolinite addition to sandy samples was investigated [67] and found an increase in relaxation rate with increasing amount of kaolinite present in the sample. This was ascribed to the increasing surface area (increase in smaller pores) and the higher surface relax-ivity of kaolinite (one reason for this higher surface relaxiv-ity may be the presence of iron in the octahedral layers of kaolinite). However, at a certain amount of kaolinite the re-laxation rate increased less. This was assumed to be the point where all sand surfaces were covered in kaolinite and the surface relaxivity was stable, leaving only decreasing pore size and changing pore geometry responsible for changes in T1.
A slightly different approach to determine pore mobile and immobile fractions in a wetland soil was used by Culli-gan et al. [68]: The sample (a sphagnum peat moss) was saturated with water and T1 was determined (at 122 MHz), then a 1 mM Gd
3+ solution was added and T1 was deter-
mined again. As the Gd3+
solution was added under condi-tions where diffusion is negligible, this second measurement sampled only the mobile pore space. It was found that 43% of the pore space showed a fast relaxation time (T1 = 35 ms), and 56% exhibited a longer relaxation time of T1 = 165 ms. The first was assumed to represent the pore space filled by Gd
3+ solution, whereas the latter only by water, therefore,
confirming the existence of two porosities in the wetland peat.
One main assumption when converting relaxation time
distribution into pore size distributions is that pores are not
interconnected or more specific relaxation starts and ends
within one pore. This may apply to geological formations
which have larger pores than soils, but does not hold true for
soils. Also, the pore drainage in soils can be considered to
not necessarily be total, i.e. some pores drain while others
retain their water [60]. Further assumptions are that the sur-
face relaxation is constant throughout the pore system and
the shape factor of the pores is constant and known [55]. In
20 The Open Magnetic Resonance Journal, 2010, Volume 3 Bayer et al.
most studies assessing pore size distributions the fast diffu-
sion regime is assumed, so that relaxation time is influenced
only by the surface relaxivity of the solid surface and the
relaxation time of the bulk phase [66]. The surface relaxivity
can be determined from volume to surface area ratios which
in turn can be determined from e.g. nitrogen adsorption or
mercury porosity measurements [55, 63, 66].
The application of NMR relaxometry to determine soil
pore size distributions so far has been mainly qualitative.
Several studies agree that relaxation time distributions of soil
samples are related to pore sizes, but do not directly and
quantitatively describe pore size distributions [53, 69]. The
study conducted by Hinedi et al. (1993) was probably the
first one to derive a real pore size distribution from a relaxa-
tion time distribution, but did not verify the outcomes by
comparing them to results from conventionally obtained pore
size distributions [55]. A qualitative comparison of NMR
derived and conventional determined pore size distributions
was undertaken in two later studies, but NMR relaxometry
was recommended only as an additional method to conven-
tional pore size determination to characterize pore connec-
tivity [60]. However, a quantitative comparison between
pore size distributions derived from NMR and conventional
methods so far has been mainly conducted for several rock
types [63]. Pore sizes, determined by NMR relaxation meas-
urements in comparison to mercury porosimetry, were over-
estimated by an order of magnitude. Mercury porosimetry is
based on the Washburn equation (x
rv
l
2
cos= , where v is
the rate of liquid entry into the capillary, r is the capillary
radius, l is the liquid surface tension, is the viscosity of the
liquid, x is the distance penetrated, and is the contact angle
[70]). It, therefore, tends to reflect more pore throats than
pore sizes, leading to an underestimation of the real pore size
[63]. Just recently the application of NMR relaxometry (T2
measurements at 2 MHz) for determination of pore size dis-
tributions by quantitatively comparing it to conventional
pore size distributions derived from water retention curves
was verified for several soil types [66]. In this new approach,
the relaxation time – pore size relation revealed two separate
regions. The condition for the fast-diffusion regime [40] was
fulfilled for T2 < 10 ms. For larger T2 values, a transition
from the fast-diffusion to the intermediate-diffusion regime
[40] for finer textured soil samples, and transition from the
intermediate-diffusion to the slow-diffusion regime [40] for
sandy soil samples was determined. Additionally, the true
bulk relaxation time was used instead of the hypothetical one
of free water commonly assumed for such investigations
[66].Consequently, proton relaxation in larger pores was
governed by surface relaxivity and self diffusion of water.
However, for simplification, the condition for the fast-
diffusion regime was assumed as fulfilled for all pore sizes in
this study. A good consistency (R2 = 0.98) between pore size
distributions determined by conventional soil water retention
measurements and 1H NMR relaxometry was found using
the two different surface relaxivities for micro-and
mesopores (for details on calculations see [66]).
As described above, the determination of conventional soul water retention curves is still necessary in order to be able to calculate surface relaxivities. In order to use the whole time-saving potential of the NMR measurements an independent method for the determination of surface relaxiv-ities is necessary. Additionally, changes in pore sizes during water uptake as often reported have to be investigated further as they may not only be attributed to swelling of organic matter on particle surfaces or water re-distribution into pores previously not available, but also to the formation of new pore systems due to microbial activity.
COMPLEXATION OF PARAMAGNETIC IONS IN SOIL SOLUTIONS
Both relaxation times are greatly reduced in the presence of paramagnetic ions. The strength of the effect depends on the ion environment and specification. The interaction of paramagnetic ions with FA or HA in solution, thus, can be investigated using
1H NMR relaxometry. Variations between
Mn(II), Cu(II) and Fe(III) relaxation times suggested that different complexation mechanisms were at work in several studies [51, 71-73]: No change or only minimal change was found for solutions containing sulphosalicylic acid and Mn(II) in contrast to solutions with only Mn(II), suggesting the formation of outer sphere complexes, as the rotational motion of the ions was not affected [71]. However, Cu(II) and Fe(III) solutions were strongly affected by the presence of sulphosalicyclic acid (reduction of relaxation time with increasing concentration of sulphosalicyclic acid) suggesting the formation of inner sphere complexes [71]. Contrary find-ings were reported by Melton et al. for solutions of Lauren-tian HA [72]: Relaxation times of solutions with Cu(II) de-creased only slightly with increasing concentration of HA [72]. The formation of stable or labile metal complexes, therefore, seems to be very dependent on the organic mate-rial. Interactions of organic compounds and FA or HA in solution were also investigated by changing concentrations and environmental parameters in the solution and their ef-fects on relaxation times were observed. A difference in the interaction of HA and monoaromatic compounds was found depending on the aromaticity and also very strongly on pH [73]. Relaxation acceleration due to interaction with dis-solved and colloidal Fe and Mn species in soil solutions causes a wide range of relaxation times in dependence of the Fe and Mn speciation [51].
FA and HA were shown to form - complexes with hy-drophobic organic compounds like dichlorophenol. FA was less effective in forming such complexes than HA which was attributed to the stronger hydrophobic character of HA [74]. Two NMR relaxometry studies using
13C-labeled acenaph-
tone and fluoro-acenaphtone both found evidence that the mode of interaction of FA and acenaphtone depends strongly on the concentration of FA in solution and the solution pH [75, 76].
Investigations of such interactions may help to under-stand the fate of organic compounds in the aquatic environ-ment and are partly transferable to soil systems; however, the soil matrix is so much more complex and exhibits so much more opportunity for interactions apart from the soil solu-tion, that a direct transfer is not possible.
Proton Nuclear Magnetic Resonance (NMR) Relaxometry The Open Magnetic Resonance Journal, 2010, Volume 3 21
MOBILITY AND NON-COVALENT BINDING MECHANISMS OF ORGANIC MOLECULES IN THE
SOLID ORGANIC MATTER
NMR relaxometry can be used to probe the spin envi-ronment and, therefore, gain information about binding and association forms of the molecule under investigation. These investigations are indirectly related to soils as they can help predicting behaviour of organic compounds in the environ-ment. Main constituents of SOM are fulvic acids (FA) and humic acids (HA) and several studies investigated the inter-action and non-covalent binding forms of organic molecules or metal ions with HA and FA (e.g. [71, 73-79]). The identi-fication of rigid and flexible structures within organic mate-rials is also possible [79, 80]. The reported temperature de-pendence of rigid and flexible domains within HA correlated well with glass transition temperature determined by several other authors using differential scanning calorimetry (e.g. [81, 82]). Another recent study [61] reported a correlation of decrease in matrix rigidity of a peat sample with an increase of proton relaxation time (T2). After heating a sample in an airtight container its matrix rigidity was reduced and relaxa-tion time increased, indicating a higher mobility of the or-ganic matter involved. After two weeks proton relaxation time had decreased to the original value and matrix rigidity increased. Suggested by earlier studies obtained from de-tailed DSC and TGA analysis [83-85], it was assumed that this may be due to the formation of cross-links between or-ganic molecules via water molecules (physicochemical ma-trix aging). The thermal and moisture history is expected to be linked closely to the mobility of organics and the matrix rigidity [61]. As rigid and flexible domains probably show different sorption towards contaminants the identification and quantification of such domains within SOM is of interest for modelling contaminant sorption behaviour.
MICROBIAL INFLUENCES
Microorganisms can form extended networks, so called biofilms, in order to relieve water stress and use nutrients more efficiently. These biofilms are formed of extended ex-tracellular polymeric substances (EPS) networks which bind water very effectively and form highly hydrated gels [86]. Biofilms or small biofilm-like structural units can also be formed in soils.
The change of the spin environment within such biofilms compared to bulk water was tested by NMR relaxation or MRI [9, 87, 88]. In aqueous solutions the monomodal relaxa-tion time distribution (T2 at 85 MHz) of water became bi-modal in the presence of a biofilms. However, in a porous model system of glass beads the resolution of the peaks was not possible due to the relaxation effects of the solid surface of the pore system. MR images of the same samples con-firmed biofilm distribution true to the optical examination [87] proving the applicability of the methods for such sys-tems.
In soil samples the detection of biofilm growth is not that easy and bacteria do not form free biofilm inside pores, but use EPS to attach themselves to the particle surface and en-hance transport of nutrients [86]. Microorganisms in soils are mainly attached to particle surfaces and primarily found in pores with diameters of 1-30 m [89, 90].
Enhancing microorganism activity in soil samples re-sulted in a stronger shift of the relaxation time (T2) towards shorter T2 in treated (enhanced microbial activity) than un-treated samples over the course of water uptake. This could be due to the increased production of EPS in the treated samples which may have reduced sizes of existing pores or formed a new micropore system. However, the contributions of other processes in reducing relaxation times like swelling of SOM or the change of surface relaxivity due to bacterial growths could not be excluded up to now [88] and further research in this area is needed.
Effects of Biofilm on Proton Relaxation Time Distribu-tions in Model Soil Systems
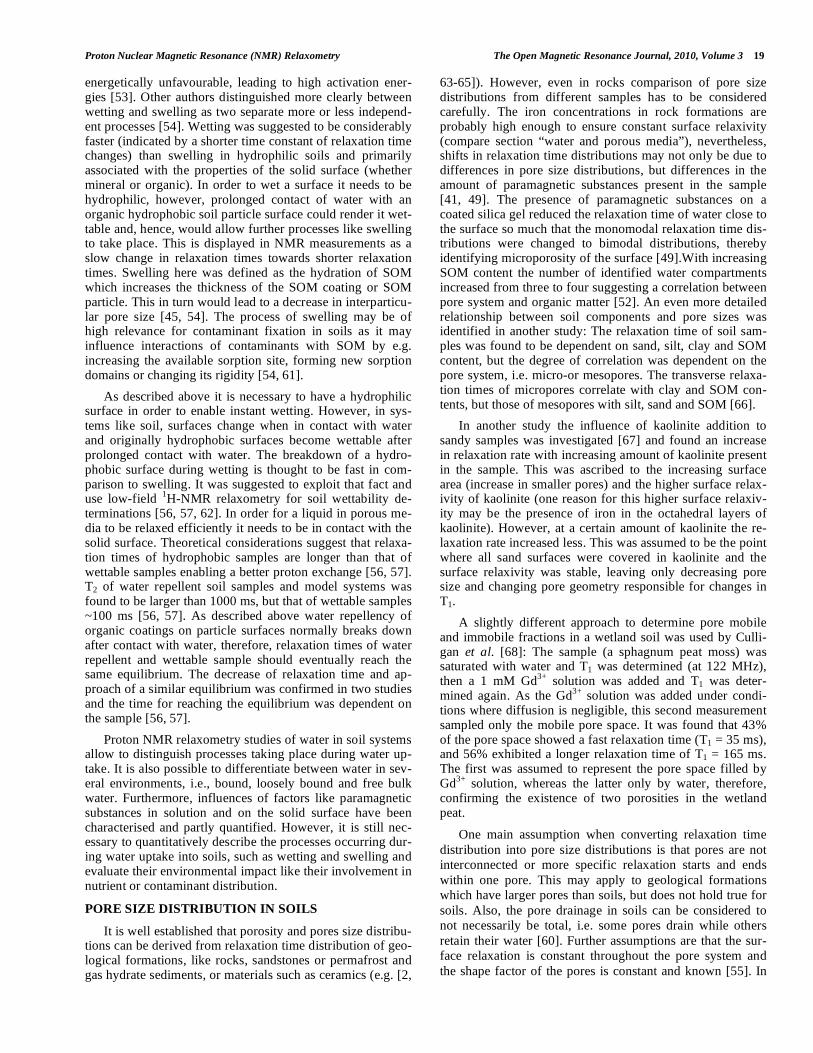
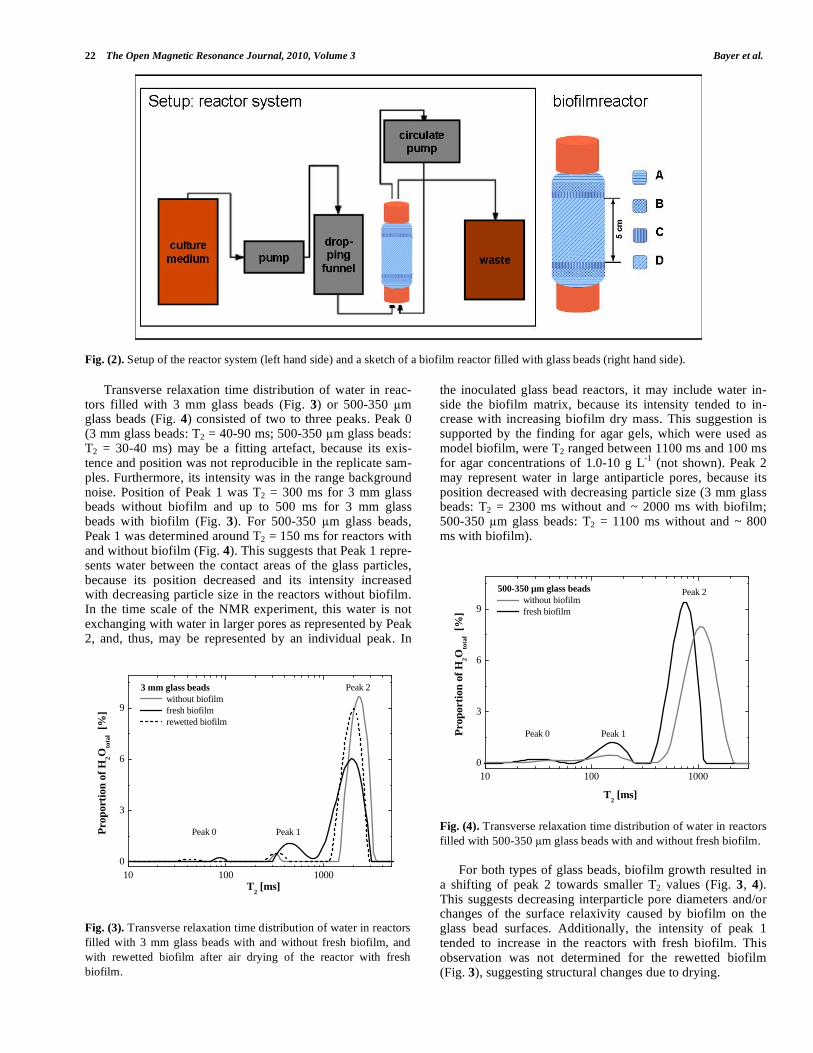
In a qualitative study, the effects of bacterial biofilm on transverse relaxation time distribution of water in biofilm reactors, used as model soil systems, at 2 MHz (Maran 2, Resonance Instruments, UK) were investigated (not pub-lished). Special designed glass bottles (height x diameter: 12 cm x 5 cm; volume: 160 cm ) with two bottle closures (at the top and bottom) were filled with glass beads of different par-ticle sizes or with natural soil (sandy soil, sieve fraction 63
m to 2 mm). Some of the reactors were inoculated with a biofilm producing isolate (99% sequence identity with Si-norhizobium sp. TB8-10-II, isolated from a waste water sand filter) and relaxation time distributions were measured after incubation time of 5 to 8 days. Optical inspection of the glass bead reactors showed biofilm growth after this time; for the soil reactor a similar growth was assumed. Fig. (2) shows the setup of the reactor system (left hand side) and a sketch of a filled reactor (right hand side). Reactors were filled with up to five layers of glass beads with particle sizes ranging from 5 mm to 150 m (decreasing particle sizes from glass closure to bottle middle) to prevent particle outflow. Layer D in Fig. (2) represents the domain studied in the NMR relaxometer (i.e. filled with the different growing materials). 2.5 L of a 30 g L
-1 Trypticase
TM Soy Broth solution (BD Diagnostic
Systems, Heidelberg, Germany) was used as a culture me-dium and was pumped with 8 mL h
-1 into to a dropping fun-
nel to prevent contamination (Fig. 2). A second pump (circu-late pump with 900 mL h
-1) was responsible for the flow of
culture medium through the reactor. After finishing the ex-periment, the reactors were dried using a pump. However, this was only possible for the 3 mm glass beads as the pres-sure was not high enough to dry the other size fractions.
1H NMR measurements were performed using a CPMG
pulse sequence [91]. The number of 180° pulses ranged be-tween 8192 (soil) and 14336 (3 mm glass beads) with con-stant number of scans of 256. Echo spacing ranged between 150 s (soil) and 300 s (glass beads). The objective was to achieve a signal to noise ratio between 50 and 100. The repe-tition time was set individually for every reactor and chosen based on three to six times the longest T2 and was 3-10 s. Relaxation time distributions were calculated from the decay curves with the WinDXP software (Resonance Instruments, UK) running a zeroth order regularisation to perform a con-tinuous distribution of exponentials applying the BRD (But-ler, Reeds and Dawson) algorithm [92]. The relaxation time distributions consisted of 128 time constants with associated amplitudes. The time constant range was 1-10000 ms, and the weight factor for the regularization was 0.5 for all biofilm reactors.
22 The Open Magnetic Resonance Journal, 2010, Volume 3 Bayer et al.
Fig. (2). Setup of the reactor system (left hand side) and a sketch of a biofilm reactor filled with glass beads (right hand side).
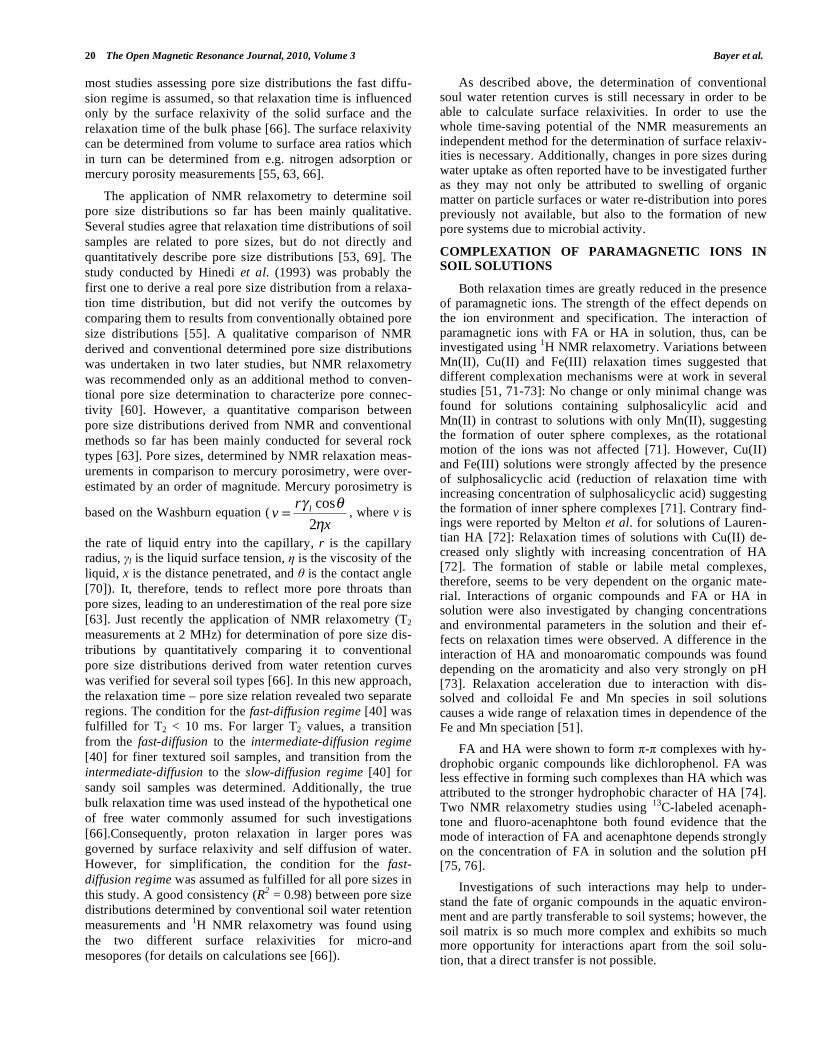
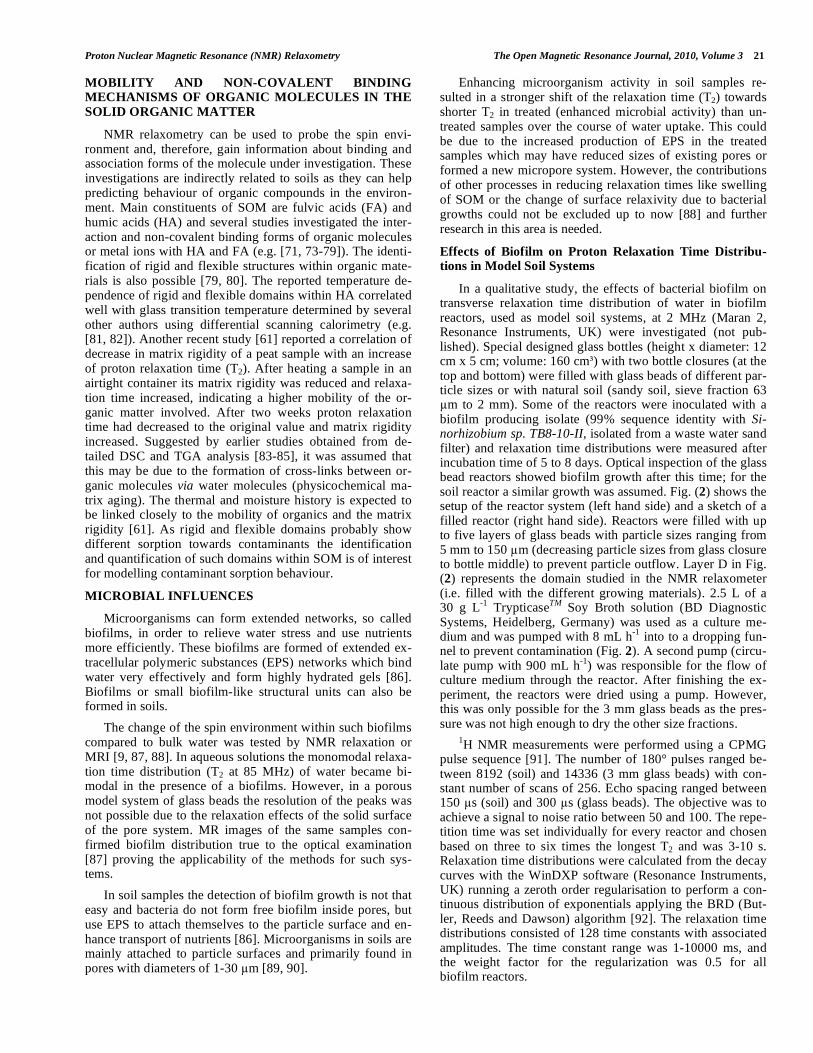
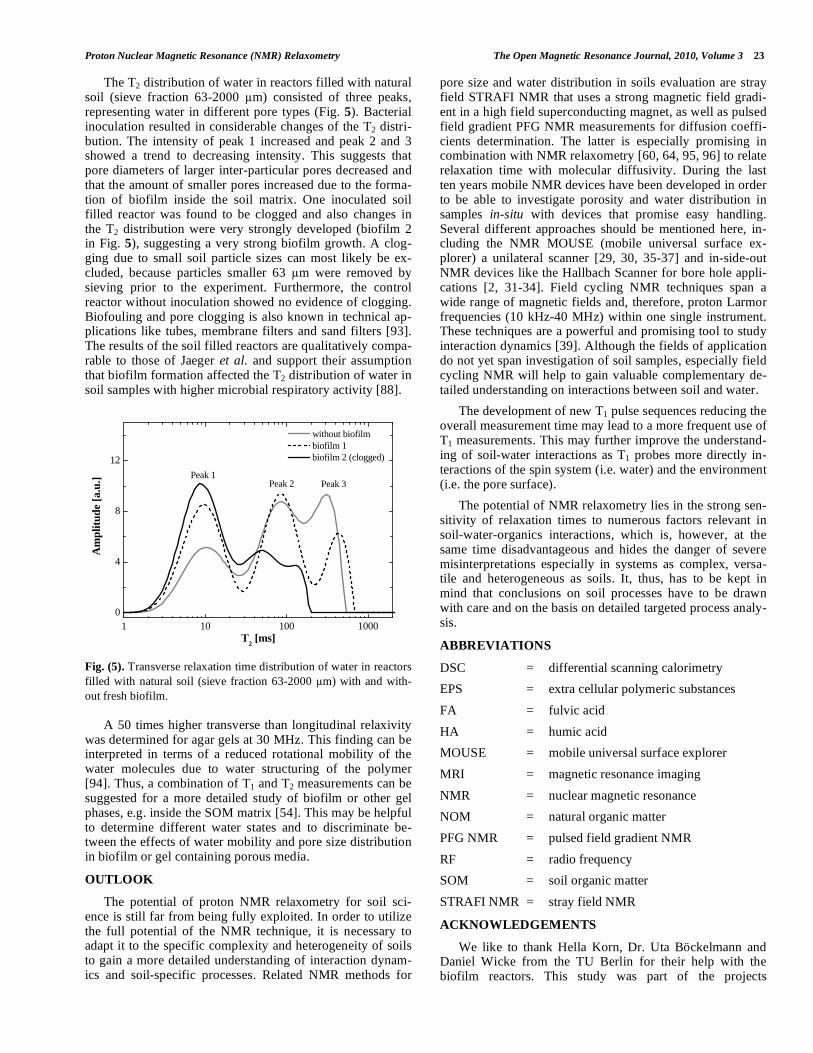
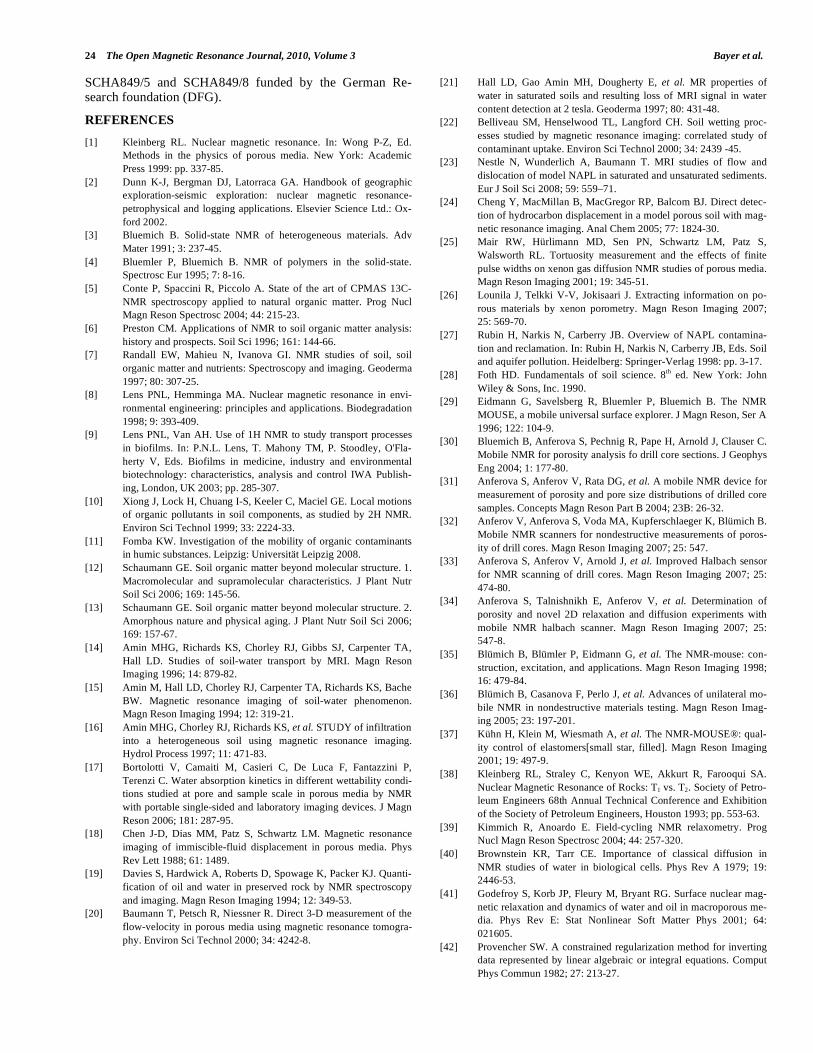
Transverse relaxation time distribution of water in reac-tors filled with 3 mm glass beads (Fig. 3) or 500-350 m glass beads (Fig. 4) consisted of two to three peaks. Peak 0 (3 mm glass beads: T2 = 40-90 ms; 500-350 m glass beads: T2 = 30-40 ms) may be a fitting artefact, because its exis-tence and position was not reproducible in the replicate sam-ples. Furthermore, its intensity was in the range background noise. Position of Peak 1 was T2 = 300 ms for 3 mm glass beads without biofilm and up to 500 ms for 3 mm glass beads with biofilm (Fig. 3). For 500-350 m glass beads, Peak 1 was determined around T2 = 150 ms for reactors with and without biofilm (Fig. 4). This suggests that Peak 1 repre-sents water between the contact areas of the glass particles, because its position decreased and its intensity increased with decreasing particle size in the reactors without biofilm. In the time scale of the NMR experiment, this water is not exchanging with water in larger pores as represented by Peak 2, and, thus, may be represented by an individual peak. In
the inoculated glass bead reactors, it may include water in-side the biofilm matrix, because its intensity tended to in-crease with increasing biofilm dry mass. This suggestion is supported by the finding for agar gels, which were used as model biofilm, were T2 ranged between 1100 ms and 100 ms for agar concentrations of 1.0-10 g L
-1 (not shown). Peak 2
may represent water in large antiparticle pores, because its position decreased with decreasing particle size (3 mm glass beads: T2 = 2300 ms without and ~ 2000 ms with biofilm; 500-350 m glass beads: T2 = 1100 ms without and ~ 800 ms with biofilm).
Fig. (4). Transverse relaxation time distribution of water in reactors
filled with 500-350 m glass beads with and without fresh biofilm.
For both types of glass beads, biofilm growth resulted in a shifting of peak 2 towards smaller T2 values (Fig. 3, 4). This suggests decreasing interparticle pore diameters and/or changes of the surface relaxivity caused by biofilm on the glass bead surfaces. Additionally, the intensity of peak 1 tended to increase in the reactors with fresh biofilm. This observation was not determined for the rewetted biofilm (Fig. 3), suggesting structural changes due to drying.
Fig. (3). Transverse relaxation time distribution of water in reactors
filled with 3 mm glass beads with and without fresh biofilm, and
with rewetted biofilm after air drying of the reactor with fresh
biofilm.
10 100 10000
3
6
9
Peak 0
Peak 23 mm glass beads without biofilm fresh biofilm rewetted biofilm
Pro
por
tion
of
H2O
tota
l [%
]
T2 [ms]
Peak 1
10 100 10000
3
6
9
500-350 µm glass beads without biofilm fresh biofilm
Pro
por
tion
of
H2O
tota
l [%
]
T2 [ms]
Peak 0 Peak 1
Peak 2
Proton Nuclear Magnetic Resonance (NMR) Relaxometry The Open Magnetic Resonance Journal, 2010, Volume 3 23
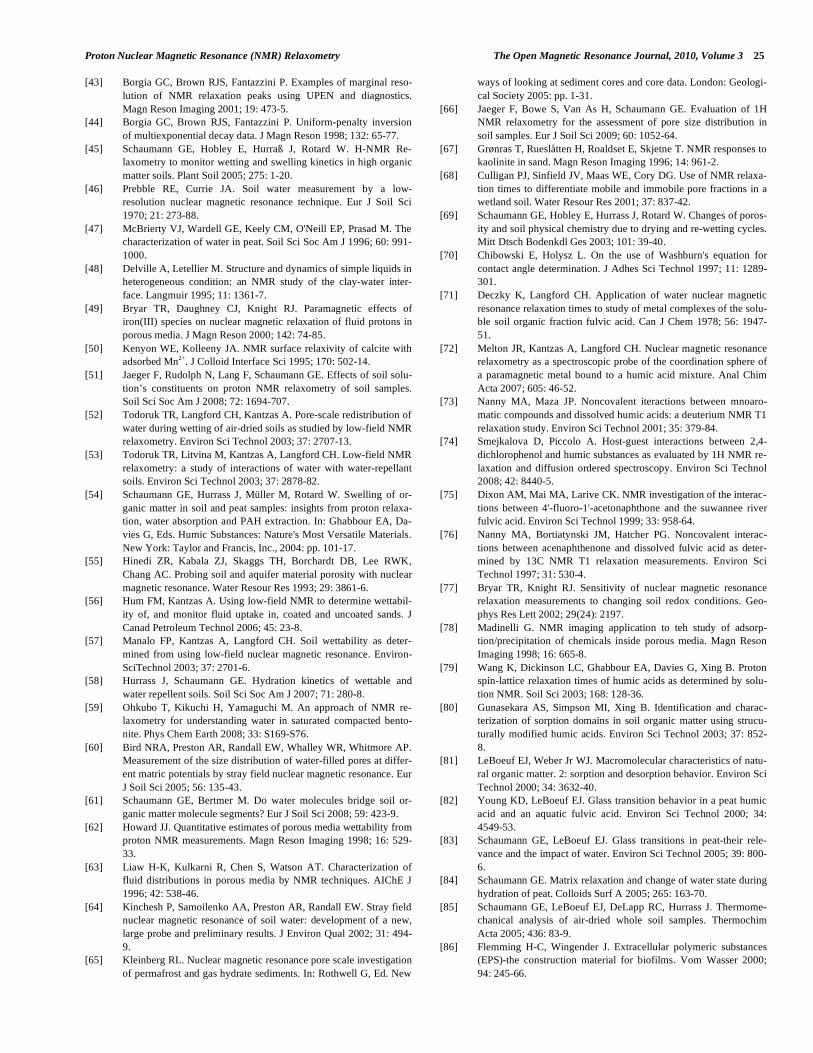
The T2 distribution of water in reactors filled with natural soil (sieve fraction 63-2000 m) consisted of three peaks, representing water in different pore types (Fig. 5). Bacterial inoculation resulted in considerable changes of the T2 distri-bution. The intensity of peak 1 increased and peak 2 and 3 showed a trend to decreasing intensity. This suggests that pore diameters of larger inter-particular pores decreased and that the amount of smaller pores increased due to the forma-tion of biofilm inside the soil matrix. One inoculated soil filled reactor was found to be clogged and also changes in the T2 distribution were very strongly developed (biofilm 2 in Fig. 5), suggesting a very strong biofilm growth. A clog-ging due to small soil particle sizes can most likely be ex-cluded, because particles smaller 63 m were removed by sieving prior to the experiment. Furthermore, the control reactor without inoculation showed no evidence of clogging. Biofouling and pore clogging is also known in technical ap-plications like tubes, membrane filters and sand filters [93]. The results of the soil filled reactors are qualitatively compa-rable to those of Jaeger et al. and support their assumption that biofilm formation affected the T2 distribution of water in soil samples with higher microbial respiratory activity [88].
Fig. (5). Transverse relaxation time distribution of water in reactors
filled with natural soil (sieve fraction 63-2000 m) with and with-
out fresh biofilm.
A 50 times higher transverse than longitudinal relaxivity was determined for agar gels at 30 MHz. This finding can be interpreted in terms of a reduced rotational mobility of the water molecules due to water structuring of the polymer [94]. Thus, a combination of T1 and T2 measurements can be suggested for a more detailed study of biofilm or other gel phases, e.g. inside the SOM matrix [54]. This may be helpful to determine different water states and to discriminate be-tween the effects of water mobility and pore size distribution in biofilm or gel containing porous media.
OUTLOOK
The potential of proton NMR relaxometry for soil sci-ence is still far from being fully exploited. In order to utilize the full potential of the NMR technique, it is necessary to adapt it to the specific complexity and heterogeneity of soils to gain a more detailed understanding of interaction dynam-ics and soil-specific processes. Related NMR methods for
pore size and water distribution in soils evaluation are stray field STRAFI NMR that uses a strong magnetic field gradi-ent in a high field superconducting magnet, as well as pulsed field gradient PFG NMR measurements for diffusion coeffi-cients determination. The latter is especially promising in combination with NMR relaxometry [60, 64, 95, 96] to relate relaxation time with molecular diffusivity. During the last ten years mobile NMR devices have been developed in order to be able to investigate porosity and water distribution in samples in-situ with devices that promise easy handling. Several different approaches should be mentioned here, in-cluding the NMR MOUSE (mobile universal surface ex-plorer) a unilateral scanner [29, 30, 35-37] and in-side-out NMR devices like the Hallbach Scanner for bore hole appli-cations [2, 31-34]. Field cycling NMR techniques span a wide range of magnetic fields and, therefore, proton Larmor frequencies (10 kHz-40 MHz) within one single instrument. These techniques are a powerful and promising tool to study interaction dynamics [39]. Although the fields of application do not yet span investigation of soil samples, especially field cycling NMR will help to gain valuable complementary de-tailed understanding on interactions between soil and water.
The development of new T1 pulse sequences reducing the overall measurement time may lead to a more frequent use of T1 measurements. This may further improve the understand-ing of soil-water interactions as T1 probes more directly in-teractions of the spin system (i.e. water) and the environment (i.e. the pore surface).
The potential of NMR relaxometry lies in the strong sen-sitivity of relaxation times to numerous factors relevant in soil-water-organics interactions, which is, however, at the same time disadvantageous and hides the danger of severe misinterpretations especially in systems as complex, versa-tile and heterogeneous as soils. It, thus, has to be kept in mind that conclusions on soil processes have to be drawn with care and on the basis on detailed targeted process analy-sis.
ABBREVIATIONS
DSC = differential scanning calorimetry
EPS = extra cellular polymeric substances
FA = fulvic acid
HA = humic acid
MOUSE = mobile universal surface explorer
MRI = magnetic resonance imaging
NMR = nuclear magnetic resonance
NOM = natural organic matter
PFG NMR = pulsed field gradient NMR
RF = radio frequency
SOM = soil organic matter
STRAFI NMR = stray field NMR
ACKNOWLEDGEMENTS
We like to thank Hella Korn, Dr. Uta Böckelmann and Daniel Wicke from the TU Berlin for their help with the biofilm reactors. This study was part of the projects
1 10 100 10000
4
8
12
Peak 3Peak 2Peak 1
Am
plit
ud
e [a
.u.]
T2 [ms]
without biofilm biofilm 1 biofilm 2 (clogged)
24 The Open Magnetic Resonance Journal, 2010, Volume 3 Bayer et al.
SCHA849/5 and SCHA849/8 funded by the German Re-search foundation (DFG).
REFERENCES
[1] Kleinberg RL. Nuclear magnetic resonance. In: Wong P-Z, Ed.
Methods in the physics of porous media. New York: Academic
Press 1999: pp. 337-85.
[2] Dunn K-J, Bergman DJ, Latorraca GA. Handbook of geographic
exploration-seismic exploration: nuclear magnetic resonance-
petrophysical and logging applications. Elsevier Science Ltd.: Ox-
ford 2002.
[3] Bluemich B. Solid-state NMR of heterogeneous materials. Adv
Mater 1991; 3: 237-45.
[4] Bluemler P, Bluemich B. NMR of polymers in the solid-state.
Spectrosc Eur 1995; 7: 8-16.
[5] Conte P, Spaccini R, Piccolo A. State of the art of CPMAS 13C-
NMR spectroscopy applied to natural organic matter. Prog Nucl
Magn Reson Spectrosc 2004; 44: 215-23.
[6] Preston CM. Applications of NMR to soil organic matter analysis:
history and prospects. Soil Sci 1996; 161: 144-66.
[7] Randall EW, Mahieu N, Ivanova GI. NMR studies of soil, soil
organic matter and nutrients: Spectroscopy and imaging. Geoderma
1997; 80: 307-25.
[8] Lens PNL, Hemminga MA. Nuclear magnetic resonance in envi-
ronmental engineering: principles and applications. Biodegradation
1998; 9: 393-409.
[9] Lens PNL, Van AH. Use of 1H NMR to study transport processes
in biofilms. In: P.N.L. Lens, T. Mahony TM, P. Stoodley, O'Fla-
herty V, Eds. Biofilms in medicine, industry and environmental
biotechnology: characteristics, analysis and control IWA Publish-
ing, London, UK 2003; pp. 285-307.
[10] Xiong J, Lock H, Chuang I-S, Keeler C, Maciel GE. Local motions
of organic pollutants in soil components, as studied by 2H NMR.
Environ Sci Technol 1999; 33: 2224-33.
[11] Fomba KW. Investigation of the mobility of organic contaminants
in humic substances. Leipzig: Universität Leipzig 2008.
[12] Schaumann GE. Soil organic matter beyond molecular structure. 1.
Macromolecular and supramolecular characteristics. J Plant Nutr
Soil Sci 2006; 169: 145-56.
[13] Schaumann GE. Soil organic matter beyond molecular structure. 2.
Amorphous nature and physical aging. J Plant Nutr Soil Sci 2006;
169: 157-67.
[14] Amin MHG, Richards KS, Chorley RJ, Gibbs SJ, Carpenter TA,
Hall LD. Studies of soil-water transport by MRI. Magn Reson
Imaging 1996; 14: 879-82.
[15] Amin M, Hall LD, Chorley RJ, Carpenter TA, Richards KS, Bache
BW. Magnetic resonance imaging of soil-water phenomenon.
Magn Reson Imaging 1994; 12: 319-21.
[16] Amin MHG, Chorley RJ, Richards KS, et al. STUDY of infiltration
into a heterogeneous soil using magnetic resonance imaging.
Hydrol Process 1997; 11: 471-83.
[17] Bortolotti V, Camaiti M, Casieri C, De Luca F, Fantazzini P,
Terenzi C. Water absorption kinetics in different wettability condi-
tions studied at pore and sample scale in porous media by NMR
with portable single-sided and laboratory imaging devices. J Magn
Reson 2006; 181: 287-95.
[18] Chen J-D, Dias MM, Patz S, Schwartz LM. Magnetic resonance
imaging of immiscible-fluid displacement in porous media. Phys
Rev Lett 1988; 61: 1489.
[19] Davies S, Hardwick A, Roberts D, Spowage K, Packer KJ. Quanti-
fication of oil and water in preserved rock by NMR spectroscopy
and imaging. Magn Reson Imaging 1994; 12: 349-53.
[20] Baumann T, Petsch R, Niessner R. Direct 3-D measurement of the
flow-velocity in porous media using magnetic resonance tomogra-
phy. Environ Sci Technol 2000; 34: 4242-8.
[21] Hall LD, Gao Amin MH, Dougherty E, et al. MR properties of
water in saturated soils and resulting loss of MRI signal in water
content detection at 2 tesla. Geoderma 1997; 80: 431-48.
[22] Belliveau SM, Henselwood TL, Langford CH. Soil wetting proc-
esses studied by magnetic resonance imaging: correlated study of
contaminant uptake. Environ Sci Technol 2000; 34: 2439 -45.
[23] Nestle N, Wunderlich A, Baumann T. MRI studies of flow and
dislocation of model NAPL in saturated and unsaturated sediments.
Eur J Soil Sci 2008; 59: 559–71.
[24] Cheng Y, MacMillan B, MacGregor RP, Balcom BJ. Direct detec-
tion of hydrocarbon displacement in a model porous soil with mag-
netic resonance imaging. Anal Chem 2005; 77: 1824-30.
[25] Mair RW, Hürlimann MD, Sen PN, Schwartz LM, Patz S,
Walsworth RL. Tortuosity measurement and the effects of finite
pulse widths on xenon gas diffusion NMR studies of porous media.
Magn Reson Imaging 2001; 19: 345-51.
[26] Lounila J, Telkki V-V, Jokisaari J. Extracting information on po-
rous materials by xenon porometry. Magn Reson Imaging 2007;
25: 569-70.
[27] Rubin H, Narkis N, Carberry JB. Overview of NAPL contamina-
tion and reclamation. In: Rubin H, Narkis N, Carberry JB, Eds. Soil
and aquifer pollution. Heidelberg: Springer-Verlag 1998: pp. 3-17.
[28] Foth HD. Fundamentals of soil science. 8th ed. New York: John
Wiley & Sons, Inc. 1990.
[29] Eidmann G, Savelsberg R, Bluemler P, Bluemich B. The NMR
MOUSE, a mobile universal surface explorer. J Magn Reson, Ser A
1996; 122: 104-9.
[30] Bluemich B, Anferova S, Pechnig R, Pape H, Arnold J, Clauser C.
Mobile NMR for porosity analysis fo drill core sections. J Geophys
Eng 2004; 1: 177-80.
[31] Anferova S, Anferov V, Rata DG, et al. A mobile NMR device for
measurement of porosity and pore size distributions of drilled core
samples. Concepts Magn Reson Part B 2004; 23B: 26-32.
[32] Anferov V, Anferova S, Voda MA, Kupferschlaeger K, Blümich B.
Mobile NMR scanners for nondestructive measurements of poros-
ity of drill cores. Magn Reson Imaging 2007; 25: 547.
[33] Anferova S, Anferov V, Arnold J, et al. Improved Halbach sensor
for NMR scanning of drill cores. Magn Reson Imaging 2007; 25:
474-80.
[34] Anferova S, Talnishnikh E, Anferov V, et al. Determination of
porosity and novel 2D relaxation and diffusion experiments with
mobile NMR halbach scanner. Magn Reson Imaging 2007; 25:
547-8.
[35] Blümich B, Blümler P, Eidmann G, et al. The NMR-mouse: con-
struction, excitation, and applications. Magn Reson Imaging 1998;
16: 479-84.
[36] Blümich B, Casanova F, Perlo J, et al. Advances of unilateral mo-
bile NMR in nondestructive materials testing. Magn Reson Imag-
ing 2005; 23: 197-201.
[37] Kühn H, Klein M, Wiesmath A, et al. The NMR-MOUSE®: qual-
ity control of elastomers[small star, filled]. Magn Reson Imaging
2001; 19: 497-9.
[38] Kleinberg RL, Straley C, Kenyon WE, Akkurt R, Farooqui SA.
Nuclear Magnetic Resonance of Rocks: T1 vs. T2. Society of Petro-
leum Engineers 68th Annual Technical Conference and Exhibition
of the Society of Petroleum Engineers, Houston 1993; pp. 553-63.
[39] Kimmich R, Anoardo E. Field-cycling NMR relaxometry. Prog
Nucl Magn Reson Spectrosc 2004; 44: 257-320.
[40] Brownstein KR, Tarr CE. Importance of classical diffusion in
NMR studies of water in biological cells. Phys Rev A 1979; 19:
2446-53.
[41] Godefroy S, Korb JP, Fleury M, Bryant RG. Surface nuclear mag-
netic relaxation and dynamics of water and oil in macroporous me-
dia. Phys Rev E: Stat Nonlinear Soft Matter Phys 2001; 64:
021605.
[42] Provencher SW. A constrained regularization method for inverting
data represented by linear algebraic or integral equations. Comput
Phys Commun 1982; 27: 213-27.
Proton Nuclear Magnetic Resonance (NMR) Relaxometry The Open Magnetic Resonance Journal, 2010, Volume 3 25
[43] Borgia GC, Brown RJS, Fantazzini P. Examples of marginal reso-
lution of NMR relaxation peaks using UPEN and diagnostics.
Magn Reson Imaging 2001; 19: 473-5.
[44] Borgia GC, Brown RJS, Fantazzini P. Uniform-penalty inversion
of multiexponential decay data. J Magn Reson 1998; 132: 65-77.
[45] Schaumann GE, Hobley E, Hurraß J, Rotard W. H-NMR Re-
laxometry to monitor wetting and swelling kinetics in high organic
matter soils. Plant Soil 2005; 275: 1-20.
[46] Prebble RE, Currie JA. Soil water measurement by a low-
resolution nuclear magnetic resonance technique. Eur J Soil Sci
1970; 21: 273-88.
[47] McBrierty VJ, Wardell GE, Keely CM, O'Neill EP, Prasad M. The
characterization of water in peat. Soil Sci Soc Am J 1996; 60: 991-
1000.
[48] Delville A, Letellier M. Structure and dynamics of simple liquids in
heterogeneous condition: an NMR study of the clay-water inter-
face. Langmuir 1995; 11: 1361-7.
[49] Bryar TR, Daughney CJ, Knight RJ. Paramagnetic effects of
iron(III) species on nuclear magnetic relaxation of fluid protons in
porous media. J Magn Reson 2000; 142: 74-85.
[50] Kenyon WE, Kolleeny JA. NMR surface relaxivity of calcite with
adsorbed Mn2+. J Colloid Interface Sci 1995; 170: 502-14.
[51] Jaeger F, Rudolph N, Lang F, Schaumann GE. Effects of soil solu-
tion’s constituents on proton NMR relaxometry of soil samples.
Soil Sci Soc Am J 2008; 72: 1694-707.
[52] Todoruk TR, Langford CH, Kantzas A. Pore-scale redistribution of
water during wetting of air-dried soils as studied by low-field NMR
relaxometry. Environ Sci Technol 2003; 37: 2707-13.
[53] Todoruk TR, Litvina M, Kantzas A, Langford CH. Low-field NMR
relaxometry: a study of interactions of water with water-repellant
soils. Environ Sci Technol 2003; 37: 2878-82.
[54] Schaumann GE, Hurrass J, Müller M, Rotard W. Swelling of or-
ganic matter in soil and peat samples: insights from proton relaxa-
tion, water absorption and PAH extraction. In: Ghabbour EA, Da-
vies G, Eds. Humic Substances: Nature's Most Versatile Materials.
New York: Taylor and Francis, Inc., 2004: pp. 101-17.
[55] Hinedi ZR, Kabala ZJ, Skaggs TH, Borchardt DB, Lee RWK,
Chang AC. Probing soil and aquifer material porosity with nuclear
magnetic resonance. Water Resour Res 1993; 29: 3861-6.
[56] Hum FM, Kantzas A. Using low-field NMR to determine wettabil-
ity of, and monitor fluid uptake in, coated and uncoated sands. J
Canad Petroleum Technol 2006; 45: 23-8.
[57] Manalo FP, Kantzas A, Langford CH. Soil wettability as deter-
mined from using low-field nuclear magnetic resonance. Environ-
SciTechnol 2003; 37: 2701-6.
[58] Hurrass J, Schaumann GE. Hydration kinetics of wettable and
water repellent soils. Soil Sci Soc Am J 2007; 71: 280-8.
[59] Ohkubo T, Kikuchi H, Yamaguchi M. An approach of NMR re-
laxometry for understanding water in saturated compacted bento-
nite. Phys Chem Earth 2008; 33: S169-S76.
[60] Bird NRA, Preston AR, Randall EW, Whalley WR, Whitmore AP.
Measurement of the size distribution of water-filled pores at differ-
ent matric potentials by stray field nuclear magnetic resonance. Eur
J Soil Sci 2005; 56: 135-43.
[61] Schaumann GE, Bertmer M. Do water molecules bridge soil or-
ganic matter molecule segments? Eur J Soil Sci 2008; 59: 423-9.
[62] Howard JJ. Quantitative estimates of porous media wettability from
proton NMR measurements. Magn Reson Imaging 1998; 16: 529-
33.
[63] Liaw H-K, Kulkarni R, Chen S, Watson AT. Characterization of
fluid distributions in porous media by NMR techniques. AIChE J
1996; 42: 538-46.
[64] Kinchesh P, Samoilenko AA, Preston AR, Randall EW. Stray field
nuclear magnetic resonance of soil water: development of a new,
large probe and preliminary results. J Environ Qual 2002; 31: 494-
9.
[65] Kleinberg RL. Nuclear magnetic resonance pore scale investigation
of permafrost and gas hydrate sediments. In: Rothwell G, Ed. New
ways of looking at sediment cores and core data. London: Geologi-
cal Society 2005: pp. 1-31.
[66] Jaeger F, Bowe S, Van As H, Schaumann GE. Evaluation of 1H
NMR relaxometry for the assessment of pore size distribution in
soil samples. Eur J Soil Sci 2009; 60: 1052-64.
[67] Grønras T, Rueslåtten H, Roaldset E, Skjetne T. NMR responses to
kaolinite in sand. Magn Reson Imaging 1996; 14: 961-2.
[68] Culligan PJ, Sinfield JV, Maas WE, Cory DG. Use of NMR relaxa-
tion times to differentiate mobile and immobile pore fractions in a
wetland soil. Water Resour Res 2001; 37: 837-42.
[69] Schaumann GE, Hobley E, Hurrass J, Rotard W. Changes of poros-
ity and soil physical chemistry due to drying and re-wetting cycles.
Mitt Dtsch Bodenkdl Ges 2003; 101: 39-40.
[70] Chibowski E, Holysz L. On the use of Washburn's equation for
contact angle determination. J Adhes Sci Technol 1997; 11: 1289-
301.
[71] Deczky K, Langford CH. Application of water nuclear magnetic
resonance relaxation times to study of metal complexes of the solu-
ble soil organic fraction fulvic acid. Can J Chem 1978; 56: 1947-
51.
[72] Melton JR, Kantzas A, Langford CH. Nuclear magnetic resonance
relaxometry as a spectroscopic probe of the coordination sphere of
a paramagnetic metal bound to a humic acid mixture. Anal Chim
Acta 2007; 605: 46-52.
[73] Nanny MA, Maza JP. Noncovalent iteractions between mnoaro-
matic compounds and dissolved humic acids: a deuterium NMR T1
relaxation study. Environ Sci Technol 2001; 35: 379-84.
[74] Smejkalova D, Piccolo A. Host-guest interactions between 2,4-
dichlorophenol and humic substances as evaluated by 1H NMR re-
laxation and diffusion ordered spectroscopy. Environ Sci Technol
2008; 42: 8440-5.
[75] Dixon AM, Mai MA, Larive CK. NMR investigation of the interac-
tions between 4'-fluoro-1'-acetonaphthone and the suwannee river
fulvic acid. Environ Sci Technol 1999; 33: 958-64.
[76] Nanny MA, Bortiatynski JM, Hatcher PG. Noncovalent interac-
tions between acenaphthenone and dissolved fulvic acid as deter-
mined by 13C NMR T1 relaxation measurements. Environ Sci
Technol 1997; 31: 530-4.
[77] Bryar TR, Knight RJ. Sensitivity of nuclear magnetic resonance
relaxation measurements to changing soil redox conditions. Geo-
phys Res Lett 2002; 29(24): 2197.
[78] Madinelli G. NMR imaging application to teh study of adsorp-
tion/precipitation of chemicals inside porous media. Magn Reson
Imaging 1998; 16: 665-8.
[79] Wang K, Dickinson LC, Ghabbour EA, Davies G, Xing B. Proton
spin-lattice relaxation times of humic acids as determined by solu-
tion NMR. Soil Sci 2003; 168: 128-36.
[80] Gunasekara AS, Simpson MI, Xing B. Identification and charac-
terization of sorption domains in soil organic matter using strucu-
turally modified humic acids. Environ Sci Technol 2003; 37: 852-
8.
[81] LeBoeuf EJ, Weber Jr WJ. Macromolecular characteristics of natu-
ral organic matter. 2: sorption and desorption behavior. Environ Sci
Technol 2000; 34: 3632-40.
[82] Young KD, LeBoeuf EJ. Glass transition behavior in a peat humic
acid and an aquatic fulvic acid. Environ Sci Technol 2000; 34:
4549-53.
[83] Schaumann GE, LeBoeuf EJ. Glass transitions in peat-their rele-
vance and the impact of water. Environ Sci Technol 2005; 39: 800-
6.
[84] Schaumann GE. Matrix relaxation and change of water state during
hydration of peat. Colloids Surf A 2005; 265: 163-70.
[85] Schaumann GE, LeBoeuf EJ, DeLapp RC, Hurrass J. Thermome-
chanical analysis of air-dried whole soil samples. Thermochim
Acta 2005; 436: 83-9.
[86] Flemming H-C, Wingender J. Extracellular polymeric substances
(EPS)-the construction material for biofilms. Vom Wasser 2000;
94: 245-66.
26 The Open Magnetic Resonance Journal, 2010, Volume 3 Bayer et al.
[87] Hoskins BC, Fevang L, Majors PD, Sharma MM, Georgiou G.
Selective imaging of biofilms in porous media by NMR relaxation.
J Magn Reson 1999; 139: 67-73.
[88] Jaeger F, Grohmann E, Schaumann GE. 1H NMR Relaxometry in
natural humous soil samples: insights in microbial effects on re-
laxation time distributions. Plant Soil 2006; 280: 209-22.
[89] Mills AL, Powelson DK. Bacterial interactions with surfaces in
soils. In Fletcher M, Ed. Molecular and ecological diversity of bac-
terial adhesion. New York: Wiley-Liss, Inc. 1996; pp. 25-57.
[90] Kirchmann H, Gerzabek MH. Relationship between soil organic
matter and micropores in a long-term experiment at Ultuna, Swe-
den. J Plant Nutr Soil Sci 1999; 162: 493-8.
[91] Meiboom S, Gill D. Modified spin-echo method for measuring
nuclear relaxation times. Rev Sci Instrum 1958; 29: 688-91.
[92] Butler JP, Reeds JA, Dawson SV. Estimating solutions of first kind
integral equations with nonnegative constraints and optimal
smoothing. SIAM J Numer Anal 1981; 18: 381-97.
[93] Flemming HC, Wingender J. Relevance of microbial extracellular
polymeric substances (EPSs)--Part II: Technical aspects. Water Sci
Technol 2001; 43: 9-16.
[94] Radosta S, Schierbaum F, Yuriev WP. Polymer-water interaction
of maltodextrins. Part II: NMR study of bound water in liquid
maltodextrin-water systems. Starch-Stärke 1989; 41: 428-30.
[95] Preston AR, Bird NRA, Kinchesh P, Randall EW, Whalley WR.
STRAFI-NMR studies of water transport in soil. Magn Reson Im-
aging 2001; 19: 561-3.
[96] Vogt C, Galvosas P, Klitzsch N, Stallmach F. Self-diffusion studies
of pore fluids in unconsolidated sediments by PFG NMR. J Appl
Geophys 2002; 50: 455-67.
Received: May 04, 2009 Revised: November 17, 2009 Accepted: January 25, 2010
© Bayer et al.; Licensee Bentham Open.
This is an open access article licensed under the terms of the Creative Commons Attribution Non-Commercial License (http://creativecommons.org/licenses/by-nc/3.0/) which permits unrestricted, non-commercial use, distribution and reproduction in any medium, provided the
work is properly cited.