Embed Size (px)
Citation preview
The Open Biomedical Engineering Journal, 2011, 5, 1-7 1
1874-1207/11 2011 Bentham Open
Open Access
Pharmacokinetic-Pharmacodynamic Modeling of Metformin for the Treatment of Type II Diabetes Mellitus Lin Suna,b,**, Ezra Kwoka,*, Bhushan Gopalunia and Omid Vahidia
aDepartment of Chemical and Biological Engineering, University of British Columbia, 2360 East Mall Vancouver, BC, Canada, V6T 1Z3 bChina University of Petroleum, Beijing, Box 260 Changping District, Beijing, 102249, China
Abstract: Metformin is an antihyperglycemic agent commonly used for the treatment of Type II diabetes mellitus. How-ever, its effects on patients are derived usually from clinical experiments. In this study, a dynamic model of Type II diabe-tes mellitus with the treatment of metformin is proposed. The Type II diabetic model is a modification of an existing com-partmental diabetic model. The dynamic simulation of the metformin effect for a Type II diabetic patient is based on the pharmacokinetic and pharmacodynamic relationship with a human body. The corresponding model parameters are esti-mated by optimization using clinical data from published reports. Then, the effect of metformin in both intravenous and oral administration on a Type II diabetes mellitus model are compared. The combination treatment of insulin infusion plus oral metformin is shown to be superior than the monotherapy with oral metformin only. These results are consistent with the clinical understanding of the use of metformin. For further work, the model can be analyzed for evaluating the treat-ment of diabetes mellitus with different pharmacological agents.
Keywords: Metformin, Modeling, Type II diabetes mellitus, Pharmacokinetic, Pharmacodynamic, Insulin.
1. INTRODUCTION
Diabetes mellitus is a metabolic disorder caused by either insufficient insulin production in islet cells in the pancreas or by tissue resistance against secreted insulin, which leads to excessive glucose concentration in the blood. Since 1961, the mathematical modeling of glucose-insulin interaction in a normal body has been studied [1]. Some physiologic models use anatomical organs and tissue compartments to propose a method for simulating glucose metabolism and its regulation by insulin and glucagons in a healthy body [2, 3]. Their main application was to simulate the physiological dynamics for Type I diabetic patients and analyze the control system for blood glucose level regulation [4, 5]. Vahidi et al. (2010) recently proposed a substantial modification of the compartmental model for Type II diabetic patients who were characterized by multiple abnormalities in the pancreas, body tissues and liver [6]. The proposed model did not include any medication effect except insulin.
Metformin has been used as a glucose-lowering agent in Type II diabetes mellitus since 1957. Nearly 40 years later, it was approved in the United States and rapidly gained worldwide acceptance [7-9]. In recent years, pharmacokinetic - pharmacodynamic (PK-PD) modeling has become a key factor in modern drug discovery and development [10]. The use of PK-PD modeling in translational drug research is a promising approach that provides better understanding of the *Address correspondence to this author at the Department of Chemical and Biological, Engineering, University of British Columbia, 2360 East Mall Vancouver, BC, V6T 1Z3, Canada; Tel: +1 604 8221346; Fax: +1 604 8226003; E-mail: [email protected] **Lin Sun is a post-doctoral fellow from China University of Petroleum, Beijing, PRC
underlying kinetic phenomena involved with the study of absorption, distribution, metabolism and excretion of drugs. There are continuing efforts to develop the PK and PD models in order to optimize therapy. D'Argenio and Schumitzky (1979) published software to estimate parameters for the PK models [11], Stepensky et al. (2001) presented the plasma glucose-lowering effect for oral metformin treatment in diabetic rats [12], and Pentikainen et al. (1979) described the pharmacokinetics of the plasma metformin concentration in healthy volunteers [13]. Lee and Kwon (2004) also developed a PK-PD model to describe the relationship between plasma concentration of metformin and its glucose-lowering effect based on the study of healthy volunteers [14]. In preliminary investigations from the literature, the glucose-lowering effect of metformin is apparently composed of a combination of several distinct activities in various organs and tissues [15, 16], including the liver, gastrointestinal tract, blood and tissues [17].
However, all of these studies focused on the efficacy and safety of metformin based on experimental studies. Because of many limitations in carrying out human experimental studies, a dynamic modeling approach of combining the PK-PD model of metformin with the Type II diabetic patient model is the objective of this research. In this modeling approach, both the mode of intravenous administration and oral administration are considered. Since the combined treatment of insulin infusion and oral hypoglycemic agents (OHA) is often used in moderate-to-severe Type II diabetic patients with secondary failure of OHA [18], the proposed model will be analyzed to compare the monotherapy with metformin only and the combination treatment of insulin infusion plus oral metformin in Type II diabetic patients.
2 The Open Biomedical Engineering Journal, 2011, Volume 5 Sun et al.
This paper will first describe the development of the dynamic model, followed by a comparison of the simulated results and human clinical data obtained from literature.
2. MODELING
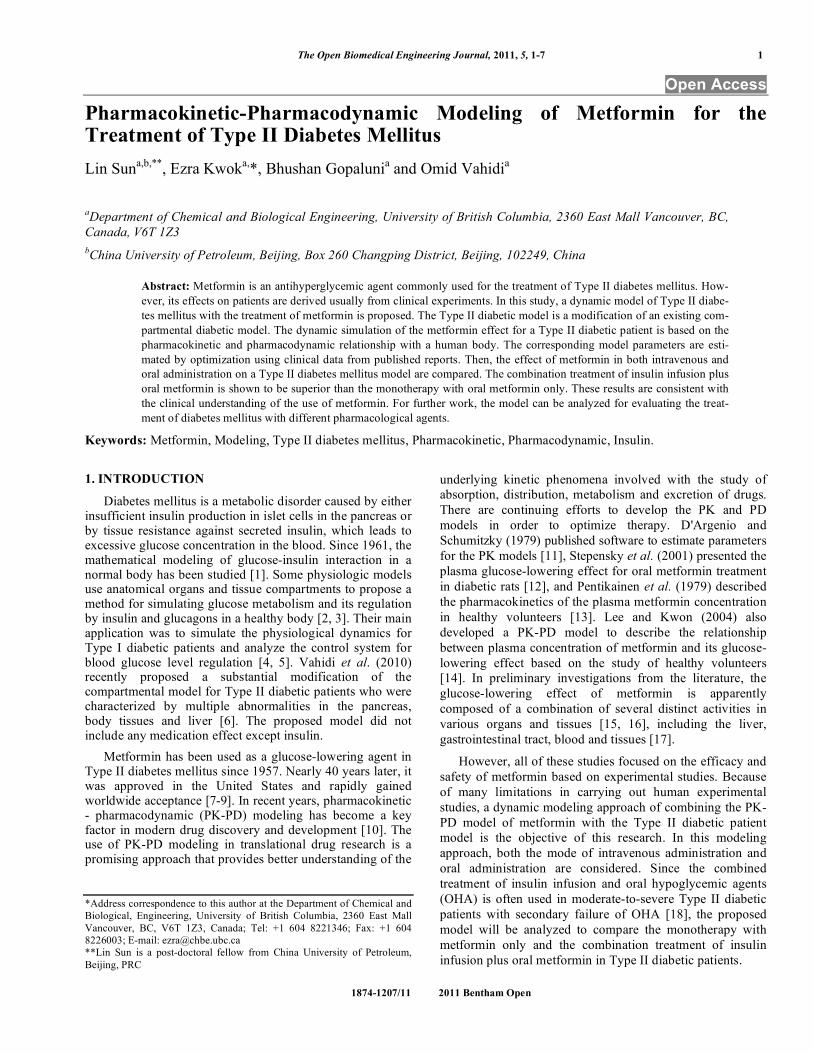
The modeling of metformin in a human body follows the idea of compartmental modeling of diabetic patients [6]. The human body is represented by seven physiologic compart- ments as shown in Fig. (1). Each block represents a different compartment, except the periphery block, which includes muscles and body tissues, and the gut compartment which contains the gastrointestinal (GI) lumen and GI wall. The solid lines indicate the blood flow directions, and the point-dash lines indicate the distribution of metformin. The model of Type II diabetic patients also includes seven similar compartments. Model equations comprise mass balance equations of insulin, glucose, and glucagon for each compartment. The glucose-lowering effect of metformin is composed of a combination of distinct activities in three organs and tissues [19], which are the gut, the liver and the periphery. Therefore a multi-compartmental PK model is used to describe the pharmacokinetics of metformin.
2.1. Type II Diabetic Model and the Treatment of Metformin
The physiological model for Type II diabetic patients used here is based on the compartmental model proposed by Vahidi et al. (2010) [6]. The proposed model contains a number of variables calculated to represent the behavior of a Type II diabetic patient with no metformin effect, including the concentration of insulin, glucose, glucagons, and the metabolic rate of different compartments.
With the treatment of metformin , the metabolic rate of different substances are adjusted according to their specific effects. Based on the clinical literature, the effects of
metformin mainly include: increased rate of intestinal glucose consumption [20]; decreased hepatic glucose output [21]; and increased glucose uptake by muscle cells and adipocytes [22].
For the simulation of Type II diabetic patients administered with metformin, the metabolic rates of the above mentioned effects of metformin are modified. The rest of the Type II diabetic model is based on the one developed by Vahidi et al. (2010), and its parameters remain the same as originally proposed (2010).
As metformin is known to increase glucose consumption by the gut, the rate of gut glucose consumption ( r
GGU
PK!PD ) in the Type II diabetic model is modified as shown in eq. (1),
rGGU
PK!PD= (1+ E
GI)rGGU
(1)
where rGGU
is the rate of the gut glucose consumption with no metformin effect, and E
GI is a weight coefficient that
represents the increment of the rate rGGU
following the administration of metformin. Similarly, metformin is known to lower hepatic glucose production, whose rate ( r
HGP
PK!PD ) is modified as shown in eq. (2),
rHGP
PK!PD= (1! E
L)rHGP
(2)
where rHGP
is the rate of the hepatic glucose production without the effect of metformin for Type II diabetic patients, and E
L is a weight coefficient that indicates the inhibition of
glucose production in the liver (L). Also, the rate of the periphery glucose uptake ( r
PGU
PK!PD ) is modified to the following equation:
rPGU
PK!PD= (1+ E
P)rPGU
(3)
Fig. (1). Schematic diagram of the compartmental model for metformin.
Pharmacokinetic-Pharmacodynamic Modeling The Open Biomedical Engineering Journal, 2011, Volume 5 3
where rPGU
is the rate of the periphery glucose uptake without the treatment of metformin, and E
P is a weight
coefficient that indicates the stimulation of glucose consumption in the periphery (P) with the metformin effect.
The overall glucose-lowering effect of metformin involves the stimulation of glucose consumption in the GI tract and periphery ( E
GI and E
P) and the inhibition of
glucose production in the liver ( EL
). These three coefficients EGI
, EL
, and EP
represent the glucose-lowering effect in the corresponding compartments, and can be calculated through the pharmacokinetic-pharmacodynamic analysis of metformin.
2.2. PK-PD Model
A PK-PD model is used to describe the relationship between the amount of metformin and its glucose-lowering effect for Type II diabetic patients after intravenous and oral administration. Based on previous analysis, the PK-PD model of metformin for the treatment of Type II diabetes mellitus constitutes three compartments including the gut, liver and periphery as shown in Fig. (1).
The accumulation of metformin in the GI wall is not only through the GI lumen, but also via arterial blood supply to the intestine (with the rate constant kpg ). Therefore, in the gut compartment, both the GI lumen and GI wall are accounted into the PK modeling. A multicompartment PK model is used to describe the pharmacokinetics of metformin [11]. The following mass balance equations can be easily derived for different compartments,
dX1/ dt = !X
1(kgo + kgg )+ XO (4)
dX2/ dt = X
1kgg + X4kpg ! X2kgl (5)
dX3/ dt = X
2kgl + X4kpl ! X3klp (6)
dX4/ dt = X
3klp ! X4 (kpl + kpg + kpo )+ XI (7)
where X1, X
2, X
3, and X
4 are the mass of metformin in
the GI lumen, GI wall, liver, and periphery compartments, respectively. X
O is the flow rate of metformin as a result of
a single oral ingestion, and XI
is the flow rate of metformin from intravenous infusion. The rate constants are: kgo , drug elimination via the fecal route; kgg , drug transfer from the GI lumen to the GI wall compartment; kgl , drug transfer from the GI wall to the liver compartment; klp and kpl , drug transfer from the liver to the periphery compartment and vice versa; kpg , drug transfer from the periphery to the GI wall compartment; and kpo , drug elimination via the urination route. As shown in eq. (4)-(7), the equations are written in terms of metformin amounts and not concentrations, thereby avoiding the need for estimating the volumes of the PK compartments. In this case, the metformin plasma concentrations are calculated as the mass of metformin divided by the blood flow (20.9 ± 4.1 ml/min/kg body weight) [23].
In this modeling approach, metformin is distributed to the GI lumen, liver, and periphery compartment following oral and intravenous modes of administration. The compartmental model with first-order absorption is used to describe the kinetics of the intravenous administration. The flow rate of metformin X
I following the intravenous
administration is represented by
XI= Ae
!"t+ Be
!#t+Ce
!$ t (8)
where XI
is the flow rate of metformin at the end of the infusion; and ! , ! and ! are the parameters that indicate the rate constants during the exponential phases; A , B and C are the parameters that represent the contribution of the corresponding exponentials. These parameters are estimated by optimization using experimental data points.
For the oral administration, the pharmacokinetics of metformin from mouth to the GI lumen is described by the following equation:
XO= A
'e!"'t ! B'e!#
't (9)
where ! ' and ! ' are rate constants; A' and B' represent the contribution of the corresponding exponentials. These parameters are also estimated by optimization using experimental data points.
As indicated in eqs. (4)-(9), the transient changes of metformin amounts at different biophases can be obtained. To generate the overall glucose-lowering effect of metformin, a PK-PD model is proposed in eqs. (10)-(12). As mentioned previously, the glucose-lowering effect of metformin mainly includes three compartments, of which the metabolic rate of the gut glucose consumption ( r
GGU
PK!PD ) is only attributed to the GI wall. According to the literature published by Stepensky et al. (2001) [12], the corresponding weight coefficients in three compartments ( E
GI, E
L, and
EP
) are calculated as follows:
EGI=
!GI ,max " (X2 )
nGI
(#GI ,50 )
nGI + (X2 )
nGI
(10)
EL=
!L ,max " (X3 )
nL
(#L ,50 )
nL + (X3 )
nL
(11)
EP=
!P,max " (X4 )
nP
(#P,50 )
nP + (X4 )
nP
(12)
where ! is the parameter representing the maximum effect of metformin in each compartment ( !
GI ,max, !
L ,max, and
!P,max
); !GI ,50
, !L ,50
, and !P,50
are the mass of metformin at the biophase that produces 50% of its maximal effect; and nGI
, nL
, and nP
are the shape factors. The model parameter estimation is an iterative process, and the parameters are fitted with the published data set from the literature published by Stepensky et al. (2002) [19].
The glucose-lowering effect of metformin in each compartment is based on the PK-PD model (eqs. (4)-(12)).
4 The Open Biomedical Engineering Journal, 2011, Volume 5 Sun et al.
The metabolic rates of their corresponding compartment in eqs. (1)-(3) are modified accordingly. The behavior of a Type II diabetic patient with the treatment of metformin is presented through the combination of the PK-PD model and the Type II diabetic model proposed by Vahidi et al. (2010).
3. RESULTS AND DISCUSSION
The dynamic simulation for the combined model is programmed in Matlab and the model parameters are optimized by using clinical data. The mass of metformin and metformin plasma concentrations are calculated for both the intravenous administration and oral administration. The relationship between metformin amounts and the glucose-lowering effect is then obtained through solving the set of equations (eqs. (4)-(12)). Using the glucose-lowering effect ( E
GI, E
L, and E
P), the metabolic rate of the corresponding
compartment for a Type II diabetic patient with the treatment of metformin ( r
GGU
PK!PD , rHGP
PK!PD , and rPGU
PK!PD ) is modified, and the simulation results are compared with the set of clinical data tested from Type II diabetic patients following the combination treatment of insulin infusion plus oral metformin [18].
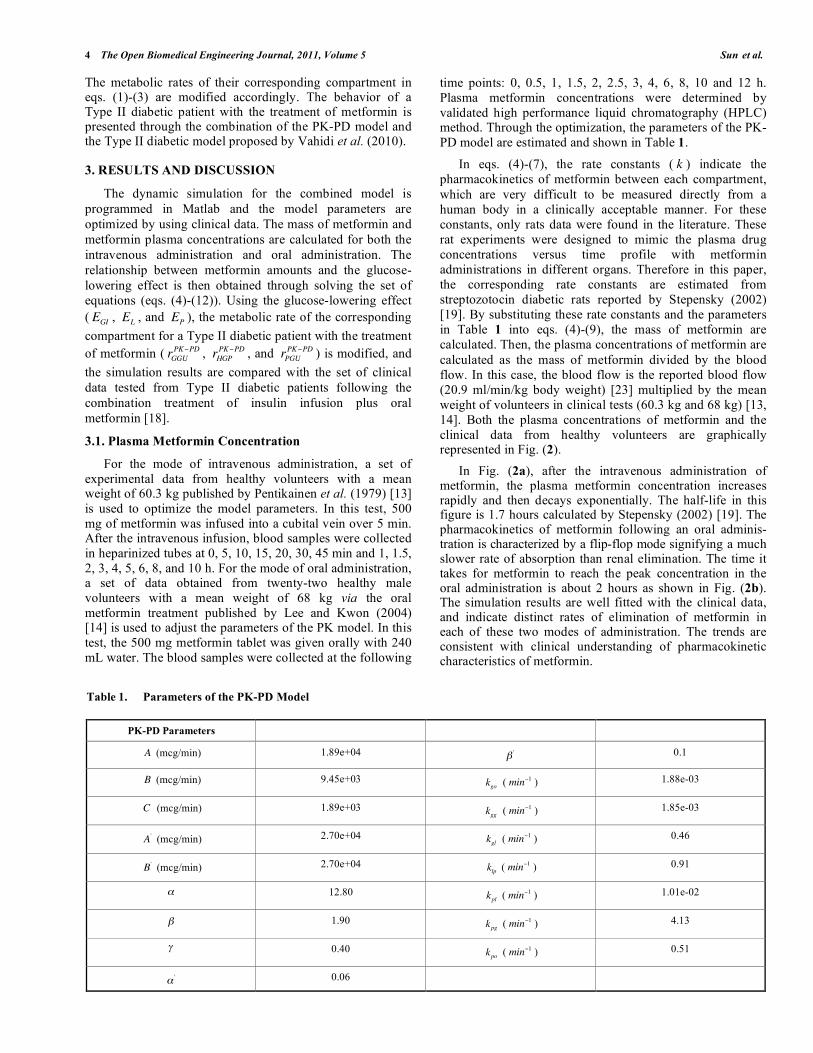
3.1. Plasma Metformin Concentration
For the mode of intravenous administration, a set of experimental data from healthy volunteers with a mean weight of 60.3 kg published by Pentikainen et al. (1979) [13] is used to optimize the model parameters. In this test, 500 mg of metformin was infused into a cubital vein over 5 min. After the intravenous infusion, blood samples were collected in heparinized tubes at 0, 5, 10, 15, 20, 30, 45 min and 1, 1.5, 2, 3, 4, 5, 6, 8, and 10 h. For the mode of oral administration, a set of data obtained from twenty-two healthy male volunteers with a mean weight of 68 kg via the oral metformin treatment published by Lee and Kwon (2004) [14] is used to adjust the parameters of the PK model. In this test, the 500 mg metformin tablet was given orally with 240 mL water. The blood samples were collected at the following
time points: 0, 0.5, 1, 1.5, 2, 2.5, 3, 4, 6, 8, 10 and 12 h. Plasma metformin concentrations were determined by validated high performance liquid chromatography (HPLC) method. Through the optimization, the parameters of the PK-PD model are estimated and shown in Table 1.
In eqs. (4)-(7), the rate constants ( k ) indicate the pharmacokinetics of metformin between each compartment, which are very difficult to be measured directly from a human body in a clinically acceptable manner. For these constants, only rats data were found in the literature. These rat experiments were designed to mimic the plasma drug concentrations versus time profile with metformin administrations in different organs. Therefore in this paper, the corresponding rate constants are estimated from streptozotocin diabetic rats reported by Stepensky (2002) [19]. By substituting these rate constants and the parameters in Table 1 into eqs. (4)-(9), the mass of metformin are calculated. Then, the plasma concentrations of metformin are calculated as the mass of metformin divided by the blood flow. In this case, the blood flow is the reported blood flow (20.9 ml/min/kg body weight) [23] multiplied by the mean weight of volunteers in clinical tests (60.3 kg and 68 kg) [13, 14]. Both the plasma concentrations of metformin and the clinical data from healthy volunteers are graphically represented in Fig. (2).
In Fig. (2a), after the intravenous administration of metformin, the plasma metformin concentration increases rapidly and then decays exponentially. The half-life in this figure is 1.7 hours calculated by Stepensky (2002) [19]. The pharmacokinetics of metformin following an oral adminis- tration is characterized by a flip-flop mode signifying a much slower rate of absorption than renal elimination. The time it takes for metformin to reach the peak concentration in the oral administration is about 2 hours as shown in Fig. (2b). The simulation results are well fitted with the clinical data, and indicate distinct rates of elimination of metformin in each of these two modes of administration. The trends are consistent with clinical understanding of pharmacokinetic characteristics of metformin.
Table 1. Parameters of the PK-PD Model
PK-PD Parameters
A (mcg/min) 1.89e+04 !' 0.1
B (mcg/min) 9.45e+03 kgo ( min!1 ) 1.88e-03
C (mcg/min) 1.89e+03 kgg ( min!1 ) 1.85e-03
A' (mcg/min) 2.70e+04 kgl ( min!1 ) 0.46
B' (mcg/min) 2.70e+04 klp ( min!1 ) 0.91
! 12.80 kpl ( min!1 ) 1.01e-02
! 1.90 kpg ( min!1 ) 4.13
! 0.40 kpo ( min!1 ) 0.51
!' 0.06
Pharmacokinetic-Pharmacodynamic Modeling The Open Biomedical Engineering Journal, 2011, Volume 5 5
3.2. Plasma Glucose and Insulin Concentration
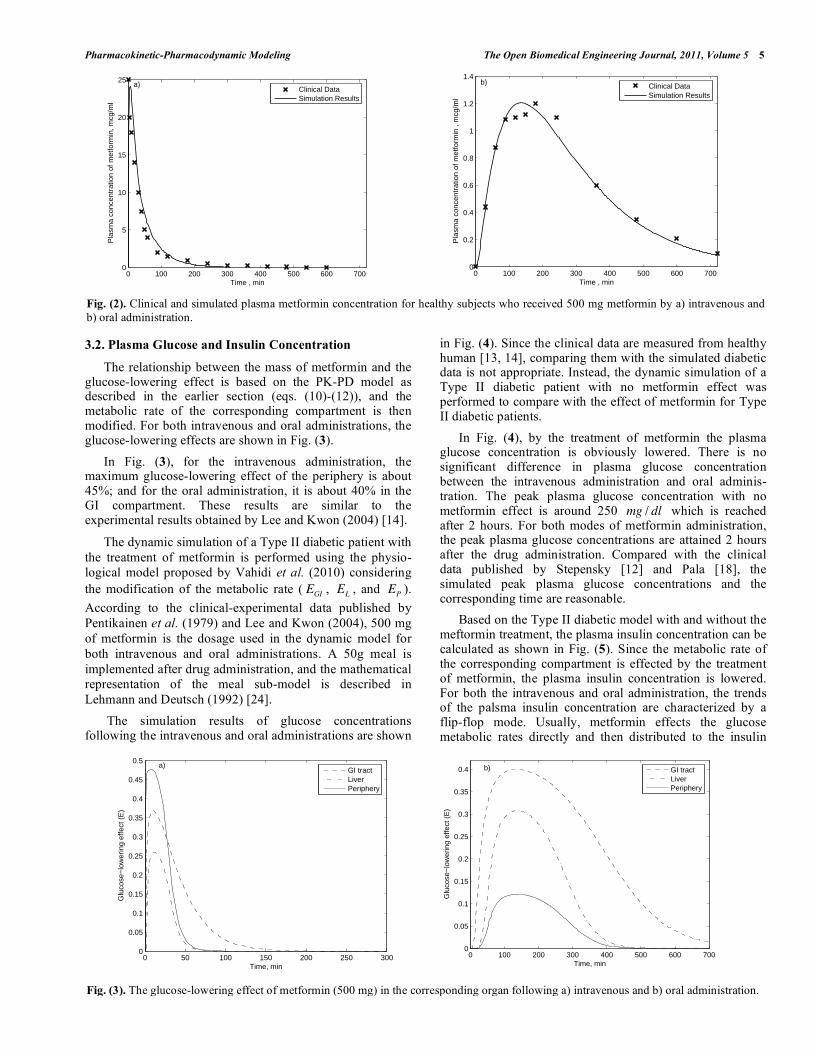
The relationship between the mass of metformin and the glucose-lowering effect is based on the PK-PD model as described in the earlier section (eqs. (10)-(12)), and the metabolic rate of the corresponding compartment is then modified. For both intravenous and oral administrations, the glucose-lowering effects are shown in Fig. (3).
In Fig. (3), for the intravenous administration, the maximum glucose-lowering effect of the periphery is about 45%; and for the oral administration, it is about 40% in the GI compartment. These results are similar to the experimental results obtained by Lee and Kwon (2004) [14].
The dynamic simulation of a Type II diabetic patient with the treatment of metformin is performed using the physio- logical model proposed by Vahidi et al. (2010) considering the modification of the metabolic rate ( E
GI, E
L, and E
P).
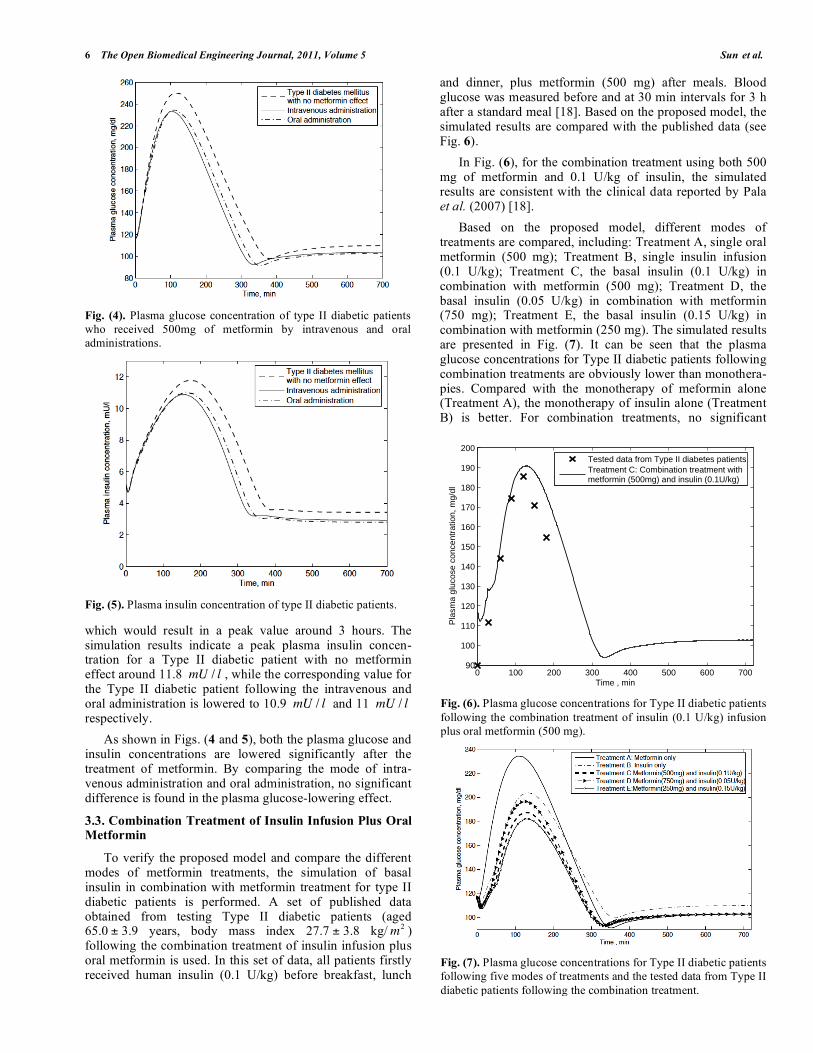
According to the clinical-experimental data published by Pentikainen et al. (1979) and Lee and Kwon (2004), 500 mg of metformin is the dosage used in the dynamic model for both intravenous and oral administrations. A 50g meal is implemented after drug administration, and the mathematical representation of the meal sub-model is described in Lehmann and Deutsch (1992) [24].
The simulation results of glucose concentrations following the intravenous and oral administrations are shown
in Fig. (4). Since the clinical data are measured from healthy human [13, 14], comparing them with the simulated diabetic data is not appropriate. Instead, the dynamic simulation of a Type II diabetic patient with no metformin effect was performed to compare with the effect of metformin for Type II diabetic patients.
In Fig. (4), by the treatment of metformin the plasma glucose concentration is obviously lowered. There is no significant difference in plasma glucose concentration between the intravenous administration and oral adminis- tration. The peak plasma glucose concentration with no metformin effect is around 250 mg / dl which is reached after 2 hours. For both modes of metformin administration, the peak plasma glucose concentrations are attained 2 hours after the drug administration. Compared with the clinical data published by Stepensky [12] and Pala [18], the simulated peak plasma glucose concentrations and the corresponding time are reasonable.
Based on the Type II diabetic model with and without the meftormin treatment, the plasma insulin concentration can be calculated as shown in Fig. (5). Since the metabolic rate of the corresponding compartment is effected by the treatment of metformin, the plasma insulin concentration is lowered. For both the intravenous and oral administration, the trends of the palsma insulin concentration are characterized by a flip-flop mode. Usually, metformin effects the glucose metabolic rates directly and then distributed to the insulin
Fig. (2). Clinical and simulated plasma metformin concentration for healthy subjects who received 500 mg metformin by a) intravenous and b) oral administration.
Fig. (3). The glucose-lowering effect of metformin (500 mg) in the corresponding organ following a) intravenous and b) oral administration.
0 100 200 300 400 500 600 7000
5
10
15
20
25
Time , min
Pla
sma
conc
entr
atio
n of
met
form
in, m
cg/m
l
Clinical DataSimulation Results
a)
0 100 200 300 400 500 600 7000
0.2
0.4
0.6
0.8
1
1.2
1.4
Time , min
Pla
sma
conc
entr
atio
n of
met
form
in ,
mcg
/ml
Clinical DataSimulation Results
b)
0 50 100 150 200 250 3000
0.05
0.1
0.15
0.2
0.25
0.3
0.35
0.4
0.45
0.5
Time, min
Glu
cose
−lo
wer
ing
effe
ct (
E)
GI tractLiverPeriphery
a)
0 100 200 300 400 500 600 7000
0.05
0.1
0.15
0.2
0.25
0.3
0.35
0.4
Time, min
Glu
cose
−lo
wer
ing
effe
ct (
E)
GI tractLiverPeriphery
b)
6 The Open Biomedical Engineering Journal, 2011, Volume 5 Sun et al.
which would result in a peak value around 3 hours. The simulation results indicate a peak plasma insulin concen- tration for a Type II diabetic patient with no metformin effect around 11.8 mU / l , while the corresponding value for the Type II diabetic patient following the intravenous and oral administration is lowered to 10.9 mU / l and 11 mU / l respectively.
As shown in Figs. (4 and 5), both the plasma glucose and insulin concentrations are lowered significantly after the treatment of metformin. By comparing the mode of intra- venous administration and oral administration, no significant difference is found in the plasma glucose-lowering effect.
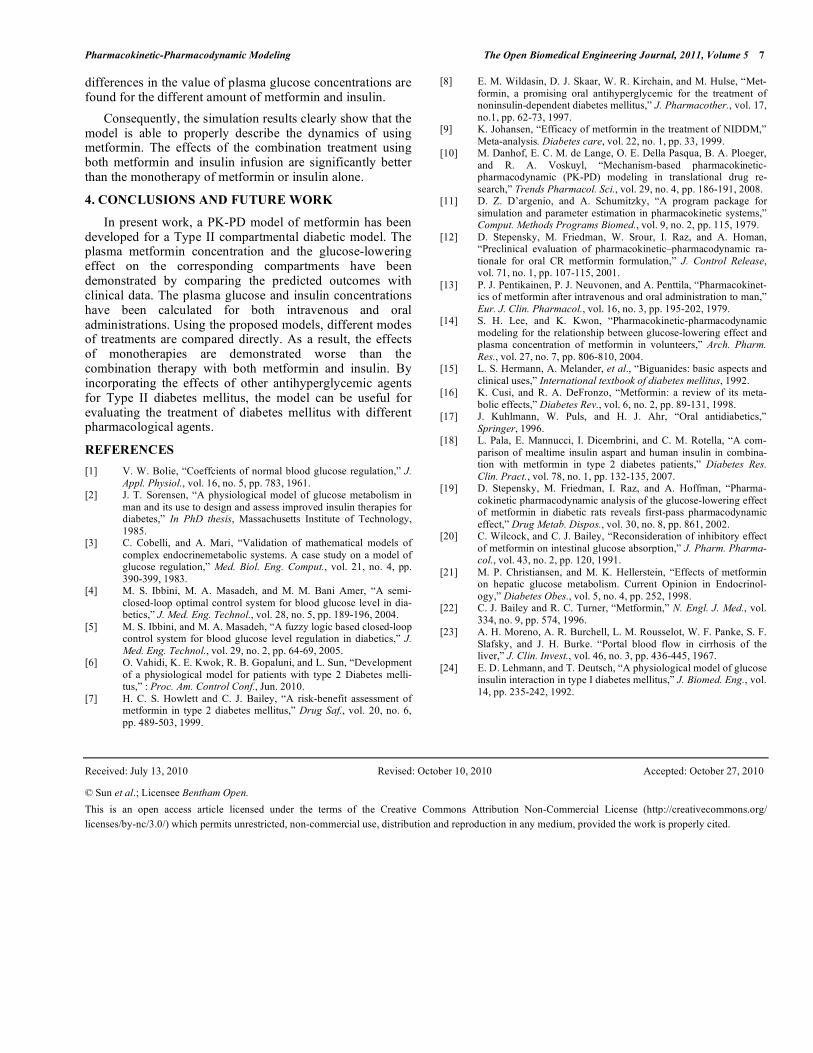
3.3. Combination Treatment of Insulin Infusion Plus Oral Metformin
To verify the proposed model and compare the different modes of metformin treatments, the simulation of basal insulin in combination with metformin treatment for type II diabetic patients is performed. A set of published data obtained from testing Type II diabetic patients (aged 65.0 ± 3.9 years, body mass index 27.7 ± 3.8 kg/m2 ) following the combination treatment of insulin infusion plus oral metformin is used. In this set of data, all patients firstly received human insulin (0.1 U/kg) before breakfast, lunch
and dinner, plus metformin (500 mg) after meals. Blood glucose was measured before and at 30 min intervals for 3 h after a standard meal [18]. Based on the proposed model, the simulated results are compared with the published data (see Fig. 6).
In Fig. (6), for the combination treatment using both 500 mg of metformin and 0.1 U/kg of insulin, the simulated results are consistent with the clinical data reported by Pala et al. (2007) [18].
Based on the proposed model, different modes of treatments are compared, including: Treatment A, single oral metformin (500 mg); Treatment B, single insulin infusion (0.1 U/kg); Treatment C, the basal insulin (0.1 U/kg) in combination with metformin (500 mg); Treatment D, the basal insulin (0.05 U/kg) in combination with metformin (750 mg); Treatment E, the basal insulin (0.15 U/kg) in combination with metformin (250 mg). The simulated results are presented in Fig. (7). It can be seen that the plasma glucose concentrations for Type II diabetic patients following combination treatments are obviously lower than monothera- pies. Compared with the monotherapy of meformin alone (Treatment A), the monotherapy of insulin alone (Treatment B) is better. For combination treatments, no significant
Fig. (4). Plasma glucose concentration of type II diabetic patients who received 500mg of metformin by intravenous and oral administrations.
Fig. (5). Plasma insulin concentration of type II diabetic patients.
Fig. (6). Plasma glucose concentrations for Type II diabetic patients following the combination treatment of insulin (0.1 U/kg) infusion plus oral metformin (500 mg).
Fig. (7). Plasma glucose concentrations for Type II diabetic patients following five modes of treatments and the tested data from Type II diabetic patients following the combination treatment.
0 100 200 300 400 500 600 70090
100
110
120
130
140
150
160
170
180
190
200
Time , min
Pla
sma
gluc
ose
conc
entr
atio
n, m
g/dl
Tested data from Type II diabetes patientsTreatment C: Combination treatment withmetformin (500mg) and insulin (0.1U/kg)
Pharmacokinetic-Pharmacodynamic Modeling The Open Biomedical Engineering Journal, 2011, Volume 5 7
differences in the value of plasma glucose concentrations are found for the different amount of metformin and insulin.
Consequently, the simulation results clearly show that the model is able to properly describe the dynamics of using metformin. The effects of the combination treatment using both metformin and insulin infusion are significantly better than the monotherapy of metformin or insulin alone.
4. CONCLUSIONS AND FUTURE WORK
In present work, a PK-PD model of metformin has been developed for a Type II compartmental diabetic model. The plasma metformin concentration and the glucose-lowering effect on the corresponding compartments have been demonstrated by comparing the predicted outcomes with clinical data. The plasma glucose and insulin concentrations have been calculated for both intravenous and oral administrations. Using the proposed models, different modes of treatments are compared directly. As a result, the effects of monotherapies are demonstrated worse than the combination therapy with both metformin and insulin. By incorporating the effects of other antihyperglycemic agents for Type II diabetes mellitus, the model can be useful for evaluating the treatment of diabetes mellitus with different pharmacological agents.
REFERENCES [1] V. W. Bolie, “Coeffcients of normal blood glucose regulation,” J.
Appl. Physiol., vol. 16, no. 5, pp. 783, 1961. [2] J. T. Sorensen, “A physiological model of glucose metabolism in
man and its use to design and assess improved insulin therapies for diabetes,” In PhD thesis, Massachusetts Institute of Technology, 1985.
[3] C. Cobelli, and A. Mari, “Validation of mathematical models of complex endocrinemetabolic systems. A case study on a model of glucose regulation,” Med. Biol. Eng. Comput., vol. 21, no. 4, pp. 390-399, 1983.
[4] M. S. Ibbini, M. A. Masadeh, and M. M. Bani Amer, “A semi-closed-loop optimal control system for blood glucose level in dia-betics,” J. Med. Eng. Technol., vol. 28, no. 5, pp. 189-196, 2004.
[5] M. S. Ibbini, and M. A. Masadeh, “A fuzzy logic based closed-loop control system for blood glucose level regulation in diabetics,” J. Med. Eng. Technol., vol. 29, no. 2, pp. 64-69, 2005.
[6] O. Vahidi, K. E. Kwok, R. B. Gopaluni, and L. Sun, “Development of a physiological model for patients with type 2 Diabetes melli-tus,” : Proc. Am. Control Conf., Jun. 2010.
[7] H. C. S. Howlett and C. J. Bailey, “A risk-benefit assessment of metformin in type 2 diabetes mellitus,” Drug Saf., vol. 20, no. 6, pp. 489-503, 1999.
[8] E. M. Wildasin, D. J. Skaar, W. R. Kirchain, and M. Hulse, “Met-formin, a promising oral antihyperglycemic for the treatment of noninsulin-dependent diabetes mellitus,” J. Pharmacother., vol. 17, no.1, pp. 62-73, 1997.
[9] K. Johansen, “Efficacy of metformin in the treatment of NIDDM,” Meta-analysis. Diabetes care, vol. 22, no. 1, pp. 33, 1999.
[10] M. Danhof, E. C. M. de Lange, O. E. Della Pasqua, B. A. Ploeger, and R. A. Voskuyl, “Mechanism-based pharmacokinetic-pharmacodynamic (PK-PD) modeling in translational drug re-search,” Trends Pharmacol. Sci., vol. 29, no. 4, pp. 186-191, 2008.
[11] D. Z. D’argenio, and A. Schumitzky, “A program package for simulation and parameter estimation in pharmacokinetic systems,” Comput. Methods Programs Biomed., vol. 9, no. 2, pp. 115, 1979.
[12] D. Stepensky, M. Friedman, W. Srour, I. Raz, and A. Homan, “Preclinical evaluation of pharmacokinetic–pharmacodynamic ra-tionale for oral CR metformin formulation,” J. Control Release, vol. 71, no. 1, pp. 107-115, 2001.
[13] P. J. Pentikainen, P. J. Neuvonen, and A. Penttila, “Pharmacokinet-ics of metformin after intravenous and oral administration to man,” Eur. J. Clin. Pharmacol., vol. 16, no. 3, pp. 195-202, 1979.
[14] S. H. Lee, and K. Kwon, “Pharmacokinetic-pharmacodynamic modeling for the relationship between glucose-lowering effect and plasma concentration of metformin in volunteers,” Arch. Pharm. Res., vol. 27, no. 7, pp. 806-810, 2004.
[15] L. S. Hermann, A. Melander, et al., “Biguanides: basic aspects and clinical uses,” International textbook of diabetes mellitus, 1992.
[16] K. Cusi, and R. A. DeFronzo, “Metformin: a review of its meta-bolic effects,” Diabetes Rev., vol. 6, no. 2, pp. 89-131, 1998.
[17] J. Kuhlmann, W. Puls, and H. J. Ahr, “Oral antidiabetics,” Springer, 1996.
[18] L. Pala, E. Mannucci, I. Dicembrini, and C. M. Rotella, “A com-parison of mealtime insulin aspart and human insulin in combina-tion with metformin in type 2 diabetes patients,” Diabetes Res. Clin. Pract., vol. 78, no. 1, pp. 132-135, 2007.
[19] D. Stepensky, M. Friedman, I. Raz, and A. Hoffman, “Pharma-cokinetic pharmacodynamic analysis of the glucose-lowering effect of metformin in diabetic rats reveals first-pass pharmacodynamic effect,” Drug Metab. Dispos., vol. 30, no. 8, pp. 861, 2002.
[20] C. Wilcock, and C. J. Bailey, “Reconsideration of inhibitory effect of metformin on intestinal glucose absorption,” J. Pharm. Pharma-col., vol. 43, no. 2, pp. 120, 1991.
[21] M. P. Christiansen, and M. K. Hellerstein, “Effects of metformin on hepatic glucose metabolism. Current Opinion in Endocrinol-ogy,” Diabetes Obes., vol. 5, no. 4, pp. 252, 1998.
[22] C. J. Bailey and R. C. Turner, “Metformin,” N. Engl. J. Med., vol. 334, no. 9, pp. 574, 1996.
[23] A. H. Moreno, A. R. Burchell, L. M. Rousselot, W. F. Panke, S. F. Slafsky, and J. H. Burke. “Portal blood flow in cirrhosis of the liver,” J. Clin. Invest., vol. 46, no. 3, pp. 436-445, 1967.
[24] E. D. Lehmann, and T. Deutsch, “A physiological model of glucose insulin interaction in type I diabetes mellitus,” J. Biomed. Eng., vol. 14, pp. 235-242, 1992.
Received: July 13, 2010 Revised: October 10, 2010 Accepted: October 27, 2010
© Sun et al.; Licensee Bentham Open.
This is an open access article licensed under the terms of the Creative Commons Attribution Non-Commercial License (http://creativecommons.org/ licenses/by-nc/3.0/) which permits unrestricted, non-commercial use, distribution and reproduction in any medium, provided the work is properly cited.