Embed Size (px)
Citation preview
| 67
Geoplanning Vol 3, No 1, 2016, 67-76 Journal of Geomatics and Planning
E-ISSN: 2355-6544 http://ejournal.undip.ac.id/index.php/geoplanning
doi: 10.14710/geoplanning.3.1.67-76
RELATIONSHIP BETWEEN URBANIZATION AND DENGUE HAEMORRHAGIC FEVER INCIDENCE IN SEMARANG CITY
I. P. Pratamaa, S. Rahayua a
Diponegoro University, Indonesia
Abstract: Unplanned urbanization can cause unhealthy urban environment, which in
turn increases the population of mosquitoes carrying the dengue vector. Consequently, this would reduce the urban life quality because public health is an important aspect of it. The increasing incidence of Dengue Haemorrhagic Fever (DHF) in Semarang City has been alarming. In 2013, the incidence was 2,364 cases, which increased up to 89.11% from the 1,250 cases of 2012. So, it is necessary to study about what relationship is there between the level of urbanization and the incidence of DHF in Semarang. This study used quantitative and spatial approach. The unit of analysis is sub-district with time series data from 2006 to 2013. The analysis technique is spatial analysis through image interpretation, regression, and descriptive analysis. The level of urbanization has been measured through the variables of population growth, population density, land use change, and building density. The results have shown that there is no significant correlation between the level of urbanization and the incidence of dengue fever. The urbanization is acknowledged as influencing only about 28% of the DHF incidence in the city, while the other 72% has been influenced by other factors.
Copyright © 2016 GJGP-UNDIP This open access article is distributed under a
Creative Commons Attribution (CC-BY-NC-SA) 4.0 International license.
How to cite (APA 6th Style): Pratama, I. P. and Rahayu, S. R. (2016). Relationship between urbanization and dengue haemorrhagic fever incidence in Semarang City. Geoplanning: Journal of Geomatics and Planning, 3(1), 67-76. doi:10.14710/geoplanning.3.1.67-76.
1. INTRODUCTION
The phenomenon of urbanization has been common in big cities in Indonesia. It is undeniable that the growth of the urban physical space is strongly influenced by urbanization (Arta & Pigawati, 2015). The development of cities is accompanied by changes in positive and negative aspects. Positive changes can be seen, for example, in rapid economic growth. The phenomenon creates urban dynamics, changes in land use, as well as the emergence of legal and illegal settlements and other issues. In addition, urban areas are growing and developing to lead to the development of social heterogeneity as shown in the different characteristics of the population.
The high rate of urbanization occurred in metropolitan regions, such as Jakarta (including Bekasi, Bogor, and Tangerang), Semarang, Surabaya, Bandung, Medan, Palembang, and Makassar has made them to be the main magnets. Statistical records show that since 1970, the proportion of Indonesia's urban population increased from 17.4% in 1970 to 22.3% in 1980, 30.9% in 1990, 43.99% in 2002 and, finally, 52.03% in 2010. It means that within 40 years, urbanization has tripled the urban population.
Unplanned urbanization can result in a quality urban environment that is not healthy, so it has the potential to enhance the development of mosquitoes carrying the dengue vector (Rigau-Pérez et al., 1998; Wu et al., 2009). This statement is collaborated by the results of several study (Conroy et al., 2015; Devaleenal et al., 2015; Murugananthan et al., 2014; Phung et al., 2015; Vasquez-Velasquez et al., 2015), which stated that the adverse effects of the phenomenon of urbanization form the ideal environment for the aedes aegypti mosquito as a carrier vector for breeding in the urban settlement area .
Article Info: Received: 15 January 2016 In revised form: 30 March 2016 Accepted: 17 April Available Online: 30 April 2016
Keywords: Urbanization, Dengue Haemorrhagic Fever (DHF), Semarang City, GIS
Corresponding Author: Isnu Putra Pratama Diponegoro University, Semarang, Indonesia Email: [email protected]
OPEN ACCESS
Pratama and Rahayu / Geoplanning: Journal of Geomatics and Planning, Vol 3, No 1, 2016, 67-76 doi: 10.14710/geoplanning.3.1.67-76
68 |
In Indonesia, dengue fever has become a public health problem during the past four decades. There has been an increase in the spread of the endemic disease to a number of provinces and districts or cities, from only two cities in two provinces in 1968 to 382 districts or cities (77%) in 32 provinces (97%) in 2009. In addition, there has also been an increase in the number of dengue cases, from only 58 cases in 1968 to 158,912 cases in 2009. The increase and spread of dengue fever are likely caused by the high mobility of the population, urban growth, climate change, changes in population density and distribution as well as other epidemiological factors that still require further research (Health Department of Indonesia, 2013).
As one of the major cities in Java, Semarang City also experienced population growth caused by the phenomenon of urbanization. Historical facts indicate that the process of urbanization has been going on since the arrival of the Dutch. The growth has been more rapid after the construction of the air and sea ports, as well as the establishment of various industrial facilities and services. The increase of population in the city of Semarang is caused by many factors, one of them is urbanization. It is characterized by land use change from agriculture to settlement and commercial zones.
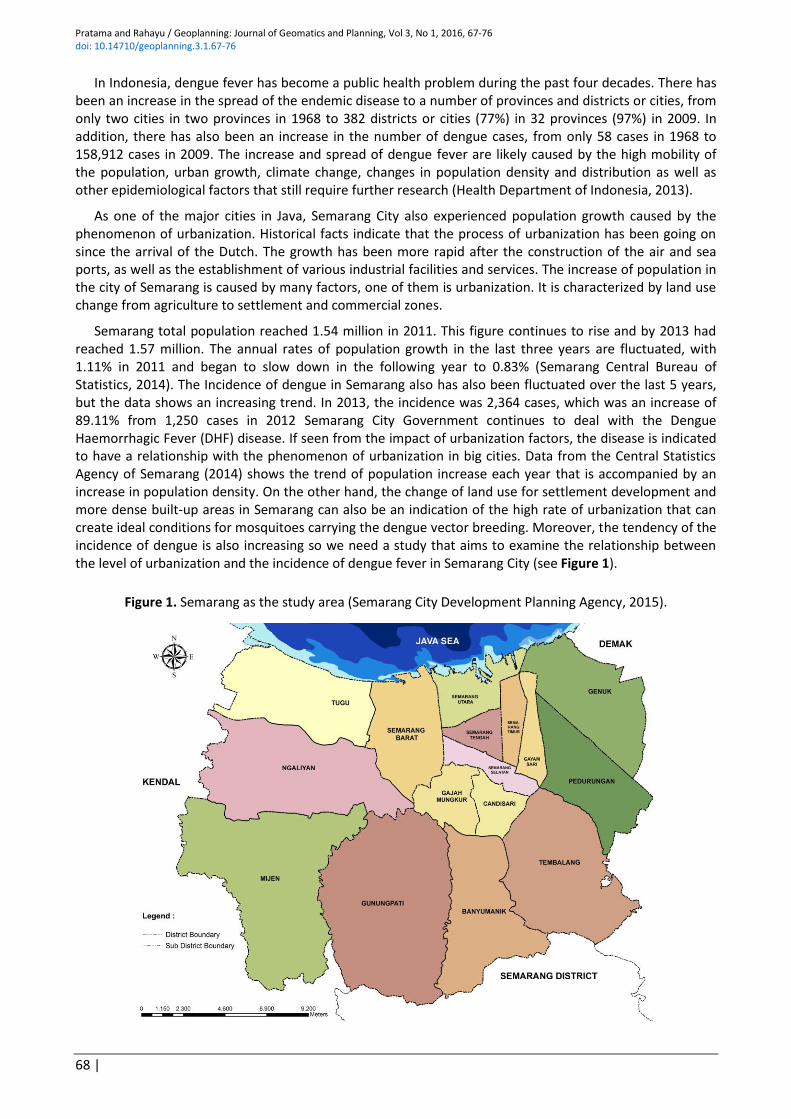
Semarang total population reached 1.54 million in 2011. This figure continues to rise and by 2013 had reached 1.57 million. The annual rates of population growth in the last three years are fluctuated, with 1.11% in 2011 and began to slow down in the following year to 0.83% (Semarang Central Bureau of Statistics, 2014). The Incidence of dengue in Semarang also has also been fluctuated over the last 5 years, but the data shows an increasing trend. In 2013, the incidence was 2,364 cases, which was an increase of 89.11% from 1,250 cases in 2012 Semarang City Government continues to deal with the Dengue Haemorrhagic Fever (DHF) disease. If seen from the impact of urbanization factors, the disease is indicated to have a relationship with the phenomenon of urbanization in big cities. Data from the Central Statistics Agency of Semarang (2014) shows the trend of population increase each year that is accompanied by an increase in population density. On the other hand, the change of land use for settlement development and more dense built-up areas in Semarang can also be an indication of the high rate of urbanization that can create ideal conditions for mosquitoes carrying the dengue vector breeding. Moreover, the tendency of the incidence of dengue is also increasing so we need a study that aims to examine the relationship between the level of urbanization and the incidence of dengue fever in Semarang City (see Figure 1).
Figure 1. Semarang as the study area (Semarang City Development Planning Agency, 2015).
Pratama and Rahayu / Geoplanning: Journal of Geomatics and Planning, Vol 3, No 1, 2016, 67-76
doi: 10.14710/geoplanning.3.1.67-76
| 69
2. DATA AND METHODS
Based on the research aim, this study used quantitative and spatial approach. This study investigated the relationship between the level of urbanization and the incidence of dengue in Semarang City using districts (kecamatan) as the analysis units. The data used was time series over a period of 8 years from 2006 to 2013. The data collection was done by observation, survey to the relevant agencies to obtain secondary data, literature review, and light interviews to get recommendations and advice from the related stakeholders. Analysis was carried out in various stages analyzing the variables, such as variables of the level of urbanization, DHF variables, and analysis of the correlation between urbanization and the DHF.
2.1 Building Density
The variable of building density can be known through the help of Quickbird imagery in 2006, 2010 IKONOS imagery and imagery of Google Earth in a period of rest for 8 years (2006-2013). In analyzing the image, it used satellite image interpretation technique and GIS in order to test the validity of the accuracy of data interpretation results can be used as the basis of analysis and evaluation (Halder et. al, 2011). Results of interpretation which tested its accuracy be used to locate data building density and rate of change of land use. Calculation of the building density is approached through a number of building basic coefficient (KDB) per Building Coverage. Assessment of the building density coefficient is based on a comparison between the area of the ground floor of the building with an area of land use of an area or region.
2.2 Identification of Landuse Change
The calculation of land use change was by using the help of the spatial conversion rate of satellite imagery. The type of land use change analyzed in this study is the change from non-settlement to settlement area, indicated by changes in the area of non-built-up into the built-up area. Analysis using this method were done through the following equation;
Where : V = The rate of change of land use Lt= The land area is currently / year-t (ha) Lt-1= Land area the previous year (ha)
2.3 Population Growth
The population growth was calculated using the geometric equation as follows:
Where, for example using the period of 2006-2013: r = The average rate of population growth Pt = The total population in 2013 P0 = Population in 2006 n = Interval years 2006 - 2013 (n=7)
r = ( (Pt/P0)1/n -1 ) x 100%
Pratama and Rahayu / Geoplanning: Journal of Geomatics and Planning, Vol 3, No 1, 2016, 67-76 doi: 10.14710/geoplanning.3.1.67-76
70 |
2.4 Population Density
Calculation of the population density used the following equation:
Population Density = Population of Region A: Area of Region A (Km²)
2.5 Analysis of incidence of Dengue Haemorrhagic Fever (DHF)
The data of the incidence of dengue fever was obtained from department of Health, Semarang City . The time series data of 2006-2013 was then analyzed to understand the trend or tendency.
2.6 Analysis of the Relationship Between Urbanization Rate and Incidence of Dengue
The analysis methods used in the next stage after identifying each variable were descriptive and regression analyses. The Descriptive analysis aims to provide an overview of data distribution in the form of each variable. Meanwhile, the regression analysis was used to examine the relationship between the dependent variable (incidence of DHF) with independent variables (population, a number of population density, building density, and changes in land use). In general, the multiple regression equation can be written as follows:
Where: Y = Dependent Variable (DHF) A = Constant b = Independent Variable X1 = Building Density X2 = Landuse Change X3 = Population Growth X4 = Population Density
3. RESULTS AND DISCUSSION
3.1 Analysis of the Incidence of Dengue Haemorrhagic Fever (DHF)
Tembalang District is the highest in the incidence of DHF with 37 cases on average annually while Mijen District is the lowest with only four cases. There are eight districts that have an average rate of incidence of 20 cases or more, where most of them are densely populated.
The highest incidence rates occurred in 2010 in the District of Tembalang with an average of up to 77 cases of dengue fever incidence, especially in Sendangguwo sub-district that reached 342 cases in the same year while the lowest occurred only 1 case in the Tugu District in 2012. The pattern of incidence of dengue in the city of Semarang shows numbers fluctuating up and down over a period of 8 years. From 2006 to 2008 there was an increase of up to an average of 32 cases in the city, then fell in 2009 and again reached its peak in 2010 with the same number of cases, ie 32 events. In the following years the incidence of dengue fever down with 8 cases, but rebound in 2013 to an average of 13 cases of dengue incidence (see Figure 2).
The high incidence of dengue in Tembalang District is caused by various factors, one of which is as expected, i.e. the high population and building density of the settlement areas. In addition, it is because of the unstable climate and high rainfall.
Y = a + b1X1 +b2X2 + b3X3 +b4 X4

Pratama and Rahayu / Geoplanning: Journal of Geomatics and Planning, Vol 3, No 1, 2016, 67-76
doi: 10.14710/geoplanning.3.1.67-76
| 71
Figure 2. Distribution of DHF incidence in Semarang
(Semarang City Health Office and Analysis, 2015).
3.2 Analysis of the Urbanization
a) Building Density
The growth of built-up area occurs almost in every district in Semarang City shown by the land conversion. This will greatly affect the density of the building as one variable of the level of urbanization. The building density map can be seen in Figure 3.
The District of Central Semarang has the highest density, while the District of Mijen is the lowest, around 3%. District of Central Semarang building density unchanged from 2006 while the highest change occurred in the District of West Semarang with value accretion was 6%. the District of West Semarang consists of settlement areas, settlement, and commercial. In general, changes in the built-up land in this region occur in an open space into settlement development. On the other hand, District of Mijen as the region with the lowest density is one of the plateau regions on the edge of Semarang dominated by agricultural land, forests, and plantations.

Pratama and Rahayu / Geoplanning: Journal of Geomatics and Planning, Vol 3, No 1, 2016, 67-76 doi: 10.14710/geoplanning.3.1.67-76
72 |
Figure 3. Building density in Semarang City, 2006 and 2013 (Analysis, 2015).
b) The Rate of Land Use Change
The areas with high rate of conversion to settlement use are generally located on the outskirts of the city of Semarang. These areas were dominated by agricultural land and open space, which were then converted to settlements. Areas that are not indicated for the conversion of settlement land are generally located in the center of a densely populated and buildings, as well as settlement areas. It already can not expand the surrounding areas because there is areas barrier like the area of trade and services, government agencies, industry, and others. Figure 4 shows the growth of settlement use in Semarang between 2006 and 2013.
Figure 4. Settlement growth at Semarang in 2006 and 2013 (Analysis, 2015).
Pratama and Rahayu / Geoplanning: Journal of Geomatics and Planning, Vol 3, No 1, 2016, 67-76
doi: 10.14710/geoplanning.3.1.67-76
| 73
There are seven districts which on average did not change land use, in addition to the District of Mijen be the region with the highest rate of change of land use by 3% during 8 years. In general, differences in the rate of change of land use in the city of Semarang was affected by the conditions of land use and housing needs in each of the districts.
The increasing need for settlement land in the city of Semarang tends to increase the rate of land conversion, especially in regions such as Ngaliyan, Gunungpati, and Mijen. Land use change into settlements in the district Mijen is the fastest because there are still a lot of potential land for settlement areas or housing. Bukit Semarang Baru (BSB) City became one of the major projects to the concept of settlement has changed the scale of the city as a suburb Mijen District of Semarang to become an alternative place to settle in the future.
c) Population Growth
Regions with the highest average population growth in Semarang contained in 7 districts with a value of 3%. On the other hand, there are 2 sub-district which is worth an average of -1% which Semarang District of Central and East Semarang. Population growth in the city of Semarang is always changing every year, it is influenced by the dynamics of birth, death and migration in each of the districts.
Conditions housing environment has a great influence as a container to accommodate the growing population. Areas of districts with high growth were 3%, generally do settlement development or new settlements during the last 8 years, as the District Gunungpati, Mijen, and Tembalang. Demographic dynamics such as fertility, mortality, and migration can also be the cause of the rapid rate of population growth, some areas with good housing conditions have the potential to be an option migrants to reside.
d) Population Density
North Semarang District is a region with highest average population density at 17, 242 inhabitants per km², and the lowest is Tugu District with 1,032 people per km². High population density in the city of Semarang is generally found in settlement areas around the city center such as East Semarang, Candisari, and Gayamsari Districts.
The population density in each district shows the same distribution pattern in the period of 8 years, which is dominated by the North Semarang District while the Mijen and Gunungpati District including the lowest population density over a period of 8 years. The population density figure is the quotient between the number of population and area so that the District Mijen and Gunungpati who have a large area but few areas tend to be the dense settlement.
3.3 Regression Analysis of the Relationship Between Urbanization and Dengue Haemorrhagic Fever
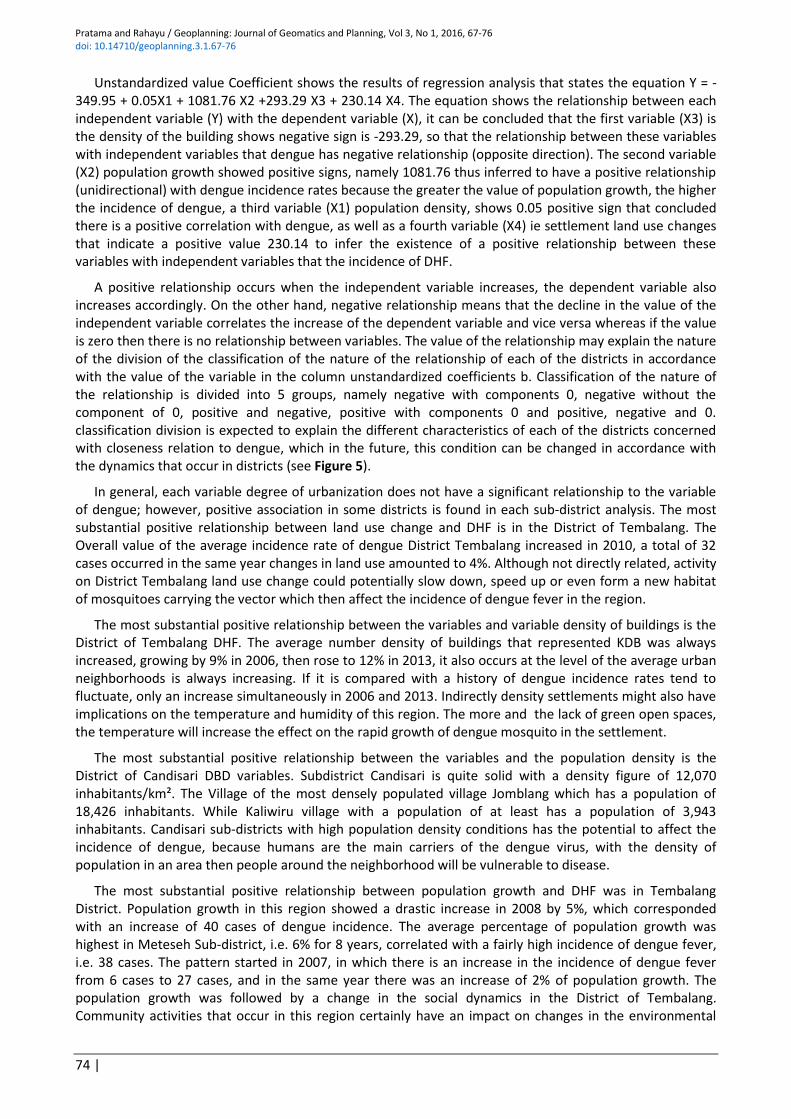
The analysis that resulted in the Sig. of 0.863 showed no significant relationship between the independent variable (X), which indicates urbanization, with the dependent variable (Y) that is the incidence of dengue because the value of Sig. Is greater than 0.05. A large value of R is 0.534, according to the assessment criteria correlation concluded that the independent variables (X1, X2, X3, and X4) have a moderate correlation with the dependent variable (Y). While the coefficient of determination R ² of 0.28 or 28%, in other words, the influence of independent variables (X1, X2, X3, and X4) jointly to Y is at 28% while the remaining 72% is determined by other factors, outside variables X1, X2, X3, and X4 (see Table 1).
Table 1. Relationship between urbanization levels and DHF (Analysis, 2015).
MODEL UNSTANDARDIZED COEFFICIENTS B SIG.
(CONSTANT) -349.95 .716 POPULATION_DENSITY 0.05 .735 POPULATION_GROWTH 1,081.76 .385 BUILDING_DENSITY -293.29 .843 LANDUSE_CHANGE 230.14 .813
Pratama and Rahayu / Geoplanning: Journal of Geomatics and Planning, Vol 3, No 1, 2016, 67-76 doi: 10.14710/geoplanning.3.1.67-76
74 |
Unstandardized value Coefficient shows the results of regression analysis that states the equation Y = -349.95 + 0.05X1 + 1081.76 X2 +293.29 X3 + 230.14 X4. The equation shows the relationship between each independent variable (Y) with the dependent variable (X), it can be concluded that the first variable (X3) is the density of the building shows negative sign is -293.29, so that the relationship between these variables with independent variables that dengue has negative relationship (opposite direction). The second variable (X2) population growth showed positive signs, namely 1081.76 thus inferred to have a positive relationship (unidirectional) with dengue incidence rates because the greater the value of population growth, the higher the incidence of dengue, a third variable (X1) population density, shows 0.05 positive sign that concluded there is a positive correlation with dengue, as well as a fourth variable (X4) ie settlement land use changes that indicate a positive value 230.14 to infer the existence of a positive relationship between these variables with independent variables that the incidence of DHF.
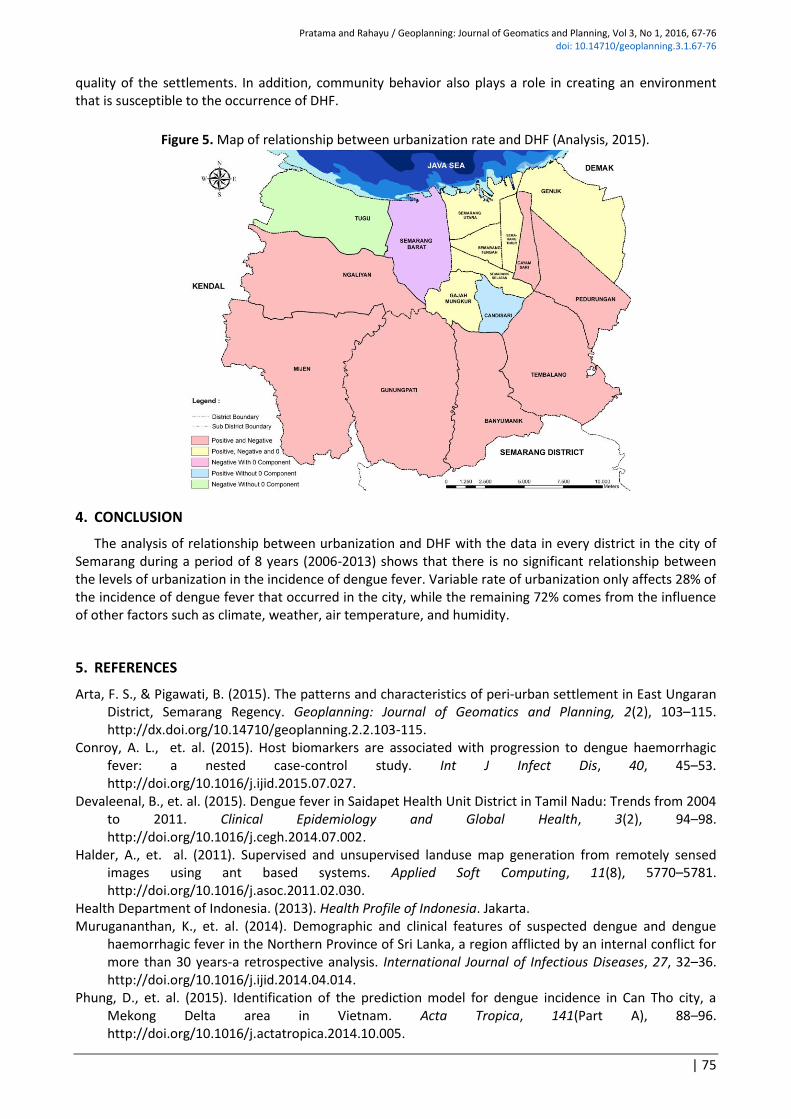
A positive relationship occurs when the independent variable increases, the dependent variable also increases accordingly. On the other hand, negative relationship means that the decline in the value of the independent variable correlates the increase of the dependent variable and vice versa whereas if the value is zero then there is no relationship between variables. The value of the relationship may explain the nature of the division of the classification of the nature of the relationship of each of the districts in accordance with the value of the variable in the column unstandardized coefficients b. Classification of the nature of the relationship is divided into 5 groups, namely negative with components 0, negative without the component of 0, positive and negative, positive with components 0 and positive, negative and 0. classification division is expected to explain the different characteristics of each of the districts concerned with closeness relation to dengue, which in the future, this condition can be changed in accordance with the dynamics that occur in districts (see Figure 5).
In general, each variable degree of urbanization does not have a significant relationship to the variable of dengue; however, positive association in some districts is found in each sub-district analysis. The most substantial positive relationship between land use change and DHF is in the District of Tembalang. The Overall value of the average incidence rate of dengue District Tembalang increased in 2010, a total of 32 cases occurred in the same year changes in land use amounted to 4%. Although not directly related, activity on District Tembalang land use change could potentially slow down, speed up or even form a new habitat of mosquitoes carrying the vector which then affect the incidence of dengue fever in the region.
The most substantial positive relationship between the variables and variable density of buildings is the District of Tembalang DHF. The average number density of buildings that represented KDB was always increased, growing by 9% in 2006, then rose to 12% in 2013, it also occurs at the level of the average urban neighborhoods is always increasing. If it is compared with a history of dengue incidence rates tend to fluctuate, only an increase simultaneously in 2006 and 2013. Indirectly density settlements might also have implications on the temperature and humidity of this region. The more and the lack of green open spaces, the temperature will increase the effect on the rapid growth of dengue mosquito in the settlement.
The most substantial positive relationship between the variables and the population density is the District of Candisari DBD variables. Subdistrict Candisari is quite solid with a density figure of 12,070 inhabitants/km². The Village of the most densely populated village Jomblang which has a population of 18,426 inhabitants. While Kaliwiru village with a population of at least has a population of 3,943 inhabitants. Candisari sub-districts with high population density conditions has the potential to affect the incidence of dengue, because humans are the main carriers of the dengue virus, with the density of population in an area then people around the neighborhood will be vulnerable to disease.
The most substantial positive relationship between population growth and DHF was in Tembalang District. Population growth in this region showed a drastic increase in 2008 by 5%, which corresponded with an increase of 40 cases of dengue incidence. The average percentage of population growth was highest in Meteseh Sub-district, i.e. 6% for 8 years, correlated with a fairly high incidence of dengue fever, i.e. 38 cases. The pattern started in 2007, in which there is an increase in the incidence of dengue fever from 6 cases to 27 cases, and in the same year there was an increase of 2% of population growth. The population growth was followed by a change in the social dynamics in the District of Tembalang. Community activities that occur in this region certainly have an impact on changes in the environmental
Pratama and Rahayu / Geoplanning: Journal of Geomatics and Planning, Vol 3, No 1, 2016, 67-76
doi: 10.14710/geoplanning.3.1.67-76
| 75
quality of the settlements. In addition, community behavior also plays a role in creating an environment that is susceptible to the occurrence of DHF.
Figure 5. Map of relationship between urbanization rate and DHF (Analysis, 2015).
4. CONCLUSION
The analysis of relationship between urbanization and DHF with the data in every district in the city of Semarang during a period of 8 years (2006-2013) shows that there is no significant relationship between the levels of urbanization in the incidence of dengue fever. Variable rate of urbanization only affects 28% of the incidence of dengue fever that occurred in the city, while the remaining 72% comes from the influence of other factors such as climate, weather, air temperature, and humidity.
5. REFERENCES
Arta, F. S., & Pigawati, B. (2015). The patterns and characteristics of peri-urban settlement in East Ungaran District, Semarang Regency. Geoplanning: Journal of Geomatics and Planning, 2(2), 103–115. http://dx.doi.org/10.14710/geoplanning.2.2.103-115.
Conroy, A. L., et. al. (2015). Host biomarkers are associated with progression to dengue haemorrhagic fever: a nested case-control study. Int J Infect Dis, 40, 45–53. http://doi.org/10.1016/j.ijid.2015.07.027.
Devaleenal, B., et. al. (2015). Dengue fever in Saidapet Health Unit District in Tamil Nadu: Trends from 2004 to 2011. Clinical Epidemiology and Global Health, 3(2), 94–98. http://doi.org/10.1016/j.cegh.2014.07.002.
Halder, A., et. al. (2011). Supervised and unsupervised landuse map generation from remotely sensed images using ant based systems. Applied Soft Computing, 11(8), 5770–5781. http://doi.org/10.1016/j.asoc.2011.02.030.
Health Department of Indonesia. (2013). Health Profile of Indonesia. Jakarta. Murugananthan, K., et. al. (2014). Demographic and clinical features of suspected dengue and dengue
haemorrhagic fever in the Northern Province of Sri Lanka, a region afflicted by an internal conflict for more than 30 years-a retrospective analysis. International Journal of Infectious Diseases, 27, 32–36. http://doi.org/10.1016/j.ijid.2014.04.014.
Phung, D., et. al. (2015). Identification of the prediction model for dengue incidence in Can Tho city, a Mekong Delta area in Vietnam. Acta Tropica, 141(Part A), 88–96. http://doi.org/10.1016/j.actatropica.2014.10.005.
Pratama and Rahayu / Geoplanning: Journal of Geomatics and Planning, Vol 3, No 1, 2016, 67-76 doi: 10.14710/geoplanning.3.1.67-76
76 |
Rigau-Pérez, J. G., et. al. (1998). Dengue and dengue haemorrhagic fever. The Lancet, 352, 971–977. Semarang Central Bureau of Statistics. (2014). Kota Semarang Dalam Angka 2014. Semarang: Badan Pusat
Statistik Kota Semarang. Vasquez Velasquez, C., et. al. (2015). Alpha tryptase allele of Tryptase 1 (TPSAB1) gene associated with
Dengue Haemorrhagic Fever (DHF) and Dengue Shock Syndrome (DSS) in Vietnam and Philippines. Human Immunology, 76(5), 318–323. http://doi.org/10.1016/j.humimm.2015.03.009.
Wu, P. C., et. al. (2009). Higher temperature and urbanization affect the spatial patterns of dengue fever transmission in subtropical Taiwan. Science of the Total Environment, 407(7), 2224–2233. http://doi.org/10.1016/j.scitotenv.2008.11.034.