Embed Size (px)
Citation preview
Office of Professional Accountability
2019
OPA ANNUAL REPORT This report provides statistical data regarding administrative investigations, citizen complaints, vehicle pursuits, patrol crashes, use of force incidents, and firearm discharge incidents, etc. within the Department of Safety and Homeland Security from January 2019-December 2019.

1 2019 OPA Annual Report| Department of Safety & Homeland Security
CONTENTS ADMINISTRATIVE INVESTIGATIONS (AD) 3
STATEWIDE DISTRIBUTION OF ADMINISTRATIVE INVESTIGATIONS BY UNIT 4
DISPOSITION OF ADMINISTRATIVE INVESTIGATION CASES 5
2017-2019 ADMINISTRATIVE CASE TREND ANALYSIS 6
CITIZEN COMPLAINTS (CC) BY THP BUREAUS & DRIVER SERVICES (DS) 7
STATEWIDE DISTRIBUTION OF CITIZEN COMPLAINTS 8
DISPOSITION OF CITIZEN COMPLAINT INVESTIGATIONS 9
2018-2019 CITIZEN COMPLAINT CASE TREND ANALYSIS 10
DISTRIBUTION OF THP CASES BY DISTRICT 11-12
DISTRIBUTION OF DRIVER SERVICES CASES BY DISTRICT 13-14
COMBINED OVERVIEW OF AD-CC CASE DISTRIBUTION & DISPOSITIONS 15
SUSPENSIONS: STATEWIDE DISTRIBUTION 16
DISTRIBUTION OF SUSPENSIONS BY UNIT/DISTRICT 17
TERMINATION, RESIGNATION, DEMOTION, DISCRETIONARY LEAVE & APPEAL DATA 18
A. Terminations, Resignations & Demotions: 18
B. Discretionary Leave 2018-2019 Comparison: 19
C. Appeal Hearings: 20
D. Written Warning Reviews: 21
OTHER DISCIPLINARY ACTIONS 22-24
INFORMATION ONLY CASES 25
DEPARTMENTAL PURSUIT DATA BY DISTRICT 26

2 2019 OPA Annual Report| Department of Safety & Homeland Security
PURSUIT DISPOSITIONS BY DISTRICT 27-28
DEPARTMENTAL CRASH DATA 29
DEPARTMENTAL CRASH DISCIPLINARY ACTIONS BY DISTRICT 30
USE OF FORCE INCIDENTS 31
FIREARM DISCHARGES 32
EARLY INTERVENTION ALERTS BY DISTRICT 33
WORKPLACE HARASSMENT COMPLAINTS 34

3 2019 OPA Annual Report| Department of Safety & Homeland Security
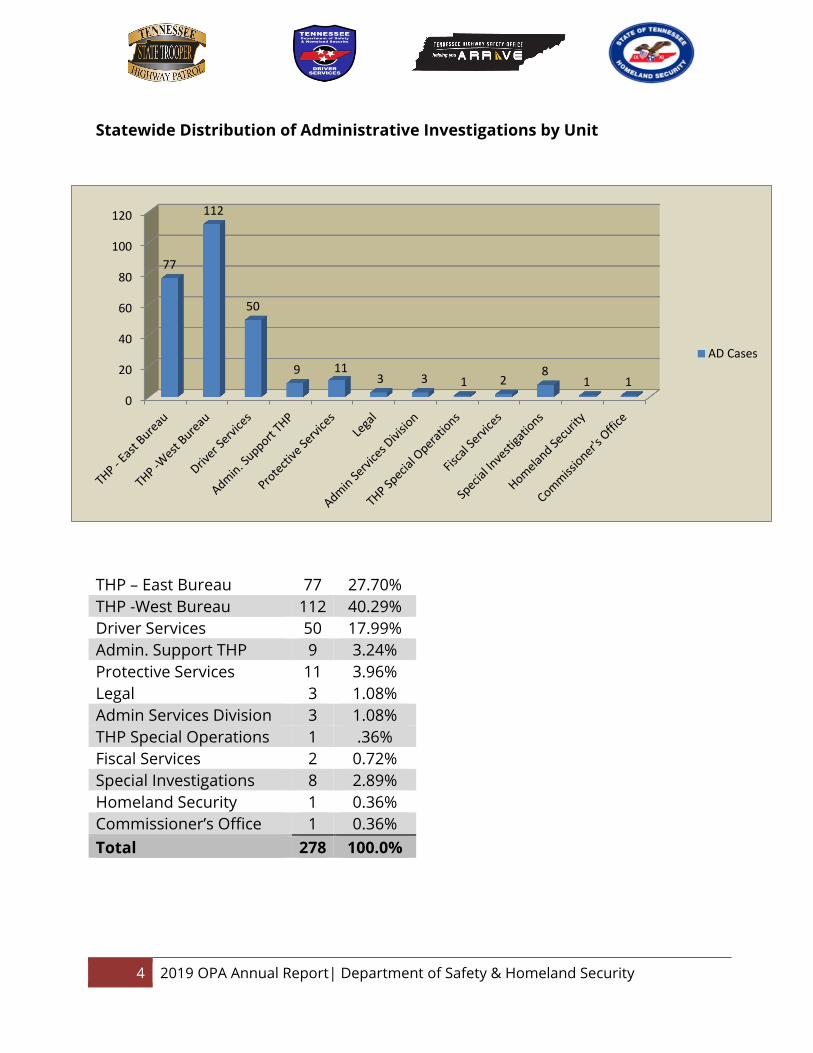
Administrative Investigations (AD) The Office of Professional Accountability (OPA) processed 278 Administrative Investigations (AD) in 2019. The distributions of AD cases are as follows: THP East Bureau 28%, THP West Bureau 40%, Driver Services 18%, and Administrative 14%. Of the 278 cases, the OPA completed 51 (18%) investigations and the Field completed 227 (82%) investigations. Refer to the below graph and the following pages for a breakdown of the distribution and disposition of all AD cases.
For reporting purposes in this section, “Administrative” consists of the following: Admin. Support THP, Protective Services, THP Special Operations, Admin Services Division, Legal, Technology Systems, Special Investigations, Homeland Security, Fiscal Services, Human Resources, Internal Audit, Financial Responsibility, Special Programs, and THSO. In reference to this report, “Admin Support THP” consists of the following: Dispatch, Training Center, Support Services, Handgun Permits, and the Colonel’s Office.
In reference to this report, “Admin Services Division” consists of the following: Research Planning & Development.
28%
14%
40%
18%
Administrative Investigations
THP East Bureau
Driver Services
THP West Bureau
Administrative
4 2019 OPA Annual Report| Department of Safety & Homeland Security
Statewide Distribution of Administrative Investigations by Unit
0
20
40
60
80
100
120
77
112
50
9 113 3 1 2
81 1
AD Cases
THP – East Bureau 77 27.70% THP -West Bureau 112 40.29% Driver Services 50 17.99% Admin. Support THP 9 3.24% Protective Services 11 3.96% Legal 3 1.08% Admin Services Division 3 1.08% THP Special Operations 1 .36% Fiscal Services 2 0.72% Special Investigations 8 2.89% Homeland Security 1 0.36% Commissioner’s Office 1 0.36% Total 278 100.0%

5 2019 OPA Annual Report| Department of Safety & Homeland Security
Disposition of Administrative Investigation Cases
AD Case Disposition AD Cases Percent Sustained 267 95.31% Exonerated 4 1.44% Inconclusive 2 .72% Unfounded 5 1.81% Suspended Status 1 .72% Total 278 100.0%
1 case is in a suspended status due to the employees being on extended leave.
0
50
100
150
200
250
300 264
4 2 5 1
Administrative Case Dispositions
AD Cases

6 2019 OPA Annual Report| Department of Safety & Homeland Security
2017-2019 Administrative Case Trend Analysis
During 2019, the Department saw a 6.54% increase in Administrative Cases when compared to 2018. Refer to the below graph for a breakdown of the distribution and disposition of all Administrative Investigation cases.
District 2017 AD
Cases
2017 % of AD Cases
per District
2018 AD
Cases
2018 % of AD Cases
per District
2019 AD
Cases
2019 % of AD Cases
per District
2017/2018 +/- Change Number of
Cases
2017/2018 Percentage Difference
2018/2019 +/-
Change Number of Cases
2018/2019 Percentage Difference
THP-1 21 8.7% 34 13.07% 25 9.03% +13 +61.90% -9 -26.47% THP-2 19 7.57% 14 5.40% 19 6.86% -5 -26.31% +5 +35.71% THP-3 25 9.96% 38 14.62% 41 14.80% +13 +52.00% +3 +7.89% THP-4 15 5.98% 20 7.70% 39 13.72% +5 +33.33% +19 +90% THP-5 23 9.16% 23 8.8% 29 10.47% 0 0.00% +6 +26.09% THP-6 15 5.98% 10 3.85% 6 2.17% -5 -33.33% -4 -40% THP-7 12 4.78% 13 5.00% 17 6.14% +1 +8.33% +4 +30.77% THP-8 22 8.76% 7 2.70% 13 4.69% -15 68.18% +6 +85.71% THP-9 40 15.94% 53 20.40% 39 14.08% +13 +32.50% -14 -26.42%
DS 56 22.31% 45 17.31% 50 18.05% -11 -19.64% +5 +11.11% Legal 3 1.20% 3 1.15% 3 .36% 0 0.00% 0 0.00%
Totals 251 100.0% 260 100.0% 278 100% +9 +3.59% +18 +6.54%
THP-9 consists of the following: Admin. Support THP, Protective Services, THP Special Operations, Admin Services Division, Technology Systems, Special Investigations, Special Programs, Homeland Security, Human Resources, Fiscal Services, and Internal Audit.
2119
25
15
23
15 12
22
40
56
3
34
14
38
20
23
10
13
7
53
45
3
25
19
41 39
29
6
17
13
39
50
3
0
10
20
30
40
50
60
2017
2018
2019

7 2019 OPA Annual Report| Department of Safety & Homeland Security
Citizen Complaints (CC) by THP Bureau & Driver Services (DS)
Citizen Complaints (CC) are complaints made by the general public that allege an employee of the Department has violated a rule, policy, or procedure. OPA began tracking Citizen Complaints in 2013. The Department received 42 Citizen Complaints during 2019. Of the 42 cases, the Office of Professional Accountability completed 18 (42.86%) investigations, and the Field completed 24 (57.14%) investigations. During 2019, the Department saw a 100% increase in Citizen Complaints when compared to 2018. Refer to the below graph and the following pages for a breakdown of the distribution and disposition of all Citizen Complaint cases.
In reference to this report, “Protective Services” consists of the following: Capital and Executive Protection.
**Note**
The significant increase in Citizen Complaints for 2019 can be attributed to a change in the way complaints were categorized.
22%
31%31%
5% 7%
2% 2%
Citizen Complaints
THP East Bureau
Driver Services
THP West Bureau
Proctective Services
Legal
Admin Support THP
SIB
8 2019 OPA Annual Report| Department of Safety & Homeland Security
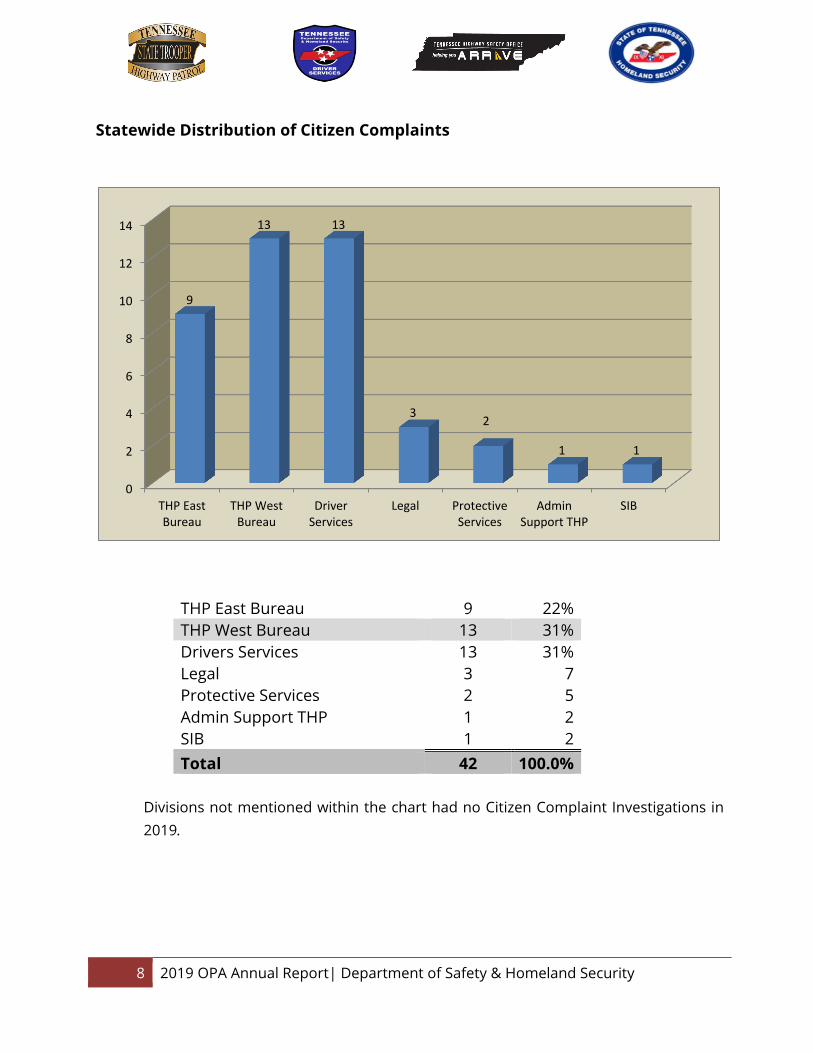
Statewide Distribution of Citizen Complaints
THP East Bureau 9 22% THP West Bureau 13 31% Drivers Services 13 31% Legal 3 7 Protective Services 2 5 Admin Support THP 1 2 SIB 1 2 Total 42 100.0%
Divisions not mentioned within the chart had no Citizen Complaint Investigations in 2019.
0
2
4
6
8
10
12
14
THP EastBureau
THP WestBureau
DriverServices
Legal ProtectiveServices
AdminSupport THP
SIB
9
13 13
3 2
1 1
9 2019 OPA Annual Report| Department of Safety & Homeland Security
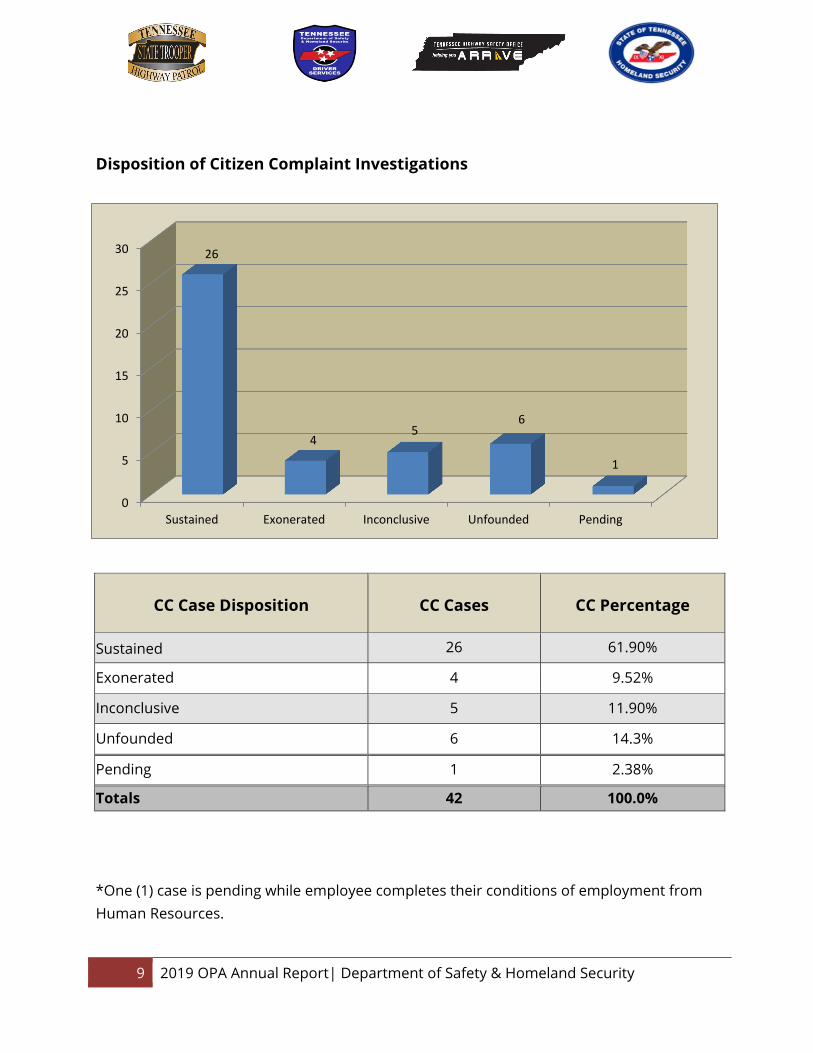
Disposition of Citizen Complaint Investigations
CC Case Disposition CC Cases CC Percentage
Sustained 26 61.90%
Exonerated 4 9.52%
Inconclusive 5 11.90%
Unfounded 6 14.3%
Pending 1 2.38%
Totals 42 100.0%
*One (1) case is pending while employee completes their conditions of employment from Human Resources.
0
5
10
15
20
25
30
Sustained Exonerated Inconclusive Unfounded Pending
26
45
6
1

10 2019 OPA Annual Report| Department of Safety & Homeland Security
2017-2019 Citizen Complaint Case Trend Analysis
District 2017 CC
Cases
2017 % of CC Cases
per District
2018 CC
Cases
2018 % of CC Cases
per District
2019 CC
Cases
2019 % of CC Cases
per District
2017/2018 +/-
Change Number of Cases
2017/2018 Percentag
e Difference
2018/2019 +/- Change Number of
Cases
2018/2019Percentag
e Difference
THP-1 2 9.09% 3 14.29% 4 9.53% +1 +50% +1 +33.33% THP-2 0 0.0% 1 4.76% 3 7.14% +1 +100% +2 +200% THP-3 4 18.18% 3 14.29% 2 4.76% -1 -25% -1 -33.33% THP-4 2 9.09% 2 9.52% 5 11.90% 0 0 +3 +150% THP-5 1 4.55% 3 14.29% 0 0% +2 +200% -3 -100% THP-6 1 4.55% 2 9.52% 2 4.76% +1 +100% 0 0% THP-7 2 9.09% 3 14.29% 2 4.76% +1 +50% -1 -33.33% THP-8 0 0.0% 1 4.76% 4 9.53% +1 +100% +3 +300% THP-9 0 0.0% 2 9.52% 7 16.67% +2 +200% +5 +250%
DS 10 45.45% 1 4.76% 13 16.67% -9 -90% +12 +1200% Totals 22 100.0% 21 100.0% 42 100% -1 -4.54% +21 +100%
THP-9 consists of the following: Admin. Support THP, Protective Services, THP Special Operations, Special Programs, Admin Services Division, Technology Systems, Special Investigations, Homeland Security, Support Services, THSO, Legal, and Internal Audit.
2
0
4
21 1
2
0 0
10
3
1
32
32
3
12
1
4
3
2
5
0
2 2
4
7
13
0
2
4
6
8
10
12
14
2017
2018
2019
11 2019 OPA Annual Report| Department of Safety & Homeland Security
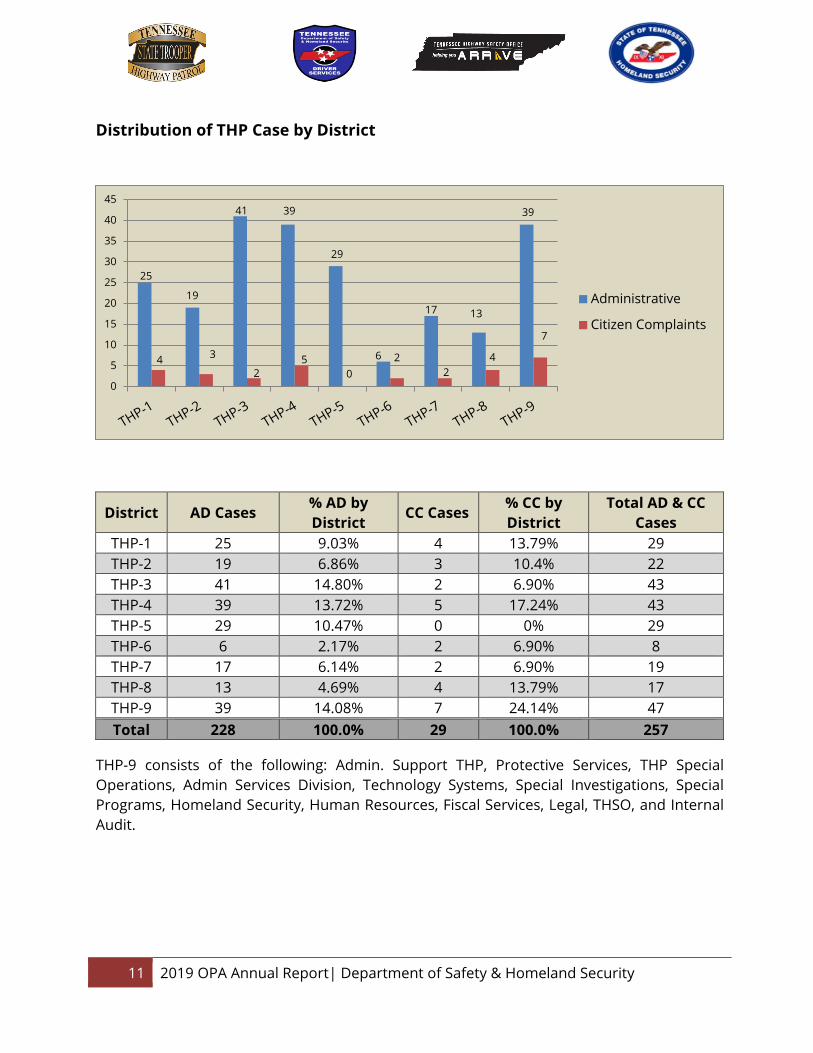
Distribution of THP Case by District
District AD Cases % AD by District
CC Cases % CC by District
Total AD & CC Cases
THP-1 25 9.03% 4 13.79% 29 THP-2 19 6.86% 3 10.4% 22 THP-3 41 14.80% 2 6.90% 43 THP-4 39 13.72% 5 17.24% 43 THP-5 29 10.47% 0 0% 29 THP-6 6 2.17% 2 6.90% 8 THP-7 17 6.14% 2 6.90% 19 THP-8 13 4.69% 4 13.79% 17 THP-9 39 14.08% 7 24.14% 47 Total 228 100.0% 29 100.0% 257
THP-9 consists of the following: Admin. Support THP, Protective Services, THP Special Operations, Admin Services Division, Technology Systems, Special Investigations, Special Programs, Homeland Security, Human Resources, Fiscal Services, Legal, THSO, and Internal Audit.
25
19
41 39
29
6
17 13
39
4 3
25
02
24
7
0
5
10
15
20
25
30
35
40
45
Administrative
Citizen Complaints
12 2019 OPA Annual Report| Department of Safety & Homeland Security
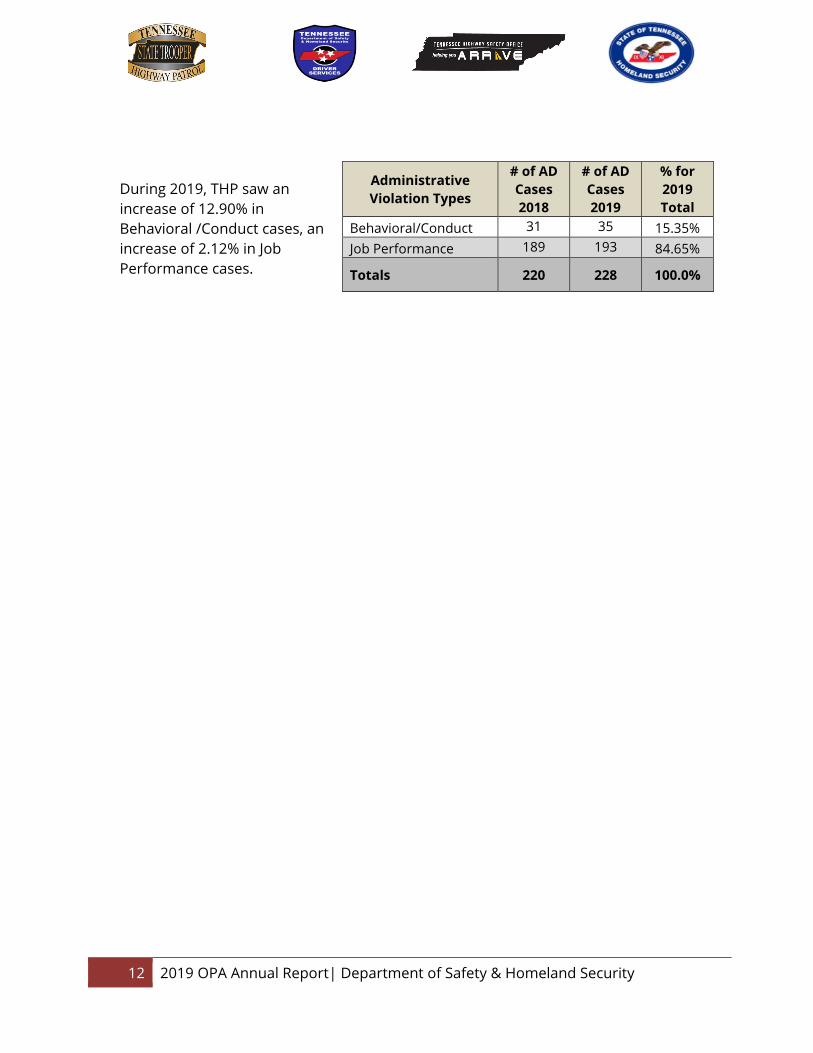
During 2019, THP saw an increase of 12.90% in Behavioral /Conduct cases, an increase of 2.12% in Job Performance cases.
Administrative Violation Types
# of AD Cases 2018
# of AD Cases 2019
% for 2019 Total
Behavioral/Conduct 31 35 15.35% Job Performance 189 193 84.65%
Totals 220 228 100.0%

13 2019 OPA Annual Report| Department of Safety & Homeland Security
Distribution of Driver Services Cases by District
District AD Cases
% AD by District CC Cases
% CC by District
Total AD & CC Cases
DS-1 5 10% 1 7.69% 6 DS-2 5 10% 3 23.09% 8 DS-3 18 36% 2 15.38% 20 DS-4 2 4% 4 30.77% 6 DS-5 4 8% 2 15.38% 6 DS-6 2 4% 1 7.69% 3 DS-7 0 0% 0 0.0% 0 DS-8 1 2% 0 0.0% 1
Admin 13 26% 0 0.0% 14 Total 50 100.0% 13 100.0% 63
5 5
18
2
4
2
01
13
1
32
4
21
0 0 00
2
4
6
8
10
12
14
16
18
20
Administrative
Citizen Complaints

14 2019 OPA Annual Report| Department of Safety & Homeland Security
20 of the Administrative Investigation cases for Driver Services in 2019 were for unsatisfactory job performance; a decrease of 39.39% from 2018. Behavioral/Conduct issues accounted for 60% of Administrative Investigation cases, up 150% from 2018.
Administrative Violation Types
# of AD Cases 2018
# of AD Cases 2019
2019% of
Total Behavioral/Conduct 12 30 60% Job Performance 33 20 40%
Totals 45 50 100.0%

15 2019 OPA Annual Report| Department of Safety & Homeland Security
Combined Overview of AD-CC Case Distribution & Dispositions
Bureau AD Cases CC Cases Total AD & CC Cases THP East 77 9 86 THP West 112 13 125 *THP Admin 36 4 40 DS 50 13 63 Legal 3 3 6 Totals 278 42 320
*THP Admin consists of the following: Admin. Support THP, Protective Services, Special Investigations, Fiscal Services, THP Special Operations, Admin Services Division, Field Operations, Human Resources, Communications, THSO, Special Programs, and Internal Audit & Technology Systems.
Case Disposition AD
Cases AD
Percentage CC
Cases CC
Percentage AD & CC
Total Percentage
Total
Sustained 266 95.67% 26 61.90% 292 91.22% Exonerated 4 1.44% 3 7.14% 7 2.19% Inconclusive 2 0.72% 5 11.90% 7 2.19% Unfounded 5 1.81% 6 14.30% 11 3.45% Pending 1 .36% 2 4.76% 3 .94% Totals 278 100.0% 42 100.0% 320 100.0%
THP East, 77
THP West, 111
THP Admin, 36
DS, 50
Legal, 3
AD & CC Cases by Bureau
THP East
THP West
THP Admin
DS
Legal

16 2019 OPA Annual Report| Department of Safety & Homeland Security
Suspensions: Statewide Distribution
The statewide distribution of suspensions charted below illustrates a total of 77 suspensions during the calendar year of 2019. The distribution of these suspensions by sections and the number of days suspended is shown in the table below.
Suspensions Driver
Services THP East Bureau
THP West
Bureau
THP Admin.
Legal Grand Total 2019
Grand Total 2018
2018/2019 +/-
Change Number of Cases
2018/2019 Percentage Difference
1 Day 6 8 22 7 3 46 32 +14 +43.75% 2 Days 3 4 6 2 0 15 9 +6 +66.67% 3 Days 2 1 0 0 0 3 10 -7 -70% 5 Days 1 0 2 3 0 6 8 -2 -25% 6 Days 0 1 0 0 0 1 0 +1 +100% 10 Days 0 2 2 0 0 4 1 +3 +300%
30 Days 0 0 2 0 0 2 0 +2 +200%
Totals 12 16 34 12 3 77 64 +13 +20.31%
% of Suspensions
15.88% 20.78% 44.16% 15.58% 3.90% 100.0%
The Department suspended 77 employees in 2019, compared to suspending 64 employees in 2018. This represents a 20.31% increase in suspensions.

17 2019 OPA Annual Report| Department of Safety & Homeland Security
Distribution of Suspensions by Unit/District
The below table illustrates a breakdown by Unit/District for the 77 suspensions received within the Department.
In reference to this report, Admin Support THP consists of the following: Dispatch, Training Center, Support Services, Handgun Permits, the Colonel’s Office, Protective Services, Special Investigations, Fiscal Services, THP Special Operations, Admin Services Division, Field Operations, Human Resources, Communications, THSO, Special Programs, and Internal Audit & Technology Systems.
Suspensions by Unit/District
1 Day 2 Days 3 Days 5 Days 6
Days 10
Days 30
Days Total
Suspension
Total Percentage Suspension
DS-2 0 0 1 1 0 0 0 2 2.60%
DS-3 5 2 1 0 0 0 0 8 10.39%
DS-4 0 1 0 0 0 0 0 1 1.30%
DS-5 1 0 0 0 0 0 0 1 1.30%
Legal 3 0 0 0 0 0 0 3 3.90%
THP-1 3 1 0 0 1 0 0 5 6.49%
THP-2 4 2 1 0 0 0 0 7 9.09%
THP-3 6 0 0 1 0 0 1 8 10.39%
THP-4 7 5 0 1 0 1 1 15 19.48%
THP-5 1 1 0 0 0 2 0 4 5.19%
THP-7 6 1 0 0 0 0 0 7 9.09%
THP-8 3 0 0 0 0 1 0 4 5.19%
Admin. Support THP
7 2 0 3 0 0 0 12 15.58%
TOTALS 46 15 3 6 1 4 2 77 100.0%

18 2019 OPA Annual Report| Department of Safety & Homeland Security
Termination, Resignation, Demotion, Discretionary Leave & Appeal Data
A. Terminations, Resignations & Demotions:
Bureau Terminated Probationary &
Part-Time Terminations
Resigned In Lieu of Termination Demoted Totals
THP East 2 0 1 0 3 THP West 2 1 2 1 6 Admin. Support THP 0 3 1 0 4 Driver Services 4 3 0 0 7 Fiscal Services 0 1 0 1 2 Protective Services 0 0 1 0 1 Legal 0 0 1 0 2 Totals 8 8 6 2 24
Comparing 2018 to 2019, the Department had an decrease of 11% in Terminations (9 to 8), 50% increase in Resignations (4 to 6), 60% decrease in Demotions (5 to 2), and a 33% decrease in Probationary / Part-Time Terminations (12 to 8).
19 2019 OPA Annual Report| Department of Safety & Homeland Security
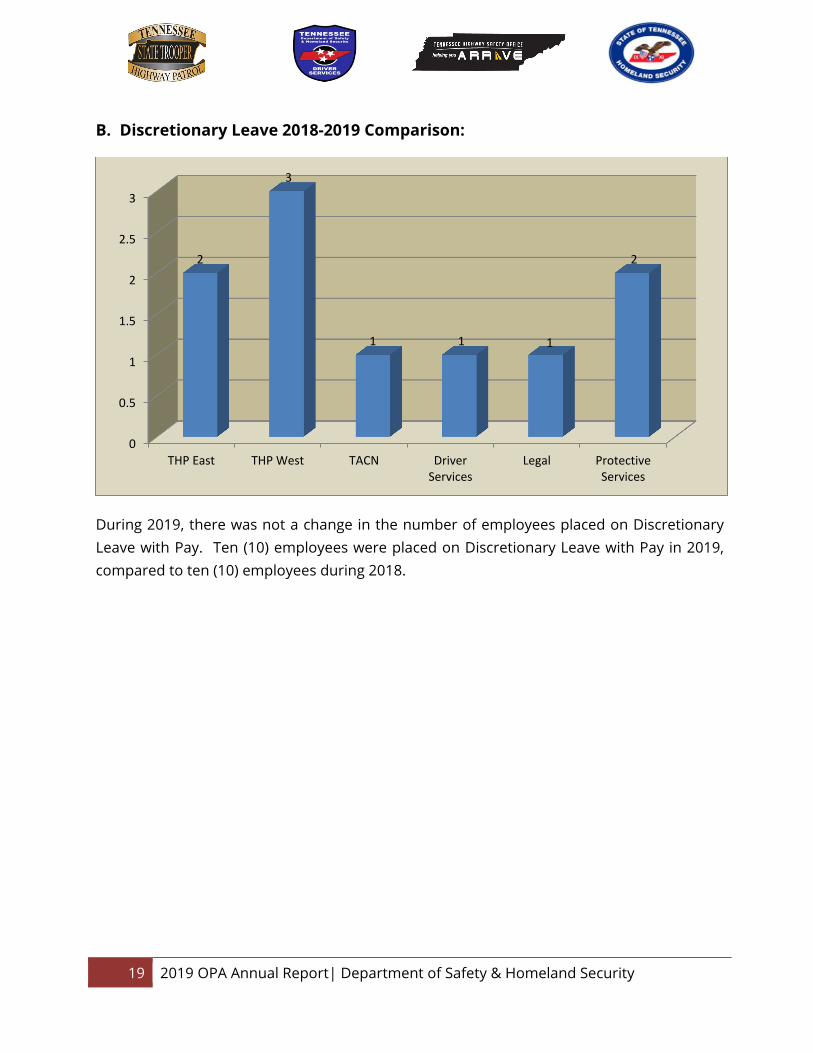
B. Discretionary Leave 2018-2019 Comparison:
During 2019, there was not a change in the number of employees placed on Discretionary Leave with Pay. Ten (10) employees were placed on Discretionary Leave with Pay in 2019, compared to ten (10) employees during 2018.
0
0.5
1
1.5
2
2.5
3
THP East THP West TACN DriverServices
Legal ProtectiveServices
2
3
1 1 1
2
20 2019 OPA Annual Report| Department of Safety & Homeland Security
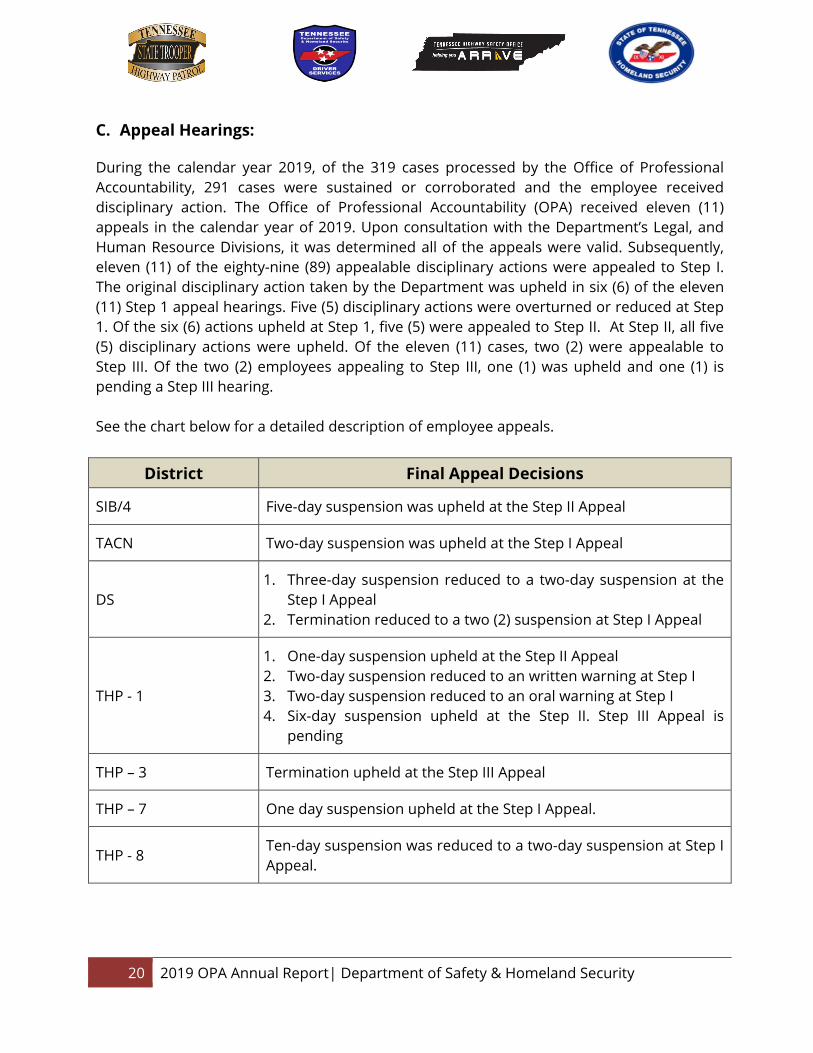
C. Appeal Hearings:
During the calendar year 2019, of the 319 cases processed by the Office of Professional Accountability, 291 cases were sustained or corroborated and the employee received disciplinary action. The Office of Professional Accountability (OPA) received eleven (11) appeals in the calendar year of 2019. Upon consultation with the Department’s Legal, and Human Resource Divisions, it was determined all of the appeals were valid. Subsequently, eleven (11) of the eighty-nine (89) appealable disciplinary actions were appealed to Step I. The original disciplinary action taken by the Department was upheld in six (6) of the eleven (11) Step 1 appeal hearings. Five (5) disciplinary actions were overturned or reduced at Step 1. Of the six (6) actions upheld at Step 1, five (5) were appealed to Step II. At Step II, all five (5) disciplinary actions were upheld. Of the eleven (11) cases, two (2) were appealable to Step III. Of the two (2) employees appealing to Step III, one (1) was upheld and one (1) is pending a Step III hearing. See the chart below for a detailed description of employee appeals.
District Final Appeal Decisions
SIB/4 Five-day suspension was upheld at the Step II Appeal
TACN Two-day suspension was upheld at the Step I Appeal
DS 1. Three-day suspension reduced to a two-day suspension at the
Step I Appeal 2. Termination reduced to a two (2) suspension at Step I Appeal
THP - 1
1. One-day suspension upheld at the Step II Appeal 2. Two-day suspension reduced to an written warning at Step I 3. Two-day suspension reduced to an oral warning at Step I 4. Six-day suspension upheld at the Step II. Step III Appeal is
pending
THP – 3 Termination upheld at the Step III Appeal
THP – 7 One day suspension upheld at the Step I Appeal.
THP - 8 Ten-day suspension was reduced to a two-day suspension at Step I Appeal.

21 2019 OPA Annual Report| Department of Safety & Homeland Security
D. Written Warning Reviews:
During 2019, eighty-eight (88) written warnings were processed by the Inspectional Services Bureau. Four (4) employees’ submitted a request for a written warning review. One (1) written warning was reduced to a coaching session and One (1) was reduced to an oral warning.

22 2019 OPA Annual Report| Department of Safety & Homeland Security
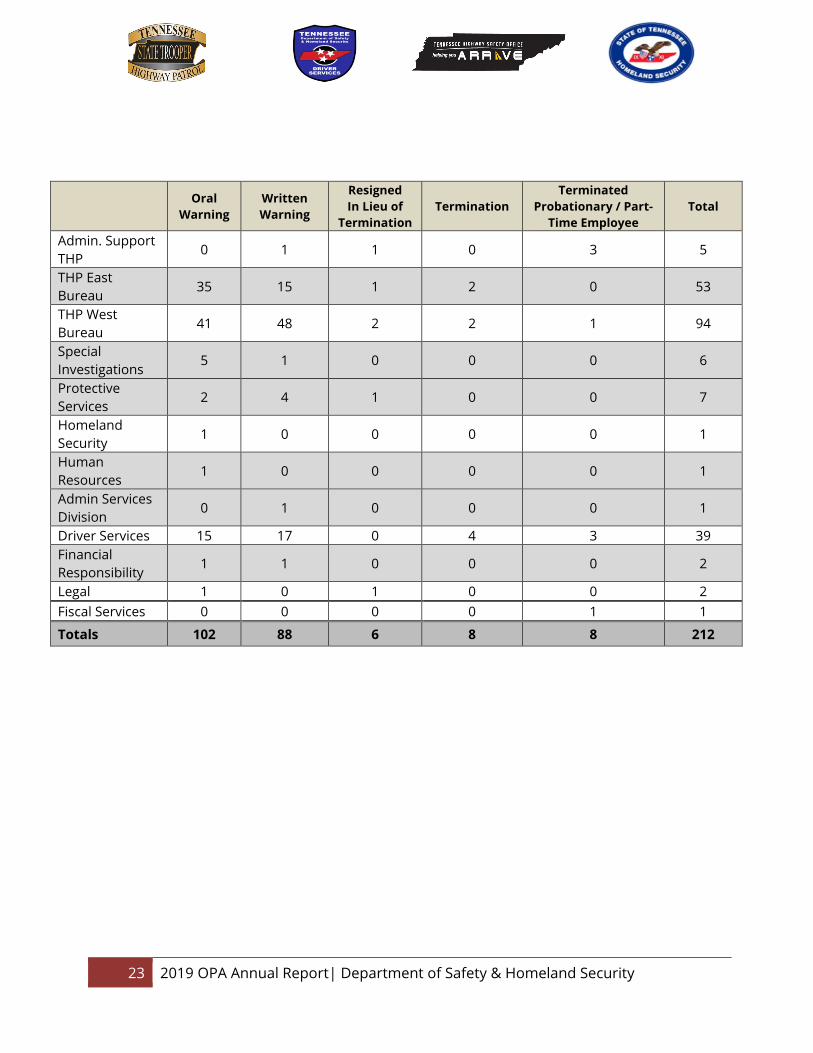
Other Disciplinary Actions
See the following chart along with the table on the following page for other disciplinary actions.
0
10
20
30
40
50
60
Oral Warning Written Warning Resignation inLieu of
Termination
Termination TerminatedProbationary /
Part-TimeEmployee
Admin. Support THP
THP East Bureau
THP West Bureau
Special Investigations
Protective Services
Homeland Security
Fiscal Services
Admin Services Division
Technology Systems
Driver Services
Financial Responsibility
Legal
Human Resources
23 2019 OPA Annual Report| Department of Safety & Homeland Security
Oral Warning
Written Warning
Resigned In Lieu of
Termination Termination
Terminated Probationary / Part-
Time Employee Total
Admin. Support THP
0 1 1 0 3 5
THP East Bureau
35 15 1 2 0 53
THP West Bureau
41 48 2 2 1 94
Special Investigations
5 1 0 0 0 6
Protective Services
2 4 1 0 0 7
Homeland Security
1 0 0 0 0 1
Human Resources
1 0 0 0 0 1
Admin Services Division
0 1 0 0 0 1
Driver Services 15 17 0 4 3 39 Financial Responsibility
1 1 0 0 0 2
Legal 1 0 1 0 0 2 Fiscal Services 0 0 0 0 1 1
Totals 102 88 6 8 8 212
24 2019 OPA Annual Report| Department of Safety & Homeland Security
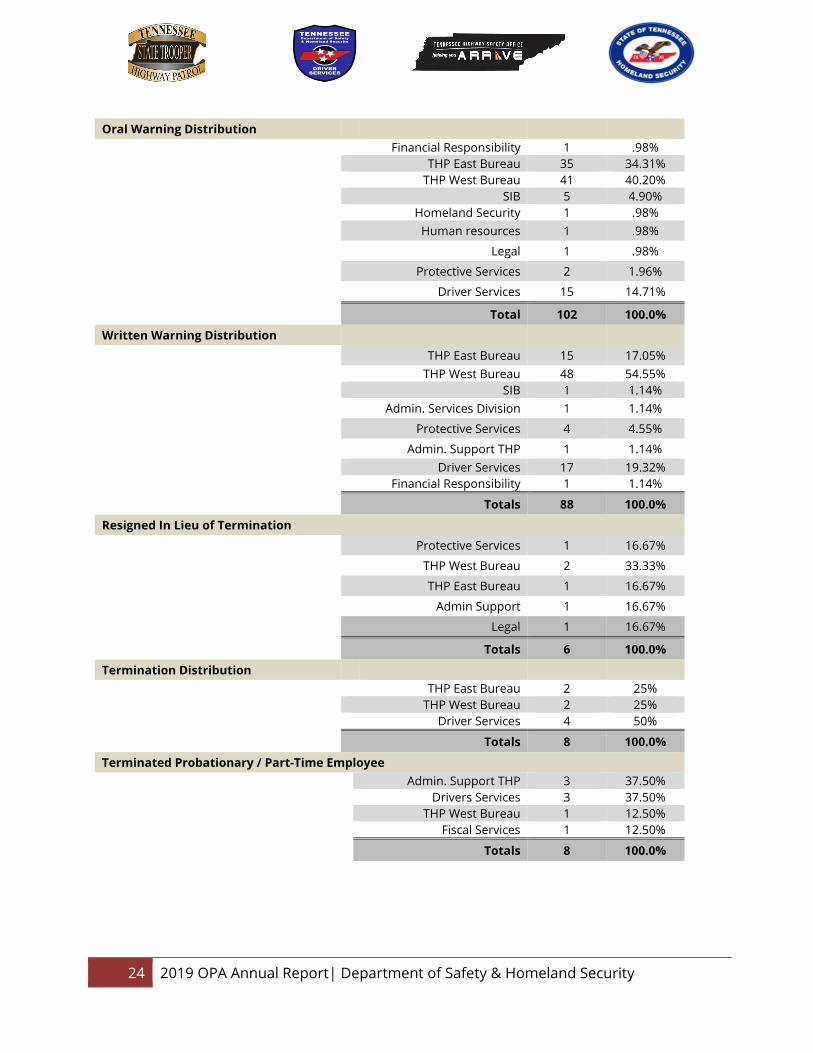
Oral Warning Distribution
Financial Responsibility 1 .98%
THP East Bureau 35 34.31%
THP West Bureau 41 40.20%
SIB 5 4.90%
Homeland Security 1 .98%
Human resources 1 .98%
Legal 1 .98%
Protective Services 2 1.96%
Driver Services 15 14.71%
Total 102 100.0%
Written Warning Distribution
THP East Bureau 15 17.05%
THP West Bureau 48 54.55%
SIB 1 1.14%
Admin. Services Division 1 1.14%
Protective Services 4 4.55%
Admin. Support THP 1 1.14%
Driver Services 17 19.32% Financial Responsibility 1 1.14%
Totals 88 100.0%
Resigned In Lieu of Termination
Protective Services 1 16.67%
THP West Bureau 2 33.33%
THP East Bureau 1 16.67%
Admin Support 1 16.67%
Legal 1 16.67%
Totals 6 100.0%
Termination Distribution
THP East Bureau 2 25% THP West Bureau 2 25%
Driver Services 4 50%
Totals 8 100.0%
Terminated Probationary / Part-Time Employee
Admin. Support THP 3 37.50% Drivers Services 3 37.50% THP West Bureau 1 12.50% Fiscal Services 1 12.50%
Totals 8 100.0%

25 2019 OPA Annual Report| Department of Safety & Homeland Security
Information Only Cases The Office of Professional Accountability processed 298 Information Only (IO) cases in 2019. Cases categorized as an IO involve minor complaints, requests for information, and complaints that are non-departmental, but for informational purposes are tracked by the Department.
The data in the Other/Non-Departmental category includes requests for information, customer comments, and complaints that are outside the jurisdiction of the Department. Comparing 2018 to 2019, Driver Services increased by 25.64%, Highway Patrol decreased by 6.38%, and Other/Non-Departmental decreased by 5.55%. Total IO reviews increased by 4.93% in comparison to the previous year.
Unit Assigned Amount
Admin. Support THP 2
Admin Services Div. 2
Driver Services 94
Financial Responsibility
4
TACN 1
THSO 1
FPO 2
THP East Bureau 77
THP West Bureau 91
Special Investigation 8
Special Programs 1
Special Operations 1
Other / Non-Departmental
14
Total 298
2 2
94
411
281
77
91
14
1
Information Only CasesAdmin. Support THP
Admin. Services Div.
Driver Services
Financial Responsibility
TACN
THSO
FPO
Special Investigations
Special Programs
THP East Bureau
THP West Bureau
Other / Non-Departmental
Special Operations

26 2019 OPA Annual Report| Department of Safety & Homeland Security
Departmental Pursuit Data by District
During 2019, the Department had 272 pursuits compared to 277 pursuits in 2018 which represents a 2.53% decrease. The following chart illustrates the number of vehicle pursuits by District that were initiated by either a misdemeanor or a felony.
District Misdemeanor Initiated
Felony Initiated
Total Pursuits Percentage
THP-1 41 5 46 16.91% THP-2 23 3 26 9.56% THP-3 46 5 51 18.75% THP-4 2 5 7 2.57% THP-5 56 6 62 22.79% THP-6 23 5 28 10.29% THP-7 0 12 12 4.41% THP-8 16 5 21 7.72% THP–9 16 3 19 6.99% Total 223 49 272 100.00%
Initiated Due To Number Percentage Felony BOLO 24 8.82% Misdemeanor BOLO 13 4.78% Erratic Driving / DUI 45 16.54% Speeding 121 44.49% Other Traffic Offenses 59 21.69% Stolen Vehicle 10 3.68% Total 272 100%
27 2019 OPA Annual Report| Department of Safety & Homeland Security
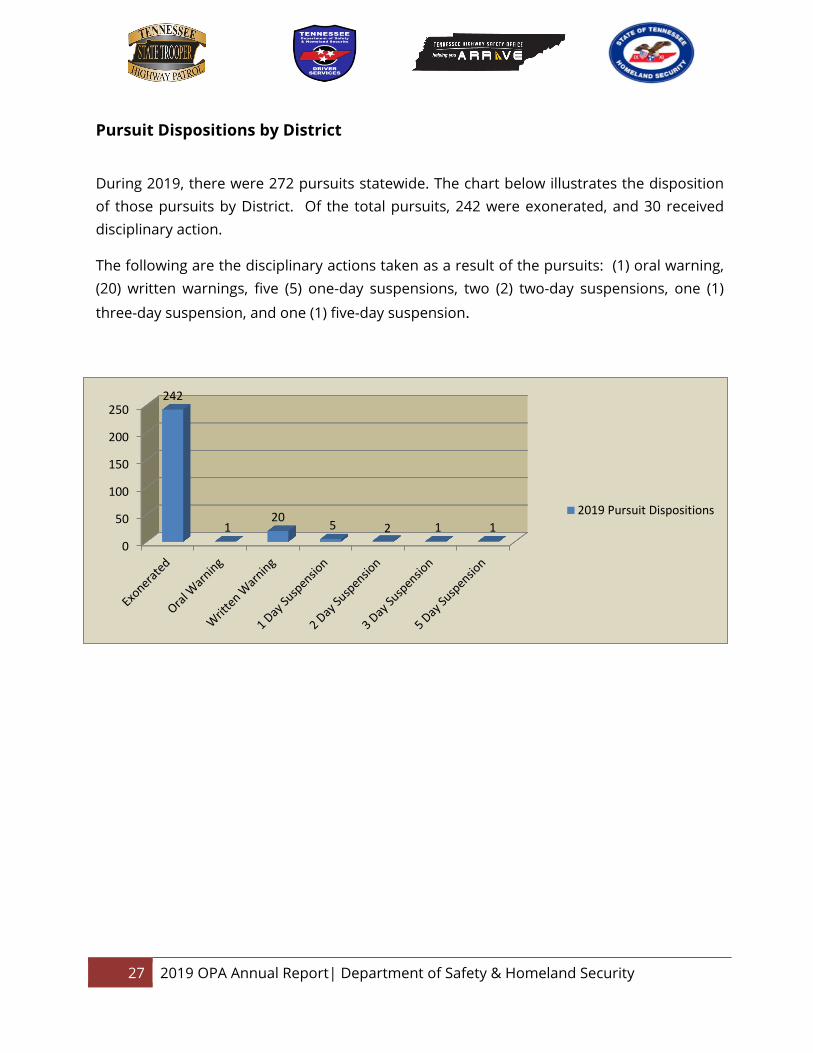
Pursuit Dispositions by District
During 2019, there were 272 pursuits statewide. The chart below illustrates the disposition of those pursuits by District. Of the total pursuits, 242 were exonerated, and 30 received disciplinary action.
The following are the disciplinary actions taken as a result of the pursuits: (1) oral warning, (20) written warnings, five (5) one-day suspensions, two (2) two-day suspensions, one (1)
three-day suspension, and one (1) five-day suspension.
0
50
100
150
200
250242
120 5 2 1 1
2019 Pursuit Dispositions

28 2019 OPA Annual Report| Department of Safety & Homeland Security
District Exonerated Oral
Warning Written Warning
1 Day Suspension
2 Day Suspension
3 Day Suspension
5 Day Suspension
Total Pursuits
SIB 13 0 0 0 0 0 0 13 Admin Sup THP
4 0 0 0 0 0 0 4
Prot. Serv. 1 0 0 0 0 0 0 1
Special Ops 1 0 0 0 0 0 0 1
THP-1 40 0 5 0 1 0 0 46
THP-2 25 1 0 0 0 0 0 26
THP-3 44 0 3 2 0 1 1 51
THP-4 3 0 2 2 0 0 0 7
THP-5 57 0 5 0 0 0 0 62
THP-6 27 0 1 0 0 0 0 28
THP-7 11 0 0 0 7 0 0 12
THP-8 16 0 4 1 0 0 0 21
Total 242 1 20 5 2 1 1 272

29 2019 OPA Annual Report| Department of Safety & Homeland Security
Departmental Crash Data
The Department had 159 patrol car crashes in 2019 compared to 172 patrol car crashes in 2018. This represents a 7.56% decrease in crashes from the previous year. The following
chart illustrates the breakdown of crashes by Districts.
District Total Crashes % of Total
THP-1 18 10.47% THP-2 14 8.14% THP-3 24 13.95% THP-4 13 7.56% THP-5 14 8.14% THP-6 14 8.14% THP-7 21 12.21% THP-8 14 8.14% Protective Services 9 5.23% Special Investigations 8 4.65% Special Operations 2 1.16% Admin. Support THP 4 2.33% Admin. Services Division 4 2.33% Total 159 100.0%
0
5
10
15
20
25
18
14
24
13 14 14
21
14
9 8
24 4 Crashes

30 2019 OPA Annual Report| Department of Safety & Homeland Security
Departmental Crash Disciplinary Actions by District
During 2019, there were 159 car crashes statewide. The chart below illustrates the disposition of those crashes by District.
District Exonerated Oral Warning Written Warning
1 Day Suspension
2 Day Suspension
3 Day Suspension
Terminated Total
Crashes
THP-1 15 3 3 0 0 0 0 18
THP-2 5 6 1 0 1 1 0 14
THP-3 14 8 1 1 0 0 0 24
THP-4 3 4 5 0 1 0 0 13
THP-5 5 7 1 0 1 0 0 14
THP-6 11 3 0 0 0 0 0 14
THP-7 13 4 2 2 0 0 0 21
THP-8 11 2 0 1 0 0 0 14
Special Investigations 6 1 1 0 0 0 0 8
Admin. Support THP 1 1 1 1 0 0 0 4
Admin. Services Division 4 0 0 0 0 0 0 4
Protective Services 7 1 1 0 0 0 0 9
Special Operations 2 0 0 0 0 0 0 2
Total 94 40 16 5 3 1 0 159
0102030405060708090
100
Exonerated OralWarning
WrittenWarning
1 DaySuspension
2 DaySuspension
3 DaySuspension
94
40
165 3 1
Disciplinary Actions

31 2019 OPA Annual Report| Department of Safety & Homeland Security
Use of Force Incidents
During 2019, there was 61 Use of Force (UF) incidents. This represents a 12.86% decrease compared to the 70 Use of Force (UF) incidents that occurred in 2018. Three (3) of the 61 did not comply with departmental policies and procedures. The following are disciplinary actions that resulted from those incidents: One (1) written warning, two (2) one-day suspensions, and one (1) requirement to attend tire deflation refresher training.
District 2018
Exonerated Cases
2018 Sustained
Cases
2018 Total
2019 Exonerated
Cases
2019 Sustained
Cases
2019 Total
2019 % per
District
2018/2019 +/-
Change Number of Cases
2018/2019 %
Difference
THP-1 10 2 12 8 0 8 13.11% -4 -33.33%
THP-2 12 1 13 12 3 15 24.59% +2 +15.38%
THP-3 7 0 7 11 0 11 18.03% +4 +57.14%
THP-4 1 0 1 1 0 1 1.64% 0 0%
THP-5 25 1 26 9 0 9 14.75% -17 -65.38%
THP-6 4 0 4 6 0 6 9.84% +2 +33.33%
THP-7 2 0 2 3 0 3 4.92% +1 +50.00%
THP-8 0 0 0 7 0 7 11.48% +7 +700% Special Investigations
3 1 4 1 0 1 1.64% -3 -75%
Protective Services
1 0 1 0 0 0 0.0% -1 -100%
Totals 65 5 70 58 3 61 100% -9 -12.86%
0
2
4
6
8
10
12
0
3
0 0 0 0 0 0 0
8
1211
1
9
6
3
7
1Sustained Cases
Exonerated Cases
32 2019 OPA Annual Report| Department of Safety & Homeland Security
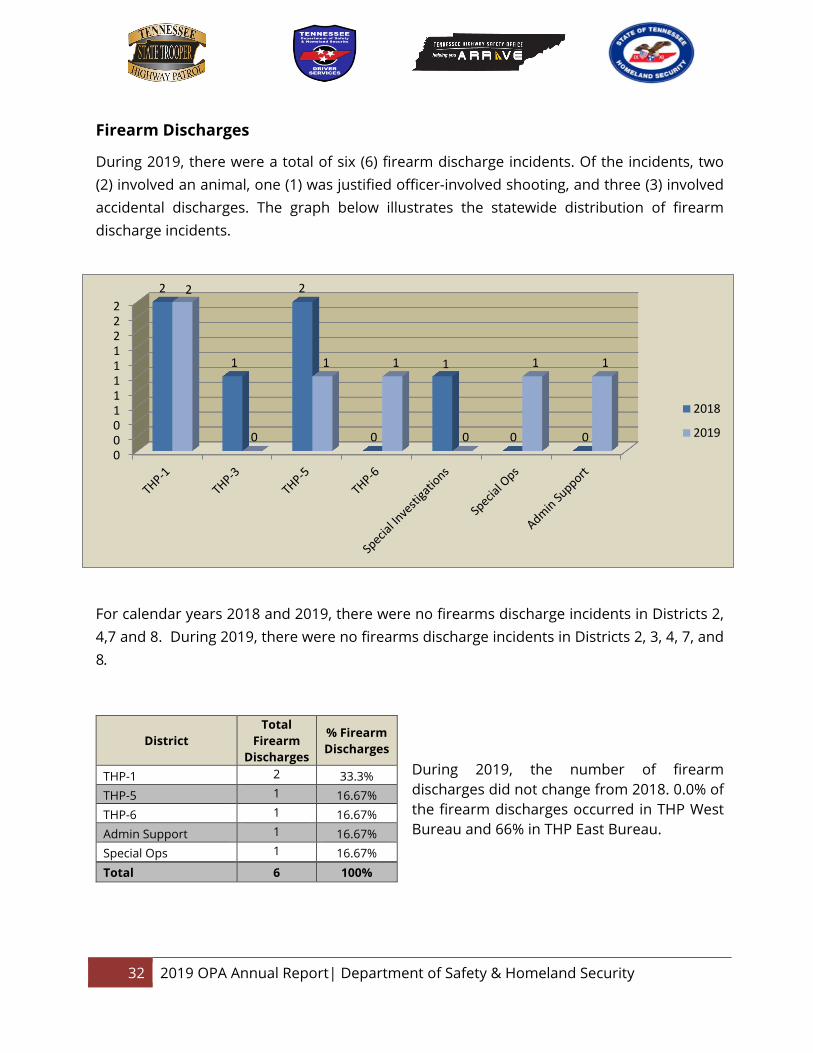
Firearm Discharges
During 2019, there were a total of six (6) firearm discharge incidents. Of the incidents, two (2) involved an animal, one (1) was justified officer-involved shooting, and three (3) involved accidental discharges. The graph below illustrates the statewide distribution of firearm discharge incidents.
For calendar years 2018 and 2019, there were no firearms discharge incidents in Districts 2, 4,7 and 8. During 2019, there were no firearms discharge incidents in Districts 2, 3, 4, 7, and 8.
District Total
Firearm Discharges
% Firearm Discharges
THP-1 2 33.3% THP-5 1 16.67% THP-6 1 16.67% Admin Support 1 16.67% Special Ops 1 16.67% Total 6 100%
During 2019, the number of firearm discharges did not change from 2018. 0.0% of the firearm discharges occurred in THP West Bureau and 66% in THP East Bureau.
00011111222
2
1
2
0
1
0 0
2
0
1 1
0
1 1
2018
2019

33 2019 OPA Annual Report| Department of Safety & Homeland Security
Early Intervention Alerts by District
In 2019, Early Intervention Alerts (90) increased by 57.89% when compared to 2018. Of all Early Intervention Alerts, 75 (83.33%) occurred in the Tennessee Highway Patrol, 3 (3.33%) occurred in Protective Services and 12 (13.33%) in Driver Services.
District Alerts % of Alerts THP-1 10 11.11% THP-2 7 7.78% THP-3 17 18.89% THP-4 18 20.00% THP-5 17 18.89% THP-6 0 0% THP-7 3 3.33% THP-8 3 3.33% Protective Services 3 3.33% Driver Services 12 13.33% Total Alerts 90 100%
THP East Bureau, 34
THP West Bureau, 41
Protective Services, 3
Driver Services, 12

34 2019 OPA Annual Report| Department of Safety & Homeland Security
Workplace Harassment Complaints
In July 2019, the Department entered a Memorandum of Understanding (MOU) with the Tennessee Department of Human resources (DOHR), to investigate Employee Workplace Harassment and Illegal Discrimination allegations. All complaints received by OPA after July 1, 2019, were referred to the DOHR for review/investigation.
During the calendar year of 2019, the Office of Professional Accountability received 25 Workplace Harassment and Illegal Discrimination complaints. This was a 19% increase when compared to the 21 complaints the Department received in 2018. After consulting with the Department’s Legal, Human Resource Divisions, and DOHR, it was determined that all of these complaints met the criteria to be investigated under the Department’s Workplace Harassment and Illegal Discrimination policy or legislation covering bullying. The following data provides the disposition of the complaints received this year:
• Sixteen (16) were categorized as Not Corroborated.
• Nine (9) were categorized as Corroborated and their results are below.
o One (1) Oral Warning o One (1) Oral Warning and respectful workplace training o One (1) written warning and respectful workplace training o One (1) termination o One (1) third party contractor removed from training for Department o Four (4) mandated training requirements