Embed Size (px)
Citation preview
/oo0tSize Distributionof Income 10088A Compilation of Data
Shail Jain /m7
A World Bank Publication
Pub
lic D
iscl
osur
e A
utho
rized
Pub
lic D
iscl
osur
e A
utho
rized
Pub
lic D
iscl
osur
e A
utho
rized
Pub
lic D
iscl
osur
e A
utho
rized
Pub
lic D
iscl
osur
e A
utho
rized
Pub
lic D
iscl
osur
e A
utho
rized
Pub
lic D
iscl
osur
e A
utho
rized
Pub
lic D
iscl
osur
e A
utho
rized

/ I-Aw
Size Distributionof Income


Size Distributionof IncomeA Compilation of Data
Shail Jain
The World BankWashington, D.C. U.S.A.
Copyright 0 1975 byINTERNATIONAL BANK FORRECONSTRUCTION AND DEVELOPMENT1818 H Street, N.W., Washington, D.C. 20433, U.S.A.
All rights reserved
Library of Congress Cataloging in Publication Data:Jain, Shail, 1946-
Size distribution of income.Includes bibliographical references.1. Income distribution. I. Title.
HC79.15J3 339.2 75-34628ISBN 0-916058-07-7
OTHER WORLD BANK BOOKS ABOUT INCOMES
Public Expenditures on Educatiotn and Income Distribution in Colombia byJean-Pierre Jallade, World Bank Staff Occasional Papers no. 18,published by The Johns Hopkins University Press, 1974.
Redistribution wit/h Growth by Hollis Chenery, Montek S. Ahluwalia,C. L. G. Bell, John H. Duloy, and Richard Jolly, published for theWorld Bank by Oxford University Press, 1974.
A System of 'International Comparisons of 'Gross Product and PurchasingPower by Irving B. Kravis, Zoltan Kenessey, Alan Heston, andRobert Summers, published for the World Bank by The JohnsHopkins University Press, 1975.
WORLD BANK RESEARCH PUBLICA TIONS
Economic Analysis of'Projects by Lyn Squire and Herman G. van der Tak,published by The Johns Hopkins University Press, 1976.
The Design of 'Rural Development. Lessons from Africa by Uma Lele,published by The Johns Hopkins University Press, 1975.
Patterns of Development, 1950-1970 by Hollis Chenery and Moises Syr-quin, published by Oxford University Press, 1975.
Economy- Wide Models and Development Planning, edited by Charles R.Blitzer, Peter B. Clark, and Lance Taylor, published by Oxford Uni-versity Press, 1975.
Attacking RuralPoverty: How Nonj/ormal Education Can Help by Philip H.Coombs with Manzoor Ahmed, published by The Johns HopkinsUniversity Press, 1974.
The World Bank Catalog lists all of the Bank's free and sale publica-tions; it is available to any individual or institution with a serious in-terest in economic and social development. To obtain more informationabout Bank publications and to request a copy of the Catalog, contactthe Publications Unit, The World Bank, 1818 H Street, N.W., Wash-ington, D.C. 20433, U.S.A., or the European Office of the World Bank,66, avenue d'lena, 75116 Paris, France.
Foreword
Simon Kuznets, in his pioneering multicountry study ("QuantitativeAspects of Economic Growth of Nations. III: Distribution of Income bySize"), published in 1963, included eleven developing countries amongthe eighteen countries examined. Since then, many more surveys of in-come distribution have been completed and reported upon, and data onthe subject are no longer as sparse as they once were. These data are noteasily accessible to the student of the subject, however, since they ap-pear in a variety of reports, monographs, and articles and are rarely in acomparable format.
This volume presents a large body of data from eighty-one countriesin a format that allows comparisons among the results of various sur-veys. The imperfections of income distribution data, which are outlinedin the introductory section, "The Data: Description and Concepts," ap-ply in full measure to the present collection. There are in no sense anyspecial qualities deriving from the fact that they are published by theWorld Bank. Rather, such data are essential raw material for quantita-tive research on an extremely important topic, and it is in this spirit thatthey are presented. So much importance in fact do we attach to en-couraging research in the areas of poverty and the distribution of in-come, that we have departed from the usual practice of researchers bymaking our assembled data available to others before our own analysesare completed.
This compilation of data was initiated by the late Arthur Tiemann. Itis part of a larger and continuing program of research in the Develop-ment Research Center of the World Bank. Among the principal compo-nents of this program are the following: (a) analysis of survey data tostudy the anatomy of income distribution; (b) generalization of thedualistic model of economic development (modern and traditional) intoa segmented model, with many income and wealth-holding groups andmany sectors; (c) extensive work on formulating and estimating struc-tures and determinants of consumer demand in developing countries,by income class and by occupational, age, and regional groupings; (d)in-depth studies of the incidence of the subsidy content of government
vii
expenditures, by income class; and (e) studies of the mobilization ofsavings among rural poor.
Additional studies will extend analysis to'several other issues, such asthe iniluence of pricing policies on the welfare levels of different in-come classes, the implact of rural-urban migration on income distribu-tion, and the relation of wage and employment levels to the degree ofsegmentation in the labor market.
A part of' the Center's current program-on international com-parisons and analysis of income distribution data in the Latin Americanand Asian regions-is being conducted in collaboration with the U.N.Economic Commission for Latin America and the U.N. Economic andSocial Commission for Asia and the Pacific.
JOHN H. DULOYWashington, D.C. DirectorSeptember 1975 Development Research Center
viii
Contents
The Data: Description and Concepts xiStatistical Tables
Index of Tables and Coverage 3Abbreviations Used 6Tables 7
Sources 123
ix

Acknowledgements
I am grateful to John Duloy and Montek Ahluwalia for their guidanceand support in developing the project. I have benefited from YougeshJain's constant moral support and encouragement. I also wish to thankJean Ponchamni, Pamela Smith, and Yupin Whitehead for typing themanuscript; Julio Kipnis for doing the bibliographical research; andBrian Svikhart lor editing and overseeing production of the book.
SHAIL B. JAIN
x
The Data: Description and Concepts
This compilation of available data on the size Wherever possible, we have attempted to tracedistribution of income in both developing and the original published source of the data.developed countries was undertaken primarilyas a stocktaking exercise to make the data The Income Conceptreadily accessible for further research. It does The absence of both a standard income con-not represent a set of "officially accepted" esti- cept and a set of uniformly applied guidelinesmates of the distribution of income. The ac- for measurement present a major problem incuracy and reliability of income distribution data the study of income distribution. For purposesfrequently suffer from an improperly defined of welfare measurement, the income conceptconcept of income, inconsistent measuring should include both income in cash and incomepractices, and wide variations in the represen- in kind (valued appropriately). It should alsotativeness of sample surveys. Available esti- take account of the net effect of tax subsidymates tend to be, at best, approximations of the operation on disposable income. The incomeunderlying distribution that we wish to measure. concept used in most surveys falls far short ofIn preparing this compilation, our reservations these requirements. Furthermore, many of theabout the accuracy of such data have been data sources used in compiling estimates of in-greatly reinforced. As well, we faced afresh the come distribution reported in this volume dodifficulties of obtaining comparability both not given sufficient information on this subjectacross countries and for the same country over to classify the data according to differences intime. The reader is therefore cautioned that the concepts. Users are therefore urged to see thedata reported in this paper are not in any sense original sources in each case and verify the par-presented as "reliable" or even "best esti- ticular concepts and measurement techniquesmates." Our aim was simply to present a com- used.pilation of available statistical information aspart of an ongoing larger program of work in this Type of Populationarea. Different distribution estimates typically
We have attempted to present all available refer to the distribution of income acrossestimates in a comparable format, reporting in- different population units. In some cases thecome shares accruing to each decile of the popu- distribution data relate to the distribution of in-lation, as well as to the top 5 percent. The tables come among households and in others amongalso report various inequality indexes such as individuals. The coverage of "individuals" it-the Gini coefficient, the Kuznets index, and an self may also vary. Our tables distinguish amongentropy-based inequality index. Sources for six population units for,'which distribution esti-each data set are listed at the end of the book. mates are reported.
xi
Households, in accordance with the U.N. ranked by per capita household income (seedefinition, may refer to either of two concepts. following).One is a single-person household-that is, a per- Households and individuals by per capita house-son who makes provision for his own food or hold income is an income concept obtained byother essentials of living without combining dividing household income by the number ofwith any other person to form part of a multiper- people in the household. This permits two typesson household. The other is a multiperson of distribution to be studied: the distribution ofhousehold, or in other terms a group of two or income among individuals, ranked according tomore persons who occupy the whole or part of per capita household income, and the distribu-one housing unit and make joint provisions for tion of income among households, ranked ac-food or other essentials of living. cording to per capita household income. The
Economically active population usually refers to distinction is important since family size variesthe labor force, the individuals who are able to across households and large household sizework, including both the employed and therefore may not reflect lower levels of incomeunemployed. In developing countries, the eco- per person.nomically active population usually refers tomales 15 years of age and over. In developed Sectoral Breakdown of Coveragecountries this category us 'ually includes both The data reported in this volume are classifiedfemales and males, with the working age defini- by coverage into three broad categories: na-tion varying from country to country. tional, rural or agricultural or both, and urban or
Income Recipient refers to individuals who re- nonagricultural or both. Some data sources pro-ceive income of any kind, including transfer in- vide estimates for only one sector, while otherscomes and social security benefits. give estimates for all three sectoral breakdowns.
Workers is a poorly defined category used in It should be emphasized that no uniform defini-some data sources. It is often not clear whether tions of rural/agricultural and urban/only urban workers are covered and, within that agricultural are followed for all countries.group, whether workers in the informal sectorare included. In general this is an extremely Estimation of Income Sharesrestrictive category, and distribution data basedon such coverage are unlikely to be representa- The data in this book were obtained fromtive of the population as a whole. various sources, and were not directly compara-
Population is also not well defined in most ble in their original form. To ensure com-cases. In some instances-for example, in India parability, these data have been transformedand Pakistan-it corresponds to individuals into estimates of income shares accruing to each
xii
decile of the population. These estimates were der for this purpose.2 Kakwani and Podder showobtained by fitting a Lorenz curve to the ob- that the equation of the Lorenz curveserved data. On a graph, the Lorenz curvedepicts the relation between the cumulative per- a>= r ( - [nd L>0centage of population shares (designated F) on a>0, a>0 and ,3>0,the x-axis and the cumulative percentage of in- where q = (F-F,)/V2 and 7T = (F+F,)/N,come shares (designated F1) on the y- fits well to *most income distributions. Theaxis.' Normally the curve could be obtained by restriction a > 0 implies that the Lorenz curveplotting cumulative shares Fagainst cumulative lies below the egalitarian line and, further, a >shares Fl, although here we have used a mathe- 0 and /3 > 0 ensures that 77 = 0 when 7r = 0matical function proposed by Kakwani and Pod- and also when 7r =N/2 That is, population
shares and income shares are equal at the lowerend (0, 0) and upper end (1, 1) of the Lorenz
I. In many cases the original sources do not report cumulative curve. The curve is symmetric if a = /, andshares Fand Ft but instead report frequency distributions skewed toward (0, 0) if a > ,B and toward (1,across discrete income classes. In these cases, the cumula- 1) if a < ,.tive income shares were obtained by treating the midpoint The parameters a, a, and j3 were obtainedof each income interval as the mean income of individuals from using least squares estimates of the login that class and estimating mean incomes for the open-ended income class at the upper interval by using an esti- form of equation [11, above. With thesemate of the Pareto coefficient. The mean income of the parameters, we have evaluated F1 at variousopen-ended interval was taken as: points on the population density function F
X = x(v/v-l) using equation [1], above. Estimated parameter
where v = (c-d)/(b-a) is an estimate of the Pareto coefli- values and the coefficient of determination cR2)cient: X is the estimated mean of open end interval; X is are reported for each distribution.the lower limit of open end intervalt a is the logarithm oflower limit of interval preceding open-ended interval, b is Measures of Income Inequalitythe logarithm of lower limit of open-ended interval; c is thelogarithm of the sum oi frequencies in open-ended interval It might be helpful to note the ways in whichand preceding interval; and d is the logarithm of frequency the three inequality measures reported in the ta-in open-ended interval. The estimate of the Pareto coetTi- bles were calculated.cient, v, is essentially an approximation based on linear in-terpolation between the open-ended interval and the pre-ceding one. A better procedure is to fit the Pareto functionto several points in the upper interval but this could not be 2.N. C. Kakwani and N. Podder, "Efficient Estimation of the
attempted since the data for many countries is reported Lorenz Curve and Associated Inequality Measures from
with very wide income intervals. Grouped Observations," Econometrica (in press).
xiii
The Gini coefficient is a ratio of (a) the area on of perfect equality to 9.5 in the case of max-a graph that lies between the Lorenz curve and imum inequality. Division by 9.5 is necessary tothe egalitarian line (or line of perfect equality, standardize the measure to a range of zero towhich forms a 45 degree angle with both the x- one.and y-axes) to (b) the area of the entire triangle This gives:formed by the egalitarian line and the x-and y-axes. As a measure of income concentration, dthe Gini coefficient ranges from 0 to 1-the D = 20-__5 20 9.5larger the coefficient, the greater the inequality.Thus 0 represents perfect equality and I repre- where d is the absolute deviation of the incomesents perfect inequality. Here, the Gini coeffi- share of each 5 percentile group from 5 percent.cient was calculated directly from the estimated The standardized E index, an entropy measure,parameters of the Lorenz curve. As derived by can be used as a basis for developing indexes ofKakwani and Podder, the Gini coefficient is inequality. The E index reported in the tablesgiven by follows a suggestion by Marfels, 4 which can be
G = 2 f ai7a (N/2 - 7r)9 d7 written:I+a+1
= 2a(<~) B(l + aY, I + ,3). E* = I - antilog H(y)/n
where B (I + a, I + )3 ) is the Beta functionwhich has been widely tablulated. where H(y) is the entropy measure defined as
The Kuznets index is an alternative measure of follows:income inequality and is computed for the caseof twenty intervals.3 Under perfect equality, H(y) = Zy, log (1/y,)each 5 percentile group would receive 5 percent = - y1 log Yiof the total income. The absolute mean devia-tion of the income share of each 5 percentile where y, are income shares of the ith individual.group from 5 percent is therefore a measure of H(y) is at a maximum when all income sharesinequality. The arithmetic average of the twenty are equal, that is, when y1 = I /n for all i. In thisabsolute deviations ranges from zero in the case case H(y) = log n and the inequality measure E*
= 0. Conversely, H(y) is at a minimum when all
3.See S. Kuznets, 'Quantitative Aspects ol the EconomicGrowth ol' Nations. 11: Industrial Distribution of' National 4.Christian Marfels, "Absolute and Relative Measures ofProduct and Labor Force," Economic Developmrent and Concentration Reconsidered," Kyklos, vol. 24 (1971), fasc.Cultural Cliange. vol. 5 Supplement (July 1957). 4, pp. 753-66.
xiv
income accrues to one individual. In this case simple mean incomes, yet this statistic is impor-
H(y) = 0 and E* = I - I/n. Thus, E* varies tant if we are to evaluate the consistency of
from 0 to 1 - I/n. E* can be standardized by these data with other sources of inlormation on
dividing it by (n - )/n to give an index of in- income levels such as the national accounts.
equality E ranging from zero in the case of max- Ideally, this requires a comparison with per
imum equality to unity in the case of maximum capita personal disposable income, which is, of
inequality. course, considerably less than per capita gross
Sample Means and Gross national product (GNP). Because personal in-National Product Per Capita come estimates for most developing countriesNational Product Per capita are not available, we have instead reported per
The tables also show for each country the capita GNP (market prices) for the country in
sample mean income of the unit-household or the year concerned. The sample mean income
individual-where this information is available. relates to the mean income of the units
In each case, we have reported the estimated an- sampled, which may refer to households or in-
nual income of the unit sampled from the in- come earners and not total population. Thus,
come reported for a particular period.' It will be the GNP figure is only a rough benchmark and
noted that a number of sources did not report not a basis for direct comparison.
5.The annual income estimate is obtained by a simple pro-portional adjustment. Thus, where the simple mean in-
come refers to a reference period of a calendar month, an-
nual income is obtained by multiplying the figure by
twelve.
xv

I

Statistical Tables

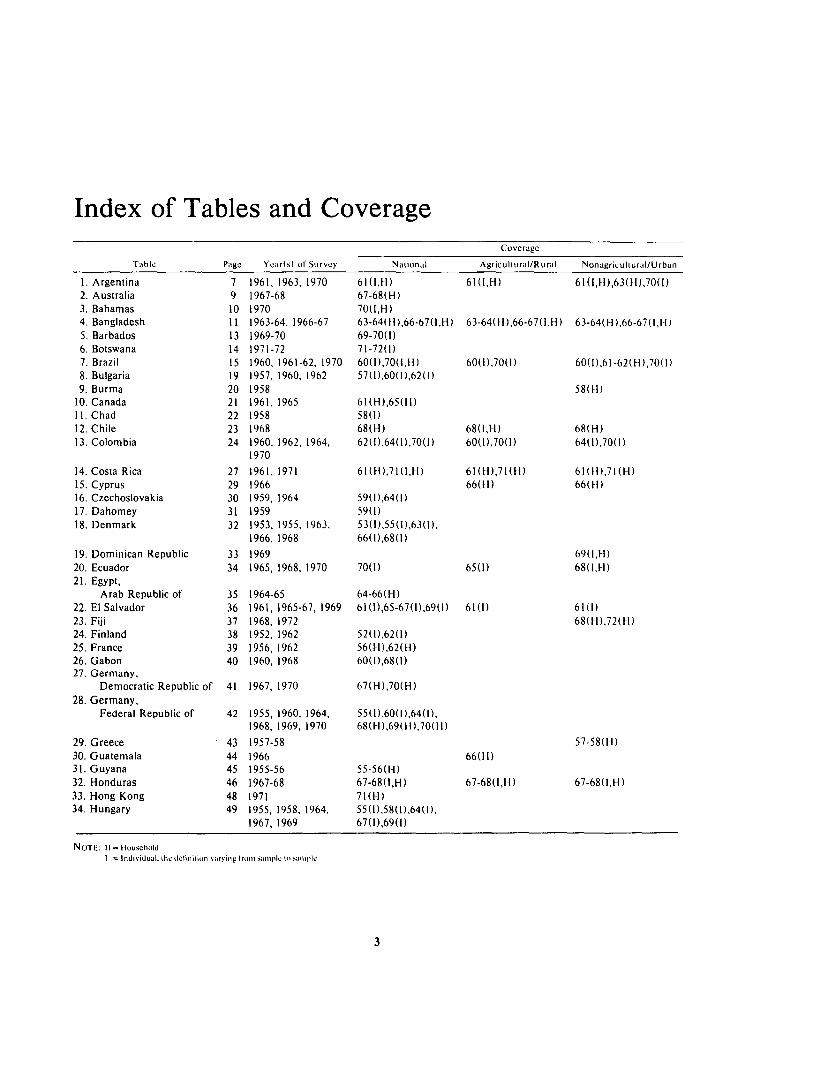
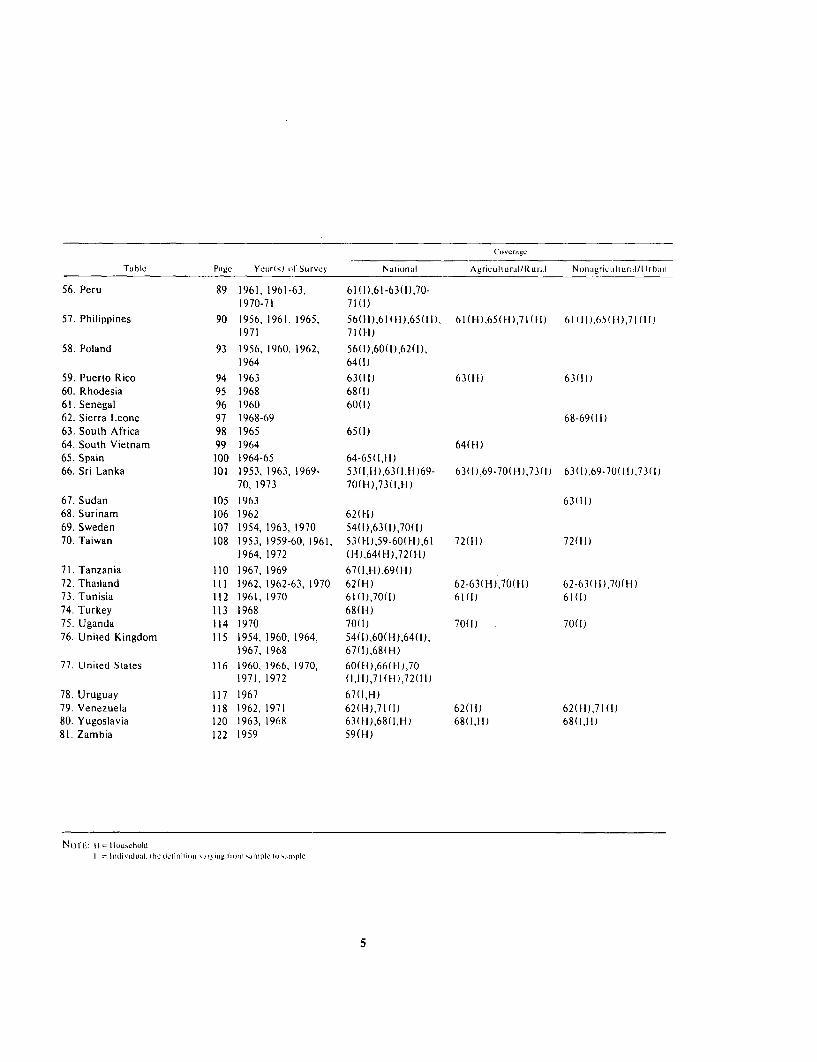
Index of Tables and CoverageCoverage
T;ible Pilge YVersrl ol Survey Naltionall AgriculturaIl/R ural Nonalgriculurial/Urban
I. Argentina 7 1961, 1963, 1970 61(1,H) 61(1,H) 61(0,H),63(H),70(1)
2. Australia 9 1967-68 67-68(H)
3. Bahamas 10 1970 70(1,H)
4. Bangladesh 11 1963-64, 1966-67 63-64(11),66-67(1,H) 63-64(H),66-67(l,FI) 63-64(H),66-67(1,FI-)
5. Barbados 13 1969-70 69-70(l)
6. Botswana 14 1971-72 71-72(l)
7. Brazil 15 1960, 1961-62, 1970 60(1),70(1,H) 60(i),70(1) 60(1),61-62(Hi),70(i)
8. Bulgaria 19 1957, 1960, 1962 57(l),60(l),62(l)
9. Burma 20 1958 58(H)
10. Canada 21 1961, 1965 61((H),65(FI)
11. Chad 22 1958 58(I)
12. Chile 23 1968 68(H) 68(1,HI) 68(H)
13. Colombia 24 1960, 1962, 1964, 62(1),64(1),70(1) 60(1).70(1) 64(l),70(1)
1970
14. Costa Rica 27 1961, 1971 61(H),71(1,H) 61(H),71(H) 61(FI),71(H)
15. Cyprus 29 1966 66(H) 66(H)
16. Czechoslovakia 30 1959, 1964 59(1),64(1)
17. Dahomey 31 1959 59(I)
18. Denmark 32 1953, 1955, 1963, 53(1),55(1),63(1),1966, 1968 66(l),68(l)
19. Dominican Republic 33 1969 69(1,FI)
20. Ecuador 34 1965, 1968, 1970 70(l) 65(l) 68(1,H)
21. Egypt,Arab Republic of 35 1964-65 64-66(H)
22. El Salvador 36 1961, 1965-67, 1969 61(l),65-67(l),69(l) 61(l) 61(1)
23. Fiji 37 1968, 1972 68(H),72(H)
24. Finland 38 1952, 1962 52(l),62(1)
25. France 39 1956, 1962 56(H),62(H)
26. Gabon 40 1960, 1968 60(0),68(l)27. Germany,
Democratic Republic of 41 1967, 1970 67(H),70(H)
28. Germany,Federal Republic of 42 1955, 1960, 1964, 55(1),60(1),64(l),
1968, 1969, 1970 68(F),69(H),70(H)
29. Greece 43 1957-58 57-58(H)
30. Guatemala 44 1966 66(H)
31. Guyana 45 1955-56 55-56(H)
32. Honduras 46 1967-68 67-68(1,H) 67-68(1,H) 67-68(1,HI)
33. Hong Kong 48 1971 71(H)
34. Hungary 49 1955, 1958, 1964, 55(l),58(l),64(l).1967, 1969 67(l),69(l)
NOTi: 11 - ilouscholdI =Individual,the delinitian varying tram Sam5lple filpl3
3
C o c ra,ge
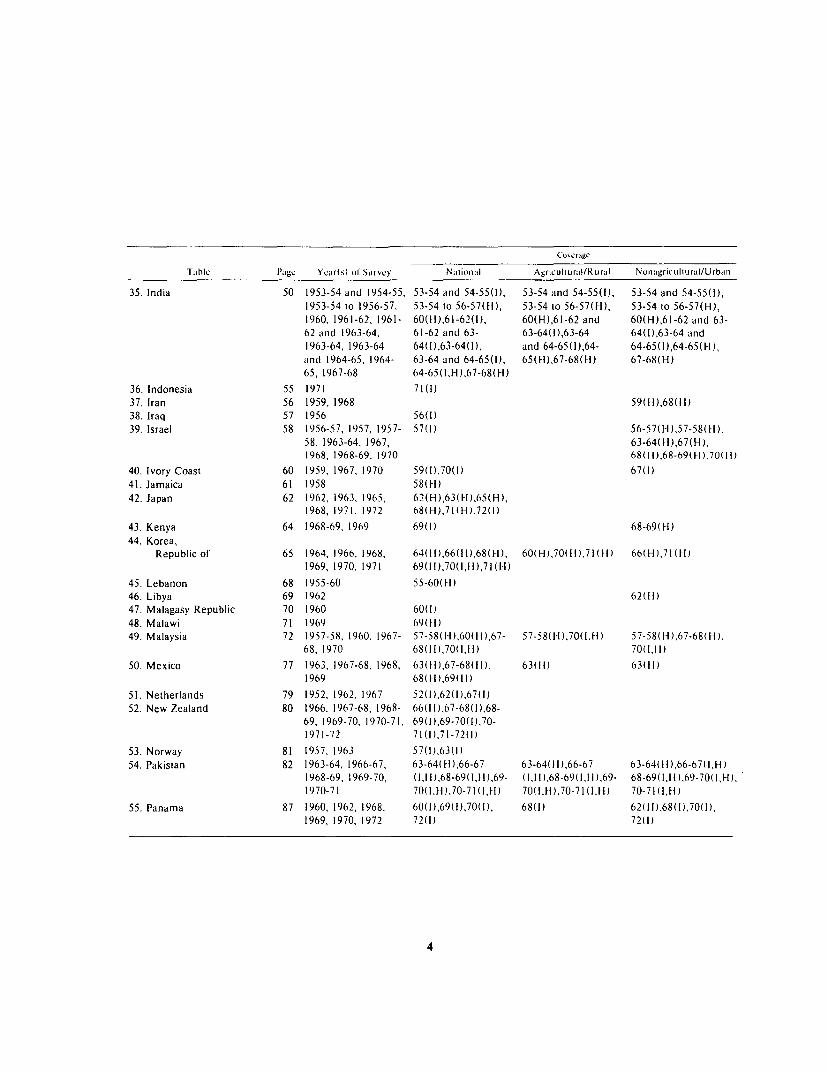
TIable Plage Yearis) ol Survey Nt iontal Agricultural/R Li ra I Noji agr icultural/Urbin
35. India 50 1953-54 and 1954-55, 53-54 and 54-55(I), 53-54 and 54-55(I), 53-54 and 54-55(i),1953-54 to 1956-57, 53-54 to 56-57(H), 53-54 to 56-57(H), 53-54 to 56-57(H),1960, 1961-62, 1961- 60(FI),61-62(1), 60(H),61-62 and 60(H),61-62 and 63-62 and 1963-64, 61-62 and 63- 63-64(1),63-64 64(i),63-64 and1963-64, 1963-64 64(l),63-64(l). and 64-65(l),64- 64-65(l),64-65(FI),and 1964-65, 1964- 63-64 and 64-65(I), 65(l-),67-68(H) 67-68(H)65, 1967-68 64-65(1,H),67-68(H)
36. Indonesia 55 1971 71(I)37. Iran 56 1959, 1968 59(FI),68(FI)38. Iraq 57 1956 56(I)39. Israel 58 1956-57, 1957, 1957- 57(1) 56-57(1I),57-58(FI),
58, 1963-64, 1967, 63-64( H),67(H),1968, 1968-69, 1970 68(H),68-69(1-I),70(/H)
40. Ivory Coast 60 1959, 1967, 1970 59(1),70(1) 67(l)41. Jamaica 61 1958 58(l-)42. Japan 62 1962, 1963, 1965, 62(-I),63(FI),65(H),
1968, 1971, 1972 68(FI),71(H),72(1)43. Kenya 64 1968-69, 1969 69(I) 68-69(11)44. Korea,
Republic of 65 1964, 1966, 1968, 64(H),66(1I),68(H), 60(H),70(H),71(H) 66(1-1,71 (H)1969, 1970, 1971 69(FI),70(l,H),71(H)
45. Lebanon 68 1955-60 55-60(11)46. Libya 69 1962 62(H)47. Malagasy Republic 70 1960 60(1)48. Malawi 71 1969 69(1H)49. Malaysia 72 19S7-58, 1960. 1967- 57-58(1-1),60(1-1),67- 57-58(H),70(1,H) 57-58(H),67-68(FI),
68, 1970 68(F),70(l,HI) 70(1,H)50. Mexico 77 1963, 1967-68, 1968, 63(FI),67-68(FI), 63(H]) 63(H)
1969 68(11),69(fl)SI. Netherlands 79 1952, 1962. 1967 52(1),62(1),67(1)52. New Zealand 80 1966, 1967-68, 1968- 66(FI),67-68(1),68-
69, 1969-70, 1970-71, 69(i),69-70(1),70-1971-72 71(1),71-72(1)
53. Norway 81 1957, 1963 57(1),63(1)54. Pakistan 82 1963-64, 1966-67, 63-64(H-),66-67 63-64(11),66-67 63-64(I1),66-67(1l,I)
1968-69, 1969-70, (I, 1),68-69(1,H),69- (II.1),68-69(1,H),69- 68-69(1,11),69-70(1,1-),1970-71 70(1,11),70-71 ,1H) 70(1,1-),70-71(1.11) 70-71(1,11)
SS. Panama 87 1960, 1962, 1968, 60(i),69(1),70(l), 68(I) 62(11),68(1),70(1),1969, 1970, 1972 72(l) 72(I)
4
r 02 crn gc'
Ttble l';ge Yec;r(sl ol Survcy N atioi dl A gricu uIur.il/Rur.,2 NonaigriC Lur ii I Jrh.i i
56. Peru 89 1961, 1961-63, 61(1),61-63(1),70-1970-71 71(l)
57. Philippines 90 1956, 1961, 1965, 56(i),61 (11),65(11), 61(1),65(1),71M(1) 61(11),65(1),71(11)1971 71(01)
58. Poland 93 1956, 1960, 1962, 56(i),60(i),62(l),1964 64(I)
59. Puerto Rico 94 1963 63(11) 63(1) 63(11)60. Rhodesia 95 1968 68(I)61. Senegal 96 1960 60(I)62. Sierra Leone 97 1968-69 68-69(11)63. South Africa 98 1965 65(1)64. South Vietnam 99 1964 64(11)65. Spain 100 1964-65 64-65(1,F)66. Sri Lanka 101 1953, 1963, 1969- 53(1,11),63(1,11)69- 63(i),69-70(FI),73(1) 63(1),69-70(11,73(1)
70, 1973 70(11),73(1,11)
67. Sudan 105 1963 63(11)68. Surinam 106 1962 62(Hl)69. Sweden 107 1954, 1963, 1970 54(i),63(l),70(i)70. Taiwan 108 1953, 1959-60, 1961, 53(FI),59-60(1I),61 72(H) 72(11)
1964, 1972 (H),64(F),72(FI)
71. Tanzania 110 1967, 1969 67(1,H),69(I-)72. Thailand 111 1962, 1962-63, 1970 62(H) 62-63(H),70(11) 62-63(11),70(M)73. Tunisia 112 1961, 1970 61(1),70(1) 61(I) 61(1)74. Turkey 113 1968 68(11)75. Uganda 114 1970 70(l) 70(l) 70(I)76. United Kingdom 115 1954, 1960, 1964, 54(l),60(H),64(1),
1967, 1968 67(1),68(H)77. United States 116 1960, 1966, 1970, 60(1-),66(FI),70
1971, 1972 (I,H),71(H),72(H)
78. Uruguay 117 1967 67(1,H)79. Venezuela 118 1962, 1971 62(H),71(1) 62(H) 62(H),71(1)80. Yugoslavia 120 1963, 1968 63(FI),68(1,H) 68(1,H) 68(1,11)81. Zambia 122 1959 59(H)
NOTI: H = llou,choldI = Ir(fiVIduflW. he deliiiiin'.0g fro l 51 mpni Ole 10 dmpIlc
5

Abbreviations Used
Population
HH HouseholdIR Income Recipient
EAP Economically Active PopulationWRK Workers
POP PopulationPC Per Capita
PCH Per Capita Household
Coverage
NL NationalURB Urban
NAG NonagriculturalRRL Rural
AG Agricultural
6

Table 1. Argentina
SOURCE 1 1 2 3 4 1YEAR 61 61 61 61 63 61POPULATION IR HH IR HH HH IRCOVFRAGE NL NL NAG NAG URB AG
PERCENT OFPOPULATION PERCENT OF INCOME
0"10 1,8 3,1 job 3,2 2,8 2.110.20 3.3 3.8 3,4 4,0 4.0 3,120-30 4.3 4.5 4t,5S 4,7 5.0 3,730.40 5,0 5,2 5,3 5,5 5,8 4.540-50 6,0 6,1 6,3 6,4 6,9 5.350.60 7,1 7,2 7,4 7,4 8.1 6,460.70 B4 8,6 8,6 8,7 908 7,670.80 10,2 10.6 10,4 0l,7 11,9 9,580.90 13,2 13.9 13,2 13,8 15,6 12,690"100 40,7 37.0 39,3 35,6 30,1 45,2
95.100 32,0 27,5 30,8 2b,4 19,8 36,8
SIATISTICS OF INTFREST
A 94026 93952 93771 .3714 93549 ,4559ALPHA ,8575 ,9b43 ,8089 ,9427 ,9050 ,9329bETA 96480 ,7298 ,6159 ,7076 ,8138 ,6662R-SQUARE *9997 ,9930 ,9996 ,9941 ,9997 ,9941
GINI COEFF, ,4895 ,4375 ,4772 ,4204 ,3849 95311KULNETS INDEX .3611 ,3316 ,3463 ,3168 .2916 ,3979t-ENTROPY .3979 .3277 ,3807 ,30b4 .2370 ,4626
MEAN INCOME 92,140 CA) N.A, N.A. N.A. 78t620CPES OS)
GNP PER CAPITA 58,860 58,8b0 58,860 58,860 88,515 58,860(PESOS)
(A) USS2500
7
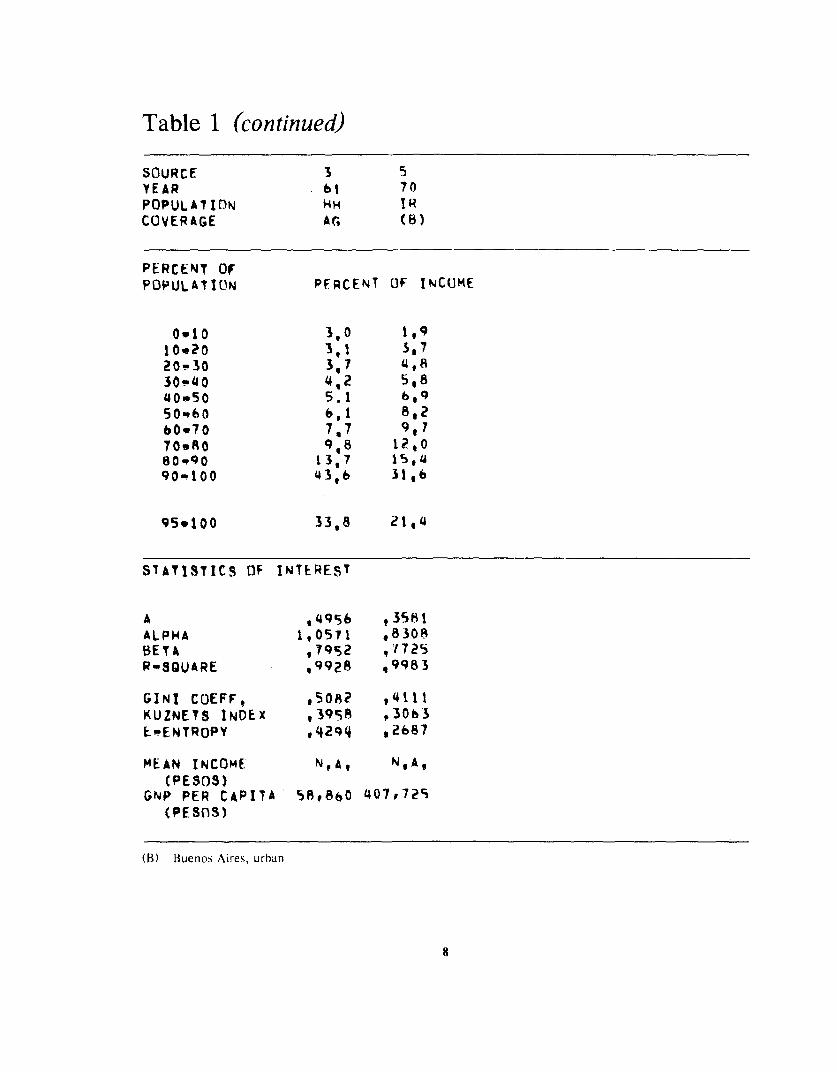
Table 1 (continued)
SOURCE 3 SYEAR 61 70POPULATION HH TRCOVERAGE AG, (B)
PERCENT OFPOPULATION PFRCENT OF INCUME
0.o0 3,0 1,9
100?0 3,1 3,720-30 3,7 4,8
30-40 4,2 5,800.50 5.1 6,950w60 6,1 8,2
60.70 7,7 9,g70-R0q 9,8 12,080O90 13,7 15,490-100 43,6 31,6
95.100 33,8 21,4
STATISTICS OF INTEREST
A , 4956 93581
ALPHA 1, 0571 ,8308BETA ,7952 ,1725R-SQUARE ,9928 e9983
GINT COEFFe .5082 ,4111KUZNETS INDEX ,39%8 ,30b3
E"ENTROPY ,42zq ,2687
MEAN INCOME N,A, N,A,
(PESOS)GNP PER CAPITA 58.860 407,729i
(PESOS)
B) Buenos Aires, urban
8

Table 2. Australia
SOURCE IYEAR 67-6bPOPULATION HHCOVERAGE NL
PERCENT OFPOPULATION PERCFNT (OF INCOME
0w10o 2,41 0-20 4.720-30 5,930'4 0 7.040.50 8,250-60 9,460W70 10,870-80 12,780sa90 15,490.100 23,5
95-100 14,1
STATISTICS OF INTEREST
A ,2743ALPHA ,7628bETA 28176R.SQUARE ,9977
GINI COEFF, ,3185KUZNETS INDEX 235MEPENTROPY 1610°
MEAN INCOME 15,650(AUSTRALIAN $)
GNP PER CAPITA 1*935(AUSTRALIAN $)
9

Table 3. Bahamas
SOURCE 1 2YEAR 70 70POPULATION IR HHCUVERAGE NL NL
PERCENT OFPOPULATION PERCENT OF INCOME
Owl o , 9 ! 810.20 2,7 2,620'30 3,7 3,830- 0 4,9 51040-50 b61 6,350-60 7, 7 8,060-70 9,4 10,070-80 12,2 12,980.90 16,5 17,790-100 35,9 32,9
95"100 24,4 20,7
STATISTICS OF INTFREAST
A ,q398 ,4381ALPHA ,8462 ,8420BETA ,84P6 ,9080R-SQUARE 0 994 *?980
GIN! COEFF, ,4835 ,4h74KUZNETS INDEX ,3642 ,3558E%ENTROPY ,3537 ,3263
MEAN INCOME Us400 N,A,(BAHAMAS $)
GNP PER CAPITA 2.375 2,375(BAHAMAS $)
10
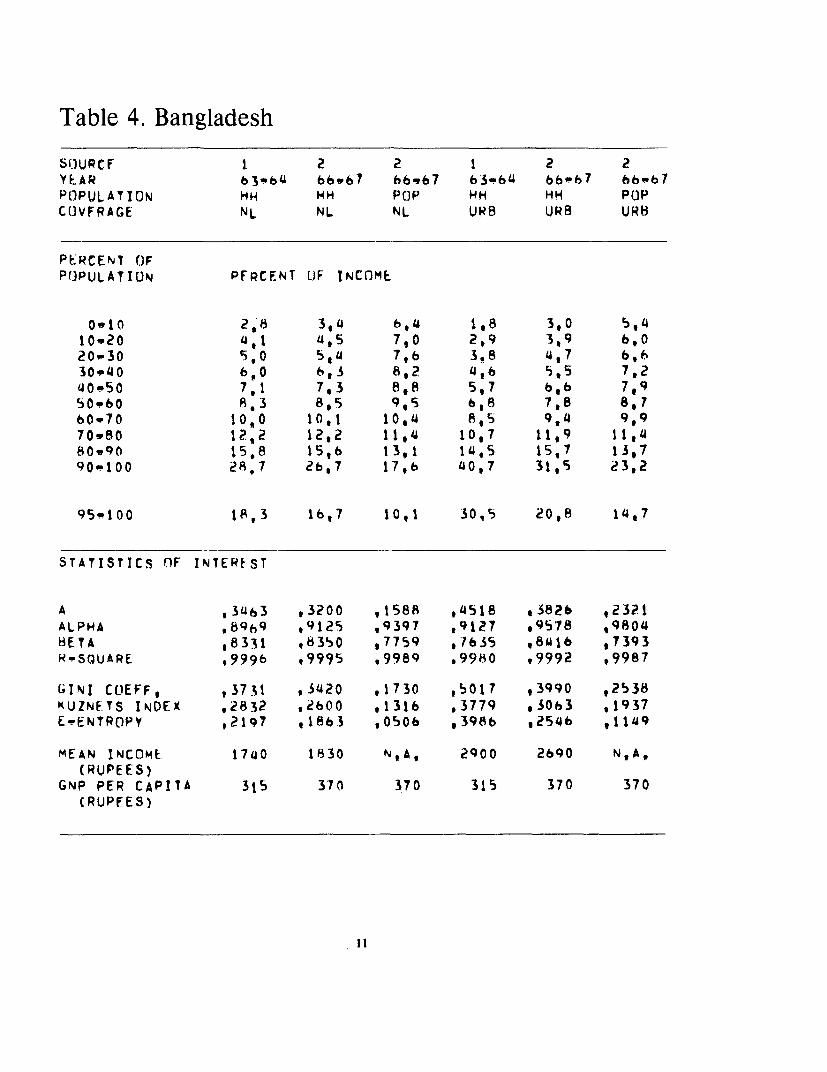
Table 4. Bangladesh
SOURCE 1 2 2 1 2 2YEAR 63"64 b bb6b7 b66v7 63-64 b66-67 b-bb7
POPULATION HH POP HH HH POPCOVFRAGE NL NL NL URB URB URB
PERCENT OFPOPLIL AT ION PERCENT OF INCOME
0.10 2,8 3,4 b,4 1,8 3,0 5,410.20 4,1 4,5 7,0 2,9 319 6,020.30 5,0 51*4 7,b 3.8 4,7 6,630.40 6,0 6,3 8,2 4,6 5,5 7,240-50 7,1 7,3 8,8 5,7 b,b 7,950p6O 8,3 8,5 9,5 6,8 7,8 8, 760.70 lO1O 10,1 10,4 8,5 9,4 9,970.80 12,2 12,2 11,'4 10,7 11,9 111480.q90 15,8 15,6 13,1 14,5 1S,7 13,790p100 28,7 2b,7 17,6 40,7 31,5 23,2
95-100 18,3 16t7 10,1 30,5 20,8 14,7
STATISTICS OF INTEREST
A ,34b3 93200 ,1588 ,4518 o3826 ,2321ALPHA ,8%h9 ,9125 99397 ,9127 ,9578 ,9804BETA ,8331 ,8350 ,7759 , ?635 ,8416 ,7393W-SQUARE ,999b ,9995 ,9989 ,9980 ,9992 ,9987
GINI COEFF, ,3731 ,3420 ,1730 ,5017 ,3990 ,2538KUZNFTS INDEX ,2832 ,2800 ,1316 .3779 ,30h3 ,1937E.ENTROPY ,2197 ,1863 ,0506 ,3986 ,2546 11149
MEAN INCOME 17i40 1830 N,A, 2900 2690 N,A,(RUPEES)
GNP PER CAPITA 315 370 370 315 370 370(RUPEES)

Table 4 (continued)
SOURCE 1 2 2YEAR 63-6 4 b66hth7 6bb67POPULATION HH HH PoPCOVERAGE RRL "RL RRL
PERCFNT nFPOPULATION PERCENT OF INCOME
0-10 3, '4 3,5 h,510w20 4,'4 4.6 7,?20-30 5,? 5,5 7,630-40 6,2 b,3 8,340.50 7,1 7,'4 8,950-60 8,14 8,6 9,660.70 100 10,,2 10,570.80 1?,2 12,2 11,580-90 15,7 15th 13,290.100 27.4 2h,1 16.7
95100 1 7,2 lb, 1 9! 3
STATISTICS OF INTEREST
A , 3341 .31O , 1563ALPHA ,9 3S9 .9239 ,9631BETA ,8481 ,8'4 b ,8297R-SQUARE ,9991 .9995 ,9987
GINI COEfF, 93508 t3339 91b36KUZNETS INDEX ,2684 ,2547 v1253E.ENTROPY ,1961 ,1774 .0439
MEAN INCOtME 1680 1800 N,A,(RUPEES)
GNP PER CAPITA 315 370 370(RUPEES)
12
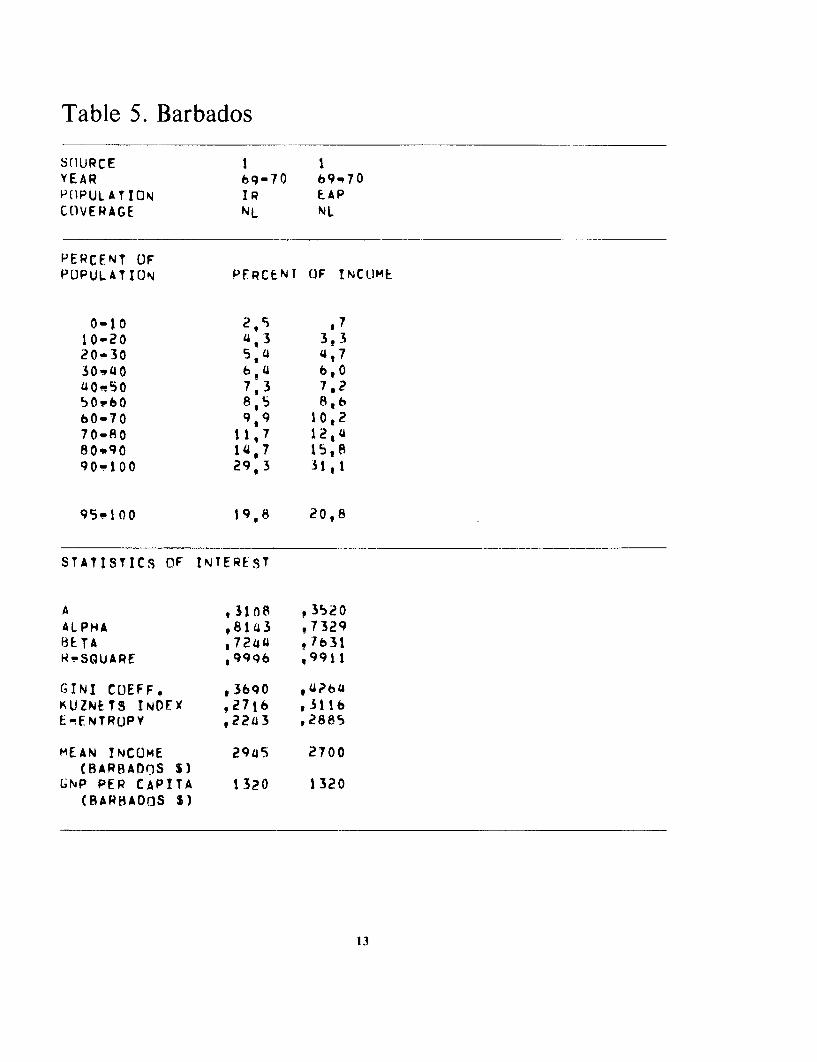
Table 5. Barbados
SC1URCE I 1YEAR h9-70 b9w70P(OPULATION IR EAPCO1VERAGE NL NL
PERCENT OFPOPULATION PFRCENT (IF INCOIME
0-10 2,5 ,710-20 4'3 39320-30 5,4 4U730-W40 6 1U 6,0u0iq50 7, 3 7,250-60 8,5 8,660-70 9,9 10,270-80 11,7 12,480W90 14,7 15,890-100 29,3 31,1
95q100 19,8 20,8
STATISTICS OF INTEREST
A , 31 n 8 3520ALPHA ,8143 973298E TA , 7244 . 7631R-SQUARE ,9996 ,9911
GINI CL1EFF, ,3690 ,U?64KUZNETS INDFXT ,27j6 ,3116E-ENTROPY ,22u3 ,2885
MEAN INCOME 2945 2700(BARBADOS S)
GNP PER CAPITA 1320 1320(BARBADOS S)
13

Table 6. Botswana
SOURCE IYE AR 7 I 72POPULATION FAAPCOVERAGE NL
PERCENT OF*PLIPULATION PERCENT OF INCOME
10"20 1*1420.30 2,S30.40 3,540SO 4u, 950-60 6b460V70 8,870P80 12,080W90 18,290. I 00 4?,1
95.100 28,1
STATISTICS OF INTEREST
A ,5745ALPHA ,9 121BETA ,w703R"SQUARE , 99#o
GINI CEFF, ,5740KUZNETS INDEX , a53E-ENTRUPY ,4648
MEAN INCOME 210(RAND)
GNP PER CAPITA 125(RAND)
14

Table 7. Brazil
SOURCE 1 2 3 . S 6
YEAR 60 60 bO 60 70 70POPULATION IQ EAP EAP EAP IR (C)
COVERAGE NL NL N L NL NL NL
PERCENT OFPOPULATION PERCENT OF INCOME
0-10 1,2 19 0,0 11 1,1 1,110-20 2,3 2,0 ,8 2,6 1,7 2,320.30 3,0 2,5 2,3 3,6 2,3 3,1
30"40 3,8 3,0 3,4 4 ,6 3.0 4,240.s0 4,8 3,8 4,8 5.8 3,9 5,450-60 5,9 4t7 6,3 7.1 5b1 6,86 070 7,4 6,1 8,5 9,0 6,b6 8,8
70.80 9,5 8,0 11,7 11,5 9,0 11,6
80.90 13,0 11,2 17,2 15,8 13,0 1b,790.1tO 49,1 56,8 45,0 38,9 S4,3 40,0
951 O0 39,4 48,8 31,9 27,1 544 ,8 27,7
STATISTICS OF INTERFST
A ,5?57 ,b198 5S747 ,4593 96228 ,5077ALPHA ,9289 1,0454 ,8b54 ,8729 ,9960 ,9225BETA ,7334 ,t538 ,9148 ,8179 ,8188 o8920R-SQUARE 1,0000 ,9998 ,9995 ,9992 ,9985 ,9988
GINI COEFF, ,5896 wb544 ,6038 ,504b ,64h5 ,5244KUZNETS INDEX ,4442 ,5053 ,4621 ,3811 ,4979 ,4032E-ENTROPY .5274 ,6283 ,5113 ,3881 96013 ,4073
MEAN INCOME (A) N,A, (B) 2470 N,A, 3785(N,CRUZEIRnS)
GNP PER CAPITA 410 40 40 40 1790 1790(N,CRUZFIRCIS)
(A) USS840(B) USSSI0(C) Salaried employees
15

Table 7 (continued)
SOURCE 3 4 4 7 1 2YEAR 70 70 70 70 60 60POPULATION FAP EAP HH HH IR LAPCOVERAGE NL NI NL NL NAG NAG
PERCENT OFPOPULATION PFRCENT OF' INCOME
0.10 0,0 1,1 1,2 ,9 ,9 1,210.20 1,1 2,1 1,8 1,5 2,1 1,820-30 2,0 2,8 2,7 2,2 3,0 2,530.40 2,9 3,8 3.5 3,1 3,7 3t040-50 44,2 4,7 4,6 4,2 4,8 3,9SO-bO 9,6 6,1 60 5,6 5,9 4 760-70 7,S 7,8 7,9 7,5 7,4a h,070-80 10,5 10,2 10,8 10,5 9,6 7,680"90 15,9 14,7 16,O 15,9 11,0 10,490-100 50,3 46,7 45,5 48,6 49,6 58,9
95100 38,1 36,0 333,3 3h,0 40,5 51,9
STATISTICS OF INTEREST
A ,6290 ,543A8 .5765 ,6224 ,5261 ,5991ALPHA ,9211 ,942l ,9782 ,9882 ,9034 ,9686BETA ,9075 ,8224 ,9106 ,9360 ,7233 jb6P7k.SQUARE ,9982 ,9993 ,9996 ,9994 ,9991 ,9998
GINI COEFF, ,h6409 v5770 ,5744 ,6093 ,6001 ,6895KUZNETS INDEX ,4937 ,'u441 ,4463 ,4758 94495 ,5211t-ENTRt)PY ,%708 ,4967 ,4823 ,5292 ,5395 ,6b24
MEAN INCOME 3100 3385 5005 5335 N,A, N,A,(N,CRUZEIROS)
GNP PFR CAPITA 1790 1790 1790 1790 40 440(N,CRUZFIROS)
16
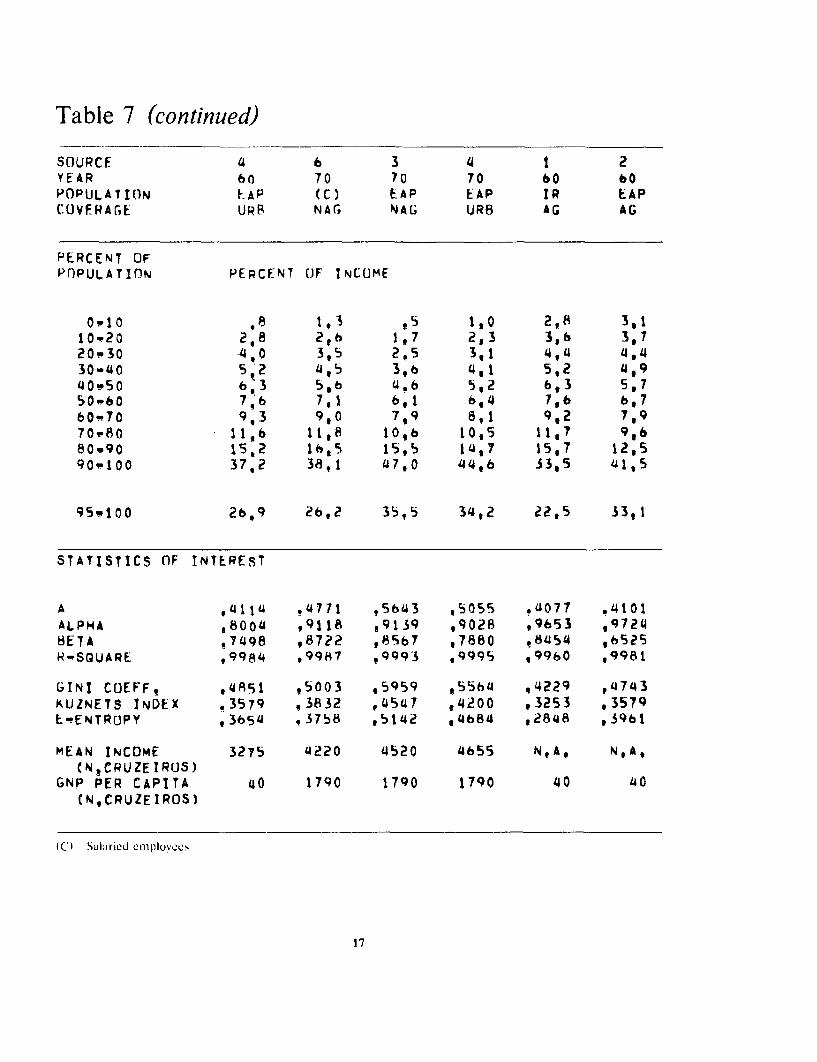
Table 7 (continued)
SOURCE 4 6 3 4 1 2YEAR 60 70 70 70 60 60POPULATION EAP (C) EAP LAP IR EAPCOVERAGE URS NAG NAG URB AG AG
PERCENT OFPOPULATION PERCENT (OF INCUME
010 ,8 193 .5 1,0 2,8 3,110w20 2,8 2,h 1,7 2,3 3,6 3,720-30 4, 0 3,5 2,5 3,1 4,4 4,430-40 5,2 4,5 3,6 4,1 5,2 4,940P50 6 3 5S,6 4.6 5,2 b,3 5,750-O0 716 7,1 6,1 6,4 7,6 b,7b0 70 9,3 9,0 7,9 Bet 9,2 7,970,"80 11,6 11,8 10,6 10,5 11,7 9,680,90 15,2 1625 15,5 14,7 15,7 12,590w100 37,2 38 ,1 47,0 44,6 33,5 41,5
95t100 26,9 2b,2 35,5 34,2 22,5 33, 1
STATISTICs nF INTEREST
A ,411u ,4771 ,5643 ,S055 t4077 .4101ALPHA o8004 t9118 ,9139 ,9028 ,9653 t9724BETA ,7498 ,87?2 ,8567 ,7880 ,8454 ,6525R-SQUARE ,9984 ,9987 ,9993 ,q9995 ,9960 ,9981
GINI COEFF, ,4891 ,5003 ,5959 155h4 ,4229 ,4743KUZNETS INDEX *3579 13832 94547 4200 ,3253 ,3579L-ENTROPY ,3654 ,3758 ,51B ,4b84 ,2848 ,3961
MEAN INCOME 3275 4220 4520 4655 N,A, N,A,(N,CRUZE IRUS)
GNP PER CAPITA 40 1790 1790 1790 40 40(N,CRUZEIROS)
(C) Salaried cmiplovees
17

Table 7 (continued)
SOURCE 4 6 3 4YEAR 6O 70 70 70POPULATION EAP (C) EAP EAPCOVERAGE RPL AG AG RRL
P.RCENT OFPOPULATION PERCENT 1)F INCL1MF
0.10 1,9 1,3 0,0 2,010.20 314 3,7 ,2 3,b20,30 4,5 5,1 2,7 4,1430w40 5,5 6,3 4,1 5,440-50 6,6 7,6 5,5 61450-60 7,9 9,1 7,2 7,660.70 9,6 10,8 9,4 9,070.80 11,9 13,0 12,3 11,080W90 15,6 16,4 17,2 14,390-100 33,1 26,7 41,4 36,3
95-100 22b6 16,3 29.1 26,7
STATISTICS OF INTERE-ST
A ,384? .3318 ,50614 ,3816AL.PHA ,8596 ,7620 ,7644 .8571BETA ,7940 ,8473 ,8519 ,7087R-SQUAQE 99qg3 '9999 9963 '9994
(;INI COEFF, ,4302 ,3800 ,5780 ,141480KUZNETS INDEX ,3221 v28S2 ,14305 ,3326E-ENTROPY ,2916 ,.2270 ,4768 ,3299
MEAN INCOME 1450 1080 1280 1655(N,CRUZEIROS)
GNP PER CAPITA 140 1790 1790 1790(N,CRUZEIROS)
(C) SalariCed cmrployccs
18
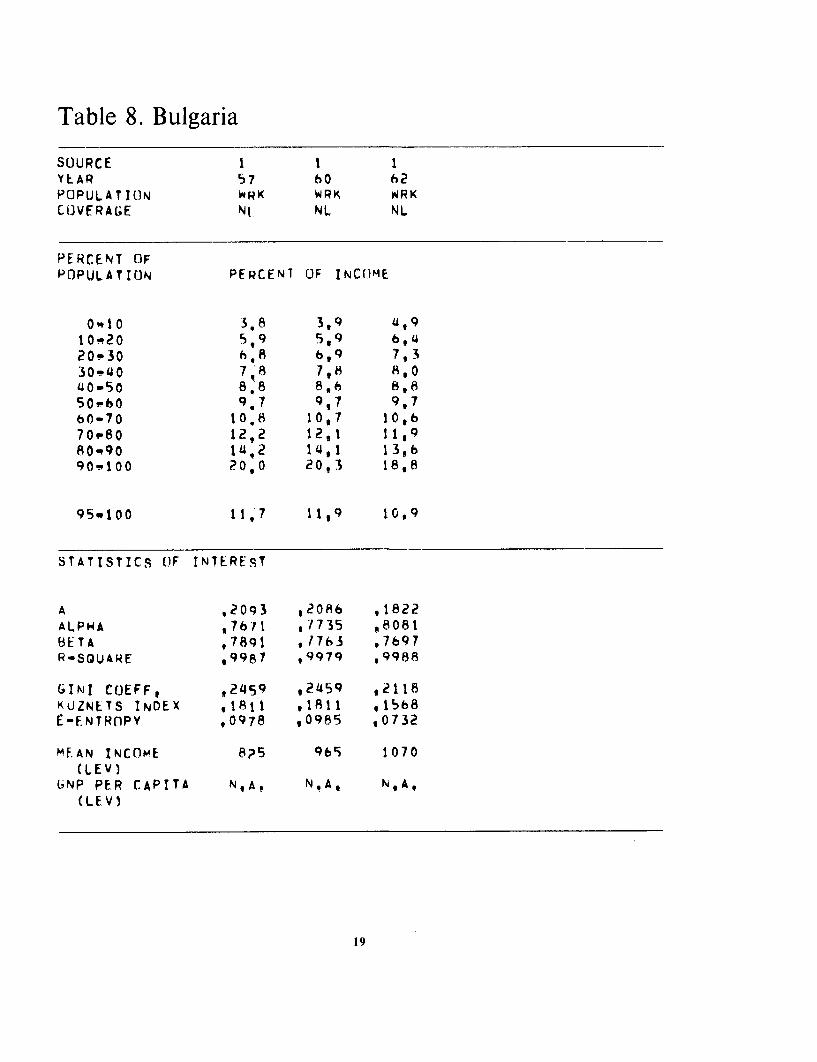
Table 8. Bulgaria
SOURCE 1 1 1YEAR 57 60 62POPULATION wRK WRK WRKCOVFRAGE NI NL NL
PERCENT OFPOPULATION PERCENT OJF INCOME
0"10 3,8 3,9 4,910w20 5 9 5,9 69420-30 6h*8 6,9 7,330-40 78 71,8 8,040-S0 8,8 8,6 8,850wbO 9.7 9,7 9,76O-70 10.8 10,7 10,670P80 12,2 12,1 11,980q90 14.2 14,1 13,690100 20,0 20,3 18,8
95q100 11,7 11,9 10,9
STATISTICS OF INTEREqT
A ,2093 ,2086 ,1822ALPHA ,7671 ,1735 ,8081BETA ,7891 ,/763 ,7697R-SQUARE ,9987 ,9979 ,9988
GINI COEFFt 92459 ,2459 ,2118KUZNETS INDEX ,1811 ,1811 .16b8E-ENTROPY ,0978 ,0985 ,0732
MFAN INCnmE 8?5 969 1070(LEV)
6NP PER CAPITA N,A, N.A, N,A.(LEV)
19

Table 9. Burma
snURCE lYEAR 58POPULATION HHCOVFRAGE (A)
PERCENT OFPOPULATInN PERCENT OF INCOJME
0"10 2910'm20 3,620.30 4.530-40 5,540-50 6b75060 8 3bO-70 10,'470-R0 13,48090 18,1I90-100 26,6
95,100 14 ,b
STATISTICS OF INTEREST
A ,4077ALPHA , 9278 TA jI,02R1R-SQUARE ,9999
GINI CnEFF, ,3806KUZNETS INDEX ,3011E-ENTRnPy g21h 3
MEAN INCOME 31S5t K V A T S )
GNP PER CAPITA 270(KYATS)
(A) Riangoon. urban
20
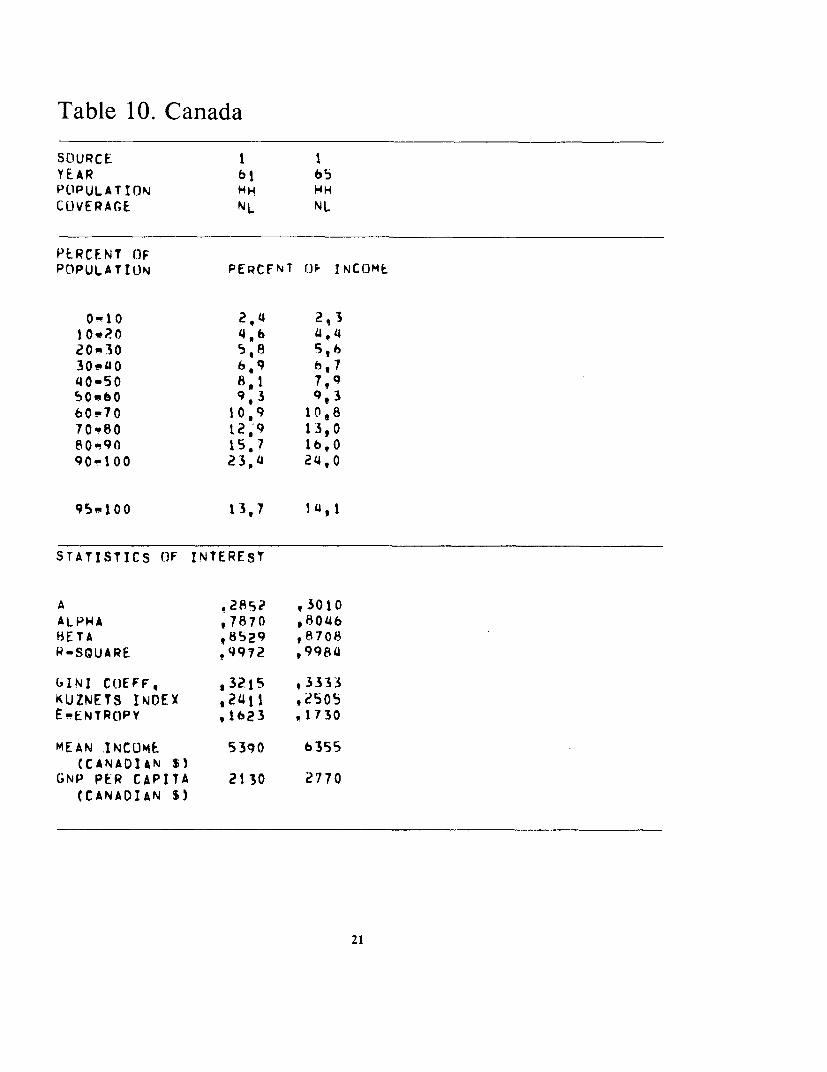
Table 10. Canada
SOURCE I IYEAR 61 65POPULATION HP HCOVERAGE NL NL
PERCENT OFPOIPULATION PERCENT OP INCOME
0-10 29 4 2,3l0e20 4 ,6 4.4201'30 5,8 5,630.'40 6,9 6,740-50 8,1 7,950e60 9 3 9,360-70 10,9 10,870-80 12,9 13,080-90 15.7 16,090-100 23,4 24,0
95P100 13,7 14,1
STATISTICS OF INTEREST
A .2852 ,3010ALPHA ,7870 98046BETA ,8529 ,8708R-SOUARE P9972 ,9984
(INI COEFF, .3215 93333KUZNETS INDEX ,2411 .Z505E-ENTROPY ,1623 ,1730
MEAN INCOME 5390 6355(CANADIN S)
GNP PER CAPITA 2130 2770(CANADIAN S)
21
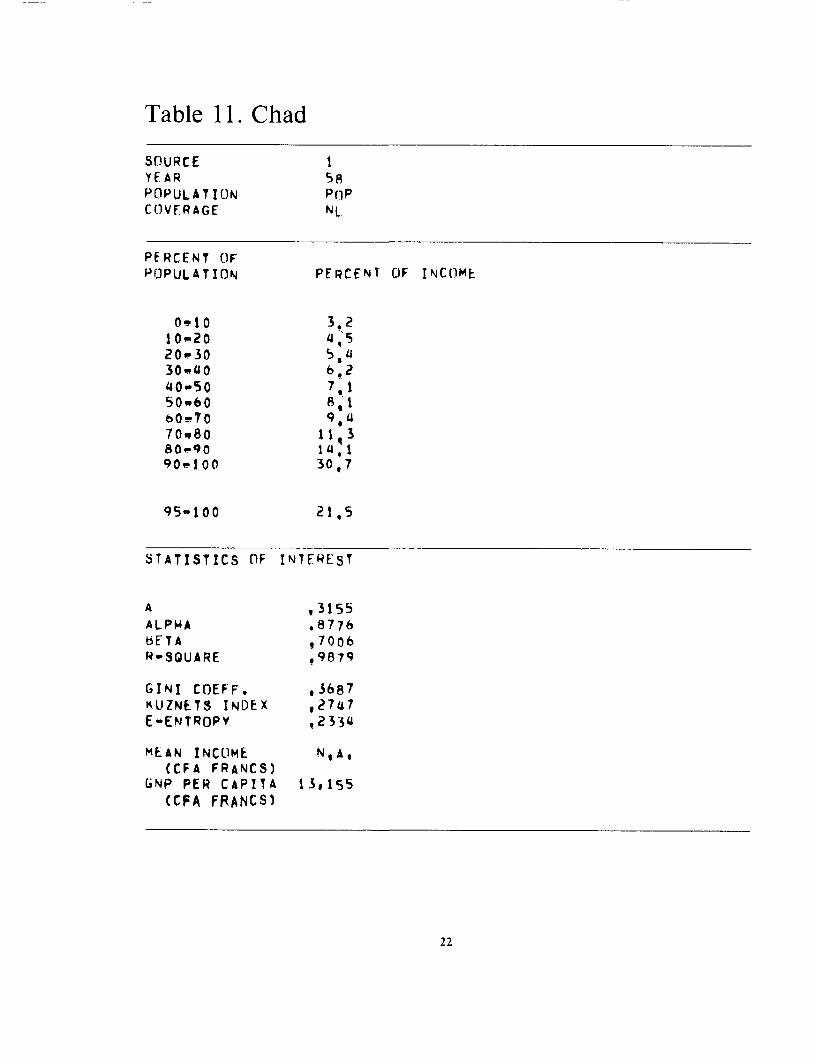
Table 11. Chad
SOURCE IYEAR 58POPULATION PO PCOVFRAGE NL
PERCENT OFPOPULATION PERCENT OF INCOME
010 3.210-2020.30 5,430'F40 6.240.50 7, 150.60 86* 1bO.70 q, *70.80 380.9090X100 30,7
95-100 21t 5
STATISTICS OF INTEREST
A ,3155ALPHA ,8776bETA ,7006R-SGUARE ,9879
GINI COEFF. ,3b67KUZNETS INDEX t2747E-ENTROPY ,2334
MEAN INCOME NAt,(CFA FRANCS)
6NP PER CAPITA 13s155(CFA FRANCS)
22
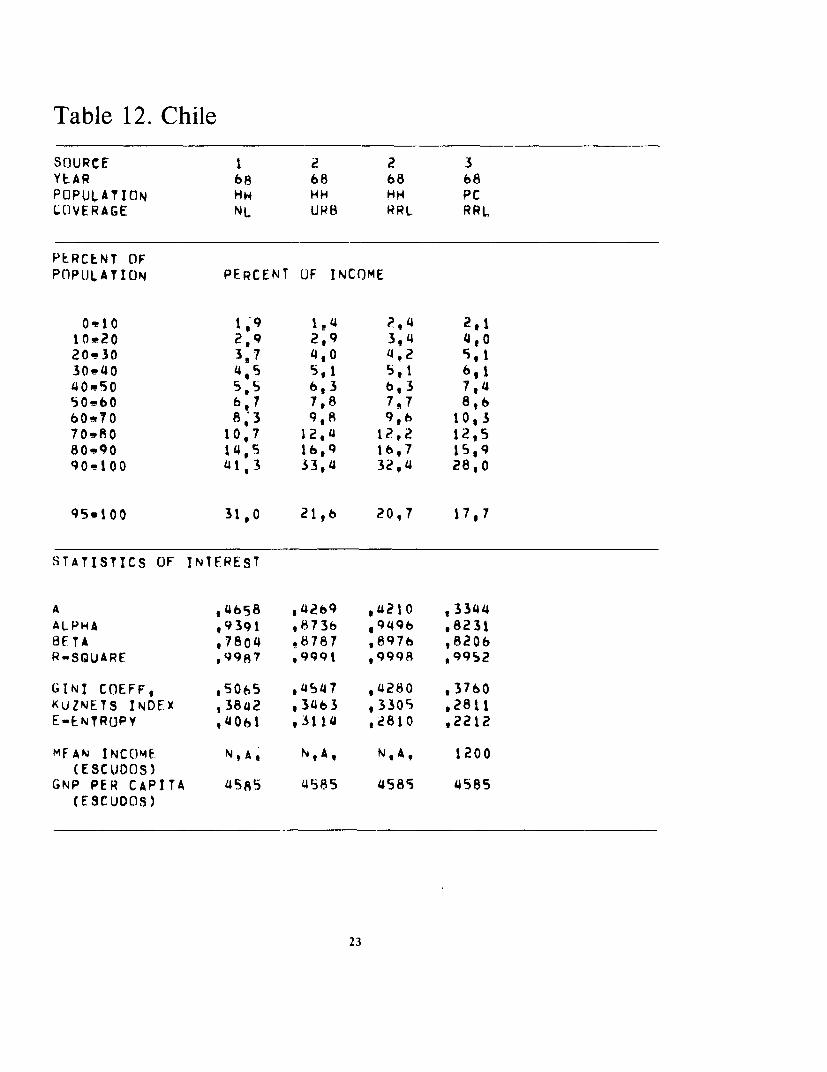
Table 12. Chile
SOURCE I 2 2 3YEAR 68 68 68 68POPULATION HH HH HH PCCOVFRAGE NL URB RRL RRL
PERCENT OFPOPULATION PERCENT OF INCOME
0.10 -'1,9 14 P4 2,110w20 2,9 2,9 394 4,020.30 3,7 4,0 4,2 S,130.40 4,S 5,1 5,1 6,140.50 5,5 6,3 b,3 7,450.60 b,7 7,8 7,7 8,660"70 8,3 9,8 9,6 10,370-80 10,7 12,4 12,2 12,580,90 14,5 16,Q 1b,7 15,990-100 '41,3 33,4 32,4 28,0
95-100 31,0 21,6 20,7 17,7
STATISTICS OF INTEREST
A ,4b58 ,4269 ,4210 ,3344ALPHA ,9391 ,8736 ,9496 .8231BETA 97804 ,8787 ,897h ,8206R-SQUARE ,9987 '9991 ,9998 ,9952
GINI COEFF, ,5065 94547 ,4280 ,3760KUZNETS INDEX ,3842 ,3463 ,3305 ,2811E-ENTROPY ,4061 ,3114 ,2810 ,2212
MFAN INCOME N,A, N,A, N,A, 1200(ESCUDOS)
GNP PER CAPITA 4S85 4585 4585 4585(ESCUDOS)
23

Table 13. Colombia
SOURCE 1 2 3 4 5 6YEAR 62 62 h4 64 64 70POPULATION IR EAP IR IR EAP IRCOVERAGE NL NL NL NL NL NL
PERCENT OFPnPULATION PERCFNT OF INCOMF
0t10 1,7 ?,8 ,7 2,0 ,8 t810.20 2,4 3,0 1.8 2,3 1,3 2,120.30 3,2 3,b 2,S 2,5 1 ,9 3,030.40 14,1 4,3 3,5 299 2,8 4.140-S0 5t1 5,3 4,6 3,8 3,8 5,150O60 6,5 6,6 S,9 5,0 5,1 6,560.70 8,3 8,3 7,8 6,6 b, 9 8,27080 11,1 110 10,4 9,2 9,7 10,780-90 16,1 15,9 15,2 14,1 14,8 15,190,100 410,5 39,2 47,6 51,6 52,9 44,4
951 00 29,4 27,5 36, 43 40,3 41,2 33,7
STATISTICS OF TNTFRFST
A ,5242 ,5001 ,5707 ,6591 ,b617 ,5113ALPHA ,9832 1,0557 ,9352 1,1309 1,0044 ,8895BETA ,8992 .9011 ,8569 ,9419 ,9244 ,8037R-SQUARE ,9983 ,9911 l 9995 ,9896 ,9998 ,9998
GINI CuEFF, ,5252 ,48S4 ,5965 ,6032 ,6466 .5615KUZNETS INDEX ,4074 ,3800 ,4568 ,4811 ,5053 ,4232E-ENTROPY ,4160 ,3697 51bb ,5506 ,5868 ,4715
MEAN INCOMf N,A, N,A, N,A, N,A, N,A, 12,900(PESOS)
GNP PER CAPITA 2,OSO 2,050 3,030 3,030 3.030 6,015( PESOS)
24
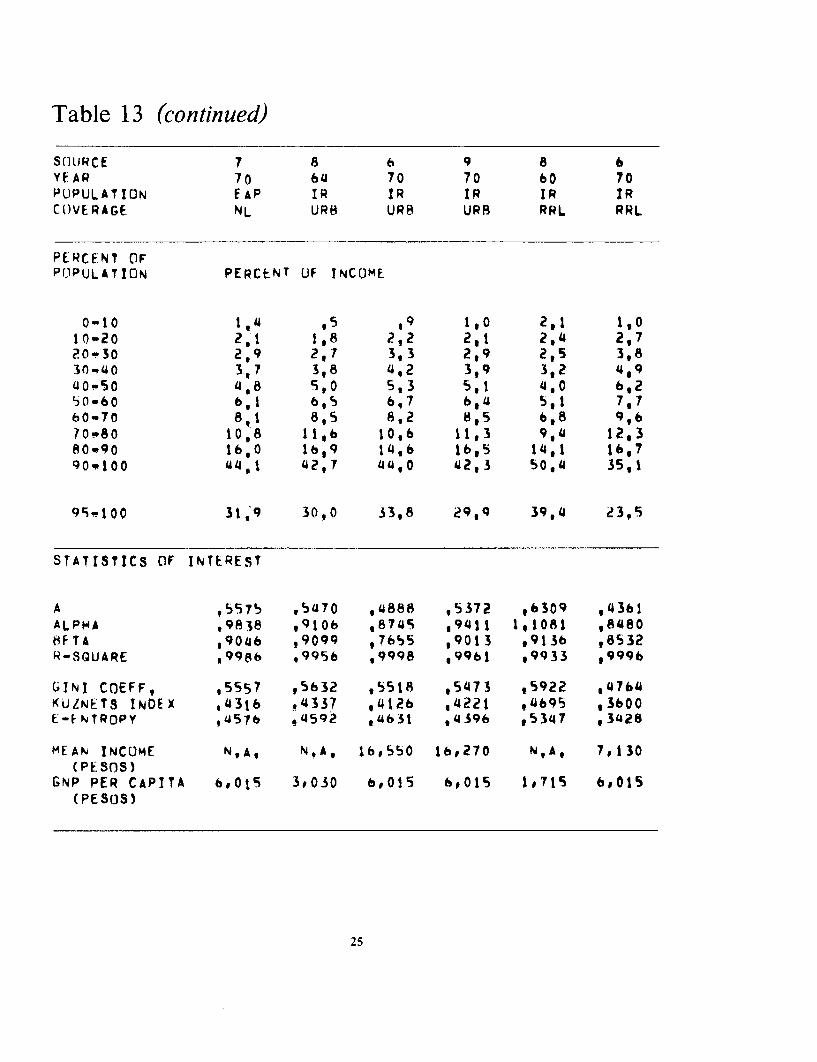
Table 13 (continued)
SO(9RCE 7 8 6 9 8 6YEAR 70 64 70 70 60 70PUPULATION EAP IR IR IR IR IRCOVERAGE. NL UR8 URB URB RRL RRL
PERCENT OFPOPULATION PERCENT UF INCOME
0-1O 1,4 ,5 ,9 1,0 2,1 1,010-20 2,1 1,8 292 291 2,4 2,720-30 2,9 2,7 3,3 2,9 2,5 3,830.40 3,7 3,8 4,2 3,9 3,2 4,9'40-50 4,8 5,0 5,3 5,1 4,0 6,250-60 6,1 6,5 6,7 6,4 5,s 7,760-70 8,1 8,S 8,2 8,5 6,8 99670.80 10,8 11l, 10.6 11,3 9,4 12,380w90 16,0 16,9 14,6 16,5 14,1 16,790.100 t44,1 42,7 44,0 142,3 50,4 35,1
95.100 31,9 30,0 33,8 29,9 39,4 2395
STATISTICS OF INTEREST
A t557s ,5470 ,,888 ,5372 .6309 ,4361ALPHA ,9838 ,9106 ,8745 ,9411 1,1081 ,8480fRFTA ,9046 ,9q99 97655 ,9013 99136 ,8532R-SQUARE ,9986 ,9956 ,9998 .9961 ,9933 ,9996
GINI COEFF, ,5S57 95632 ,5518 ,5473 95922 ,4764KUZNETS INDEX ,4316 ,4337 ,4126 ,4221 ,4695 ,3600E-ENTROPY ,4576 .4592 ,4631 ,4396 ,5347 ,3428
MEAN INCOME N,oA N9AP 16,550 16,270 N,A, 7,130(PESOS)
GNP PER CAPITA 6,0o5 3,030 6,015 6,015 1,715 6,OIS(PES)OS)
25
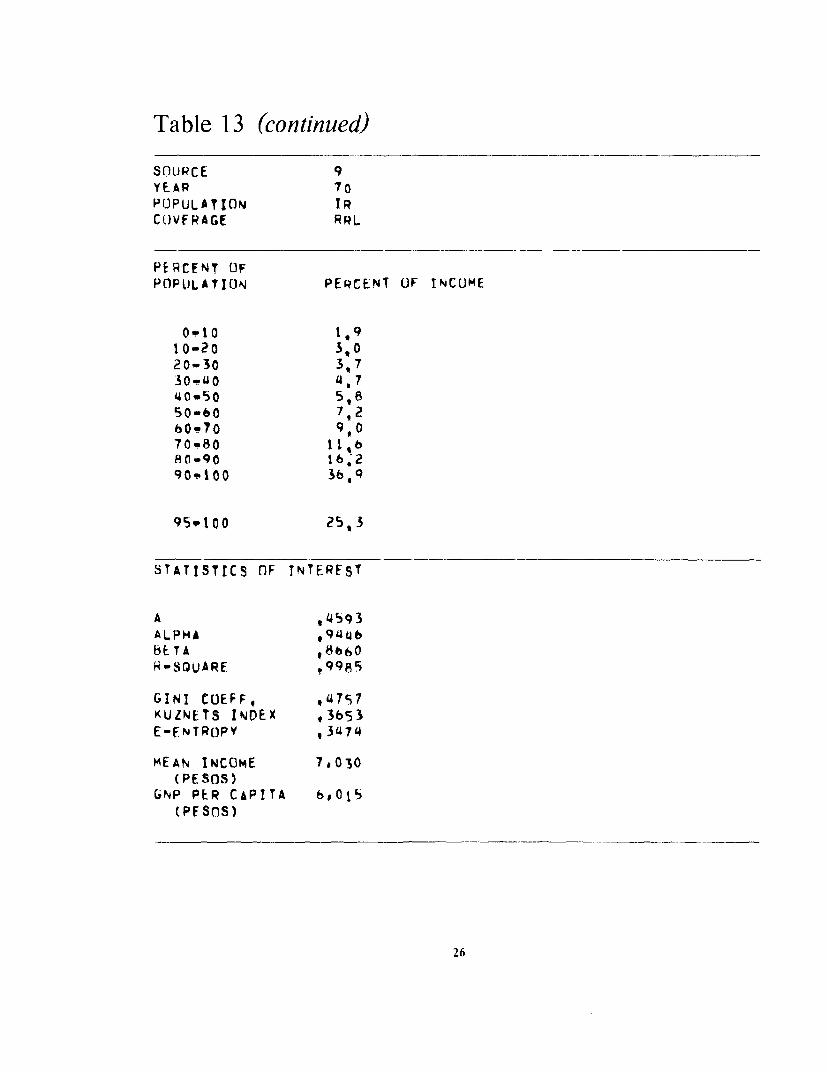
Table 13 (continued)
SOLIRCE 9YE AR 70POPULATION TR
COVFRAGE RRL
PERCENT OFPOPULATION PERCENT OF INCOME
0-10 1,91O-2O 3*020-30 3, 730.- .40 Y, 740-P50 5,850'b0 7,260-70 9 070-80 11, b80-90 6b,290-100 36,9
95' 100 25t 3
STATISTICS OF INTEREST
A ,459 3
ALPHA ,9i44b
BETA ,8660-SQUARE ,9985
GINI CUEFF, t47S7KUZNETS INDEX ,3653E-FNTROPVY ,34J4
MEAN INCOmE 7 , 030(PESOS)
GNP PER CAPITA 60O15(PFSOS)
26

Table 14. Costa Rica
SOURCE 1 2 2 2 3 3YEAR 61 71 71 71 61 61POPULATION HH PC HH PCH NH HHCOVERAGE NL Nt NL NL NAG AG
PERCENT OFPOPUJLATION PERCENT OF INCOME
0.10 2,6 2,0 2,1 2,7 1,8 4,110,Y20 3t1 3,0 3t3 4,2 3,0 4,620-30 3,3 3,8 4,1 5,1 4,0 4,93014 0 4 0 14,8 5.1 6,0 4,9 5,24ow.0 14,8 5,8 6,2 7,1 5,9 5.550-6o 5 9 7,1 7,6 8,4 7,3 5,960w70 7,6 A,9 9,14 9,8 9,0 6,470,80 10,l1 11,4 11,8 12,0 11,5 7,080.90 14,6 15,7 16,2 15,3 15,6 8,090.100 44,0 37,5 34,2 29,4 37,0 48,4
95.100 33,0 2b,3 21,0 19,3 2691 43'9
STATISTICS OF INTEREST
A ,5408 ,4520 ,4211 ,3374 ,4364 ,3481ALPHA 1.0938 ,9407 ,9219 ,8747 t9074 ,9568bETA ,8784 f8387 ,8501 ,7911 .8153 .2816R-SQUAPE 99143 ,9998 ,9999 ,9952 ,9872 ,9971
GINI COEFF, ,5207 ,14757 ,14445 ,3757 ,'4724 ,5310KlJZNFTS INDEX ,41¶t , 364Ž ,3389 ,2821 ,3589 ,14095E-ENTROPY ,14366 ,3527 ,3065 ,2265 ,3479 ,5153
MEAN INCOME N,A. 2,S20 14,100 N,A, N.A, N,A.(COL ONES)
GNP PER CAPITA 2D230 3,8140 3,8140 3,840 2,230 2,230(COLONES)
27
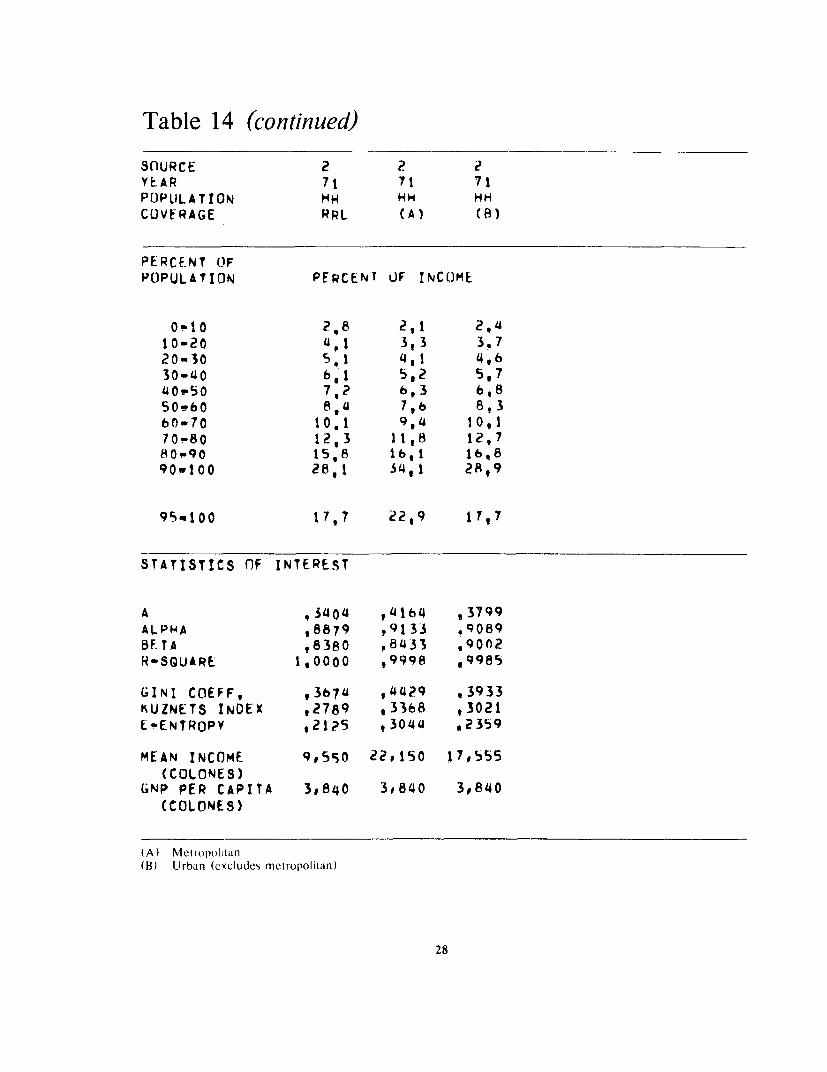
Table 14 (continued)
SOURCE 2 2 2YEAR 71 71 71POPUILATION HH HHCOVFRAGE RRL (A) (8)
PERCENT OFPOPULATION PERCENT UF INCOME
0w10 2,8 2,1 2,410-20 4,1 3,3 3.720-30 5,1 4,1 4,630-40 6,1 5,2 5,7405o 7,? 6,3 6,850 V60 8,44 7,6 8,3bO-0l 10,1 9,4 10t,70-80 12,3 11,8 12,780w90 15,8 l6,1 16,890"100 28,1 34,1 28,9
95v.100 1717 22,9 17,7
STATISTICS OF INTEREST
A , 3404 ,4 1h4 ,3799ALP9hA 8879 t9133 .9089BETA ,8380 ,8433 ,9002R-SOUARE 1,0000 ,9998 ,9985
GINI COEFF, *3674 ,4429 ,3933KUZNETS INDEX t2789 ,3368 ,3021E-ENTROPY ,21Z5 ,3044 ,2359
MEAN INCOME 9,550 22,150 17,555(COLONES)
GNP PER CAPITA 3,840 3,840 3,840(COLONES)
(A) Metropolitan(B) Urban (excludes meiropolilan)
28
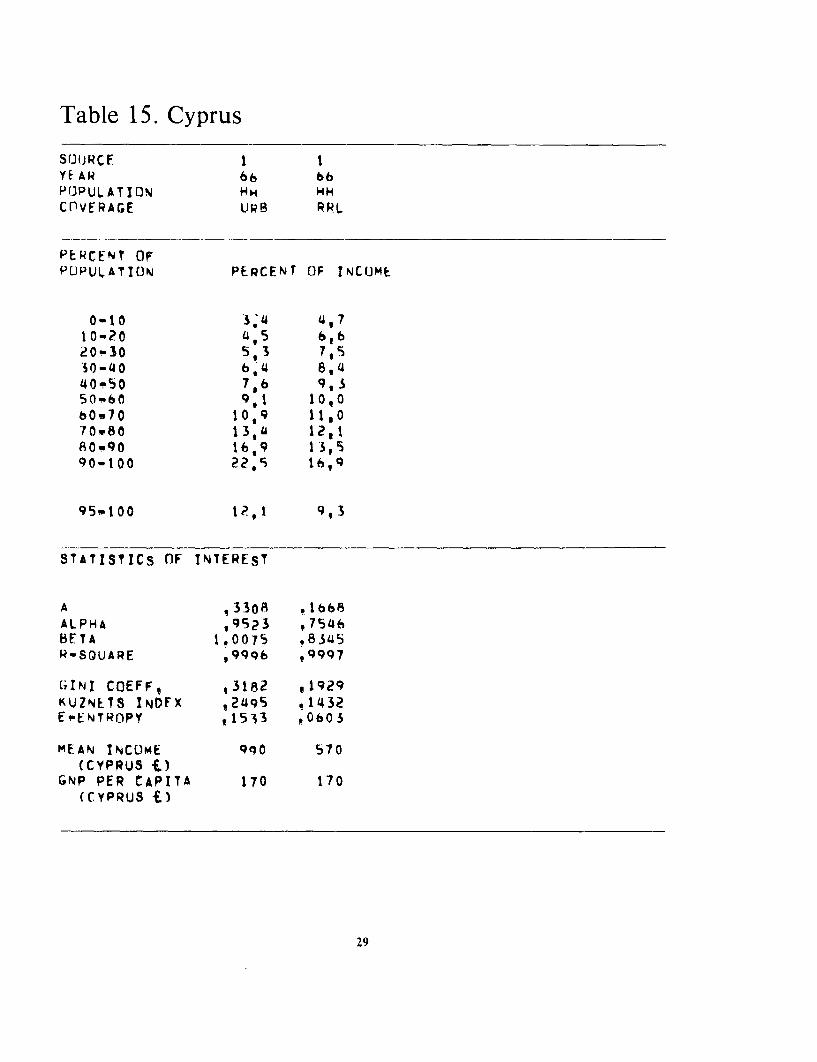
Table 15. Cyprus
SOJ(JRCE 1 IYE AR 66 b6P(PULATION HH HHCOVERAGE UPHS RRL
PERCENT OFPOPULATION PERCENT OF INCOME
0-10 3;4 4,710"20 1,5 6,62 0 - 30 5,3 7.930-40 6,4 8,440-50 736 9,S50-6 0 ,1 10,0b0t70 10,9 11,070w80 13,L 12,1Ao"90 16,9 13,990-100 22,'9 169
95-100 12,1 9,3
STATISTICS nF INTEREST
A 13308 .1668ALPHA ,9523 ,7546BETA 1.0075 .8345R-SQUARE ,9996 9997
(;INI COEFF, ,3182 r1929KUZNETS INDFX 22495 ,1432E-ENTRQPY ,1533 o! 0603
MEAN INCOME 990 570(CYPRUS f£)
GNP PER CAPITA 170 170(CYPRUS f.)
29

Table 16. Czechoslovakia
S(.)URCE I IYEAR 59 64POPULATION WRK WRKCOVERAGE NL NL
PERCENT OiFPOPULATION PERCENT OF INCOME
a-1o 4 ,7 5,4110.,20 6,4 6,520'30 712 7,430-40 8,1 8,140,S0 9.0 8,950-60 9,9 91860-7Q 11,0 10,870-80 1Z" 2 l2,080mW90 14,0 13,790-100 17,5 17,4.
95-100 9, 6
STATISTICS OF INTEREST
A tlA69 1799ALPHA ,8179 , 8h9hBETA ,86S5 .8596R-SQUARE ,9991 .9997
GINI COEFF, ,206O 91938KUZNETS INDEX ,1558 .1463E-ENTROPY ,0675 ,0598
MEAN INCOME 16,900 1H,600(KCS)
GNP PER CAPITA N,jA NfA,(I0CS)
301
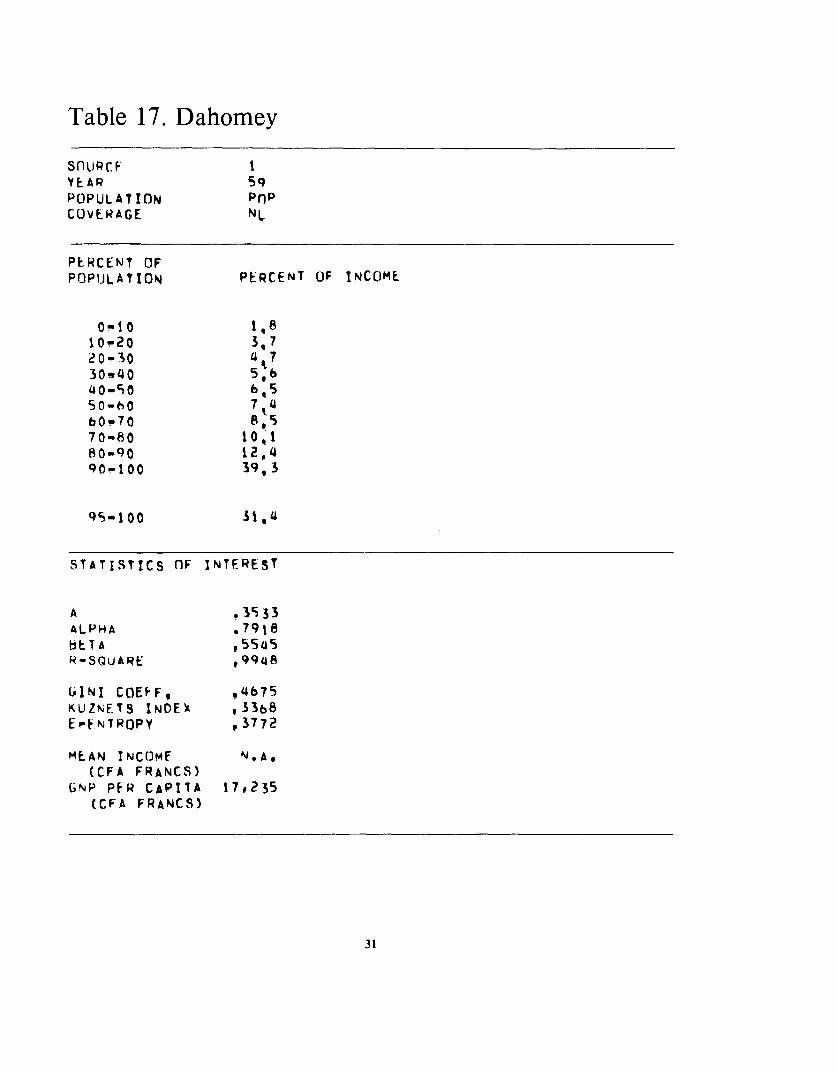
Table 17. Dahomey
snupcF IYEAR 59POPULATION PnPCOVERAGE NL
PERCENT OFPOPULATION PERCENT OF INCOME
0-O0 1,810-20 3, 120-30 4t730 40 5,640-50 645
50-60 7 k4
bQv70 570-80 10.180-90 12 490-100 39,3
95-I00 31 ,4
STATISTICs nF INTEREST
A .3533ALPHA ,7918bETA .5545R-SQUARE *9948
UINI COEFF, ,4675KUZNETS INDEX , 3 3 68EptENTROPY g3772
MEAN INCOME Nq, A(CFA FRANCS)
GNP PER CAPITA 17,235(CFA FRANCS)
31
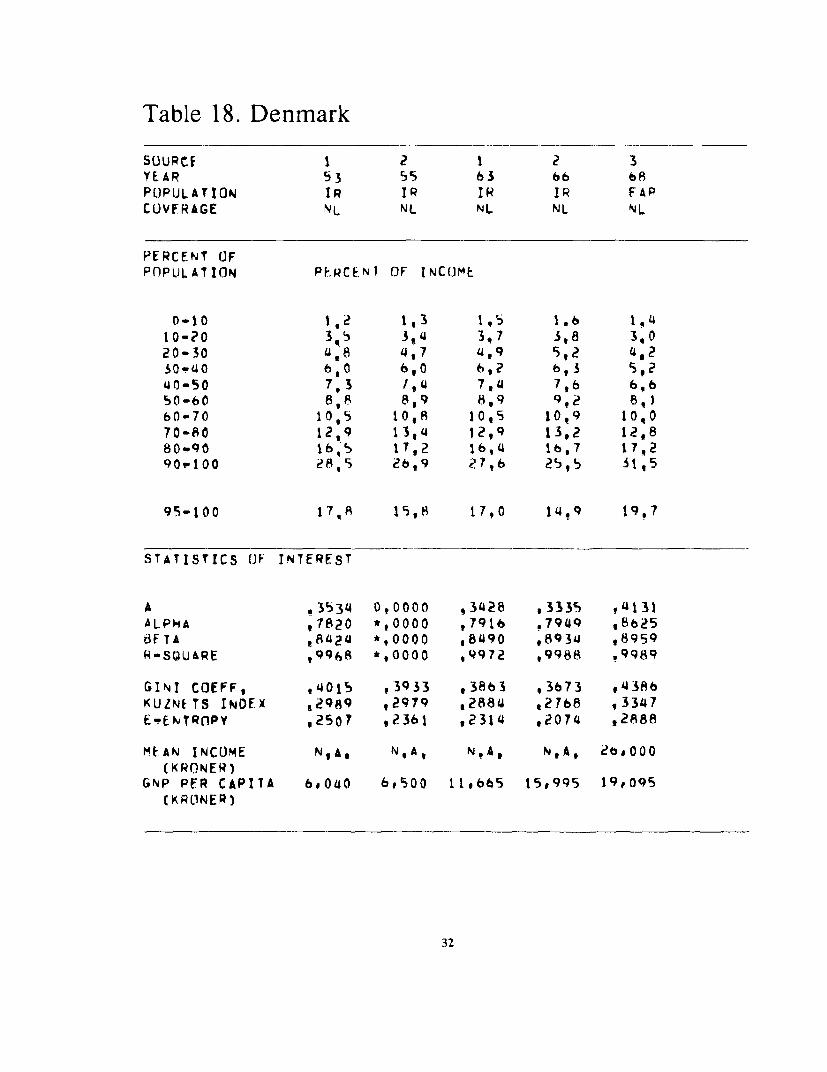
Table 18. Denmark
SOURCE 1 2 1 2 3YEAR 53 55 63 66 68POPULATION IR IR IR IR FAPCOVFRAGE NL NL NL NL NL
PERCENT UFPOPlULATION PERCENr OF INCOrME
0-10 1,2 1,3 1,5 1.6 1.410-20 3, 5 3,4 3,7 3, 8 3,020-30 4,8 4,7 4,9 5,2 4,230-40 6,0 6,0 6,2 6,3 5,240-50 7,3 /94 7,4 7,6 b,6
50-60 8,8 8,9 8,9 902 8,160-70 10,5 10,8 10,5 10,9 10,070-80 12,9 13,4 12,9 13,2 12,880-90 16,5 17,2 16,4 16,7 17,290p100 28,5 26,9 27,6 25,5 31,5
95-100 17,A 15,8 17,0 14.9 19,7
STATISTICS OF INTEREST
A ,3534 0,OOnn ,3428 ,3335 ,4131ALPHA ,7820 *,0000 (7916 !7949 18625BFTA ,8424 *,0000 ,8490 ,893s4 ,8959R-SOUARE ,99 h8 *,0000 ,9972 ,9988 .9989
GINI COEFF, ,4015 ,3933 ,3863 ,3673 ,4386KUZN&TS INDEX ,2989 ,2979 e2884 ,2768 ,3347
E-ENTRPPY ,250o7 2361 ,2314 ,2074 ,2888
MEAN INCOME N,As N,A, N,A, N,A, LEb#000
(KRONER)GNP PER CAPITA 6,040 6,500 11,665 15,995 19,095
(IKRONER)
32
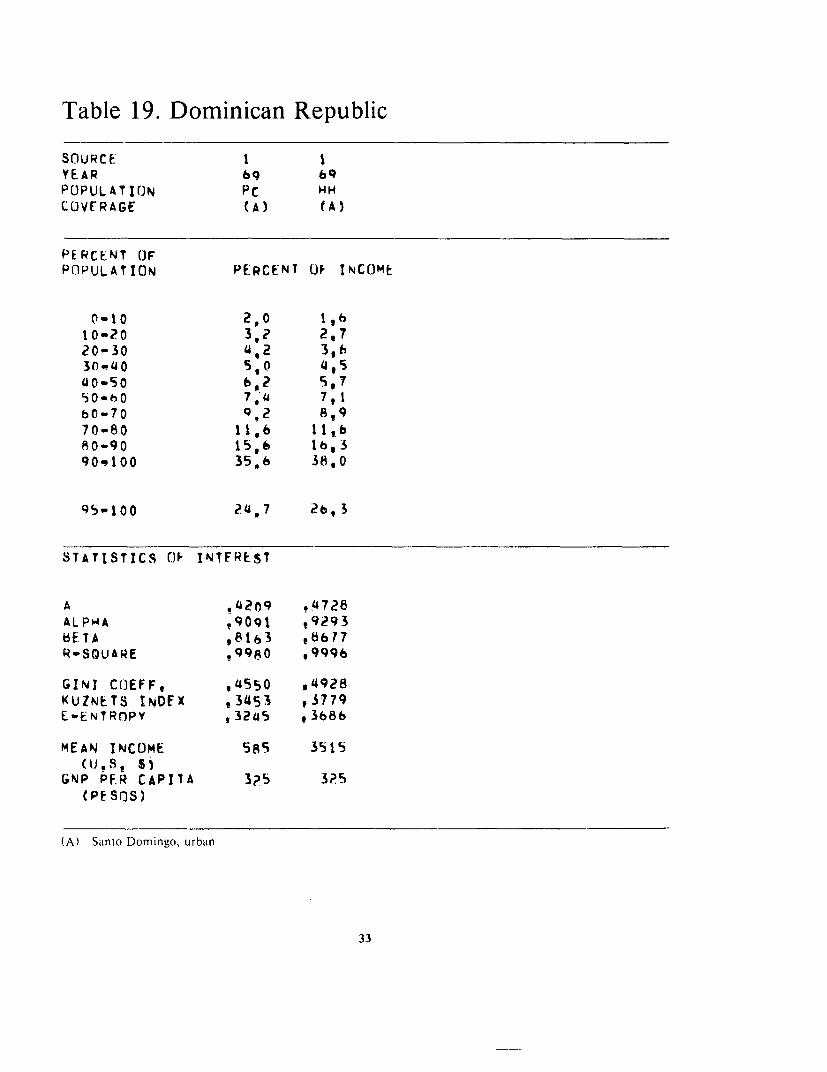
Table 19. Dominican Republic
SnURCE 1 1YEAR 69 69
POPULATIO)N PC HHCLVrRAGE (A) (A)
PERCENT (IFPnPULATION PERCENT UF INCOME
0-10 2,0 1,h10-20 3,2 2,720-30 4,2 3,630 -4'0 5,0 44,54Q-S0 b62 5,750-h0 7,4 7,160-70 9,2 8,970-80 11,0 11,690-90 15,6 16,390z100 35t6 38,0
qsq100 24.,7 26,3
STATISTICS OF INTFREST
A ,042o9 .4728ALPHA !9091 ,9293tE TA ,81 63 8677R-SQUARE ,9980 ,9996
GINI CtEFF, ,4550 '4928KUZNETS INDFX t3453 t3779E-ENTRnPY ,324i5 ,3686
MEAN INCOME 585 3515(U.82 5)
GNP PER CAPITA 3?5 325X PE SOS )
(A) Santo Domingo, urban
33
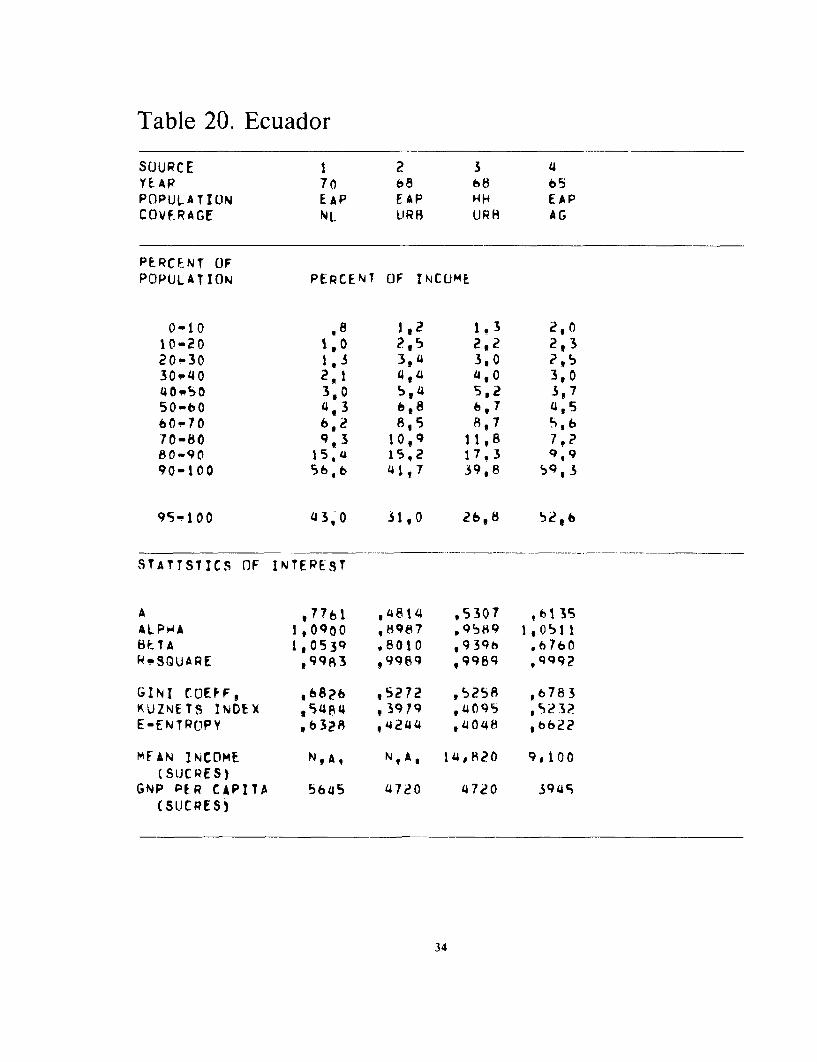
Table 20. Ecuador
SOURCE 1 2 3 4YE AR 70 68 68 65POPULATION EAP EAP HH EAPCOVERAGE Nt. URB URR AG
PERCENT OFPOPULATION PERCENT OF INCOME
0-10 ,8 1,2 1,3 ,n10-20 1,0 2,5 2,2 2,320-30 1*3 3,4 3,0 7J530-40 2p, 1 14.1 4410 3 040w50 3,0 5,4 5,2 3,750-bO 4 3 6,8 6,7 4,S60-70 6,2 R8i 8,7 5,t70-80 9,3 10,9 1 1,8 7.?80-90 15,u 15.2 17.3 9,990-100 56,6 41,7 39,8 59,3
95-100 43,0 31,0 26,8 52,6
STATTSTICS OF INTEREST
A ,7761 ,48t4 ,5307 ,b35ALPHA 1,0900 ,8987 ,9589 1,0511BETA 1,0539 .8010 ,939h .6760RUSQUARE I9 93 t99e89 ,9989 999Z
GINI COEF,F s6826 15272 5258 ,6783KUZNETS INDEX 95484 t3979 ,4095 ,523?E-ENTROPY 6328 ,4244 ,4048 ,>622
MFAN INCOME N,Aq NfA, 14,820 9 100( S C RE S )
GNP PER CAPITA 5645 '4720 4720 3945(SlUC RE S)
34
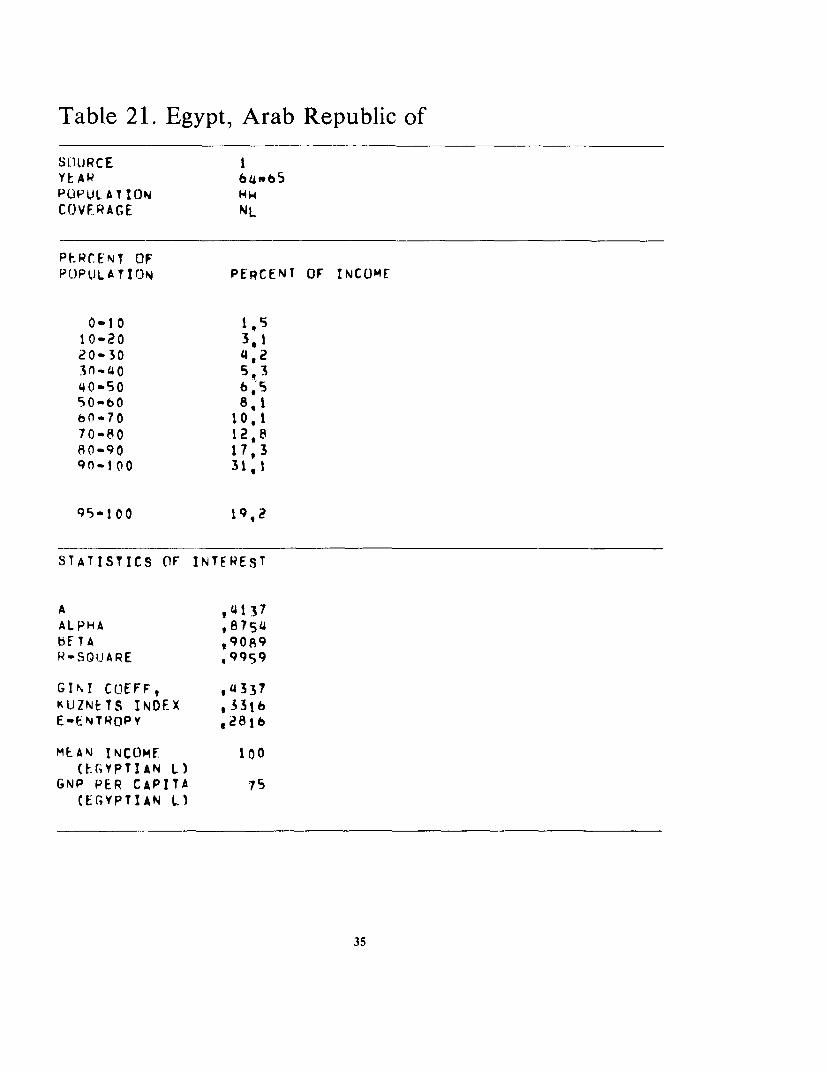
Table 21. Egypt, Arab Republic of
SO.UJRCE I
POPULA*ION HHCOVF.RAGE NL
PERrENT OFPL)PLJLATION PERCENT OF INCOME
0-10 1 510-20 3,120-30 4R23O.40 5,340-50 6 S50-60 8, 160-70 10 170-80 12,880-90 17,390-100 31,1
95 -00 19,2
STATISTICS OF INTFREST
A ,41 37ALPHA ,B754bETA ,9089R-SOtUARE ,9959
GINI COEFF, 04337KUZNETS INDEX ,33¶bE-ENTROPY g2816
MEAN INCOME t10
(EGYPTIAN L)GNP PER CAPITA 75
(EGYPTIAN L)
35

Table 22. El Salvador
S%URCE I 2 2 3 3YEAR 61 65/67 69 61 61PnPULATION EAP PfOP POP IR IR
COVFRAGE NJ. Nt Nt NAG AG
PERCENT nFPOPULATION PERCENT OF INCOME
0-10 2,4 1,1 1,1 1.3 3, '4
10-20 2,7 2,1 2,6 2,9 3,7
2n-30 3,0 3,0 3,8 3.9 4,1
30-40 3,5 3,9 4,9 5,i 4,5
40-50 4,5 S,51 h,2 6,2 5,250-60 5,17 6,6 7,8 7,7 5,9ha-lo 714 8,5 10.0 9,6 6,970-80 10,0 11,6 12,8 1? , 8,4
8(-90 1991 lb,8 17,8 1b,7 ntn7
90-100 45,7 '41,3 33,0 34,4 47,2
95-100 34,0 ?8,5 20,b 22,7 40.3
STATISTICS OF INTFRFST
A ,58'47 ,5367 ,44b8 4 312 ,4403
ALPHA 1,1062 ,9502 ,8735 ,8722 1.0227
BETA ,9244 ,9213 ,9247 ,8b36 ,5796R-SQUARE 99971 ,9977 ,9980 ,9999 9948
GINT COEFF, .54hO ,538q ,4b53 p4630 ?5242
KUZNEIS INDEX ,4337 ,1179 ,3568 .3516 ,4000
E-ENTROPY ,4649 ,4254 ,3202 ,3244 ,4Hh3
MFAN INCOME N,A, N,A, N,A, N,IA N A(COLONES)
(NP PER CAPITA 570 700 715 570 570(COL.ONES)
36
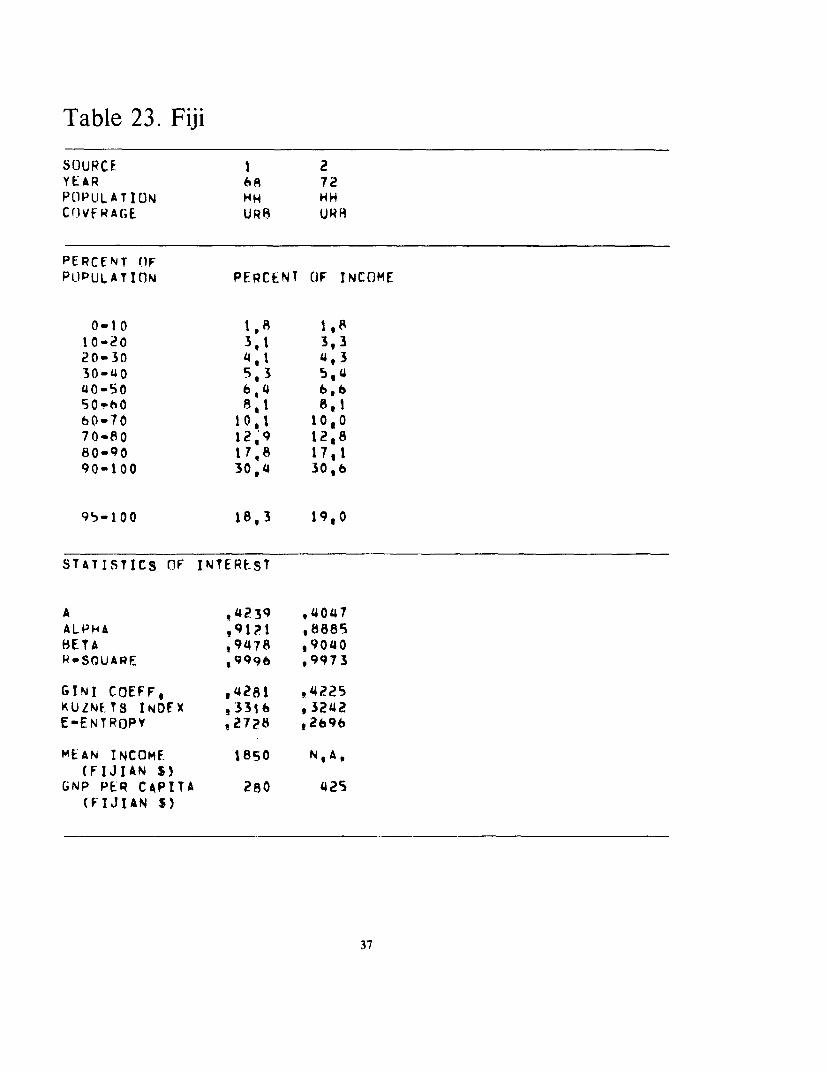
Table 23. Fiji
SOURCE. 1 2YEAR 68 72POIPULATION HH HH
C(OVF RA;E UR8 UPF
PERCENT OF
POlPULATION PERCENT OF INCOME
0-10 1 ,A 1,810-20 3,1 3,320-30 4,1 4,330-40 5,3 5,44 0-50 6,4 6,650.-O 8, 1 8,160.70 10,1 10070-80 12,9 12,880-90 11,8 17,190-100 30,4 30,6
95-100 18,3 19,0
STATISTICS OF INTEREST
A ,4239 ,4047ALPHA ,91?1 ,8885BETA ,9478 ,9040R.SOUARE ,9996 ,9973
GINI COEFF, g4281 ,4225KUZNETS INDFX ,3316 ,3242E-ENTROPY ,27?8 ,2696
MEAN INCOME 1850 N,A,(FIJIAN S)
GNP PER CAPITA 280 425(FIJIAN S)
37
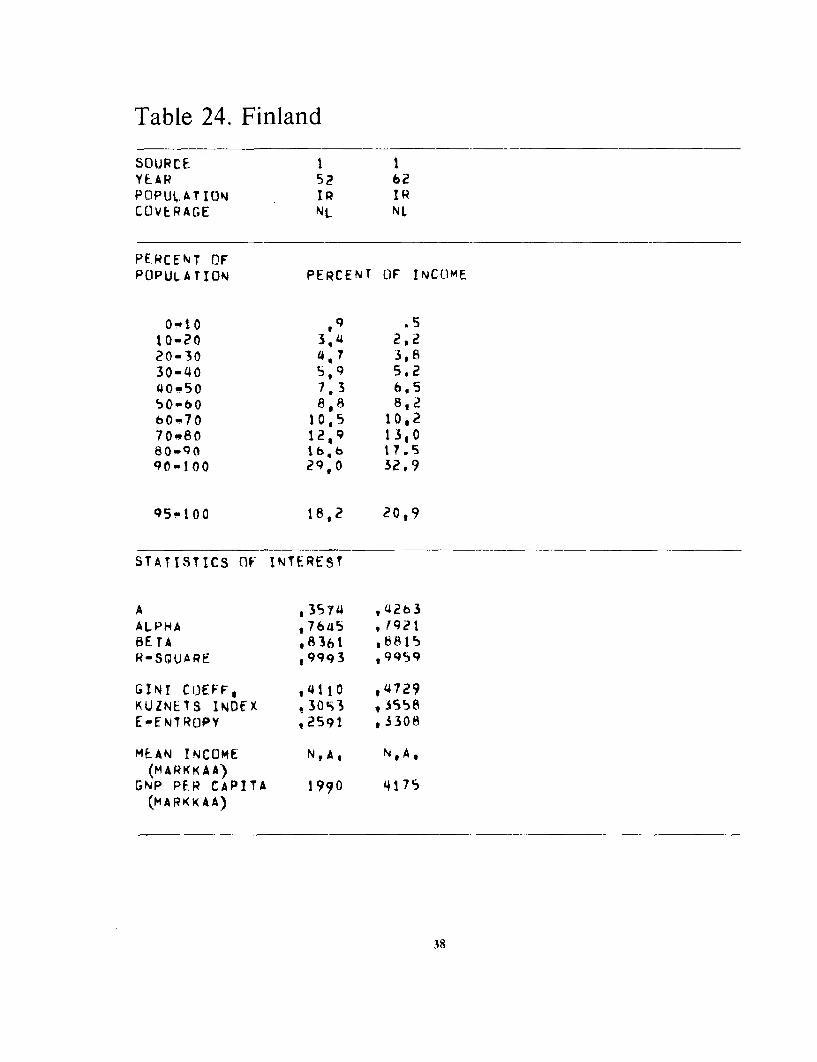
Table 24. Finland
SOURC E I YEAR 52 62POPULATION IR IRCOVERAGE NL Nl
PERCENT OFPOPULATION PERCENT OF INCOME
01O I9 1510-20 3 '4 2,220-30 4,7 3,830-40 5,9 5.240.50 7.3 6.550-60 8,8 8,260"70 10,5 10,270"80 12,9 13,080-90 16,6 17.590-100 29,0 32.9
95-100 18,2 20t9
STATISTICS OF INTEREST
A ,3574 ,942b3ALPHA ,97b45 1921BETA ,h361 .8815R-SQUARE 29943 ,9959
GIN! COEFF, ,4110 ,4729KUZNETS INDEX .30s3 ,3558E-ENTROPY ,2591 93308
MEAN INCOME N,A, N,A,(MARKKAA)
GNP PER CAPITA 1990 4175(MARKKAA)
38

Table 25. France
SOURCE I IYEAR Sf2POPULATION HH NH
COVE RAGE NL NL.
PERCENT OFPOPULATION PERCENT OF INCO4ME
0-10 ,7 !5
10-20 2,4 1 ,820-30 3.7 3t330-40 5,0 4,440-50 6.3 5SI50.60 7,9 7,560"70 9'9 9'570-80 12,6 125,80w90 1702 17,590_100 34,3 37,2
95-1o0 22,4 24t7
STATISTICS OF INTEREST
A ,4358 .4808ALPHA .820 1 , 838 3BETA ,869b .8931HRS(lUARE ,9983 99b7
GINT COEFF, ,4790 ,5176KUZNE1S INDEX a 3611 , 3926E-ENTROPY ,3404 ,389PJ
MEAN INCOIME N, A N,A,(F RANCS)
GNP PER CAPITA 4635 7815( FRANCS)
39
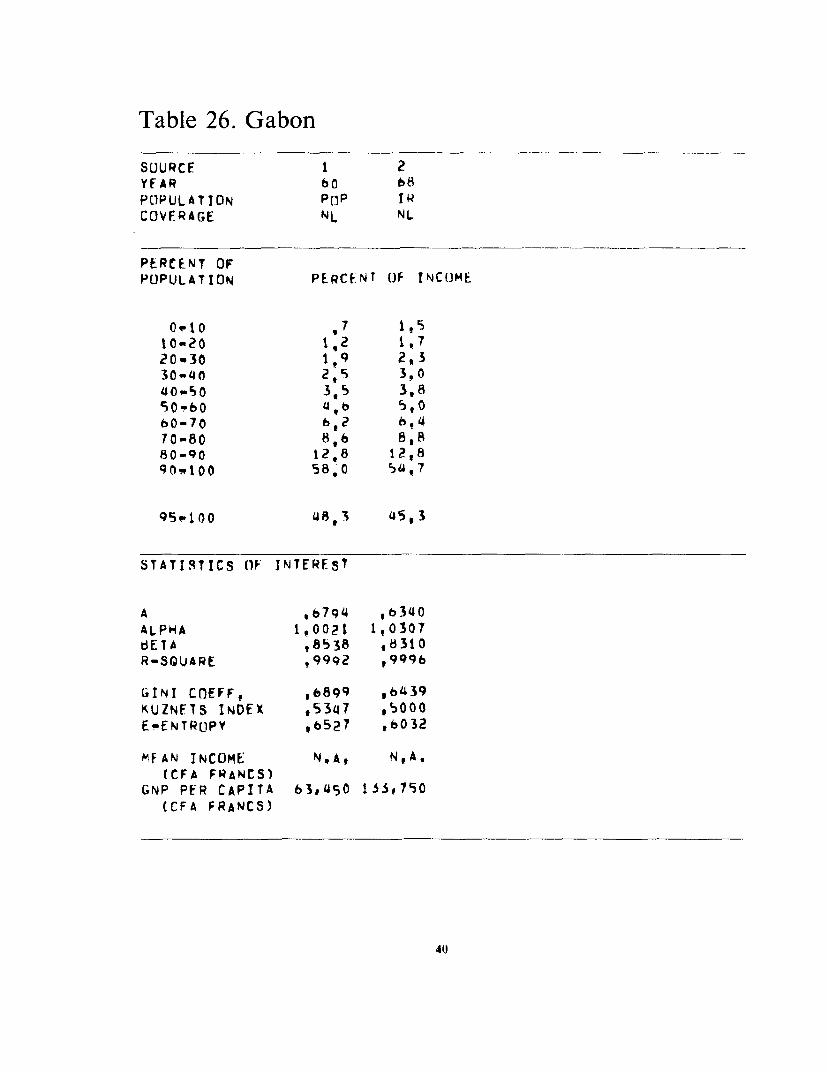
Table 26. Gabon
SOURCE 1 2YEAR b O8POPULATION POP IRCOVERAGE NL NL
PERCENT OFPOPULATION PERCENT Of INCUME
0O1o '7 1,5I0-20 1,2 1,720m30 1,9 2,330-40 2,5 3!O40.'50 3,5 3,890-bO U ,6 5,060-70 6,2 6,470-80 8,6 8,880-90 12,8 12,8qf(I_100 58,0 54,7
95q.100 45,3 45,3
STATISTICS OF INTEREST
A ,6794 ,b6340ALPHA 1l0021 1,0307t3ETA ,8538 ,8310R-SGUARE t9992 ,9996
GINI COEFF, *6899 96439KUZNFTS INDEX ,5347 ,S0000E-ENTROPY ,6527 ,6032
MFAN INCOME N,A, N,A.(CFA FRANCS)
GNP PER CAPITA 63,450 133,790(CFA FRANCS)
40
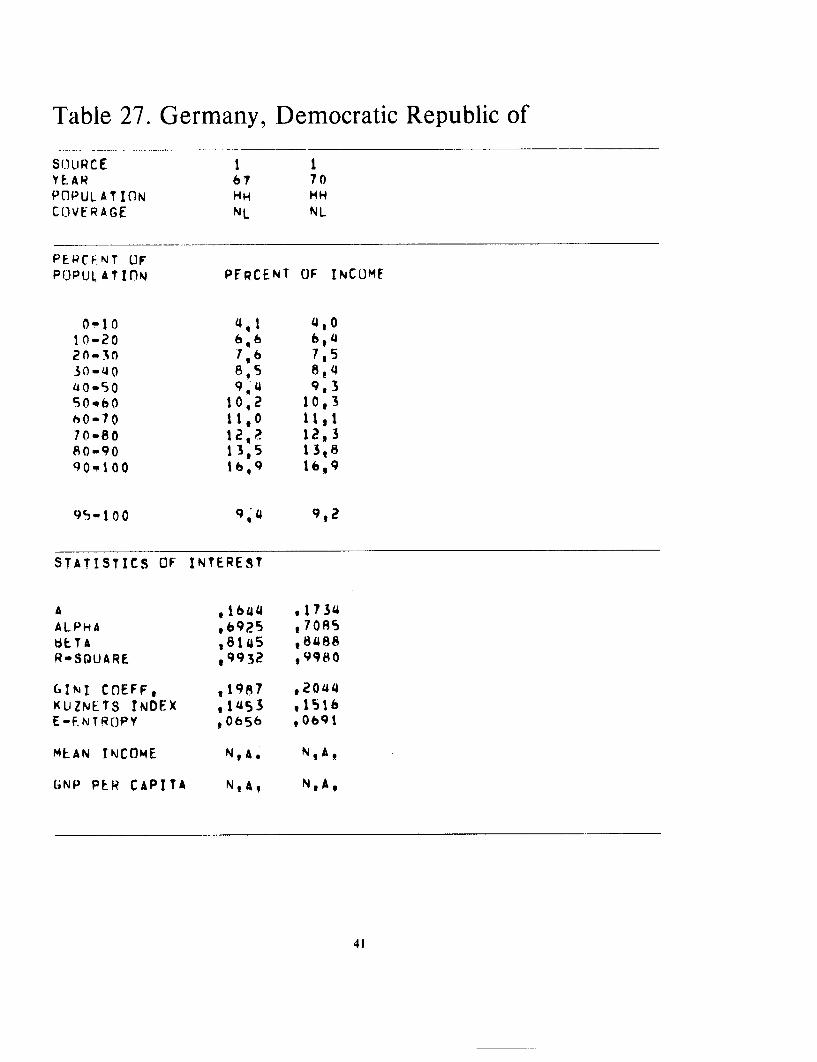
Table 27. Germany, Democratic Republic of
S 0URCE R 1YEAR 67 70POPULJATION HH HCOVERAGE NL NL
PERCF.NT OFPOPULATION PFRCENT OF INCOME
0-Xo 4,1 4,010-20 6,6 6,420- 3 1,6 7,530-4 0 8,5 8,44o-50 9 4 9, 3S50 R 10,2 10,3hO-70 1,O 11,170-80 12,? 12,380-90 13,5 13,890-100 16,9 16,9
9S-100 9,4 9,2
STATISTICS OF INTEREST
A ,1644 ,1734ALPHA ,6925 ,7085BtTA ,8145 ,8488R-SQUARE ,9932 .9980
GINI COEFF, ,1987 ,2044KUZNETS INDEX ,1453 ,1516E-FNTROPY ,0656 O0691
MEAN INCOME N,A. N,A,
GNP PER CAPITA N,Aq N,A,
41

Table 28. Germany, Federal Republic of
S5UlJRCE I I 1 2 3 2YEAR 59 60 64 68 69 70POPULATION IR IR IR HH HH HH
CUVERAGE NL NL NL NL NL NL
PERCENT OFPOPULATION PERCENT OF INCOME
0-10 1 ,b 1,9 2,0 2,4 2,6 2,210-20 3*2 3,4 3,6 3,8 4,3 3,720"30 4,0 4t4 4,5 4,8 5,4 4,730-40 4 8 5,1 5,4 5,8 6,6 5.8
40-50 5,8 5,9 6,2 7,0 7,7 7t050-60 6,7 6,9 7,1 814 9,? 8,360.70 8° 0 B,0 8,2 10,2 10,8 10,270-80 9,1 9,s 9.8 12,6 13,1 12,580-90 12,4 11,9 12,2 16 4 16,4 16,5
90-100 43,8 43,0 41,0 28t6 23,9 29,1
99-100 35,8 35,4 33,2 17,8 13,7 18,2
STATISTICS Of INTEREST
A ,4149 38882 ,3705 .3634 ,3151 36h73ALPHA ,8468 835h ,v8251 t8853 ,8485 ,8732BETA .5991 ,55lb ,5575 ,8722 t9124 18654
RSSQUARE .9992 .9986 ,9986 ,9991 ,9976 ,9998
GINI COEFF, ,5219 ,5053 ,4126 ,3860 ,3344 ,3939KUZNE.IS INDEX ,3821 ,3674 ,3505 ,2937 ,2547 ,2989E-ENTRfoPY ,4478 ,4326 ,400A ,2295 1711 ,2386
MEAN INCOME N,A, N,A, N,A, N,A N.A, N,A,(MARKS)
GNP PER CAPT7A 3,660 5.459 7,?20 8,975 9,945 11.135(MARKS)
42
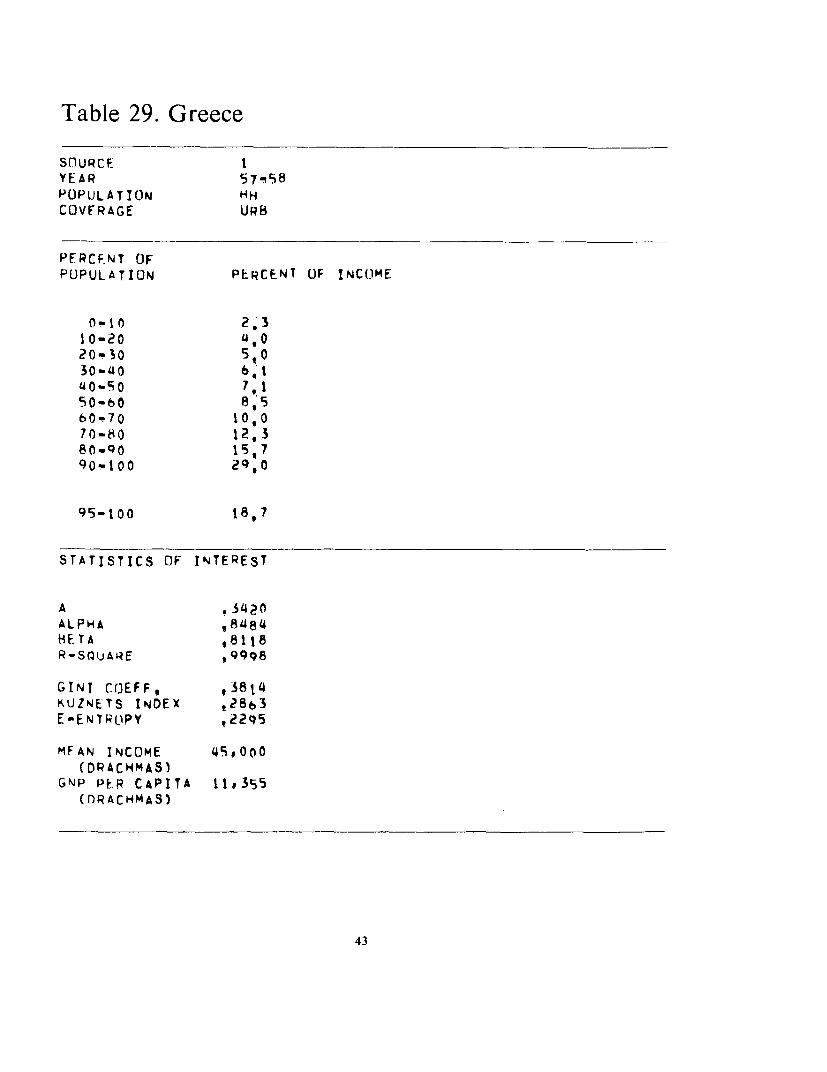
Table 29. Greece
snuRcF tYEAR 57 58POPULATION HHCOVFRAGE URB
PERCFNT OFPUPULATION PERCENT OF INCOME
0-10 2 310-20 4 020.30 5,030-40 b6 t4 0-5 0 7 , 150-60 8,560-70 10,070-80 2, 38n.90 15 790-100 29 0
95- 1 0 0 1 8 , 7
STATISTICS OF INTEREST
A .3420ALPHA ,8484HETA 981 18R-SQUARE ,9998
GINT COEFF, ,3fl4KUZNETS INDEX .2863E-ENtROPY 2295
MFAN INCOME 45.00o(DPACHMAS)
GNP PER CAPITA 11.355(DRACHMAS)
43
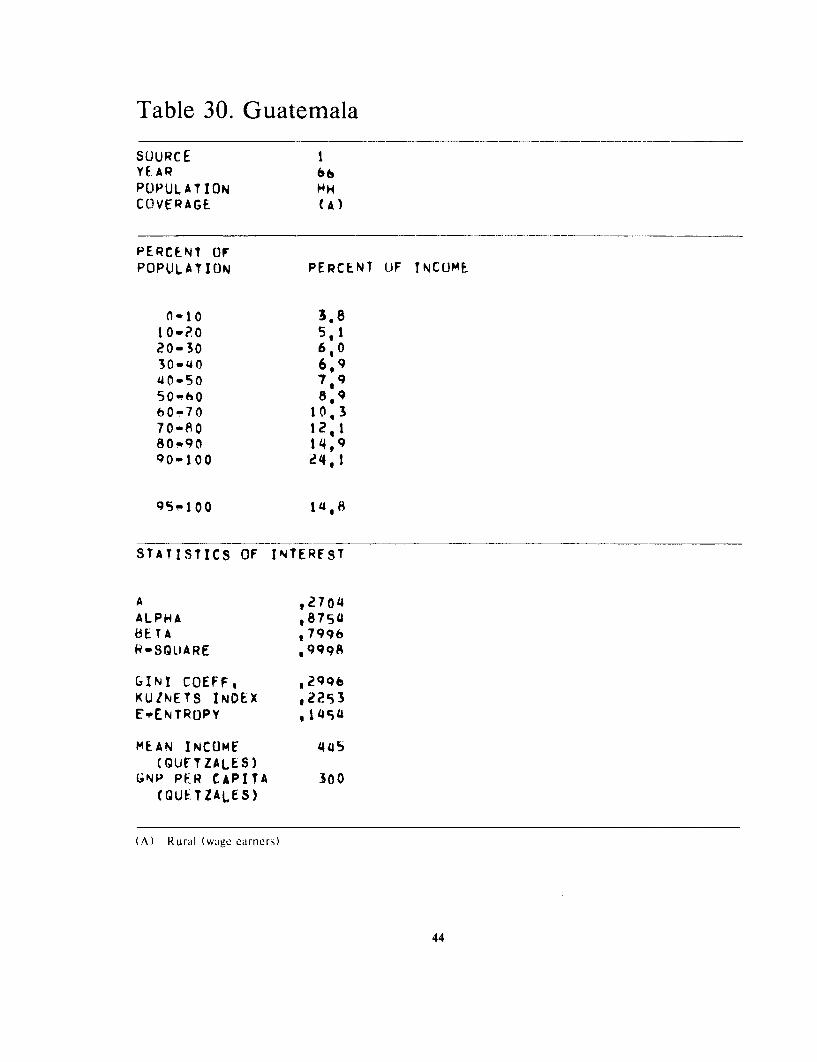
Table 30. Guatemala
SOURCE 1YEAR 66POPULATION HHCOIVERAGE (A)
PERCENT OFPOPULATION PERCENT OF TNCOME
0-10 3.810-?0 5,120-30 6,030-40 6,9lJ0-50 72950-hO 8, 960-70 1 , 370-80 12,18f0-90 14,990-100 24,1
95-100 14,8
STATISTICS OF INTEREST
A t 2704ALPHA ,875s1BETA t7996R-SQLIARE *999Q
6IN! COEFF, ,2996KUZNETS INDEX 22rS3E-ENTROPY ,14ic4
MEAN INCOME 445(QUFTZALES)
GNP PER CAPITA 300(GUETZALES)
(A) Rural (wage earners)
44
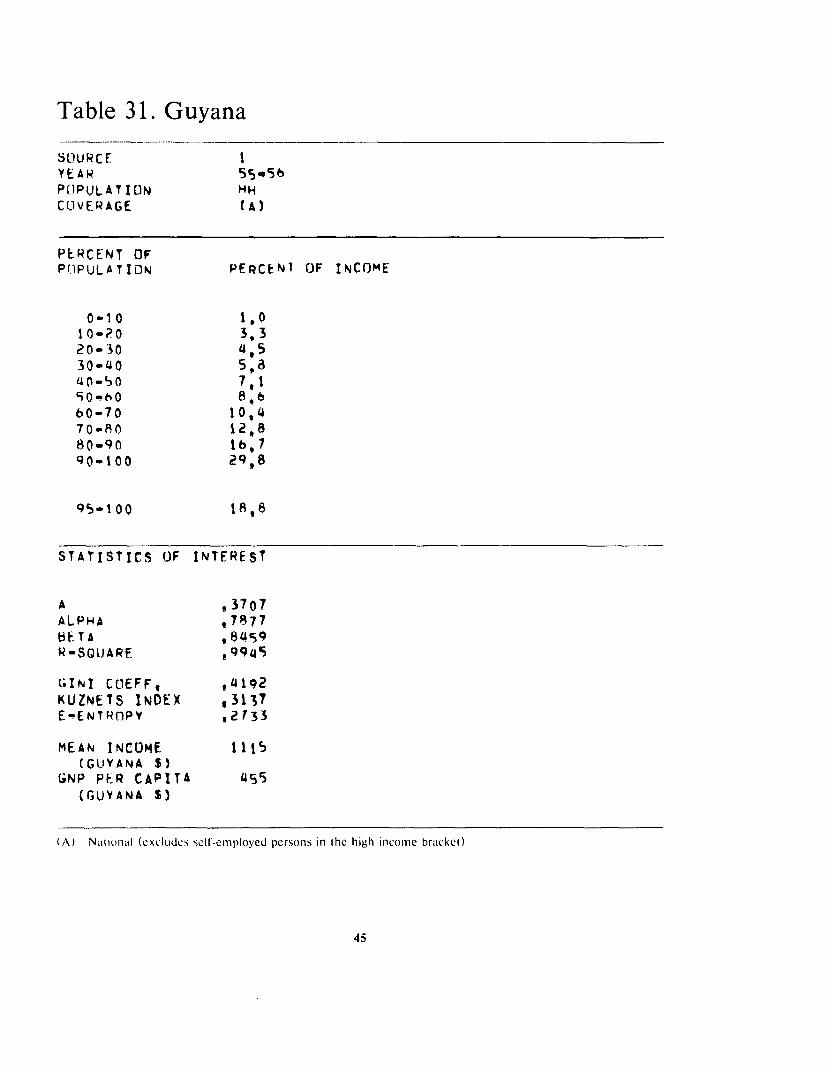
Table 31. Guyana
SOJURC E 1YEA R 5c5w.tP(OPULATION HHCOLVERAGE (A)
PERCENT OFPOPULATION PERCENI OF INCOME
0-10 1,010-0 3,320-30 4,530-lJ0 59840-S0 781'iQ - s 0 8,660-70 10,470-80 12*880-90 16,790-lQ0 29,8
95-100 18,8
STATISTICS OF INTEREST
A 3707ALPHA ,7877kt;.TA ^,84,j9
R"-SGLUAPE 994S
(INI COEFF, 4192KUZNETS INDEX *3137E-ENTROPY ,2733
MEAN INCOME 1115(GUYANA S)
(NP PER CAPITA 455(GUYANA S)
(A) National (excludes sell-employed persons in the high incolie bracket)
45
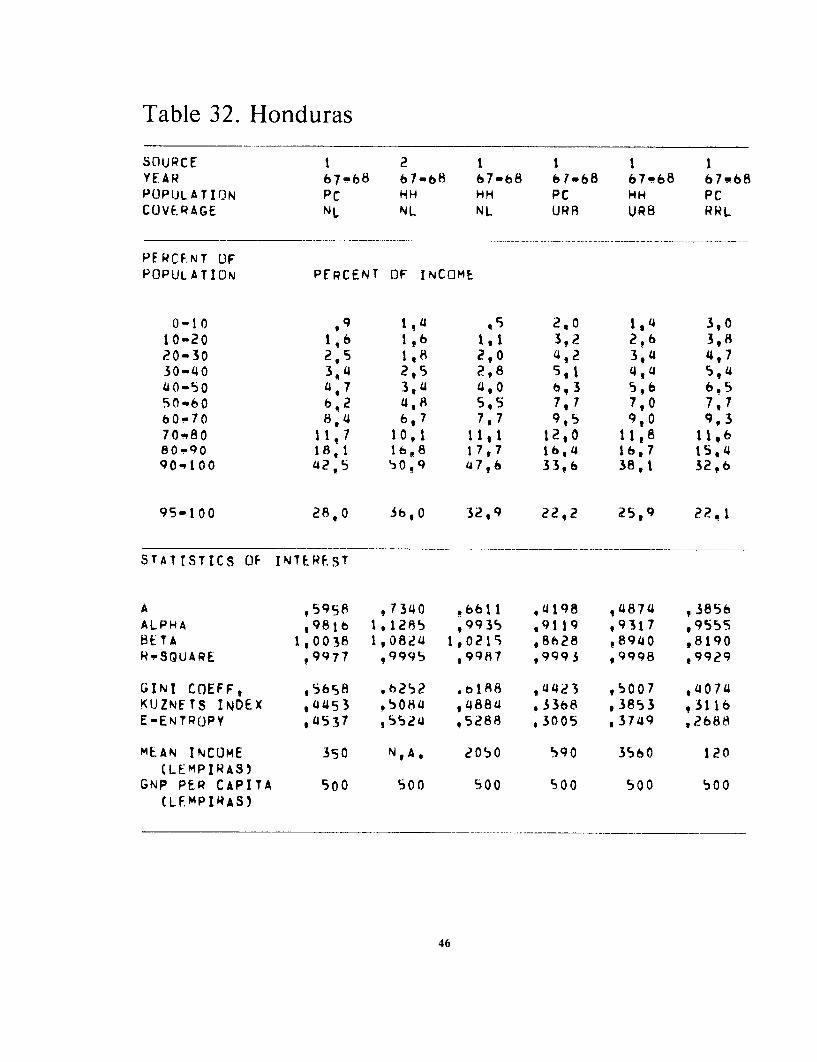
Table 32. Honduras
SOURCE 1 2 1 1 1 1YEAR 67-68 67-b 8 67-68 67.68 67-68 67P68POPULATION PC HH HH PC HH PCCOVERAGE NL NL NL URR URB RRL
PERCENT OFPOPULATION PERCENT OF INCOME
0-10 ,9 1.4 ,5 2,0 1,4 3,010-20 196 1,b 1I1 3,2 2P6 39820-30 2,5 1,8 2,0 492 3,4 4,730-40 3,4 2,5 2e8 5,1 '4,4 5,440-50 li7 3,4 4I0 6,3 5I6 6.550 -6 bI2 4,8 5,5 7,7 7,0 7,760-70 814 6,7 7,7 95 9,0 9,370 t80 111 10,1 11tl1 1290 11,8 119680-90 18,1 16,8 17,7 16,4 16,7 15,490-100 42?,5 50 9 47,6 33,6 38A1 32,6
95-100 28f,0 3bI0 32,9 22I2 25,9 22q I
STATISTICS OF INTEREST
A ,5958 7 3 40 .6611 4198 4874 , 3856ALPHA ,981b 1,1285 99935 ,9119 e9317 .9555BETA 1,0038 l,O824 1,0215 g8628 ,8940 8190R-SQUARE .9977 99995 ,998f ,9993 .9998 e9929
GIN! COEFF, ,5658 .b252 .b188 ,4423 ,5007 ,4074KUJZNETS INDEX ,4453 !5084 14884 .3368 ,3853 93116E-ENTROPY ,4537 ,5524 5288 t 3005 .3749 ,2688
MEAN INCOME 350 N,A, 2050 590 3560 120(LEMPIRAS)
GNP PER CAPITA 500 500 500 500 500 500(LFMPIRAS)
46
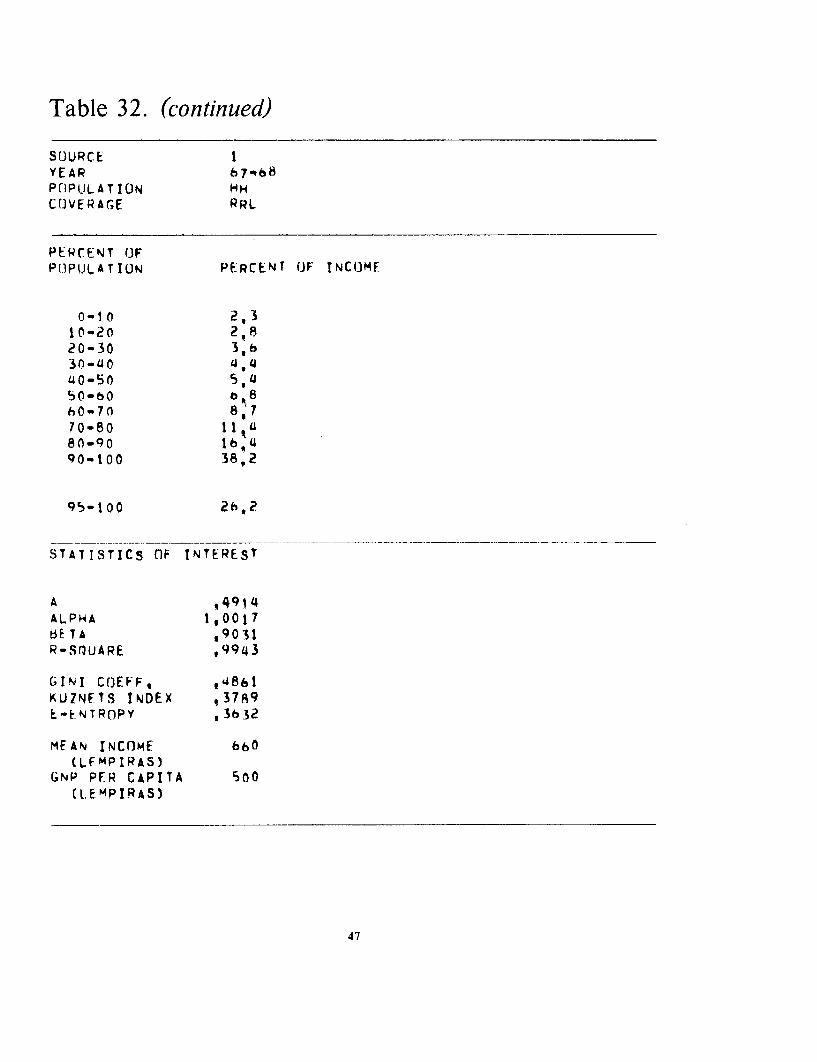
Table 32. (continued)
SOURCE IYEAR 67-68PKlPULATION HHCOVERAGE RRL
PERCENT OFPOPULATION PERCENT 1OF INCOME
0-10 2,310-20 21820-30 3,h30-'40 4*4Y0-50 5,450-O0 b,8hO-70 8, 770-80 11 'U80-90 lb,M90-100 38,2
95-100 2b,2
STATISTICS OF INTEREST
A s9t49ALPHA 1,0017bETA ,9031R-SIUARE , 943
GINI COEFF, ,'4861KUZNFTS INDEX e37R9L-tNTROPY ,3632
MEAN INCOME 660(LFMPIRAS)
GNP PER CAPITA o00(l.EMPIRAS)
47
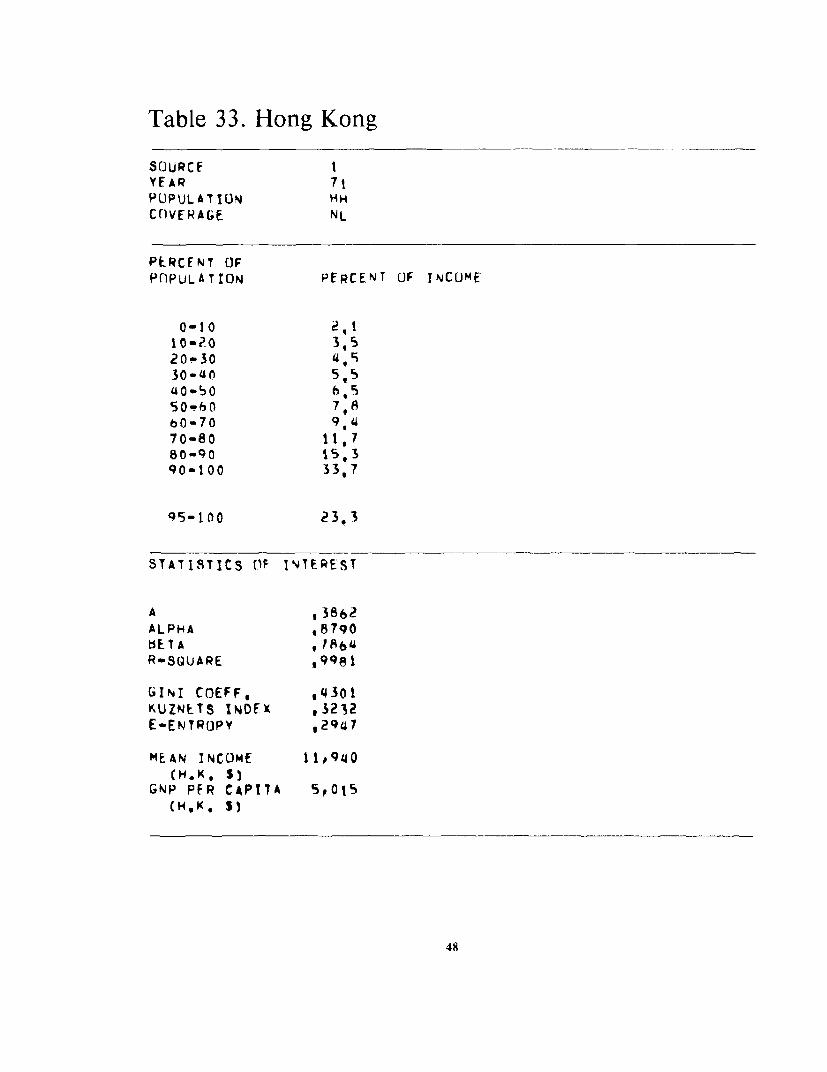
Table 33. Hong Kong
SOURCF 1YEAR 7 POPULATION HHCOlVERAGE NL
PERCENT OFPOPULATION PERCENT OF INCUME
0-10 2,l10-?O 3,520-30 4, 30-40 5,54 0 450 h, 5so-hn 7, 8bO-70 9 U70-80 1, 780-90 15, 390-t 00 33, 7
95-100 23.3
STATISTICS OF INTEREST
A t 3862ALPHA *8790bE.TA ,864R-SQUARE ,9981
GINI COEFF, ,4301KUZNETS INDEX ,3232E-ENTROPY ,2947
MEAN INCOME 1 10 9 40(H.K, S)
GNP PER CAPITA 5sot5(H,K. S)
48
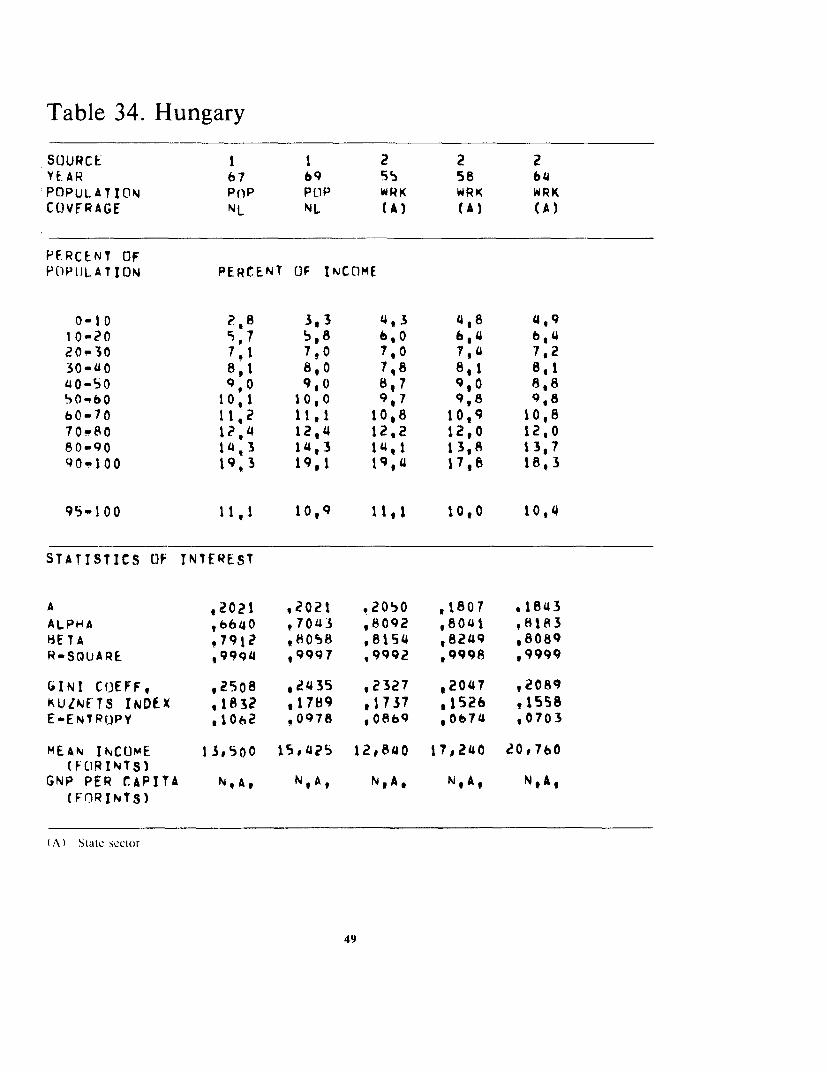
Table 34. Hungary
SOURCE I 1 2 2 2YEAR 67 69 5S 58 64PDPULATION P(1P POP WRK WRK WRKCOVFRAGE NL NL (A) (A) (A)
PERCENT OFPOPULATION PERCENT OF INCOME
0-10 ?,8 3,3 4,3 4e8 4,910-20 5,7 5,8 6,0 6,4 6,420w30 7,1 7,0 7,0 7,Y 7,230-40 8,1 8,0 7,8 8 gt 8,140-50 9,0 9,0 8,7 9,0 8,850-60 tO,I 10,0 9*7 9,8 9,860-70 11,2 11,1 10,8 10,9 10,870-RO 12,4 12,4 12,2 12,0 12,080-90 1',3 14,3 1l,1 13,8 13,790-100 19,3 19,1 19,' 17,8 18,3
95-100 11,1 10,9 q l,s 10,0 10,4
STATISTICS OF INTEREST
A ,2021 ,2021 ,2050 ,1807 ,1843ALPHA 96640 ,70143 ,8092 ,80'41 98183f3ETA 97912 ,8058 ,8154 ,8249 ,8089
R-SOUARE ,99q4 ,9997 .9992 ,9998 ,9999
GINS COEFF, ,25oB ,2435 ,2327 ,2047 ,2089KULNETS INDEX .1832 ,1789 ,1737 11526 ,1558E-ENTROPY .1062 ,0978 ,0869 ,0674 ,0703
MEAN INCOME 13,500 15,425 12,840 17,240 20,760( FlRI NT S)
GNP PER CAPITA N,A, N,A, N,A, N,Aq N,A,(FORINTS)
(.A') State sctlor
49

Table 35. India
SOURCE 1 Z 2 3 3 1
YFAR 53.55 S3-57 60 (A) (8) hl-64
PnPULATION IR HH HH POP Pop IR
CUVF.RAGE NL NL NL NL NL N .
PERCENT 0FPOPULATION PERCFNT OF INCOME
0-10 3,0 3,1 1,1 3,3 2,9 2,010-opo u. 42H 3,0 4,4 4,5 3,1
20-30 * 7 5,7 4,2 5,2 5,3 4,030-40 5,u 6,6 5.3 6,0 6,1 4,9
40-50 6,4 7,5 b,l4 7,0 6,9 5t8
50-60 7,5 8,b 7,7 8,0 7,8 7,060-70 8,9 9,8 9,2 9,5 8,8 8,5
70-80 10,9 11t5 11,4 11,4 10,3 10,6
80-90 14,3 14,2 15,0 14,7 12,5 14,2
9n-100 34,9 28,2 3b,7 30,5 3/4,9 39,9
95-100 25,3 19.2 26.7 20,9 27,0 30,3
STATISTICS OF INTERFST
A *3756 .2854 ,3919 ,3329 .3101 ,4294
ALPHA ,9379 8233 .8058 f9156 ,8280 ,9030BETA ,7350 *6927 ,7311 ,7515 ,5609 ,7307R-SQUARE ,9993 *9967 ,9972 ,9989 ,9979 ,9998
GINI COEFF. ,'4193 ,3a34 ,4727 ,3717 ,14025 ,4878
AUZNETS INDEX .3168 ,2526 ,348 4 ,2800 ,29Z6 ,3653
E-!-ENTR(JPV 2977 ,200 4 ,3549 ,2321 ,297 4 ,3853
MEAN TNCOME N,A, NA,. N.A N,A N,A, N,A,
(RUPEES) p I
(NP PER CAPITA 280 290 350 370 415 /415
(RUPEES)
(A) 1961-62 (f igures arc .xvcragc ol iwo estimates givnii hv lni0ztlN.(K) 1961-64 (higurcs arc avcrage ol 1961-62 and 1963-64)
50
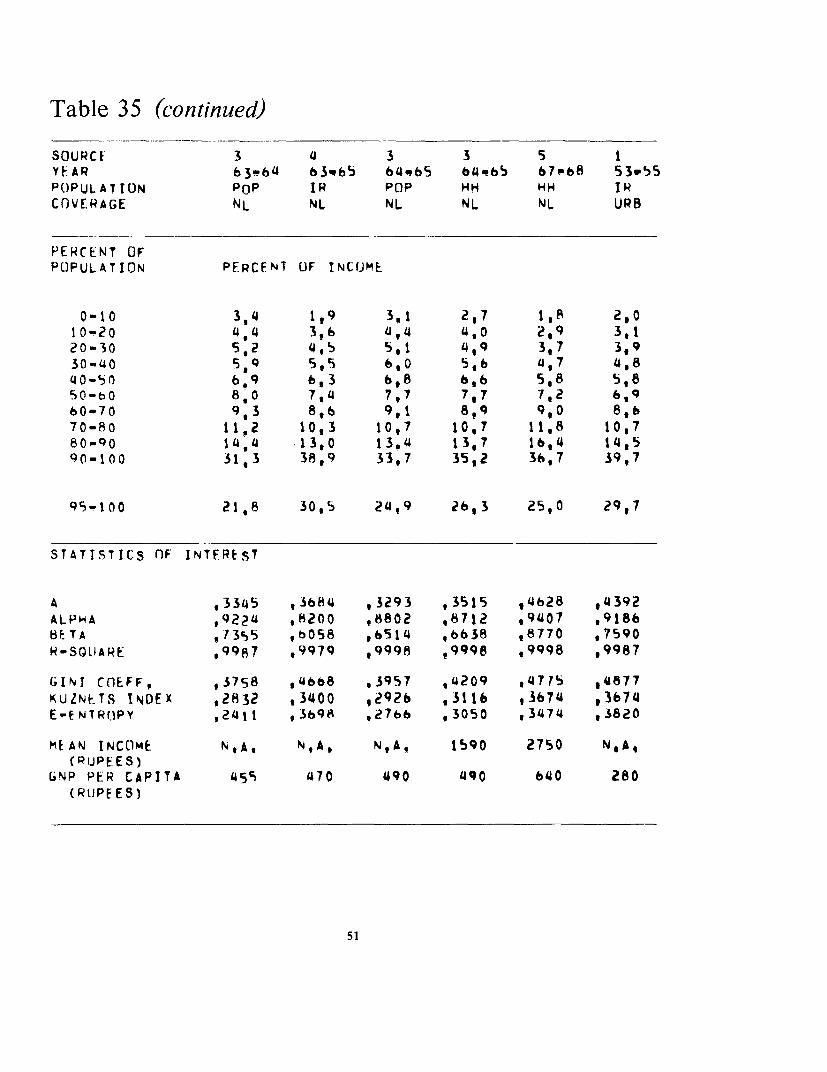
Table 35 (continued)
SOURCE 3 4 3 3 5 1
YEAR 63I6 4 63q65 6b4b5 64-65 67"68 53W55
POPULATION PoP IR POP HH HH IR
COVERAGE NL NL NL NL NL URB
PERCENT OFPOPULATION PERCENT OF INCOME
0-10 3,4 1,9 3,1 2,7 1,A 2,0
10-20 4,4 3,6 4,4 4,0 2,9 3,120-30 5,2 4,5 5,1 44,9 3,7 3,9
30- 40 S,9 5,S 6,0 5,6 4,7 4,8
40-50 6*9 6,3 6,8 6,6 5,8 5,850-60 8 *0 7,4 7,7 7,7 7,2 6,9
60-70 9,3 8,6 9,1 8,9 9,0 8,6
70-80 11,2 10,3 10,7 10,7 11,8 10,780-90 14,4 13,0 13.4 13,7 16,4 14,5
90-100 31,3 38A9 33,7 35,2 36,7 39,7
95-100 21,8 30,5 24,9 26h3 25,0 29,7
STATISTICS nF INTFREsT
A ,3345 ,3684 ,3293 ,3515 ,4628 ,4392
ALPHA ,9224 ,k200 ,8802 ,8712 ,9407 ,9186BETA ,1 3s5 ,b058 ,6514 ,6638 ,8770 ,7590
k-SQLIARE .9987 ,9979 ,9998 ,9998 ,9998 ,9987
GINT cnEFF, ,3758 *4668 ,3957 ,4209 ,47r5 ,4877
KUZNETS INDEX ,2832 ,3400 ,2926 ,3116 ,3674 ,3674
E-ENTRFIPY ,24i1 ,3698 ,27bh ,3050 ,3474 ,3820
MEAN INCOME N,A, N,A, N,A, 1590 2750 N,A,(PUPEES)
GNP PER CAPITA 455 470 490 490 640 280
(RJPE ES)
51
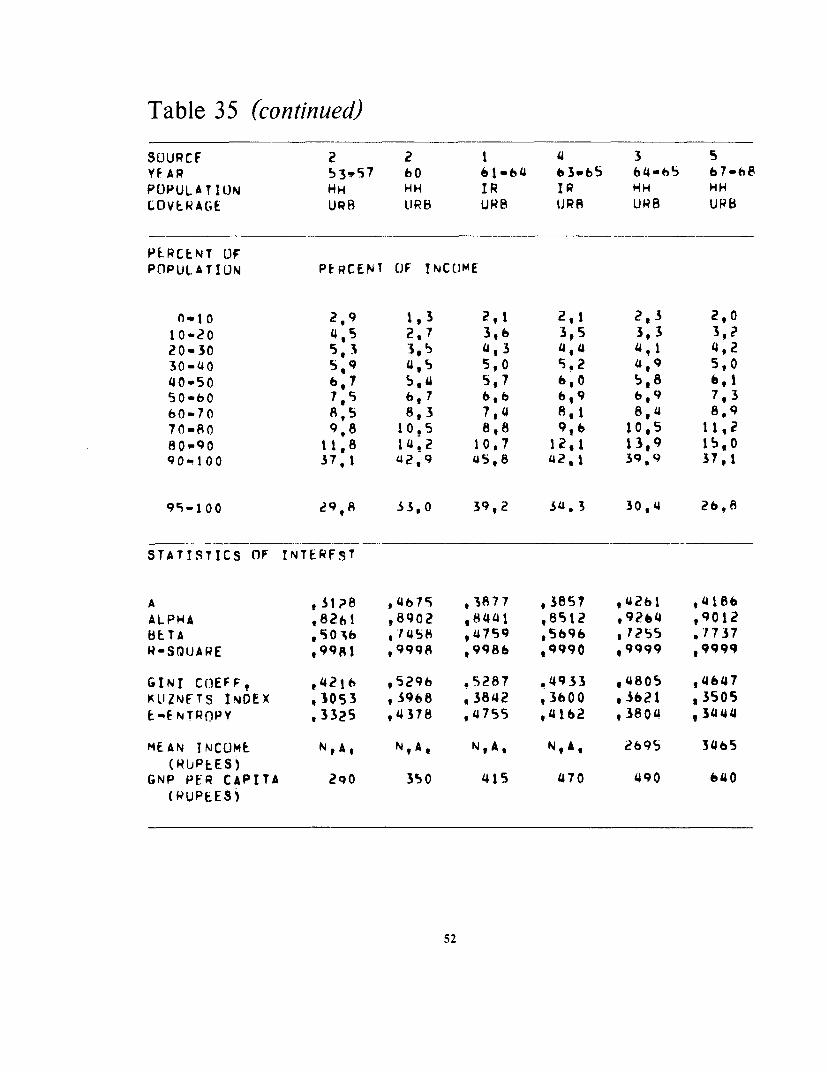
Table 35 (continued)
SUURCE 2 2 1 4 3 5YEAR 53T57 60 61-64 3w-65 64-65 67-h8POPULATION HH HH IR IR HH HHCOVERAGE URB LJRl URB lJQS URB URB
PERCENT OFPOPULATION PtERCENT OF TNC0ME
O.W10 2,9 1,3 2,1 2,1 2,3 2,010-20 4,5 2,7 3,6 3,5 3,3 3,?20-30 5,3 3,5 4,3 4,4 4,1 4,230-40 5.9 4,5 5,O 5,2 4 5,040-50 h,7 5,4 5,7 6,0 5,8 6,150-60 7,5 b,7 6,6 6,9 6,9 7,3h0-70 8,5 8,3 7,4 8,1 8,4 8,970-80 9,8 10,5 8,8 9,6 10,5 11,2BqO90 11,8 14,2 10,7 12,1 13,9 15,090-100 37,1 42,9 45,8 42,1 39,9 37,1
95-100 29 8 33,0 39,2 34,3 30,4 26,8
STATISTICS OF INTERFST
A ,31?8 ,4675 ,3877 ,3857 ,4261 ,418BALPHA ,8261 ,8902 ,8441 ,8S12 ,9264 ,9012BETA ,501h ,145k ,4759 ,5696 ,17255 ,7737H-SQUARE 99g1 ,9998 ,9986 ,9990 ,9999 ,9999
GINI COEFF, ,42Ž1 ,5296 .5287 ,4933 ,4805 94647KLUZNFTS INDEX ,1053 ,3968 ,3842 ,3600 ,3621 ,3505EtENTROPY ,3325 ,4378 ,4755 94162 ,3804 ,3444
MEAN INCOME N,A, N,A, N,A, NqA, 2695 3465(RUPEES)
GNP PER CAPITA 2q0 350 415 470 490 640(RUPEES)
52
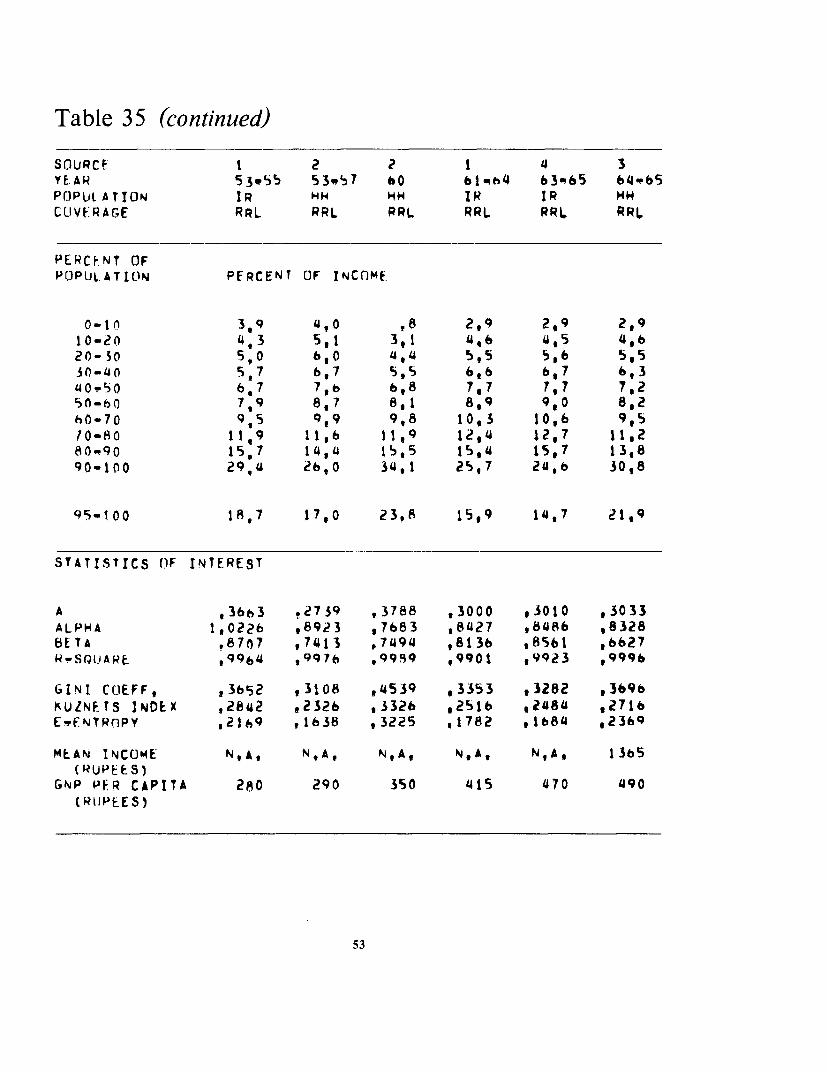
Table 35 (continued)
SnypcQC I 2 2 1 4 3YE AR 53,55 53w57 hO 61.,"h4 63u65 64J.b5POPUL, ATION IR HH HH IR IR HHCOVERAGE RRL RRL PRL RRL RRL RRL
PERCE.NT OFPOPULATION PERCENT OF INCOME.
0-10 3,9 4,0 ,8 2,9 2,9 2,910-20 4,3 5,1 3,1 4,6 4,5 4,620-50 5,0 6,0 4,4 525 5,6 5,5.0-40 5,7 6,7 5,5 6,6 6,7 6,340-5 6b,7 7, 6 6,8 7,7 I,7 7,2sn-60 7,9 8,7 8,1 8,9 9,0 8,2hO-70 9,5 9t9 9,8 10,3 10,6 9,510-80 119 11,h 1 1,9 12,4 12,7 11,280-90 15,7 14,4 15,5 15,4 15,7 13,890-100 29,4 26,0 34,1 2S,7 24,6 30,8
9S-100 18,7 17,0 23,8 15,9 14,7 21,9
STATISTICS OF INTEREST
A ,3663 .2739 ,3788 ,3000 ,3010 ,3033ALPHA 1,0226 ,8923 ,7683 ,8427 ,848b ,8328BETA .8707 ,7413 ,7494 ,8136 ,8561 ,6627RrSQUARL ,9964 ,9976 ,9999 .9901 ,9923 ,9996
GINI COEFF, ,3652 ,3108 ,4539 ,3353 ,3282 ,369bMU.NETS INDEX ,2842 t2326 ,3326 ,2516 ,2484 ,2716EFNTRnPY ,21h9 ,1638 ,3225 ,1782 ,1684 ,2369
MEAN INCOME N,A, N,A, N,Ag N,A, N,A, 1365(RUPEES)
GNP PFER CAPITA 280 290 350 415 470 490(RUlPEES)
53
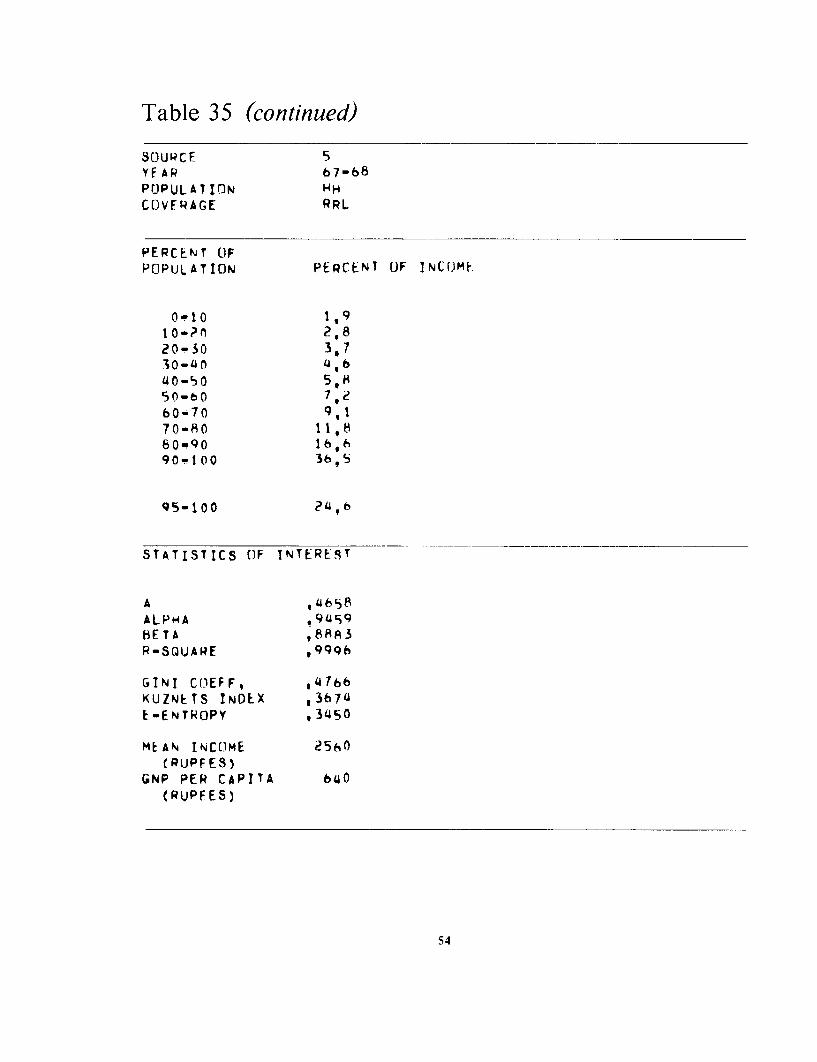
Table 35 (continued)
SOURCE 5YFAR b7-68POPULATION HHCOVERAGE RRL
PEPCENT OFPOPUJLATION PERCENT OF INCOME
-10 1 ,91 0-?O220-30 3, 730 -4 4 ,640-SO S1o
60-70 9, 170-MO 11,880-90 16 h 690!-100 3bq,
95-100 ,b
STATISTICS (IF TNTEREST
A , 4b6S8
ALPHA8ETA 883R-SQUARE ,9996
GINI COEFF, ,416bKUZNETS INDEX ,3674E-ENTROPY 3450
MEAN INCOME 25hO( R P F ES)
GNP PER CAPITA 6s°o(RUPF ES)
54
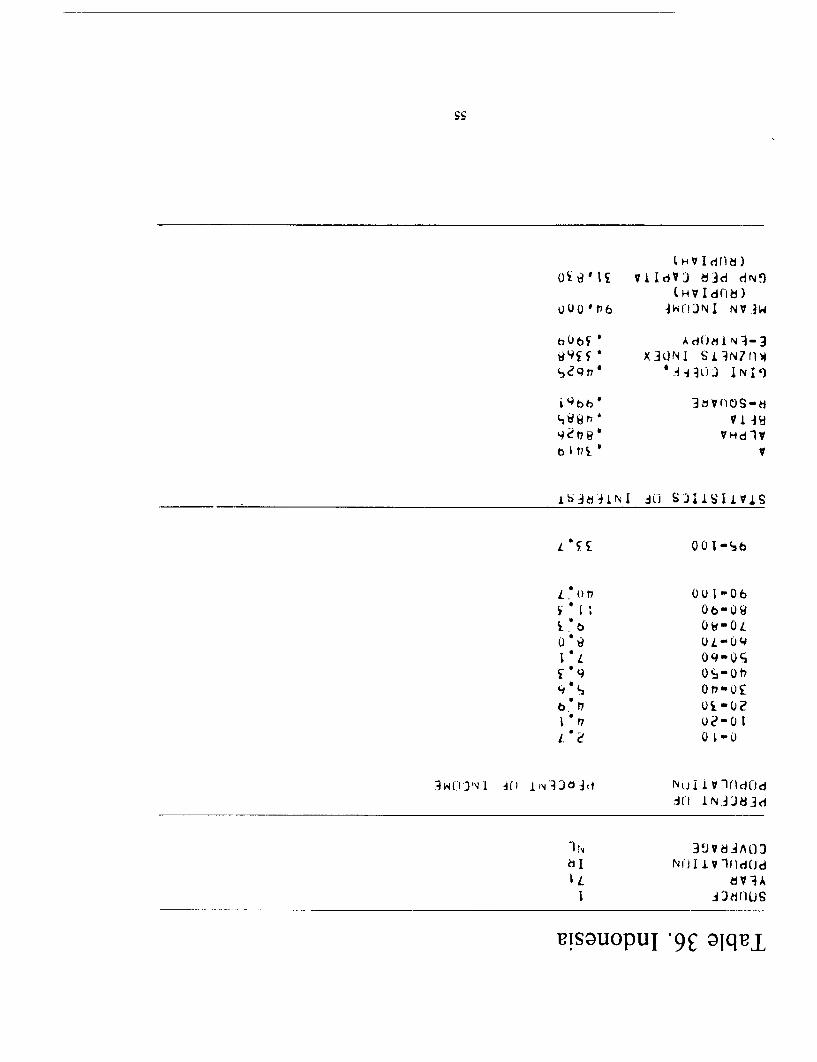
OS t.F' 1 V 1i dVJ 83d dN)(HYv I dfl?j)
(HV I dO 8)tQUO I'Wb P4HIJNI NV,3W
,5 , os A d(MI N I-3i4 9i f" X3UNI S1iN?7rj SZ9t7 '-2AIV3 IN;P)
i 9b)h '3V()Os -ti'd J? t7 vi p9
9etia 1 VHdlVIt 017 U V
LSdF1FLNI iXJ SJiiSUI±VjS
S I *T 06-OiQL 5 OU-OL
IL 09-U5H 0S-0CO 13 0~~~2-t7U t7 ' i 0 £
b. Ui?-1
L e OL -0
IHUJN 1 AO 1 r4 13ajc1 NOJ 1 V iridud-J 1 N.9 j 8 J cl
iNy 3J9VdAAOJNlJ I IV lfld(Jd
IL dV IAI A J ti f I sri
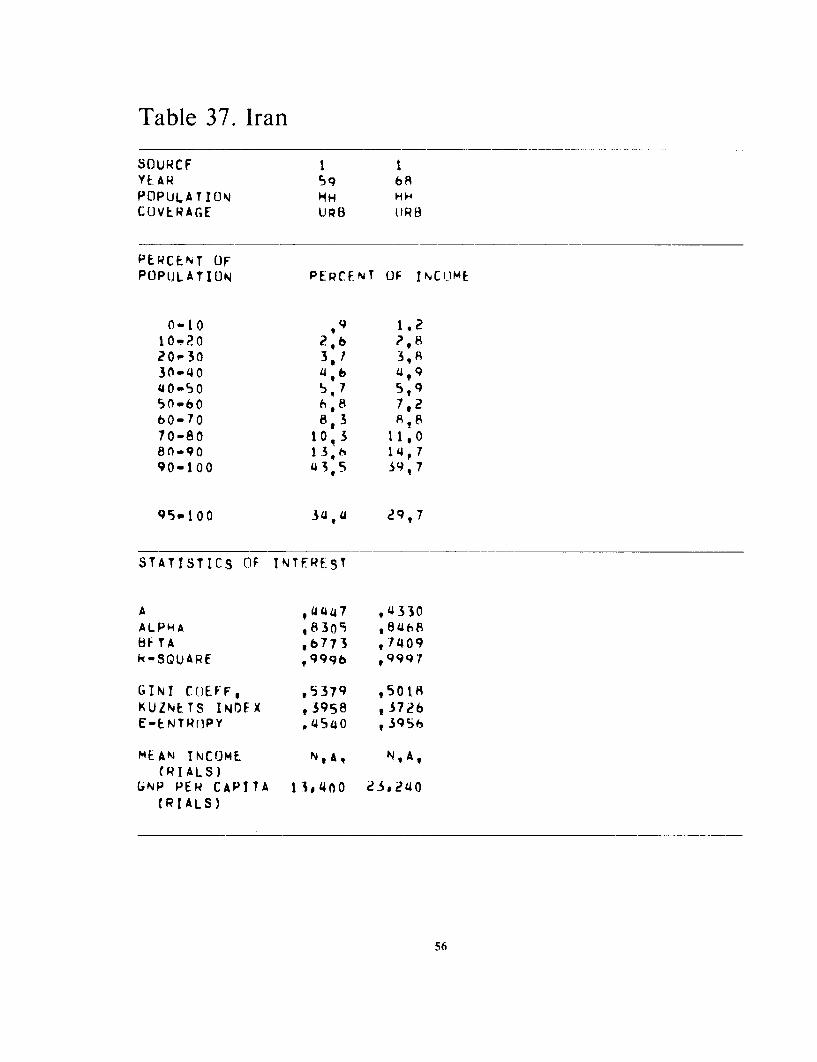
Table 37. Iran
SOURCF 1 1YE AR 5q 68POPULATION HHHHCOVERAG,E URB lJRB
PERCfNT OFPOPULATION PERCFNT OF INCOME
o010 ,9 1,210-20 2,b 2,R20q30 3,7 3,830-40 416 4,940-5o ,7 5,950W60 6,8 7,260-70 8,3 8,870-80 10,3 11,080-90 13,h 14790-100 43,5 39,7
95w100 34,4 29,7
STATISTICS OF INTFREST
A ,4447 ,4330ALPHA ,8305 ,814h8bFTA ,h773 ,7409N-SQUARE ,999b f9997
GINI COEfF, ,5379 ,501AKUZNETS INDEX ,3958 ,3726E-ENTRIPY ,4540 ,3956
MEAN INCOME N,IA N,A,(RIALS)
GNP PER CAPITA 13s.40 23.240(RIALS)
56
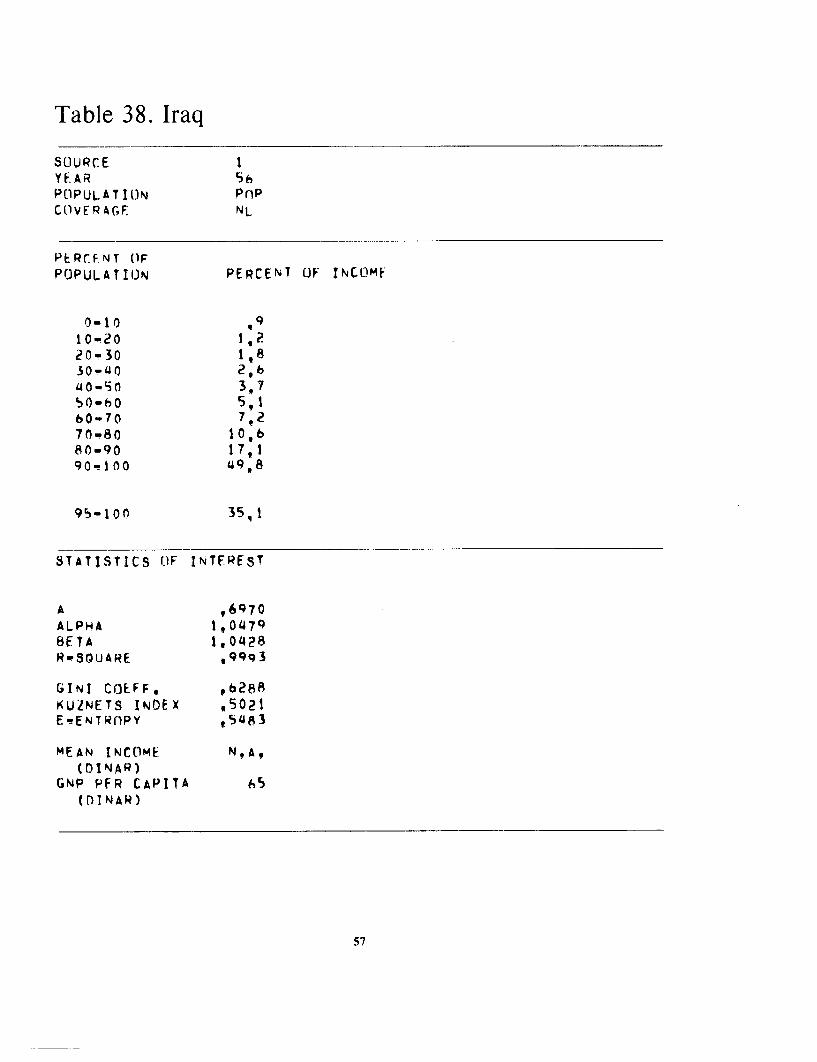
Table 38. Iraq
SOIURCE 1YEAR 56POPULATION Pr1PCI)VFPA Q ,F: NL
PERCF,NT (OFPOPULATION PERCENT OF INCOME
0-10 ,910-R20 1,?20-30 1,830-490 2,40-SO 3, 750hwO 5 160-70 7e270_-80 10,80-90 17,190-1I00 9q 8
95-100 35 1
STATISTICS O)F INTFREST
A ,6970ALPHA 1904 7Q8ETA 1,0428R.SQUARE ,9993
GINI COEFF, vb288KUZNETS INDEX .5021E-ENTRnPY 5S483
MEAN INCOME N.A,(DINAR)
GNP PFR CAPITA 65(DINAR)
57

Table 39. Israel
SCIURCt ¶ ? 3 4 3 5YEAR 57 5S/57 57-5B h3/b4 63-64 63/64
POPULATION (A) WH (8) HH (8) HHCOVE4AG1F. ~NL UR8 URRB IRi URB URB
PERCENT OFPIJPUL ATIlN PERCENT lF INCUME
0-to 2,5 3,3 2,2 3,0 2,6 16
10-20 44,6 5,9 44,6 5q3 4,7 4.320w30 5,9 7,0 5,9 694 5.9 5,7
30-40 6,9 8,0 7,1 7,3 1,0 7,040-50 8A2 8,9 8,2 8,4 8,1 8,250-60 9 , 9 7 9.5 9 ,3 9.3 9.7
60-70 11,0 10,8 8,0 10,5 10,8 11,270-80 12,9 1,9 12,9 t2,0 1.2,7 13, 380-90 15,8 13,8 19.5 14,3 15.4 16,090-Oao 22,7 20.7 23,1 23,5 23,5 23,0
95w100 13,1 12,6 13,6 14,8 1i4o 13,3
STATISTICS OF INTFREST
A ,282?2 ,1972 92764 2381 ,2767 ,2882ALPHA 7917 4P6838i ,1571 91414 7841 ,7295BETA ,8733 JC094 ,840o6 ,7193 ,82Q5 .8b90RPSQUAPE , s9955 !99h5 ,9987 ,9999 ,9998 ,9979
GINI COEFF, ,3143 21518 ,3314 ,2937 ,3i59 ,3326KUZNETS INDEX .2358 ,1811 .23b8 ,2137 .2358 ,2474E-LNTRIUPY ,1544 91O80 ,lbjO ,1435 .1580 ,1773
MEAN INCOME Nd, 3290 N,A, (350 N,A, N,A,(ISRAEL 1)
GNP PER CAPITA 1585 1519 1670 3465 346b5 34h(ISR&EL -)
IA) VWagc cazrnlcrs(1S) Jcwish wagc carnsrs household
58

Table 39 (continued)
SOURCE 3 3 6 3 3YtEAR 67 68 68/69 68/6 9 70
POPULATIOlN (8) t8) HH (B) (a)
CO)VERAGE URB UR8 URR URB URi
PERCENT OFPOPULATIfON PERCENT UF INCOMEt
0-10 1,9 1,8 1,3 2,3 3,1
10-20 4,0 4,4 3,7 4,6 4,720-30 5,? 5,8 5,0 5,9 5,9
30-40 6,4 6,9 6,2 7, I b,8
40-50 .7,b 8,2 7,9 8,1 S,0
50-60 8,9 9,9 9,0 9,5 9,3
60-70 10,6 11,0 10,8 10,9 10,8
t0-R0 12,7 13,0 13,0 12.7 12,880-90 16,0 15,A 1b,5 15,5 15,690.100 26,7 23,6 27,0 23,4 23,0
95-100 1b,5 13,9 16b,4 13e9 13,4
STAI1STICS H)F INTEREST
A .3236 ,28641 ,3388 ,2755 ,2838
ALPHA 7996 ,J/431 ,77'48 ,7590 .8388
bETA ,8325 ,H439 ,8548 ,8252 ,8716R-SQUARIF ,998? ,999S ,99tS 1,0000 99994
GIN! Ct1EFF, ,3667 ,3320 t3840 ,3195 ,3087KUZNF.TS INDEX ,2737 ,2463 ,2874 ,2368 ,2337E-ENTROPY ,21n3 ,1763 ,2292 1623 ,1483
MLAN INCOME N,A, N,A, NIA, N,A# N,A,
(ISRAfL -i)GNP PER CAPITA 45S45 5225 5530 5530 6505
(ISRAEL t)
tB) Jewish wage ceIIners household
59

Table 40. Ivory Coast
S()URCE 1 2YE AR 59 70POPULATION PoP 1WCOVERAGE NL NL
PERCFNY OFPOPULATION PERCENT fOF INCOME
0wI0 2 7 1 71 0 -2 0 3,9 2,220-30 4Ib 2,930-40 5,3 3,840-90 h%2 4,95060 7,1 , 360b70 t,4 8, 370-80 10,0 11,480-90 12,6 17,090-100 39,Z 41,5
95-100 30,9 28,y
STATISTICS ne INTERFST
A ,3728 *5590ALPHA .8932 1,0142ET A ,6 1a7 9592
R-SQUARE ,9900 9979
GINI COEfF, 4556 P ,5342KUZNFTS INtFX , 5379 ,4200EPENTROPY ,3h4ob ,L4213
MEAN INCOME N &, N,A,(CFA FRANCS)
6NP PER CAPITA 3S,845 80.875(CFA FRANCS)
60

Table 41. Jamaica
SOORCF IYEAR 58PrJPLILATIOJN HHCOVERAGE NL
PERCENT OFPO3PULATION PERCFNT OF INLOME
0-10 910-20 1,620-30 2 530-'40 3,5
50-60 6b2b0-70 8 370R8 I 1 5AO-90 17, 490-1 (00 43,8
5-0 0 30,2
STATISTICS (IF INTEREST
A ,5852ALPHA t9'498BETA ,9600RfSQUARE ,9999
GINI COEFF, ,5766KULNETS INDEX ,4495EPENTROPY ,4726
MEAN INCOME NeA(JAMAICAN $)
GNP PER CAPITA 265(JAMAICAN $)
61
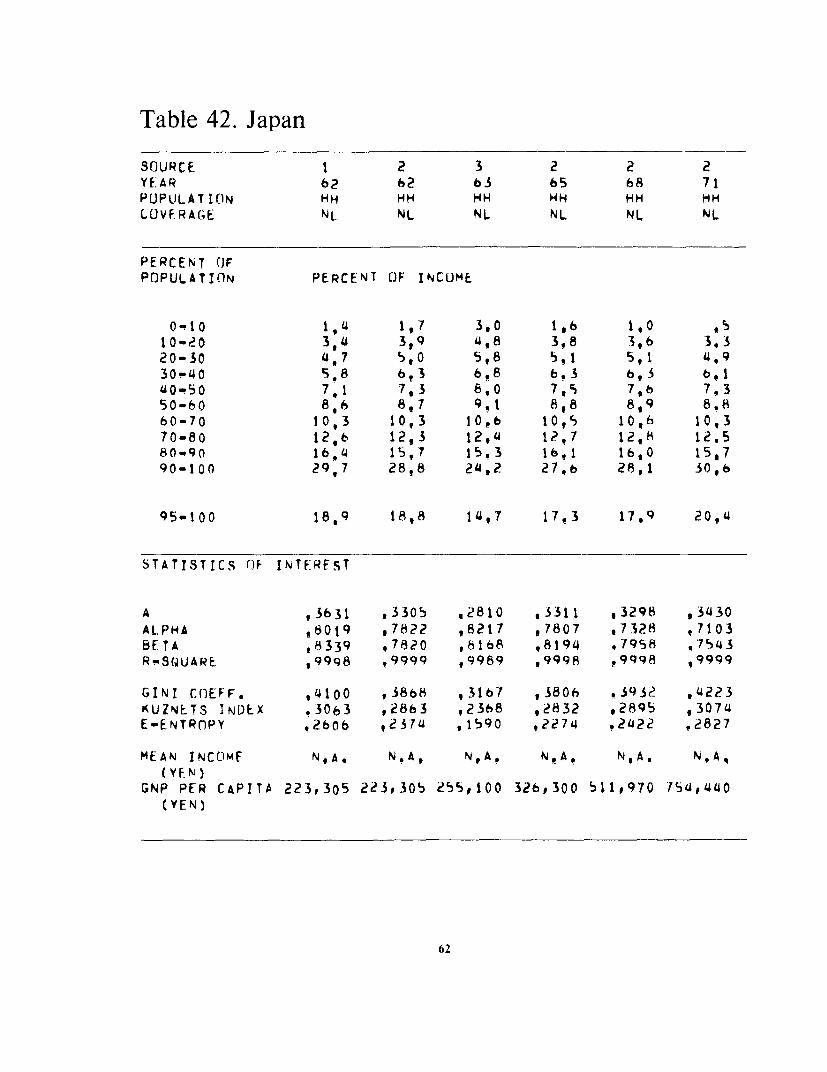
Table 42. Japan
SOURCE 1 2 3 2 2 2YEAR 62 62 63 65 68 71POPULATIOIN HH HH HH HH HH HHLOVERAGE NL NL NL NL NL NL
PERCENT OFPOPULATION PERCENT OF INCOME
0-10 1,4 1,1 3,0 1,6 1,0 ,510-20 3,4 3,9 4,8 3,8 3t6 3.320-30 4,7 S,0 5,8 S,1 5.1 4.930"40 5.8 6,3 6.8 b.3 6,p3 6,140-50 7,1 7,3 8,0 7,S 7,6 7,350-60 8,6 8,7 9.1 8,8 8,9 8.860-70 10,3 10,3 10,6 10,5 10lt 10,370-80 12,6 12,3 12,4 1?47 12.8 12.580 90 16,4 15,7 15,3 16,1 16,0 15,790-100 29,7 28,8 24,2 27,6 28,1 30,h
95-100 18,9 18,8 14,7 17,3 17,9 20,4
STATISTICS rF INTEREsT
A ,3631 ,3305 ,2810 ,3311 ,3298 ,3430ALPHA 280j9 .782? ,8217 r7807 ,7328 ,7103BETA ,8339 ,7820 ,8168 .8194 .7958 ,7543R-S(QUARE ,9998 ,9999 ,9989 ,9998 t 9998 ,9999
GINI CMEFF. ,4100 ,38b8 ,3167 ,3806 ,393c2 ,4223KUZNETS INDEX .3063 ,2863 ,2368 ,2832 ,2895 ,3074E-ENTRnPY .2606 ,2374 ,1590 ,2274 .2422 ,2827
MEAN INCME,M N . A , N .A, N A N A, NA. N . A,tYEN)
GNP PER CAPITA 223,305 223,305 255,100 326,300 511,970 154,440(YEN)
62
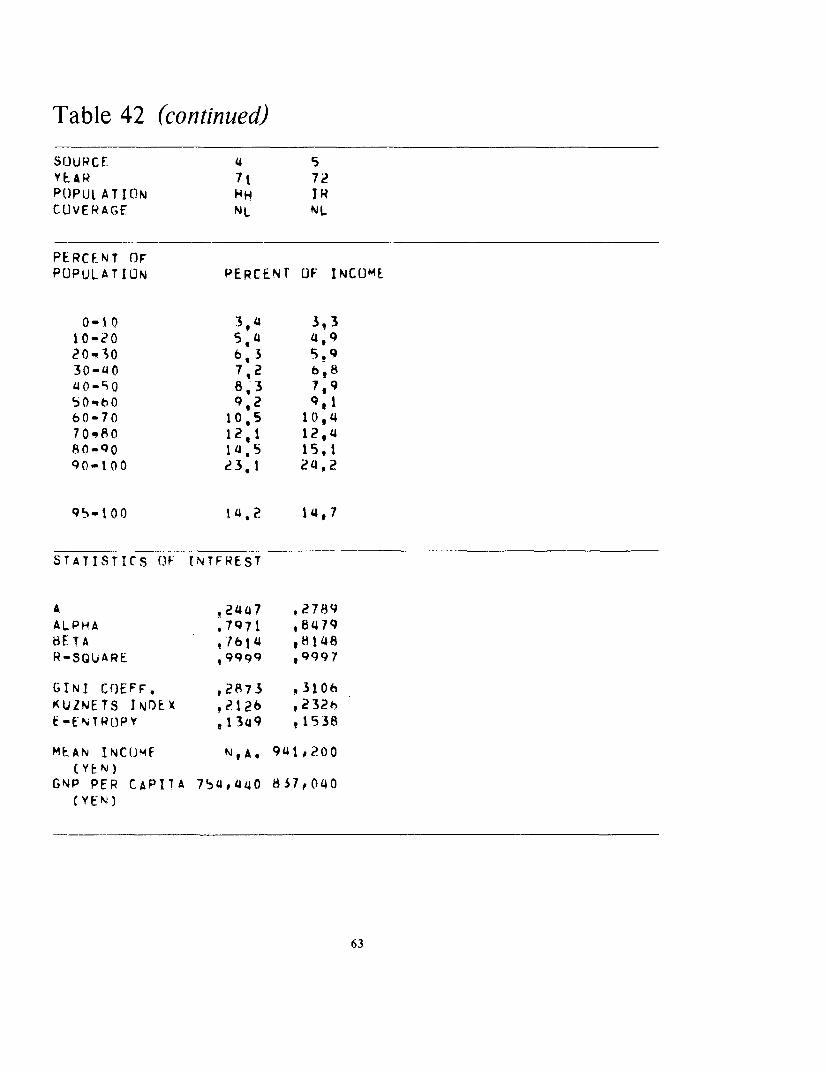
Table 42 (continued)
SrJuRcF 4 5YEAR 71 72POPULATION HH IRCOVERAGE NL NL
PERCENT OFPOPULATION PERCENT OF INCOME
0-10 3 '4 3,3
10-20 5.4 4920-30 6,3 5,930-40 7 2 b,8U 0 -1; 0 8.3 7,950b6O 9,2 9,160-70 10,5 10,470"80 12,1 12,480-q0 1i4.5 15,190-100 23,1 24,2
95-too 14.2 14,7
STATISTICS OF TNTFREST
A ,2447 .2789ALPHA .7971 ,8479BETA ,7614 ,8148R-SQUARE q9999 ,9997
GINI CC)EFF. ,2873 ,3106KUZNETS INOEX ,2126 ,232bE-ENTROtPY ,1349 ,1538
MEAN INCOMF N,A. 941,200(YEN)
GNP PER CAPPIA 754,440 8S7,p0ICYEN)
63
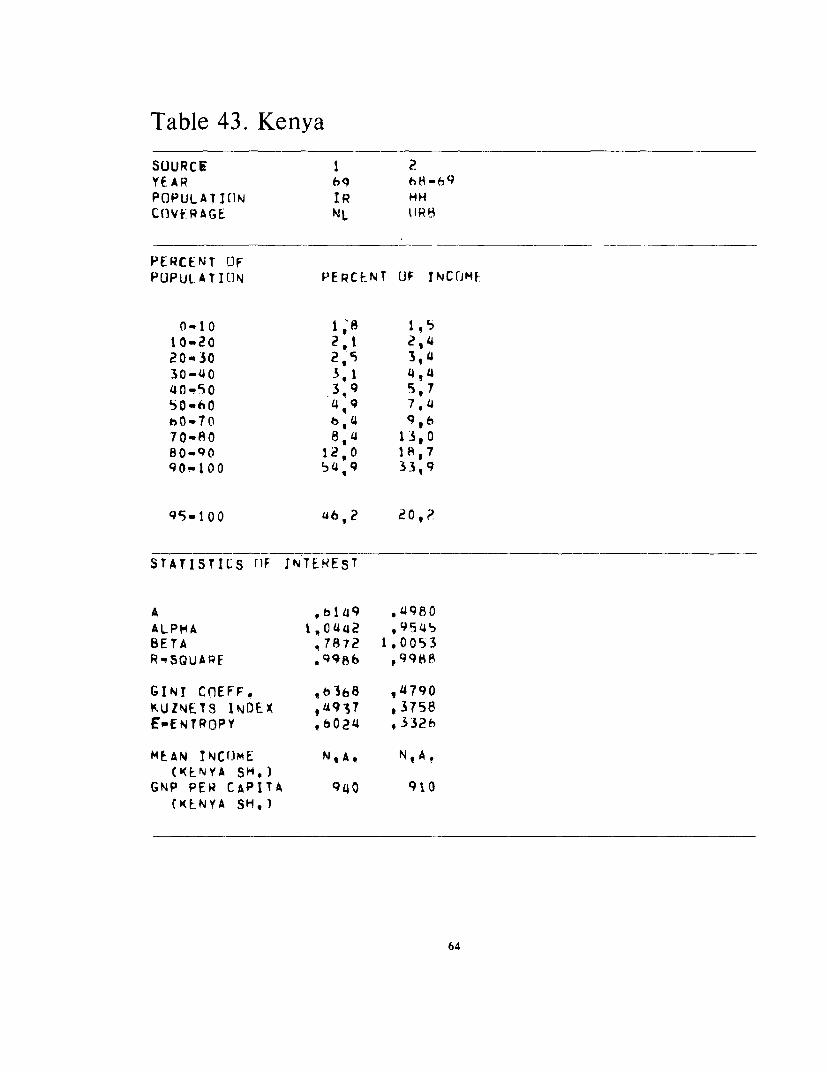
Table 43. Kenya
SOURCE 2YEAR h9 b8-b9POPULATION IR HHCOVE RAGE NL ORB
PERCENT OFPOPULATION PERCENT OF INCOME
n-l Q 1,510.20 2,1 2,420-30 2,5 }3,430-40 3, 1 4,4u40.-0 .3t9 5,750-h0 4t9 7.4b)0-70 b, 4 9,b70-so 8,4 13,080-90 12,0 18,790-100 54,9 3399
45-1oO 46,2 20,?
STATISTICS OF INTEREsT
A ,b149 .498 0ALPHA 1,0442 ,9545BETA t7872 1.0053R-SQUAPF ,9986 ,99$8
GINI COEFF. ,b368 ,4790KUZNETS 1ND0KX 419 37 , 3758E"ENTROPY ,bO24 ,332h
MEAN INCOME NA* N,Aj(KENYA SH.)
GNP PER CAPITA 940 910(K ENYA SH.)
64
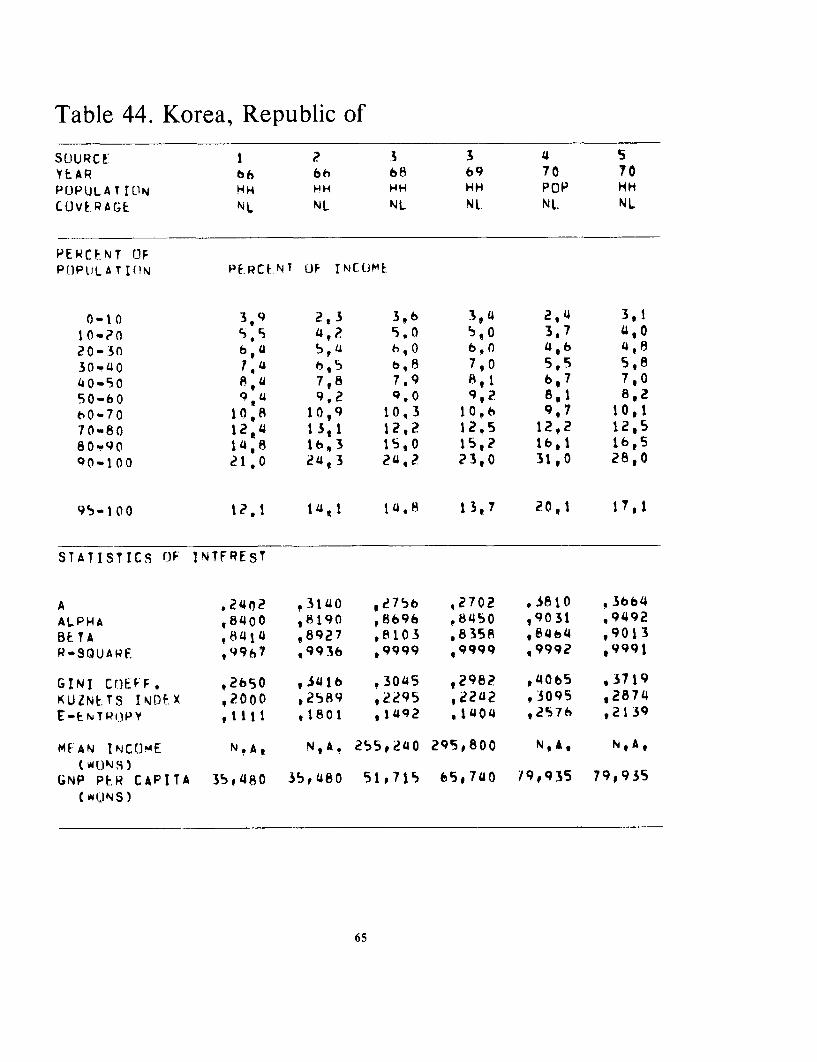
Table 44. Korea, Republic of
SOURCE I 2 3 3 4 5YEAR b6 6h 68 69 70 70PfLPULATItIN HH HH HH HH POP HHCLVERAGE NL NL NL NL. Nl. NL
PERCENT OFP)PL)L AT I0N PE.RCiNT OF INCOJME
0-tn 3,9 2,3 3,6 3,4 2,4 3,110-?O 5,5 4,? 9.0 5t0 3,7 4ag20-30 6,4 5,4 h,0 b,O 4,b 4,830-40 7,4 6,5 6,8 7,0 5,5 5,840-50 8,4 7,8 7,9 8,1 6,7 7,050-60 9,U 9,2 9.0 9,2 6,1 8,2hQ-70 1o,8 10,9 10,3 10,6 9,7 10,l70-80 12,4 13,1 12,2 12,5 12,2 12,580-90 14,8 16,3 15,0 15,2 16,1 1b,59Q-100 21.0 24,3 24,? 23,0 31,0 28,0
95-100 t2.1 14U1 14.8 13,7 20,1 1T,1
STATISTICS OF INTFREST
A ,2402 ,3140 ,275b ,2702 .3810 *3664ALPHA ,8400 8190 ,8696 ,8450 ,9031 ,9492BETA ,8414 98927 ,8103 ,8358 ,8464 ,9013R-SQUARE ,99h7 ,9936 ,9999 ,9999 ,9992 ,9991
GINI COEFF. ,2650 ,3416 t3045 ,2982 ,4065 ,3719KUZNETS INDEX ,?000 ,2589 ,2295 ,2242 .3095 ,2874t-ENTR(.PY ,1lll ,1801 ,1492 ,1404 ,257h ,2139
MEAN INCOME N.A, N,A, 255,240 295,800 NhA, N,A,WUONS)
GNP PER CAPITA 35,480 35,480 51,715 65,740 79,935 79,935C INS)
65

Table 44 (continued)
SfOURCE 6 7 8 2 7 2YEAR 70 71 71 66 71 66POPULATION HH HH HH HH HH HHCOVERAGE NL NL NL URB URB RRL
PERCENT OFPPUOPATION PFRCENT OF INCOME
0,10 2.5 ?,q 44,2 1,A 3,4 2,910-20 4,0 4,t3 597 4,7 4,7 4,620-30 5,0 5,2 6,5 6,1 5,7 5,730-40 6,0 b,3 7,3 7,2 6,6 b6940-.50 7,0 7,3 8,2 8,4 7,4 8,150whO 8 4 8,5 9, 1 9,5 8,6 9t560,70 9,9 10,0 10,2 1a,8 9,8 11,270-80 12*0 12,1 11,b 12,6 11,6 13,480-90 15 S 6 15,3 13,9 lS.0 41 5 .390-100 29,6 28,1 23,3 23,9 27,7 21,4
95-100 19, l 18,1 14,8 14,8 18, 5 1 6
STATISTICS OF INTEREST
A .3455 .3233 ,2298 ,?bll I 2914 .2960ALPHA ,867S 78611 ,8359 ,b6959 8590 .8550
EtTA .8028 .7973 .7133 .7616 t,283 ,9644R-SGUAPF .99qt t9991 ,9996b 9953 t9996 ,9986
GINT COhEFF, , 3836 ,3hO ,271 ,3229 ,3381 30 56KUZNtTS IND)EX ,2884 ,2705 .2011 ,2347 .2516 ,2347E-ENTROPY .2339 ,?079 ,1259 .1738 ,1922 ,1427
MEAN INCOME N,A, 448,fO0 400,080 N,A, 543,004 N,A(WONS)
GNP PER CAPITA '9,935 9b,190 96,190 3r,'480 96,190 35,480(WONS)
66
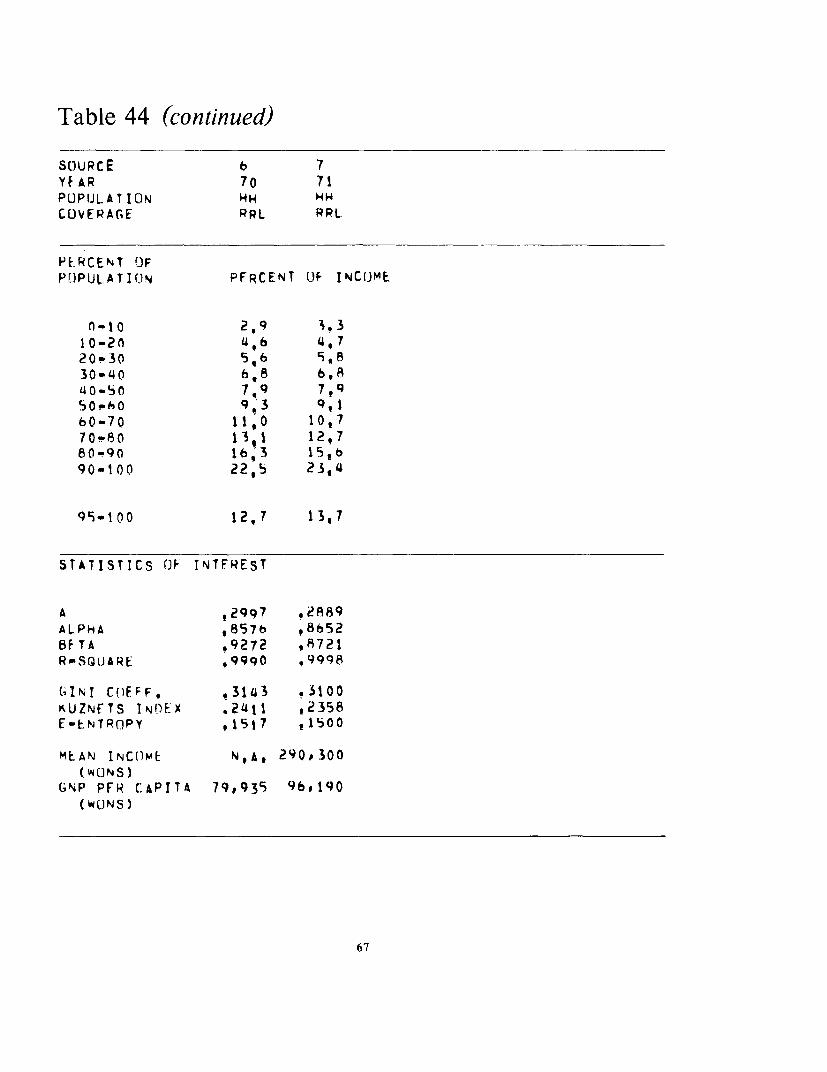
Table 44 (continued)
SCOURCE 6 7YE AR 70 7 1POPIJLATION HH HHCOVERAG7E RRL RRL
PERCENT OFPOPULATIONJ PFRCENT OF INCOME
n-to 2,9 3,310-20 4ss 6 720-30 5,6 9,830-4 0 6 * 8 6,840-5O 7,9 Tt9SOphO 9,3 q,I60-70 11,0 10,770-80 13,1 12,780-90 16b3 15,690-100 22,5 23,4
99.100 12,7 13,7
STATISTICS OF INTFREST
A e2997 ,2889ALPHA ,857b 86h52BETA .9272 ,A721RPSQUARE t 99q0 .9998
1.INI COFFF. .3143 31 00KUZNFTS IN D E X 22411 2358E-ENTROPY ,1517 t1b00
MEAN INCOME N,A, 290,300( OCN S)
GNP PFR CAPITA 79,939 96,190W(.) N S)
67

Table 45. Lebanon
SOURCE IYEAR S)hPOPULATION HHCOVERAGE NL
PERCENT OFPOPULATION PERCENT OF INCOME
0-10 2,410-20 2,720-30 3t2
30-60 4, 0
SQ-bO ~ ~~~~ 6,
70-R0 $ 890Q0 1, I390-10045l
95-100 34, 6
STATISTICS OF INTFREST
A ,9322ALPHA IQ039qbFTA .S3b1R-SQUARE , 9954
GINI COEFF .5370KUZNE TS INDEX ,41 79E-ENTROPY ,M45J 7
MEAN INCUMF Nt,A(LE4ANESE i)
GNP PER CAPITA (A)(LE8ANFSE + )
(A Lchbarisc B855 (csIiin,ite is 1or 19600
68
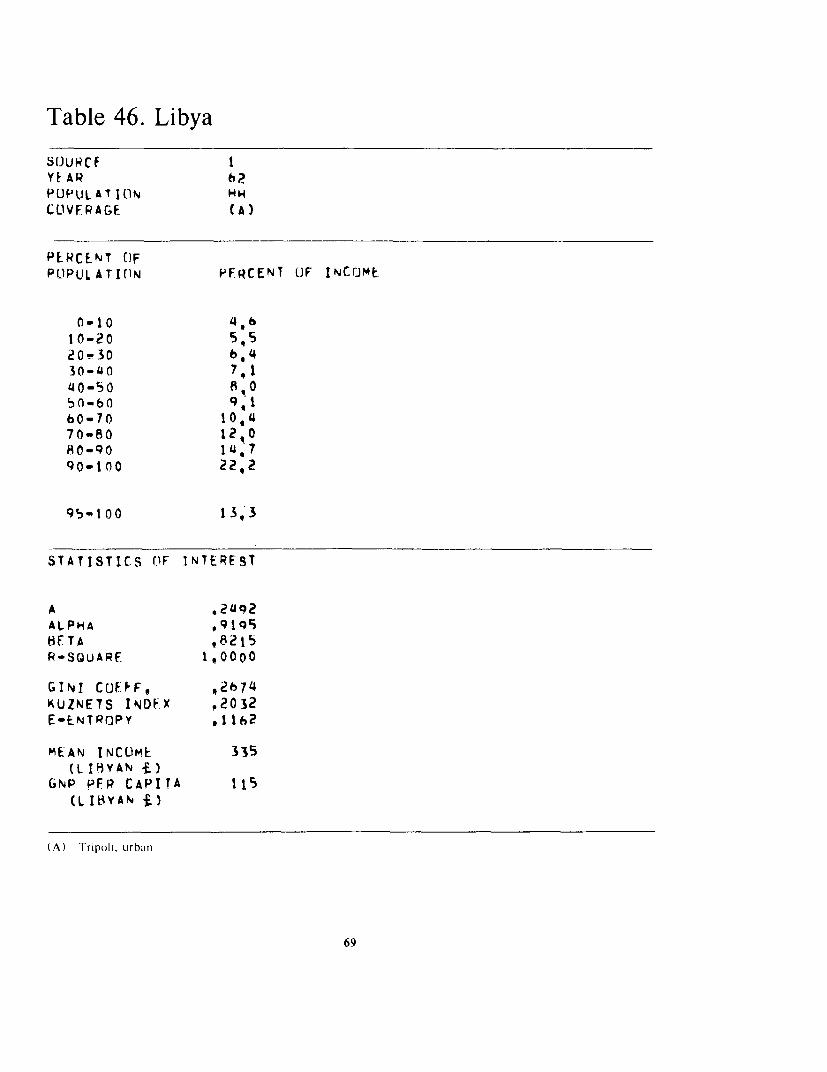
Table 46. Libya
S(JURCE IYF AR hPOPULATION HH1.4CLlVFRAGE (A)
PERCEfNT OFPOPUL ATICIN PFRCENT OF INNCUMt
0-10 4*610-20 5q520-30 6Q430-40 7,140-S0 8,0sn-60 9, t60-70 10, 470-80 12, 0A0-90 1I4a790-100 22,2
95-100 13,3
STATISTICS (IF INTEREST
A , 2492ALPHA 99199HFTA ,82t5R-SQUARE 10000
GINI COEFF, 12674KUZNETS INDEX .2032E-ENTROPY ,11I2
MEAN INCOHE 335(L IBYAN i-)
GNP PFR CAPITA 115(L ItYAN i )
(A) Tripolh, urban
69

Table 47. Malagasy Republic
SUURCF IYEAR 60POPUJLATION NPPCOVERAGE NL
PERCFNT OJFPOPUL ATILIN PERCENT OF INCOME
0-10 2,210-20 3t020-30 3,b30-4n 404~0-SO 5,050-60 6, 060-70 7,170-80 8,e80-900
95-100 41,0
STAIISTICS (IF INTERE ST
A 9 4728ALPHA ,99489BErTA .b242R-SOUARE ,99h
6INI CrJFFF. 5618KUJZNF.TS INI)EX .4221E-ENTRnPY tS129
MEAN INClME N,At
GNP PER CAPITA N,A.
70
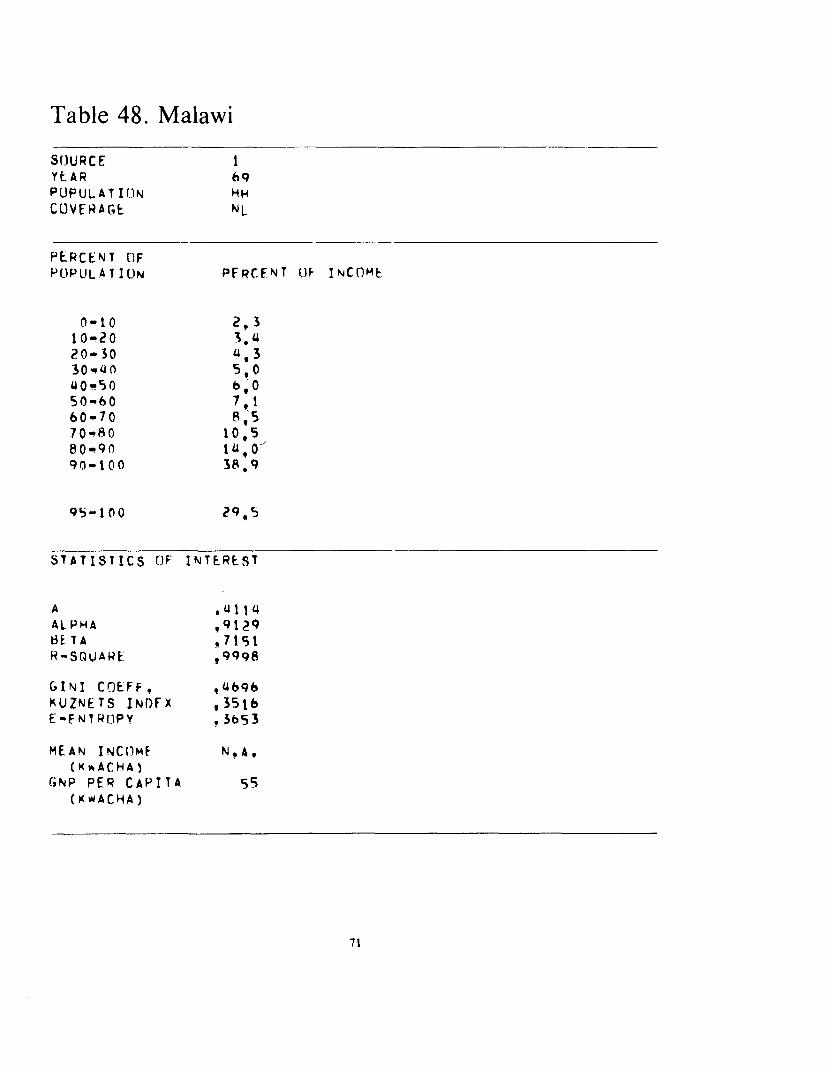
Table 48. Malawi
SOURCE IYEAR 69POPULATION HHCOVERAGT NL
PERCENT (IFPUPLILATIUN PFRCENT OF INCOME.
0-10 2,310-20 3.1420-30 /43
3o.q40 5,0SjO-5 0 b, 0s0-bo 7,160-70 8,tS
70-80 10,580-90 jsa,'090-100 38,9
qs-100 29,5
STATISTICS OF INTEREST
A .14
ALPHA t9S29BETA I1I51R-SOUARE ,9998
GINI COEFF, 4,696KUZNETS INDEX ,35h6E-FNTPClPY ,3653
MEAN INCOME N,A,(K-ACHA)
GNP PER CAPITA 55(KWACHA)
71

Table 49. Malaysia
SOURCE 1 2 2 2 2 3YEAR 57"58 57/58 60 61/68 70 70POPULATION HHH H H H NH
COVERAGE NL Nl NL NL NL. NL
PERCENT OFPOPULATION PERCENI 1F INCnME
0-10 2,6 2,2 1,2 Ito 1,2 1,110-20 4,0 3,6 ?,0 2,2 2?6 2,420-30 S,0 4,5 2.7 3,1 3.5 3,430-40 6.1 594 3,7 all 4.5 4,34Q0-S0 7,2 8,5 4,7 5,1 5,5 5,6
50-60 8,5 7,6 lb8, boa 6,9 3,9
60-70 10,2 9,2 7,9 8,2 8,t 8,870-80 12,5 1 ,I 10,6 10,7 11I0 11, '80-90 16,l 14,8 15,5 15,1 15,1 16,19 0- 00 02 7 ,8 3 Ut8 45o 7 44 ! 1 41 t | q 9
95-0 0 17 2 24,9 34,0 33,3 30, s 28,3
STATISTICS OF INTERESI
A ,3449 .3826 ,5598 ,5122 .4715 ,4854ALPHA ,8772 t8759 .9633 t91oo 8921 ,8993BFTA ,8563 ,7485 ,8763 ,8128 ,7954 ,8497R-SOUARE 999999 ,99999 ,9996 ,9987 99997 .9997
GINI COEFF'. ,3708 i4356 ,571b ,5545 t5194 ,51 79KUZNETS INQEX .2811 t3263 ,4411 ,4200 .3916 .3947E-ENTR(PY .2134 ,3082 ,'4824 04621 ,41-38 ,4030
MEAN INCOME N,A* 2640 3000 2820 3300 3170(MALAYSIAN S)
GNP PE.R CAPITA 715 715 800 970 1070 10t0(MALAYSIAN S)
72
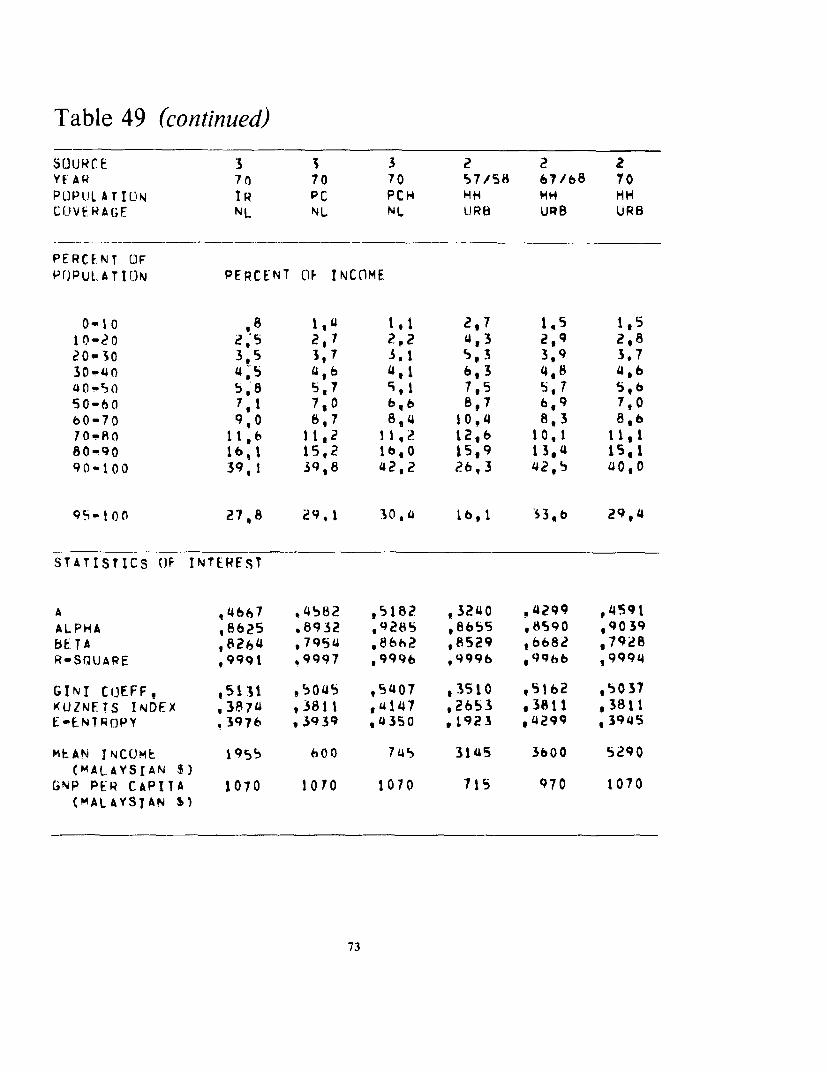
Table 49 (continued)
SOURFCE 3 3 3 2 2 2YE AR 70 70 70 57/58 67/b8 70PUPULATION IR PC PCH HH HH HHCOVE'RAGE NL NL NL URB URB URB
PERCENT OFPOPUL A T IN PERCENT tTh INCOME
0-10 18 ,oU l,1 2,7 1,5 1,5
10-20 2,5 2g7 2,2 413 2,9 2,820-30 3,5 3t 7 3, 1 5, 3 3,9 3, 7
30-40 4.5 4,6 ,1 ,3 4,8 4,iuO-S 5,8 5,7 7, t,5 5, 7 5,650-60 7,1 7,0 b,b 8,7 6,9 7,060-70 9,0 8,7 8,4 10,4 8,3 8,6Tom0 b11,6 11,2 11,2 12,6 10,1 11,180-90 16,1 15,2 16,0 l5,9 13,4 15,190-100 39,1 39,8 42,2 26,3 42,5 40,0
95-I00 27,8 29,1 30,4 1b,1 33b 29,4
STATISTICS OF INTEREST
A ,4667 ,4b82 ,5182 ,3240 .4299 ,4591ALPHA 18625 8932 ,9285 ,8655 ,8590 ,9039bETA ,8264 ,7954 ,8b62 ,8529 ,6682 ,7928
R-SQUARE 9991 . 9 ,999b ,99b ,9994
GINI COEFF, ,5131 ,5045 95407 ,3510 ,5162 05037KUZNFTS INDEX ,3874 ,3811 ,u147 ,2653 ,3811 ,3811
E-tNtR OPY .3976 ,3939 .4350 ,1923 ,4299 ,3945
MEAN INCOME 1955 600 74S 31uS 3600 5290
(MALAYSIAN $)
GNP PER CAPITA 1070 1070 1070 715 970 1070(MALAYSIAN S)
73

Table 49 (continued)
SOURCE 3 3 3 3 2 2YEAR 70 70 70 70 57/58 70POPULATION HH IR PC PCH NH HHCOVERAGE URB URB OJRS URB RRL RRL
PERCENT OFPOPULATION PE9RCENT OF INCO)ME
0-1o 1,2 1,0 1,b 1,3 2,8 1,310"20 2,5 2,5 297 2,3 4,4 3,020-30 3,5 3,5 3,6 3,3 5,4 4,130-40 4 ,5 414 4.6 4,3 6,5 5,140-50 5,7 5,6 S,6 St4 7,5 6,1450-60 7,0 7,0 7.0 6,8 8,7 7,760-70 8,9 8,7 8,7 8,7 10,2 9,470-80 11t5 11,2 11,2 11,4 12,3 11,880-90 16,0 15,S 1i,b 16,2 15,4 15,890-100 39,2 40,h 391t4 440,3 2h,8 35 ,4
95'100 27,8 29,7 ?8,4 28,5 1he,9 e4,5
STATISTICS OW INTEREST
A ,4732 .4721 ,14b67 ,4992 ,3107 ,4136ALPHA ,8961 ,879? ,9182 ,9248 ,8459 ,8459hETA ,8397 ,805h ,8232 ,8693 ,8037 ,8013RvSQuARE t9995 .9998 ,9996 09995 .9Q9 7 ,9987
GINI COEFF, ,5083 ,5205 ,5006 .5210 ,3i484 ,4643KUZNETS INDEX ,3863 ,392h ,3811 ,3989 .2611 ,3474E-ENTRtOPY ,39 17 ,4129 , 38b4 ,14068 ,1926 ,3338
MEAN INCOME 51 35 2870 950 1200 1870 2450(MALAYSIAN $)
GNP PER CAPITA 1070 1070 l070 1070 715 1070(MALAYSIAN S)
74

Table 49 (continued)
SOURCF 3 3 3 3 3 3YEAR 70 70 70 70 70 70
POPULATTON4 HH IR PC PCH HH HH
COVERAGE RRL RRL RRL RRL (A) (B)
PERCENT LOFPOPULATIONJ PERCENT OF INCOME
0-O0 1 , 3 1,0 1,7 1,3 1,3 1,310-20 2,8 2,8 3,1 2,6 2,4 2,820-30 3,8 14,n 4,2 3,7 3,4 3,930-40 4,8 5,0 5,2 4,6 ',3 5,040"50 h,1 6,3 b,3 597 5,4 6,250-60 7,5 7,7 7,6 7,1 6,8 1,760-70 9'4 9,5 9,3 8,8 8,7 9,670-80 12,0 12,1 11,6 11,4U 11,3 12,280-90 1 5 16,3 15,5 15,5 15,9 16,790-100 35,8 35,3 35,5 39,3 40,5 34,6
95-100 24,2 24,0 24.9 28,3 28,9 22,9
STATISTICS OF INTFRE.ST
A ,4435 ,1426? ,14095 ,4597 ,4925 ,4342ALPHA ,87q4 ,8410 ,8668 ,8867 ,9202 ,8710b TA , @ 8557 ,8288 .7904 ,8102 .8519 ,86429-SOUARE ,9993 ,9985 ,9996 ,9995 ,9993 ,9998
GINI Cf..IFFF q47h4 ,t ,4729 i4577 *5037 ,5198 ,14664KUZNETS INOEX .361 1 3547 ,3432 ,3811 ,3968 ,3537E-FNTROPY ,3435 ,3404 ,3283 ,3888 ,4076 ,3286
MEAN INCOME 2400 1535 455 550 5940 4130(MALAYSIAN $)
GNP PER CAPITA 1070 1070 1070 1070 1070 1070(MALAYSIAN $)
ismli7
75
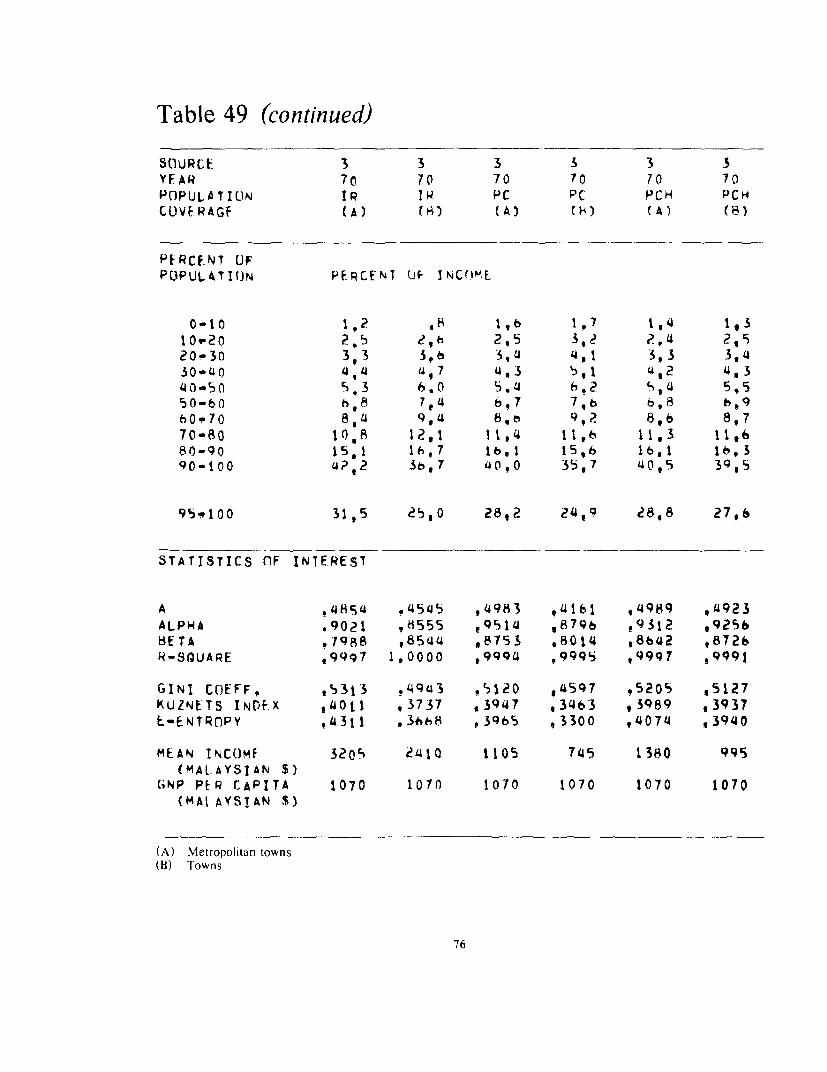
Table 49 (continued)
SOURCE 3 3 3 3 3 3
YFAR 7 70 70 70 70 70POPULATION Ip IR PC PC PCH PCH
COVERAGF (A) (H) (A) (A)
PERCfNT UfPUPULATION PERCENT JF INCOME.
0-10 1,? ,6 1,b 1,7 1,4 1,3
10'20 2,5 2,6 2,5 3, 2.,4 2,520-30 3,3 36 3,41 4 ,1 3,3 3,430-40 494 4,7 4,3 5,1 4l2 4,3410-SO C,3 6.0 5,4 6,2 S,4 5t550-0 h8,6 7e4 6,7 7,6 6.8 h,9
60*70 864 9,4 8,0 9,2 8,6 8,7
70-80 10, 12,1 11,4 1 ,6 11,3 11,680-90 15,1 16,7 Ib,1 15,6 16,1 1(,390-100 4?,? 36,7 '40,0 35,7 4095 3Q,5
95w100 31,5 2S,O 28,2 24,9 28,8 27,6
STATISTICS nF INTEREST
A *4894 .4545 ,4983 ,41161 ,4989 ,4923
ALPHA .9021 ,.8555 ,951J , 8796 !9312 ,9256BETA ,7988 ,8544 ,8753 .8014 ,8642 ,8726
H-SQUARE t9997 1,0000 ,9994 .9995 .9997 ,9991
GINI COEFF ,5313 94943 ,5120 ,4597 ,5205 .5127KUZNETS INDEX ,40t 1 , 3737 , 3947 , 3463 , 3989 ,3937E-ENTROPY ,4311 , 36hh b 3965 , 3300 ,4074 ,3940
MEAN INCOMf 3205 2410 1105 745 1360 995
(MALAYSIAN $)(;NP PER CAPITA 1070 1010 1070 1070 1070 1070
(M AYYSIAN 5)
(A) Metropolitan towns(B) Towns
76
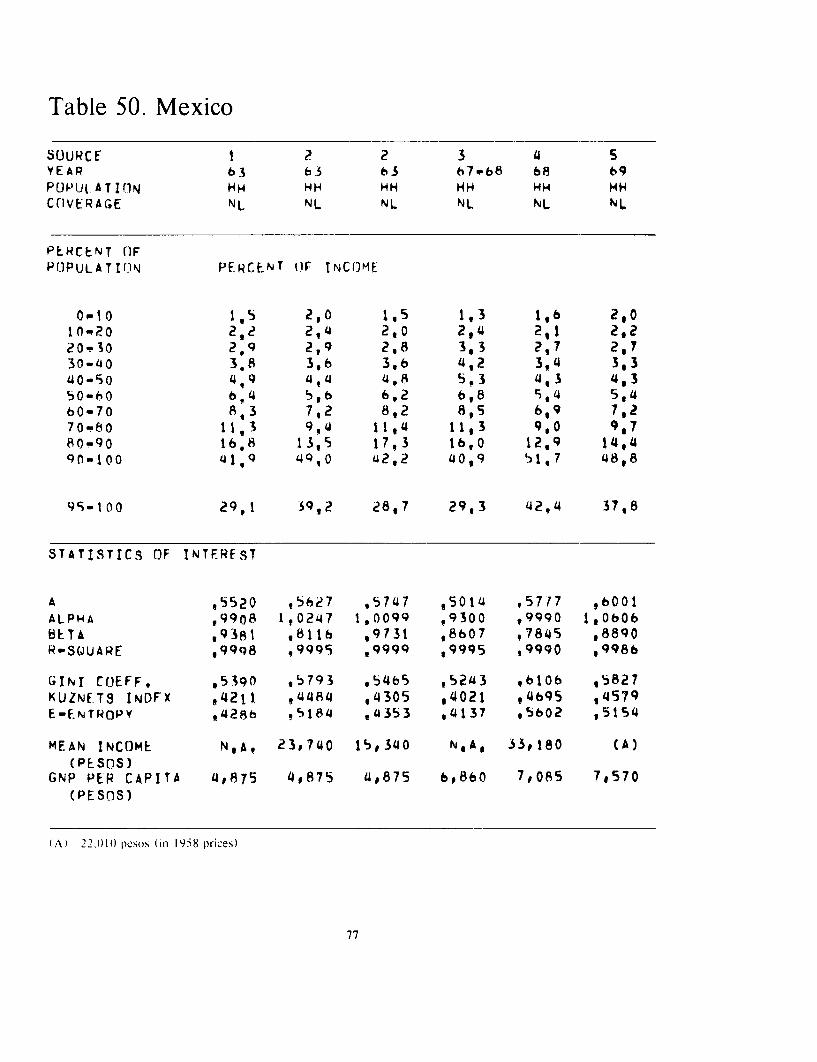
Table 50. Mexico
SOURCE I 2 2 3 4 5YEAR 63 bS 63 676b8 68 69POPULATION HH HH HH HH HH HH
COVERAGE NL NL NL NL NL NL
PERCENT O)FPOPULATr ON PF RCENT IhF INCOME
o0wo 1,5 2,0 1,5 1,3 1,6 2,010'"20 2,2 2t4 2,0 2,4 2,1 2,220-30 2,9 2,9 2,8 3,3 2,17 2,730-40 3a8 3,6 3,6 4,2 3,94 3.340-S0 4,9 4,4 4,8 5,3 4,3 4,350-60 6,4 5,6 6,2 6,8 S,4 5.460-70 8,3 7,2 8,2 8,5 6,9 7,270-80 11,13 9,4 11,4 11,3 9,0 9,780-90 16,8 13,9 1793 16,0 12,9 14,490-100 41,q 49,0 42,2 40,9 31,7 48,8
9s-tno 29,1 S9,2 28,7 29,3 42,4 37,8
STATISTICS OF INTEREST
A 95520 ,5627 ,5747 ,5014 ,5717 ,OOlALPHA ,99o8 190247 1,0099 ,9300 .9990 1,0b06BETA .9381 .8116 ,9731 ,8607 t7845 ,8890RPS0UARE ,99Q8 99995 99999 ,9995 ,9990 ,9986
GTINI COEFF, ,5390 .5793 *5465 ,S243 .6106 ,5827KUZNE.TS INDFX t4211 ,4484 ,4305 94021 ,4695 ,4579E-F.NTROPY 4286 %5184 .4353 .4137 .5602 ,5154
MEAN INCOME N,A, 23,740 1$,340 N,A, 3,3180 (A)(PE.SOS )
GNP PER CAPITA 4,875 4,875 4,875 b,860 7,085 7,570(PESOS)
(A) 220)10 pesos (in 1958 prices)
77
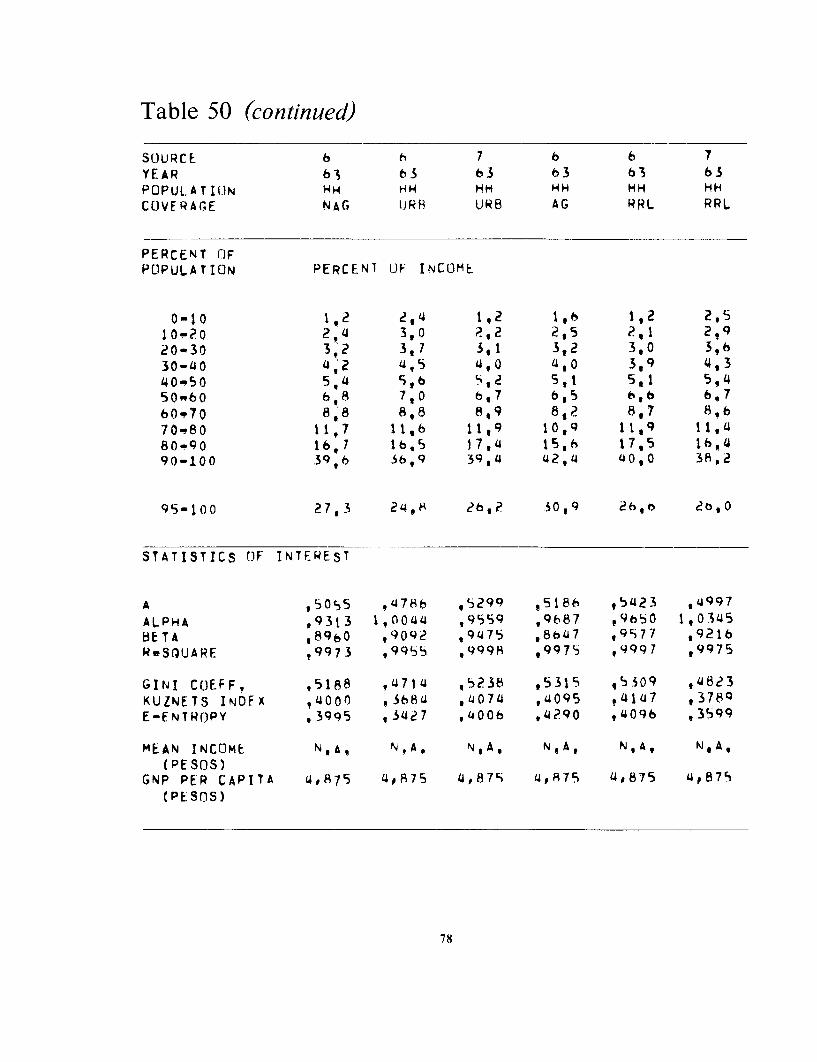
Table 50 (conitinued)
SC)UR C b h 7 6 6 7
YEAR 63 63 63 63 b3 63POPUL.ATI(3N HH HH HH HH HH HHCOVERAGE NAG URN URB AG RRL RRL
PERCENT OFPOPULATION PERCENT OF INCOME
0-010 1,2 2,4 1,2 1,6 1,2 29S10-20 2,4 3,0 2,2 2,5 2,1 22920-30 3,2 3,7 3,1 3,2 3,0 3,630-40 4,2 4,5 4,0 4,0 3,9 4,340.50 5,4 S,b 5,2 5,1 5,1 5,450Q6O 6,8 7,0 6,7 6,5 6,6 6,7
60-70 8,8 8,8 8,9 8,2 8,7 8,6
70"80 11,7 11,6 11,9 10,9 11,9 11,480-90 16,7 16,s 17,4 15,6 17,5 16,490-100 39,6 36,9 39,4 42,4 40,0 38,2
95-100 27,3 24,8 eb?2 30$9 2hob, 2b,O
STATISTICS OF INTEREST
A ,505 5 4786 ,5299 ,5186 ,b423 ,4997ALPHA 093t3 1,0044 ,9559 q9687 p9hs0 1,0i458ETA ,8960 ,9092 ,9475 ,8b47 ,9577 ,9216RwSQUARE .9973 ,9955 ,999H ,9975 ,9997 ,9975
GINI C(EFF, ,5188 ,4714 ,5238 ,5315 q53 0 9 ,4823KUZNETS INDFX ,4000 .3684 ,4074 t4095 44147 ,3789E-ENTROPY ,3995 ,3427 ,400b ,4 290 ,4096 ,3599
MEAN INCOME N,A, N,A, N,A, N,A, N,A, N,A,
(PESOS)GNP PER CAPITA 4t875 4,875 4,875 4,815 4,875 4,875
(PESOS)
78
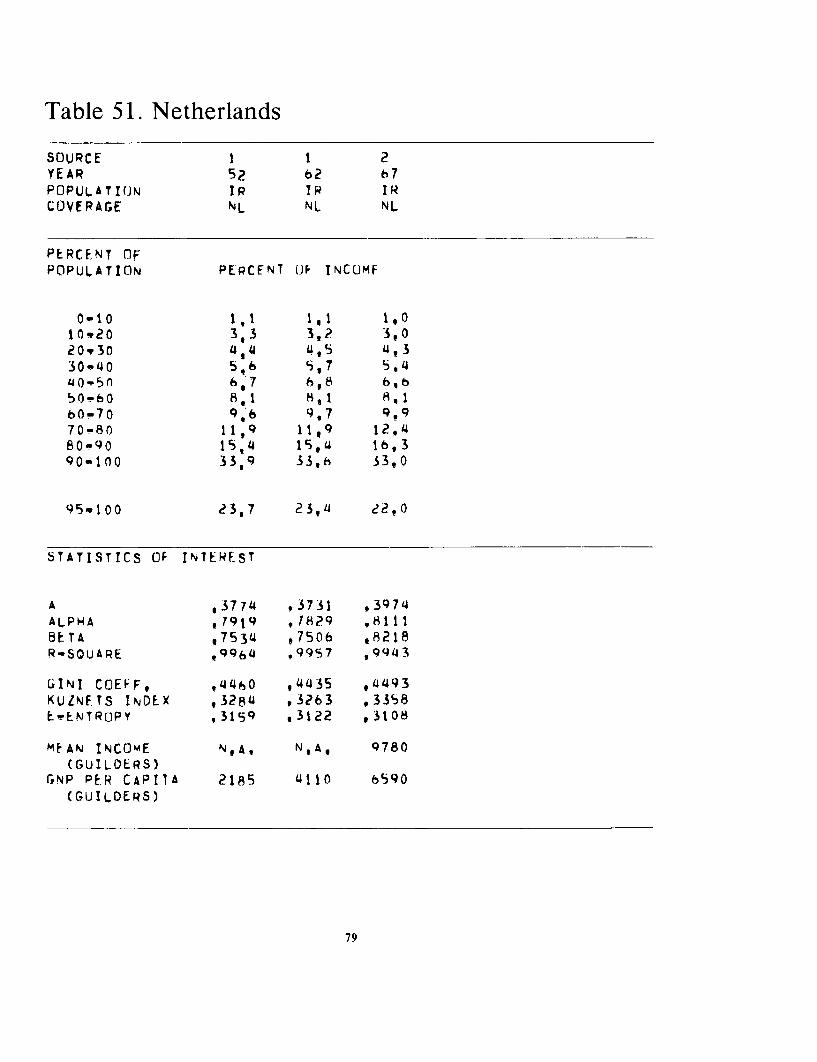
Table 51. Netherlands
SOUPC E 1 1 2YEAR Sp 62 67POPULATIOJN IR TR IRCOVERAGE NL NL NL
PERCFNT OFPOPU.ATION PEPCENT OF INCOMF
0-10 11o 1,1 1,010'20 3,3 3,? 3,020-30 4,4 4,5 4,330"40 5*56 5,7 5,440-5n 6,7 6,8 b,b50- 8 1 8, 1 8 1bO-70 9,6 9,7 qf970-80 11,9 11t9 12,480-90 15,4 1,4 1b, 390-100 33,9 33,h 33,0
95"1 0 0 2 3, 7 2 3 , 4 22 , 0
STATISTICS OF INTEREST
A ,3774 ,3731 ,3974ALPHA ,1919 ,1829 ,8111BETA ,7534 v7sOb .8218R-SQUARE ot964 t9957 ,9943
GINI COEFF, ,4460 ,4435 ,4493KUZNFTS INDEX ,3284 ,3263 ,3358EmENTROPY ,3159 ,3122 ,3108
MEAN INCOME N,A, N,A, 9780(GUILDERS)
GNP PER CAPITA 2185 4110 b590(GUILDERS)
79
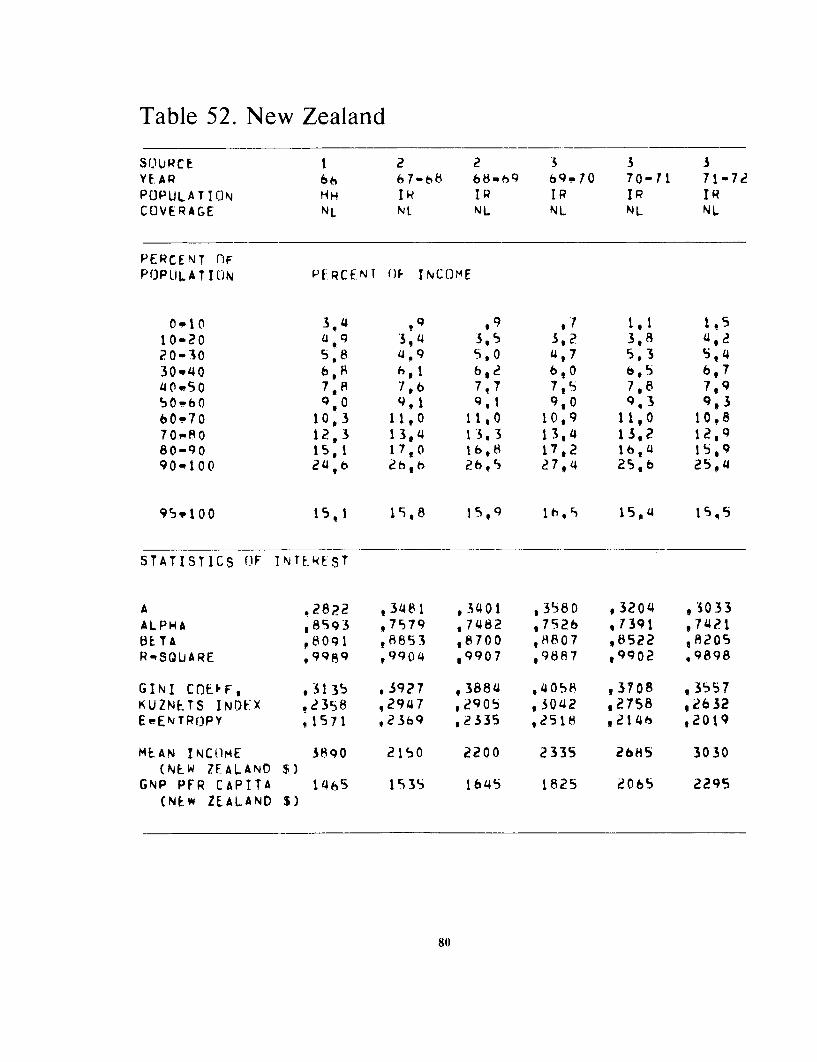
Table 52. New Zealand
S Q UR C t 1 2 2 3 3 3YEAR 66 67-6b 68t,59 69-p0 70-71 71-72POPULATION HH IR IR IR IQ IRCOVERAGE NL NL. NL NL NL NL
PERCENT OFPOPlULATION PERCENT OF INCOME
0-10 3,4S ,9 9 ,7 1,1 1.510-20 * 9 3,4 3,5 3,2 3,8 420-30 5 8 4.9 5,0 4,7 5,3 5,430P40 6 * 6 1 6,2 6 0 6,5 6,740q.50 70178 7,6 7,7 7,5 7,8 7,950-60 9,0 9,1 9,1 9,0 9,3 9,360.70 10,3 11,0 11,0 10,9 11,0 10.870t80 12,3 13,4 13.3 13,4 13,2 12,980-90 15,1 17,0 16,8 17,2 1b,4 15,990-100 2419 2h6, 26h5 27,4 25,6 25,4
95-100 15 I 5,8 l5,9 lb 15 u I5 S
STATISTICS OF INTE k EST
A .2822 ,3481 ,3401 ,3580 ,3204 ,3033ALPHA ,8593 ,7579 ,7482 ,7526 ,7391 ,7421BETA ,8091 s8853 ,8700 ,8807 ,8522 ,8205R SQUARE ,9989 ,9904 *9907 ,9887 ,9902 ,9898
GINI COEPF, ,313S ,3927 ,388 a ,4058 ,3708 ,3557KUZNETS INDtX *2358 92947 ,2905 ,3042 e2758 ,2632E"ENTR(jPY ,1571 ,2369 ,2335 ,251P ,2146 ,2019
MEAN INCOME 3890 2150 2200 2335 2685 3030(NEW ZEALAND $)
GNP PFR CAPITA 14h5 1535 1645 1825 2065 2295CNEdW ZEALAND S)
80
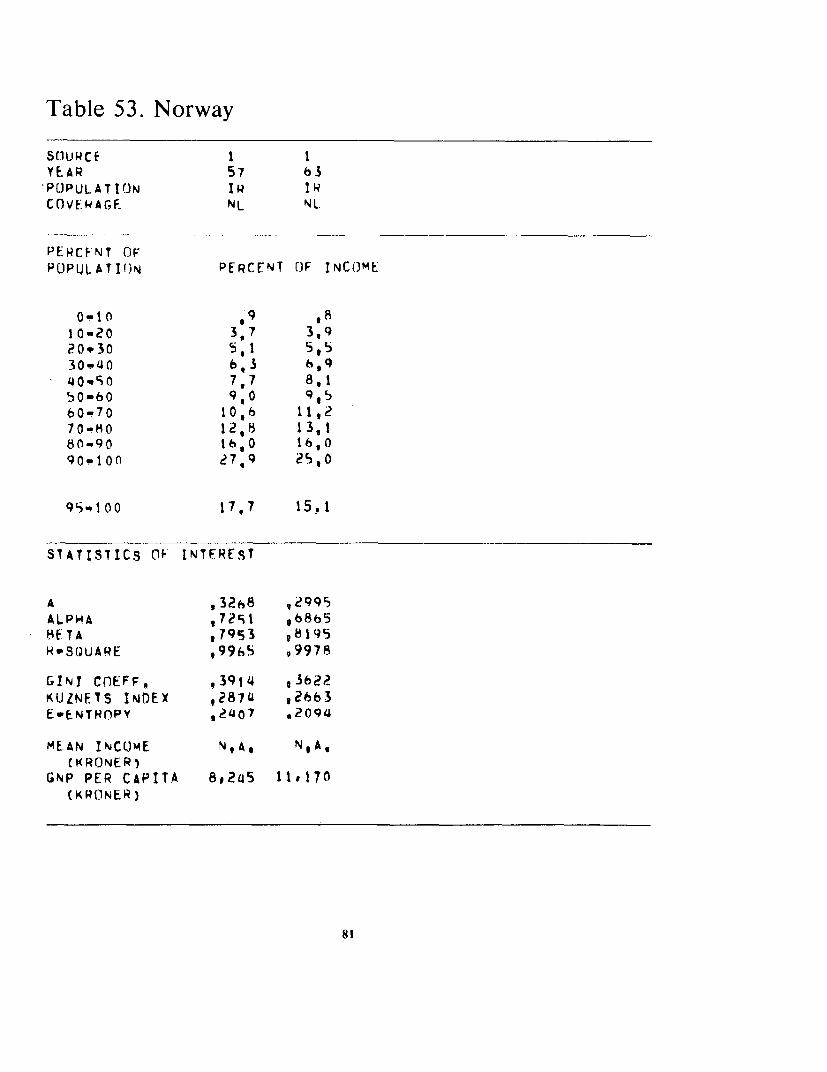
Table 53. Norway
SluURCf I IYEAR 57 b3tPOPULATION IR I9COVEWAGE NL Nl.
PERCENT OFPOPUL.ATI(N PERCENT OF INCOME
0-tI0 ,9 ,810"20 3, 7 3,920.30 50 1 5,530.40 6 3 h,940"50o 7,7 8, 150-60 9,0 9 560-70 10,6 11,270"80 12,8 13,180-90 Ih,0 16,090.100 27,9 25,0
qs., 100 17,7 15 .
STATISTICS OF INtEREST
A , 3 2h8 ,2 995ALPHA 972S1 ,6865HTA ,7953 ,8195NPSOUARE , 99h5 99978
GINT CnEFF, ,3914 93622KIlZNETS INDEX ,287'J ,2663E.ENTRnPY ,214Q7 209'4
MEAN INCOME N,A, N,A,(KRONER)
GNP PER CAPITA 8,p25 11,170(K RON ER
81
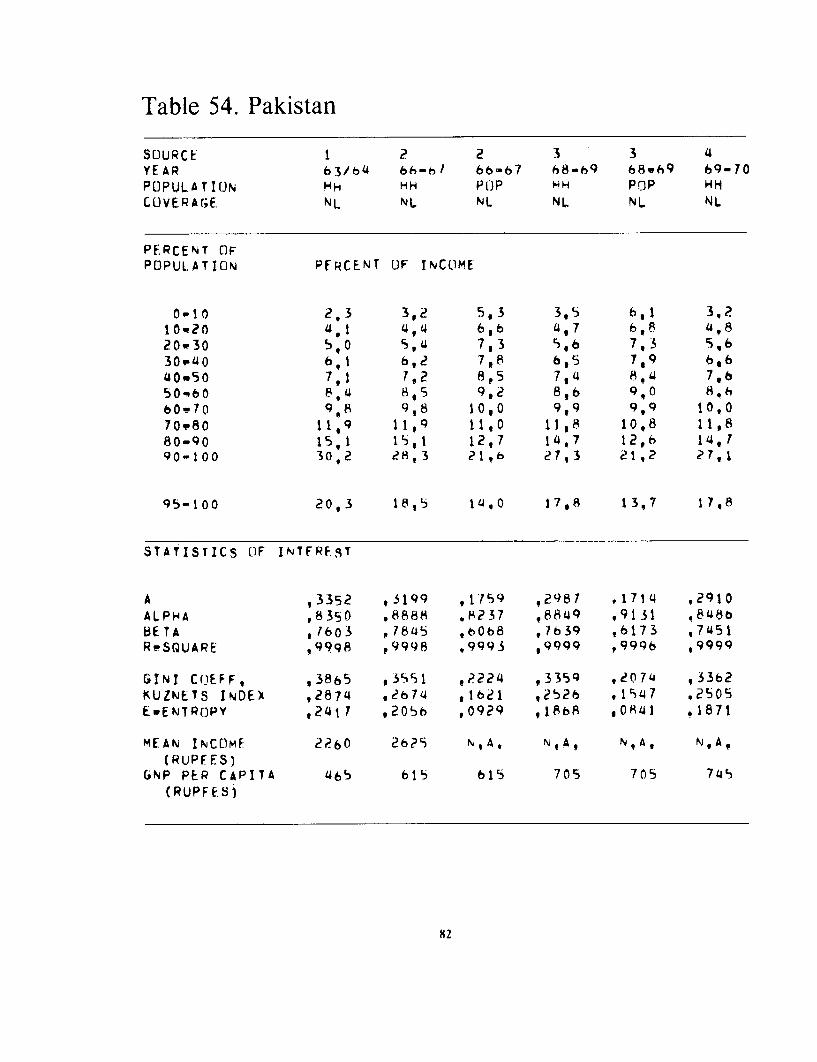
Table 54. Pakistan
SOURCE 1 2 2 3 3 4YEAR 63/64 66-h6 66-67 68-h9 68*69 69-70POPULATION HH HH POP HH POP HHCOVERAG;E NL NL NL NL NL
PFRCENT OFPOPULATION PERCENT OF INCOME
0-10 2,3 3,2 5,3 3,5 6,1 3,210.20 4,1 4,4 6,b 4, 1 6,8 4,820.30 5,0 5,4 7,3 5,6 7,3 5,630.L40 6,1 6t2 7,8 6,5 7,9 6,6'40.50 7,1 1,2 8,5 7,'4 8,4 7,650'60 8,4 8,5 9,2 8,6 9,0 8,660"70 9,8 9,8 10,0 9,9 9,9 10,070.80 11,9 11,9 11,0 11,8 10,8 11,880-90 15,1 15,1t 12,7 14,7 12,6 14,19 0 - I 0 30 ,2 2 8 , 3 2 1 , b 27,3 2 1,2 27,1
95-100 20,3 18,5 1,140 17,8 13,7 17,8
STATISTICS OF INTFRFST
A ,3352 ,3199 ,1759 ,2987 .1714 ,2910ALPHA ,8350 ,8888 *8237 ,8849 99131 4 8 bbETA ,1603 ,7845 ,60b8 ,lb39 ,6173 ,7451RPSGUARE ,9998 ,9998 ,9993 ,9999 ,9996 ,9999
GINI CQEFF, ,3865 ,3551 ,?224 ,3359 ,207 4 ,3362KUZNETS INDEX ,2874 ,2674 t1b21 .252h ,1947 ,2505EWENTROPY ,2417 ,205h ,0929 ,1868 ,0'Q41 ,1871
MEAN INCOMF 2260 2625 N,A, N,A, N ,A, N,A(RUPF ES)
GNP PER CAPITA 465 615 615 705 705 7445(RUPF ES)
82
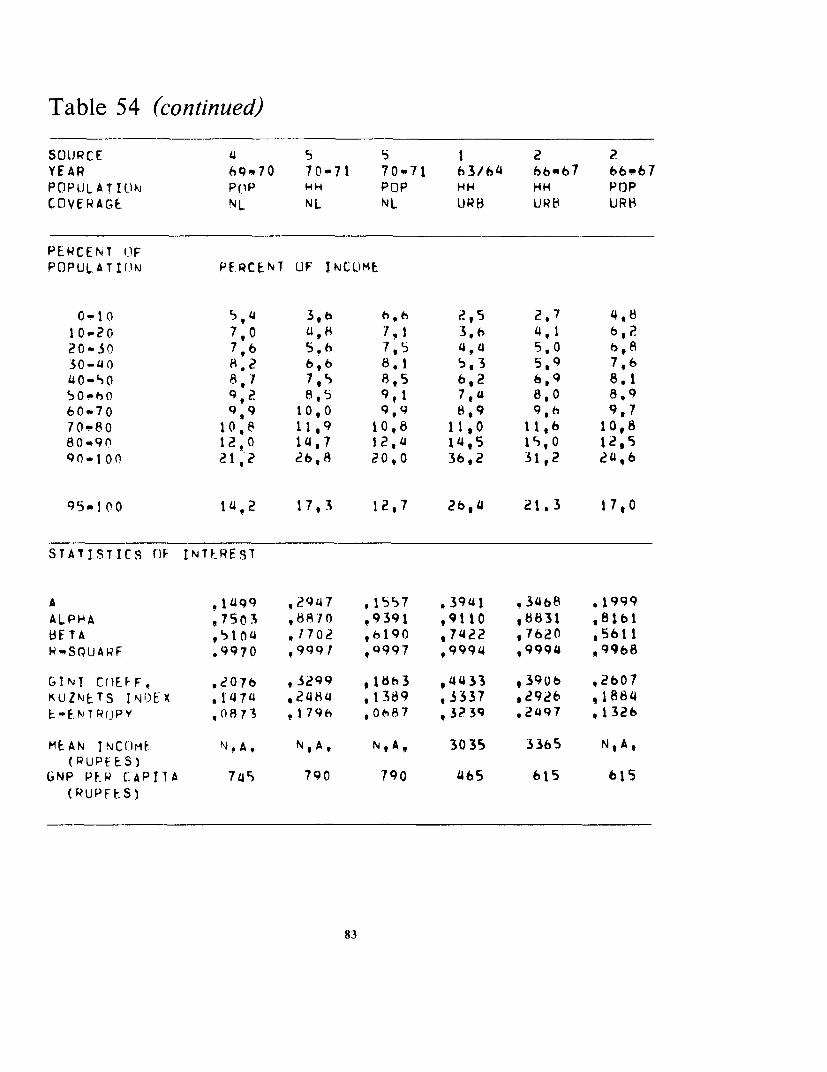
Table 54 (continued)
SOUJRC E 4 5 5 1 2 2YEAR h6q70 70-71 70m71 63/64 66.o7 66-67POPULATIONj PpP WH PoP HH HH POPCOVERAG6 NL NL NL UR8 UR1 URB
PERCENT (IFPOPULATION4 PERCENT UF INCOJME
0-10 5,14 3,b 6,6 2,5 2,7 4,81020 7,0 4,8 7.1 3,h 4,1 6,2
20.30 7,6 5,h 7,5 4,14 5,0 b68
30-40 8.2 b,6 8,1 5,3 5,9 7,6
40-S0o 8,7 7,5 8,5 6,2 6,9 8,150"60 9,2 8,5 9t1 7,14 8,0 8,9
60.70 9,9 10,0 9,9 8,9 9,h 9,7
70-80 10,% 11,9 10,8 11,0 11,6 10,880.90 12,0 14,7 12,4 14,5 1s,0 12,590-100 21,2 26,8 20,0 36,2 31,2 24,6
95-100 14,2 17,3 12,7 2b,4 21.3 17,0
STATISTICS r)F INTFREST
A .12499 *947 ,155 7 .394 1 ,3468 .1999
ALPHA ,7503 ,8wn0 ,9391 ,9110 w8831 ,8161L3FTA ,5104 ,1702 ,b190 ,7422 ,7620 ,5611
RNSQUARF .9970 ,9991 ,9997 ,9994 ,9994 ,9968
GINI C)EFF, ,2076 ,3299 ,18h3 ,4'433 ,3906 ,2607KUZNETS INDEX .114114 2484 ,1389 ,3337 ,2926 ,1884E -F.NTRfRJPY ,0873 I79 , 0687 ,3?39 ,2447 ,1 326
MEAN INC(IME N,A, NgA, N,A, 3035 3365 N,Aq(QUPEES)
GNP PER C'APITA 7%5 790 790 465 615 615
(RUPFES)
83

Table 54 (continued)
SOURC k 3 i 4 4YEAR 68-6V 68-b9 69,70 69170 70-71 70-71POPUILATIr)N HH POP NH HH popC(V F:RA ;E URh URH LJR URN l!RB URH
PERCENT OFPOPULATION PERCENT QF TNCU!ME
0-10 3,2 5.6 3,9 6,3 3 ,2 5,810.20 4,3 6j, 4,6 6,5 4.5 6,520.30 boo 6S5 5, 1 6,9 5 ,3 7'030-40 5,8 7,1 5,9 7,? 6,1 7,640"50 6,8 7,8 b,7 7,8 ,1| 81|SOW60 7,9 A1,4 7,8 8,3 8,2 8,760.70 9,3 9.u 9,2 9,? 9,7 9,570.80 11,4 10,7 11,3 10,14 11,5 10,680-90 14.8 12,8 14,6 12,? 14,7 12,?90.100 31,5 25,b 30,9 25,2 29,7 24,0
95 - 1 0 0 21,7 17,7 21,1 17,7 20,1 h, 6
STATISTICS iJF INTEREST
A ,'3493 ,2265 , 3448 .2076 ,3232 .1889ALPHA ,9299 ,9726 ,9924 1,O3114 ,8939 .9047BETA ,7640 .6261 ,7764 ,5866 ./511 ,5552R-S(UAPE ,9988 ,9983 ,9991 .9973 ,9997 .9994
GINI CuEFF, .3848 ,26b3 ,3671 .2452 ,3645 ,2387KUZNErS INDFX .2916 ,2011 ,2821 ,1874 ,2737 *17b8EwENTRHOPY 241475 , 1416 ,2312 , 1 321 ,2218 , 1 187
MEAN INCOME N,A, N,A, N,A, N,A, N,A, N,A'(RUPEES)
GNP PER CAPITA 705 705 7 45 745 790 7 90(RUPEES)
84
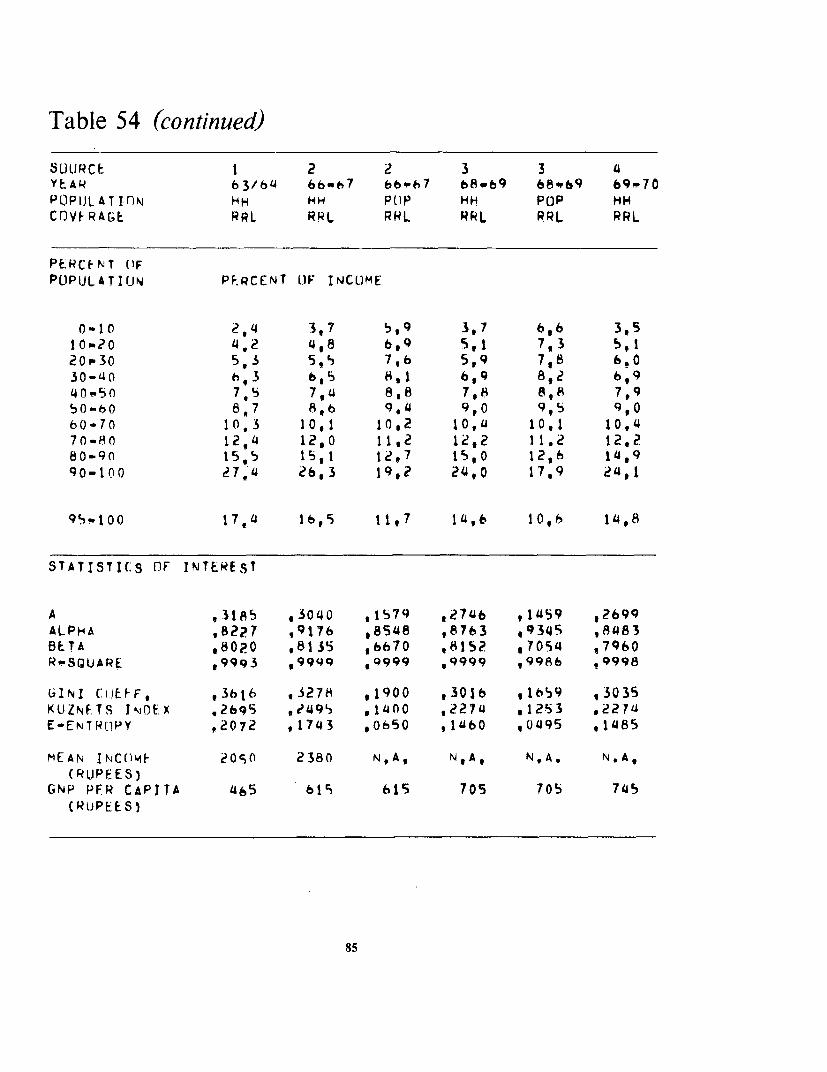
Table 54 (continued)
SURCCE 1 2 2 3 3 4YEAR 63/64 66b.7 bbo"67 68.69 6Bhq9 69"70PCOPLJLArInN HH POP HH POP MCOV RA(;E RLRL RRL RRL RRL RRL
PERCRNT (IFPUIPULATION PF.QCENT OF INCOME
0-10 2,4 3,7 5,9 3,7 6,6 3,510w-20 4,2 4,8 6,9 Set 703 Sol20f-30 5,3 5,5 7,6 5,9 7,8 6.030t4OQ 6,3 6,5 8,1 6,9 8,2 6,940-50 7, 7,4 8,8 7,8 8,8 7,950-bO 8,7 8,6 9,4 9,0 9,5 9,060-70 10t)3 10,1 10,2 10,U 10,1 10.470-80 12,4 12,0 11,2 12,2 11.2 12,280-90 15,5 15,1 12,7 15,0 12,6 14,990-100 27,4 26,3 19,2 24,0 17,9 24,1
951-100 17,4 16,5 ljv7 14,6 IQ,6 1408
STATISTICS OF INTEREST
A ,3185 ,3040 ,1579 ,2746 ,1459 ,2699ALPHA .8227 ,9176 ,8548 ,8763 ,9345 ,8483BETA .8020 ,8135 ,6670 ,8152 ,17054 ,7960R'SQUARE .9993 $99'q , 9999 a , 9986 ,9998
GINI CuJEfFO ,3616 ,3278 ,1900 93016 ,1659 l3035KUZNFTS IWAOEX .2695 .2495 ,1400 .2274 ,12S3 .2274E-ENTROPY ,2072 ,1743 90650 , 160 ,0495 ,1L485
MEAN IMC(.m) 205() 2380 N,A, N,A, N,A, N,A,(R UPE ES)
GNP PFR CAPITA 465 bjS 615 705 705 745(RUPEES)
85

Table 54 (continued)
SnuRcE 4 5 SYE AR he)-70 70.7 1 70-7 1POPULATION PoP HH P(pCOVE RAGI, RRL RRL RRL
PERCENT t!FPOPULATION PERCENT OF INCOM[
01o 5,9 3,7 7,010- 20 7.?5 be 7,b2t! -i si n I h 1 8 , n30,i40 8,6 6,9 8.540_50 9,? 7V9 90050"60 9,7 9,0 9,sbhO-70 10,2 10,4 10,270.80 l,0! 12,0 10,980-90 12,1 14Jt 12, 390.-100 17,7 ?410 17,0
95.100 10,8 14,9 101O
STATISTICS Of INTFREST
A , 1224 ,2hS1 , 1252ALPHA ,73o3 ,Tb02 ,9170BE TA ,5886 * 78b5 , h89 1R-SOUARE *94hh .9998 '9991
GINI CUEFF, .1630 ,?979 .14b5KUlNETS INDEX .115A .223? ,1095
E-ENTROPY ,045s ,1444 ,0 398
MEAN INCOME N,A, N.A, N,A,(RUPEES)
GNP PER CAPITA 7a5 790 790(RtJPEES)
86
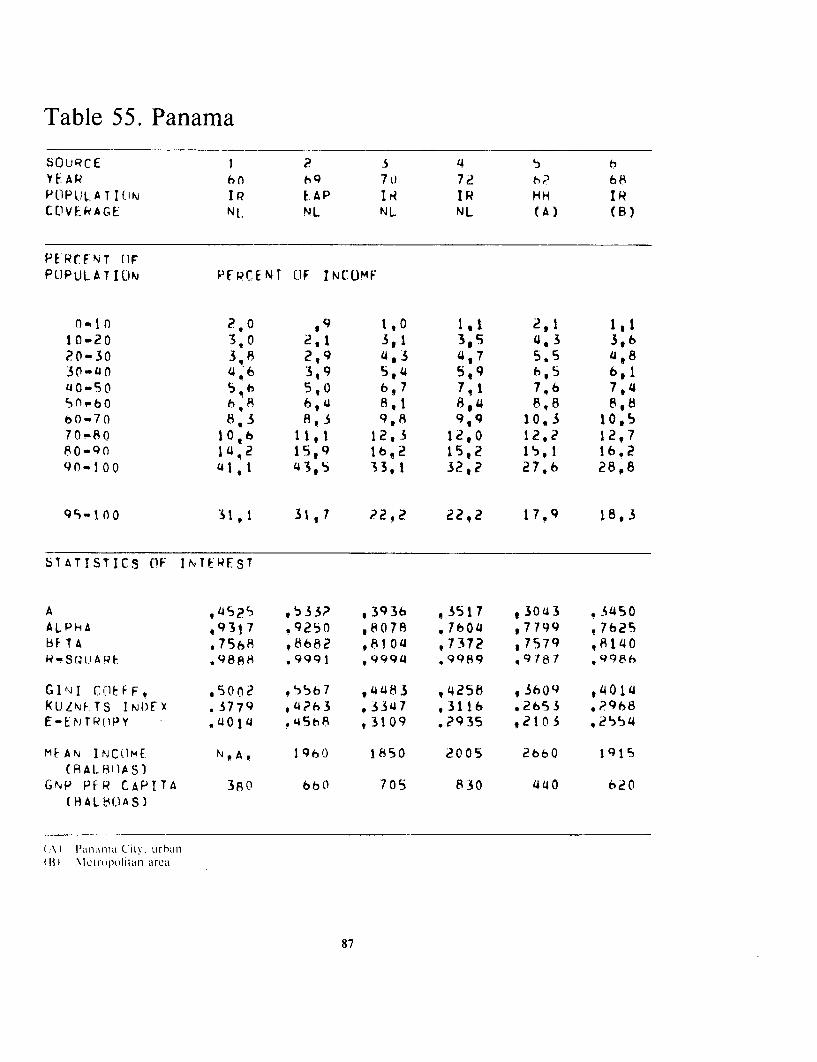
Table 55. Panama
SOURCE I 2 3 4 5 hYEAR ho 7t) 72 61 h8POPOLATItN IQP LAP IP IR HH IRC[VERACGE NI. N JL NL tA) (B)
PE'RC.FNT fiFPOPULATION PFPCENT OiF INCOMF
0n10 2,0 9 10 1,1 2,1 1,l10,20 3 0 2, 1 3, 1 3,5 4. 3 3,b20-30 3,8 2,9 4,3 4,7 5.5 4,830-4n0 4 S6 3,9 5,4 5,9 h,5 6,14lO-50 5, 5,0 6 ,7 7t1 7 ,6 7,1450,bO h,A 6,14 8, 1 8,4 8,8 8,8b6-70 8,3 893 9,8 9,9 10,3 10,570-80 10,b 11,1 12,3 12,0 12.2 12,7130-90 14,2 15,9 1bg2 15,2 15,1 16.290-100 41,1 43,5 33,1 32,2 27.6 28,8
95-100 31,1 31,7 ?2,2 22.2 17,9 18,3
SIATISTICS (IF INTF-EST
A ,4525 ,533? ,393h ,3517 ,30u43 .3450ALPHA ,93i7 .9250 ,8078 ,7604 ,7799 .7h25BK TA ,7568 ,,8682 ,8I0l4 ,7372 ,7579 ,81l40R"SrQU A 9F- ,.9888 .9991 ,9994 .9989 .9t87 ,9986
GINI CrOFFj .5002 .5567 .41483 ,4258 ,3609 ,4014RUZNF.TS INOFf) .3779 ,4?63 ,33147 ,3116 .2653 *?968E-E rJTRf)PY - * 0104 .45hR , 3109 .?935 ,21 0 , 2554
MIAN INCOME: NvAi 1960 1850 2005 2bbO 1915(RAL OA 5 )
GNP PfR CAPITA 380 bbL 705 8 30 440 620(HAL H () AS)
( I'Wta ; (Civ. tUrban(13) NIci rupulii)atl aIrea8
87
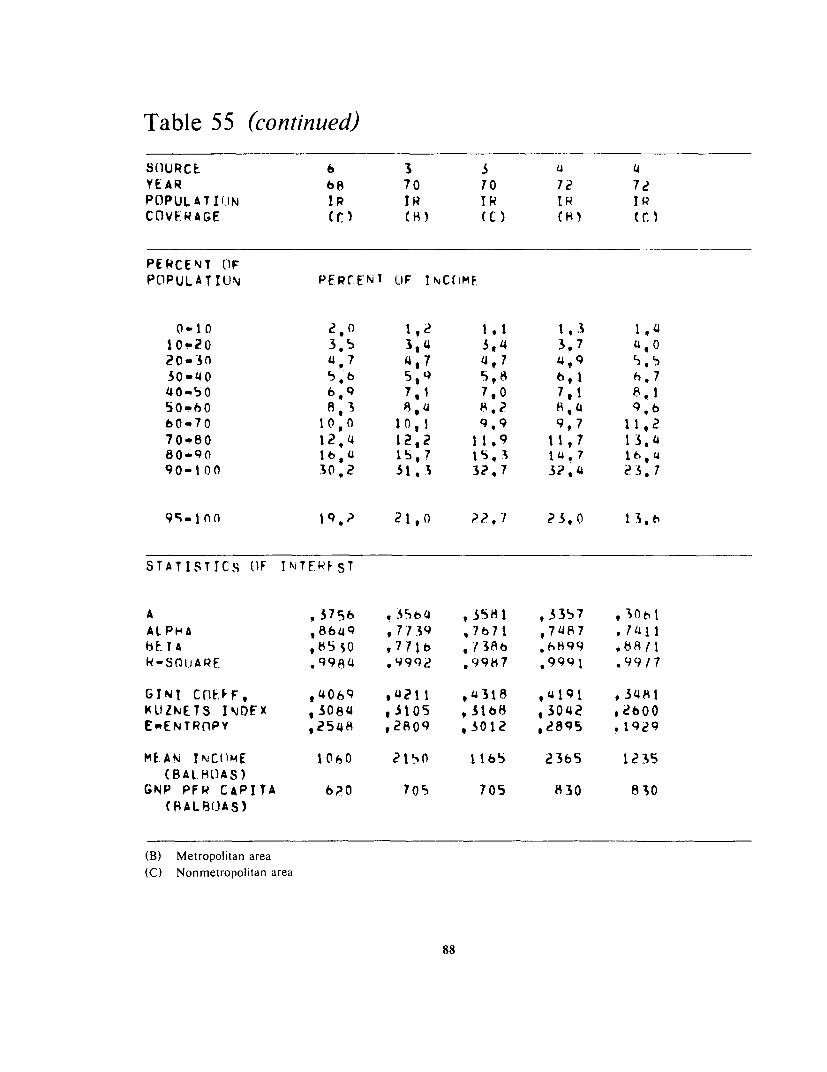
Table 55 (continued)
SOURCE 6 3 3 4YEAR 68 70 70 72 72POPULATIOIN IR IR TR IR TR
COVERAGE (C) (H) (C) (H) (C.)
PERCENT OIFPLIPULATIUN PERCENT UF INCVIME
0-10 2,0 1,2 1,1 1,3 1 410-20 3.5 3,4 3,4 3.7 4.020-30 4,7 4,7 4,7 4,9 5,530-40 5,b 5,9 5,8 6,1l h.740"50 6 9 7. 7,0 7, I 8, 1
50-hO A,-S 8,4 8,2 8,4 94660bw0 I0,0 10,1 9.9 9,7 11,270-80 12,4 12,2 11,9 11,7 13.480-90 16,4 1s,7 159. 14.7 16V4
90-100 30,2 31,3 32,7 32,4 23.1
gsl;.n( 19,P 21,(0 P?.7 23.0 13,t)
STATISTICS (F INTTF T ST
A ,3796 .3564 ,1 ,58 I 37 ,35 7AL PMA ,8bQ ,7 1 39 ,7h 1 , 748 7 1411bET A.85$O s 771b ,/386 .h699 ,88 1R-SOUAPE .9984 .9992 .9987 ,9991 .99/17
GINI COEFF, ,4069 ,4211 ,4318 ,4191 .3481KUZNETS INQFX ,3084 ,3105 ,31b8 ,3042 ,2600E".ENTRnPY ,2548 28A09 ,3012 *2895 . 1929
MEAN INCO)mE 10O0 2150 1165 2365 1235(BAL.O)AS )
GNP PFR CAPITA 6?0 705 705 830 830CM ALBO3AS)
(B) Metropolitan area(C) Nonmetropolitan area
88
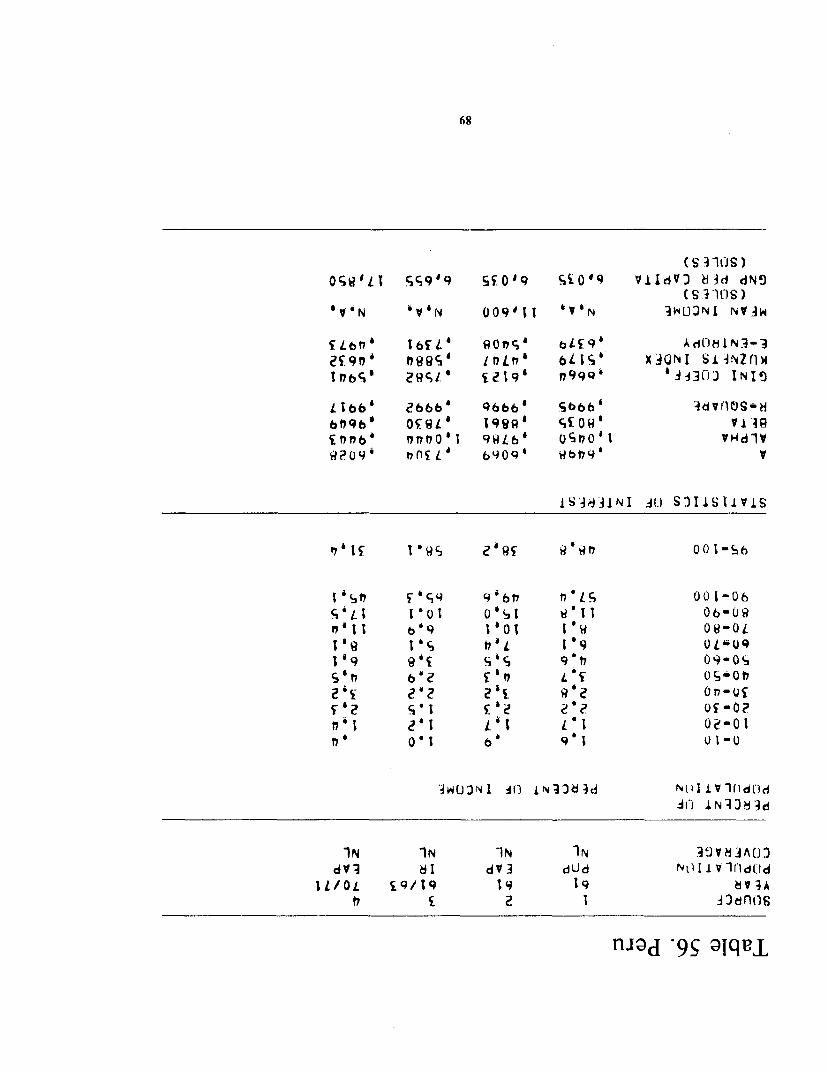
68
('S 1OJS)osq'Ll SS9'9 SS0'9 SiO9 ViIdV) 83d dNO
( S.V1]t)S )
V'N V N 009'1T v' N iK)ONI NV3W
f Lw71n I ' " thL. ' IR01 or,c " Lis A dO IN 3- 3Z£.9rz' rigoc5I I rtn'"I oL I 5 X-30NI Sl SNZnAI t) 2 9IRC .' i 2t9 A t799 I 'AI3(-J INI!t
Lthbb' 2b6 96b61 sbb6o' 4dVoloS'mbf?96 I OSgL ' 1 9R'a S£ Ow a W qi9?O I,'")Il' 19L,6' 0'bt70o' vHdIVW?ow *, nnT L 4 ,4 o 4 86 f17 v
IS'9~33lNI i SIlvs
soLt 6Ot O*qt 7 U0 b6
4L. I 0 O I 0 TI O- J9#' t t b'9 1 'Ot l OS-OL
17,1 ̂ S 1'5L I ' 9 OL UI'9 q I
f ' 1 2 ' 1 t i t 1 * 1os-Qt11 0 9 O1t-U9c a '
i021 L1 *~3Id otllV-oI)
* ~~~~~~~~, 9' 17 90
FIj 1N1J8 d
1N 1N iN iN 19VtF^AUJdVl dI dv3 dJd Nt)IlVlrldOd
L/OL £9/19 s1 19 0t £ Z I £te,l'S
nJod 9S oTqeI

Table 57. Philippines
SLUUPRCf. I 1 2 3 1 3YEAR 56 61 61 61 bs 65PLOPJLATI1N HH HH HNH HH HH HHCOVFRAGE NL NL NL NL NL. NL
PERCFNT (IFPOJPULATIUN PF.pCFNT OF INCOME
0-10 2,1 2,0 1Jo l,h 1,2 1,110-20 2,8 2,8 2,b 2tb 2,5 20520-I0 3, S 3,c 3,4 3,5 3,5 3.530-4Q0 4, 5 '44 4, 3 4.3 i4, 4 '40-50 $5- 5,4 5,4J 5,5 5.1 t 5b50-60 6,8 6,h 6.7 i,7 7.0 7, 1bn-70 8,1 8,5 8,b 8,5 8,8 8.870-80 11,3 10.9 11,2 11,o 11.5 11,3R0-40 15,9 15,4I IS,9 15.3 16 I I5.690-100 38,9 4 0 u, ', 3 41,0 39,3 39,9
95-100 27,? 29,3 28,8 30,1 27,8 29,0
STATISTICS (IF INTEREST
A *'4837 ,4871 ,495Q ,48H30 ,4771 14658ALPHA ,9752 ,97n7 ,9495 .9310 ,9010 ,8757BETA 8730 ,8Y4h ,8b13 ,8211 8455 .6075R"SQIJARE tqq9b q994 ,9994 1.0000 ,9993 1.0000
GIN! COthEF, ,49?1 ,50142 .5128 .5155 95099 .5139KUZNEIS INDE X I 380 0, IA7L (3937 ,392b .3884 t 3874E-ENTROPY 3730 ,3952 ,4001 ,4091 ,3925 ,4029
MEAN INCO>ME 1470 N.A, 1805 N,A. 2S40 N,Ao(PESrIS)
GNP PER CAPITA 400 530 530 530 700 700(PESOlS)
911

Table 57 (continued)
SOURcEF 2 4 2 2 4 2YEAR 69 71 61 65 71 61POPIALATION HH NH HH HH HH NH
COvERAr;E NL NL IIRB UPH (URB RRL
PERCEFNT (IFPOPJLATIOJN PERCENT fiF JNC(JME
0-10 1.1 1,3 1,2 1q2 1.6 2,210-20 2,5 2,h ?,4 2,5 2,9 3,620-30 3,4 3,41 3,2 3,4 1,9 4,630-40 4,S 4,6 4,2 4,3 5.0 S,%40-%0 S,1 o,1 5,4 5,4 6,3 6,750-bo 7,0 7,2 6,7 h,7 7,6 8.1bO-70 8.9 9,2 8,b 8.5 9,6 9,770-8O 11 12,0 1 1,44 10,8 12,3 12,280-90 15,8 16, 116,1 15,1 16,7 16,090-100 39.6 37,1 40,8 442,1 34,1 31,4
95-100 28,3 244,8 29,1 31,5 22,4 20,5
STATISTTCS (IF INTFPFST
A 94719 ,4179 ,028 .4835 ,4334 .3820ALPHA ,8840 ,19151 ,9250 ,8999 .8918 .8887bETA .8284 ,8971 ,81b46 .7971 ,8762 ,8378R-SOUAPE ,9996 ,9998 9998 ,9998 ,9998 ,9999
GINI ClOEFF, ,5l2V ,44941 9259 ,5303 ,4580 ,4 123KlJZNFTS INF)FDX 3884 .3789 ,44032 ,4000 .3449 ,3126E-FNTRnpY ,3980 .3637 ,41449 ,4s401 93174 ,2652
MEAN INCOmE 2540 3135 2970 444405 5865 1205(PESI1S)
GNP PRF CAPITA 700 1305 530 700 1305 530(IESOS9
91

Table 57 (continued)
SOURCE 2 4YEAR 7 1POPULATION HH HHCOVERAGE RRL RRL.
PERCENT OFPOPULATION PFRCENI OF INLOMFT
0-I n 13 1.510-20 3.? 2 .20..30 4, 3 3,Q30-40 5.5 41,940-SOb. b, 150-60 8,3 7,b60-70 10,3 9,570-80 1?.9 12r280-w0 1712 16.8
0-00oo 30,? 34,7
95-100 18, 7 2t9
STATISTICS OF INTFRfqT
A ,39S4 ,4426ALPHA ,8391 .8957BETA .8q16 .8799R-SrnJAPE .9999 ,9998
GINI CU!EFF ,4258 ,4bS49K(ZNE TS INDEx .3232 ,3S8E-ENTROPY ,2738 ,S 71
MEAN INcnME 1 7C5 2f820( PES(IS )
GNP PER CAPITA 7oO 1305(PE, S(1S)
92
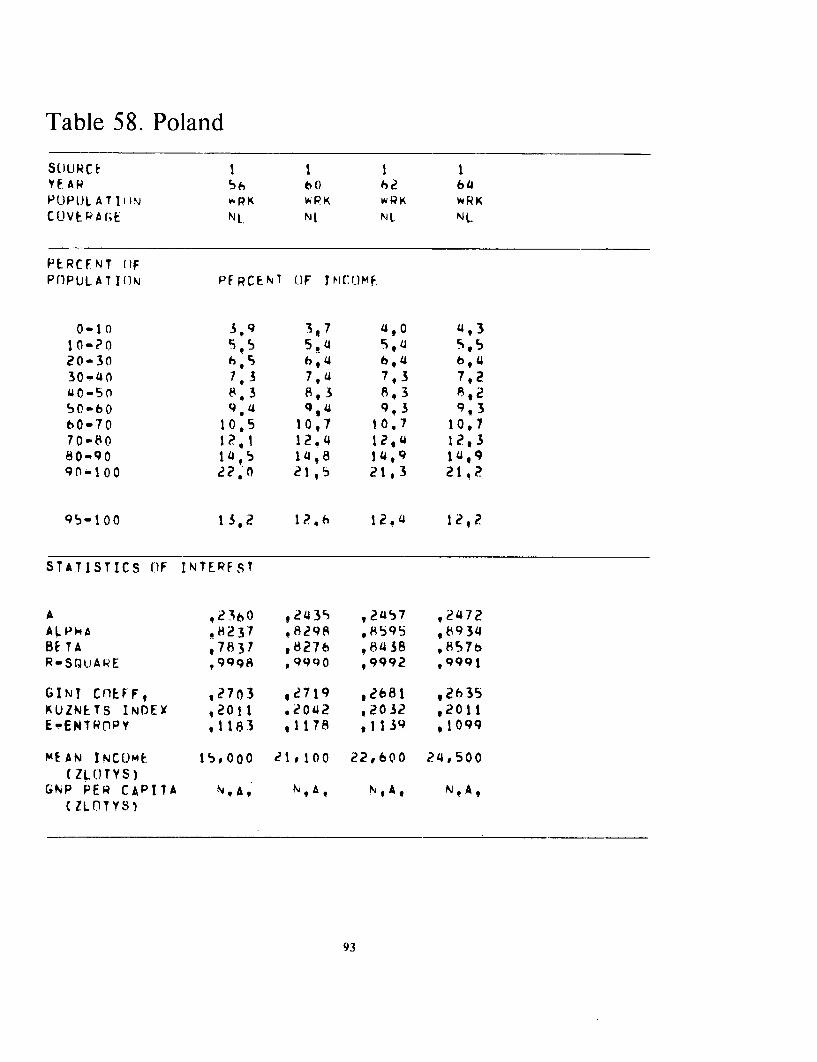
Table 58. Poland
SU LI RCE.YEAR 5 b6( 62 h4POlPULAT IW RpK WP WRK WRKCUVER6GE NL. NL NL NL
PtRCFNT (IFPnPf L A IAI f I N PFRCENI (IF INOMF
0-10 3.9 317 g,0 4,310-?0 . 5,4 ,4 520-30 h, 5 6, 4 6,430-40 7,3 7,4 7,3 7,214Q 50 8.3 8,3 813 8,250-60 9t014 94 9,3 9,360.70 10,5 10,7 10.7 10,770-80 1291 12.4 12,4 12,380-90 1495 14,8 1 4,9 14,990-100 22.0 21,5 21,3 21,2
95-100 13,2 1?,h 12.4 12,2
STATISTICS OlF INTEREST
A .2p30 l243S ,2457 ,2472ALPHA .8237 .8298 ,8595 68934BETA ,7831 ,8276 ,8438 ,8576R-SQ UARE , 999A ,9990 ,9992 ,9991
GINS CflEFF, ,27o3 ,2719 ,2b81 ,2635KUZNLTS IN0E X 20 1 g2042 ,2032 ,2011E-ENTROPY ,1183 1 178 ,113V ,1099
MEAN INCOM9E l5000 e1 .100 22,600 24,500(ZLOTYS)
GNP PER CAPITA N,tA N,A. N,A, N,A,(nZLTYS)
93
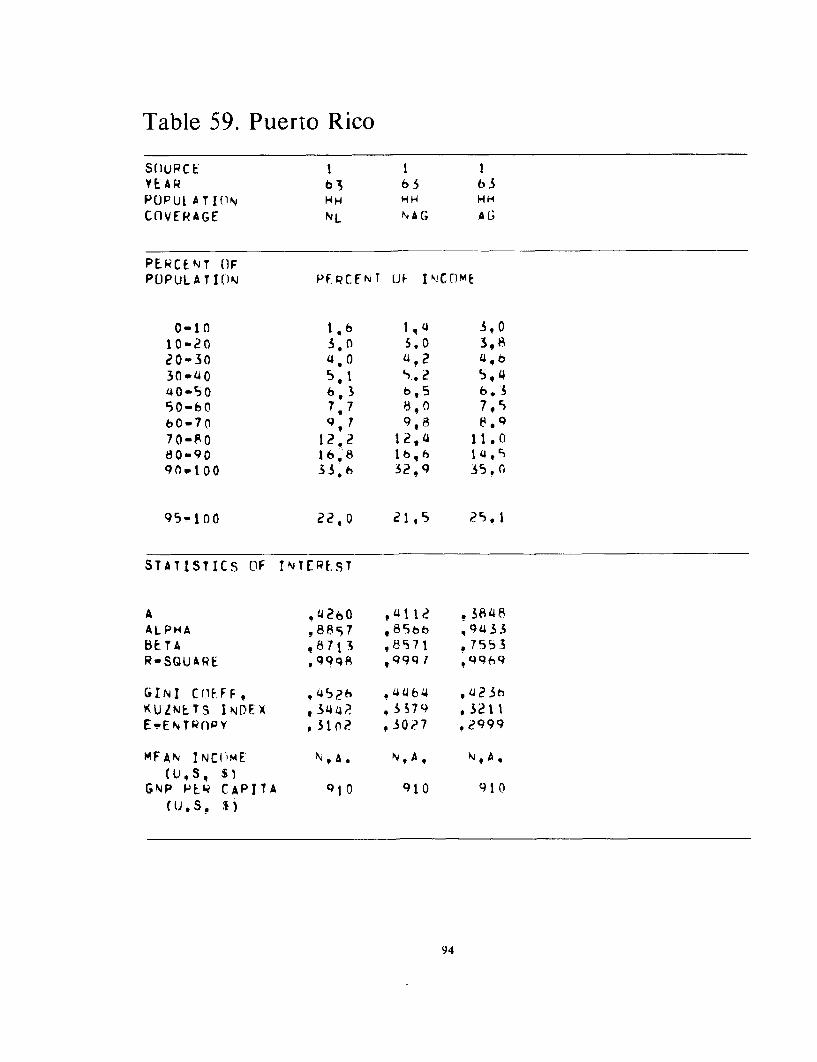
Table 59. Puerto Rico
SOURC t I IYEAR 63 6b 63POPULATION HH HH
CnvERAGE NL NAC; AG
PERC;ENT llFPOPULATION PFPCENT UP INCO)ME
0-10 1.( 1 ,u 3,010-20 3.0 5,0 3,820-30 4.°0 '2 4,6b30-4 0 5,t S..2 5, 440-50 6,3 6,5 6.350-bf 7,7 680 7,560-70 9,7 9,A 8,970-fo 12.2 12,I 11.080-90 16,8 b6,h 14,990W100 33.h 32.9 351(
95-100 22,0 21,5 25.1
STATISTICS OF INTEREST
A ,4 20 0UI1 . 38 4 8ALPHA ,88r7 *85b ,9433
BETA ,8713 98571 .7553R-SQUARE ,qg '9i ,99h9
GINI CriEFF, ,45?h ,4b64 .423bKU1NETS INDEX ,344? ,3579 .3211E-ENTrPOPY ,3 1?2 30?7 .2999
MFAN INCOME N A. A N I A N I A ,tU,Sit $)
GNP PEW CAPITA 910 910 910
94
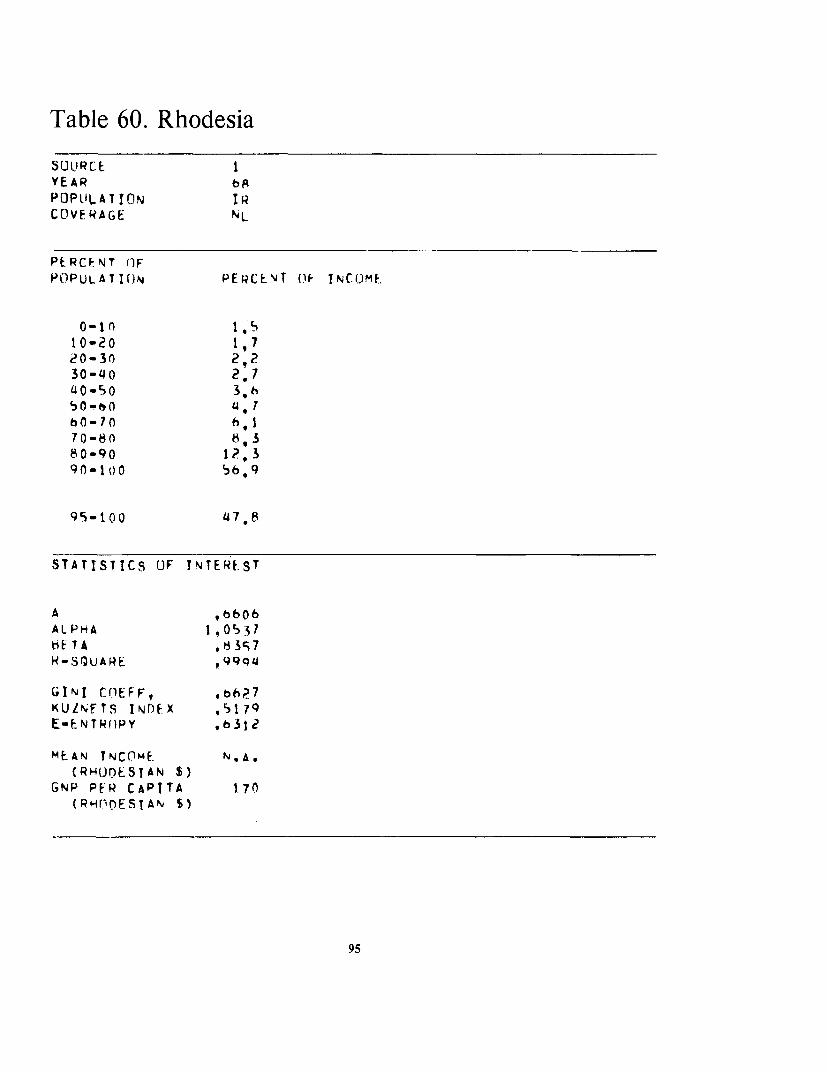
Table 60. Rhodesia
SOlURCE IYEAR hRPOPUILATION IRCOVERAGE NL
PERCENT (IFPO)PULATION PERCENT (11F INCOME.
0-1I0 1 .510-2 0 1 ,720-30 2 230- 40 2 740-50 3, h
s o- 4. bO-70 6,170-8 0 t 380-90 1?, 390-1I)0 S6.9
95-100 47.8
STATISTICS OF TNTER[.ST
A , bO06ALPHA I 0531bETA t 3s;7K-SQUARE 99Q4
GINI ClEFF P,,h 7KULNFTS IN)EX SI79E-ENTR1PY .b312
MEAN TNCOME. N. A(RHODESIAN $)
GNP PER CAPITA 170(RHfODESIAN $)
95
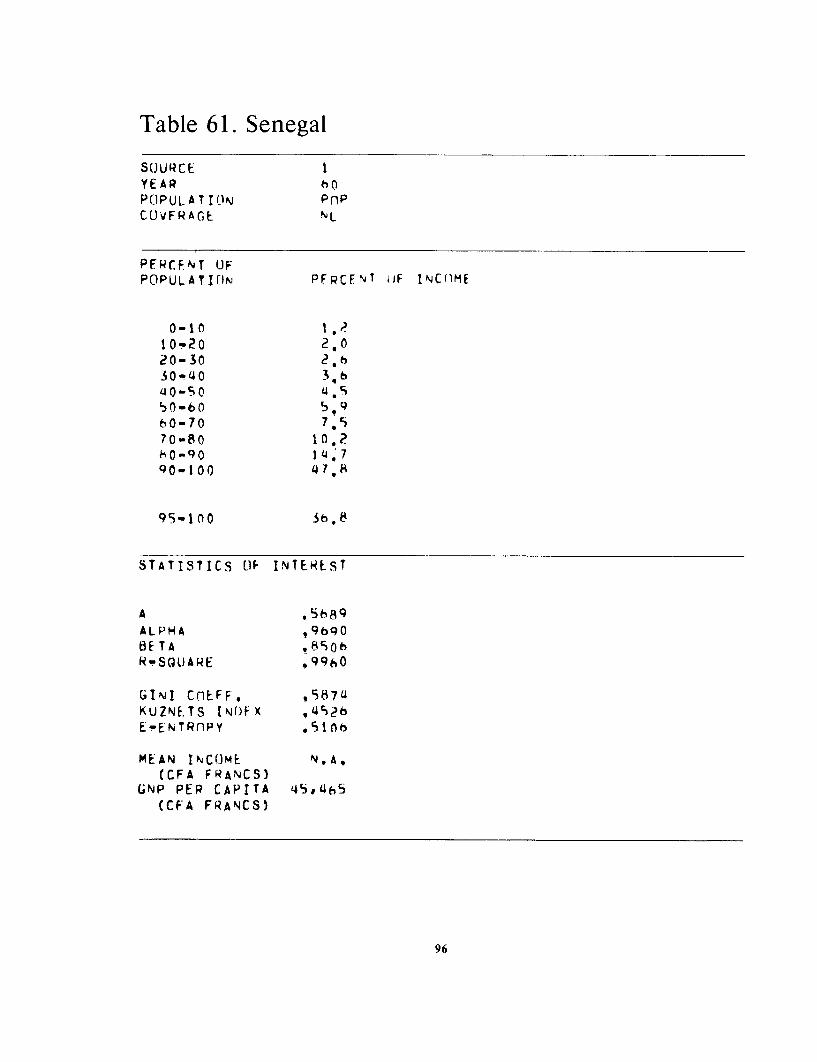
Table 61. Senegal
SuURCE IYEAR h lPU.1PUI.ATIfN PnPCUVFRAGt NL
PEsRCENT OFPOPULATION PFRCFNT tiF INCO1ME
10-20 2 a20-30 2,630 - 4 0 3,64o-so 4SO-b0 560-70 7. 70-80 1 0 2
O0-9 0 1 4 790-100 47,1
STATISTICS LIP INTEREST
A ,R9ALPHA ,9690BE TA *850h
R-SQlUARE ,99hO
GINI Cn1EFF, 5874KUZNETS INDFX x 4SL>E.-ENTRnPY .5106
MEAN INCOME N,A.(CFA FRANCS)
GNP PEP CAPITA qS.465(CFA FRANCS)
96

Table 62. Sierra Leone
SOURCE IYEAR 68369POPULATION HCOVFR&(F (A)
PERCENT OFPOPULATION pectN ()OF INCOME
0-10 0 010-20 1, 12n-30 2.530-U0t 39 h
50-hO 6 ,3bo-70 8*110.80 10 880-909 0 I0 0 41. 4
9'i- I 0 0 36.cMqo-loo~~~~~~~~~~~~~~~~
STATISTITCS OF INIEREST
A A 55 O 8ALPHA .8471t3E TA 8B 1 4R-S(QUARF *Q984
GINI COEFF. ,1il7KUZNETS INDF.X 4i49
E-ENTROPY
MEAN INCOME 595(L E(ONES )
GNP PFR CAPITA 130(L E ONE S)
(A) Not including Westeri1 I'rovince
97

Table 63. South Africa
SO LJRCF IYEAR b5POPULATIQN PlOPCOJVFRAGE NL
PERCENT OFPOPULATIUN PEPCENT OF INCOMF
0-10 0I0l20 1.220-30 t,930-40 3,040-50 4,250-60 h. n
h0-70 89570-80 12,b80-9090-100 4109
95-100 23. 1
STATISTICS OF INIFRE-T
A , b58ALPHA 1,02n2BETA 1.1432RwSDUARE A994qJ
GINT COEFF, ,813KUZNEIS INDEX (4bqbE"ENTROPY .46b30
MEAN INCOME N.Av(RAND)
GNP PFR CAPITA 400(HAND)
98
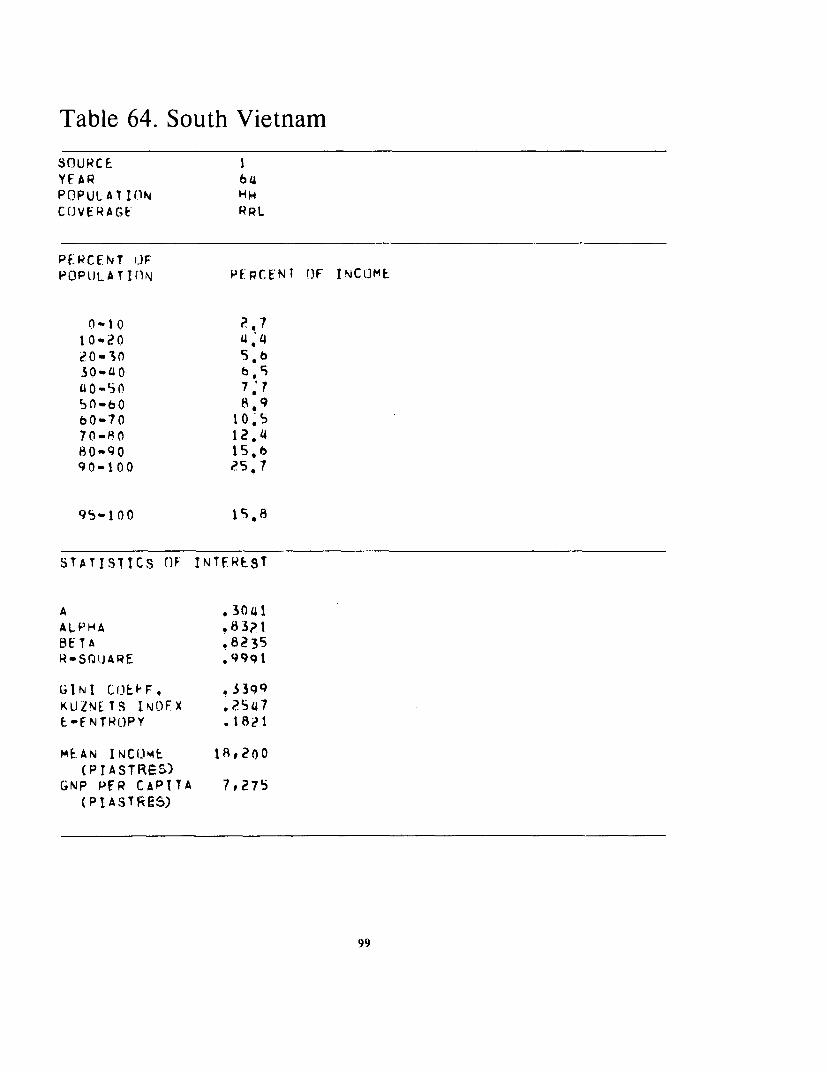
Table 64. South Vietnam
SOURCE IYF AR 64POPULATION HHCOVERAGE RRL
Pf-:CENT ILFPOPULATION PEPCENI OF INCOME
10-20 4,420-10
a 0 - 0 7
5f-6b0 8.9be-70 10.570-fl0 12. 480-90 15,h90-I00 25, 7
95-100 1S,f8
STATISTICS (IF INTEREST
A . 30 41ALPHA .83?l
BETA .8235R-S(iUARE .9991
GINI CrJtLEF, ,33 9 qKUZNETS INOFX .54E-ENTROJPY .1821
MEAN INCOM*E 18.2o0( P I A STRES)
GNP PFR CAPTTA 7#275(PIASTRES)
99
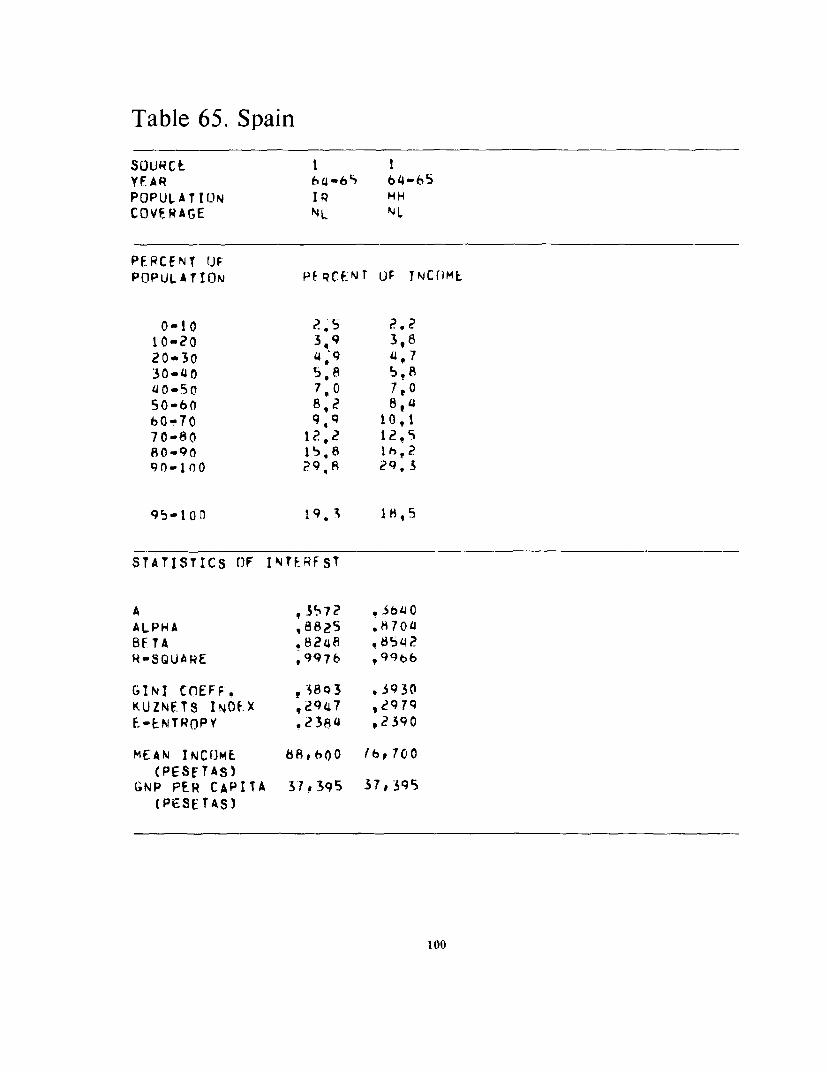
Table 65. Spain
suuce I I
YFAR b.-4bS b4-65
POPULATI1ON IPR HCOVERAGE NL Nl
PERCENT !JF
POPULATION P~RCFNT OF TNCOME
0-10 R'5 2.210-20 3'9 3,820-30 4'9 14,730-U4 5,8 5,AJo-50 700 7,0
50-60 8,2 8,s460-70 9,q 10,170-80 12,2 12.980-9 0 Ibs8 Ih?
90-1oo ?9,8 29.3
95-10' 19.3 18,5
STATISTICS Of INTfRfST
A 35 ,7? , bu4cALPHA ,8825 ,870L1BETA .8248 ,b652H-SQUARE ,9976 , 99bb
GINI CnEFF, , 3893 .3930KUZNETS INOt X ,247 ,2 9 79
F-ENTROPY .238' ,2390
MEAN INCOME 88,0oo lb,700(PESETAS)
GNP PER CAPITA 37.395 37,395(PESE TAS)
100
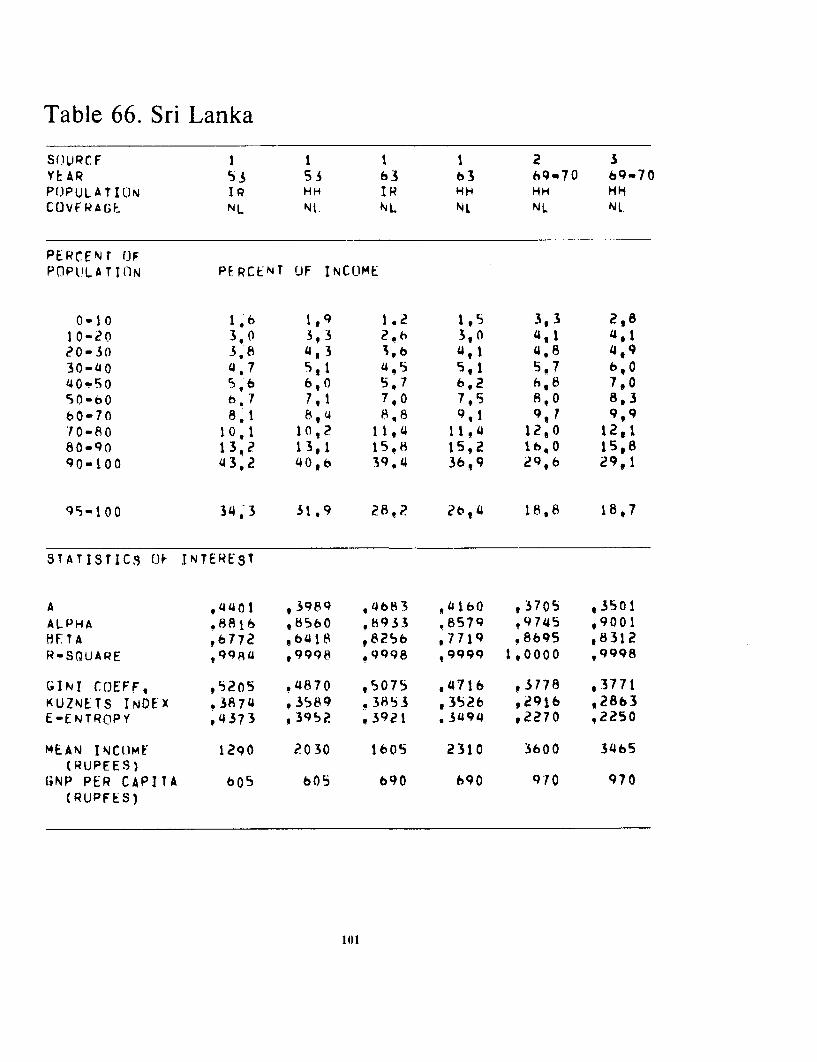
Table 66. Sri Lanka
SO.JURCF I 1 1 1 2 3YEAR 53 53 63 b3 69t70 69-70POPULATION TR HH IR HN HH HhCOVFRAGE NL Nl, NL NL NL NL
PERCEN r r)FPOPUnLATION PERCENT OF INCOMEI
0-10 1,6 1,9 1.2 1,9 3,3 2,810-20 3 0 3,3 2.f 3 0 4,1 4,120-30 3,8 4,3 1,6 4,1 4,8 4,930-40 4.7 S,1 4,9 9,1 5.7 6,040-S0 5,6 6,0 5,7 6,2 6,8 7,0S5-60 b.7 7,1 7,0 7,5 8,0 8,360-70 8 1 8,4 8,8 9,1 9,7 9,970-80 10,1 10.2 11,4 11.4 12,0 12,180-90 13,2 13,1 15,8 15,2 16.0 15,890-0 0 43,2 40,6 39.4 36,9 29,6 29, 1
95-100 34,3 31.9 28,? 2b,4 18,8 18,7
STATISTICS Oe INTEREST
A ,4401 ,3989 *4683 ,4160 ,3705 ,3$01ALPHA .8816 ,8560 ,8933 .8579 t9745 ,9001HFTA ,6772 ,6418 ,8256 ,7119 ,8695 ,8312R-SQUAPE .9984 ,9998 ,9998 t9999 1,0000 ,9998
GINI COEFF, ,52o5 .4870 ,5075 .4716 93778 .3771KUZNETS INDEX ,3874 .3589 ,383 ,3526 .2916 ,2863E-ENTROPY '4373 ,3952 ,3921 .3494 ,2270 ,2250
MEAN INCOiME 1290 2030 1605 2310 3600 3465(RUPEES)
GNP PER CAPITA 605 605 690 690 970 970(RUPFES)
101

Table 66 (continued)
SOURCF 4 4a 4 3 4YEAR 71 73 63 69-70 69-70 13PLOPuLATIO5N HH IR IR hh HH IRCOVVERAGE NL NL UR3 pRrH IJRS URB
PERCENT (lFP(.Pt!LATIf)N PERCf:NT OP I NJME
0-10 2,8 1,7 1.? 2.8 2q4 1,610-0?n 4,S 3,4 2.3 3,5i 3,7 3,720-30 5,5 4,16 3.1 4,3 4,6 4.930-40 6,5 5,h 4p1 5,2 5,6 6,04 0-S0 7.4 7.0 5,1 6,3 6.7 7,250-60 8,7 8.3 6,5 717 7,9 8.560-70 10,0 10.3 l8.4 9,6 9,6 10.270-80 11,8 1?,8 11,0 12,3 12,0 1 2,4en_v 0 C 14, lh,R 1 s 6 I. 158 15b,9q90-100 28,0 29,5 42.7 31,4 31.7 29.6
95"100 18 b 18,3 3t,1 19b6 21 ,1 9,2
STATISTICS (IF INTEREST
A , 30 1 ,3801 ,5170 .4221 37781 7 3477ALPHA .8292 .8i14 ,9350 ,9914 ,899j *7986BETA .7 413 ,8796 .8i46 ,927h ,8219 ,8026R-SQUARE 99q9 .9987 ,9997 ,9968 1,0000 .9987
GINI COEPF, .3530 ,4092 ,5410 ,4143 ,'4100 ,3994KUZNETS INDEX ,2611 3105 .4137 ,3232 93105 .2968E-ENTRnPY ,2049 .2547 .4389 .2641 ,2654 .2499
MEAN INCOME 3730 2650 264S 5300 51440 3605(RUPEES)
GNP PER CAPITA 1120 1120 690 970 970 1120(RUPEES)
102

Table 66 (continued)
SOURCE 4 3 4 4 2 2YEAR h3 69-70 73 63 69-70 69w70P(OPULATION IR HH IR IR HH HHCOVERAGE RRL RRL RRL (A) (B) (C)
PERCENT OFPOJPULATILON PERCENT OF INCOME
_-10 1.0 2,9 t,7 300 6,7 4,410-20 2,7 4,3 3,9 5,b 6,8 4,520-30 3.8 5,2 5,1 6,7 6.9 4,930-40 5,0 6,2 6,4 7,6 7.2 59h40-5O 6 3 7.3 7,5 8,4 7.7 6,550-60 7.8 h,7 9.0 9.2 8,8 7t9hO-70 9,8 1093 10.6 10,1 10,0 9,870-80 12,6 12,b 12,8 11,3 11,8 12,680-90 17:3 lhel lhil 13,1 14,7 17,290-100 33.7 2b*4 26,9 25,0 19,4 26,6
99-100 21.7 l,0 16.6 11,1 10,b 19,0
SIATISTICS OF INTEREST
A .4380 .33s2 .3272 ,2136 .2472 ,3963ALPHA .8579 ,8917 .7832 ,6811 1.3108 1,14358ETA ,8902 .8736 .8327 ,5774 ,9904 1,0212R-SQUARE ,9992 ,999E ,9980 ,9993 .9901 ,9984
GINI COEFF. ,4675 .3517 ,3732 .2931 ,2047 93458KUZNETS INDEX .35558 ,Z84 ,2779 ,2063 .1695 ,2789E-ENTRJPY .3262 ,1921 ,2172 ,lSb4 ,0736 ,1891
MEAN INCOM 1490 3170 2750 755 2380 3180(RUPFFS)
GNP PFR CAPITA 690 970 1120 690 970 970(RtJPtES)
(A.\ ) I:t) c(1) IFstaLIC. rur;lW(I ()her. ruril
103
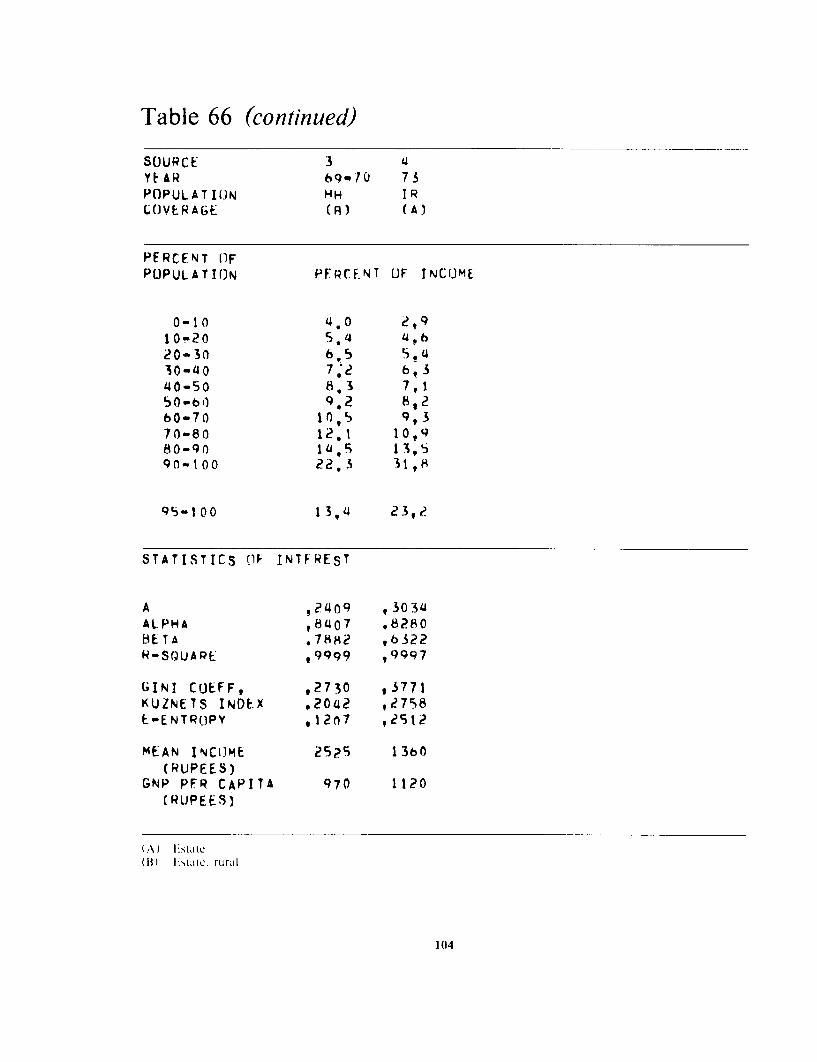
Table 66 (continued)
SOURCE 3 4YEAR 69-TO 73POPULATION HH IRLOVERAGE (R) (A)
PERCENT OFPOPULATION PFRCENT OIF INCOME
0-10 4.0 2,910-20 5.4 4th20-30 6.5 5,430-40 7,2 bq340-50 8 .3 7,150-b) 9,2 8,260-70 10,5 9,370-80 12.1 10,980-90 14., 13,590-t00 22.3 31,8
95-100 13,4 23,p
STATISTICS (IF INTFREST
A ,'2409 t30 34ALPHA ,8407 .8280EiETA .7882 ,6322R-SQUARE ,9999 ,9997
GINI CUEFF, ,?730 93771K(UZNETS INDEX ,2042 ,2758E-ENTROPY ,12n7 ,2512
MEAN INCOME 2525 1360(RUPEES)
GNP PFR CAPITA 970 1120(RUPEES)
(A) [staLeB ) I 1t;1Ic. Riural
104
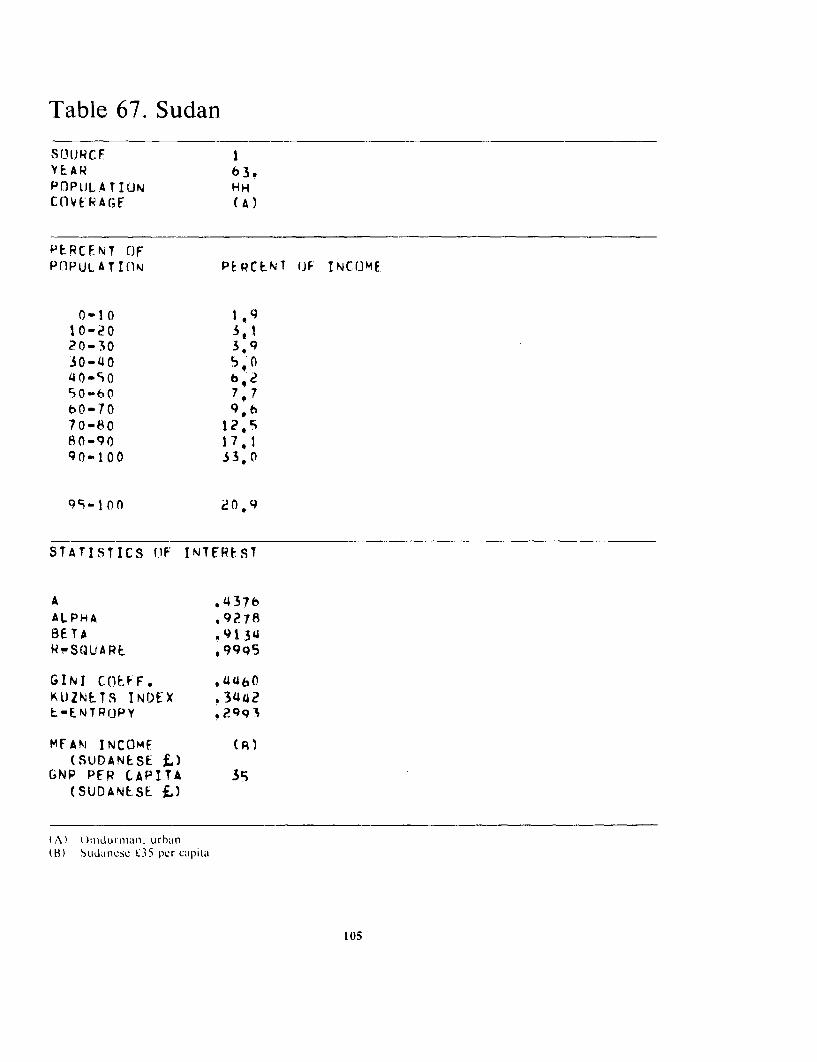
Table 67. Sudan
SO()RCF IYEAR 63.PlPlJLATIOUN HCOVERAf;F A
PERCFNT OFPOPULATIOlN PtPCENT OiF INCOME.
0-1 0 1 09I 0-20 31 I20-30 3.930-410 5,4 .0-SO 250-60 7 7bo-70 9,670-8Q0 1,58 0 -9 0 17 ,190-100 33,t)
95-10on 0n.
STATISTICS (iF INTFREST
A .437bALPHA .9278BETA .91 34RN-SQUARE R9995
GINI C(EFF. 4460KUZNETS INDEX .34aZE-ENTROJPY
MFANt INCOMF (R)(SUDANESE f )
GNP PER CAPITA 35(SUDANESE f,)
(A) ( )01du11 rm . urban(t) SLIckillesc :35 per capita
105
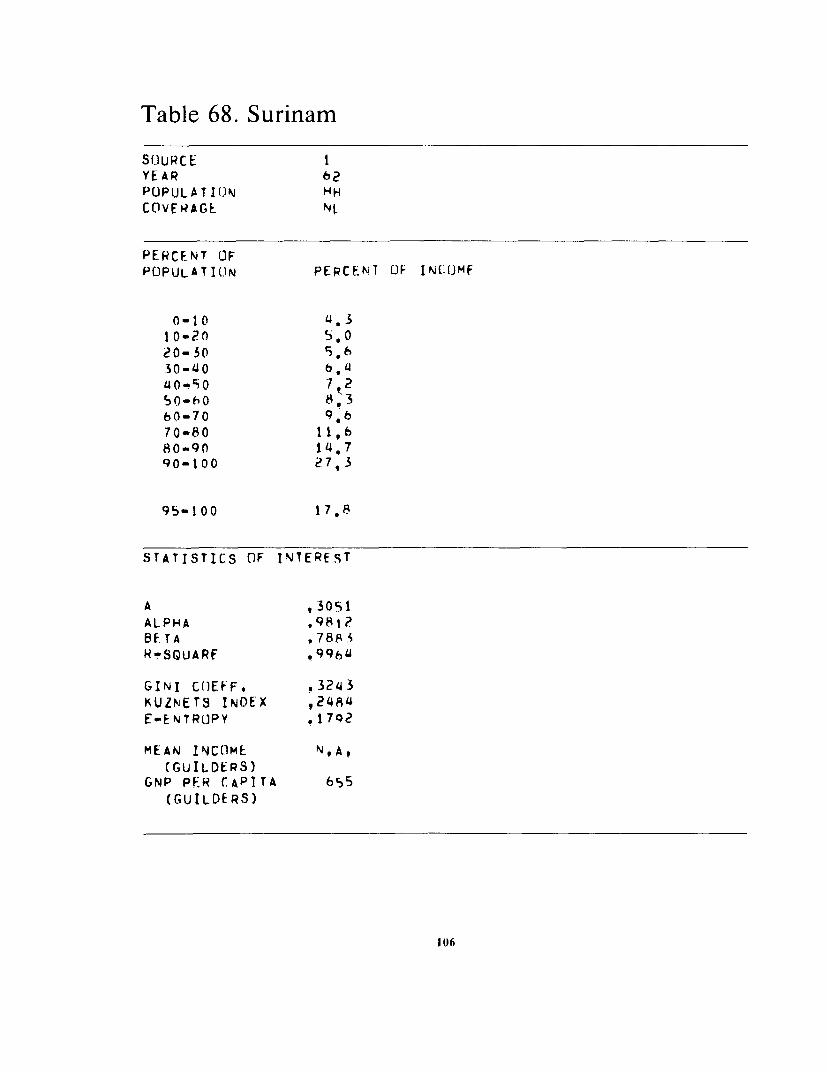
Table 68. Surinam
SfJURC E IYE AR 62POPULATION HHCOVFRAGE Nl
PERCENT OFPOPULATION PERCEN1 OF IN('OfMH
0-10 4.310-20 5,020-30 5.h30-40 6. 44n-sio 7,250-60 8, 3bO-70 9,670-80 11 b80-90 1 4.790-Q00 27, 3
95-100 17,8
STATISTICS OF INTEREST
A , 3 0 5 1ALPHA .9812BETA .788 3R-SQUARF .99h4
GINI COEFF. ,3243KUZNETS INDEX .2484E-ENTROPY Y1792
MEAN INCOME N,A.(GUILDERS)
GNP PER CAPITA 655(GUILDERS)
106

Table 69. Sweden
SOURCE. I 1 2YEAR 54 63 70POPULATION IR IR IRCOVERAG;E N1 NL Nl
PERCENT (iFPOPULATION PERCE.NT U) INCOME
0-10 1, I t3 1,510-20 4,0 3,3 3,720-30 5,1 4,17 4930-140 6,3 5,8 6,140-50 7,5 7,2 7,1450-60 8,9 A,7 8,8bO-70 lO,14 10,9 10.670-80 12,7 13,1 12,9n0-90 16.O 1,9 16,6
90-100 2703 28,5 27,.
9q'-100 17,0 17,1 16.8
STATISTICS (OF INTEREST
A ,3287 .3683 ,3470ALPHA ,79714 ,8071 ,7997bFTA q8260 ,8790 ,8604N-SQUARE ,99R4 .992h ,9992
6INI Ct)EFF. 37314 ,4058 ,3872KUZNF.TS INDEX ,2779 ,3053 ,290SE-ENTRfl:PY ,2180 .2520 ,2315
MEAN INCflME N.& N , A 20 920
(KRr)NE9)GNP PER CAPITA 6,l1S ll,470 21,130
( KRONER )
107

Table 70. Taiwan
SOURCE 123 4 1YEAR 5 3 5q-b0 6 1 b41 7?2 7 2
POPULATION HH HH HM HH HH
COVERAGE NI NL NL NL NL NAG
PERCENJT OIFPOPULATICUN PEpCENT OF INCOME
0-10 1.1 2,3 1.41 3,0 3t,b 397
IO-20 19I8 3,.3 3,I0 41,8 Is,2 5 , a20-30 2,5 41,2 41,0 5,8 6,3 6,4130-410 3,5 5,1 5,1 b, 7 7,2 7,41410-50 41.5 6,1 6.2 798 8.2 893
5n-60 5,9q 7.. 7,t6 8,8 9.3 9.3
60-70 8,0 9.1 9;2 lo's 10,6 10,770-80 10,9 11,5 lI.7 12,0 12.41 1?,3
8 0 -9 1 6 ,6 I 5, I5 , 7 114 ,7 114 18 1a , 790 -10 0 41 5 *2 35 ,41 36.,1 26,aI1 2 , 4 2 1. 8
95-100 32,? 241,5 25,3 16,7 13.,3 12,9
STATISTICS OF INtEREST
A 5b931 .41 8b ,4 195 ,2820 ,25 32 , 2 431ALPHA DqJ ,9277 1,8574 .81741 8299 .8277
BETA *9477 ?8187 ,79b8 .75413 t8162 ,81413
R-5QUARE 9,98s8 ,9979 ,9972 .9)87 .9998 .9997
GINI COEFF. .5762 .'41481 i,41941 .3290 928413 ,2736
KUZNETS INDEX u414q5 ,3411 .3526 ?2432 ,21?b .12053
F-ENTROPY ,47q8 t3173 ,34118 .1768 ,1289 .1199
MEAN INCOMF 10o500 23,700 28,330 NqA1 5b,700 60,000
(NEW TAIWAN $)GNP PER CAPITA ?,7~S 5,4125 6,260 83410 18,990 18,990
(NEWJ TAIWaAN% $)
108
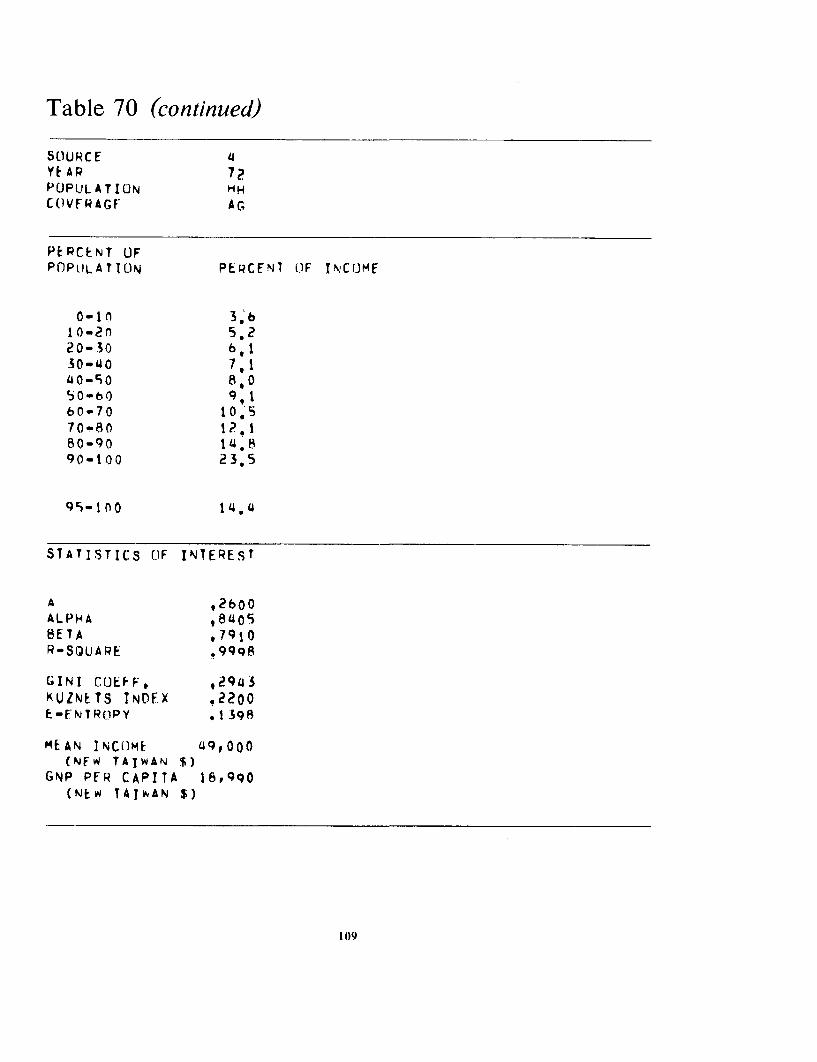
Table 70 (continued)
SOURCE 4YE AP 72POPULATION HC(IVFRAGF AG
Pt RCkNT OFPOPOLATTON PERCENT (IF INCOME
0-10 3,b10-20 5.220-30 6b,30-40 7,14 O-';0 8, 05 0 - 6 9 , 160-70 10,570-80 12,180-9090-100 23.5
95-100 14.4
STATISTICS (IF INTEREST
A t 2600ALPHA t8405BETA .7910R-SOUARE .999q
GINI CUIEFF, ,2943KUZNrTS INDETX .2200-E-NTROPY .1398
MEAN INCO)ME 490000(NEW TAIWAN $)
GNP PER CAPITA 18,990(NEW TAJVWAN $)
109
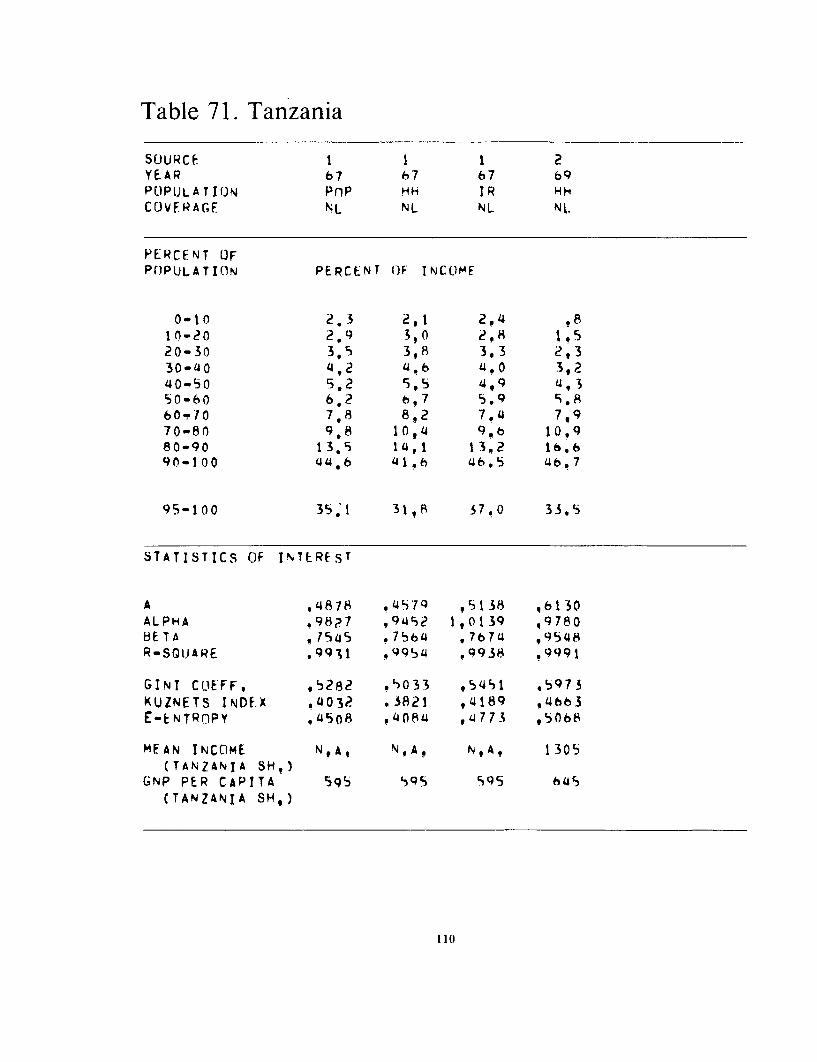
Table 71. Tanzania
SOJURCF I I 1 2YEAR 67 67 67 69POPULATION Pnp HH IR HHCOVFRAGE NL NL NL NI,
PERCENT OFPflPULATION PERCENT OiF INCOME
0-10 2.3 2,1 2,4 ,810-20 2,9 3,0 2,8 1.520-30 3,9 3,8 3,3 2,330-40 4,2 4.0 3,240-50 5.2 5,5 409 4,350-60 6.2 b,7 5.9 9.860-70 7,8 8,2 7,4 7,970-80 9.8 10,4 9,b 10,980-90 13,5 14,1 13,2 1b,690-100 44,6 U1,6 46.5 4b,7
95-100 35 1 31,8 37.0 33.5
STATISTICS OF INTEREST
A *4878 ,4579 ,5138 ,b130ALPHA .9827 ,9L492 1,0139 ,9780BETA ,7545 .7564 .7674 ,9548R-SQUARE ,9931 9 9954 99 38 .9991
GINT CLiEFF, ,5282 .'033 *5451 ,5973
KUZNETS INDE.X .4032 .3821 ,4189 ,4663E-ENhTROPY ,.4508 .4084 ,14773 ,5068
MEAN TNCOME N,A, N*A.A N,A* 1305(TANZANIA SH,)
GNP PER CAPITA 9S 59S 595 645(TANZANIA SH,)
110
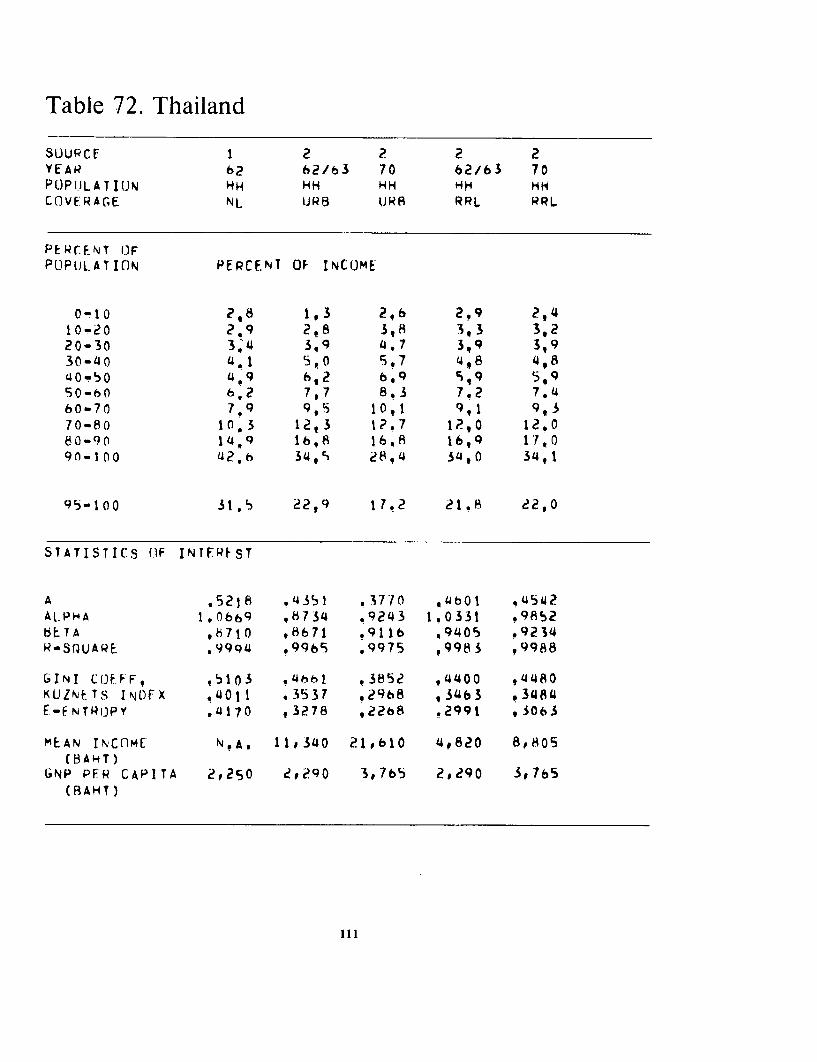
Table 72. Thailand
SUU9CF 1 2 2 2 2YEAR 62 62/63 70 62/63 70POPUlLATI(JN HH HH HH HH HHCOVERAGE NL URB URiR RRL RRL
PEWRCE.NT (FPOPULATION PERCENT 0F INCOME
0-10 2,8 1,3 2,6 2.9 2,410-20 2,9 2.8 3,8 3,3 3,220-30 3.I4 3.9 4.7 399 3,930-40 4.1 5,O 5.7 4,8 4,8'40-S0 4.9 6,2 6,9 5,9 5,950-0 6.2 7,7 8.3 7.2 7.460-70 7.9 9,5 10t1 9,1 9,370-80 to,3 12,3 I?,7 12,0 12.080-90 14,9 lb,l8 16,8 18,9 17,090-100 42.b 34',% 28.4 34,0 34,1
q5-100 31.S 22,9 17.2 21.8 22,0
STATISTICS OiF INTFRFST
A .521 .4351 .3710 a6b01 ,4542AL.PHA 1.0669 .8734 .9243 1.0331 .9852bETA ,8710 .8671 .9116 *9 4 005 s9234R-SQUARE .99Q4 ,9965 .9975 ,9983 ,9988
GINI CiOEFF, ,5103 ,4hbl .3852 .4400 ,4480KUZNETS INOFX .4011 .3537 ,29b8 ,3463 .3484E-FNTROPY .U170 ,3278 ,2268 .2991 ,3063
MEAN INC(IME N A 11 , 340 21 ,l60 4,820 8,O05(8AHT)
GNP PER CAPITA 2,250 2,290 3t765 2,290 3,765( RAHT)
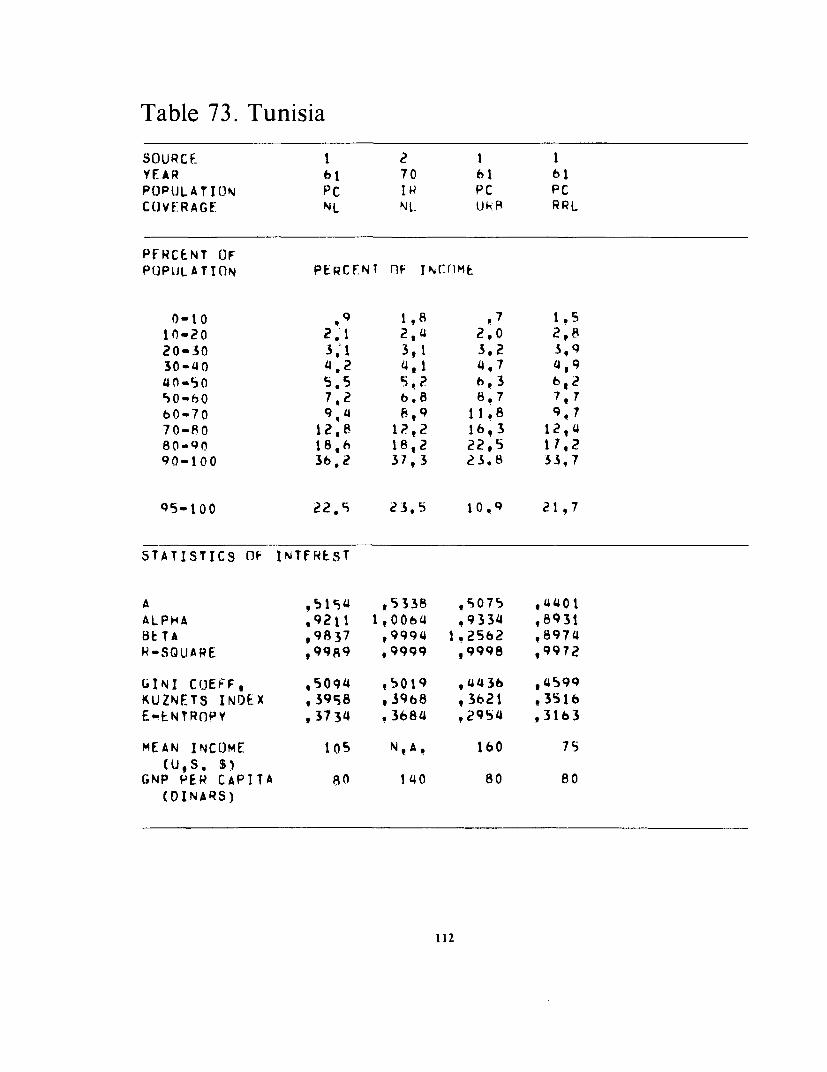
Table 73. Tunisia
SOURCf I 2 1 1YEAR 61 70 61 61POPULATION PC I PC PCCOVERAGE NL Nl kJ04 RRL
PERCENT OFPOPUJLATION PERCUNT nF INCOC1ME
0-10 ,9 1,8 ,7 1 510-20 2.1 2,4 2,0 2,820-30 3,1 3,1 3,2 3,930-40 4.2 4,1 4.7 4,940.50 5.5 9,? 6,3 6,250-60 7,2 b.8 8.7 7,7b6-70 9,4 8,9 11.8 9,770-80 12,8 1?,2 16,3 12,480-90 18,6 18,2 22,5 17,290-0 0 3692 37,3 23. 8 33,7
95-100 22.9 23.5 10,. 21,7
STATISTICS OF INTFREST
A ,5194 ,5338 15075 .4401ALPHA .9211 190064 .9334 ,8931BETA ,9837 ,9994 1.2562 ,8974P-SQUARE ,99A9 ,9999 ,9998 ,9972
GINI CUEFF, ,5094 ,5019 ,4436 ,4599KUZNETS INDEX ,3958 ,3968 ,3621 ,3516E-ENTROPY ,3734 .3684 ,29S4 ,3163
MEAN INCOME 105 N,A, 160 75
tUS,S $)GNP PER CAPITA 80 140 80 80
(DINARS)
112

Table 74. Turkey
SUIURCE: YE AR 68PnPULATION HHCLJVFRAGE NL
PERCENT OlFPflPULAT 11N PERC(ENT OF INCOME
0-10 19010-20 1 ,9
O-i0 2,830-4n 3 740 -50 a.50-bn o,260 -70 A 17 0 8 0 10*q80-40 pS190-100 44.7
99-1 00 32.8
STATISTICS OF INTEREST
A ,5533ALPHA .9452BETA .8828R-SQOJARE 1,0000
GINT COlEFF. 95679KUINETS INDEX .4368E-ENTRt)PY ,4734
MEAN INCfJMF 11,075(TURKISH LIRA)
GNP PER CAPTIA 3,295(TIJRKISH LIRA)
113

Table 75. Uganda
SOLJRCE' 1 1 1 1 1YEAR 70 o0 70 70 70POPl)LATION (A) (A) (A) (A) (A)COVERAGE NL NAG URB AG RRL
PERCENT OFPOPULATION PERCENT (iF INCOME
0-10 2,4 2,3 2,3 ',? 4.210-20 3'8 3t7 3,7 5.9 5,920-3t0 4,7 a,b 4,.7 , 8 6.730-40 9,t 5,7 5.7 7,h 7,540-50 6,8 6,8 6,8 8,3 8,250-60 9,1 8.3 8.3 9,1 9,060-70 9,8 10,0 10,0 10.0 9.970-80 12,1 12,5 12,5 11,2 11.280-90 15,9 16,5 1b,5 13,1 13,290-O00 30.7 29,6 29.5 2,.8 24,?
95-100 20.0 1Mt5 18.5 15 , 18,3
STATISTICS t!F INTEREST
A ,3h95 ,3 1h 37?50 .2066 .2125ALPHA .8882 .8926 .P929 ,7740 .7886BETA .8291 ,8738 ,8723 .611t .6152R-SQUARE .999S .9997 ,9998 ,9964 .9970
GINI COEFF, ,4iOo7 3978 3968 ,2662 ,271bKU1NETS INDEX t3032 .3032 ,3032 .1916 .1968E-ENTRnPY .2521 .24 32 ,2422 ,1290 1 344
MEAN INCOME 2890 3120 3120 1740 1780(LI;ANDA SH.)
GNP PER CAPITA 945 945 945 945 945(UGANDA SH,)
(A) Al riclirii tlie emploYccs
114
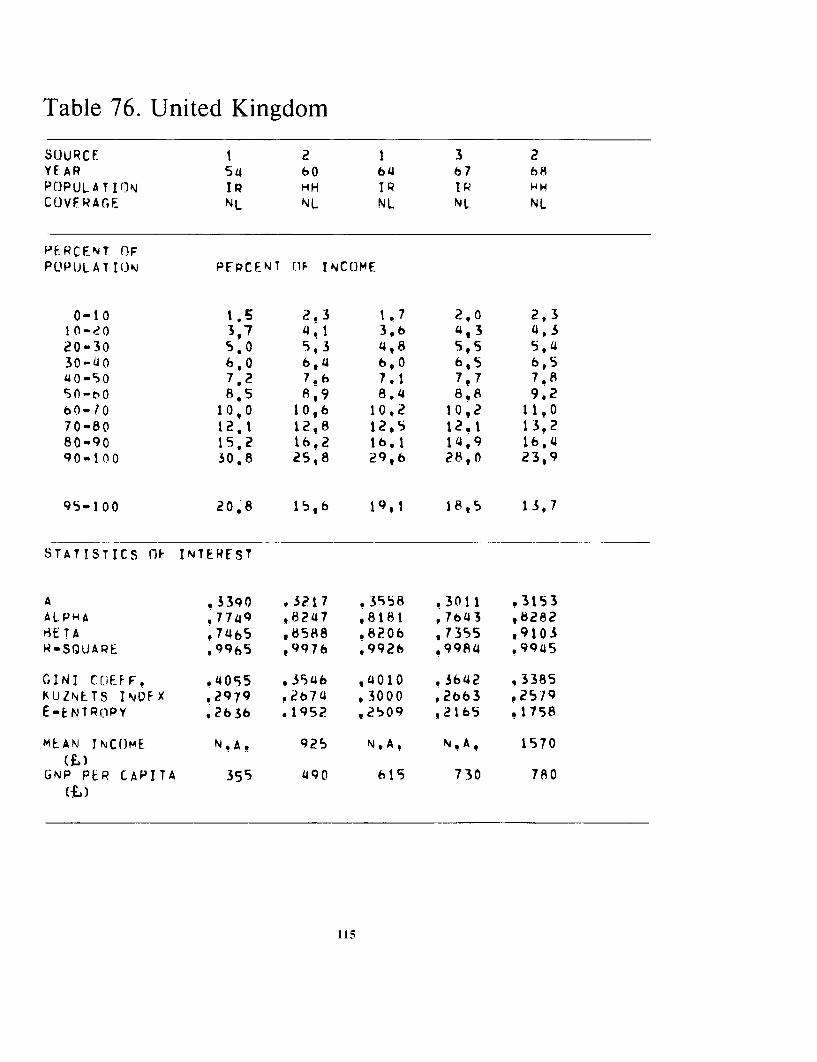
Table 76. United Kingdom
SOURCE 1 2 1 3 2YEAR 54 60 b4 67 h8POPULATION IR HH IR IR HHCOVFRAGE NL NL NL NL. NL
PERCENT OFPOPULATION PERCE NT OF INCOME
0-10 1.5 2,3 1.7 2,0 2,31o-'O 3,7 4.1 3,6 4,3 4.320-30 5.0 5,3 4,8 5,5 5.430-0 6.0 6b,4 6,0 6,5 6,540-50 7,2 726 7,1 7,7 7q850-bC) 8.5 8,9 8.4 8,8 9,260-70 10,0 10,6 10.2 10,2 11O70-80 12.1 12,8 12,9 12.1 13,280-90 15,2 16.2 16.1 14,9 16.490-100 30.8 25,8 29,6 28,0 23,9
95-100 20.8 15,6 J9,I 18,5 13,7
STATISTICs nF INTERFST
A 3390 .3217 .3558 .3011 .3153ALPHA .7749 .8247 8181 ,7643 ,8282tETA ,7465 ,8588 .8206 ,7355 19103R-SQUARE .9965 ,9976 .9926 ,9984 .9945
GINI C(IEFFF, .4055 .3546 ,4010 .3642 .3385KLIZNETS INQFX .2979 ,2674 ,3000 ,2663 ,2519E-ENTROPY .2636 .1952 ,2509 ,2165 ,1758
MEAN INCOME. N A. 925 N,A, N,A, 1570(t)
GNP PER CAPITA 359 490 h15 730 780(t)
115

Table 77. United States
SOURCE I 1 2 3 3 4YEAR hO 66 70 70 71 72POPULATION HH HH PC HH HH HHCOVERAGE NL NL NI NL NL NL
PERCeNT OFPOPULATION PERCENT UF* INCoME
0-to ,8 ,8 2,2 1,4 1,5 9810-20 3;6 3,5 46 3,4 3,14 3,120-30 5,1 4,9 5,7 4,6 41,7 4.430-40 6,4 6,2 7q0 5,9 5,9 5,840-50 7,7 7,5 8.1 7t1 7.1 7.tS0-60 9.2 8,9 9,4 8,6 8,6 8,860-70 10,9 10,6 11.0 1014 10,4 10,870-80 13,1 12,9 t2,9 12,8 12,8 13,580-90 16.5 l6,4 1.7 16,7 16.6 17.b90-100 2b.7 28.3 23t,4 29,1 29.0 28,1
95-100 16.3 17,8 13.8 18,2 18.1 l6.h
STATISTICS OF INTEREST
A ,3303 ,3427 28 36 ,3b60 3b51 ,3836AL.PHA ,7282 t7420 ,7686 .8083 .8161 .7971bETA ,8404 .820h ,8469 ,85b0 .8589 ,9190H-SQUARE .9961 .9965 ,99b0 .9956 .99S9 ,9969
GINI CUEFF, 03865 ,4018 ,3238 .4074 0Y042 ,4171KUZNETS INDEX .28h3 t2968 ,2421 ,3063 .3042 ,3158E-ENTROPY .2328 ,2509 t1655 92558 ,2512 ,2b?0
MEAN INCOME N,A, N,A, N,.A, 10,800 11,270 10,900
(U,S. sjGNP PER CAPITA 2830 3880 48140 4,835 5.155 5,625
(U.S. $)
116

Table 78. Uruguay
SOU)PCFf I IYEAR 67 67POPltJ ATI ON I R HHCO\/F PA GE L. NL
PLRCtNT C)FPOlPULATIOIN PPRCENT OF INCOMF
0-10 .9 1.310-20 2,1 3,12-3 0 3,? 4,330-40 4,4 5,540-S 5,7 bt85 0 -6 0 7.4 8.460-70 9,7 10 270-80 13,1 12,980-90 19.0 17.190-100 34,5 30,4
95-100 20.8 19,0
STATISTICS OF INTEREST
A . 507 ,3949ALPHA .9129 !8346
BETA ,9970 .8839k-SQUARE ,9 9 69 .9999
GINT Cl)EFF, 496R ,4279KUZNETS INnFX .3874 .3242E-ENTROPY .35S3 .2761
MEAN INCOME N,A, N.A,(PF'SOS)
GNP PER CAPITA 59,420 59,420(PESSn)
117

Table 79. Venezuela
SOURCE 1 2 3 4 S SYEAR 6? 71 h2 62 71 h2POPlJLATIO.1N HH EAP HH NH IR HhCOVERAGF NL NL URR LJR8 NAG RRL.
PERCENT liFPOPUL ATICIN PERCENT OF TNCOME
0-10 103 1,0 1,7 1.7 .9 1,910-?0 2.0 1.7 3.3 3t1 2.9 3,120-30 2,7 2.3 4.2 4,2 4,.0 3,930-40 3,6 3.2 S,3 5,? 5,1 4,940-SO 4,8 4,2 6,5 6.4 6.4 6.1S0-60 6.4 5,4 7.9 7,8 7,6 7,460-70 8.4 7,? 9,7 9t7 9,4 9,270-80 11.8 9,6 12.1 12,4 11.8 11.880-90 17,8 1422 lb,3 1b,A 15,6 16,390-100 41,2 51,2 33.0 32,7 36.3 35,4
95-100 27,2 440.5 2 18 21,2 25,6 23,9
STATISTIcs nf INTEREST
A ,5742 ,h058 ,4047 94172 t4141 ,4394ALPHA .9969 .9775 ,87443 ,8880 ,8169 .9248BETA .9912 .8529 ,8433 ,8757 ,7782 ,8602R-SQUARt ,9993 '9983 t997h *9997 .9996 ,9997
GINI CUEFF, ,54445 o6223 ,4385 ,44 18 ,44772 ,4607KUZNFTS INDFX .4?95 .44800 ,331b6 33b8 ,354 7 *3526E-ENTROPY .4270 560,4 .2956 .2962 ,3534 .3264
MEAN INCnME N.A, 1010 N,A, N,A. 10,800 N.A,(BOl IVARES)
GNP PER CaPITA 2,960 4,590 2,96o 2,96O 4,590 2,9O6(ROLIVARIS)
118
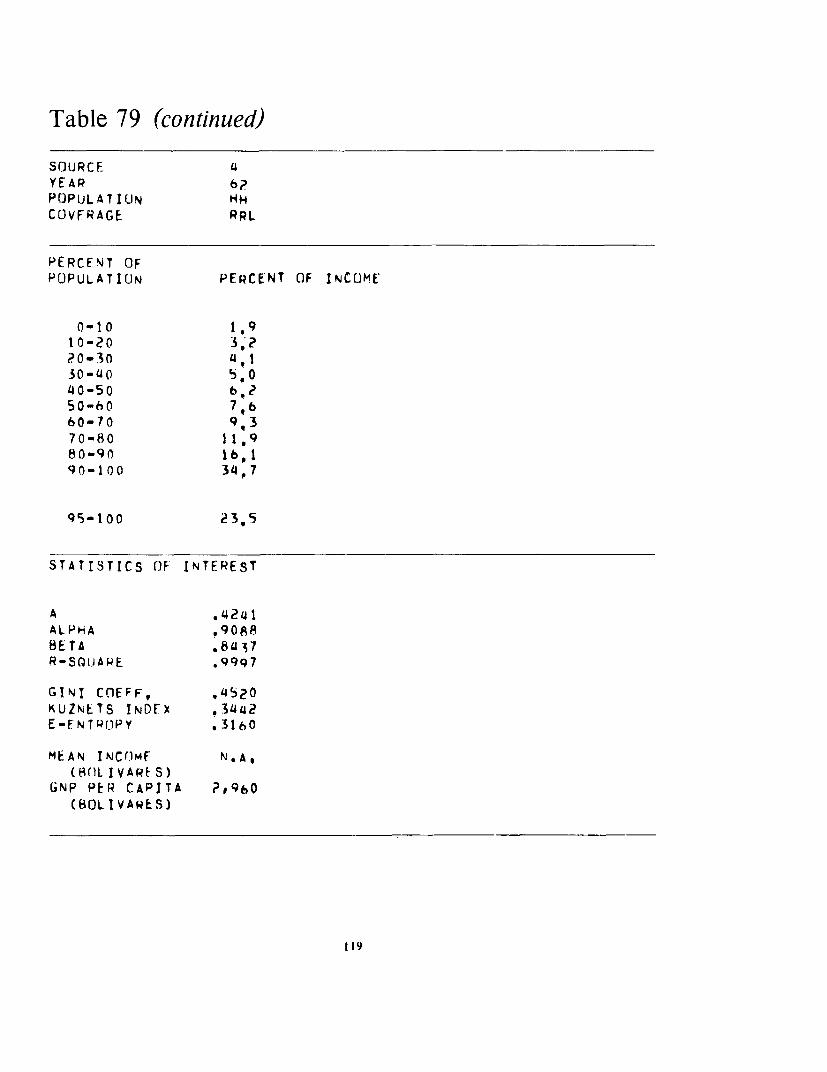
Table 79 (continued)
SOURCE. 4YEAR 6?POPIJLATION HHCOVFRAGE RRL
PERCENT OFPOPULATION PERCENT OF INCOME
0-10 1,910-20 3,220-30 '.1
4 0 -5 0 6 ,? 50-60 7,660-70 9, 370-80 1 ,980-90 lb6 190-100 314 7
95-100 23,5
STATISTICS OF INTEREST
A . 424 1ALPHA .9081BETA .8a37R-SQIARE .9997
GINI CtlEFF, 4520KUZNE.TS INDEX ,3442E-ENTPOPY .3160
MEAN INCOmF N.A,( 8 f L IV AREtS )
GNP PER CAPITA ?,960tOLIVARES)
119
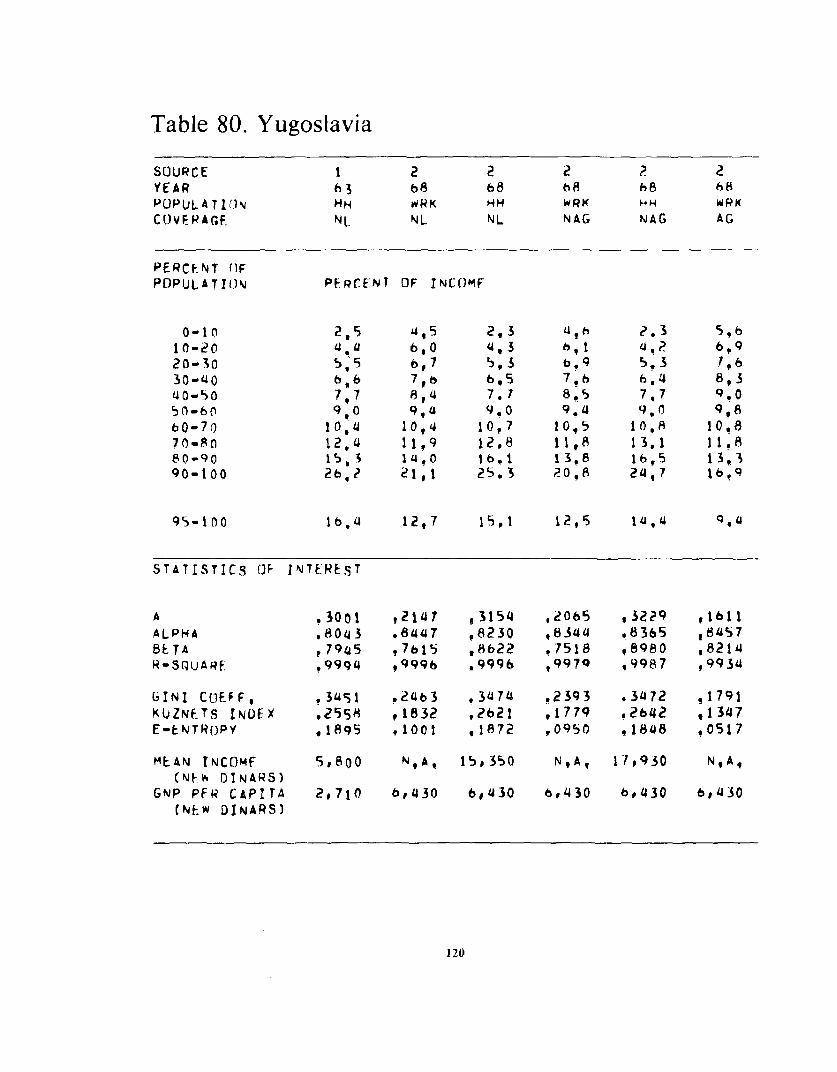
Table 80. Yugoslavia
SOURCE 1 2 2 2 2 2YEAR h3 b8 b8 h8 68 68POPULATIflN HH WK HH WRK b+H WRKCOVERAGF NL NL. NL NAG NAG AG
PERCfKNT (IFPOPULATIO)N PH9CENT OF INCOMF
0-10 2,5 4J,5 2,3 42h 2.3 5,610-20 4.U bo0 4,3 h,1 4,2 6,920-30 5,S 6,7 5,3 b , 5.3 1,630-40 b,6 7bb 6.5 7,' h,4 8,340-50 7,7 8,4 7.7 8,5 7,7 q.050-60 9t0 q9a 9.0 9.4 9,0 9,860-70 10,It 10,'j 10,7 10,5 1(.8 10,870-80 12,4 11,9 12.8 11,8 13.1 11.880-90 15,3 14,0 16.1t 13e8 16,5 13,390-100 2b,? 21,1 2S.3 20,8 24,7 16,9
95-100 1b,4 12,7 15.1 12,5 141 ,4
STATISTICS OF INTEREST
A .3001 ,21417 315 4 ,20b5 ,3229 1b 11ALPHA .804 3 .84Y 7 ,8230 ,8344 .B365 , 8457BETA ,7945 97615 ,8b22 .7518 ,89B0 ,8214R-SQCUARf. ,9994 ,9996 .9996 ,997q ,9987 ,9934
6INI COEFF, 03451 .2463 *3474 .2393 .3472 ,1791KUZNETS INIFX .2558 ,IB32 ,2b21 .1779 .2642 ,1347E-ENTROPY ,1895 ,1IOO ,1872 ,0950 ,1848 .0517
MEAN INCOMF 5,800 N,A, 15,350 N,A, 17930 N,A,(Nth- DINARS)
GNP PFR CAPITA 2,710 6,430 6,o430 6,430 b6,430 h,430(NEw DINARS)
120
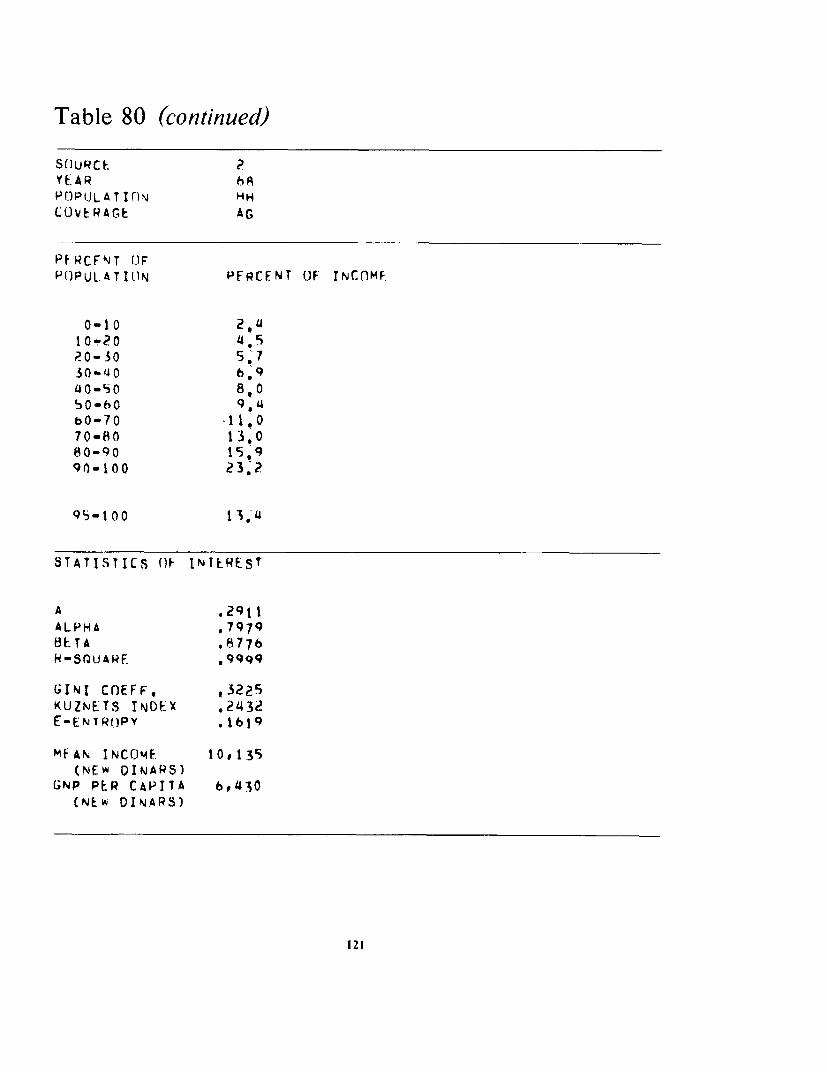
Table 80 (continued)
SOuRCE 2YE.AR 6PPO PIJL AT I (IN NHCOVERAGE AG
PE.RCFNrT (FP(PULATILIN PFRCFNT OF INCnMF.
0-10 2t0-?0 Y S? 0 - 0 5 730 -140 6 940.so 8 0¶50-b09,b0-70 11,070-8l0 1 3 080-90 15.990-100 23*?
95-100 13.4
STATISTICS O] INTEREST
A ,291 1
ALPHA ,7979BETA .8776H-SQuJAF. .9999
GIN[ COEFF, ,3225KUZNETS INDEX .2432E-ENTROPY .1619
MFAN INCO'ME 10.135(NEw DINARS)
GNP PER CAPITA 6,430(NEW DINARS)
121
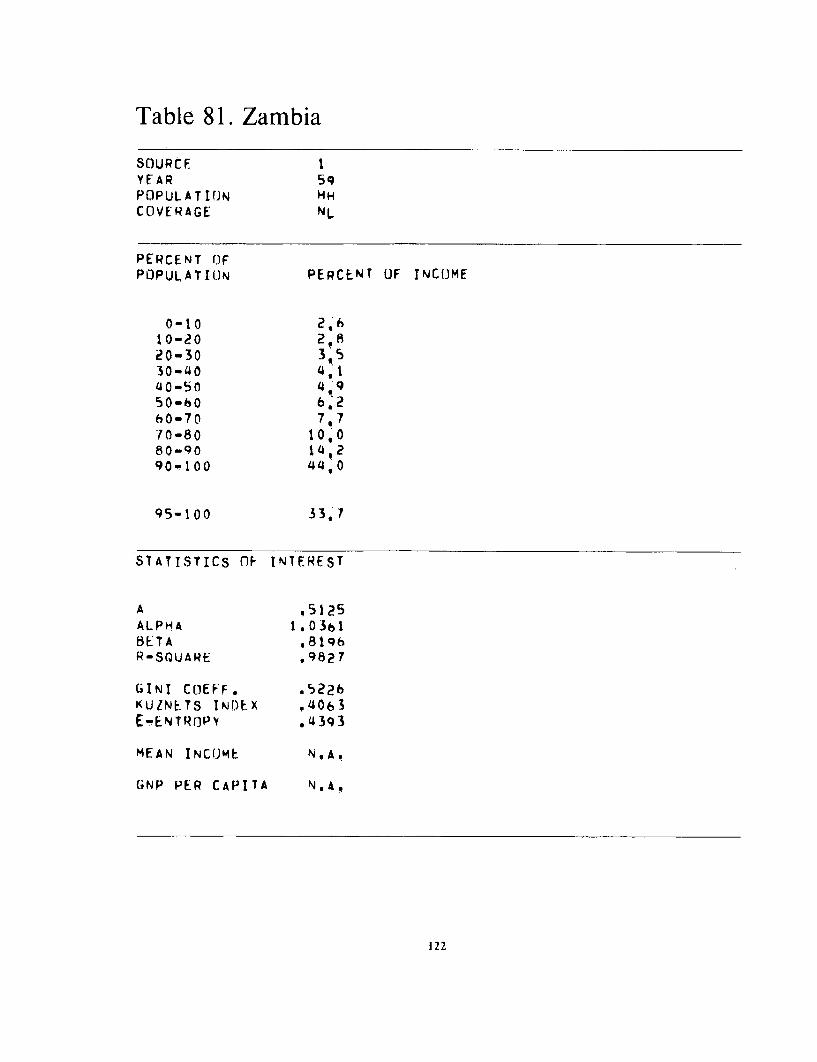
Table 81. Zambia
SOURCE IYEAR 59POPULATION HHCOVERAGE NL
PERCENT OiFPOPULATIOJN PERCENT OF INCOME
0-10 2, h10-20 2,820-30 3,530-40 4,140-50 4,950-6h0 6.260-70 7,770-80 10,080-90 14,290-100 44,0
95-100 33.7
STATISTICS nf INTEREST
A .5125ALPHA 1,0361BETA ,8196R-SQUARE 99827
iINT COEFF. .5226KUZNETS INDEX .4063E-ENTROPY .4393
MEAN INCOME N,A.
(NP PER CAPITA N.A,
122
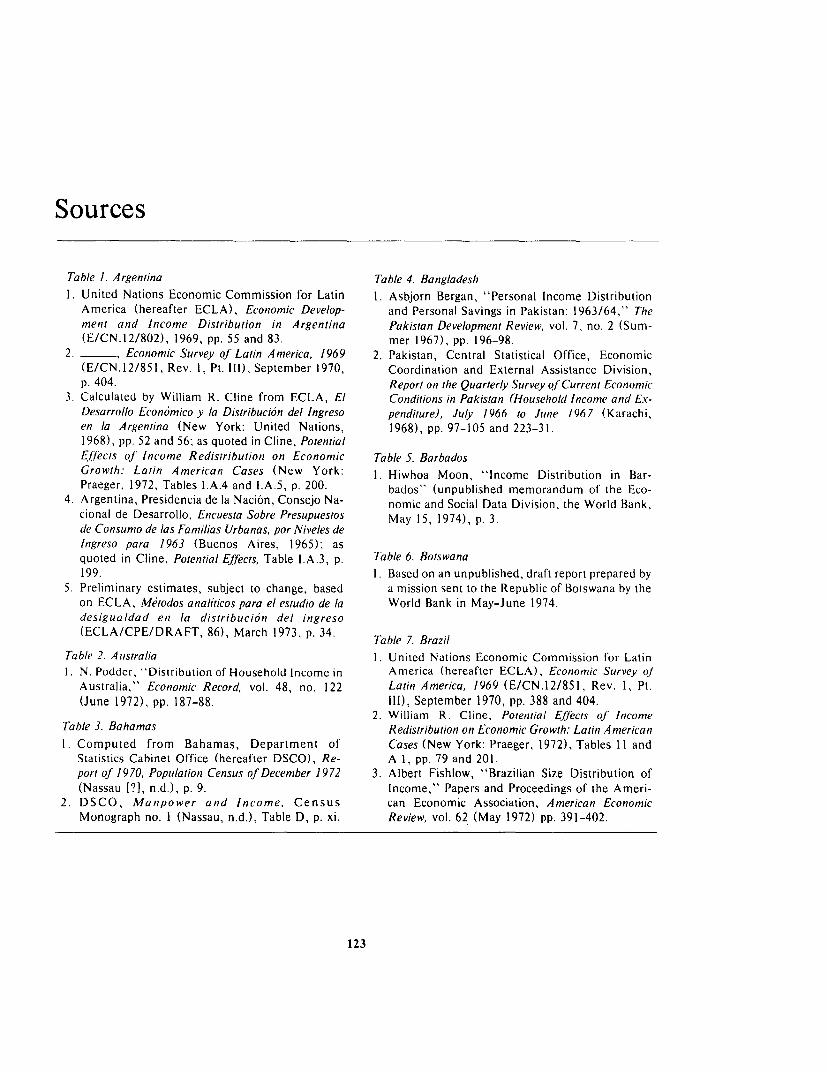
Sources
Table 1. Argentina Table 4. Bangladesh
1. United Nations Economic Commission for Latin 1. Asbjorn Bergan, "Personal Income DistributionAmerica (hereafter ECLA), Economic Develop- and Personal Savings in Pakistan: 1963/64," Thement and Income Distribution in Argentina Pakistan Development Review, vol. 7, no. 2 (Sum-(E/CN.12/802), 1969, pp. 55 and 83. mer 1967), pp. 196-98.
2. , Economic Survey of Latin America, 1969 2. Pakistan, Central Statistical Office, Economic(E/CN.12/851, Rev. 1, Pt. 1II), September 1970, Coordination and External Assistance Division,p. 404. Report on the Quarterly Survey qf Current Economic
3. Calculated by William R. Cline from ECLA, El Conditions in Pakistan (Household Income and Ex-Desarrollo Econ6mico y la Distribuci6n del Ingreso penditure), July 1966 to June 1967 (Karachi,en la Argentina (New York: United Nations, 1968), pp. 97-105 and 223-31.1968), pp. 52 and 56; as quoted in Cline, PotentialEjfects oJ Income Redistribution on Economic Table 5. BarbadosGrowth: Latin American Cases (New York: 1. Hiwhoa Moon, "Income Distribution in Bar-Praeger, 1972, Tables I.A.4 and l.A.5, p. 200. bados" (unpublished memorandum of the Eco-
4. Argentina, Presidencia de la Naci6n, Consejo Na- nomic and Social Data Division, the World Bankcional de Desarrollo, Encuesta Sobre Presupuestos May 15, 1974), p. 3.de Consumo de las Familias Urbanas, por Niveles deIngreso para 1963 (Buenos Aires, 1965); asquoted in Cline, Potential Effects, Table l.A.3, p. Table 6. Botswana199. 1. Based on an unpublished, draft report prepared by
5. Preliminary estimates, subject to change, based a mission sent to the Republic of Botswana by theon ECLA, Metodos analiticos para el estudio de la World Bank in May-June 1974.desigualdad en la distribucion del ingreso(ECLA/CPE/DRAFT, 86), March 1973, p. 34. Table 7. Brazil
Table 2. Australia I. United Nations Economic Commission for Latin1. N. Podder, "Distribution of Household Income in America (hereafter ECLA), Econornic Survey oj
Australia," Economic Record, vol. 48, no. 122 Latin America, 1969 (E/CN.12/851, Rev. 1, Pt.
(June 1972), pp. 187-88. 111), September 1970, pp. 388 and 404.2. William R. Cline, Potential Effects of Income
Table 3. Bahamas Redistribution on Economic Growth: Latin American
1. Computed from Bahamas, Department of Cases (New York: Praeger, 1972), Tables 11 andStatistics Cabinet Office (hereafter DSCO), Re- A.l, pp. 79 and 201.port of 1970, Population Census of December 1972 3. Albert Fishlow, "Brazilian Size Distribution of
(Nassau [?], n.d.), p. 9. Income," Papers and Proceedings of the Ameri-2. DSCO, Manipower and Income, Census can Economic Association, American Economic
Monograph no. I (Nassau, n.d.), Table D, p. xi. Review, vol. 62 (May 1972) pp. 391-402.
123

4. C. Langoni, Distribuicado da Renda' e Desenvolvi- Table 10. CanadamentoEcon6micodoBrasil(RiodeJaneiro: Editora 1. Computed from Canada, Dominion Bureau ofExpressao e Cultura, 1973), pp. 26, 64, 68, and Statistics, Consumer Finance Research Staff,70. "Historical Review on Non-Farm Income Dis-
5. Preliminary estimates, subject to change, are tribution," Canadian Statistical Review, vol. 44,based on Fundacao IBGE, Instituto Brasileiro de no. 8 (August 1969), p. ii.Estadistica, Encuesta de Hogares de PropositosMultiples, Pesquisa Nacional por Amostra de Table 11. ChadDomjicilios, Populacado Habitacdo, Mado de Obra, I. Christian Morrisson, La Repartition des RevenusSalario Instruico (published triannually lor eachregion beginning in May 1968); as quoted in dans les Pays du Tiers Monde (Paris: EditionsECLA, Metodos analiticos para el estudio de la Cujas, 1969), pp. 194-205.desigualdad en la distribucion de ingreso Table 12. Chile(ECLA/CPE/DRAFT, 86), March 1973, p. 34.
6. Computed from Companhia Central de Abasteci- 1. Preliminary estimates, subject to change, basedmento, "Primeiros resultados globais de pesquisa on Chile, Direcci6n General de Estadistica y Cen-sobre consumo alimentar e orcamento familiar de sos (hereafter DGEC), Encuesta Nacional sobreGrande Rio," Encuesta de Ingresos y Gastos (Rio Ingresos Familiares, Marzo-Junio 1968, Serie dede Janeiro: Guanabara, 1969). Investigaciones, B-5 (Santiago, 1969), pp. 16-17;
7. Brazil, Instituto Brasileiro de Geografia e as quoted in United Nations Economic Commis-Estadistica, Servicio Nacional de Recenseamento, sion for Latin America, Metodos analiticos para elVIII Recenseamento Geral 1 970: Censo Demo- estudio de la desigualdad en la distribuci6n del in-grafico (Rio de Janeiro, forthcoming), p. 225. greso (ECLA/CPE/DRAFT, 86), March 1973, p.
34.Table 8. Bulgaria 2. DGEC, Encuesta Nacional sobre Ingresos
Familiares; as quoted in William R. Cline, Poten-1. United Nations Economic Commission for ti.al Effects of Income Redistribution on Economic
Europe, Incomes in Postwar Europe, A Study of Growth: Latin American Cases (New York:Policies, Growth and Distribution: Economic Survey Praeger, 1972), Tables I.C.2 and I.C.3, p. 202.of Europe in 1965, Pt. 2 (E/ECE/613/ADD.1), 3. Computed from DGEC, Encuesta Nacional sobre1967, Ch. 8, p. 71. Ingresos Familiares.
Table 9. Burma
1. Burma, Central Statistical and Economics Depart- Table 13. Colombiament, Report on the 1958 Survey of Household Ex- 1. Milton C. Taylor et al., Fiscal Survey of Colombia,penditure in Rangoon (Rangoon, 1959), pp.18 and Joint Tax Program of the Organization of Ameri-30. can States and Inter-American Development
124
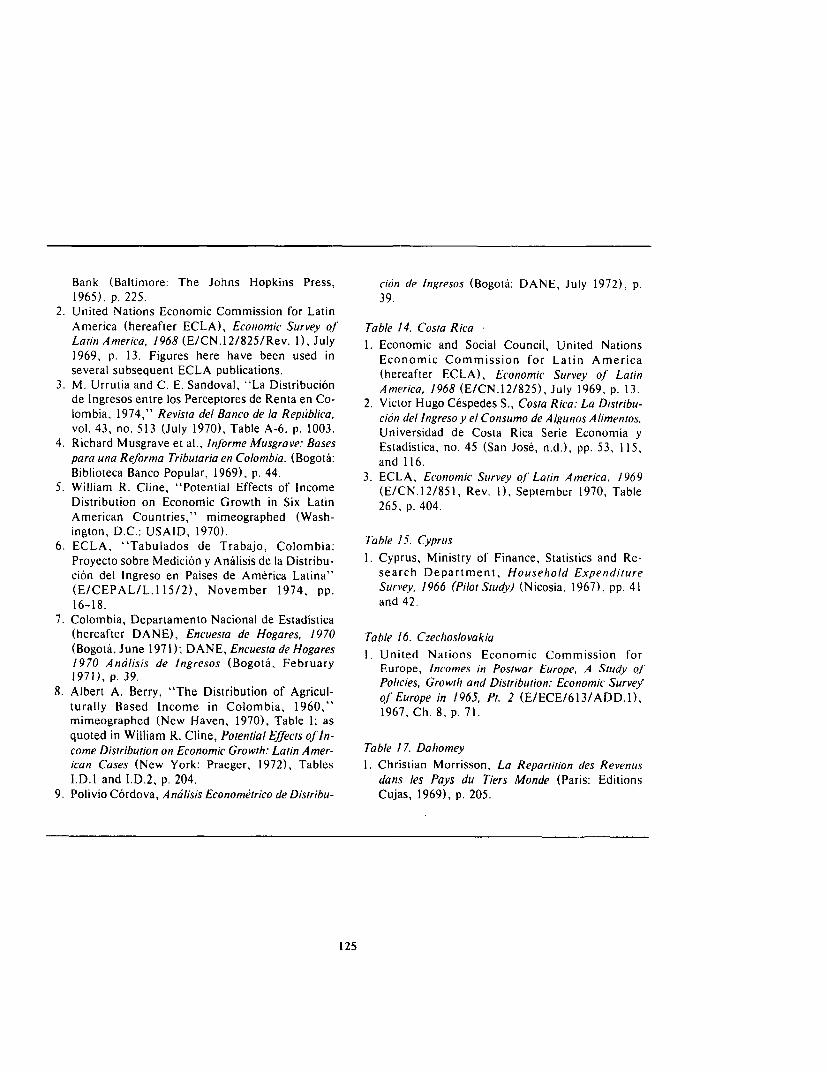
Bank (Baltimore: The Johns Hopkins Press, cion de Ingresos (Bogota: DANE, July 1972), p.1965), p. 225. 39.
2. United Nations Economic Commission for LatinAmerica (hereafter ECLA), Economic Survey of' Table 14. Costa RicaLatin America, 1968 (E/CN.12/825/Rev. 1), July 1. Economic and Social Council, United Nations
1969, p. 13. Figures here have been used in Economic Commission for Latin Americaseveral subsequent ECLA publications. (hereafter ECLA), Economic Survey of Latin
3. M. Urrutia and C. E. Sandoval, "La Distribucion America, 1968 (E/CN.12/825), July 1969, p. 13.de Ingresos entre los Perceptores de Renta en Co- 2. Victor Hugo Cespedes S., Costa Rica: La Distribu-lombia, 1974," Revista del Banco de la Republica, cion del Ingresoy el Consumo de Algunos Alimentos,vol. 43, no. 513 (July 1970), Table A-6, p. 1003. Universidad de Costa Rica Serie Economia y
4. Richard Musgrave et al., Informe Musgrave: Bases Estadistica, no. 45 (San Jose, n.d.), pp. 53, 115,para una Reforma Tributaria en Colombia. (Bogota: and 116.Biblioteca Banco Popular, 1969), p. 44. 3. ECLA, Economic Survey of Latin America, 1969
5. William R. Cline, "Potential Effects of Income (E/CN.12/851, Rev. 1), September 1970, TableDistribution on Economic Growth in Six Latin 265, p. 404.American Countries," mimeographed (Wash-ington, D.C.: USAID, 1970). Table 15. Cyprus
6. ECLA, "Tabulados de Trabajo, Colombia:Proyecto sobre Medici6n y Analisis de la Distribu- 1. Cyprus, Ministry of Finance, Statistics and Re-cion del Ingreso en Paises de America Latina" search Department, Household Expenditure(E/CEPAL/L.115/2), November 1974, pp. Survey, 1966 (Pilot Study) (Nicosia, 1967), pp. 4116-18. and 42.
7. Colombia, Departamento Nacional de Estadistica(hereafter DANE), Encuesta de Hogares, 1970 Table 16. Czechoslovakia(Bogota, June 1971); DANE, Encuesta de Hogares 1. United Nations Economic Commission for1970 Analisis de Ingresos (Bogota, February Europe, Incomes in Postwar Europe, A Study of1971), p. 39. Policies Growth and Distribution: Economic Survey
8. Albert A. Berry, "The Distribution of Agricul- olcEsrowth and Dtr E Surve.turally Based Income in Colombia, 1960," 1967, Ch. 8, p. 71.mimeographed (New Haven, 1970), Table l, asquoted in William R. Cline, Potential Effects of In-come Distribution on Economic Growth: Latin Amer- Table 17. Dahomeyican Cases (New York: Praeger, 1972), Tables 1. Christian Morrisson, La Repartition des RevenusI.D.1 and 1.D.2, p. 204. dans les Pays du Tiers Monde (Paris: Editions
9. PolivioC6rdova, AnalisisEconometricodeDistribu- Cujas, 1969), p. 205.
125
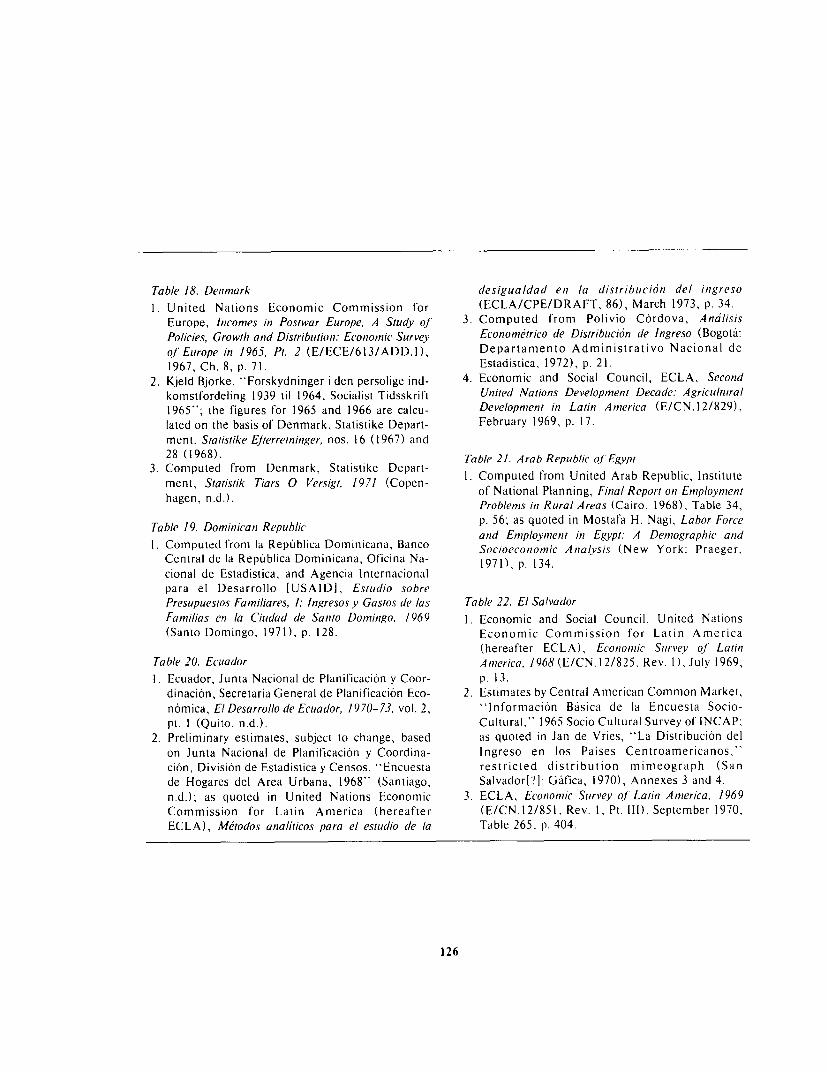
Table 18. Denmark desigualdad en la distribuci6n del ingreso1. United Nations Economic Commission for (ECLA/CPE/DRAFT, 86), March 1973, p. 34 .
Europe, Incomes in Postwar Europe, A Study of 3. Computed from Polivio C6rdova, AnalisisPolicies, Growth and Distribution: Economic Survey Econometrico de Distribuci6n de Ingreso (Bogota:of Europe in 1965, Pt. 2 (E/ECE/613/ADD.1), Departamento Administrativo Nacional de1967, Ch. 8, p. 71. Estadistica, 1972), p. 21.
2. Kjeld Bjorke, "Forskydninger i den persolige ind- 4. Economic and Social Council, ECLA, Secondkomstfordeling 1939 til 1964, Socialist Tidsskrift United Nations Development Decade: Agricultural1965"; the figures for 1965 and 1966 are calcu- Development in Latin America (E/CN.12/829),lated on the basis of Denmark, Statistike Depart- February 1969, p. 17.ment, Statistike EJierretninger, nos. 16 (1967) and28 (1968). Table 21. Arab Repuiblic of Egypt
3. Computed from Denmark, Statistike Depart- ment, Stptistik Tiars e Versigt, a97k (Copen- 1. Computed from United Arab Republic, Institutemgent, ntatdstik Tars 0 Versigt. 1971(Copen-of National Planning, Final Report on Employmenthagen, nd.). Problems in Rural Areas (Cairo, 1968), Table 34,
Table 19 . Do.iiiiicati Republic p. 56; as quoted in Mostafa H. Nagi, Labor Forceand Employnment in Egypt: A Demographic and
I. Computed from la Republica Dominicana, Banco Socioeconomic Analysis (New York: Praeger,Central de la Republica Dominicana, Oficina Na- 1971), p. 134.cional de Estadistica, and Agencia Internacionalpara el Desarrollo [USAID], Estudio sobrePresupuestos Familiares, 1: Ingresos y Gastos de las Table 22. El SalvadorFamilias en la Ciudad de Santo Domingo, 1969 1 Economic and Social Council, United Nations(Santo Domingo, 1971), p. 128. Economic Commission for Latin America
(hereafter ECLA), Economic Survey of LatinTable 20. Ecuador America, 1968 (E/CN.12/825, Rev. 1), July 1969,1. Ecuador, Junta Nacional de Planificaci6n y Coor- p. 13.
dinaci6n, Secretaria General de Planificaci6n Eco- 2. Estimates by Central American Common Market,n6mica, El Desarrollo de Ecuador, 1970-73, vol. 2, 'Informaci6n Basica de la Encuesta Socio-Pt. I (Quito, n.d.). Cultural," 1965 Socio Cultural Survey of INCAP;
2. Preliminary estimates, subject to change, based as quoted in Jan de Vries, "La Distribuci6n delon Junta Nacional de Planificaci6n y Coordina- Ingreso en los Paises Centroamericanos,"ci6n, Divisi6n de Estadistica y Censos, "Encuesta restricted distribution mimeograph (Sande Hogares del Area Urbana, 1968" (Santiago, Salvador['?]: Gafica, 1970), Annexes 3 and 4.n.d.); as quoted in United Nations Economic 3. ECLA, Econonmic Survey of Latin America, 1969Commission for Latin America (hereafter (E/CN.12/851, Rev. 1, Pt. 111), September 1970,ECLA), Metodos analiticos para el estudio de la Table 265, p. 404.
126
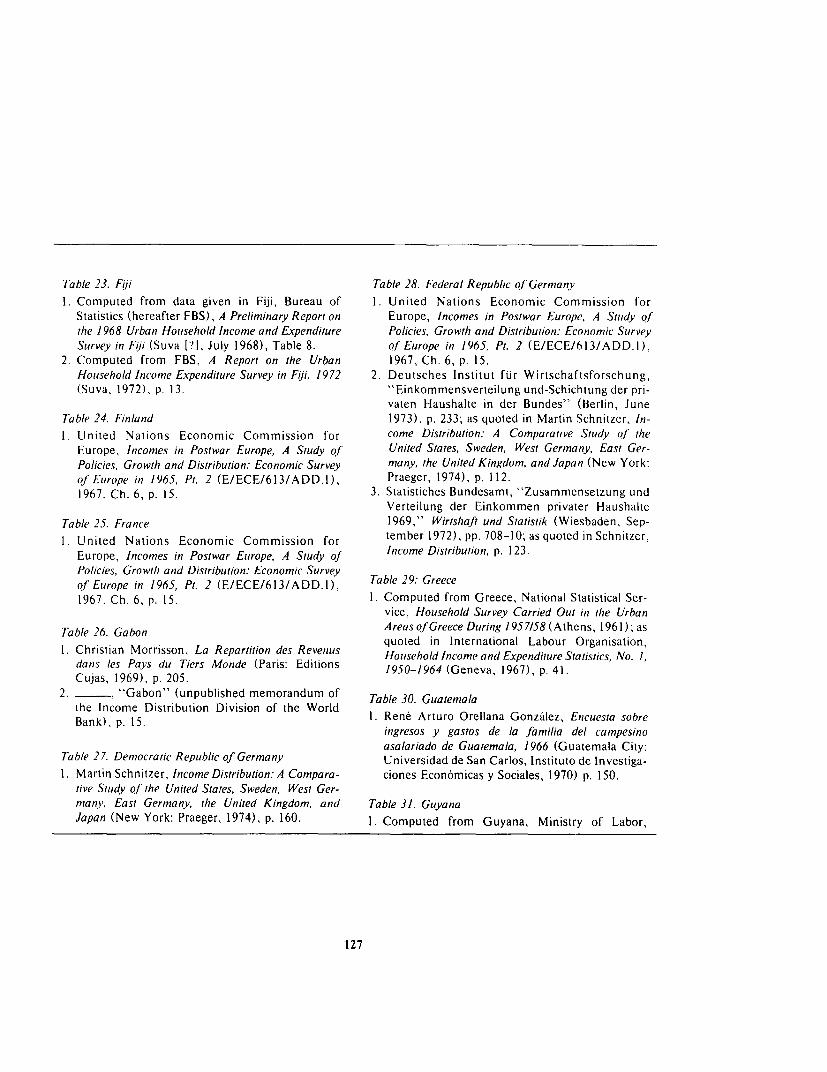
Table 23. Fiji Table 28. Federal Republic of'Germany
1. Computed from data given in Fiji, Bureau of 1. United Nations Economic Commission forStatistics (hereafter FBS), A Preliminary Report on Europe, Incomes in Postwar Europe, A Study of
the 1968 Urban Household Income and Expenditure Policies, Growth and Distribution: Economic SurveySurvey in Fiji (Suva [?], July 1968), Table 8. of'Europe in 1965, Pt. 2 (E/ECE/6l3/ADD.1),
2. Computed from FBS, A Report on the Urban 1967, Ch. 6, p. 15.Household Income Expenditure Survey in Fii, 1972 2. Deutsches Institut fur Wirtschaftsforschung,(Suva, 1972), p. 13. "Einkommensverteilung und-Schichtung der pri-
vaten Haushalte in der Bundes" (Berlin, JuneTable 24. Finland 1973), p. 233; as quoted in Martin Schnitzer, In-
1. United Nations Economic Commission for come Distribution: A Comparative Study of' theEurope, Incomes in Postwar Europe, A Study of United States, Sweden, West Germany, East Ger-Policies, Growth and Distribution: Economic Survey many, the United Kingdom, and Japan (New York:of'Europe in 1965, Pt. 2 (E/ECE/613/ADD.1), Praeger, 1974), p. 112.1967, Ch. 6, p. 15. 3. Statistiches Bundesamt, "Zusammensetzung und
Verteilung der Einkommen privater HaushalteTable 25. France 1969," WirtshaJt und Statistik (Wiesbaden, Sep-
1. United Nations Economic Commission for tember 1972), pp. 708-10; as quoted in Schnitzer,Europe, Incomes in Postwar Europe, A Study oJ' Income Distribution, p. 123.
Policies, Growth and Distribution: Economic Surveyof'Europe in 1965, Pt. 2 (E/ECE/613/ADD.1), Table29:Greece1967, Ch. 6, p. 15. 1. Computed from Greece, National Statistical Ser-
vice, Household Survey Carried Out in the Urban
Table 26. Gabon AreasoJ'GreeceDuring 1957/58(Athens, 1961); asquoted in International Labour Organisation,
1. Christian Morrisson, La Repartition des Revenus Household Income and Expenditure Statistics, No. 1,dans les Pays du Tiers Monde (Paris: Editions 1950-1964 (Geneva, 1967), p. 41.Cujas, 1969), p. 205.
2. _- "Gabon" (unpublished memorandum of Table 30. Guatemalathe Income Distribution Division of the World 1. Rene Arturo Orellana Gonzalez, Encuesta sobreBank), p. 15.1 eeAtr rlaaGnae,Ecet or
ingresos y gastos de la familia del campesinoasalariado de Guatemala, 1966 (Guatemala City:
Table 27. Democratic Republic of Germany Universidad de San Carlos, Instituto de Investiga-
1. Martin Schnitzer, Income Distribution: A Compara- ciones Economicas y Sociales, 1970) p. 150.tive Study oJ the United States, Sweden, West Ger-many, East Germany, the United Kingdom, and Table 31. GuyanaJapan (New York: Praeger, 1974), p. 160. 1. Computed from Guyana, Ministry of Labor,
127
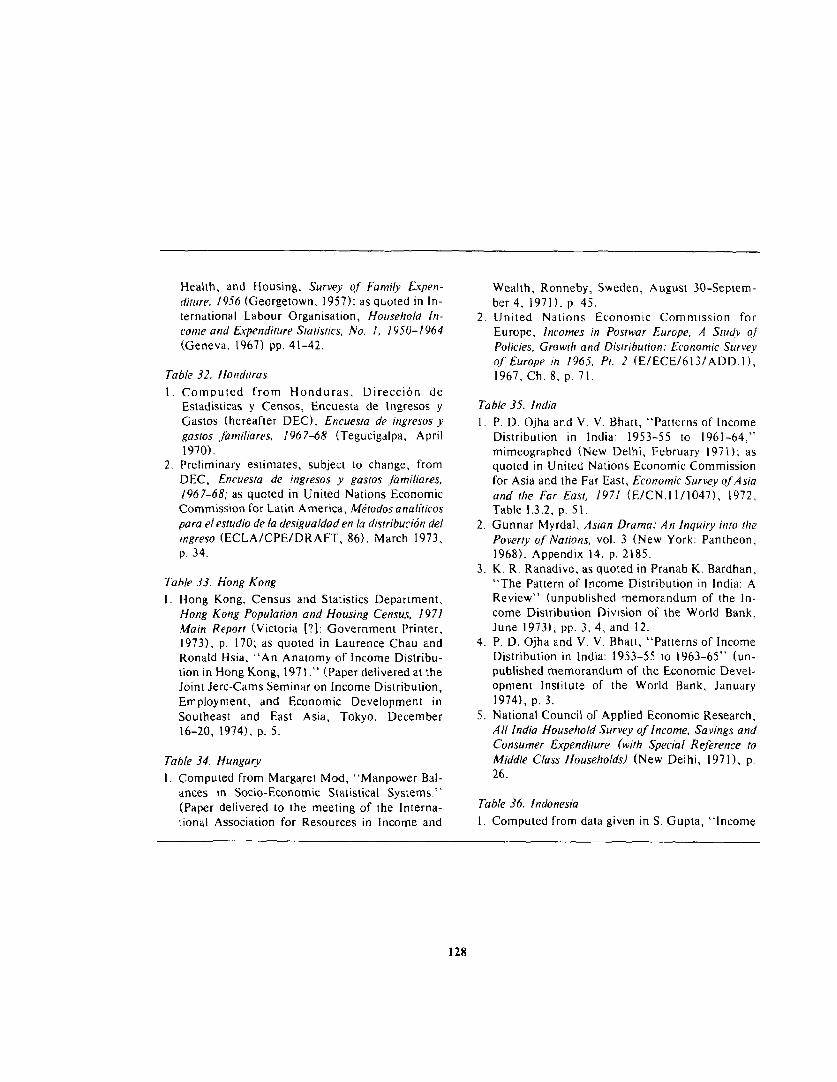
Health, and Housing, Survey of Family Expen- Wealth, Ronneby, Sweden, August 30-Septem-
diture, 1956 (Georgetown, 1957); as quoted in In- ber 4, 1971). p. 45.
ternational Labour Organisation, Househlold In- 2. United Nations Economic Commission for
come and Expenditure Statistics, No. 1, 1950-1964 Europe, Incomes in Postwar Europe, A Study qf
(Geneva, 1967) pp. 41-42. Policies, Growth and Distribution: Economic Survey
of Europe in 1965, Pt. 2 (E/ECE/613/ADD.1),
Table 32. Honduras 1967, Ch. 8, p. 71.
1 Computed from Honduras, Direccion deEstadisticas y Censos, Encuesta de lngresos y Table 35. India
Gastos (hereafter DEC), Encuesta de ingresos y 1. P. D. Ojha and V. V. Bhatt, "Patterns of Income
gastos familiares, 1967-68 (Tegucigalpa, April Distribution in India 1953-55 to 1961-64,"
1970). mimeographed (New Delhi, February 1971); as
2. Preliminary estimates, subject to change, from quoted in United Nations Economic Commission
DEC, Encuesta de ingresos y gastos Jamiliares, for Asia and the Far East, Economic Survey ofAsia
1967-68; as quoted in United Nations Economic and the Far East, 1971 (E/CN.11/1047), 1972,
Commission for Latin America, Metodosanaliticos Table 1.3.2, p. Sl.
paraelestudiode la desigualdaden la distribucion del 2. Gunnar Myrdal, Asian Drama: An Inquiry into the
ingreso (ECLA/CPE/DRAFT, 86), March 1973, Poverty o) Nations, vol. 3 (New York: Pantheon,
P. 34. 1968), Appendix 14, p. 2185.3. K. R. Ranadive, as quoted in Pranab K. Bardhan,
Table 33. Hong Kong "The Pattern of Income Distribution in India: A
I. Hong Kong, Census and Statistics Department, Review" (unpublished memorandum of the In-
Hong Kong Population and Housing Census, 1971 come Distribution Division of the World Bank,
Main Report (Victoria [?]: Government Printer, June 1973), pp. 3, 4, and 12.
1973), p. 170; as quoted in Laurence Chau and 4. P. D. Ojha and V. V. Bhatt, "Patterns of Income
Ronald Hsia, "An Anatomy of Income Distribu- Distribution in India: 1953-55 to 1963-65" (un-
tion in Hong Kong, 1971." (Paper delivered at the published memorandum of the Economic Devel-
Joint Jerc-Cams Seminar on Income Distribution, opment Institute of the World Bank, January
Employment, and Economic Development in 1974), p. 3.
Southeast and East Asia, Tokyo, December 5. National Council of Applied Economic Research,
16-20, 1974), P. 5. All India Household Survey of Income, Savings andConsumer Expenditure (with Special Reference to
Table 34. Hungary Middle Class Households) (New Delhi, 1971), p.
1. Computed from Margaret Mod, "Manpower Bal- 26.
ances in Socio-Economic Statistical Systems."(Paper delivered to the meeting of the Interna- Table 36. Indonesia
tional Association for Resources in Income and 1. Computed from data given in S. Gupta, "Income
128

Distribution, Employment, and Growth: A Case 6. HHL, Family Expenditure Survey, 1968169, specialStudy of Indonesia," World Bank Staff Working series no. 330 (Jerusalem, 1970), p xv.Paper no. 212 (Washington, D.C., August 1975),Appendix IV, Table 21, p. 19. Table 40. Ivory Coast
1. Christian Morrisson, La Repartition des RevenusTable 37. Iran dans les Pays dii Tiers Monde (Paris: Editions
1. Bank Markazi, Economic Statistics Department, Cujas, 1969), p. 206."Urban Household Budget Survey in Iran, 1346 2. , "Ivory Coast" (unpublished memoran-(March 21, 1967-March 20, 1968)," mimeograph dum of the Income Distribution Division of the(Tehran, n.d.); as quoted in A. J. Jaffe, "Notes of World Bank), pp. 17 and 18.Family Income Distribution in Developing Coun-tries in Relation to Population and Economic Table 41. JamaicaChanges, 1969," mimeograph (n.p., n.d.). 1. A. Ahiram, "Income Distribution in Jamaica,
1958," Social and Economic Studies lUniversity ofTable 38. Iraq the West Indies], vol. 13, no. 3 (September
1. Christian Morrisson, La Repartition des Revenus 1964), p. 337.dans les Pays dti Tiers Monde (Paris: EditionsCujas, 1969), p. 205 Table 42. Japan
1. Todao Ishizaki, "The Income Distribution inTable 39. Israel Japan," The Developing Economies, vol. 5, no. 2
1. Haim Ben Shahar and Moshe Sandberg, "Eco- (June 1967), p. 356.nomic and Institutional Effects on Income Dis- 2. R. 0. Wada, "Impact of Economic Growth on thetribution: The Case of Israel," Public Finance, vol. Size Distribution of Income: The Postwar Experi-22, no. 3 (1967), p. 244. ence of Japan." (Paper delivered to the Joint Jerc-
2. The Falk Project for Economic Research in Israel, Cams Seminar on Income Distribution, Employ-FiJih Report 1959 and 1960 (Jerusalem, August ment, and Economic Development in Southeast1967), p. 46. and East Asia, Tokyo, December 16-20, 1974), p.
3. Report of the Committee on Income Distribution and 24.Social Inequality (Tel Aviv, 1971), p. 48. 3. Harry T. Oshima, "Income Inequality and Eco-
4. Israel, Ha-Lishkah Hamerkazit Listatistikah nomic Growth: The Postwar Experiences of Asian(hereafter HHL), Family Expenditure Survey, Countries," Malayan Economic Review, vol. 15,
1963164, special series no. 200 (Jerusalem, 1966), no. 2 (October 1970), p. 13.p. 40. 4. Computed from data in Japan, Bureau of
5. Central Bureau of Statistics and Bank of Israel Re- Statistics, Annual Report on the Family Income and
search Department, SavingSurvey 1963164, special Expenditure Survey 1971 (Tokyo, n.d.), Table 17,
series no. 217 (Jerusalem, 1967), pp. xxv and pp. 434-35.xxxvi. 5. Unpublished data provided by Japan, Finance
129
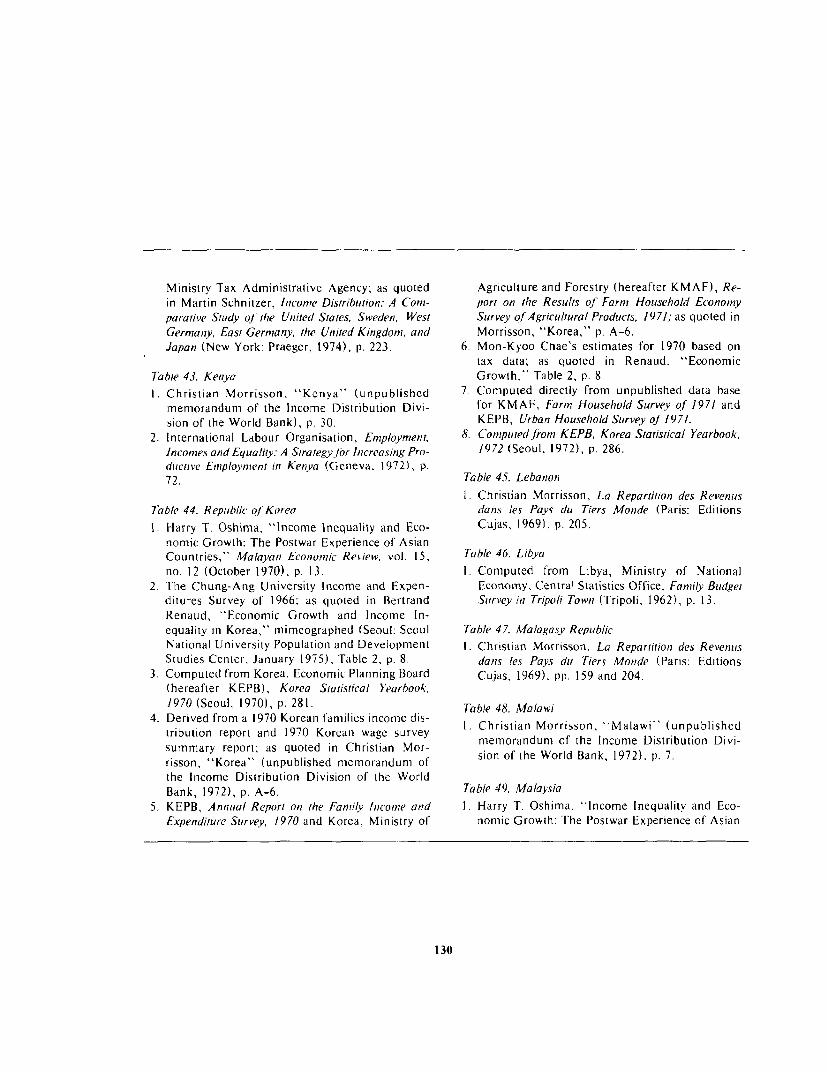
Ministry Tax Administrative Agency; as quoted Agriculture and Forestry (hereafter KMAF), Re-in Martin Schnitzer, Income Distribution: A Com- port on the Results oJ Farm Household Economyparative Study o' thie UInited States, Sweden, West Survey of'Agricultural Products, 1971; as quoted inGermaniy, East Germany, the United Kingdomt, and Morrisson, "Korea," p. A-6.Japan (New York: Praeger, 1974), p. 223. 6. Mon-Kyoo Chae's estimates for 1970 based on
tax data; as quoted in Renaud, "EconomicTab/e 43. Kenya Growth," Table 2, p. 8.I. Christian Morrisson, "Kenya" (unpublished 7. Computed directly from unpublished data base
memorandum of the Income Distribution Divi- for KMAF, Farm Household Survey of 1971 andsion of the World Bank), p. 30. KEPB, Urban Household Survey of 1971.
2. International Labour Organisation, Employment, 8. Computed.from KEPB, Korea Statistical Yearbook,Incomes and Equality: A Strategy/br Increasing Pro- /972 (Seoul. 1972), p. 286.ductive Employment in Kenya (Geneva. 1972), p.72. Table 45. Lebanon
1. Christian Morrisson, La Repartition des RevenusTable 44. Republic ol'Korea lans les Pays du Tiers Monde (Paris: Editions1. Harry T. Oshima, "Income Inequality and Eco- Cujas, 1969), p. 205.
nomic Growth: The Postwar Experience of AsianCountries," Malayan Economic Review, vol. 15, Table 46. Libyano. 12 (October 1970), p. 13. 1. Computed from Libya, Ministry of National
2. The Chung-Ang University Income and Expen- Economy. Central Statistics Office, Family Budgetditures Survey of 1966; as quoted in Bertrand Survey itt Tripoli Town (Tripoli, 1962), p. 13.Renaud, "Economic Growth and Income In-equality in Korea," mimeographed (Seoul: Seoul Table 47. Malagasy RepublicNational University Population and Development 1. Christian Morrisson, La Repartition des RevenusStudies Ccnter, January 1975), Table 2, p. 8. clans les Pays diu Tiers Monde (Paris: Editions
3. Computed from Korea, Economic Planning Board Cujas, 1969), pp. 159 and 204.(hereafter KEPB), Korea Statistical Yearbook,1970 (Seoul, 1970), p. 281. Table 48. Malawi
4. Derived from a 1970 Korean families income dis- I. Christian Morrisson, "Malawi" (unpublishedtribution report and 1970 Korean wage survey memorandum of the Income Distribution Divi-summary report; as quoted in Christian Mor- sion of the World Bank, 1972), p. 7.risson, "Korea" (unpublished memorandum ofthe Income Distribution Division of the WorldBank, 1972), p. A-6. Table 49. Malaysia
5. KEPB, Annual Report on the Family Incotmie and 1. Harry T. Oshima, "Income Inequality and Eco-Expenditure Survey, 1970 and Korea, Ministry of nomic Growth: The Postwar Experience of Asian
130

Countries," Malayan Economic Review, vol. 15, al., "The Economy of Mexico, A Basic Report,"no. 12 (October 1970), pp. 7-41. report no. 192-ME, vol. 11 (restrictedl circulation
2. Lim Lin Lean, "Income Distribution and document ol the Latin America andI CaribbeanEmployment Programme: The Pattern of Income Deparment ol the World Bank), June 1973, p. 91.Distribution in West Malaysia, 1957-70," World 5. Pfefferman et al., "The Economy of Mexico,"Employment Programme Research Working vol. II, P. 91.Paper (Geneva, International Labour Organisa- 6. ECLA, Economic Suirvey of Latin America, 1969tion, 1974), pp. 13-17. (E/CN.12/851, Rev. 1, Pt. 111), September 1970,
3. Computed directly from tape data base for Table 265, p. 404.Malaysia, Department of Statistics, "Post 7. Calculated irom Banco de Mexico, Olicina deEnumeration Survey of the 1970 Census," un- Estudios sobre Proyecciones Agricolas, Encuesta
published. sobre lngresos y Gastos Familiares en Mexico, 1963(Mexico, 1966), pp. 230 and 232; as quoted in
Table 50. Mexico W. R. Cline, Potenitial E//dcts of Income Redistribu-
1. United Nations Economic Commission for Latin tion on Economic Growth: Latin American CasesAmerica (hereafter ECLA), Economic Survey of (New York: Praeger, 1972), I.E.2 and I.E.3, p.Latini America, 1968 (E/CN.12/825), 1969, p. 13. 206.
2. lfigenia M. de Navarrete, "La Distribuci6n de In-greso en Mexico: Tendencias y Perspectivas." in Table 51. Tihe NetherlandsEl Perfil de Mxico, en 1980, vol. I (Mexico: Ins- 1. United Nations Economic Commission fortituto de Investigaciones Sociales de la Univer- Europe, Incomes in Postwar Europe, A Study ofsidad Nacional Autonoma de Mexico, 1970), pp. Policies, Growth, and Disiribution: Economic Survey15-72. ofQEurope in 1965, Pt. 2 (E/ECE/613/ADD.1),
3. Preliminary estimates, subject to change, based 1967, Ch. 6, p. 15.on Mexico, Secretaria de Industria y Comercio, 2. Computed from Netherlands, Central Bureau ofDireccion General de Muestreo, "Ingresos y Statistics, Statistical Yearbook of the Neth7erlands,Egresosde las Familias de la Republica Mexicana, 1971 (The Hague: Staatsuitgeverig, 1971), p. 2 85.1969-70" (Mexico, n.d.); as quoted in ECLA,Metodos analiticos para el estudio de la desigualdaden la distribucion del ingreso (ECLA/CPE/ Table 52. ,Vew ZealantdDRAFT, 86), March 1973, p. 34. 1. Computed f'rom New Zealand, Department of
4. Estimates make the same adjustments used by Statistics (hereafter NZDS), New Zealand CensusNavarrete, "La Distribucion del Ingreso en Mexi- of Population and Dwellings, 1966, vol. 5, "In-co." Data from Banco de Mexico, Encuesta sobre comes"; and NZDS, New ZealandCetsus ofJPopu-IngresosyGastos Familiares, 1968 (Mexico, 1972), lation and Dwellings, 1966 Household Supplement;unnumbered table "Resumen y Caracteristicas de both as quoted in W. Rosenberg, "A Note on thelas Familias"; interpreted in Guy Pfefferman et Relationship of Family Size and Income in New
131
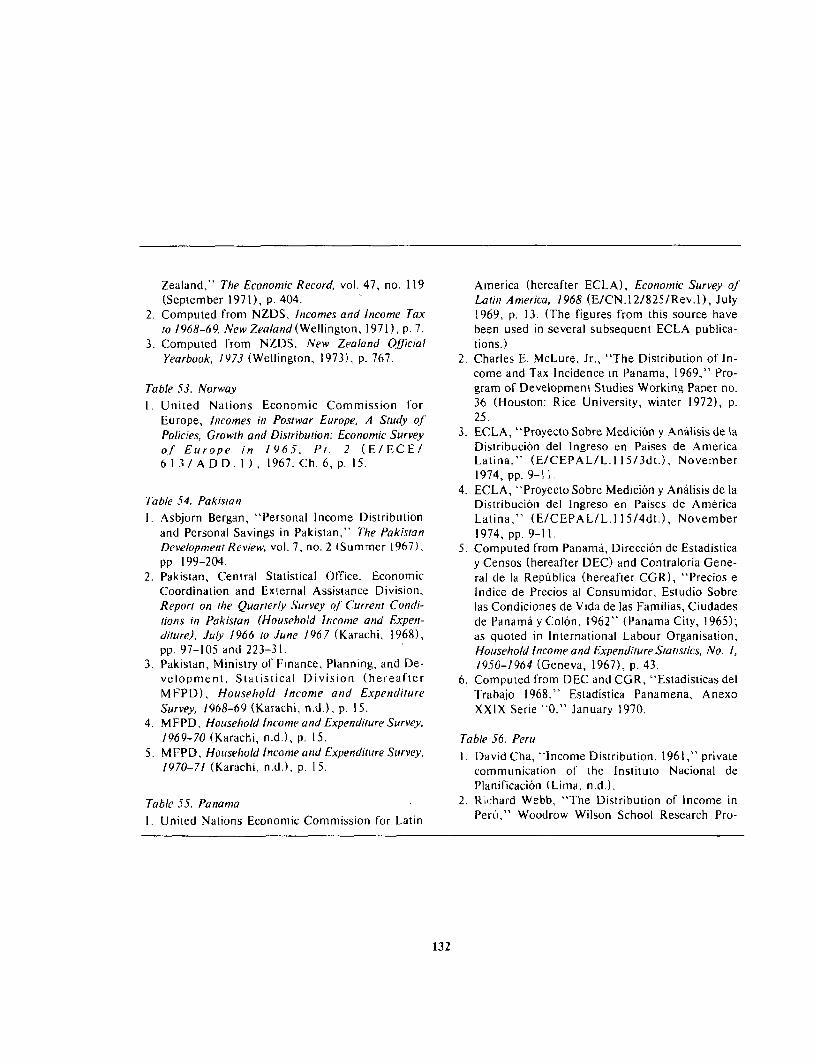
Zealand," The Economic Record, vol. 47, no. 119 America (hereafter ECLA). Economic Survey oj(September 1971), p. 404. Latin America, 1968 (E/CN.12/825/Rev.1), July
2. Computed from NZDS, Incomes and Income Tax 1969, p. 13. (The figures from this source havefo 1968-69, NewZealand(Wellington, 1971), p.7 . been used in several subsequent ECLA publica-
3. Computed from NZDS, New Zealand Ofticial tions.)Yearbook, 1973 (Wellington, 1973), p. 767. 2. Charles E. McLure, Jr., "The Distribution of In-
come and Tax Incidence in Panama, 1969," Pro-Table 53. Norway gram of Development Studies Working Paper no.
1. United Nations Economic Commission for 36 (Houston: Rice University, winter 1972), p.Europe, Incomes in Postwar Europe, A Study of 25.Policies, Growth and Distribution: Economic Survey 3. ECLA, "Proyecto Sobre Medicion y Analisis de laof Europe in 1965, P. 2 (E/ECE/ Distribuci6n del Ingreso en Paises de America6 1 3 / A D D. I ), 1967, Ch. 6, p. 15. Latina," (E/CEPAL/L.1 15/3dt.), November
1974, pp. 9-11.4. ECLA, "Proyecto Sobre Medici6n y Analisis de la
Table 54. Pakistan Distribucion del Ingreso en Paises de Am&rica
1. Asbjorn Bergan, "Personal Income Distribution Latina," (E/CEPAL/L.115/4dt.), Novemberand Personal Savings in Pakistan," The Pakistan 1974, pp. 9-11.Development Review, vol. 7, no. 2 (Summner 1967), 5. Computed from Panama, Direccion de Estadisticapp. 199-204. y Censos (hereafter DEC) and Contraloria Gene-
2. Pakistan, Central Statistical Office, Economic ral de la Repiublica (hereafter CGR), "Precios eCoordination and External Assistance Division, Indice de Precios al Consumidor, Estudio SobreReport on the Quarierly Survey o/ Cuirrent Condi- las Condiciones de Vida de las Familias, Ciudadestions in Pakistan (Household Income and Expen?- de Panama y Colon, 1962" (Panama City, 1965);diture), July 1966 to June 1967 (Karachi, 1968), as quoted in International Labour Organisation,pp. 97-105 and 223-31. Household Income and Expenditure Statistics, NVo. 1,
3. Pakistan, Ministry of Finance, Planning, and De- 1950--1964 (Geneva, 1967), p. 43.velopment, Statistical Division (hereafter 6. Computed from DEC and CGR, "Estadisticas delMFPD), Household Income and Expenditure Trabajo 1968," Estadistica Panamena, AnexoSurvey, 1968-69 (Karachi, n.d.), p. 15. XXIX Serie -0," January 1970.
4. MFPD, Household Income and Expenditure Survey,1969-70 (Karachi, n.d.), p. 15. Table 56. Peru
5. MFPD, Household Inconme and Expenditure Survey, I. David Cha, "Income Distribution, 1961," private1970-71 (Karachi, n.d.), p. 15. communication of the Instituto Nacional de
Planificaci6n (Lima, n.d.).
Table 55. Pananma 2. Richard Webb, "The Distribution of Income in
1. United Nations Economic Commission for Latin Per6i,- Woodrow Wilson School Research Pro-
132
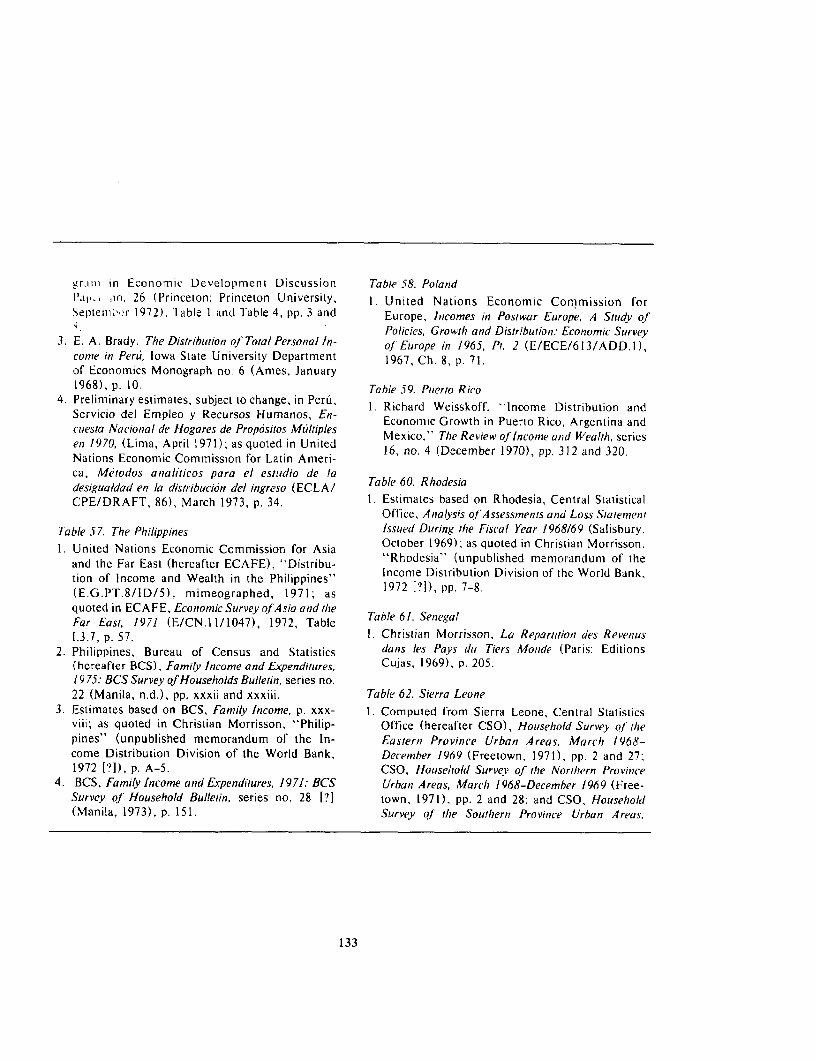
gr.iini in Economic Development Discussion Table 58. PolandPai 1~ 1o. 26 (Princeton: Princeton University, 1. United Nations Economic Commnission forSepteni;cr 1972). Table I and Table 4, pp. 3 and Europe, Incomes in Postwar Europe, A Study ojK Policies, Growth and Distribution: Economic Survey
3. E. A. Brady, The Distribution of Total Personal In- of Europe in 1965, Pt. 2 (E/ECE/613/ADD.1),come in Peru, Iowa State University Department 1967, Ch. 8, p. 71.of Economics Monograph no. 6 (Ames, January1968), p. 10. Table 59. Puerto Rico
4. Preliminary estimates, subject to change, in Peru, I. Richard Weisskoff, "Income Distribution andServicio del Empleo y Recursos Humanos, En- Economic Growth in Puerto Rico, Argentina andcuesta Nacional de Hogares de Propositos Multiples Mexico," The Review of Income and Wealth, seriesen 1970, (Lima, April 1971); as quoted in United 16, no. 4 (December 1970), pp. 312 and 320.Nations Economic Commission for Latin Ameri-ca, Metodos analiticos para el estudio de ladesigualdad en la distribuct6n del ingreso (ECLA/ Table 60. RhodesiaCPE/DRAFT, 86), March 1973, p. 34. 1. Estimates based on Rhodesia, Central Statistical
Office, Analysis qJ Assessments and Loss StatementTable 57. The Philippines Issued During the Fiscal Year 1968/69 (Salisbury,
October 1969); as quoted in Christian Morrisson,1. United Nations Economic Commission for Asia Roei"(nulsdmmraum fthand the Far East (hereafter ECAFE), "Distribu- "Rhodesia" (unpublished memorandum of thetion of Income and Wealth in the Philippines" Income Distribution Division of the World Bank,(E.G.PT.8/ID/5), mimeographed, 1971; as 1972 [1), pp. 7-8.quoted in ECAFE, Economic Survey of Asia and theFar East, 1971 (E/CN.11/1047), 1972, Table Table 6!. Senegal13.7, p. 57 1. Christian Morrisson, La Repartitioti des Revenus
2. Philippines, Bureau of Census and Statistics dans les Pays du Tiers Motide (Paris: Editions(hereafter BCS), Family Income and Expenditures, Cujas, 1969), p. 205.19 75: BCS Survey of Households Bulletin, series no.22 (Manila, n.d.), pp. xxxii and xxxiii. Table 62. Sierra Leone
3. Estimates based on BCS, Family Income, p. xxx- 1. Computed from Sierra Leone, Central Statisticsviii; as quoted in Christian Morrisson, "Philip- Olfice (hereafter CSO), Household Survey qf rtiepines" (unpublished memorandum of the In- Eastern Province Urban Areas, March 1968-come Distribution Division of the World Bank, December 1969 (Freetown, 1971), pp. 2 and 27;1972 [?]), p. A-5. CSO, House/told Survey of the Northern Province
4. BCS, Family Income and Expenditures, 1971: BCS Urban Areas, March 1968-December 1969 (Free-Survey of Household Bulletin, series no. 28 [?] town, 1971), pp. 2 and 28; and CSO, Household(Manila, 1973), p. 151. Survey qf the Southern Province Urtban Areas.
133
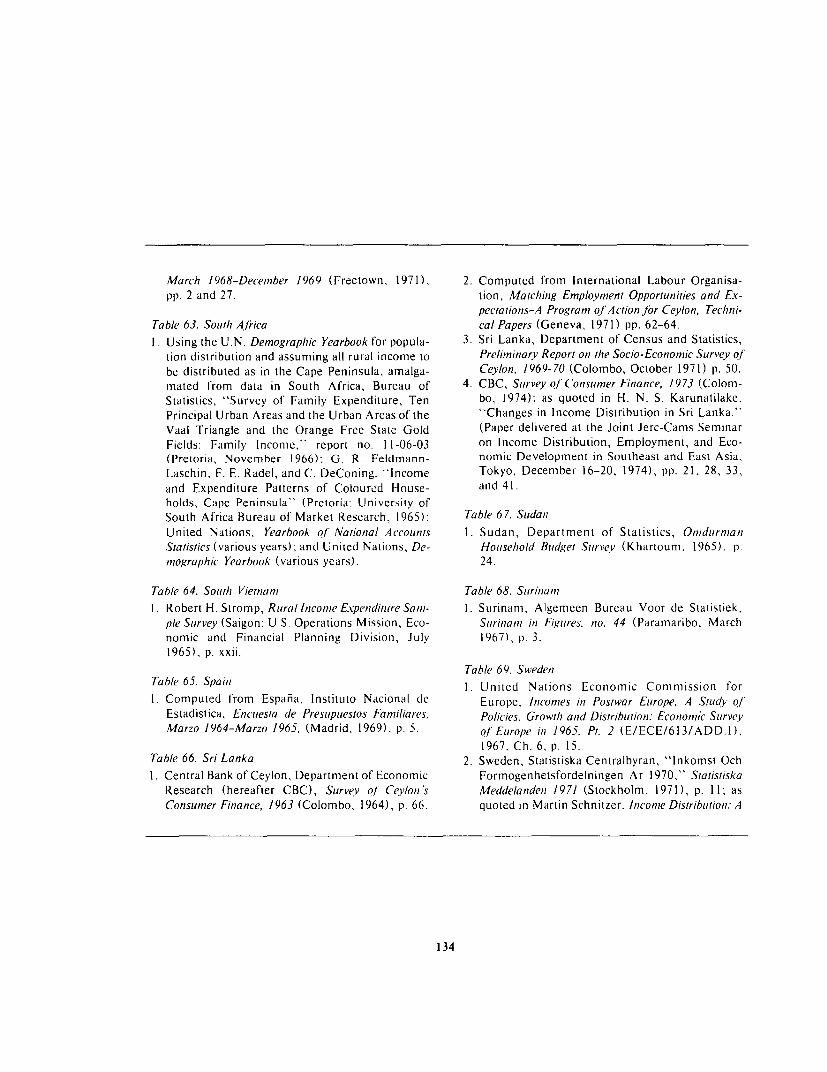
March 1968-December 1969 (Freetown, 1971), 2. Computed from International Labour Organisa-pp. 2 and 27. tion, Matching Employment Opportunities and Ex-
pectations-A Program oJ Actionjbr Ceylon, Techni-Table 63. South Africa cal Papers (Geneva, 1971) pp. 62-64.1.Using the U.N. Demographic Yearbook for popula- 3. Sri Lanka, Department of Census and Statistics,
tion distribution and assuming all rural income to Preliminary Report on the Socio-Economic Survey qfbe distributed as in the Cape Peninsula, amalga- Ceylon, 1969-70 (Colombo, October 1971) p. 50.mated f'rom data in South Africa, Bureau of 4. CBC, Survey of Consumer Finance, 1973 (Colom-Statistics, "Survey of' Family Expenditure, Ten bo, 1974); as quoted in H. N. S. Karunatilake,Principal Urban Areas and the Urban Areas of'the "Changes in Income Distribution in Sri Lanka."Vaal Triangle and the Orange Free State Gold (Paper delivered at the Joint Jerc-Cams SeminarFields: Family Income," report no. 11-06-03 on Income Distribution, Employment, and Eco-(Pretoria, November 1966). G. R. Feldmann- nomic Development in Southeast and East Asia.Laschin, F. E. Radel, and C. DeConing, "Income Tokyo, December 16-20, 1974), pp. 21, 28, 33,and Expenditure Patterns of' Coloured House- and 41.holds, Cape Peninsula" (Pretoria: University of'South Af'rica Bureau of' Market Research, 1965); Table 67. SudanUnited Nations, Yearbook of National Accounts 1. Sudan, Department of Statistics, OmdurnmanStatistics (various years); and United Nations, De- Houselhold Budget Survey (Khartoum, 1965), p.mographic Yearbook (various years). 24.
Table 64. South Vietnam Table 68. Surinanm1. Robert H. Stromp, Rural Income Erpenditure Sam- 1. Surinam, Algemeen Bureau Voor de Statistiek,
ple Survey (Saigon: U.S. Operations Mission, Eco- Surinam in Figures. no. 44 (Paramaribo, Marchnomic and Financial Planning Division, July 1967), p. 3.1965), p. xxii.
Table 69. SwedenTable 65. Spain I. United Nations Economic Commission for1. Computed from Espaia, Instituto Nacional de Europe, Incomes in Postwar Europe, A Study of
Estadistica, Encuesta de Presupuestos Familiares, Policies, Growthl and Distribution: Economic SurveyMarzo 1964-Marzo 1965, (Madrid, 1969), p. 5. of Europe in 1965, Pt. 2 (E/ECE/613/ADD.1),
1967, Ch. 6, p. 15.Table 66. Sri Lanka 2. Sweden, Statistiska Centralbyran, "Inkomst Och1. Central Bank of Ceylon, Department of Economic Formogenhetsfordelningen Ar 1970," Statistiska
Research (hereafter CBC), Survey of Ceylon's Meddelanden 1971 (Stockholm, 1971), p. 11; asConsumer Finance, 1963 (Colombo, 1964), p. 66. quoted in Martin Schnitzer, Inconme Distribution: A
134
Compararive Study of the United States, Sweden, nomic Growth," The Malayan Economic Review,West Germany, East Germany, the United Kingdom, vol. 15, no. 2 (October 1970), p. 13.andJapan (New York: Praeger, 1974), p. 82. 2. United Nations Economic Commission for Asia
and the Far East (hereafter ECAFE), "Distribu-Table 70. Taiwan tion of Income and Wealth in Thailand"1. Kowie Chang, ed,, Economic Development in (E.G.PT.8/ID/6), mimeographed, 1971; as
Taiwan (Taipei: Cheng Chung, 1968), p. 135. quoted in ECAFE, Economic Survey ofJAsia and the2. Taiwan, National Income Statistics Directorate- Far East, 1971 (E/CN.11/1047), 1972, Table
general of Budget, Account, and Statistics, and 1-3-8, p. 59.the Executive Yuan, Report on Pilot Study of Per-sonal Income and Consumption in Taiwan, (Taipei, Table 73. Tunisia1963[?]), pp. 12-13. 1. Computed from Ghazi Duwayi, Economic Devel-
3. Harry T. Oshima, "Income Inequality and Eco- opment in Tunisia. The inmpact and Conrse of Gov-nomic Growth: The Postwar Experience of Asian ernment Planning (New York: Praeger, 1967), p.Countries," Malayan Economic Review. vol. 15, 22,no. 2 (October 1970), p. 13. 2. Christian Morrisson, "Tunisia" (unpublished
4. Simon Kuznets, "Demographic (and other) memorandum of the Income Distribution Divi-Components in Size Distribution of Income." sion of the World Bank, 1972 P?]), p. 25.(Paper delivered to the Joint Jerc-Cams Seminaron Income Distribution, Employment, and Eco- Table 74. Turkeynomic Development in Southeast and East Asia 1. Tuncer Bulutay, Timur Serim, and Ersel Hasan,Tokyo, December 16-20, 1974), p. 28. Turkiye'de Gelir Dagi/imi, 1968, Ankara Univer-
sity Political Science Faculty publication no. 325Table 71. Tanzania (Ankara: Sevinc Press, 1971), Table LIA, p. 23.1. Estimates based on 1968-69 Tanzanian annual
economic survey; quoted in Christian Morrisson, Table 75. Uganda"Tanzania" (unpublished memorandum of the 1. Computed from Uganda, Ministry of PlanningIncome Distribution Division of the World Bank, and Economic Development, Statistics Division,1972), p. A-7. Enumeration oj Employees, 1961 through 1970,
2. Household budget survey of 1969; as quoted in published annually (Entebbe, 1961-70); asTanzania, Ministry of Economic Affairs and De- quoted in "Employment and Income Distributionvelopment Planning, National Accounts of Tanza- in Uganda," University of East Anglia Develop-mia, 1964-72 (Dares Salaam, February 1974), Ta- ment Studies Discussion Paper, Table d and Tableble 28, p. 37. t (iii), pp. 6 and 53.
Table 72. Thlailand Table 76. United Kingdom1. Harry T. Oshima. "Income Inequality and Eco- 1. United Nations Economic Commission for
135
Europe, Incomes in Postwar Europe, A Stu(dy of (Paper delivered at the Joint Jerc-Camns SeminarPolicies. Growtlh and Distribution: Econonmic Survey on Income Distribution, Employment, and Eco-of Europe in 1965, Pt. 2 (E/ECE/613/ADD.1), nomic Development in Southeast and East Asia,1967, Ch. 6, p. 15. Tokyo, December 10-16, 1974), p. 28.
2. Computed f1rom United Kingdom, CentralStatistical Office ['?I (hereafter CSO), Family Ex-penditures Survey, I 960 and 1968: United Kingdom Table 78. UruguayDistribution of Households by Household Income 1. Instituto de Economia, Universidad de la Repu-(London: Her Majesty's Stationery OTfice, 1969). blica de Chile, "La Distribucion del Ingreso en
3. CSO, National Inconme and Expenditures, 1966 Uruguay" (Santiago [Chile]: Grupo de Trabajo(London: Her Majesty's Stationery Office, 1966), Sobre Estadisticas de la Distribucion del Ingreso,p. 32, and National Inconme and Expenditures, 1968 el Consumo. y la Riqueza, November 1971), pp.(HMSO, 1968), p. 28; both as quoted in Martin 99 and 155.Schnitzer, Income Distribution: A ComparativeStudy of the United States, Sweden, West Germany,East Germany, the United Kingdom, and Japan Table 79. Venezuela(New York: Praeger, 1974), p. 184. 1. United Nations Economic Commission for Latin
America (herealter ECLA), Economic Survey qfTable 77. United States Latin America, 1968 (E/CN.12/825, Rev. 1), July1. United States, Department of Commerce, Bureau 1969, p. 13.
of the Census (hereafter USDC), Statistical 2. Venezuela, Ministerio de Fomento, DireccionAbstract of the United States, 1969, 89th ed. General de Estadistica y Censos Nacionales, "X(Washington, D.C.: U.S. Government Printing Censo General de Poblaci6n" (unpublished com-Office, 1968), pp. 322-24. puter printouts).
2. USDC, Current Population Reports, Consumer In- 3. ECLA, Economic Survey of Latin America, 1969come: Income in 1970 of Families andPersons in the (E/CN.12/851/Rev. 1), 1970, Table 265, p. 4 04 .United States, Commerce series P60, no. 80 4. Calculated from Venezuela, Oficina de Coordina-(Washington, D.C.: U.S. Government Printing cion y Planificacion de la Presidencia de la Repu-Office, 1971), Table A and Table 1, pp. I and 17. blica, Primera Encuesta Nacional de Ingresos y(Data obtained by computing per capita income in Gastos Familiares en Venezuela, Segundo Semestref:amilies and merging the resulting distribution de 1962, Doc. 5 (Caracas, 1964); as quoted inwith that for unrelated individuals.) William R. Cline, Potential EJfects of Income
3. Daniel B. Radner and John C. Hinrichs, "Size Redistribution on Economic Growth: Latin AmericanDistribution of Income in 1964, 1970, and 1971," Cases (New York: Praeger, 1972), Tables l.F.2Survey of Current Business (October 1974), p. 23. and l.F.3, p. 208.
4. Simon Kuznets, "Demographic (and other) 5. ECLA, "Tabulados de Trabajo, Venezuela:Components in Size Distribution of Income." Proyecto sobre Medici6n y Analisis de la Distribu-
136
ci6n del Ingreso en Paises de America Latina" Statistics, Houselhold Budget Survey of 1968(E/CEPAL/L.1 15/7), November 1974, p. 7. (Belgrade 1l'], 1969).
Table 80. Yugoslavia Table 81. Zambia
1. Computed roam International Labour Organisa- 1. R. E. Baldwin, Econonmic Development and Exporttion, Houselhold Incom1e and Expenditure Statistics, Growtlh: A Study of Nortlhern Rliodesia, 1920-60,No. 1, 1950-64, (Geneva, 1967), p. 76. (Berkeley: University of California Press, 1966),
2. Computed from Yugoslavia, Federal Institute of p. 46.
137


I


The World Banklfeadquarters1818 iI Streci. N W. UWashingtotn. ).C. 20433. U.S A.
Telephone. (202) 393-6360Cable Address INTBAFRAI)
WASIIINi'TONDC
European Office: The majority of income distribution surveys66. avenue d'lna are scattered throughout a variety of sources75116 Paris, France and rarely present their data in a comparable
manner. Size Distribution of Income represents aTokyo Office: combing of this literature and a setting of theKokusai Building, data on 81 countries into a format that allows1-1 Marunouchi 3-chomeChiyodai-ku, Tokyo 100, Japan direct comparisons among the results of all sur-
veys. A uniform group of inequality indexes ac-companies each data set; an introductory essaydiscusses measurement concepts andguidelines; an index of coverage permits easycomparison of the type and date of each surveyfor a given country; and a comprehensivebibliography cites all of the data sources. .
This unique compilation is part of an ongoingeffort by the Development Research Center ofthe World Bank to provide a factual and analyti-cal research base in the important areas ofpoverty and income distribution.
The compiler, Shail Jain, is a statistical re-searcher on the staff of' the Developnient Re-search Center.
ISBN 0-916058-07-7 $5.75