Embed Size (px)
Citation preview

National Center for Research on Evaluation, Standards, & Student Testing
UCL A | Graduate School of Education & Information Studies
RESOURCE PAPER No. 13
ONTOLOGY-BASED EDUCATIONAL DESIGN: SEEING IS BELIEVING
Eva L. BakerNational Center for Research on Evaluation Standards and Student Testing (CRESST) University of California, Los Angeles

Copyright © 2012 The Regents of the University of California. The work reported herein was supported by grant number 52306 from the Bill and Melinda Gates Foundation with funding to the National Center for Research on Evaluation, Standards, and Student Testing (CRESST). The findings and opinions expressed here are those of the authors and do not necessarily reflect the positions or policies of the National Center for Research on Evaluation, Standards, and Student Testing (CRESST) or of the Bill and Melinda Gates Foundation.

iii
TABLE OF CONTENTS Introduction ........................................................................................................................... 1
Rationale ........................................................................................................................... 1 Ontology-based Design ......................................................................................................... 2 Appendix: Frequently Asked Questions About Ontologies .................................................. 5
1
Ontology-Based Educational Design: Seeing is Believing
Eva L. Baker CRESST/University of California, Los Angeles
Introduction
Rationale
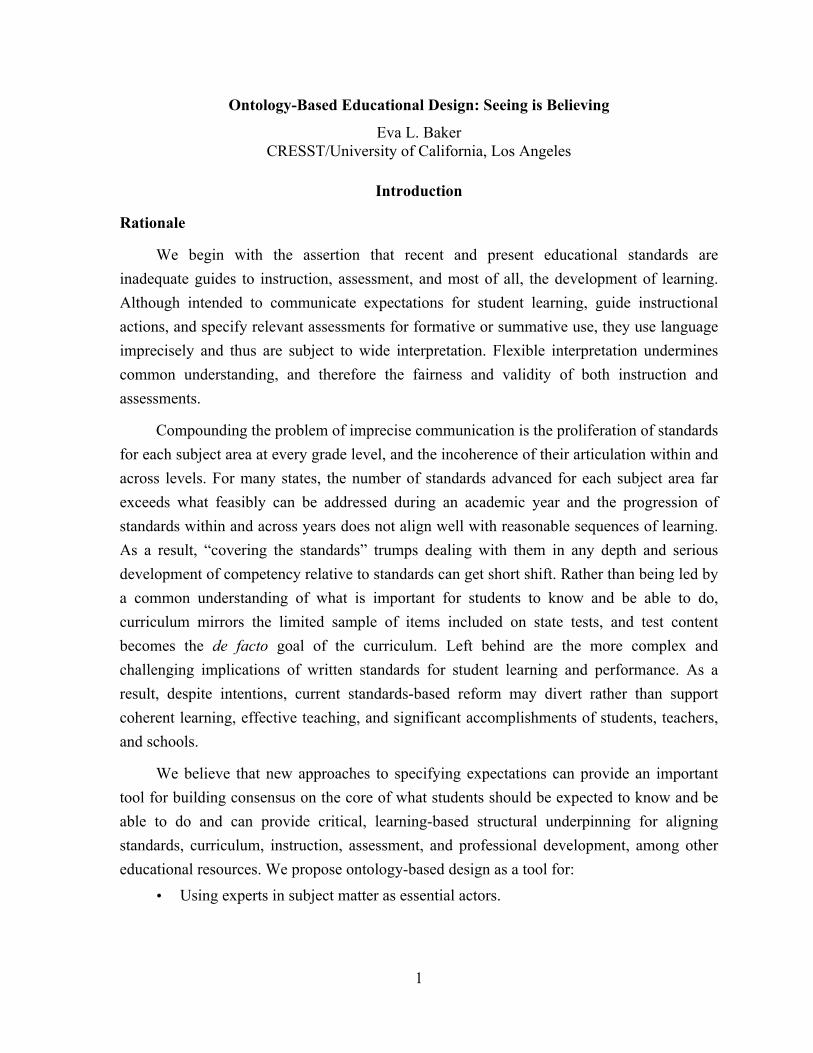
We begin with the assertion that recent and present educational standards are inadequate guides to instruction, assessment, and most of all, the development of learning. Although intended to communicate expectations for student learning, guide instructional actions, and specify relevant assessments for formative or summative use, they use language imprecisely and thus are subject to wide interpretation. Flexible interpretation undermines common understanding, and therefore the fairness and validity of both instruction and assessments.
Compounding the problem of imprecise communication is the proliferation of standards for each subject area at every grade level, and the incoherence of their articulation within and across levels. For many states, the number of standards advanced for each subject area far exceeds what feasibly can be addressed during an academic year and the progression of standards within and across years does not align well with reasonable sequences of learning. As a result, “covering the standards” trumps dealing with them in any depth and serious development of competency relative to standards can get short shift. Rather than being led by a common understanding of what is important for students to know and be able to do, curriculum mirrors the limited sample of items included on state tests, and test content becomes the de facto goal of the curriculum. Left behind are the more complex and challenging implications of written standards for student learning and performance. As a result, despite intentions, current standards-based reform may divert rather than support coherent learning, effective teaching, and significant accomplishments of students, teachers, and schools.
We believe that new approaches to specifying expectations can provide an important tool for building consensus on the core of what students should be expected to know and be able to do and can provide critical, learning-based structural underpinning for aligning standards, curriculum, instruction, assessment, and professional development, among other educational resources. We propose ontology-based design as a tool for:
• Using experts in subject matter as essential actors.
2
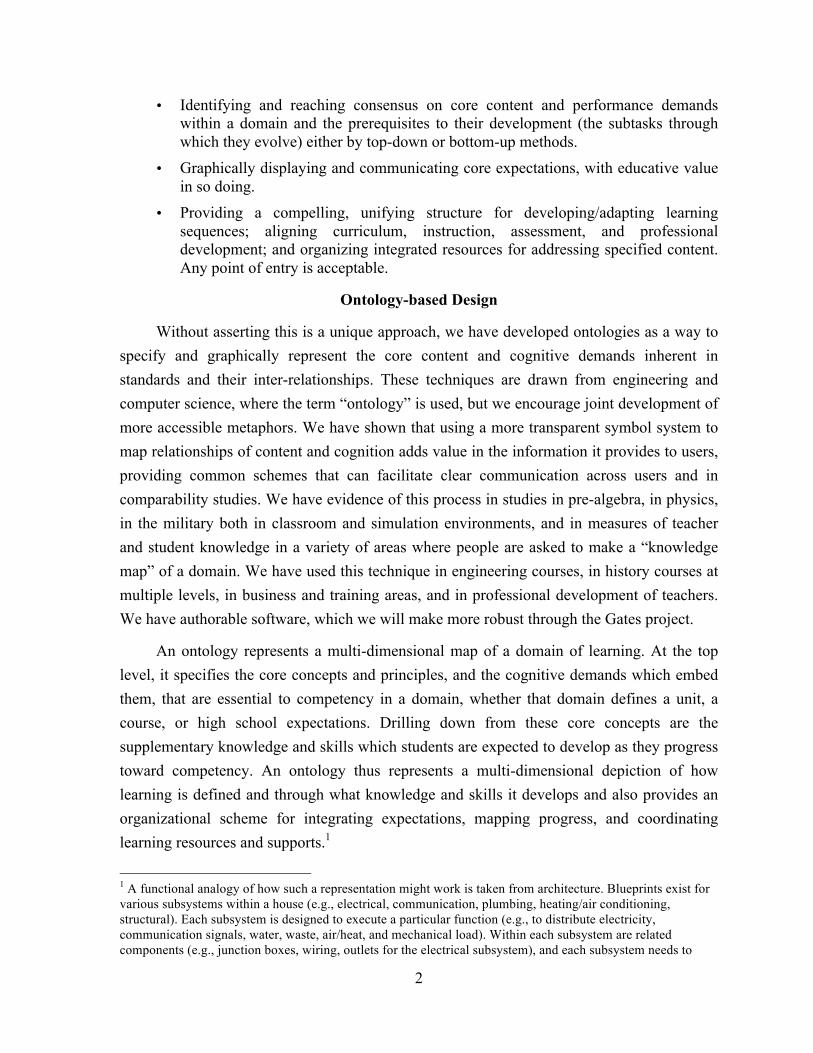
• Identifying and reaching consensus on core content and performance demands within a domain and the prerequisites to their development (the subtasks through which they evolve) either by top-down or bottom-up methods.
• Graphically displaying and communicating core expectations, with educative value in so doing.
• Providing a compelling, unifying structure for developing/adapting learning sequences; aligning curriculum, instruction, assessment, and professional development; and organizing integrated resources for addressing specified content. Any point of entry is acceptable.
Ontology-based Design
Without asserting this is a unique approach, we have developed ontologies as a way to specify and graphically represent the core content and cognitive demands inherent in standards and their inter-relationships. These techniques are drawn from engineering and computer science, where the term “ontology” is used, but we encourage joint development of more accessible metaphors. We have shown that using a more transparent symbol system to map relationships of content and cognition adds value in the information it provides to users, providing common schemes that can facilitate clear communication across users and in comparability studies. We have evidence of this process in studies in pre-algebra, in physics, in the military both in classroom and simulation environments, and in measures of teacher and student knowledge in a variety of areas where people are asked to make a “knowledge map” of a domain. We have used this technique in engineering courses, in history courses at multiple levels, in business and training areas, and in professional development of teachers. We have authorable software, which we will make more robust through the Gates project.
An ontology represents a multi-dimensional map of a domain of learning. At the top level, it specifies the core concepts and principles, and the cognitive demands which embed them, that are essential to competency in a domain, whether that domain defines a unit, a course, or high school expectations. Drilling down from these core concepts are the supplementary knowledge and skills which students are expected to develop as they progress toward competency. An ontology thus represents a multi-dimensional depiction of how learning is defined and through what knowledge and skills it develops and also provides an organizational scheme for integrating expectations, mapping progress, and coordinating learning resources and supports.1
1 A functional analogy of how such a representation might work is taken from architecture. Blueprints exist for various subsystems within a house (e.g., electrical, communication, plumbing, heating/air conditioning, structural). Each subsystem is designed to execute a particular function (e.g., to distribute electricity, communication signals, water, waste, air/heat, and mechanical load). Within each subsystem are related components (e.g., junction boxes, wiring, outlets for the electrical subsystem), and each subsystem needs to
3
By relating (or binding) instructional objects, help routines, worked examples, brief explanations, language requirements, lessons units in courses, professional development, and so on, an ontology can be sampled along different vectors or even levels for detailed development. Our goal is to produce ontologies that provide clarity, a path toward fewer standards, and analytic evidence of more challenging, complex requirements. Although typically imagined as a top-down process, we believe ontology development can proceed at different points of entry, for example, by aligning assessment tasks, or courses and curricula relative to the ontology, or move among levels. In our most recent developments, which are based on earlier work at CRESST, we are developing an assessment task ontology that could be used to identify gaps or mismatches in assessments and the goals they claim to assess. The assessment task ontology would systematically link data or evidence for various purposes to support validity interpretations and other technical quality requirements. Taken together, the data structures should enable us to operationalize to some level of satisfaction both alignment and coherence of the resulting system. The building (and rebuilding) of an ontology involves:
1. Producing a graphical representation, by a team of experts, of standards and supporting tasks intended to increase clarity and transparency of goals. Experts play an ongoing role in every step of the process.
2. Arranging the goals in a network around the central principles or concepts in the discipline or content.
3. Establishing and displaying relationships among content and supporting prerequisite learning.
4. Embedding into content the cognitive demands made on the student by the content requirements. These include the notional 21st-century skills, or intellectual and sensory tasks involving some of the following: problem solving (and its subsets), decision making, principle application; metacognitive components, situation awareness, risk assessment, teamwork, reasoning, and synthetic activities, such as writing, thinking up new problems or solutions or dealing with not routine tasks (adaptive transfer), which may include connections among multiple concepts or principles.
5. Mapping any relevant linguistic requirements.
6. Providing the capability for the graphs to be combined, reshaped, or systematically revised as needed.
safely interact with other subsystems. For example, electrical wire running through wood framing needs to be protected by a nail plate to prevent drywall screws from penetrating the wire and causing an electrical short. As with the case of architectural blueprints, the ontology can communicate function. In our case, the various subsystems are analogous to a domain representation (e.g., algebra), standards, cognitive demands, and assessment task structure. The ontology is the knowledge base that houses the various interconnected subsystems to form a coherent structure.
4
7. Developing visual representations that show a clear view of the content and cognitive relationships.
Ontologies, either as a development process or the final product, can be used to support activities from the development of fewer, clearer, and higher (FCH) standards to support for classroom instruction. Potential applications include:
1. To compare competing representations. Representations developed by alternative expert teams, districts, states, or countries can be overlaid to determine synchronicity or divergence from set of standards and supporting sub-goal analyses.
2. To develop consensus around a core set of content and cognitive demands. The analysis process could start with various stakeholders’ representations of the standards and the core knowledge and cognitive demands inherent in the standards. Then compare the various representations to identify differences in the representations, which are resolved through a consensus process.2
3. To derive FCH standards. First develop a consensus view of the big ideas, core concepts, and principles and then formulate FCH standards from the agreed-upon view.
4. To revise FCH standards. In this case, FCH standards could be analyzed in terms of implicit or explicit core content and cognitive demands (and their inter-relationships). Use expert review to reach consensus on the core content and cognitive demands to refine and validate the standards.
5. To support teachers. The ontologies can be used as performance aids for teachers, and use of the development method by teachers could serve as a process for developing consensus at a more granular level (such as a unit of instruction) among teachers.
6. To support students. The ontology or an appropriate version of it can be used to guide students to understand the organization of their own learning and to self-assess their own progress.
The ontologies are created by sets of people with expertise in content, teaching, psychology, and measurement. Their outputs delimit their view of the domain and are not intended to be a complete or canonical display of all possible content or cognition in the domain. The form of their outputs, however, is more easily subject to review and improvement, and can be represented in computational systems. Additional details are given in the Appendix section, which is presented in a “frequently asked questions” format.
2 The comparison of alternative expert ontologies is done using graph-theoretical approaches (e.g., adjacency matrices are used to describe a directed graph and to compute the difference graph and difference scores). Graph-theoretical algorithms may also be used to compare items, or for instructional sequencing using shortest path algorithm.
5
Appendix: Frequently Asked Questions About Ontologies
The FAQ comprises the following common questions about ontologies. 1. What is an ontology? 2. What does an ontology look like?
3. How can an ontology be used for assessment design? 4. How can an ontology be used for instruction?
5. How can an ontology be used for professional development? 6. How do you design an ontology?
7. How long does it take to create an ontology? 8. How do you validate an ontology?
9. What tools are available to design ontologies? 10. How has CRESST used ontologies?
11. What important elements should be included in an ontology for the Gates project? 12. How can you analyze the knowledge in ontologies?
1. What is an ontology?
We adopt the term ontology as it is used in artificial intelligence. An ontology is a (knowledge) representation that provides a shared and common understanding of a domain. While there are various formats for representing knowledge, CRESST has adopted a graphical, networked representation to represent knowledge where the nodes represent elements (e.g., concepts, procedures, facts) and the connections among nodes represent the relationships among the elements (e.g., part of, type of, leads to). A core aspect of the ontology is the inclusion of cognitive demands that relate the domain content to what learners are expected to do (cognitively) with the content. For simplicity, we will refer to nodes as concepts or elements and links as relationships.
There are two major advantages of the graphical, networked format over other formats of knowledge representations (e.g., verbal descriptions). First, the network representation can support communication among people by showing visually how the concepts relate to each other. The network representation itself imposes a kind of standardization, both in the language (i.e., the terms used for concepts and links), as well as the structure of the domain. The representation can be printed out and people can discuss whether those are the “right”
6
topics and relationships. The representation becomes an object around which people can communicate and resolve differences in understanding.
The second advantage is the network can be represented in computational form. That is, a network using a standard set of terms for concepts and relations is easily represented in the computer. The representation, once in the computer, can then be used in various applications. These applications include assessment design and instruction, discussed later in this FAQ.
Finally, it is important to note an ontology is only one way of representing a domain. The validity of the representation is strengthened by the use of experts in developing the representation, and gathering empirical data that reflect the structure of the ontology. These two issues—designing an ontology and validating an ontology are discussed elsewhere in this FAQ.
2. What does an ontology look like?
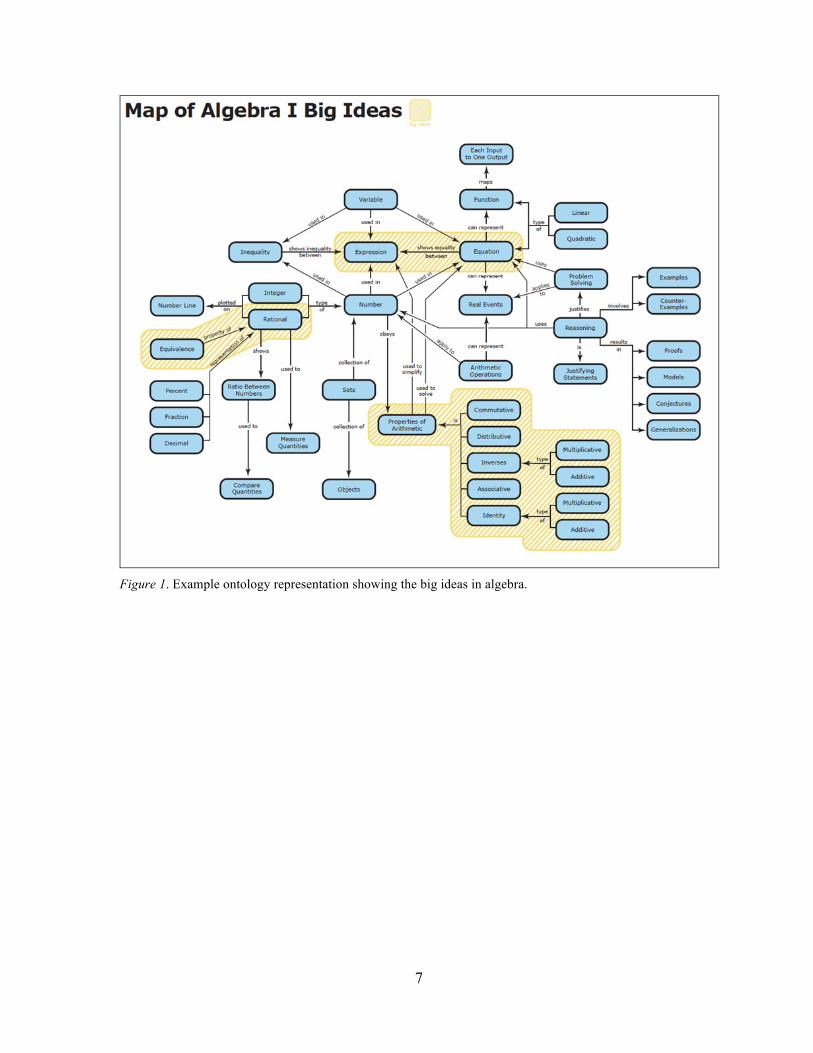
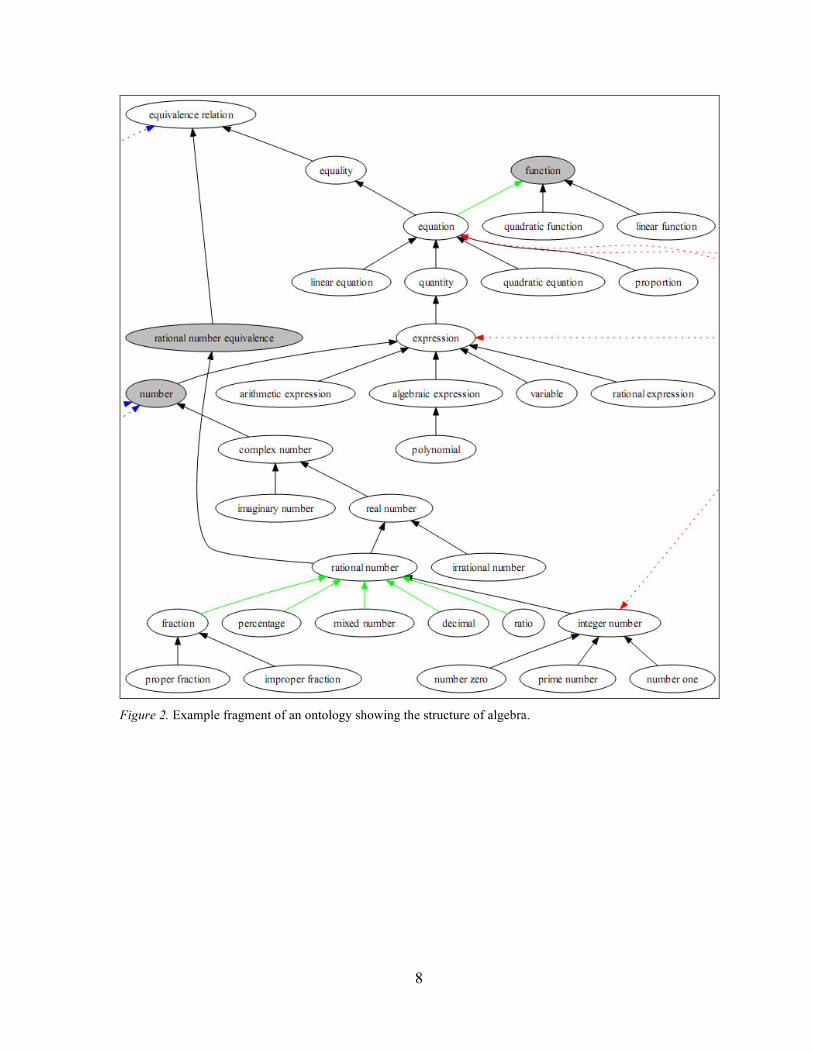
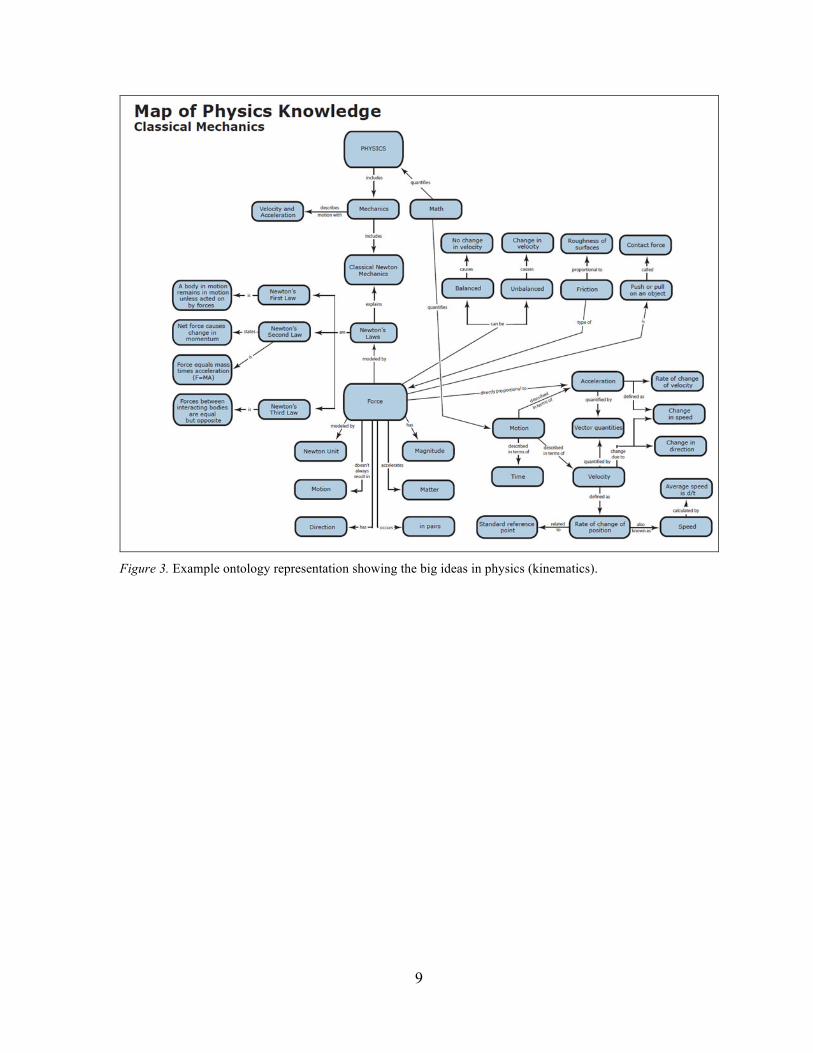
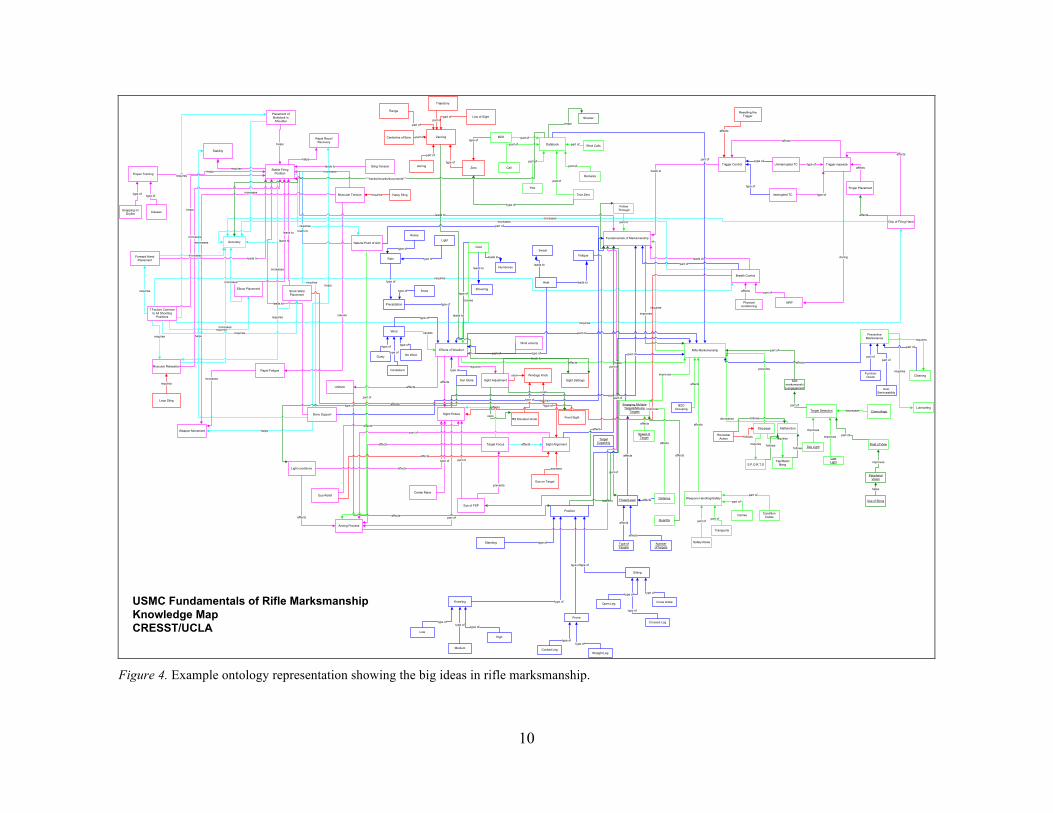
Figure 1 to Figure 4 show examples of ontologies for algebra, physics, and rifle marksmanship. Note that these representations are different levels of abstraction, with Figure 1 and Figure 3 at higher levels of abstraction, Figure 2 showing an intermediate level of abstraction, and Figure 4 showing the greatest detail.
Several important features of ontologies are shown in the examples: controlled vocabulary, structure, and parsimony. The controlled vocabulary is a property of the general approach to ontology design. The restricted vocabulary is needed both for ease of representation in the computer, and to simplify the representation. One tradeoff of a controlled vocabulary is the potential diminished expressive power of the representation.
Each example shows various structures that an ontology can assume. Figure 2 shows a largely hierarchical structure, Figure 1 and Figure 3 show associative structures, and Figure 4 shows associative structures with multiple ontologies overlaid on top each other. One key property of any of these representations is that central concepts in the domain—the big ideas—appear as nodes that have many connections. For example, in Figure 2, the concept rational number is highly connected, as is force in Figure 3.
Note that each map has a syntax or rules about how to interpret the representation. In all examples, nodes represent concepts, links represent relationships, and the direction of the arrow represents the direction of the “thought.” Also, the examples are “top-level” ontologies. Node and link labels are drawn from a set of predefined terms. In addition, parsimony is achieved by design constraints: Capture only the most important set of relations among the concepts, as judged by the experts.
7
Figure 1. Example ontology representation showing the big ideas in algebra.
8
Figure 2. Example fragment of an ontology showing the structure of algebra.
9
Figure 3. Example ontology representation showing the big ideas in physics (kinematics).
10
Fundamentals of Marksmanship
Stable Firing Position
Trigger Control
Effects of Weather
Breath Control
Aiming Process
leads to
leads to
leads to
leads to
Sight Alignment
Light conditions
Sight Picture
Target Focus
affects
part of
part of
affects
affects
Eye of FSP
Eye ReliefCenter Mass
prevents
part of
affects
type of
affects
Wind velocity
Sight Adjustment
Uniform
requires
affects
part of
Physical conditioning
NRP
affects part of
Trigger squeezeUninterrupted TC
Grip of Firing Hand
Interrupted TC
Finger Placement
during
affects
type of
type of
affects
affects
Classes
7 Factors Common to All Shooting
Positions
Rapid Recoil Recovery
Stability
Placement of Buttstock in
Shoulder
Muscular Tension
Weapon Movement
Rapid Fatigue
Elbow Placement
Bone Support
Natural Point of Aim
Forward Hand Placement
Sling Tension
Muscular Relaxation
Stock Weld Placement
Proper Training
Databook
Remarks
Call
Wind Calls
True Zero
BZO
part of
part of
part of
part of
part of
Cold
causes
Rifle Marksmanship
requires
Follow Through
part of
part of
Preventive Maintenance
Cleaning
Lubricating
requires
requires
Stoppage
S.P.O.R.T.STap/Rack/
Bang
requires
requires
prevents
BZOGrouping
affects
Engaging Multiple Targets/Moving
Targets
Distance
Quantity
Speed of Target
affects
affects
Target Detection
Weapons Handling/Safety
LowLight
Day Light
Camouflage
Field of View
part of
improves
improves
decreases
Safety Rules
Carries
Transports
Condition Codes
affects
part of
part of
part ofpart of
part of
requires
type of
type of
part of
part of
part ofaffects
part of
User Serviceability
Function Check
part ofpart of
Target Capability
Threat Level
affects
affects
Type of Targets
Number ofTargets
affects
affects
Plot
part of
affects
Position
Standing
Kneeling
Prone
Sitting
type of
type oftype of
Low
Medium
High
type oftype of
type ofCrossed Leg
Open Leg Cross Ankle
type of
type oftype of
Cocked LegStraight Leg
type oftype of
type ofShivering
Numbnessleads to
leads to
Heat
type of
Sweat
Fatigue
leads to
leads to
Sun Glare
type of
Precipitation type of
Rain
Snow
type of
type of
Heavy
Light
type of
type of
Wind
Gusty
Consistent
No Wind
type of
type of
type of
type of
increases
helps
requiresleads to
type of
Snapping in/Dryfire
type of
helps
leads to
leads to
helps
increases
causes
decreases
increases
leads to leads to
helps
leads to
requires
requires
requires
helps
helps
helps
requires
requires
requires
requiresrequires
requires
requires
affects
affects
Accuracy
increases
increases
increases
increases
increases
increases
increases
causes
Eye on Target
worsens
affects
Loop Sling
requires
Remedial Action follows
improves
Windage Knob
Sight Settings
RS Elevation Knob Front Sight
uses
type of
type ofaffects
Hasty Slingrequires
Zeroing
Range
Centerline of Bore
Aiming
Trajectory
Line of Sight
Zero
part of
part of
part of
part ofpart of
type of
type of
Resetting the Trigger
affects
type of
Peripheral Vision
Use of Binos
field marksmanship engagement
improves
helps
part of
part of
Malfunction
decreases
followsfollows
follows
affects
part of
affects
helps
improves
improves
part of
part of
part of
part of
affects
affect
type of
uses
uses
leads to
Shooter
helps
***tracks/records/documents***
type of
leads to
USMC Fundamentals of Rifle MarksmanshipKnowledge MapCRESST/UCLA
Figure 4. Example ontology representation showing the big ideas in rifle marksmanship.
11
Fundamentals of Marksmanship
Stable FiringPosition
Trigger Control
Effects of Weather
Breath Control
Aiming Process
leads to
leads to
leads to
leads to
Sight Alignment
Light conditions
Sight Picture
Target Focus
affects
part of
part of
affects
affects
Eye of FSP
Eye ReliefCenter Mass
prevents
part of
affects
type of
affects
Wind velocity
Sight Adjustment
Uniform
requires
affects
part of
Physicalconditioning
NRP
affects part of
Trigger squeezeUninterrupted TC
Grip of Firing Hand
Interrupted TC
Finger Placement
during
affects
type of
type of
affects
affects
Classes
7 Factors Commonto All Shooting
Positions
Rapid RecoilRecovery
Stability
Placement ofButtstock in
Shoulder
Muscular Tension
Weapon Movement
Rapid Fatigue
Elbow Placement
Bone Support
Natural Point of Aim
Forward HandPlacement
Sling Tension
Muscular Relaxation
Stock WeldPlacement
Proper Training
Databook
Remarks
Call
Wind Calls
True Zero
BZO
part of
part of
part of
part of
part of
Cold
causes
Rifle Marksmanship
requires
FollowThrough
part of
part of
PreventiveMaintenance
Cleaning
Lubricating
requires
requires
Stoppage
S.P.O.R.T.STap/Rack/
Bang
requires
requires
prevents
BZOGrouping
affects
Engaging MultipleTargets/Moving
Targets
Distance
Quantity
Speed ofTarget
affects
affects
Target Detection
Weapons Handling/Safety
LowLight
Day Light
Camouflage
Field of View
part of
improves
improves
decreases
Safety Rules
Carries
Transports
ConditionCodes
affects
part of
part of
part ofpart of
part of
requires
type of
type of
part of
part of
part ofaffects
part of
UserServiceability
FunctionCheck
part ofpart of
TargetCapability
Threat Level
affects
affects
Type ofTargets
NumberofTargets
affects
affects
Plot
part of
affects
Position
Standing
Kneeling
Prone
Sitting
type of
type oftype of
Low
Medium
High
type oftype of
type ofCrossed Leg
Open Leg Cross Ankle
type of
type oftype of
Cocked LegStraight Leg
type oftype of
type ofShivering
Numbnessleads to
leads to
Heat
type of
Sweat
Fatigue
leads to
leads to
Sun Glare
type of
Precipitation type of
Rain
Snow
type of
type of
Heavy
Light
type of
type of
Wind
Gusty
Consistent
No Wind
type of
type of
type of
type of
increases
helps
requiresleads to
type of
Snapping in/Dryfire
type of
helps
leads to
leads to
helps
increases
causes
decreases
increases
leads to leads to
helps
leads to
requires
requires
requires
helps
helps
helps
requires
requires
requires
requiresrequires
requires
requires
affects
affects
Accuracy
increases
increases
increases
increases
increases
increases
increases
causes
Eye on Target
worsens
affects
Loop Sling
requires
RemedialAction follows
improves
Windage Knob
Sight Settings
RS Elevation Knob Front Sight
uses
type of
type ofaffects
Hasty Slingrequires
Zeroing
Range
Centerline of Bore
Aiming
Trajectory
Line of Sight
Zero
part of
part of
part of
part ofpart of
type of
type of
Resetting theTrigger
affects
type of
PeripheralVision
Use of Binos
fieldmarksmanship engagement
improves
helps
part of
part of
Malfunction
decreases
followsfollows
follows
affects
part of
affects
helps
improves
improves
part of
part of
part of
part of
affects
affect
type of
uses
uses
leads to
Shooter
helps
***tracks/records/documents***
type of
leads to
USMC Fundamentals of Rifle MarksmanshipKnowledge MapCRESST/UCLA
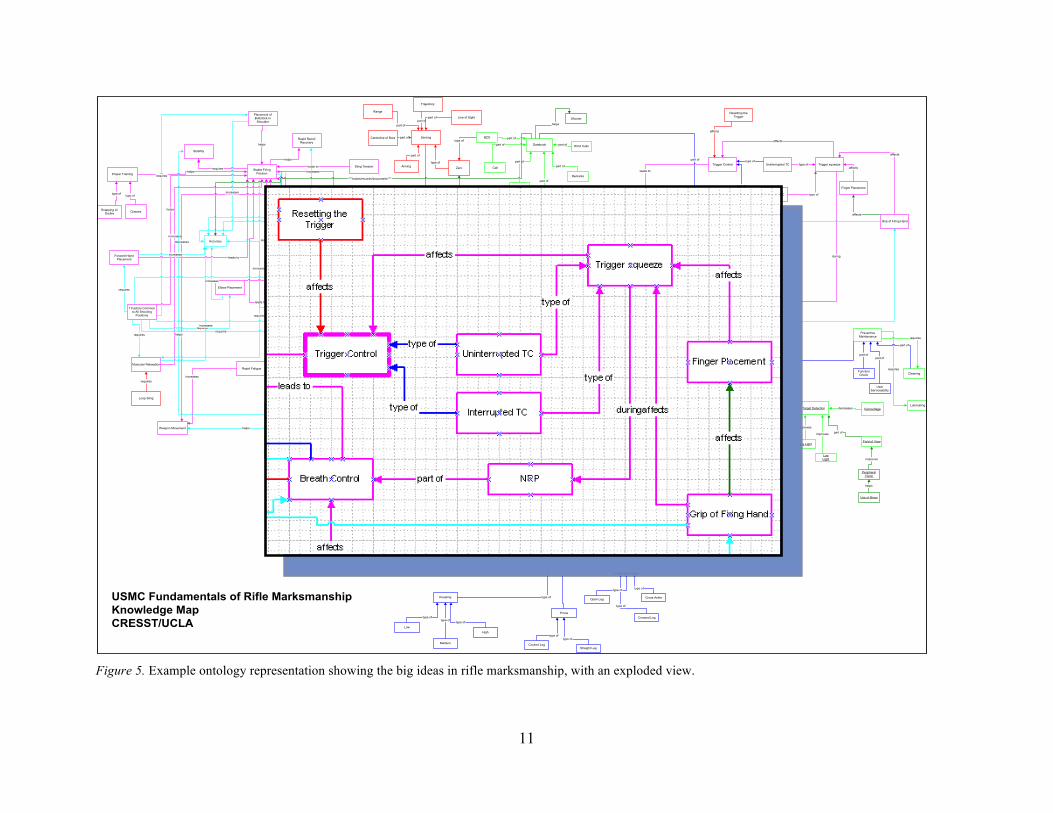
Figure 5. Example ontology representation showing the big ideas in rifle marksmanship, with an exploded view.
12
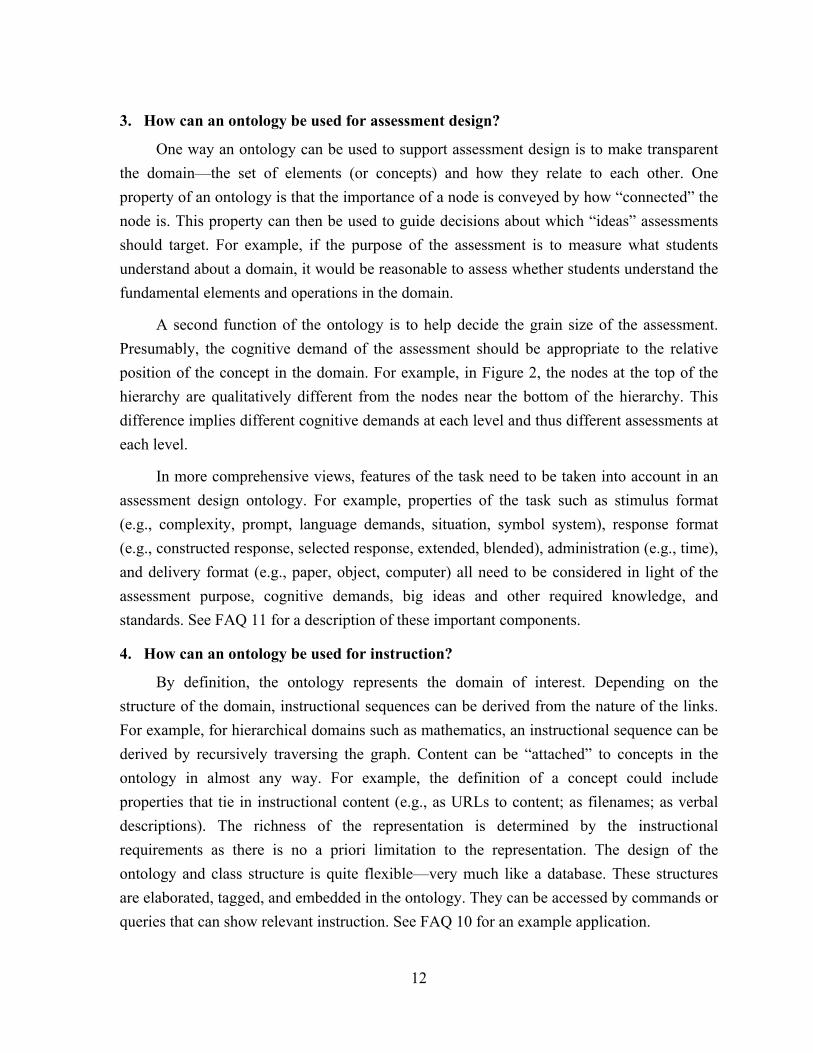
3. How can an ontology be used for assessment design?
One way an ontology can be used to support assessment design is to make transparent the domain—the set of elements (or concepts) and how they relate to each other. One property of an ontology is that the importance of a node is conveyed by how “connected” the node is. This property can then be used to guide decisions about which “ideas” assessments should target. For example, if the purpose of the assessment is to measure what students understand about a domain, it would be reasonable to assess whether students understand the fundamental elements and operations in the domain.
A second function of the ontology is to help decide the grain size of the assessment. Presumably, the cognitive demand of the assessment should be appropriate to the relative position of the concept in the domain. For example, in Figure 2, the nodes at the top of the hierarchy are qualitatively different from the nodes near the bottom of the hierarchy. This difference implies different cognitive demands at each level and thus different assessments at each level.
In more comprehensive views, features of the task need to be taken into account in an assessment design ontology. For example, properties of the task such as stimulus format (e.g., complexity, prompt, language demands, situation, symbol system), response format (e.g., constructed response, selected response, extended, blended), administration (e.g., time), and delivery format (e.g., paper, object, computer) all need to be considered in light of the assessment purpose, cognitive demands, big ideas and other required knowledge, and standards. See FAQ 11 for a description of these important components.
4. How can an ontology be used for instruction?
By definition, the ontology represents the domain of interest. Depending on the structure of the domain, instructional sequences can be derived from the nature of the links. For example, for hierarchical domains such as mathematics, an instructional sequence can be derived by recursively traversing the graph. Content can be “attached” to concepts in the ontology in almost any way. For example, the definition of a concept could include properties that tie in instructional content (e.g., as URLs to content; as filenames; as verbal descriptions). The richness of the representation is determined by the instructional requirements as there is no a priori limitation to the representation. The design of the ontology and class structure is quite flexible—very much like a database. These structures are elaborated, tagged, and embedded in the ontology. They can be accessed by commands or queries that can show relevant instruction. See FAQ 10 for an example application.
13
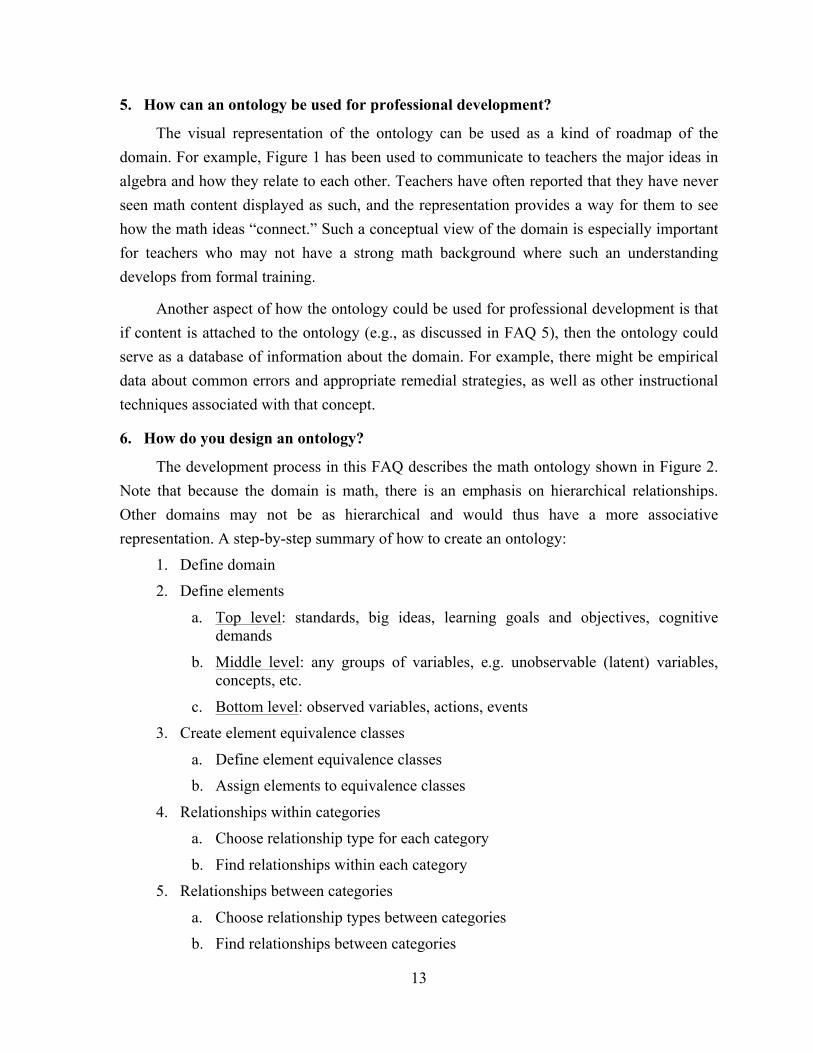
5. How can an ontology be used for professional development?
The visual representation of the ontology can be used as a kind of roadmap of the domain. For example, Figure 1 has been used to communicate to teachers the major ideas in algebra and how they relate to each other. Teachers have often reported that they have never seen math content displayed as such, and the representation provides a way for them to see how the math ideas “connect.” Such a conceptual view of the domain is especially important for teachers who may not have a strong math background where such an understanding develops from formal training.
Another aspect of how the ontology could be used for professional development is that if content is attached to the ontology (e.g., as discussed in FAQ 5), then the ontology could serve as a database of information about the domain. For example, there might be empirical data about common errors and appropriate remedial strategies, as well as other instructional techniques associated with that concept.
6. How do you design an ontology?
The development process in this FAQ describes the math ontology shown in Figure 2. Note that because the domain is math, there is an emphasis on hierarchical relationships. Other domains may not be as hierarchical and would thus have a more associative representation. A step-by-step summary of how to create an ontology:
1. Define domain 2. Define elements
a. Top level: standards, big ideas, learning goals and objectives, cognitive demands
b. Middle level: any groups of variables, e.g. unobservable (latent) variables, concepts, etc.
c. Bottom level: observed variables, actions, events 3. Create element equivalence classes
a. Define element equivalence classes b. Assign elements to equivalence classes
4. Relationships within categories a. Choose relationship type for each category
b. Find relationships within each category 5. Relationships between categories
a. Choose relationship types between categories b. Find relationships between categories
14
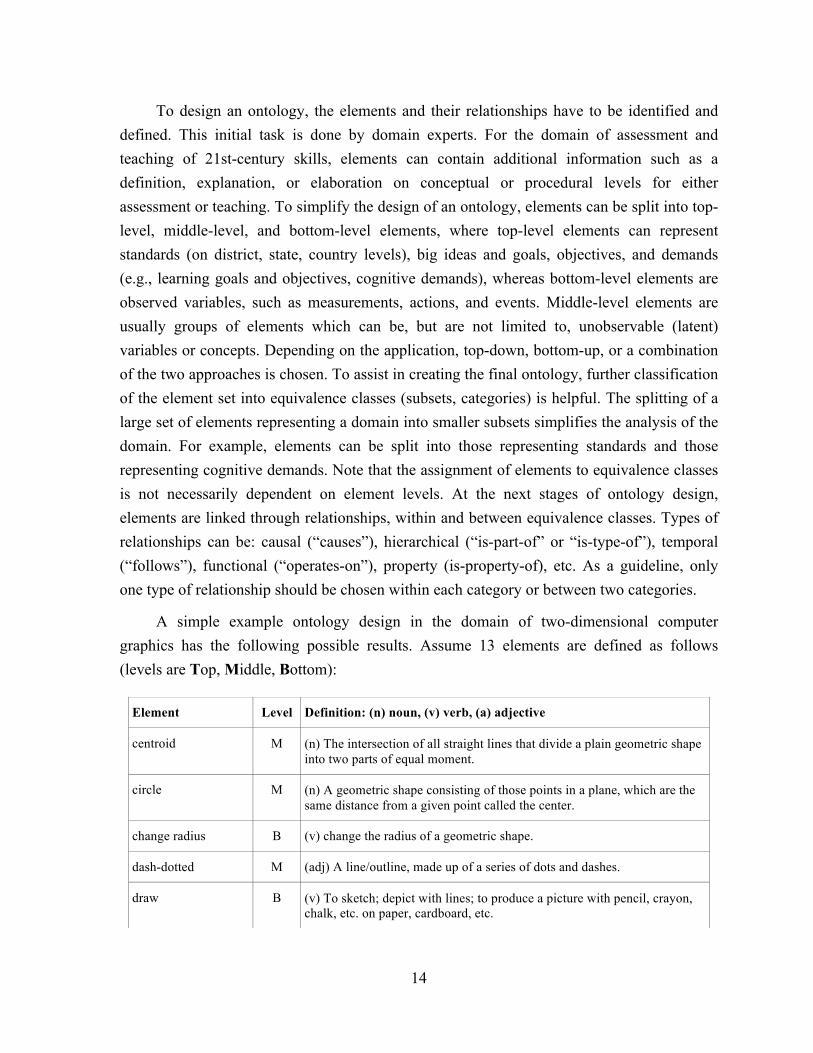
To design an ontology, the elements and their relationships have to be identified and defined. This initial task is done by domain experts. For the domain of assessment and teaching of 21st-century skills, elements can contain additional information such as a definition, explanation, or elaboration on conceptual or procedural levels for either assessment or teaching. To simplify the design of an ontology, elements can be split into top-level, middle-level, and bottom-level elements, where top-level elements can represent standards (on district, state, country levels), big ideas and goals, objectives, and demands (e.g., learning goals and objectives, cognitive demands), whereas bottom-level elements are observed variables, such as measurements, actions, and events. Middle-level elements are usually groups of elements which can be, but are not limited to, unobservable (latent) variables or concepts. Depending on the application, top-down, bottom-up, or a combination of the two approaches is chosen. To assist in creating the final ontology, further classification of the element set into equivalence classes (subsets, categories) is helpful. The splitting of a large set of elements representing a domain into smaller subsets simplifies the analysis of the domain. For example, elements can be split into those representing standards and those representing cognitive demands. Note that the assignment of elements to equivalence classes is not necessarily dependent on element levels. At the next stages of ontology design, elements are linked through relationships, within and between equivalence classes. Types of relationships can be: causal (“causes”), hierarchical (“is-part-of” or “is-type-of”), temporal (“follows”), functional (“operates-on”), property (is-property-of), etc. As a guideline, only one type of relationship should be chosen within each category or between two categories.
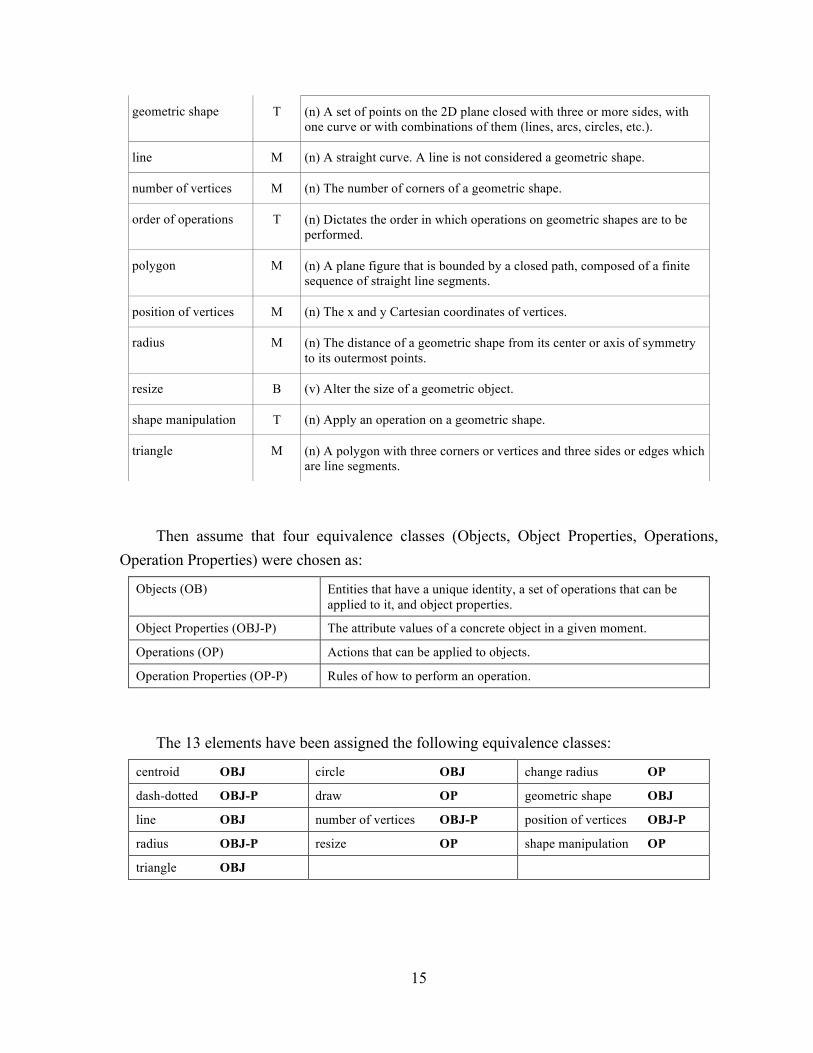
A simple example ontology design in the domain of two-dimensional computer graphics has the following possible results. Assume 13 elements are defined as follows (levels are Top, Middle, Bottom):
Element Level Definition: (n) noun, (v) verb, (a) adjective
centroid M (n) The intersection of all straight lines that divide a plain geometric shape into two parts of equal moment.
circle M (n) A geometric shape consisting of those points in a plane, which are the same distance from a given point called the center.
change radius B (v) change the radius of a geometric shape.
dash-dotted M (adj) A line/outline, made up of a series of dots and dashes.
draw B (v) To sketch; depict with lines; to produce a picture with pencil, crayon, chalk, etc. on paper, cardboard, etc.
15
Then assume that four equivalence classes (Objects, Object Properties, Operations, Operation Properties) were chosen as:
Objects (OB) Entities that have a unique identity, a set of operations that can be applied to it, and object properties.
Object Properties (OBJ-P) The attribute values of a concrete object in a given moment.
Operations (OP) Actions that can be applied to objects.
Operation Properties (OP-P) Rules of how to perform an operation.
The 13 elements have been assigned the following equivalence classes:
centroid OBJ circle OBJ change radius OP
dash-dotted OBJ-P draw OP geometric shape OBJ
line OBJ number of vertices OBJ-P position of vertices OBJ-P
radius OBJ-P resize OP shape manipulation OP
triangle OBJ
geometric shape T (n) A set of points on the 2D plane closed with three or more sides, with one curve or with combinations of them (lines, arcs, circles, etc.).
line M (n) A straight curve. A line is not considered a geometric shape.
number of vertices M (n) The number of corners of a geometric shape.
order of operations T (n) Dictates the order in which operations on geometric shapes are to be performed.
polygon M (n) A plane figure that is bounded by a closed path, composed of a finite sequence of straight line segments.
position of vertices M (n) The x and y Cartesian coordinates of vertices.
radius M (n) The distance of a geometric shape from its center or axis of symmetry to its outermost points.
resize B (v) Alter the size of a geometric object.
shape manipulation T (n) Apply an operation on a geometric shape.
triangle M (n) A polygon with three corners or vertices and three sides or edges which are line segments.

16
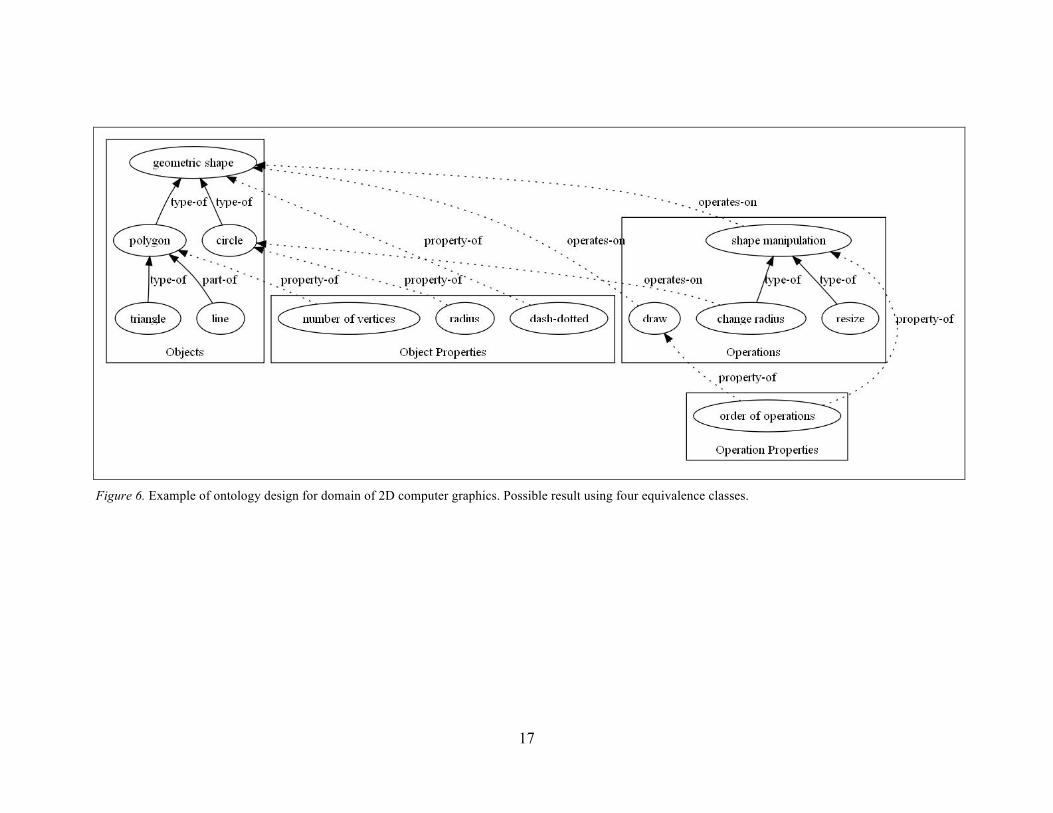
The final possible result is depicted in Figure 6 where hierarchical relationship types are used within equivalence classes and functional and property relationship types are used for between-class elements.
17
Figure 6. Example of ontology design for domain of 2D computer graphics. Possible result using four equivalence classes.
18
7. How long does it take to create an ontology?
In general, the amount of time to develop an ontology depends on numerous factors. Developing the top-level ontology (e.g., as shown in Figure 1) with experts generally takes about of week, which includes preparation and several revision cycles. The important variables include: complexity of domain (e.g., level of detail desired in the representation—the more granular, the more complex); consensus in domain (e.g., is the knowledge stable or changing?); availability of source materials in addition to experts (e.g., if the only source of knowledge is experts, then development will require numerous knowledge acquisition cycles with the expert); purpose for the ontology (e.g., is it for display purposes only, consensus building, remediation, automated testing and instruction?); availability of experts (e.g,. difficulty accessing experts will increase development time).
8. How do you validate an ontology?
Given an ontology, how do you know the structure is sufficient for the intended purposes? As with validating assessments, validating an ontology is likely to require an argument that links claims to evidence. We briefly describe several validation techniques.
Expert-based representation. Because an ontology is typically expert-based, support for the structure of the ontology could be gathered by asking experts to independently generate the structure or part of the structure. Network similarity measures could be used to provide an index of how similar the structures are. A less taxing alternative would be to have experts review the ontology structure and provide feedback or quality ratings. Revisions could then be made to the ontology and the review process repeated.
Empirical verification. Empirical support for the ontology can be gathered by examining the pattern of performance on assessment items using learners with various degrees of knowledge. For example, experts would be expected to be competent at all levels of the ontology, whereas novices would not be expected to be competent at the high levels. Advanced learners would be expected to fall somewhere in between, demonstrating more success on assessment items higher in the hierarchy than novices, but not being as proficient as experts.
Another method would be to examine the completeness of understanding using experts and novices. For example, for a given node, there may be various subordinate concepts. Experts would be expected to be competent in all the subordinate concepts compared to novices, who would be more likely to have incomplete knowledge and thus more variable performance on those subordinate concepts.
19
A third method would involve verifying the relationships among concepts. Using learners who have attained criterion understanding, verifying that their understanding (e.g., through knowledge mapping or other techniques that measure relationships) reflects the relationship specified in the ontology would provide support for the structure of the ontology.
A fourth method would be a comparison of task evidence purported to assess some aspects of the ontology. A fifth method involves randomized comparisons focused on the levels of interest (e.g., professional development type, learning progression, instructional supports).
9. What tools are available to design ontologies?
Various tools can be used to design an ontology. Depending on the application, for small ontologies, a drawing-type software package may be sufficient. For more complex ontologies that are multidimensional, more specialized tools may be more appropriate. For example, Protégé is an ontology editor that allows one to create ontologies that are “frame-based.” One shortcoming of many ontology editors is their display capabilities. Graphically or visually rendering a multidimensional ontology is difficult and may require custom-developed software.
10. How has CRESST used ontologies?
CRESST has gone through three generations of the use of knowledge representations for assessment purposes. Each generation has advanced the work toward multivariate representations of knowledge and increasing integration among assessment, instruction, and domain knowledge.
Assessing student understanding via graphical representation. The first application of knowledge representations was to the assessment of students’ content knowledge. Students were asked to create a knowledge map of their understanding of some domain. A knowledge map was defined as a network representation of nodes and directed links, where nodes represented concepts and links represented relationships. Concepts and relationships were predefined for students, and the quality of maps was evaluated by comparing students’ maps to one or more expert’s map. Score reliability has consistently been found to be very high, and validity evidence gathered has consistently shown sensitivity to instruction, expert-novice differences, and related to other measures of conceptual knowledge.
Mapping the core ideas of a domain. A second application of knowledge representations was to synthesize a domain (using experts) and represent the core concepts within a domain. Once synthesized, the core concepts—the “big ideas”—served as targets of
20
assessments. For example, CRESST elicited from a group of domain experts what they viewed as the important mathematical concepts in algebra, resulting in over 100 statements about algebra. A list of “big ideas” was derived from those statements and how those ideas related to each other (see Figure 1).
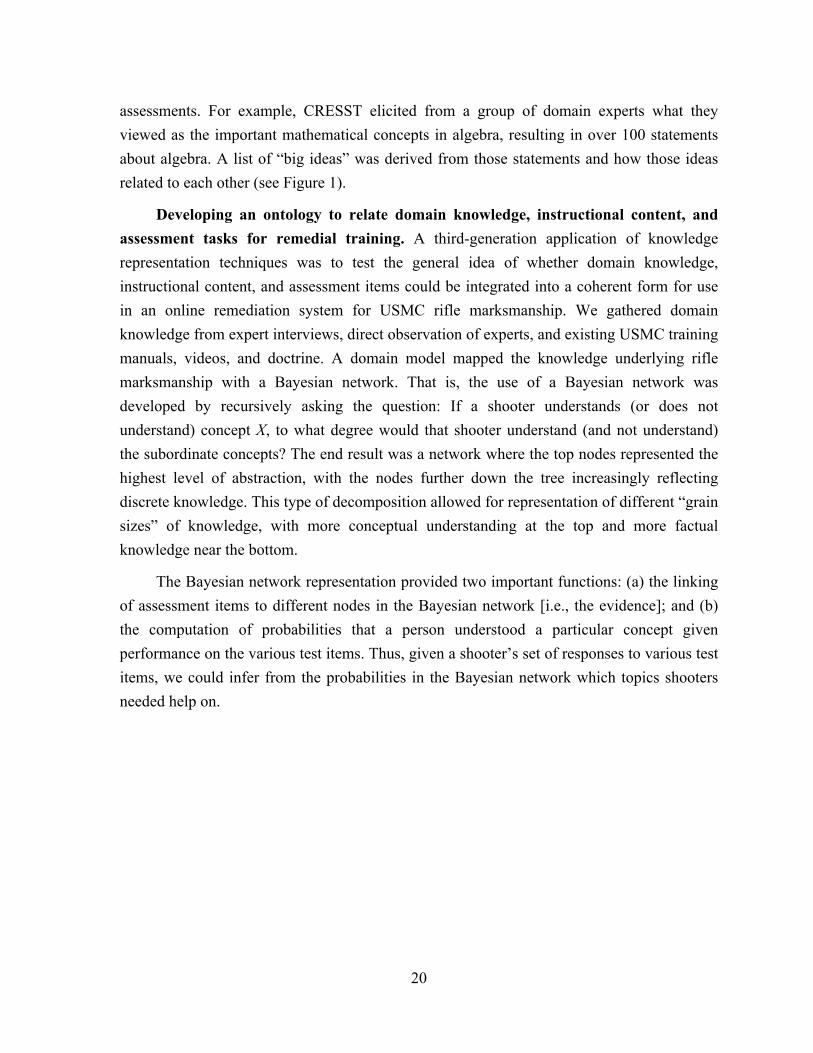
Developing an ontology to relate domain knowledge, instructional content, and assessment tasks for remedial training. A third-generation application of knowledge representation techniques was to test the general idea of whether domain knowledge, instructional content, and assessment items could be integrated into a coherent form for use in an online remediation system for USMC rifle marksmanship. We gathered domain knowledge from expert interviews, direct observation of experts, and existing USMC training manuals, videos, and doctrine. A domain model mapped the knowledge underlying rifle marksmanship with a Bayesian network. That is, the use of a Bayesian network was developed by recursively asking the question: If a shooter understands (or does not understand) concept X, to what degree would that shooter understand (and not understand) the subordinate concepts? The end result was a network where the top nodes represented the highest level of abstraction, with the nodes further down the tree increasingly reflecting discrete knowledge. This type of decomposition allowed for representation of different “grain sizes” of knowledge, with more conceptual understanding at the top and more factual knowledge near the bottom.
The Bayesian network representation provided two important functions: (a) the linking of assessment items to different nodes in the Bayesian network [i.e., the evidence]; and (b) the computation of probabilities that a person understood a particular concept given performance on the various test items. Thus, given a shooter’s set of responses to various test items, we could infer from the probabilities in the Bayesian network which topics shooters needed help on.
21
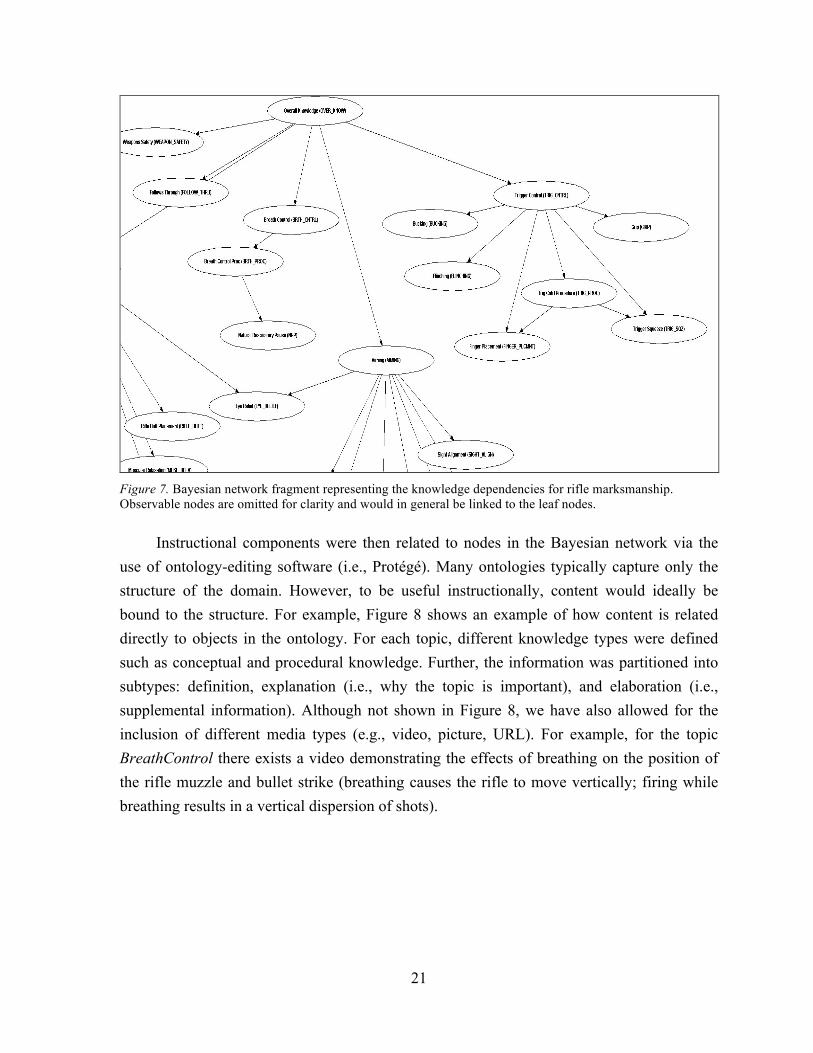
Figure 7. Bayesian network fragment representing the knowledge dependencies for rifle marksmanship. Observable nodes are omitted for clarity and would in general be linked to the leaf nodes.
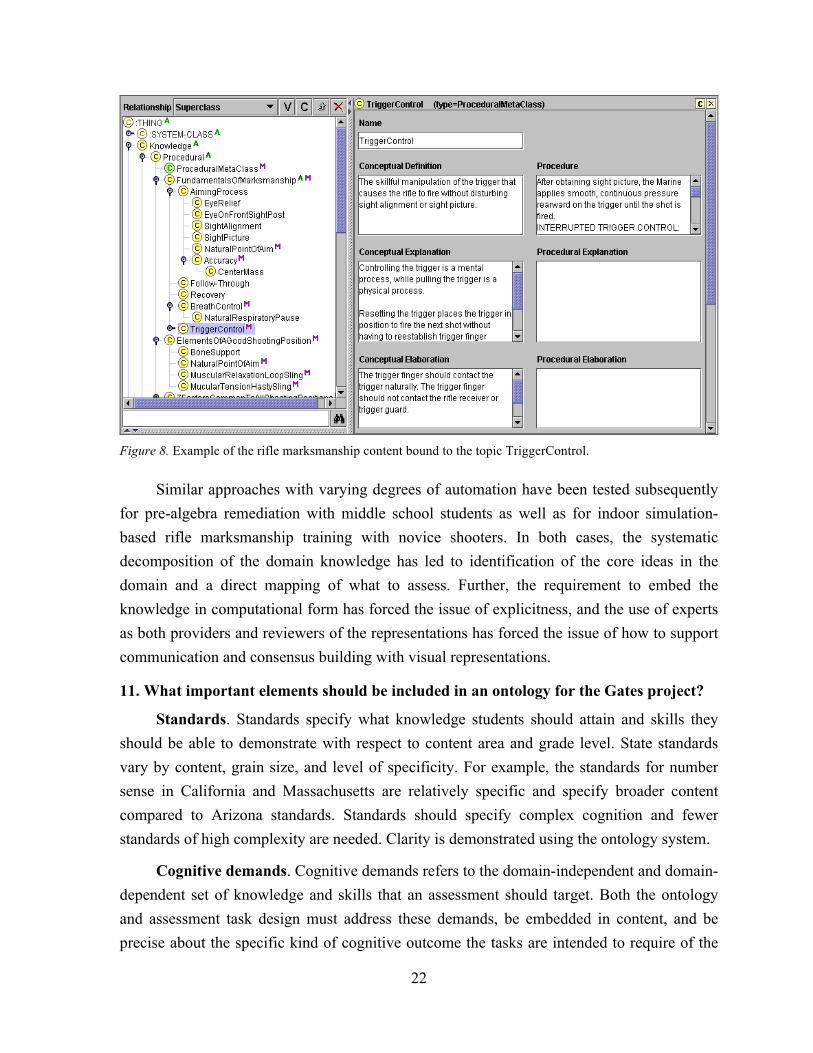
Instructional components were then related to nodes in the Bayesian network via the use of ontology-editing software (i.e., Protégé). Many ontologies typically capture only the structure of the domain. However, to be useful instructionally, content would ideally be bound to the structure. For example, Figure 8 shows an example of how content is related directly to objects in the ontology. For each topic, different knowledge types were defined such as conceptual and procedural knowledge. Further, the information was partitioned into subtypes: definition, explanation (i.e., why the topic is important), and elaboration (i.e., supplemental information). Although not shown in Figure 8, we have also allowed for the inclusion of different media types (e.g., video, picture, URL). For example, for the topic BreathControl there exists a video demonstrating the effects of breathing on the position of the rifle muzzle and bullet strike (breathing causes the rifle to move vertically; firing while breathing results in a vertical dispersion of shots).
22
Figure 8. Example of the rifle marksmanship content bound to the topic TriggerControl.
Similar approaches with varying degrees of automation have been tested subsequently for pre-algebra remediation with middle school students as well as for indoor simulation-based rifle marksmanship training with novice shooters. In both cases, the systematic decomposition of the domain knowledge has led to identification of the core ideas in the domain and a direct mapping of what to assess. Further, the requirement to embed the knowledge in computational form has forced the issue of explicitness, and the use of experts as both providers and reviewers of the representations has forced the issue of how to support communication and consensus building with visual representations.
11. What important elements should be included in an ontology for the Gates project?
Standards. Standards specify what knowledge students should attain and skills they should be able to demonstrate with respect to content area and grade level. State standards vary by content, grain size, and level of specificity. For example, the standards for number sense in California and Massachusetts are relatively specific and specify broader content compared to Arizona standards. Standards should specify complex cognition and fewer standards of high complexity are needed. Clarity is demonstrated using the ontology system.
Cognitive demands. Cognitive demands refers to the domain-independent and domain-dependent set of knowledge and skills that an assessment should target. Both the ontology and assessment task design must address these demands, be embedded in content, and be precise about the specific kind of cognitive outcome the tasks are intended to require of the
23
student (e.g., facts, declarative or procedural knowledge, conceptual knowledge, problem solving). Evidence of students’ ability to transfer and generalize to likely but directly uninstructed situations is important but often not included in standards. Assessments should address both the class of illustrations given in instruction as well as some probable requirements to apply the knowledge or skill to a different setting or task.
Task specifications. Task specifications specify the critical components of the assessment activity students are expected to engage in. Task specifications support the design of tasks to observe and gather evidence about student performance, which is the basis for drawing inferences about their competence. The task representation includes the domain model (e.g., the set of knowledge, skills, behavior, attitudes, and other properties) that performance is being generalized to, the stimulus materials, the format of the task, the set of measures and the format of students’ responses, the administration details, and the scoring method associated with the measures.
Domain model. A domain representation is an explicit description of the content, knowledge, skills, abilities, interests, attitudes, and other properties of the construct that is intended to be assessed. A domain representation is the basis for sampling test items, the referent against which to evaluate the relevance and representativeness of the test items, and a reflection of the universe that performance on an assessment is being generalized to. An important function of a domain representation is to help assessment developers sample tasks over a domain, so that tasks represent the important skills and knowledge of the domain. The idea that tasks are a sample from a domain representation suggests the representation should be explicit, precise, and externalized, and capture the essential elements of what is to be tested with respect to the target environment. Finally, empirical or analytical evidence must be connected to tasks conditioned by task purposes.
12. How can you analyze the knowledge in ontologies?
Because the ontology representation is a graph, standard analytical techniques from graph theory can be used to analyze the structure and answer questions related to the content domain, cognitive demands, assessment, and instruction. For example, the following kinds of questions can be asked of the system:
• What are the concepts covered by standard S?
• What is the set of assessment tasks related to standard S?
• For a given standard S, what is the body of knowledge of depth D that underlies S?
• For standards S1 to Sn, what is the union/intersection/complement of concepts?
24
• For standards S1 to Sn, what is the union/intersection/complement of assessment tasks?
• For assessment tasks T1 to Tn, what is the union/intersection/complement of concepts?
• For concept C, what are the prerequisite concepts students need to understand?
• What concepts are influenced by understanding concept C?
• What is the path from concept C1 to concept C2 with respect to knowledge?
• What is the path from concept C1 to concept C2 with respect to assessment tasks?
• What are the common errors and remediation strategies associated with concept C?
• What is difficult about understanding concept C?
• What are useful instructional strategies and methods associated with understanding concept C?
• What are the assessment tasks that measure cognitive demand CD for concept C?
• What is the shortest path from concept C1 to concept C2?