Embed Size (px)
Citation preview
MARINE ECOLOGY PROGRESS SERIESMar Ecol Prog Ser
Vol. 325: 205–226, 2006 Published November 7
INTRODUCTION
Establishing linkages in the field between environ-mental variability and fish production requires mea-surement of key characteristics of the physical envi-ronment and biota on relevant temporal and spatial
scales. This has proven more difficult than expecteddue to a variety of problems including: (1) selectionand measurement of appropriate physical or bioticvariables, (2) covariance among variables, (3) severeunder-sampling, and (4) mismatches of spatial andtemporal scales among variables. There is general
© Inter-Research 2006 · www.int-res.com*Email: [email protected]
Ontogenetic and seasonal trends in recent growthrates of Atlantic cod and haddock larvae on Georges
Bank: effects of photoperiod and temperature
L. J. Buckley1,*, E. M. Caldarone2, R. G. Lough3, J. M. St. Onge-Burns1
1University of Rhode Island/NOAA Cooperative Marine Education and Research Program, Graduate School ofOceanography, South Ferry Road, Narragansett, Rhode Island 02882, USA
2NOAA National Marine Fisheries Service, Narragansett Laboratory, 28 Tarzwell Drive, Narragansett,Rhode Island 02882, USA
3NOAA National Marine Fisheries Service, Woods Hole Laboratory, 166 Water Street, Woods Hole,Massachusetts 02543, USA
ABSTRACT: Growth rate is a key demographic factor affecting survival and recruitment of marinefishes. Yet in the field, the patterns of change in growth rate with development and the effects ofenvironmental variability on growth are poorly understood. We examined several factors that maycontribute to the observed variability in recent (i.e. 2 to 4 d before sampling) growth and survival ofAtlantic cod Gadus morhua and haddock Melanogrammus aeglefinus larvae on the southern flank ofGeorges Bank for the years 1995 through 1999. For both species, strong ontogenetic and seasonaltrends in larval growth rates were apparent. A rapid initial increase in specific growth rate with lar-val size was observed in both species, followed by a stanza with little change in specific growth rateand finally a gradual increase with size to a maximum specific growth rate. For larva of any givensize, growth rate increased as the season progressed. A variety of models were used to explore anddescribe the relations among growth rate, larval size, photoperiod, temperature and other variables.Generalized additive models (GAMs) with both larval size (protein content) and photoperiod termsexplained 48% and 61% of the variability observed in recent growth of cod and haddock, respec-tively. Residuals from these models were used to examine the effects of other factors on estimatedgrowth rates. Salinity, water density (sigma-t, σt), distance along the Bank, bottom depth, tempera-ture (T) and residual T (observed T minus the long-term mean for a given day of the year) explainedsmall but significant portions of the residual variability in larval growth rates. These data and otherconsiderations suggest that, while both increasing photoperiod and temperature contribute to theincrease in larval growth rates observed each spring, photoperiod rather than temperature was thebetter proxy for the seasonal trend in larval growth rates between March and May on Georges Bank.Feeding conditions and growth of larval Atlantic cod and haddock were poor during the late winterand spring of 1995 compared with those from 1997 to 1999.
KEY WORDS: Atlantic cod · Haddock · Larvae · Growth · Photoperiod · Temperature · Diel trends
Resale or republication not permitted without written consent of the publisher
Mar Ecol Prog Ser 325: 205–226, 2006
agreement, however, that knowledge of the factorsaffecting growth and survival during the first year oflife is key to understanding the linkages between thephysical and biotic environment and fish production(Leggett & Deblois 1994).
Rapid growth and high mortality characterize thelarval stage of most marine fishes. The rare survivorincreases in mass by 1 to 2 orders of magnitude fromhatching through metamorphosis to the juvenile stage.The rates of growth and mortality together determinethe rate of change in the biomass of a cohort. Inter-annual variability in these rates coupled with fluctua-tions in egg production can lead to large fluctuations inrecruitment and year-class size (Houde 1989). Whilelarval mortality generally decreases with increasingsize (Peterson & Wroblewski 1984, Bailey & Houde1989, Houde 1997), larval growth and developmentfollow genetically determined patterns that are modi-fied by environmental conditions including photo-period, water temperature and prey availability. In thefield, detailed information on the pattern of change ingrowth rate during the larval period is scarce.
In temperate waters, the increase in growth rate offish larvae observed in the spring and the decrease ob-served in the fall has most often been attributed to orcorrelated with water temperature (Campana & Hurley1989, Munk et al. 1991, Heath 1992). However, photo-period changes dramatically at middle and high lati-tudes during these same periods and may be a funda-mental cause of the change in growth rates. While thedifferences in growth rates among different stocks atvery different latitudes have been attributed tothe longer photoperiod at high latitudes (Suthers &Sundby 1996), the role of photoperiod in determininggrowth rate within a stock over the larval period has re-ceived relatively little attention. Since most marine fishlarvae are visual feeders (Blaxter 1986), photoperioddetermines the time available for feeding and conse-quently has a considerable impact on daily ingestionrates in marine fish larvae (Laurence 1977, Suthers &Sundby 1996). The seasonal changes in photoperiodand water temperature are part of an annual cycle thatmay include cyclical changes in a number of environ-mental variables affecting larval growth and survival.These include prey and predator abundance, stratifica-tion, circulation and position of hydrographic fronts.
Attribution of increased growth to water temperaturein the field is supported by numerous laboratory exper-iments that demonstrate faster larval growth rates athigher temperatures both within and among species(Pepin 1991, Buckley et al. 1993, Houde & Zastrow1993, Otterlei et al. 1999). Most of these experimentswere run at high prey levels where food was not limit-ing. When food is limiting, the relationship betweengrowth and temperature can be quite different, as seen
for starved fish in the laboratory where growth rate (inthis case negative) is inversely related to temperature.There have been relatively few laboratory studies ex-amining the relationship between photoperiod andgrowth in marine fish larvae, particularly at reduced ra-tions (Johannessen et al. 2000, Puvanendran & Brown2002). Although the role of increasing photoperiod instimulation of endocrine production and growth in fishhas been recognized since the 1950s (Brett 1979), andlarval culturists routinely use long photoperiods or con-stant light to maximize growth, the role of photoperiodin larval ecology has received relatively little attention.
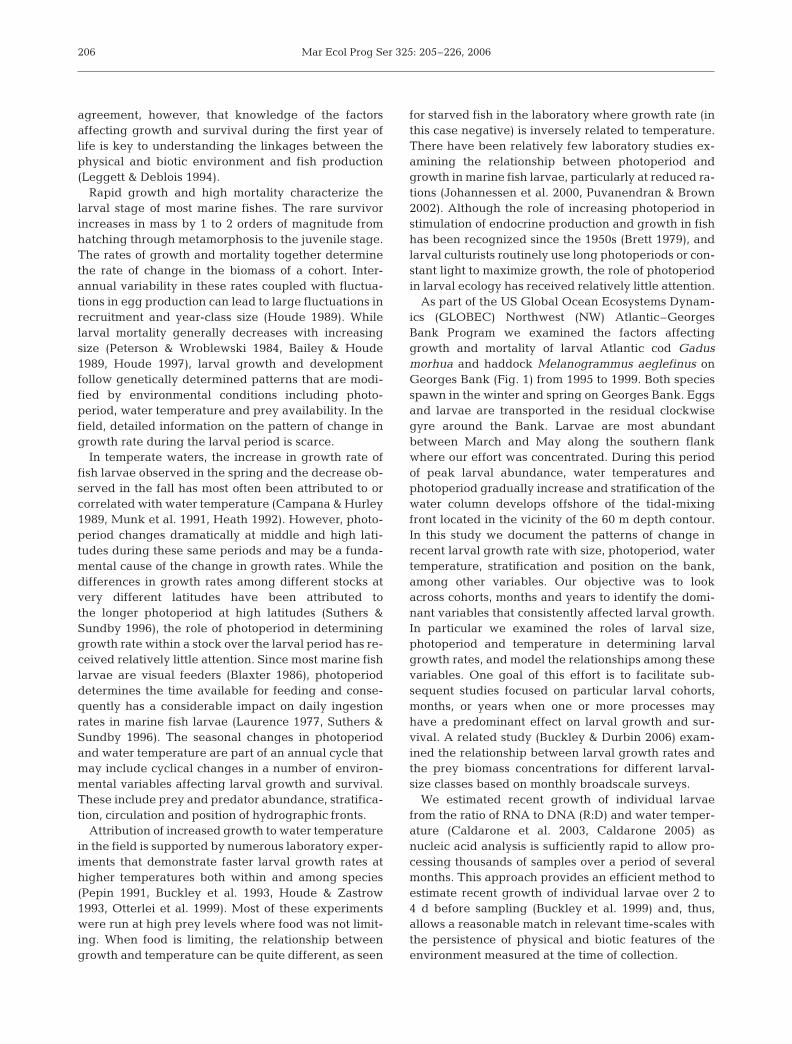
As part of the US Global Ocean Ecosystems Dynam-ics (GLOBEC) Northwest (NW) Atlantic–GeorgesBank Program we examined the factors affectinggrowth and mortality of larval Atlantic cod Gadusmorhua and haddock Melanogrammus aeglefinus onGeorges Bank (Fig. 1) from 1995 to 1999. Both speciesspawn in the winter and spring on Georges Bank. Eggsand larvae are transported in the residual clockwisegyre around the Bank. Larvae are most abundantbetween March and May along the southern flankwhere our effort was concentrated. During this periodof peak larval abundance, water temperatures andphotoperiod gradually increase and stratification of thewater column develops offshore of the tidal-mixingfront located in the vicinity of the 60 m depth contour.In this study we document the patterns of change inrecent larval growth rate with size, photoperiod, watertemperature, stratification and position on the bank,among other variables. Our objective was to lookacross cohorts, months and years to identify the domi-nant variables that consistently affected larval growth.In particular we examined the roles of larval size,photoperiod and temperature in determining larvalgrowth rates, and model the relationships among thesevariables. One goal of this effort is to facilitate sub-sequent studies focused on particular larval cohorts,months, or years when one or more processes mayhave a predominant effect on larval growth and sur-vival. A related study (Buckley & Durbin 2006) exam-ined the relationship between larval growth rates andthe prey biomass concentrations for different larval-size classes based on monthly broadscale surveys.
We estimated recent growth of individual larvaefrom the ratio of RNA to DNA (R:D) and water temper-ature (Caldarone et al. 2003, Caldarone 2005) asnucleic acid analysis is sufficiently rapid to allow pro-cessing thousands of samples over a period of severalmonths. This approach provides an efficient method toestimate recent growth of individual larvae over 2 to4 d before sampling (Buckley et al. 1999) and, thus,allows a reasonable match in relevant time-scales withthe persistence of physical and biotic features of theenvironment measured at the time of collection.
206
Buckley et al.: Cod and haddock larval growth rates
METHODS
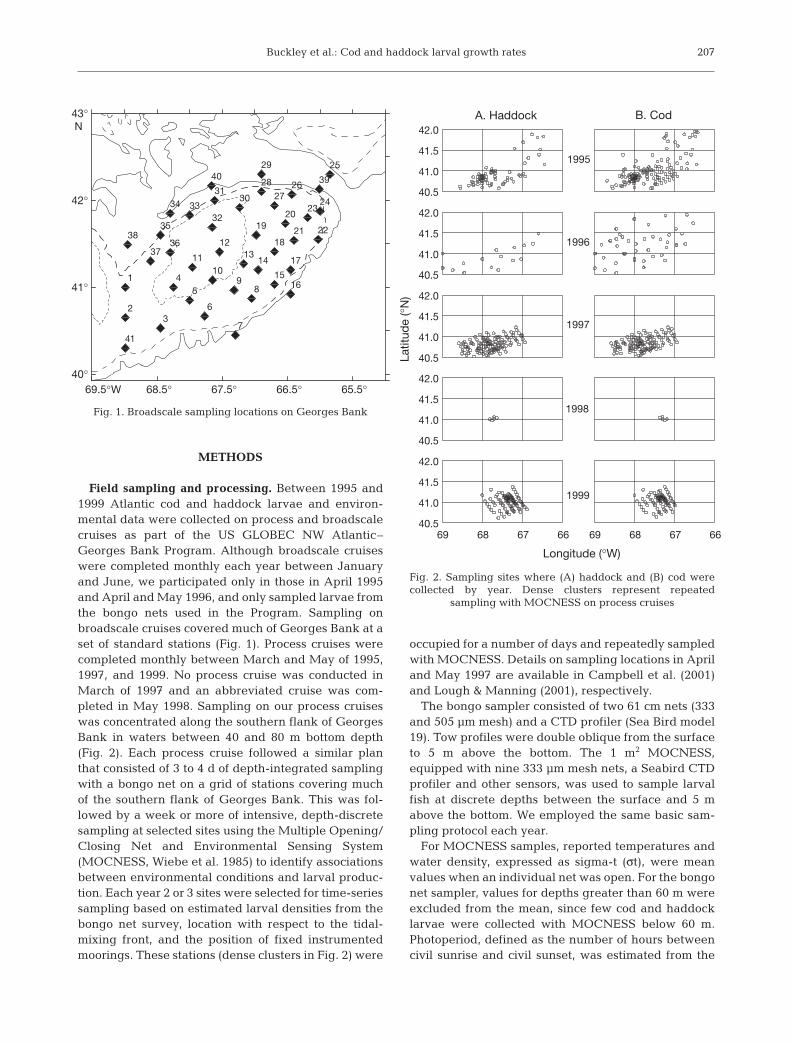
Field sampling and processing. Between 1995 and1999 Atlantic cod and haddock larvae and environ-mental data were collected on process and broadscalecruises as part of the US GLOBEC NW Atlantic–Georges Bank Program. Although broadscale cruiseswere completed monthly each year between Januaryand June, we participated only in those in April 1995and April and May 1996, and only sampled larvae fromthe bongo nets used in the Program. Sampling onbroadscale cruises covered much of Georges Bank at aset of standard stations (Fig. 1). Process cruises werecompleted monthly between March and May of 1995,1997, and 1999. No process cruise was conducted inMarch of 1997 and an abbreviated cruise was com-pleted in May 1998. Sampling on our process cruiseswas concentrated along the southern flank of GeorgesBank in waters between 40 and 80 m bottom depth(Fig. 2). Each process cruise followed a similar planthat consisted of 3 to 4 d of depth-integrated samplingwith a bongo net on a grid of stations covering muchof the southern flank of Georges Bank. This was fol-lowed by a week or more of intensive, depth-discretesampling at selected sites using the Multiple Opening/Closing Net and Environmental Sensing System(MOCNESS, Wiebe et al. 1985) to identify associationsbetween environmental conditions and larval produc-tion. Each year 2 or 3 sites were selected for time-seriessampling based on estimated larval densities from thebongo net survey, location with respect to the tidal-mixing front, and the position of fixed instrumentedmoorings. These stations (dense clusters in Fig. 2) were
occupied for a number of days and repeatedly sampledwith MOCNESS. Details on sampling locations in Apriland May 1997 are available in Campbell et al. (2001)and Lough & Manning (2001), respectively.
The bongo sampler consisted of two 61 cm nets (333and 505 µm mesh) and a CTD profiler (Sea Bird model19). Tow profiles were double oblique from the surfaceto 5 m above the bottom. The 1 m2 MOCNESS,equipped with nine 333 µm mesh nets, a Seabird CTDprofiler and other sensors, was used to sample larvalfish at discrete depths between the surface and 5 mabove the bottom. We employed the same basic sam-pling protocol each year.
For MOCNESS samples, reported temperatures andwater density, expressed as sigma-t (σt), were meanvalues when an individual net was open. For the bongonet sampler, values for depths greater than 60 m wereexcluded from the mean, since few cod and haddocklarvae were collected with MOCNESS below 60 m.Photoperiod, defined as the number of hours betweencivil sunrise and civil sunset, was estimated from the
207
69.5°W 68.5° 67.5° 66.5° 65.5° 40°
41°
42°
43° N
1
2
41
3
45
6
7
89
1011
1213
14
1516
17
18
1920
21 22
2324
25
392627
28
29
30
40
31
323334
35
3637
38
Fig. 1. Broadscale sampling locations on Georges Bank
40.5
41.0
41.5
42.0
40.5
41.0
41.5
42.0
40.5
41.0
41.5
42.0
40.5
41.0
41.5
42.0
6667686940.5
41.0
41.5
42.0
66676869
1995
1996
1997
1998
1999
A. Haddock B. Cod
Longitude (°W)
Latit
ude
(°N
)
Fig. 2. Sampling sites where (A) haddock and (B) cod werecollected by year. Dense clusters represent repeated
sampling with MOCNESS on process cruises
Mar Ecol Prog Ser 325: 205–226, 2006
date of capture using longitude 67.5°W and latitude41°N (http://aa.usno.navy.mil/data/docs/RS_OneDay.html). A stratification index (Δσt) was estimated as thedifference in density between the water at 30 to 40 mdepth and the surface 10 m (i.e. Δσt = mean σt 30–40 m– mean σt 0–10 m). An index of along-bank drift from areference line passing through the northeast peak ofGeorges Bank was derived by rotating the axes by20.2° around 41°N 68°W so that the new longitudinalaxis was approximately normal to the isobaths on thesouthern flank using the equation:
Along-bank distance = [(Long. + 68) × –60 × 0.75 × cos(5.93)] (1)
– [(Lat. – 41) × –60 × sin(5.93)] + 90
On each cruise, Atlantic cod and haddock larvaefrom one net of the bongo sampler and from selectedMOCNESS nets were sorted immediately from thecatch and frozen individually in 1.5 ml cryovials placedin the vapor phase of liquid nitrogen for later analysisof protein, RNA and DNA content (Buckley et al. 2004).To minimize the time between capture in the net andfreezing, collections for biochemical analysis weremade with the last nets tripped in a MOCNESS haul.The time between a net coming on deck and freezingof larvae in liquid nitrogen was minimized as much aspossible and, during this interval, plankton samplesand larvae were kept cold using frozen gel packs. Justbefore freezing, a video image of each larva was takenfor determination of length. Shipboard standard length(SSL) was defined as the distance in mm between thetip of the jaw and the end of the notochord recorded onthese images.
Biochemical analysis and estimation of growth rate.The RNA and DNA contents of individual larvae wereestimated using one of 2 fluorometric methods that wereintercalibrated extensively to insure the integrity of thetime series. Samples from March and April of 1995 wererun using a flow-injection analyzer and 2 fluorochromedyes, one specific for DNA (Hoechst) and the otherreactive with both nucleic acids (ethidium bromide, EB)(Caldarone & Buckley 1991). For samples collectedin May 1995 and later, we used a fluorescence mi-croplate reader and a one-dye (EB) procedure employ-ing RNase to digest RNA after an initial reading (Cal-darone et al. 2001, 2003). The average DNA/RNA sloperatio was 2.43 for this study. Protein content of individuallarvae was estimated using a colorimetric assay (bicin-choninic acid, Sigma) modified from Smith et al. (1985).
Recent growth (Gi) expressed as the instantaneousprotein-specific growth rate (d–1) was estimated foreach larva from water temperature (T; °C) and RNA:DNA ratio (R:D; dimensionless) using the equation:
Gi = –0.147 + 0.009(T) + 0.045(R:D) (2)
where R:D was estimated using the microplate tech-nique. For 1995, nucleic acid values, determined usingthe flow-injection technique, were first converted tocomparable microplate values using an equationderived from an intercalibration study of the 2 methods(Caldarone et al. 2003). Eq. (2) was derived from labo-ratory experiments with larval Atlantic cod (Caldaroneet al. 2003) and haddock (Caldarone 2005) reared at 3temperatures and 3 feeding levels plus a starvationtreatment. For the calibration experiments, Gi (d–1) wascalculated from samples taken at 4 to 7 d intervalsusing the equation:
Gi = (lnWt2 – lnWt1) × (t2 – t1)–1 (3)
where Wt1 and Wt2 were the individual protein content(µg per larva) for larvae sampled on Days t1 and t2,respectively, assuming exponential growth. Sinceprotein makes up the bulk of larval dry weight(Buckley & Lough 1987), Gi closely tracks growth indry weight through the larval period. For both codand haddock, larval dry weight is approximatelydouble the protein content.
Examination of the residuals from models relatinglarval growth rate to R:D and temperature has sug-gested that growth of yolk-sac and first feeding larvae(YSFF) is somewhat overestimated (negative residu-als) by the models; thus, the data on the youngest lar-vae had been excluded from the models (Folkvord etal. 1996, Caldarone et al. 2003, Caldarone 2005). Thenegative residuals could imply that either the RNAwas not as active or that net retention of protein wasreduced in YSFF larvae compared with older larvae.Another more likely explanation for the negativeresiduals is that growth of the embryo shortly afterhatching was underestimated in the laboratory cali-bration studies, since no distinction was madebetween larval tissue and yolk. At hatching, yolkaccounts for about 30% of the dry weight (Folkvord2005). If the protein content or dry weight of the yolkhad been excluded from values used in the growthcomputation, the relationship between R:D, tempera-ture and growth rate would likely be the same forYSFF and older larvae.
Data analysis. We divided larvae into size classesbased on protein content. The smallest larvae (≤50 µgprotein) were assigned to size class 1 (lsc 1), corre-sponding to approximately ≤4.5 mm SSL. Larvae in lsc1 were considered YSFF larvae. Larvae with a proteincontent from >50 to ≤193 µg were assigned to size class2 (lsc 2), corresponding to ~4.5 to 7 mm SSL. Most lar-vae in size class 2 would have initiated feeding andgrowth and are considered preflexion larvae (Lough etal. 1996). Larvae with a protein content from >193 to≤1200 µg were assigned to size class 3 (lsc 3), corre-sponding to ~7 to 12 mm SSL. Larger larvae in this size
208
Buckley et al.: Cod and haddock larval growth rates
class would be approaching metamorphosis. Fish witha protein content >1200 µg would have completedmetamorphosis into pelagic juveniles and were notincluded in subsequent analyses, since the relationshipamong R:D, water temperature and growth rate hasnot been calibrated for this size class.
The data were analyzed and statistics performedusing SAS software (SAS Institute 2001). We used 3data sets. The first contained a record for each individ-ual larva ≤1200 µg protein (IF) in size, the second con-sisted of net means (NM), and the third was net meansby larval size class (NMLSC). The general approachwas to first use all the data for individual larvae (IF) toexplore the relationships among recent growth rate,larval size, photoperiod, water temperature, and day ofthe year (year day). Next, generalized additive models(GAMs) were used to remove the ontogenetic and sea-sonal trends and to generate a set of growth rate resid-uals (rGi) for individual larva. Averaging all variablesby net gave the data set NM. Averaging by net and lar-val size class (lsc) yielded the data set NMLSC. In thisdata set an observation is the average for all larvae in aparticular net in a particular size class. We then usedthe data sets NM and NMLSC to examine the effects ofother environmental variables (including temperature)on rGi. We used net means for this purpose rather thandata on individual larva to avoid problems related topseudoreplication, since all larvae collected in a givennet were associated with a single set of environmentalobservations.
A set of temperature residuals (rT) for each specieswas produced by subtracting the long-term mean sur-face (0 to 30 m) water temperature for a given year dayfrom the observed water temperature when a net wasopen. The long-term mean surface water temperatureswere obtained from the annual cycle of temperature onthe southern flank of Georges Bank based on hydro-graphic measurements made on more than 200 cruisesbetween 1978 and 2005 (D. Mountain pers comm).
Analysis of ontogenetic and seasonal trends. Avisual examination of the data (x-y plots) revealedstrong seasonal trends in larval size, growth rate andsome of the environmental variables, as well as a rela-tionship between larval size and growth rate. Toexplore these trends we used both linear regressionanalysis and GAMs. The data were fit using the SASREG procedure for linear regression analysis and theSAS GAM procedure for nonparametric regression.The GAMs avoid the necessity of making assumptionsrelative to the form or shape of the relationships amongvariables. One disadvantage of GAMs is that they donot provide output for a model with established para-meters, although predicted values and residuals canbe obtained. After examining different values for de-grees of freedom (df), we chose 4 df in the models to
allow for sufficient flexibility in shape without exces-sive data chasing. Growth rates for each species (IFdata set) were fit to the model:Gi = spline (protein content, df = 4)
spline (environmental variable, df = 4) (4)
where the environmental variable was either year day,photoperiod or temperature. A set of residual growthrates (rGi) was produced using photoperiod as theenvironmental variable. Photoperiod was selected overyear day because of the importance of photoperiod todaily ration and to make the model more generallyapplicable to Atlantic cod and haddock populationsoccurring over a wide range of latitudes in the NorthAtlantic Ocean. Photoperiod was chosen over temper-ature since it explained slightly more of the observedvariability in growth rate.
Stepwise linear regression analysis was completedon the IF data set using the model:
Gi = temperature photoperiod ln(protein) (5)
with forward selection. Correlation analysis was com-pleted using the NM data set. The correlationsbetween photoperiod and temperature, photoperiodand growth, and temperature and growth were usedin path analysis for a 3 variable model (Pedhazur1997). Path analysis is a special case of structuralequation models. Since photoperiod can affect tem-perature but temperature cannot affect photoperiod,photoperiod was treated as an extrinsic variable andtemperature was treated as an endogenous (depen-dent) variable.
Analysis of inter-annual variability. Statisticalanalysis of differences among years was limited to theyears 1995, 1997 and 1999. This was done becauseeffort and sample sizes were much greater duringthese years compared with either 1996 or 1998. Datafor individual larvae containing ≤1200 µg proteinlarva–1 or ~12 mm SSL (IF data set) were fit to theequation:
Gi = [m1 × ln(Pro)] + [m2 × PP] + C (6)
where Pro is the protein content in µg larva–1, PP is thephotoperiod in h, m1 and m2 are regression coeffi-cients and C is a constant. Separate equations werederived for each year. Daily growth curves for larvaehatched on April 1 (year day 91) of each year werethen produced assuming exponential growth and asize at hatch of 23 µg protein excluding yolk.
Following literature precedents (Ricker 1979, Cam-pana & Hurley 1989, Buckley et al. 2004) the relation-ship between recent growth and water temperaturewas fit to a quadratic parabola:
Gi = Gmax + [k × (T – Topt)2] (7)
209
Mar Ecol Prog Ser 325: 205–226, 2006
where Gmax is the maximum growth rate at the opti-mum water temperature for growth (Topt), k is alwaysnegative, and T is the temperature. Net means wereused in the analysis (dataset NM).
Differences in growth rate among years were evalu-ated for lsc 2 and lsc 3 using ANOVA with the NMLSCdata set. Both specific growth rate and rGi were consid-ered. Growth residuals were used in part to control forthe size of larvae and the timing of cruises that differedamong years. The first model examined was:
Gi = month year lsc (8)
with interactions. However, since there was no processcruise in March 1997 and due to significant interac-tions among main effects (year, month and lsc), sepa-rate analyses were run for each month and size class.
RESULTS
Sampling effort and consequently larval catches(Table 1) were greatest in the GLOBEC process-study
years (1995, 1997 and 1999). Waters yielding larvalAtlantic cod and haddock differed in temperature andsalinity among the 3 primary sampling years. DuringApril and May, mean water temperatures were highestin 1999 and lowest in 1997. Salinity was highest in1995 and lowest in 1997. An examination of residualwater temperature (rT) confirmed that 1997 was thecoldest of the 3 process years and 1999 the warmest(during April and May).
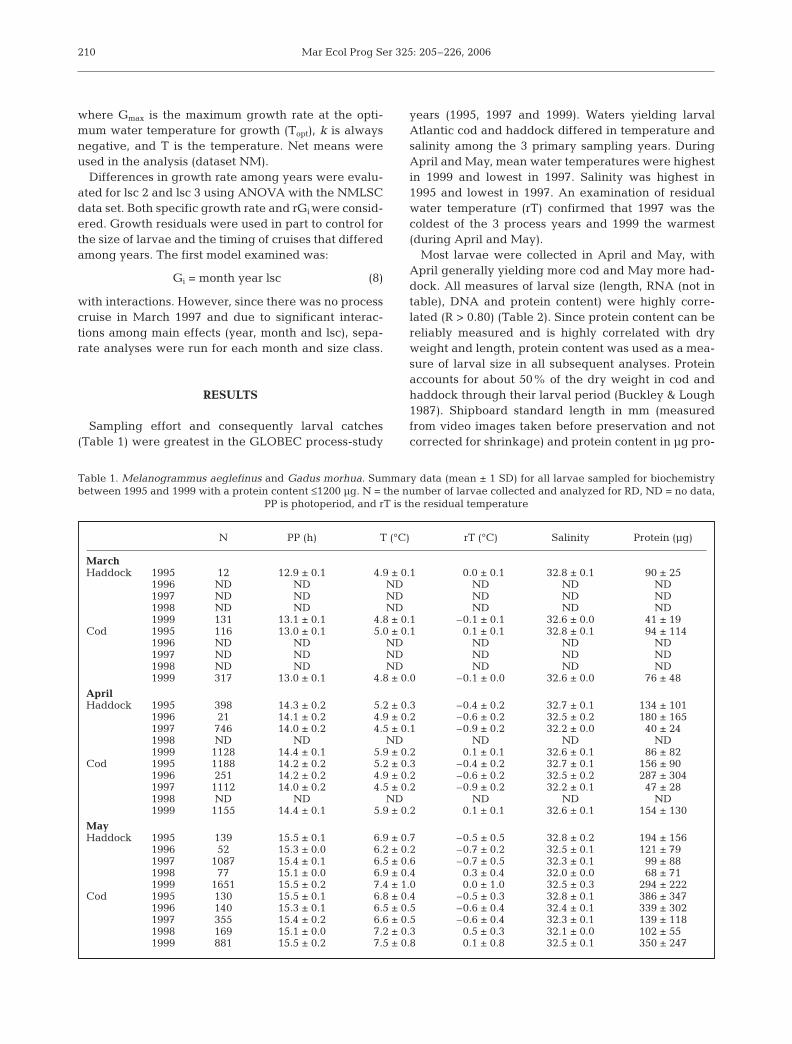
Most larvae were collected in April and May, withApril generally yielding more cod and May more had-dock. All measures of larval size (length, RNA (not intable), DNA and protein content) were highly corre-lated (R > 0.80) (Table 2). Since protein content can bereliably measured and is highly correlated with dryweight and length, protein content was used as a mea-sure of larval size in all subsequent analyses. Proteinaccounts for about 50% of the dry weight in cod andhaddock through their larval period (Buckley & Lough1987). Shipboard standard length in mm (measuredfrom video images taken before preservation and notcorrected for shrinkage) and protein content in µg pro-
210
N PP (h) T (°C) rT (°C) Salinity Protein (µg)
MarchHaddock 1995 12 12.9 ± 0.1 4.9 ± 0.1 0.0 ± 0.1 32.8 ± 0.1 90 ± 25
1996 ND ND ND ND ND ND1997 ND ND ND ND ND ND1998 ND ND ND ND ND ND1999 131 13.1 ± 0.1 4.8 ± 0.1 –0.1 ± 0.1 32.6 ± 0.0 41 ± 19
Cod 1995 116 13.0 ± 0.1 5.0 ± 0.1 0.1 ± 0.1 32.8 ± 0.1 94 ± 1141996 ND ND ND ND ND ND1997 ND ND ND ND ND ND1998 ND ND ND ND ND ND1999 317 13.0 ± 0.1 4.8 ± 0.0 –0.1 ± 0.0 32.6 ± 0.0 76 ± 48
AprilHaddock 1995 398 14.3 ± 0.2 5.2 ± 0.3 –0.4 ± 0.2 32.7 ± 0.1 134 ± 101
1996 21 14.1 ± 0.2 4.9 ± 0.2 –0.6 ± 0.2 32.5 ± 0.2 180 ± 1651997 746 14.0 ± 0.2 4.5 ± 0.1 –0.9 ± 0.2 32.2 ± 0.0 40 ± 241998 ND ND ND ND ND ND1999 1128 14.4 ± 0.1 5.9 ± 0.2 0.1 ± 0.1 32.6 ± 0.1 86 ± 82
Cod 1995 1188 14.2 ± 0.2 5.2 ± 0.3 –0.4 ± 0.2 32.7 ± 0.1 156 ± 90x1996 251 14.2 ± 0.2 4.9 ± 0.2 –0.6 ± 0.2 32.5 ± 0.2 287 ± 3041997 1112 14.0 ± 0.2 4.5 ± 0.2 –0.9 ± 0.2 32.2 ± 0.1 47 ± 281998 ND ND ND ND ND ND1999 1155 14.4 ± 0.1 5.9 ± 0.2 0.1 ± 0.1 32.6 ± 0.1 154 ± 130
MayHaddock 1995 139 15.5 ± 0.1 6.9 ± 0.7 –0.5 ± 0.5 32.8 ± 0.2 194 ± 156
1996 52 15.3 ± 0.0 6.2 ± 0.2 –0.7 ± 0.2 32.5 ± 0.1 121 ± 79x1997 1087 15.4 ± 0.1 6.5 ± 0.6 –0.7 ± 0.5 32.3 ± 0.1 99 ± 881998 77 15.1 ± 0.0 6.9 ± 0.4 0.3 ± 0.4 32.0 ± 0.0 68 ± 711999 1651 15.5 ± 0.2 7.4 ± 1.0 0.0 ± 1.0 32.5 ± 0.3 294 ± 222
Cod 1995 130 15.5 ± 0.1 6.8 ± 0.4 –0.5 ± 0.3 32.8 ± 0.1 386 ± 3471996 140 15.3 ± 0.1 6.5 ± 0.5 –0.6 ± 0.4 32.4 ± 0.1 339 ± 3021997 355 15.4 ± 0.2 6.6 ± 0.5 –0.6 ± 0.4 32.3 ± 0.1 139 ± 1181998 169 15.1 ± 0.0 7.2 ± 0.3 0.5 ± 0.3 32.1 ± 0.0 102 ± 55x1999 881 15.5 ± 0.2 7.5 ± 0.8 0.1 ± 0.8 32.5 ± 0.1 350 ± 247
Table 1. Melanogrammus aeglefinus and Gadus morhua. Summary data (mean ± 1 SD) for all larvae sampled for biochemistrybetween 1995 and 1999 with a protein content ≤1200 µg. N = the number of larvae collected and analyzed for RD, ND = no data,
PP is photoperiod, and rT is the residual temperature
Buckley et al.: Cod and haddock larval growth rates
tein larva–1 (Pro) were related according to the follow-ing equations:
SSLcod = 1.308(Pro)0.315 n = 5920 R2 = 0.91 (9)
SSLhad = 1.237(Pro)0.324 n = 5403 R2 = 0.92 (10)
Ontogenetic and seasonal trends
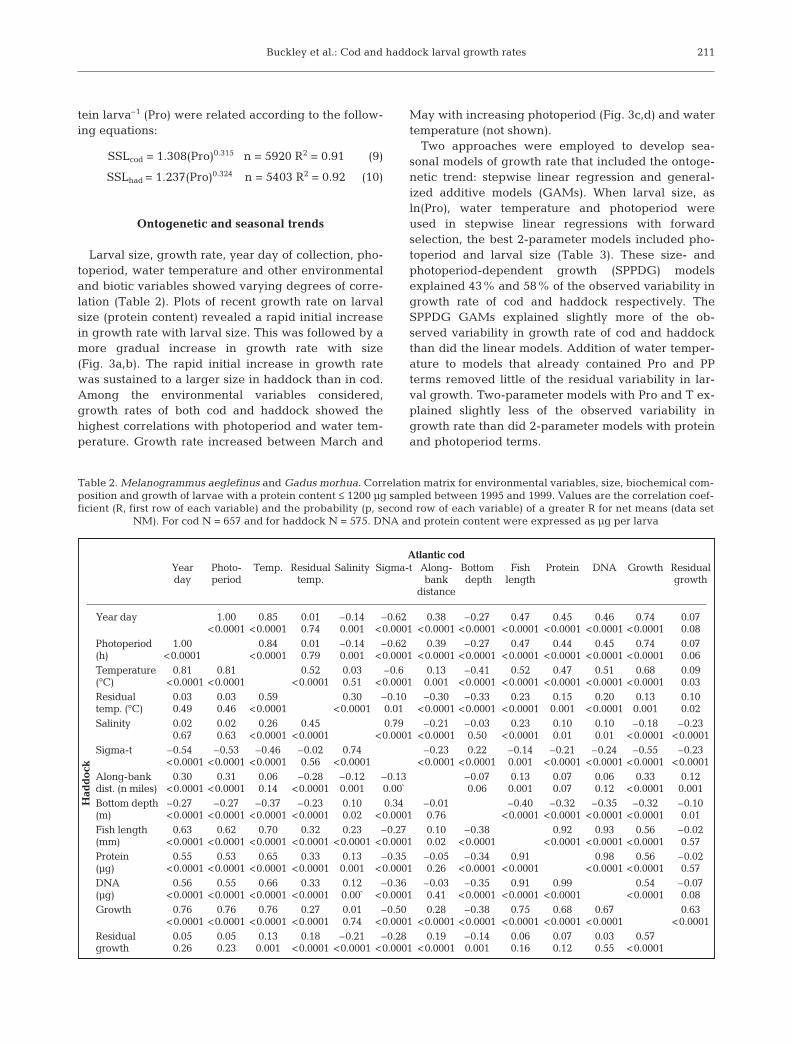
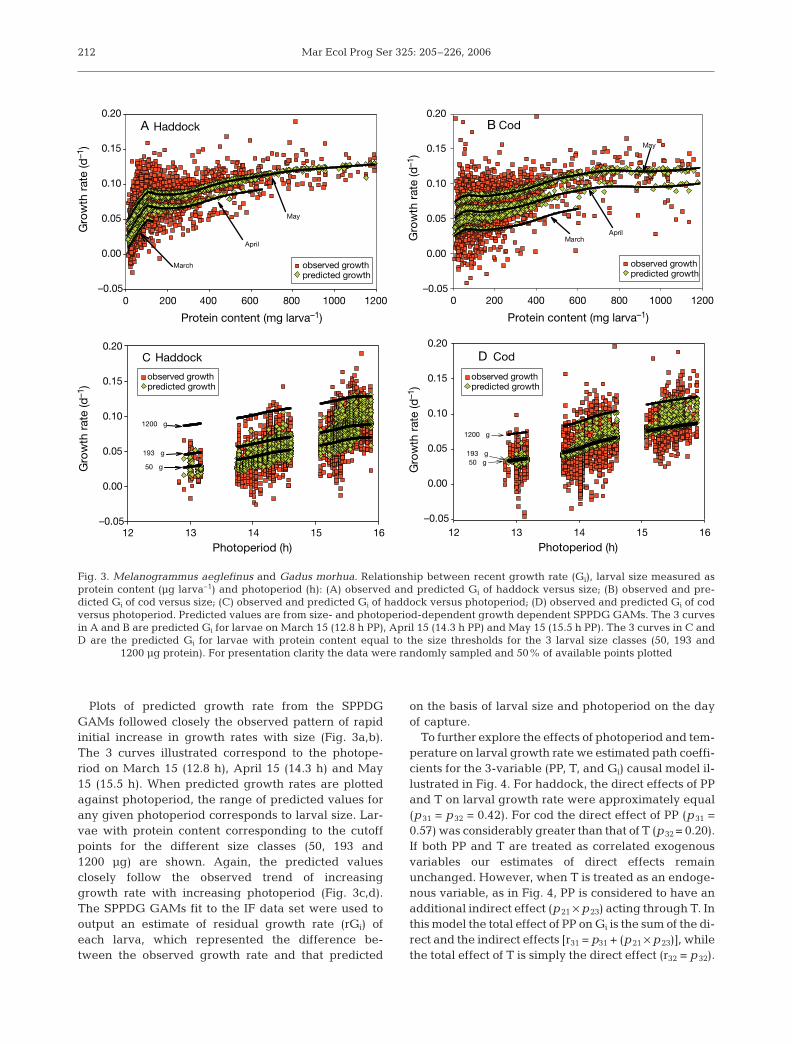
Larval size, growth rate, year day of collection, pho-toperiod, water temperature and other environmentaland biotic variables showed varying degrees of corre-lation (Table 2). Plots of recent growth rate on larvalsize (protein content) revealed a rapid initial increasein growth rate with larval size. This was followed by amore gradual increase in growth rate with size(Fig. 3a,b). The rapid initial increase in growth ratewas sustained to a larger size in haddock than in cod.Among the environmental variables considered,growth rates of both cod and haddock showed thehighest correlations with photoperiod and water tem-perature. Growth rate increased between March and
May with increasing photoperiod (Fig. 3c,d) and watertemperature (not shown).
Two approaches were employed to develop sea-sonal models of growth rate that included the ontoge-netic trend: stepwise linear regression and general-ized additive models (GAMs). When larval size, asln(Pro), water temperature and photoperiod wereused in stepwise linear regressions with forwardselection, the best 2-parameter models included pho-toperiod and larval size (Table 3). These size- andphotoperiod-dependent growth (SPPDG) modelsexplained 43% and 58% of the observed variability ingrowth rate of cod and haddock respectively. TheSPPDG GAMs explained slightly more of the ob-served variability in growth rate of cod and haddockthan did the linear models. Addition of water temper-ature to models that already contained Pro and PPterms removed little of the residual variability in lar-val growth. Two-parameter models with Pro and T ex-plained slightly less of the observed variability ingrowth rate than did 2-parameter models with proteinand photoperiod terms.
211
Atlantic codYear Photo- Temp. Residual Salinity Sigma-t Along- Bottom Fish Protein DNA Growth Residual day period temp. bank depth length growth
distance
Year day 1.00 0.85 0.01 –0.14 –0.62 0.38 –0.27 0.47 0.45 0.46 0.74 0.07<0.0001 <0.0001 0.74 0.001 <0.0001 <0.0001 <0.0001 <0.0001 <0.0001 <0.0001 <0.0001 0.08
Photoperiod 1.00 0.84 0.01 –0.14 –0.62 0.39 –0.27 0.47 0.44 0.45 0.74 0.07(h) <0.0001 <0.0001 0.79 0.001 <0.0001 <0.0001 <0.0001 <0.0001 <0.0001 <0.0001 <0.0001 0.06Temperature 0.81 0.81 0.52 0.03 –0.6 0.13 –0.41 0.52 0.47 0.51 0.68 0.09(°C) <0.0001 <0.0001 <0.0001 0.51 <0.0001 0.001 <0.0001 <0.0001 <0.0001 <0.0001 <0.0001 0.03Residual 0.03 0.03 0.59 0.30 –0.10 –0.30 –0.33 0.23 0.15 0.20 0.13 0.10temp. (°C) 0.49 0.46 <0.0001 <0.0001 0.01 <0.0001 <0.0001 <0.0001 0.001 <0.0001 0.001 0.02Salinity 0.02 0.02 0.26 0.45 0.79 –0.21 –0.03 0.23 0.10 0.10 –0.18 –0.23
0.67 0.63 <0.0001 <0.0001 <0.0001 <0.0001 0.50 <0.0001 0.01 0.01 <0.0001 <0.0001Sigma-t –0.54x –0.53 –0.46 –0.02 0.74 –0.23 0.22 –0.14 –0.21 –0.24 –0.55 –0.23
<0.0001 <0.0001 <0.0001 0.56 <0.0001 <0.0001 <0.0001 0.001 <0.0001 <0.0001 <0.0001 <0.0001Along-bank 0.30 0.31 0.06 –0.28 –0.12 –0.13 –0.07 0.13 0.07 0.06 0.33 0.12dist. (n miles) <0.0001 <0.0001 0.14 <0.0001 0.001 0.00` 0.06 0.001 0.07 0.12 <0.0001 0.001Bottom depth –0.27x –0.27 –0.37 –0.23 0.10 0.34 –0.01 –0.40 –0.32 –0.35 –0.32 –0.10(m) <0.0001 <0.0001 <0.0001 <0.0001 0.02 <0.0001 0.76 <0.0001 <0.0001 <0.0001 <0.0001 0.01Fish length 0.63 0.62 0.70 0.32 0.23 –0.27 0.10 –0.38 0.92 0.93 0.56 –0.02(mm) <0.0001 <0.0001 <0.0001 <0.0001 <0.0001 <0.0001 0.02 <0.0001 <0.0001 <0.0001 <0.0001 0.57Protein 0.55 0.53 0.65 0.33 0.13 –0.35 –0.05 –0.34 0.91 0.98 0.56 –0.02(µg) <0.0001 <0.0001 <0.0001 <0.0001 0.001 <0.0001 0.26 <0.0001 <0.0001 <0.0001 <0.0001 0.57DNA 0.56 0.55 0.66 0.33 0.12 –0.36 –0.03 –0.35 0.91 0.99 0.54 –0.07(µg) <0.0001 <0.0001 <0.0001 <0.0001 0.00` <0.0001 0.41 <0.0001 <0.0001 <0.0001 <0.0001 0.08Growth 0.76 0.76 0.76 0.27 0.01 –0.50 0.28 –0.38 0.75 0.68 0.67 0.63
<0.0001 <0.0001 <0.0001 <0.0001 0.74 <0.0001 <0.0001 <0.0001 <0.0001 <0.0001 <0.0001 <0.0001Residual 0.05 0.05 0.13 0.18 –0.21 –0.28 0.19 –0.14 0.06 0.07 0.03 0.57growth 0.26 0.23 0.001 <0.0001 <0.0001 <0.0001 <0.0001 0.001 0.16 0.12 0.55 <0.0001
Table 2. Melanogrammus aeglefinus and Gadus morhua. Correlation matrix for environmental variables, size, biochemical com-position and growth of larvae with a protein content ≤ 1200 µg sampled between 1995 and 1999. Values are the correlation coef-ficient (R, first row of each variable) and the probability (p, second row of each variable) of a greater R for net means (data set
NM). For cod N = 657 and for haddock N = 575. DNA and protein content were expressed as µg per larva
Had
do
ck
Mar Ecol Prog Ser 325: 205–226, 2006
Plots of predicted growth rate from the SPPDGGAMs followed closely the observed pattern of rapidinitial increase in growth rates with size (Fig. 3a,b).The 3 curves illustrated correspond to the photope-riod on March 15 (12.8 h), April 15 (14.3 h) and May15 (15.5 h). When predicted growth rates are plottedagainst photoperiod, the range of predicted values forany given photoperiod corresponds to larval size. Lar-vae with protein content corresponding to the cutoffpoints for the different size classes (50, 193 and1200 µg) are shown. Again, the predicted valuesclosely follow the observed trend of increasinggrowth rate with increasing photoperiod (Fig. 3c,d).The SPPDG GAMs fit to the IF data set were used tooutput an estimate of residual growth rate (rGi) ofeach larva, which represented the difference be-tween the observed growth rate and that predicted
on the basis of larval size and photoperiod on the dayof capture.
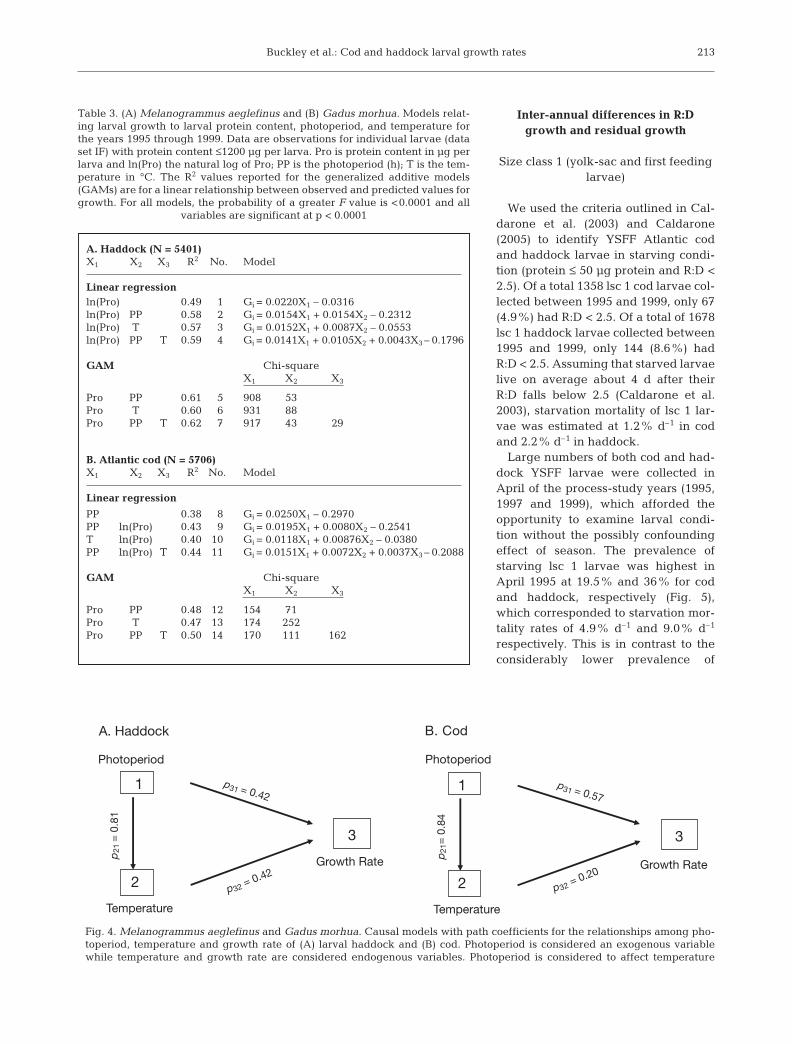
To further explore the effects of photoperiod and tem-perature on larval growth rate we estimated path coeffi-cients for the 3-variable (PP, T, and Gi) causal model il-lustrated in Fig. 4. For haddock, the direct effects of PPand T on larval growth rate were approximately equal(p31 = p32 = 0.42). For cod the direct effect of PP (p31 =0.57) was considerably greater than that of T (p32 = 0.20).If both PP and T are treated as correlated exogenousvariables our estimates of direct effects remainunchanged. However, when T is treated as an endoge-nous variable, as in Fig. 4, PP is considered to have anadditional indirect effect (p21 × p23) acting through T. Inthis model the total effect of PP on Gi is the sum of the di-rect and the indirect effects [r31 = p31 + (p21 × p23)], whilethe total effect of T is simply the direct effect (r32 = p32).
212
CodD
Photoperiod (h)12 13 14 15 16
HaddockC
50 µg
193 µg
1200 µg
Protein content (mg larva–1)
0 200 400 600 800 1000 1200
Gro
wth
rat
e (d
–1)
–0.05
0.00
0.05
0.10
0.15
0.20
observed growthpredicted growth
March
April
May
A Haddock
MarchApril
May
B Cod
Gro
wth
rat
e (d
–1)
Gro
wth
rat
e (d
–1)
Gro
wth
rat
e (d
–1)
Protein content (mg larva–1)
0 200 400 600 800 1000 1200
observed growthpredicted growth
observed growthpredicted growth
observed growthpredicted growth
–0.05
0.00
0.05
0.10
0.15
0.20
–0.05
0.00
0.05
0.10
0.15
0.20
–0.05
0.00
0.05
0.10
0.15
0.20
Photoperiod (h)12 13 14 15 16
50 µg193 µg
1200 µg
Fig. 3. Melanogrammus aeglefinus and Gadus morhua. Relationship between recent growth rate (Gi), larval size measured asprotein content (µg larva–1) and photoperiod (h): (A) observed and predicted Gi of haddock versus size; (B) observed and pre-dicted Gi of cod versus size; (C) observed and predicted Gi of haddock versus photoperiod; (D) observed and predicted Gi of codversus photoperiod. Predicted values are from size- and photoperiod-dependent growth dependent SPPDG GAMs. The 3 curvesin A and B are predicted Gi for larvae on March 15 (12.8 h PP), April 15 (14.3 h PP) and May 15 (15.5 h PP). The 3 curves in C andD are the predicted Gi for larvae with protein content equal to the size thresholds for the 3 larval size classes (50, 193 and
1200 µg protein). For presentation clarity the data were randomly sampled and 50% of available points plotted
Buckley et al.: Cod and haddock larval growth rates
Inter-annual differences in R:Dgrowth and residual growth
Size class 1 (yolk-sac and first feedinglarvae)
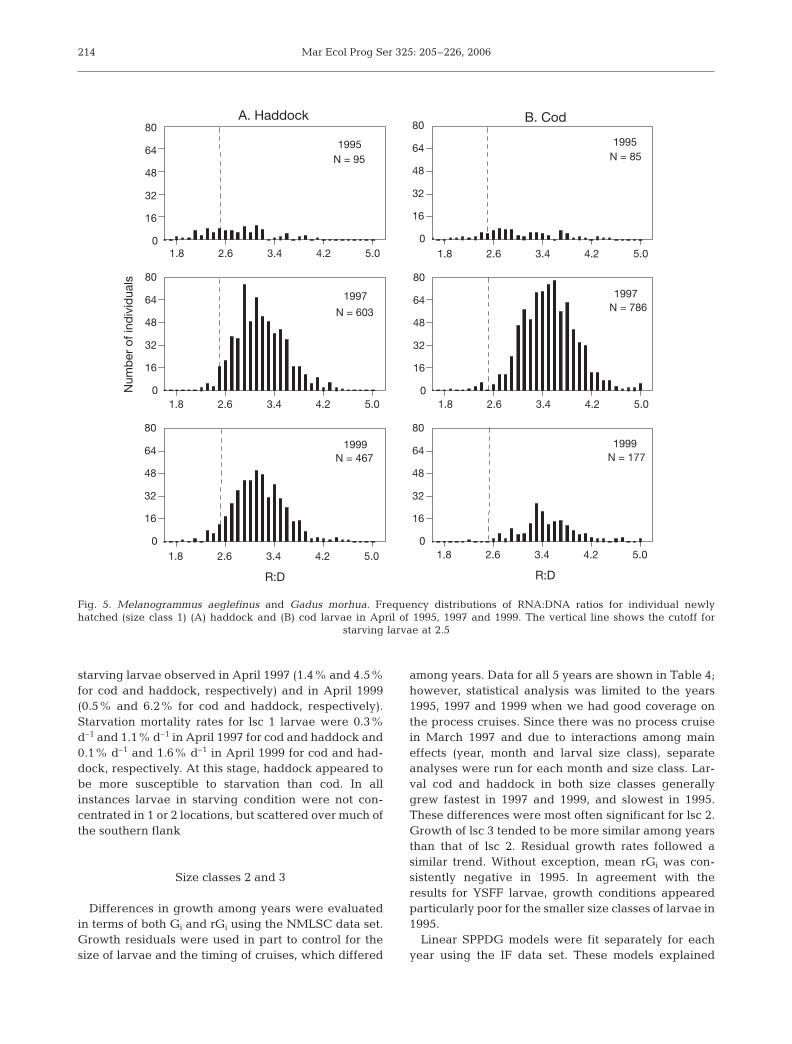
We used the criteria outlined in Cal-darone et al. (2003) and Caldarone(2005) to identify YSFF Atlantic codand haddock larvae in starving condi-tion (protein ≤ 50 µg protein and R:D <2.5). Of a total 1358 lsc 1 cod larvae col-lected between 1995 and 1999, only 67(4.9%) had R:D < 2.5. Of a total of 1678lsc 1 haddock larvae collected between1995 and 1999, only 144 (8.6%) hadR:D < 2.5. Assuming that starved larvaelive on average about 4 d after theirR:D falls below 2.5 (Caldarone et al.2003), starvation mortality of lsc 1 lar-vae was estimated at 1.2% d–1 in codand 2.2% d–1 in haddock.
Large numbers of both cod and had-dock YSFF larvae were collected inApril of the process-study years (1995,1997 and 1999), which afforded theopportunity to examine larval condi-tion without the possibly confoundingeffect of season. The prevalence ofstarving lsc 1 larvae was highest inApril 1995 at 19.5% and 36% for codand haddock, respectively (Fig. 5),which corresponded to starvation mor-tality rates of 4.9% d–1 and 9.0% d–1
respectively. This is in contrast to theconsiderably lower prevalence of
213
A. Haddock (N = 5401)X1 X2 X3 R2 No. Model
Linear regressionln(Pro) 0.49 1 Gi = 0.0220X1 – 0.0316ln(Pro) PP 0.58 2 Gi = 0.0154X1 + 0.0154X2 – 0.2312ln(Pro) T 0.57 3 Gi = 0.0152X1 + 0.0087X2 – 0.0553ln(Pro) PP T 0.59 4 Gi = 0.0141X1 + 0.0105X2 + 0.0043X3 – 0.1796
GAM Chi-squareX1 X2 X3
Pro PP 0.61 5 908 53Pro T 0.60 6 931 88Pro PP T 0.62 7 917 43 29
B. Atlantic cod (N = 5706)X1 X2 X3 R2 No. Model
Linear regression
PP 0.38 8 Gi = 0.0250X1 – 0.2970PP ln(Pro) 0.43 9 Gi = 0.0195X1 + 0.0080X2 – 0.2541T ln(Pro) 0.40 10 Gi = 0.0118X1 + 0.00876X2 – 0.0380PP ln(Pro) T 0.44 11 Gi = 0.0151X1 + 0.0072X2 + 0.0037X3 – 0.2088
GAM Chi-squareX1 X2 X3
Pro PP 0.48 12 154 71Pro T 0.47 13 174 252Pro PP T 0.50 14 170 111 162
Table 3. (A) Melanogrammus aeglefinus and (B) Gadus morhua. Models relat-ing larval growth to larval protein content, photoperiod, and temperature forthe years 1995 through 1999. Data are observations for individual larvae (dataset IF) with protein content ≤1200 µg per larva. Pro is protein content in µg perlarva and ln(Pro) the natural log of Pro; PP is the photoperiod (h); T is the tem-perature in °C. The R2 values reported for the generalized additive models(GAMs) are for a linear relationship between observed and predicted values forgrowth. For all models, the probability of a greater F value is <0.0001 and all
variables are significant at p < 0.0001
Growth Rate Growth Rate
A. Haddock
Photoperiod
Temperature
1
2
3
p32 = 0.42
p31 = 0.42
B. Cod
Photoperiod
Temperature
1
2
3
p21
= 0
.84
p32 = 0.20
p31 = 0.57
p21
= 0
.81
Fig. 4. Melanogrammus aeglefinus and Gadus morhua. Causal models with path coefficients for the relationships among pho-toperiod, temperature and growth rate of (A) larval haddock and (B) cod. Photoperiod is considered an exogenous variablewhile temperature and growth rate are considered endogenous variables. Photoperiod is considered to affect temperature
Mar Ecol Prog Ser 325: 205–226, 2006
starving larvae observed in April 1997 (1.4% and 4.5%for cod and haddock, respectively) and in April 1999(0.5% and 6.2% for cod and haddock, respectively).Starvation mortality rates for lsc 1 larvae were 0.3%d–1 and 1.1% d–1 in April 1997 for cod and haddock and0.1% d–1 and 1.6% d–1 in April 1999 for cod and had-dock, respectively. At this stage, haddock appeared tobe more susceptible to starvation than cod. In allinstances larvae in starving condition were not con-centrated in 1 or 2 locations, but scattered over much ofthe southern flank
Size classes 2 and 3
Differences in growth among years were evaluatedin terms of both Gi and rGi using the NMLSC data set.Growth residuals were used in part to control for thesize of larvae and the timing of cruises, which differed
among years. Data for all 5 years are shown in Table 4;however, statistical analysis was limited to the years1995, 1997 and 1999 when we had good coverage onthe process cruises. Since there was no process cruisein March 1997 and due to interactions among maineffects (year, month and larval size class), separateanalyses were run for each month and size class. Lar-val cod and haddock in both size classes generallygrew fastest in 1997 and 1999, and slowest in 1995.These differences were most often significant for lsc 2.Growth of lsc 3 tended to be more similar among yearsthan that of lsc 2. Residual growth rates followed asimilar trend. Without exception, mean rGi was con-sistently negative in 1995. In agreement with theresults for YSFF larvae, growth conditions appearedparticularly poor for the smaller size classes of larvae in1995.
Linear SPPDG models were fit separately for eachyear using the IF data set. These models explained
214
1.8 2.6 3.4 4.2 5.00
16
32
48
64
80N
umb
er o
f ind
ivid
uals
N = 95 N = 85
N = 786N = 603
N = 467 N = 177
1995
1997
1999
1995
1997
1999
A. Haddock B. Cod
R:D R:D
0
16
32
48
64
80
0
16
32
48
64
80
0
16
32
48
64
80
0
16
32
48
64
80
0
16
32
48
64
80
1.8 2.6 3.4 4.2 5.0
1.8 2.6 3.4 4.2 5.0
1.8 2.6 3.4 4.2 5.0
1.8 2.6 3.4 4.2 5.0
1.8 2.6 3.4 4.2 5.0
Fig. 5. Melanogrammus aeglefinus and Gadus morhua. Frequency distributions of RNA:DNA ratios for individual newlyhatched (size class 1) (A) haddock and (B) cod larvae in April of 1995, 1997 and 1999. The vertical line shows the cutoff for
starving larvae at 2.5
Buckley et al.: Cod and haddock larval growth rates
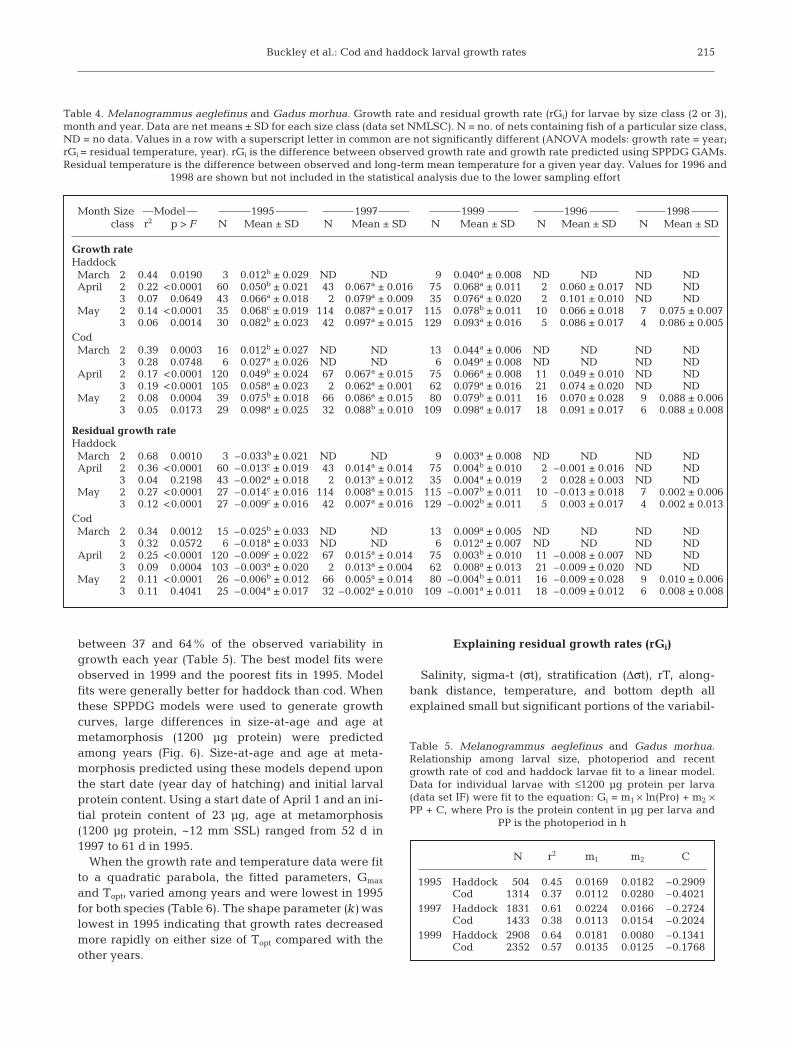
between 37 and 64% of the observed variability ingrowth each year (Table 5). The best model fits wereobserved in 1999 and the poorest fits in 1995. Modelfits were generally better for haddock than cod. Whenthese SPPDG models were used to generate growthcurves, large differences in size-at-age and age atmetamorphosis (1200 µg protein) were predictedamong years (Fig. 6). Size-at-age and age at meta-morphosis predicted using these models depend uponthe start date (year day of hatching) and initial larvalprotein content. Using a start date of April 1 and an ini-tial protein content of 23 µg, age at metamorphosis(1200 µg protein, ~12 mm SSL) ranged from 52 d in1997 to 61 d in 1995.
When the growth rate and temperature data were fitto a quadratic parabola, the fitted parameters, Gmax
and Topt, varied among years and were lowest in 1995for both species (Table 6). The shape parameter (k) waslowest in 1995 indicating that growth rates decreasedmore rapidly on either size of Topt compared with theother years.
Explaining residual growth rates (rGi)
Salinity, sigma-t (σt), stratification (Δσt), rT, along-bank distance, temperature, and bottom depth allexplained small but significant portions of the variabil-
215
Month Size Model 1995 1997 1999 1996 1998class r2 p > F N Mean ± SD N Mean ± SD N Mean ± SD N Mean ± SD N Mean ± SD
Growth rateHaddockMarch 2 0.44 0.0190 3 0.012b ± 0.029 ND ND 9 0.040a ± 0.008 ND ND ND NDApril 2 0.22 <0.0001 60 0.050b ± 0.021 43 0.067a ± 0.016 75 0.068a ± 0.011 2 0.060 ± 0.017 ND ND
3 0.07 0.0649 43 0.066a ± 0.018 2 0.079a ± 0.009 35 0.076a ± 0.020 2 0.101 ± 0.010 ND NDMay 2 0.14 <0.0001 35 0.068c ± 0.019 114x 0.087a ± 0.017 115x 0.078b ± 0.011 10 0.066 ± 0.018 7 0.075 ± 0.007
3 0.06 0.0014 30 0.082b ± 0.023 42 0.097a ± 0.015 129x 0.093a ± 0.016 5 0.086 ± 0.017 4 0.086 ± 0.005CodMarch 2 0.39 0.0003 16 0.012b ± 0.027 ND ND 13 0.044a ± 0.006 ND ND ND ND
3 0.28 0.0748 6 0.027a ± 0.026 ND ND 6 0.049a ± 0.008 ND ND ND NDApril 2 0.17 <0.0001 120x 0.049b ± 0.024 67 0.067a ± 0.015 75 0.066a ± 0.008 11 0.049 ± 0.010 ND ND
3 0.19 <0.0001 105x 0.058a ± 0.023 2 0.062a ± 0.001 62 0.079a ± 0.016 21 0.074 ± 0.020 ND NDMay 2 0.08 0.0004 39 0.075b ± 0.018 66 0.086a ± 0.015 80 0.079b ± 0.011 16 0.070 ± 0.028 9 0.088 ± 0.006
3 0.05 0.0173 29 0.098a ± 0.025 32 0.088b ± 0.010 109x 0.098a ± 0.017 18 0.091 ± 0.017 6 0.088 ± 0.008
Residual growth rateHaddockMarch 2 0.68 0.0010 3 –0.033b ± 0.021 ND ND 9 0.003a ± 0.008 ND ND ND NDApril 2 0.36 <0.0001 60 –0.013c ± 0.019 43 0.014a ± 0.014 75 0.004b ± 0.010 2 –0.001 ± 0.016 ND ND
3 0.04 0.2198 43 –0.002a ± 0.018 2 0.013a ± 0.012 35 0.004a ± 0.019 2 0.028 ± 0.003 ND NDMay 2 0.27 <0.0001 27 –0.014c ± 0.016 114x 0.008a ± 0.015 115x–0.007b ± 0.011x 10 –0.013 ± 0.018 7 0.002 ± 0.006
3 0.12 <0.0001 27 –0.009c ± 0.016 42 0.007a ± 0.016 129x–0.002b ± 0.011x 5 0.003 ± 0.017 4 0.002 ± 0.013CodMarch 2 0.34 0.0012 15 –0.025b ± 0.033 ND ND 13 0.009a ± 0.005 ND ND ND ND
3 0.32 0.0572 6 –0.018a ± 0.033 ND ND 6 0.012a ± 0.007 ND ND ND NDApril 2 0.25 <0.0001 120x–0.009c ± 0.022 67 0.015a ± 0.014 75 0.003b ± 0.010 11 –0.008 ± 0.007 ND ND
3 0.09 0.0004 103x–0.003a ± 0.020 2 0.013a ± 0.004 62 0.008a ± 0.013 21 –0.009 ± 0.020 ND NDMay 2 0.11 <0.0001 26 –0.006b ± 0.012 66 0.005a ± 0.014 80 –0.004b ± 0.011x 16 –0.009 ± 0.028 9 0.010 ± 0.006
3 0.11 0.4041 25 –0.004a ± 0.017 32 –0.002a ± 0.010x 10⁹x–0.001a ± 0.011x 18 –0.009 ± 0.012 6 0.008 ± 0.008
Table 4. Melanogrammus aeglefinus and Gadus morhua. Growth rate and residual growth rate (rGi) for larvae by size class (2 or 3),month and year. Data are net means ± SD for each size class (data set NMLSC). N = no. of nets containing fish of a particular size class,ND = no data. Values in a row with a superscript letter in common are not significantly different (ANOVA models: growth rate = year;rGi = residual temperature, year). rGi is the difference between observed growth rate and growth rate predicted using SPPDG GAMs.Residual temperature is the difference between observed and long-term mean temperature for a given year day. Values for 1996 and
1998 are shown but not included in the statistical analysis due to the lower sampling effort
N r2 m1 m2 C
1995 Haddock 504 0.45 0.0169 0.0182 –0.2909Cod 1314 0.37 0.0112 0.0280 –0.4021
1997 Haddock 1831 0.61 0.0224 0.0166 –0.2724Cod 1433 0.38 0.0113 0.0154 –0.2024
1999 Haddock 2908 0.64 0.0181 0.0080 –0.1341Cod 2352 0.57 0.0135 0.0125 –0.1768
Table 5. Melanogrammus aeglefinus and Gadus morhua.Relationship among larval size, photoperiod and recentgrowth rate of cod and haddock larvae fit to a linear model.Data for individual larvae with ≤1200 µg protein per larva(data set IF) were fit to the equation: Gi = m1 × ln(Pro) + m2 ×PP + C, where Pro is the protein content in µg per larva and
PP is the photoperiod in h
Mar Ecol Prog Ser 325: 205–226, 2006
ity in residual growth rates (rGi) (Table 7). Distancealong the bank and bottom depth were more importantfor haddock than for Atlantic cod. Stratification was asignificant factor for larval haddock but not for cod.The relationships for rGi and water temperature inboth species and bottom depth in haddock during Maywere markedly nonlinear, as indicated by the better fitof the GAMs compared with linear models. The GAMs
216
N r2 Gmax k Topt
1995 Haddock 118 0.36 0.083 –0.0058 7.73Cod 192 0.45 0.091 –0.0104 7.27
1997 Haddock 209 0.70 0.120 –0.0021 10.75Cod 182 0.63 0.094 –0.0038 7.74
1999 Haddock 220 0.78 0.110 –0.0031 9.93Cod 204 0.68 0.114 –0.0023 10.35
Table 6. Melanogrammus aeglefinus and Gadus morhua. Therelationship between water temperature and recent growth rateof cod and haddock larvae fit to a quadratic parabola. Netmeans for larvae with ≤1200 µg protein per larva (data set NM)were fit to the equation: Gi = Gmax + k(T– Topt)2, where Gmax isthe maximum growth rate at the optimum water temperaturefor growth (Topt), k is always negative, and T is the temperature
0
200
400
600
800
1000
1200
0 10 20 30 40 50 60 70
Age (dph)
Pro
tein
co
nten
t (µ
gla
rva–
1 )
Fig. 6. Gadus morhua. Modeled growth of cod larvae onGeorges Bank for the years 1995, 1997 and 1999. The curvesfor the years 1995 (j), 1997 (d) and 1999 (+) were estimatedusing the SPPDG models given in Table 6, assuming a hatchsize of 23 µg protein on April 1. The curve for Folkvord’s(2005) STDG model (××) was generated using mean GeorgesBank water temperatures for each year day. This curve wasmatched closely using our SPPDG model for 1999 when thelonger photoperiods for Bergen, Norway (60°N) were used(nn). Dry weight was estimated as 2× the estimated proteincontent. The same April 1 hatch date was used for all curves
Independent Linear models GAMSvariable R2 p Chi-square p > Chi-square R2 p > F
HaddockSalinity 0.061 <0.0001 rGi = -0.0159X + 0.5173 31.7 <0.0001 0.099 <0.0001Along-bank distance (km) 0.042 <0.0001 rGi = 0.0002X – 0.0136 11.9 <0.05xx 0.057 <0.0001Sigma-t 0.048 <0.0001 rGi = –0.0149X + 0.3795 16.9 <0.01xx 0.070 <0.0001Stratification 0.007 <0.05xx rGi = –0.0052X + 0.0007 12.5 <0.05xx 0.026 <0.0001Bottom depth (m) 0.011 <0.01xx rGi = –0.0001X + 0.0088 6.7 NS
May only 0.001 NS 20x <0.001x 0.047 <0.0001Residual temp. (°C) 0.014 <0.001x rGi = 0.0028X – 0.0004 11.5 <0.05xx 0.030 <0.001x
1999 only 0.240 <0.0001 rGi = 0.0082X – 0.0014 38.3 <0.0001 0.320 <0.0001EDST (h) 0 NS 9.7 <0.05xx 0.014 <0.01xxTemperature (°C) 0 NS 30.1 <0.0001 0.042 <0.0001All of above 0.196 <0.0001 0.280 <0.0001
Atlantic codSalinity 0.046 <0.0001 rGi = –0.0170X + 0.5540 17.2 <0.001x 0.065 <0.0001Along-bank distance (km) 0.003 NS 21.3 <0.001x 0.027 <0.0001Sigma-t 0.033 <0.0001 rGi = –0.0128X + 0.3258 28.6 <0.0001 0.066 <0.0001Stratification 0.001 NS 4.3 NSBottom depth (m) 0.006 <0.05xx rGi = –0.0001X + 0.0060 3.7 NSMay only 0.006 NS 9.1 NS
Residual temp. (°C) 0.011 <0.01xx rGi = 0.0033X 23.1 <0.0001 0.038 <0.00011999 only 0.160 <0.0001 rGi = 0.0081X – 0.0009 18.8 <0.001x 0.204 <0.0001
Temperature (°C) 0.002 NS 44.6 <0.0001 0.064 <0.0001EDST (h) 0.001 NS 14.5 <0.01xx 0.018 <0.0001All of above 0.116 <0.0001 0.197 <0.0001
Table 7. Melanogrammus aeglefinus and Gadus morhua. Relationship between environmental variables and residual growthrate (rGi) for cod and haddock in size-classes 2 and 3. N is the number of nets containing size-class 2 larvae plus the number con-taining size-class 3 larvae (i.e. a net containing fish in both size classes constituted 2 observations). N = 887 for cod and 753 forhaddock. The R2 and p > F values reported for GAMs are for a linear relationship between observed and predicted values, NS =
not significant. EDST is Eastern daylight savings time
Buckley et al.: Cod and haddock larval growth rates
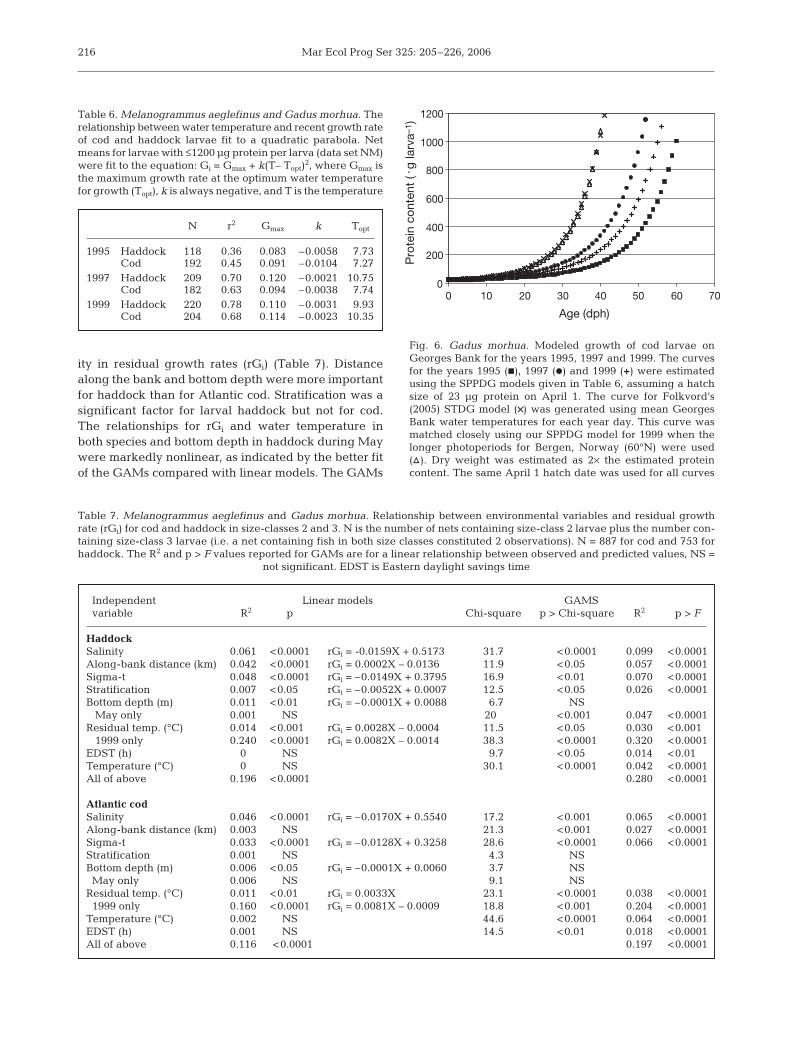
incorporating different combinations of these indepen-dent variables explained up to 28% of the variability inrGi for haddock and up to 20% of the variability in rGi
for cod. Plots of rGi against rT indicated a strong linearrelationship in 1999 for both cod and haddock (Fig. 7).
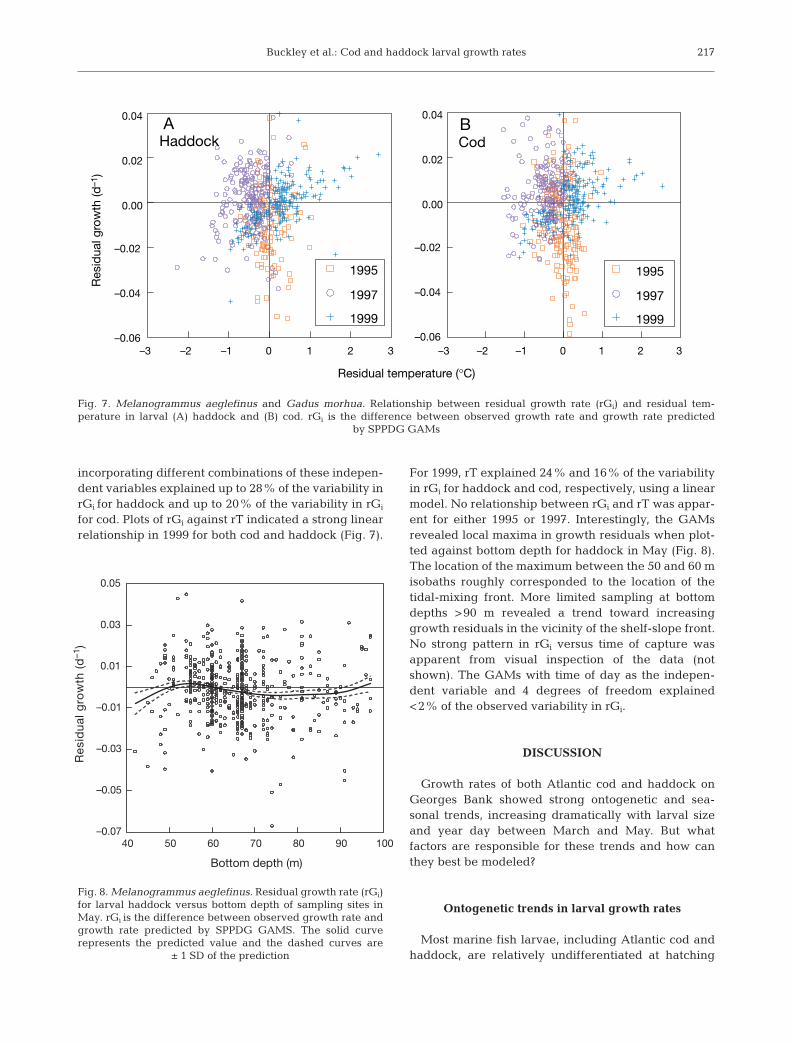
For 1999, rT explained 24% and 16% of the variabilityin rGi for haddock and cod, respectively, using a linearmodel. No relationship between rGi and rT was appar-ent for either 1995 or 1997. Interestingly, the GAMsrevealed local maxima in growth residuals when plot-ted against bottom depth for haddock in May (Fig. 8).The location of the maximum between the 50 and 60 misobaths roughly corresponded to the location of thetidal-mixing front. More limited sampling at bottomdepths >90 m revealed a trend toward increasinggrowth residuals in the vicinity of the shelf-slope front.No strong pattern in rGi versus time of capture wasapparent from visual inspection of the data (notshown). The GAMs with time of day as the indepen-dent variable and 4 degrees of freedom explained<2% of the observed variability in rGi.
DISCUSSION
Growth rates of both Atlantic cod and haddock onGeorges Bank showed strong ontogenetic and sea-sonal trends, increasing dramatically with larval sizeand year day between March and May. But whatfactors are responsible for these trends and how canthey best be modeled?
Ontogenetic trends in larval growth rates
Most marine fish larvae, including Atlantic cod andhaddock, are relatively undifferentiated at hatching
217
–3 –2 –1 0 1 2 3
Residual temperature (°C)
–0.06
–0.04
–0.02
0.00
0.02
0.04
Res
idua
l gro
wth
(d–1
)
–3 –2 –1 0 1 2 3
Haddock CodA B
1995
1997
1999
1995
1997
1999–0.06
–0.04
–0.02
0.00
0.02
0.04
Fig. 7. Melanogrammus aeglefinus and Gadus morhua. Relationship between residual growth rate (rGi) and residual tem-perature in larval (A) haddock and (B) cod. rGi is the difference between observed growth rate and growth rate predicted
by SPPDG GAMs
40 50 60 70 80 90 100
Bottom depth (m)
–0.07
–0.05
–0.03
–0.01
0.01
0.03
0.05
Res
idu
al g
row
th (
d–1
)
Fig. 8. Melanogrammus aeglefinus. Residual growth rate (rGi)for larval haddock versus bottom depth of sampling sites inMay. rGi is the difference between observed growth rate andgrowth rate predicted by SPPDG GAMS. The solid curverepresents the predicted value and the dashed curves are
± 1 SD of the prediction
Mar Ecol Prog Ser 325: 205–226, 2006
and development continues at a rapid rate through thefirst several weeks thereafter (Blaxter 1986). Within aspecies, developmental state is closely related to size.Houde (1997) examined the relation between weight-specific growth rate and size for a variety of marine andanadromous fish larvae and early juveniles. While nu-merous species exhibited increasing weight-specificgrowth rates during the first several weeks after hatch-ing in culture, only 3 species (American shad Alosa sap-idissima, striped bass Morone saxatilis and Pacific her-ring Clupea pallasii) showed a similar increase ingrowth rate with size in the sea. For striped bass andPacific herring the relationship between weight-specific growth rate and size was dome-shaped. Houde(1997) concluded that for most marine species weight-specific growth rates in the sea were either relativelyconstant or declined with size during the larval period.
We found that larval size strongly affected growthrates of both cod and haddock larvae on GeorgesBank. An initial rapid increase in growth rate was sus-tained to a size of about 80 to 106 µg protein in cod andhaddock respectively. Given the rapid development ofvisual, locomotive, respiratory and digestive systemsthat dramatically improve an individual larva’s abilityto acquire and process food in the first weeks afterhatching (Hunter 1981, Blaxter 1986), an initial in-crease in growth rate with size would be expected. Butwhy does weight-specific growth rate appear todecrease with larval size in most field studies? Themethods and size groupings used may explain thedifferences in outcomes among studies. Most of thestudies considered by Houde (1997) estimated length-at-age based on counts of daily rings in the otoliths.Length-specific growth rates were estimated fromthese data and then converted to weight-specific ratesusing weight-length relationships. Larval shrinkageduring capture and processing, variability in weight-length relationships, and underestimation of age inslow-growing individuals could contribute to error inestimating weight-specific growth rates using thisapproach. Data were then grouped into size categoriesand averaged to generate stage-specific information.In contrast, we treated larval size as a continuous vari-able and documented a very rapid initial increase ingrowth rate over a small range of size. This detailwould have been lost in averaging within the sizeclasses used by Houde (1997). Cod and haddock wereamong the species cited as showing an initial increasein growth rate with size in laboratory or enclosurestudies but not in previous field studies, raising thepossibility that increasing weight-specific growth ratesduring the larval period may be more common in thesea than previously thought.
Atlantic cod reared at high prey densities (Otterlei etal. 1999) showed a similar initial increase, as we found
in weight-specific growth rates, that peaked at a sizebetween 100 and 1000 µg dry weight (depending uponthe water temperature) and then declined. While it iscertain that the rapid weight-specific growth ratesseen in the middle and late larval periods are not sus-tained through the entire juvenile stage, the size atwhich growth rates begin to decline may vary depend-ing upon a variety of factors including prey availabilityand quality, and any density-dependent effects. Theinflection point where growth rates are maximum andthen begin to decrease with size was not seen withinthe size range considered in our study (<1200 µg pro-tein, ~12 mm SSL). However, the curves representinggrowth rate were very flat for larger larvae suggestingthat the inflection point was close to our threshold sizenear the transition from larvae to the juvenile stage.
In the sea, high mortality rates during the larvalperiod likely contribute to the observed increase ingrowth rates with size (Meekan & Fortier 1996, Pepinet al. 1999, Pitchford et al. 2005). Pepin et al. (1999)hypothesized that R:D and growth rate are indicatorsof survival probability (fitness) that are acquired earlyand remain somewhat persistent through a larva’s life,and moreover that they contract toward the highestvalues with larval size due to selective mortality. Highmortality would not have been a factor in at leastsome of the laboratory experiments where survival tothe end of the experiments was high (Otterlei et al.1999).
Seasonal trends in larval growth rates
Growth rate of Atlantic cod and haddock larvae onGeorges Bank showed a strong seasonal trend increas-ing from March through May. During this period anumber of environmental variables change on a simi-lar pattern including temperature, photoperiod, andprey biomass concentration, and all likely play a role indetermining larval growth rates.
Temperature affects the rate of chemical reactions.Because fish larvae are ectotherms, their activity andthe rates of development, metabolism and digestionincrease with temperature (Hunter 1981). In well-fedfish larvae, daily ration and growth rate increase withtemperature and then fall precipitously as temperatureapproaches the lethal limit. However, when food islimited an increase in temperature can lead to a de-creased growth rate, resulting in temperature optima(Topt) for maximum growth (Gmax) lower than thoseobserved for well-fed fish. Both Topt and Gmax decreasewith decreasing ration (Brett 1979). This is due toincreased metabolic costs at the higher temperaturethat are not met by increased consumption in a food-poor environment.
218
Buckley et al.: Cod and haddock larval growth rates
In an earlier study we examined the relationshipbetween water temperature and growth of larval codand haddock in May on Georges Bank (Buckley et al.2004). Based on 3 years of data (1992 to 1994), wereported a dome-shaped relationship between watertemperature and recent growth rates of both species.Maximum growth was observed at temperatures near7°C, considerably lower than the 14 to 16°C Topt
reported for well-fed cod larvae (Otterlei et al. 1999).Similar low Topt values for larvae collected in the north-west Atlantic Ocean were reported earlier, based onotolith microstructure analysis (Campana & Hurley1989). The low Topt and Gmax values, and the reducedgrowth at higher temperatures, compared with well-fed larvae in the laboratory, were offered as evidencefor food-limited growth in larval cod and haddock.
The US GLOBEC Georges Bank Program providedthe opportunity to examine, in much greater detail, therelations between larval growth and environmentalvariability over the period of larval drift. While therelationship between temperature and growth wasvariable among years, the data presented here alsosupport the hypothesis that larval growth can at timesbe food-limited. The low Topt values observed in 1995for both cod and haddock were suggestive of food-limited growth. The higher Topt values observed in1997 and 1999 indicate that sufficient food was avail-able in those years to support rapid larval growth. Thisconclusion also was supported by an analysis of themean prey biomass concentration estimated for dif-ferent size classes of cod from the monthly GLOBECbroadscale surveys (Buckley & Durbin 2006).
Most marine fish larvae including cod and haddockare visual feeders (Hunter 1981, Blaxter 1986). Pho-toperiod determines the time available for feedingeach day and consequently affects daily ration andgrowth rate (Suthers & Sundby 1996). One assumptioncommon to most larval bioenergetics models is that for-aging time and consumption are directly proportionalto photoperiod (e.g. Laurence 1985, Letcher et al. 1996,Lough et al. 2005). Increasing photoperiod from 12 to18 h in these models results in ~50% increase in con-sumption and a comparable increase in growth rate.Puvanendran & Brown (2002) reported that weight-specific growth rates of larval cod reared with abun-dant food at a constant temperature were 50% higherin the first 4 wk after hatching when kept on an18 h photoperiod compared with a 12 h photoperiod.Growth rates further increased by another 20% whenphotoperiod was increased from 18 to 24 h. Growthrates of herring Clupea harengus larvae in the labora-tory at both high and low prey densities were almost50% higher on a long spring photoperiod (16 to 20 h)compared with a short fall photoperiod (13 to 10 h)(Johannessen et al. 2000). Aquaculturists now rou-
tinely rear cod and haddock larvae at temperaturesabove 10°C and photoperiods in excess of 16 h to takeadvantage of the rapid growth and high survivalachieved under these conditions when food is avail-able in excess (Baskerville-Bridges & Kling 2000).
Food is a primary factor affecting larval growth,since without a source of energy and metabolites thereis no growth. For a period of days after hatching theembryo continues to develop and grow using energyand metabolites stored in the yolk. Exogenous feedingmust be initiated before maternal sources of energyare fully depleted. In culture, larval growth ratesincrease and mortality rates decrease with increasingprey levels (Houde 1978, Buckley et al. 1993). Al-though considerable debate still exists concerning therole of food availability in determining larval growthand mortality rates in the sea (Leggett & Deblois 1994),there is a growing body of evidence suggesting thatfood can at times limit growth rates and affect mortal-ity rates of marine fish larvae (e.g. Suthers et al. 1989,Bailey et al. 1995, Rilling & Houde 1999, Buckley et al.2004, Takahashi & Watanabe 2005, Buckley & Durbin2006). At other times there appears to be more thansufficient prey available to saturate larval feeding (e.g.MacKenzie et al. 1990, Gallego et al. 1999, Baumann etal. 2003, Lough et al. 2005).
Modeling the ontogenetic and seasonal trends ingrowth rates
Larval size, measured as protein content, was highlycorrelated with growth rates of both Atlantic cod andhaddock larvae. Because of its relatively constant pro-portion to dry weight and its structural role in muscletissue, protein content was an obvious choice for anindependent variable against which to model the onto-genetic trend in growth rates. The shape of the rela-tionship between protein content and larval growthrate was less obvious since a number of curves fit thedata reasonably well. The GAMs do not impose anyparticular shape and provide a tool to explore the rela-tionships among variables. When fit to our data, GAMsrevealed 3 apparent growth stanzas with relativelysharp transitions between the first and second stanzaand a more gradual transition between the second andthird stanza. The same general pattern was seen forboth cod and haddock, and persisted when the datawere grouped by month in an attempt to minimize theeffects of factors related to the seasonal cycle. The firststanza was characterized by a rapid initial increase ingrowth rate with size. This was followed by a stanzacharacterized by little change in growth rate with size.The third stanza was characterized by a gradualincrease in growth rate with size, approaching a maxi-
219
Mar Ecol Prog Ser 325: 205–226, 2006
mum growth rate. The transition point between thefirst and second stanza occurred at a larger size in had-dock than in cod.
The choice of an independent variable or variables tomodel the seasonal trend in growth rates was not obvi-ous. We considered 3 candidate variables (year day,photoperiod and temperature), all easily estimated ormeasured and all highly correlated with larval size andgrowth rates. The high correlations among these vari-ables in the spring on Georges Bank suggested thatthey contain much of the same information. We pre-sented a variety of growth models incorporating thesevariables, but for purposes of removing the ontoge-netic and seasonal trends in growth rate and exploringthe relationships among variables, we used SPPDGGAMs. For predictive purposes we used linear SPPDGmodels incorporating size as ln (protein content). Wechose photoperiod over year day in order to producemodels that were more generally applicable to othercod and haddock stocks that occur at widely differentlatitudes and spawn at different times of the year.Spawning time and latitude strongly affect the patternof photoperiod experienced by different stocks duringthe larval period. Fall-spawned cod, for example,would experience a declining photoperiod during thelarval period. We chose photoperiod over temperaturedue to its slightly higher correlation with larval growthrates, and other considerations discussed in the follow-ing section. Once photoperiod was incorporated intothe models, temperature explained little of the residualvariability in larval growth rates, except in 1999.
Role of photoperiod and temperature in determining larval growth rates
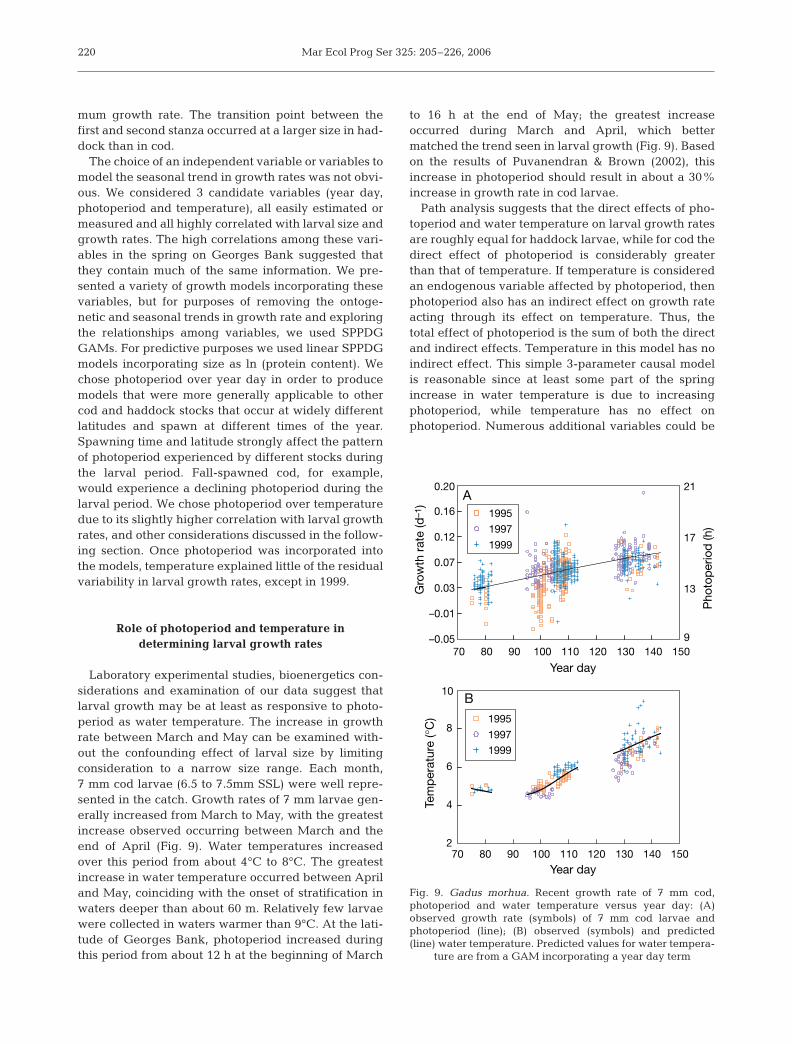
Laboratory experimental studies, bioenergetics con-siderations and examination of our data suggest thatlarval growth may be at least as responsive to photo-period as water temperature. The increase in growthrate between March and May can be examined with-out the confounding effect of larval size by limitingconsideration to a narrow size range. Each month,7 mm cod larvae (6.5 to 7.5mm SSL) were well repre-sented in the catch. Growth rates of 7 mm larvae gen-erally increased from March to May, with the greatestincrease observed occurring between March and theend of April (Fig. 9). Water temperatures increasedover this period from about 4°C to 8°C. The greatestincrease in water temperature occurred between Apriland May, coinciding with the onset of stratification inwaters deeper than about 60 m. Relatively few larvaewere collected in waters warmer than 9°C. At the lati-tude of Georges Bank, photoperiod increased duringthis period from about 12 h at the beginning of March
to 16 h at the end of May; the greatest increaseoccurred during March and April, which bettermatched the trend seen in larval growth (Fig. 9). Basedon the results of Puvanendran & Brown (2002), thisincrease in photoperiod should result in about a 30%increase in growth rate in cod larvae.
Path analysis suggests that the direct effects of pho-toperiod and water temperature on larval growth ratesare roughly equal for haddock larvae, while for cod thedirect effect of photoperiod is considerably greaterthan that of temperature. If temperature is consideredan endogenous variable affected by photoperiod, thenphotoperiod also has an indirect effect on growth rateacting through its effect on temperature. Thus, thetotal effect of photoperiod is the sum of both the directand indirect effects. Temperature in this model has noindirect effect. This simple 3-parameter causal modelis reasonable since at least some part of the springincrease in water temperature is due to increasingphotoperiod, while temperature has no effect onphotoperiod. Numerous additional variables could be
220
70 80 90 100 110 120 130 140 150 Year day
Year day
–0.05
–0.01
0.03
0.07
0.12
0.16
0.20
Gro
wth
rat
e (d
–1)
9
13
17
21
2
4
6
8
10
Tem
per
atur
e (°
C)
A
BP
hoto
per
iod
(h)
1995
1997
1999
1995
1997
1999
70 80 90 100 110 120 130 140 150
Fig. 9. Gadus morhua. Recent growth rate of 7 mm cod,photoperiod and water temperature versus year day: (A)observed growth rate (symbols) of 7 mm cod larvae andphotoperiod (line); (B) observed (symbols) and predicted(line) water temperature. Predicted values for water tempera-
ture are from a GAM incorporating a year day term
Buckley et al.: Cod and haddock larval growth rates
added to this simple causal model, but for the most partthe data needed to establish parameters for these morecomplex causal models are not available. For example,both photoperiod and temperature affect food avail-ability and both would have additional indirect effectsacting through food availability.
Our SPPDG models explain much of the observedvariability in growth rate without directly consideringfood availability. Certain variables such as water tem-perature, photoperiod, position in the water columnand position in relation to a hydrographic front may berelated to food availability (Heath & Gallego 1997,Munk 1997) and serve to some extent as a proxy forfood availability. On Georges Bank, photoperiod,water temperature, prey biomass concentration andlarval growth rates follow similar trends in the latewinter and spring during the period of larval drift(Buckley & Durbin 2006). Our SPPDG models, with-out specific temperature and food availability terms,contain information on temperature and food availabil-ity due to their correlation with dependent variablesused in the models. For Georges Bank, photoperiodrather than temperature appears to be the better pre-dictor or proxy for the seasonal trend in feeding con-ditions and growth rates of larval cod and haddock.
Most often in field studies where increased larvalgrowth rates are associated with increased water tem-perature, the increased growth rates are attributed towater temperature (Heath 1992). Often the increase intemperature is part of a seasonal cycle or associatedwith different water masses, and other environmentalvariables, such as photoperiod and prey abundance,change in concert with temperature (Sundby 2000).These other variables are often not considered to thesame degree as water temperature. Photoperiod inparticular has received relatively little attention in fieldstudies. Two examples serve to illustrate this point. Xie& Watanabe (2005) reported, based on otolith micro-structure analysis, that rates of growth and develop-ment of jack mackerel Trachurus japonicus werehigher in late-hatched compared with early-hatchedfish. They concluded, ‘higher water temperaturesexperienced by late-hatched fish during the early lifestages may contribute critically to the higher growthand development rates.’ Photoperiod was not consid-ered in the paper; however, in the study area (~30°N)photoperiod increased over the study period from11.6 h on February 1 to 14.4 h on June 1. This 24%increase in photoperiod could also have contributed tothe higher growth and development rates observed inlate-hatched fish. In another example, Gallego et al.(1999) concluded, ‘Daily larval haddock growth vari-ability, estimated from otolith microstructure analysis,was independent of the measured variability of thephysical and biological environment of the larvae.’
Variables considered included temperature, turbu-lence, depth of the mixed layer, light intensity, chloro-phyll and zooplankton concentrations. They deter-mined that individual birth date was the only‘environmental’ variable (their quote) that explained asignificant portion of the observed variability in dailygrowth rates. However, they did not address the effectof birth date on the photoperiod experienced bylarvae. In their North Sea study area (~60°N) in April, adifference in hatch date of only 10 d resulted in a 1 hdifference in photoperiod.
Apart from the direct effects of photoperiod and tem-perature on larval growth rates, these variables serveas estimators of position in the seasonal cycle. Ourestimates of photoperiod are based simply on date andlatitude, while we used actual water temperature atthe time of sampling. That the fixed variables (year dayand photoperiod) showed correlations with growthrates as high or higher than that with actual water tem-perature implies that (1) the seasonal cycle on GeorgesBank was relatively fixed in time for the 5 years (1995to 1999) studied and (2) the position in the seasonalcycle was as important as actual water temperature indetermining larval growth rates.
While the times of sunrise and sunset are a functionof the day of the year and the latitude, light at depthand effective photoperiod can vary greatly dependingon a variety of factors including cloud cover, fog, seastate and pigment concentration (Suthers & Sundby1996). These factors have their greatest effects at dawnand dusk when the sun is close to the horizon, and inthe surface and deep waters where light levels arenear their upper and lower limits for feeding. Estimatesof the probability of clouds on the southern flank ofGeorges Bank based on SeaWiFS data (J. O’Riley perscomm) demonstrate considerable variability in thespring among both months and years. The resultingvariability in incident energy and effective photo-period may also play a role in explaining rGi and inter-annual variability in larval growth and survival.
Comparison with other growth models
Folkvord (2005) suggested ‘that surviving cod larvaein the sea typically grow at rates close to their maxi-mum size- and temperature-dependent capacity.’ Thismaximum capacity was based on output from a size-and temperature-dependent growth (STDG) modelderived from laboratory experiments on Atlantic codlarvae reared at temperatures between 4 and 14°C andfed to satiation (Otterlei et al. 1999). The effect of tem-perature on growth was approximately linear in theirunderlying data. Photoperiod, although not explicitlystated in either paper or incorporated into the model,
221
Mar Ecol Prog Ser 325: 205–226, 2006
was relatively long and adjusted during the 56 dexperiments to correspond with that at Bergen, Nor-way (~60°N) between April and the beginning of June.Folkvord (2005) limited his consideration of field datato published studies where growth was estimated fromotolith microstructure analysis. His conclusions tendedto minimize any effect of photoperiod and food avail-ability in determining growth of surviving larvae in thesea. In contrast, our data showed variability in growthrates that cannot be explained solely by differencesin temperature and larval size. Moreover, the datademonstrated the importance of photoperiod and fooddensity in determining the growth rate of cod and had-dock larvae in the sea.
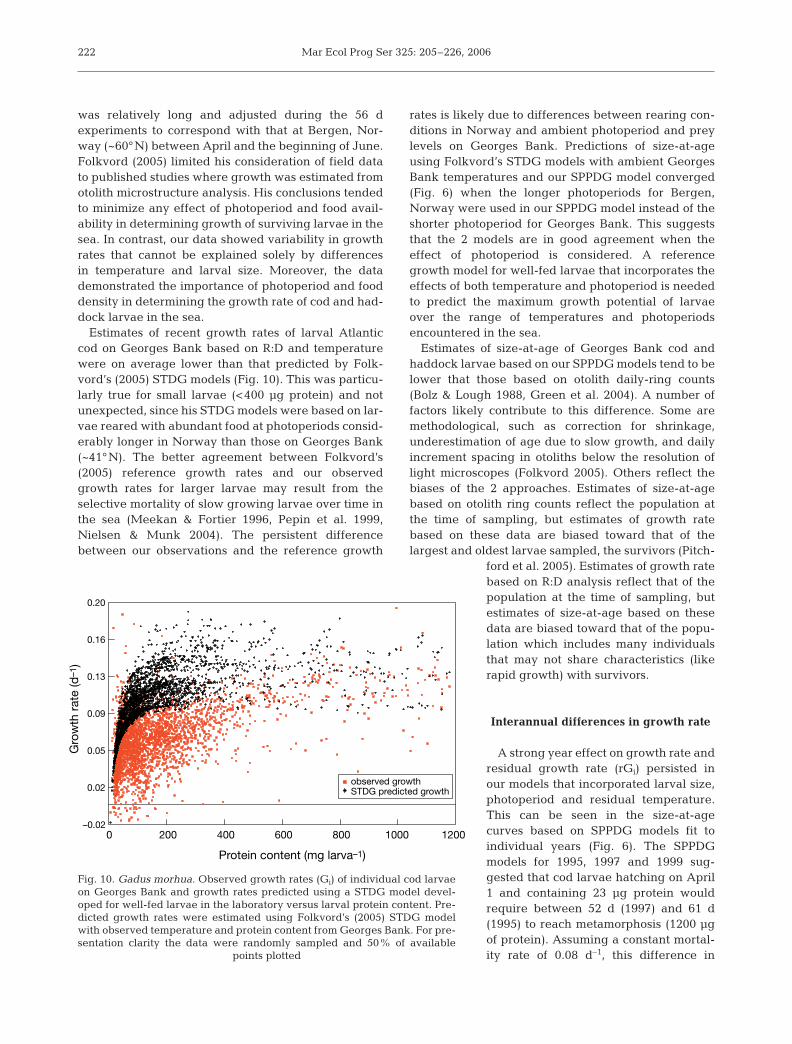
Estimates of recent growth rates of larval Atlanticcod on Georges Bank based on R:D and temperaturewere on average lower than that predicted by Folk-vord’s (2005) STDG models (Fig. 10). This was particu-larly true for small larvae (<400 µg protein) and notunexpected, since his STDG models were based on lar-vae reared with abundant food at photoperiods consid-erably longer in Norway than those on Georges Bank(~41°N). The better agreement between Folkvord’s(2005) reference growth rates and our observedgrowth rates for larger larvae may result from theselective mortality of slow growing larvae over time inthe sea (Meekan & Fortier 1996, Pepin et al. 1999,Nielsen & Munk 2004). The persistent differencebetween our observations and the reference growth
rates is likely due to differences between rearing con-ditions in Norway and ambient photoperiod and preylevels on Georges Bank. Predictions of size-at-ageusing Folkvord’s STDG models with ambient GeorgesBank temperatures and our SPPDG model converged(Fig. 6) when the longer photoperiods for Bergen,Norway were used in our SPPDG model instead of theshorter photoperiod for Georges Bank. This suggeststhat the 2 models are in good agreement when theeffect of photoperiod is considered. A referencegrowth model for well-fed larvae that incorporates theeffects of both temperature and photoperiod is neededto predict the maximum growth potential of larvaeover the range of temperatures and photoperiodsencountered in the sea.
Estimates of size-at-age of Georges Bank cod andhaddock larvae based on our SPPDG models tend to belower that those based on otolith daily-ring counts(Bolz & Lough 1988, Green et al. 2004). A number offactors likely contribute to this difference. Some aremethodological, such as correction for shrinkage,underestimation of age due to slow growth, and dailyincrement spacing in otoliths below the resolution oflight microscopes (Folkvord 2005). Others reflect thebiases of the 2 approaches. Estimates of size-at-agebased on otolith ring counts reflect the population atthe time of sampling, but estimates of growth ratebased on these data are biased toward that of thelargest and oldest larvae sampled, the survivors (Pitch-
ford et al. 2005). Estimates of growth ratebased on R:D analysis reflect that of thepopulation at the time of sampling, butestimates of size-at-age based on thesedata are biased toward that of the popu-lation which includes many individualsthat may not share characteristics (likerapid growth) with survivors.
Interannual differences in growth rate
A strong year effect on growth rate andresidual growth rate (rGi) persisted inour models that incorporated larval size,photoperiod and residual temperature.This can be seen in the size-at-agecurves based on SPPDG models fit toindividual years (Fig. 6). The SPPDGmodels for 1995, 1997 and 1999 sug-gested that cod larvae hatching on April1 and containing 23 µg protein wouldrequire between 52 d (1997) and 61 d(1995) to reach metamorphosis (1200 µgof protein). Assuming a constant mortal-ity rate of 0.08 d–1, this difference in
222
0 200 400 600 800 1000 1200
Protein content (mg larva–1)
–0.02
0.02
0.05
0.09
0.13
0.16
0.20
Gro
wth
rat
e (d
–1)
observed growthSTDG predicted growth
Fig. 10. Gadus morhua. Observed growth rates (Gi) of individual cod larvaeon Georges Bank and growth rates predicted using a STDG model devel-oped for well-fed larvae in the laboratory versus larval protein content. Pre-dicted growth rates were estimated using Folkvord’s (2005) STDG modelwith observed temperature and protein content from Georges Bank. For pre-sentation clarity the data were randomly sampled and 50% of available
points plotted
Buckley et al.: Cod and haddock larval growth rates
development time would result in a 2-fold difference insurvival to metamorphosis among years. Any size-selective mortality (Meekan & Fortier 1996) and vari-ability in growth rates (Pitchford et al. 2005) wouldmagnify this difference.
The year effect was consistent among months, sug-gesting that the factors responsible operated overextended periods of time (months). Food availability isthe single additional factor (beyond larval size, pho-toperiod and temperature) most likely to explain theresidual variability in observed larval growth and toaccount for the year effect. Food availability may alsoexplain the different patterns seen in the T-G relation-ships among years and the particularly strong positiverelationship observed between rGi and rT observed in1999. An analysis of the prey available to cod and had-dock larvae on Georges Bank for the years from 1995to 1999 based on a series of standard stations sampledmonthly suggested that prey concentrations increasedduring the period of larval drift (February to June), andwere lower in 1995 and 1996 compared with the periodfrom 1997 to 1999 (Buckley & Durbin 2006). They re-ported a strong positive relationship between monthlyaverage prey biomass concentration and growth ratesof larval cod and haddock. Residual growth ratesincreased with residual prey abundance (a measure ofthe deviation from the seasonal trend in prey concen-tration). The low Topt and low Gmax values estimated for1995 compared with either 1997 or 1999 were consis-tent with the low prey biomass concentrations reportedfor 1995 (Buckley & Durbin 2006). The strong positivecorrelations between rGi and rT observed for cod andhaddock larvae in 1999 were consistent with the highprey biomass concentrations observed that year. Apositive relationship between rGi and rT would beexpected when food was plentiful and growth was notfood-limited. If temperature played the dominant rolein determining variability in larval growth rates in thesea, then a strong relationship between rT and rGi
should be observed in most if not all years.The relatively high incidence of starving YSFF
observed in 1995 compared with those in either 1997 or1999 provides further evidence that feeding conditionswere poor in 1995.
Our estimates of starvation mortality in YSFF codand haddock larvae (0.1 to 9% d–1) are comparable tothat reported for walleye pollock Theragra chalco-gramma (Theilacker et al. 1996). Walleye pollock,Atlantic cod and haddock, all gadoid species, appear tobe vulnerable to starvation for a 2 wk period after firstfeeding. Published estimates of total mortality in codand haddock larvae on Georges Bank range from 3 to14% d–1 (Lough 1984, Mountain et al. 2003). Our datasuggest that for YSFF larvae, much of this mortalitymay at times be due to starvation as was reported for
jack mackerel (Theilacker 1986). The very low inci-dence of larger, older larvae (size classes 2 and 3) withnegative growth rates at the time of capture (≤1% forboth species in our data set) suggests that direct star-vation plays a relatively small role in mortality of codand haddock larvae on Georges Bank, once feedingand growth are initiated. Nevertheless, food-limitedgrowth and the resulting increase in the duration of thevulnerable larval period may be an important factor inmortality of these species during the larval period.
Additional factors affecting larval growthand survival
It is the deviations from the seasonal and ontoge-netic trends in food availability and growth rate (rGi)that are most likely related to interannual variabilityin survival and recruitment (Platt et al. 2003). Whileprey concentration or, more specifically, the deviationfrom the seasonal trend in prey concentration may bethe most informative variable in this regard, it is dif-ficult, time-consuming and expensive to measure(although new technologies are changing this situa-tion). Consequently, with few exceptions long timeseries of prey abundance data comparable in durationto available recruitment time series (>30 yr) are gen-erally unavailable. Where these data are availablethey may be limited in spatial coverage or taxonomicdetail (Beaugrand et al. 2003). Often the small nau-pliar and copepodite stages that make up the bulk ofthe diet of fish larvae are not adequately sampled.The lack of long time series of prey abundance dataincreases the need for and the value of proxies forprey abundance for which long time series data areavailable.
Several environmental variables measured in thisstudy were weakly correlated with rGi and may serveas proxies for feeding and growth conditions. Amongthe environmental variables considered, salinity ex-plained the largest portion of the observed variabilityin rGi. Salinity was inversely correlated with both preybiomass concentration (Buckley & Durbin 2006) andrGi. High salinity in 1995 likely contributed to theseinverse correlations. Prey biomass concentrations andlarval growth rates were lowest in 1995 and salinitiesthe highest in the time series. In May 1995 a warm-core ring brought warmer and saltier slope water uponto the southern flank of the Bank (Manning et al.2001). However, few cod and haddock larvae were col-lected in this warmer water, and salinities on GeorgesBank in 1995 were already higher than the decadalmean before this event, suggestive of a larger scaleprocess (Smith et al. 2001, Mountain 2003). The 1990swas a period of general freshening in the Gulf of
223
Mar Ecol Prog Ser 325: 205–226, 2006
Maine and Georges Bank, which was attributed to anincreased inflow of low salinity surface water from theScotian Shelf (Mountain 2003). Positive salinity anom-alies in 1994 and early 1995 were attributed to reducedfreshwater fluxes in late 1993 through early 1995(Smith et al. 2001). While salinity can directly affectgrowth and survival of marine fish larvae with maxi-mum rates observed at salinities lower than fullstrength seawater (Opstad 2003), the relatively smalldifference in salinity observed between years, about1 psu, was likely more important as a marker for theproductivity of the associated water masses. Althoughhigh σt in 1995 likely contributed to the inverse corre-lation between density and rGi, the trend was alsoapparent in other years. An index of density stratifica-tion (Δσt) was weakly correlated with rGi of larval had-dock but not cod. Peak spawning of haddock is about1 mo after cod, and haddock larvae appear to be moredependent on development of stratification in thespring (Buckley et al. 1993). Results from earlier stud-ies on Georges Bank have shown that potential zoo-plankton prey items are concentrated near the thermo-cline (Incze et al. 1996, Lough & Mountain 1996) andthat growth of haddock was higher in stratified waterscompared with that in well-mixed shoal sites (Buckley& Lough 1987).
As part of the US GLOBEC Program, we have com-piled a database on environmental conditions, size,macromolecular composition and recent growth ofmore than 14000 individual Atlantic cod and haddocklarvae collected on Georges Bank between 1995 and1999. Specific growth rate initially increased rapidlywith larval size and increased more slowly through theremainder of the larval period. Growth increased withincreasing photoperiod and water temperature be-tween March and May. Over the 5 years of theGLOBEC field program on Georges Bank, a singlestrong year class of haddock was produced (1998),while recruitment of Atlantic cod was consistently low(Mayo & Terceiro 2005). Prey abundance was high(Buckley & Durbin 2006) and growth of both cod andhaddock larvae was rapid in 1998. However, feedingconditions and growth rate were similarly favorable in1997 and 1999, years that produced weak to averageyear classes of both cod and haddock. These findingsare consistent with the notion that favorable feedingconditions and rapid growth during the larval stage arenecessary but not sufficient for production of strongyear classes of either species.
Acknowledgements. This research is contribution #325 of theUS GLOBEC Program, funded jointly by NOAA and theNational Science Foundation. Three anonymous reviewersprovided helpful comments on an earlier version of the man-uscript.
LITERATURE CITED
Baumann H, Pepin P, Davidson FJ, Mowbray F, Schnack D,Dower JF (2003) Reconstruction of environmental historiesto investigate patterns of larval radiated shanny (Ulvariasubbifurcata) growth and selective survival in a large bayof Newfoundland. ICES J Mar Sci 60:243–258
Bailey KM, Houde ED (1989) Predation on eggs and larvae ofmarine fishes and the recruitment problem. Adv Mar Biol25:1–83
Bailey KM, Canino MF, Napp JM, Spring SM, Brown AL(1995) Contrasting years of prey levels, feeding conditionand mortality of larval walleye pollock Theragra chal-cogramma in the western Gulf of Alaska. Mar Ecol ProgSer 119:11–23
Baskerville-Bridges B, Kling LJ (2000) Early weaning ofAtlantic cod (Gadus morhua) onto a microparticulate diet.Aquaculture 189:109–117
Beaugrand G, Brander K, Lindley JA, Souissi S, Reid PC(2003) Plankton effect on cod recruitment in the NorthSea. Nature 426:661–664
Blaxter JHS (1986) Development of sense organs and behav-iour of teleost larvae with special reference to feeding andpredator avoidance. Trans Am Fish Soc 115:89–114
Bolz GR, Lough RG (1988) Growth through the first sixmonths of Atlantic cod, Gadus morhua, and haddock,Melanogrammus aeglefinus, based on daily otolith incre-ments. Fish Bull US 86:223–235
Brett JR (1979) Environmental factors and growth. In: Hoar WS,Randall DJ, Brett JR (eds) Fish Physiology, Vol. VIII,Bioenergetics and growth. Academic Press, London,p 599–667
Buckley LJ, Durbin E (2006) The relationship between preyabundance and growth rate of Atlantic cod (Gadusmorhua) and haddock (Melanogrammus aeglefinus) lar-vae on Georges Bank. Deep-Sea Res II (in press)
Buckley LJ, Lough RG (1987) Recent growth, biochemicalcomposition and prey field of larval haddock (Melano-grammus aeglefinus) and Atlantic cod (Gadus morhua) onGeorges Bank. Can J Fish Aquat Sci 44:14–25
Buckley LJ, Smigielski AS, Halavik TA, Burns BR, LaurenceGC (1993) Growth and survival of the larvae of three spe-cies of temperate marine fishes at discrete prey densities.II. Cod (Gadus morhua), winter flounder, (Pseudopleu-ronectes americanus), and silver hake (Merluccius bilin-earis). In: Walther BT, Fyhn HJ (eds) Physiological andbiochemical aspects of fish development. University ofBergen, Norway, p 183–195
Buckley LJ, Caldarone E, Ong TL (1999) RNA-DNA ratio andother nucleic acid-based indicators for growth and condi-tion of marine fishes. Hydrobiology 401: 265–277
Buckley LJ, Caldarone E, Lough RG (2004) Optimum temper-ature and food limited growth of larval Atlantic cod(Gadus morhua) and haddock (Melanogrammus aeglefi-nus) on Georges Bank. Fish Oceanogr 13:134–140
Caldarone EM (2005) Estimating growth in haddock larvaeMelanogrammus aeglefinus from RNA:DNA ratios andwater temperature. Mar Ecol Prog Ser 293:241–252
Caldarone EM, Buckley LJ (1991) Quantitation of DNA andRNA in crude tissue extracts by flow injection analysis.Anal Biochem 199:137–141
Caldarone EM, Wagner M, St. Onge-Burns JM, Buckley LJ(2001) Protocol and guide for estimating nucleic acids inlarval fish using a fluorescence microplate reader. Ref. doc01-11:1–22, National Marine Fisheries Service, WoodsHole, Massachusetts. Also available at www.nefsc.noaa.gov/nefsc/publications/crd/crd0111/0111.htm
224
Buckley et al.: Cod and haddock larval growth rates
Caldarone EM, St. Onge-Burns JM, Buckley LJ (2003) Rela-tionship of RNA/DNA ratio and temperature to growth inlarvae of Atlantic cod Gadus morhua. Mar Ecol Prog Ser262:229–240
Campana SE, Hurley PCF (1989) An age- and temperature-mediated growth model for cod (Gadus morhua) and had-dock (Melanogrammus aeglefinus) larvae in the Gulf ofMaine. Can J Fish Aquat Sci 46:603–613
Campbell RG, Runge JA, Durbin EG (2001) Evidence for foodlimitation of Calanus finmarchicus production rates on thesouthern flank of Georges Bank during April 1997. Deep-Sea Res II 48:531–549
Folkvord A (2005) Comparison of size-at-age of larval Atlanticcod (Gadus morhua) from different populations based onsize- and temperature-dependent growth models. Can JFish Aquat Sci 62:1037–1052
Folkvord A, Ystanes L, Johannessen A, Moksness E (1996)RNA:DNA ratios and growth of herring (Clupea harengus)larvae reared in mesocosms. Mar Biol 126: 591–602
Gallego A, Heath MR, Basford DJ, MacKenzie BR (1999) Vari-ability in growth rates of larval haddock in the northernNorth Sea. Fish Oceanogr 8:77–92
Green J, Jones R, Brownell S (2004) Age and growth of larvalcod and haddock on Georges Bank during 1995 and 1996.Mar Ecol Prog Ser 283:255–268
Heath MR (1992) Field investigations of early larval stages ofmarine fish. Adv Mar Biol 28:1–175
Heath MR, Gallego A (1997) From the biology of the individ-ual to the dynamics of the population: bridging the gap infish early life studies. J Fish Biol 51 (Suppl A): 1–29
Houde ED (1978) Critical food concentrations for larvae ofthree species of subtropical marine fishes. Bull Mar Sci 28:395–411
Houde ED (1989) Comparative growth, mortality, and ener-getics of marine fish larvae: temperature and implied lati-tudinal effects. Fish Bull US 87:471–495
Houde ED (1997) Patterns and trends in larval-stage growthand mortality of teleost fish. J Fish Biol 51 (Suppl A):52–83
Houde ED, Zastrow CE (1993) Ecosystem- and taxon-specificdynamic and energetic properties of larval fish assem-blages. Bull Mar Sci 53:290–335
Hunter JR (1981) Feeding ecology and predation of marine fishlarvae. In: Lasker R (ed) Marine fish larvae, morphology,ecology and relation to fisheries. Washington Sea GrantProgram, University of Washington Press, Seattle, p 34–87
Incze L, Aas P, Ainaine T (1996) Distribution of copepodnauplii and turbulence on the southern flank of GeorgesBank: implications for feeding by larval cod (Gadusmorhua). Deep-Sea Res II 43:1855–1873
Johannessen A, Bloom G, Folkvord A (2000) Differences inthe growth pattern between spring and autumn spawnedherring (Clupea harengus L.) larvae. Sarsia 85:461–466
Laurence GS (1977) A bioenergetics model for the analysis offeeding and survival potential of winter flounder, Pseudo-pleuronectes americanus, larvae during the period fromhatching to metamorphosis. Fish Bull US 75:529–546
Laurence GC (1985) A report on the development of stochas-tic models of food limited growth and survival of cod andhaddock larvae. In: Laurence GC, Lough RG (eds) Growthand survival of larval fishes in relation to the trophody-namics of Georges Bank cod and haddock. NOAA TechMemo NMFS-F/NEC-36, p 83–150
Leggett WC, Deblois E (1994) Recruitment in marine fishes: Isit regulated by starvation and predation in the egg andlarval stages? Neth J Sea Res 32:119–134
Letcher BH, James JA, Crowder LB, Rose KA (1996) Variabil-ity in survival of larval fish: disentangling components
with a generalized individual-based model. Can J FishAquat Sci 53:787–801
Lough RG (1984) Larval fish trophodynamic studies onGeorges Bank: sampling strategy and initial results. In:Dahl E, Danielssen DS, Moksness E, Solemdal P (eds)The propagation of cod Gadus morhua L. Flodevigenrapportser 1:395–434
Lough RG, Manning JP (2001) Tidal-front entrainment andretention of fish larvae on the southern flank of GeorgesBank. Deep-Sea Res II 48:631–644
Lough RG, Mountain DG (1996) Effect of small-scale turbu-lence on feeding rates of larval cod and haddock in strati-fied water on Georges Bank. Deep-Sea Res II 43:1745–1772
Lough RG, Caldarone EM, Rotunno TK, Broughton EA, BurnsBR, Buckley LJ (1996) Vertical distribution of cod and had-dock eggs and larvae feeding and condition in stratifiedmixed waters on southern Georges Bank May 1992. Deep-Sea Res 43:1875–1904
Lough RG, Buckley LJ, Werner FE, Quinlan JA, Pehrson-Edwards K (2005) A general biophysical model of larvalcod growth applied to Georges Bank. Fish Oceanogr 14:1–22
MacKenzie BR, Leggett WC, Peters RH (1990) Estimatinglarval fish ingestion rates: Can laboratory derived valuesbe extrapolated to the wild? Mar Ecol Prog Ser 67:209–225
Manning JP, Lough RG, Naimie E, Churchill JH (2001) Mod-eling the effect of a slope-water intrusion on advection offish larvae in May 1995 on Georges Bank. ICES J Mar Sci58:985–993
Mayo RK, Terceiro M (eds) (2005) Assessment of 19 Northeastgroundfish stocks through 2004. Ground Fish AssessmentReview Meeting, Northeast Fisheries Science Center,Woods Hole, Massachusetts, USA, 15–19 August, NEFSCReference Document 05–13
Meekan MG, Fortier L (1996) Selection for fast growth duringthe larval life of Atlantic cod Gadus morhua on the ScotianShelf. Mar Ecol Prog Ser 137:25–37
Mountain D (2003) Variability in the properties of ScotianShelf water in the Middle Atlantic Bight, 1977–1999.J Geophys Res 108(C1):3014, doi:10.1029/2001JC001044
Mountain D, Berrien P, Sibunka J (2003) Distribution, abun-dance and mortality of cod and haddock eggs and larvaeon Georges Bank in 1995 and 1996. Mar Ecol Prog Ser 263:247–260
Munk P (1997) Prey size spectra and prey availability of larvaland small juvenile cod. J Fish Biol 51 (Suppl A):340–351
Munk P, Heath M, Skaarup B (1991) Regional and seasonaldifferences in growth of larval North Sea herring (Clupeaharengus L.) estimated by otolith microstructure analysis.Cont Shelf Res 11:641–654
Nielsen R, Munk P (2004) Growth pattern and growth depen-dent mortality of larval and pelagic juvenile North Sea codGadus morhua. Mar Ecol Prog Ser. 278:261–270
Opstad I (2003) Growth and survival of haddock (Melano-grammus aeglefinus) larvae at different salinities. The bigfish bang. In: Browman HI, Skiftesvik AB (eds) Proceed-ings of the 26th Annual Larval Fish Conference. Instituteof Marine Research, Bergen, Norway, p 63–69
Otterlei E, Nyhammer G, Folkvord A, Stefansson SO (1999)Temperature- and size-dependent growth of larval andearly juvenile Atlantic cod (Gadus morhua): a comparativestudy of Norwegian coastal cod and northeast Arctic cod.Can J Fish Aquat Sci 56:2099–2111
Pedhazur EJ (1997) Multiple regression in behavioral re-search explanation and prediction. Harcourt Brace Col-lege Publishers, Fort Worth, Texas
225
Mar Ecol Prog Ser 325: 205–226, 2006
Pepin P (1991) Effect of temperature and size on develop-ment, mortality, and survival rates of the pelagic early lifehistory stages of marine fish. Can J Fish Aquat Sci 48:503–518
Pepin P, Evans GT, Shears TH (1999) Patterns of RNA/DNAratios in larval fish and their relationship to survival in thefield. ICES J Mar Sci 56:697–706
Peterson I, Wroblewski JS (1984) Mortality rate of fishes in thepelagic ecosystem. Can J Fish Aquat Sci 41:1117–1120
Pitchford JW, James A, Brindley J (2005) Quantifying theeffects of individual and environmental variability in fishrecruitment. Fish Oceanogr 14:156–160
Platt T, Fuentes-Yaco C, Frank KT (2003) Spring algal bloomand larval fish survival. Nature 423:389–399
Puvanendran V, Brown JA (2002) Foraging, growth and sur-vival of Atlantic cod larvae reared in different light inten-sities and photoperiods. Aquaculture 214:131–151
Ricker WE (1979) Growth rates and models. In Hoar WS,Randall DJ, Brett JR (eds) Fish physiology, Vol 8. Bioener-getics and growth. Academic Press, New York, p 677–743
Rilling GC, Houde ED (1999) Regional and temporal variabilityin growth and mortality of bay anchovy, Anchoa mitchilli,larvae in Chesapeake Bay. Fish Bull US 97:555–569
Smith P, Houghton RW, Fairbanks RG, Mountain DG (2001)Interannual variability of boundary fluxes and water massproperties in the Gulf of Maine and on Georges Bank:1993–1997. Deep-Sea Res II 48:37–70
Smith PK, Krohn RI, Hermanson GT, Mallia AK, Gartner FH,Provenzano MD, Fujimoto EK, Goeke NM, Olson BJ,Klenk DC (1985) Measurement of protein using bicin-choninic acid. Anal Biochem 150:76–85
Sundby S (2000) Recruitment of Atlantic cod stocks in relationto temperature and advection of copepod populations.Sarsia 85:277–298
Suthers IM, Sundby S (1996) Role of the midnight sun: com-parative growth of pelagic juvenile cod (Gadus morhua)from the Arcto-Norwegian and a Nova Scotian stock.ICES J Mar Sci 53:827–836
Suthers IM, Frank KT, Campana SE (1989) Spatial compari-son of recent growth in postlarval Atlantic cod (Gadusmorhua) off southern Nova Scotia: inferior growth in apresumed nursery area. Can J Fish Aquat Sci 46:113–124
Takahashi M, Watanabe Y (2005) Effects of temperature andfood availability on growth rate during the late larvalstage of Japanese anchovy (Engraulis japonicus) in theKuroshio-Oyashio transition region. Fish Oceanogr 14:223–235
Theilacker GH (1986) Starvation-induced mortality of youngsea-caught jack mackerel, Trachurus symmetricus, deter-mined with histological and morphological methods. FishBull US 84:1–17
Theilacker GH, Bailey KM, Canino MF, Porter SM (1996)Variations in larval walleye pollock feeding and condition:a synthesis. Fish Oceanogr 5:112–123
Wiebe PH, Morton AW, Bradley AM, Backus RH, CraddockJE, Barber V, Cowles TJ, Flierl GR (1985) New develop-ments in the MOCNESS, an apparatus for sampling zoo-plankton and micronekton. Mar Biol 87:313–323
Xie S, Watanabe Y (2005) Hatch date-dependent differencesin early growth and development recorded in the otolithmicrostructure of Trachurus japonicus. J Fish Biol 66:1720–1734
226
Editorial responsibility: Kenneth Sherman (ContributingEditor), Narrangansett, Rhode Island, USA
Submitted: September 7, 2004; Accepted: April 10, 2006Proofs received from author(s): October 5, 2006