Embed Size (px)
Citation preview

Ontario Student Achievement
2018–2019
EQAO’s Provincial Elementary School ReportResults of the 2018–2019 Assessments of Reading, Writing and Mathematics,
Primary Division (Grades 1–3) and Junior Division (Grades 4–6)
English-Language Students

About the Education Quality and Accountability Office
EQAO’s tests measure student achievement in reading, writing and mathematics in relation to
Ontario Curriculum expectations. The resulting data provide accountability and a gauge of quality
in Ontario’s publicly funded education system. By providing this important evidence about learning,
EQAO acts as a catalyst for increasing the success of Ontario students.
The objective and reliable results from EQAO’s tests complement the information obtained from
classroom and other assessments to provide students, parents, teachers and administrators with
a clear and comprehensive picture of student achievement and a basis for targeted improvement
planning at the individual, school, school board and provincial levels. EQAO helps build capacity
for the appropriate use of data by providing resources that educators, parents, policy-makers and
others in the education community can use to improve learning and teaching. EQAO distributes an
individual report to each student who writes a test, and posts school, school board and provincial
results on its website (www.eqao.com).
Mandate
EQAO is dedicated to working with the education community and to enhancing the quality and
accountability of the education system in Ontario. This is achieved through student assessments
that produce objective, reliable and relevant information, and through the timely public release of
this information along with recommendations for system improvement.
Values
EQAO values giving all students the opportunity to reach their highest possible level of achievement
and well-being.
EQAO values its role as a service to educators, parents, students, government and the public in
support of teaching and learning in the classroom.
EQAO values credible evidence that informs professional practice and focuses attention on
interventions that improve student success.
EQAO values research that informs large-scale assessment and classroom practice.
EQAO values the dedication and expertise of Ontario’s educators and their involvement in
all aspects of the assessment process and the positive difference their efforts make in student
outcomes.
EQAO values the delivery of its programs and services in a manner that embraces diversity and
moves beyond tolerance and celebration to inclusivity.

Ontario Student Achievement2018–2019
EQAO’s Provincial Elementary School ReportResults of the 2018–2019 Assessments of Reading, Writing and Mathematics,
Primary Division (Grades 1–3) and Junior Division (Grades 4–6)
English-Language Students
© 2019 Queen’s Printer for Ontario
ISBN: 978-1-4868-3743-4 (PDF)
DR. BETTE M. STEPHENSON (1924–2019)
This report is dedicated to the memory of Dr. Stephenson, former EQAO board member and Director Emeritus.
Dr. Stephenson’s lifelong passion was her commitment to public service, and EQAO will remember and cherish her for her many contributions to the agency.

BOARD OF DIRECTORS
Cameron Montgomery, Chair
David Agnew, Vice-Chair
Gail Anderson
Roland Boudreau
Michael Bowe
Emily Brown
Abirami Jeyaratnam
Jim Marsh
Pierre Riopel
Norah Marsh, Chief Executive Officer
EQAO’s Provincial Elementary School Report, 2018–2019
MESSAGE FROM THE CHAIR OF THE BOARD OF DIRECTORS
On behalf of the Board of Directors of the Education Quality and Accountability Office (EQAO),
I am pleased to present Ontario Student Achievement: Provincial Elementary School Report:
Results of the 2018–2019 Assessments of Reading, Writing and Mathematics, Primary Division
(Grades 1–3) and Junior Division (Grades 4–6).
The objective data EQAO offers through its province-wide assessments contribute to
supporting public accountability, equity and improvements in our education system. By
assessing each student’s math and literacy skills in relation to curriculum expectations, EQAO
can shed light on areas that require further attention at a systemic and individual student level,
ensuring the education system continues to meet the current and future needs of every
Ontario student.
EQAO’s Assessments of Reading, Writing and Mathematics, Primary Division (Grades 1–3)
and Junior Division (Grades 4–6), administered at key stages in a child’s learning development,
give a measurement of student achievement in numeracy and literacy. The information gained
from cohort tracking helps us understand learning trends over time, informs targeted strategies
implemented by policy makers and educators, and is useful for researchers, parents and
guardians, and the rest of the public alike.
As one source of information among many others, the data provided by EQAO assessments
are a gauge of the strengths and weaknesses of our publicly funded education system. EQAO
is as always committed to helping the education community provide initiatives that will benefit
students and prepare them for a successful future.
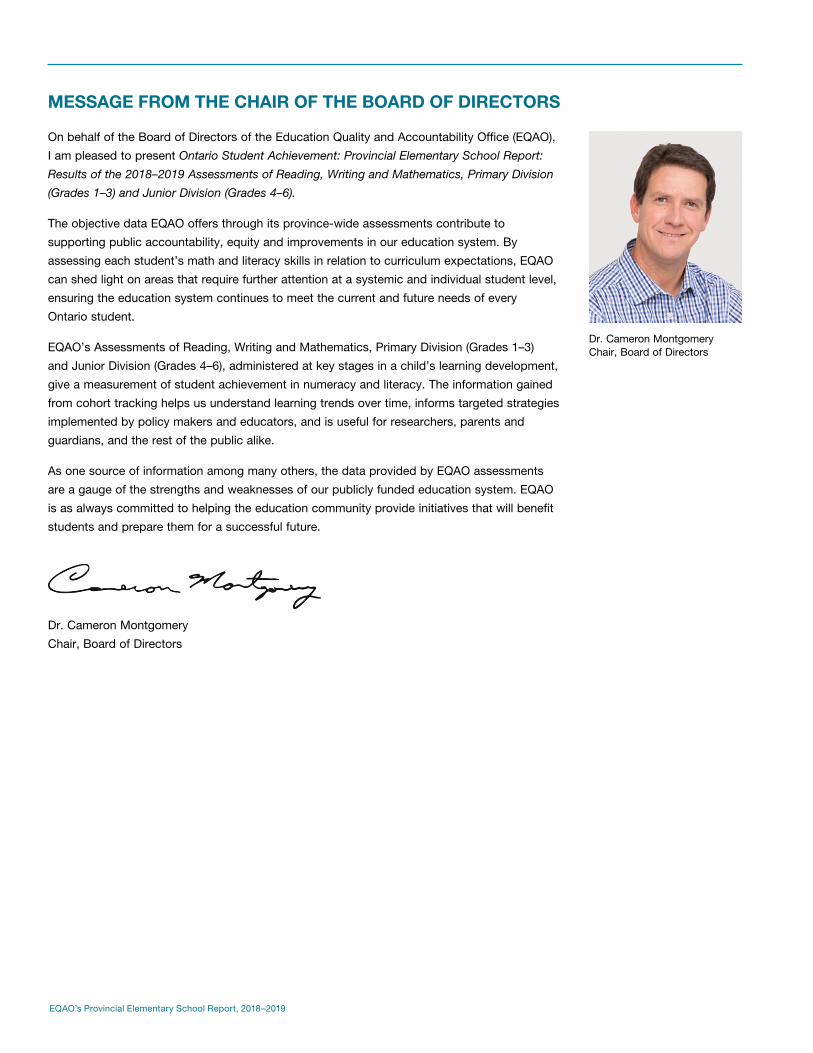
Dr. Cameron Montgomery
Chair, Board of Directors
Dr. Cameron Montgomery Chair, Board of Directors
EQAO’s Provincial Elementary School Report, 2018–2019
MESSAGE FROM THE CEO
On behalf of the EQAO staff, it is my pleasure to present the provincial-level results of the
2018–2019 primary- and junior-division Assessments of Reading, Writing and Mathematics.
We are committed to providing independent data that support student success by highlighting
trends in mathematics and literacy learning across Ontario.
To build a full picture of learners’ contexts and the factors that influence achievement, it is
important to consider assessment results alongside other information, such as demographic
data and EQAO questionnaire responses. In mathematics, for instance, responses to EQAO’s
Student Questionnaire show that at the elementary level, fewer than 60% of students reported
liking or being good at mathematics. Research based on EQAO data also reveals that, in
Grades 3 and 6, Ontario students’ basic knowledge of fundamental mathematics skills is
stronger than their ability to apply those skills to a problem or think critically to determine an
answer. Elementary teacher responses to our questionnaires show that a variety of instructional
strategies are used to teach mathematics. According to EQAO data this year, the trends in
mathematics remained relatively consistent, except for the decline in achievement results
among students in Grade 3.
With respect to literacy, this year most students in Grades 3 and 6 indicated that they see
themselves as good readers, yet proportions smaller than 50% of students like to read and
write and see themselves as good writers. According to our assessment data this year, the
trends in literacy are consistent, except for the decline in writing among students in Grade 3.
Some observations drawn from EQAO data may prompt further inquiry within a school’s
context. For example, EQAO research suggests that students’ attitudes toward mathematics
at a young age can influence their long-term achievement; it is therefore worth considering
what can be done to promote students’ positive attitudes toward this subject. In literacy, the
fact that reading and writing achievement trends in Grade 6 are consistently higher than those
in Grade 3 may also reflect students’ developmental growth. We know that students can
overcome learning challenges when the right kind of supports are in place. EQAO data clearly
demonstrate that students with gaps in their learning at an early age can go on and achieve at
a high level in academic courses in secondary school. EQAO data, along with information from
other sources, can be used to support inclusive strategies benefiting each child and youth of
this province.
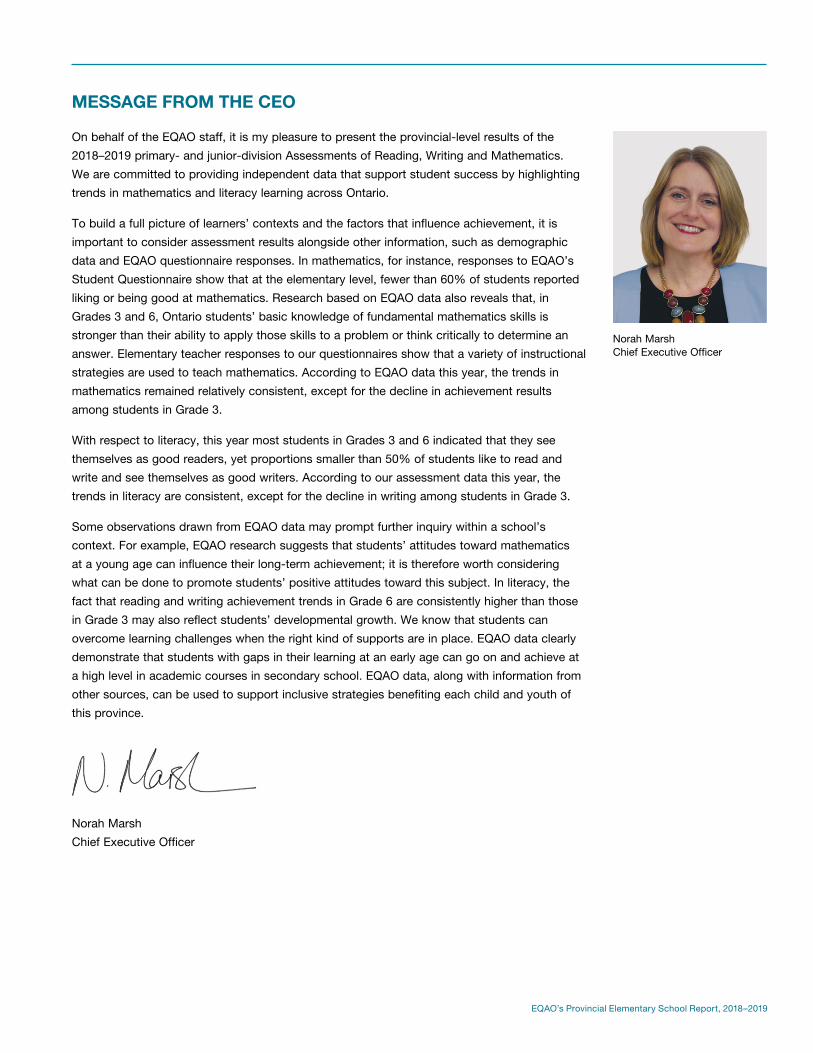
Norah Marsh
Chief Executive Officer
Norah Marsh Chief Executive Officer

EQAO’s Provincial Elementary School Report, 2018–2019
THE EQAO ASSESSMENT PROCESS
About the Primary- and Junior-Division Assessments
EQAO conducts several province-wide tests, among them
the Assessments of Reading, Writing and Mathematics,
Primary and Junior Divisions. The primary- and junior-division
assessments are conducted annually and involve all Grades
3 and 6 students in publicly funded schools in Ontario. The
tests measure how well students have met the provincial
expectations for the subjects assessed, as outlined in The
Ontario Curriculum.
Design and Development
All EQAO tests are developed in keeping with the Principles
for Fair Student Assessment Practices for Education in Canada
(1993), a document created by representatives of national
education institutions and associations and widely endorsed
by Canada’s education community. EQAO consults with
internationally recognized experts in large-scale assessment
for all aspects of the tests: design, development, bias reviews,
field testing, administration, scoring and reporting. Educators
from across the province also work with EQAO on all aspects
of the tests, including question development and review (i.e.,
for bias, curriculum connection and content), scoring-material
development and scoring.
Parallel English- and French-language versions of the tests
are developed. Each version has the same number and types
of questions but reflects variations in the curricula for the two
languages. The tests contain multiple-choice questions, open-
response questions and writing tasks through which students
can demonstrate what they know and can do. Grades 3 and 6
students are assessed in three key subject areas:
Reading: using a variety of reading strategies and
conventions, understanding concepts, making inferences and
connecting ideas
Writing: using writing strategies and language conventions,
understanding assigned tasks, organizing ideas and
communicating with the reader
Mathematics: demonstrating knowledge and skills across the
five strands of mathematics: number sense and numeration;
measurement; geometry and spatial sense; patterning and
algebra; and data management and probability
Consistency and Fairness
Each year, schools are sent English- or French-language
administration and accommodation guides. These guides
provide instructions to ensure that consistent administrative
and accommodation procedures are followed. The guides
describe in detail what is expected of educators involved in
the administration of the tests, including
• professional responsibilities for the administration of
the tests;
• detailed steps to follow (e.g., preparation of materials
for distribution to students, administration and return of
materials to EQAO) and
• the accommodations, special provisions and exemptions
allowed for students with special education needs and for
English language learners.

EQAO’s Provincial Elementary School Report, 2018–2019
Quality Assurance
EQAO has established quality-assurance procedures to help
ensure that its assessments are administered consistently and
fairly across the province and that the data produced are valid
and reliable. EQAO follows a number of procedures to ensure
that parents, educators and the public have confidence in the
validity and reliability of the results reported:
• Quality-assurance monitors: EQAO contracts quality-
assurance monitors to visit a random sample of schools
in order to observe the administration of the assessments
to determine the extent to which EQAO guidelines are
being followed.
• Examination of test materials: Following each
assessment, EQAO looks for evidence of possible
irregularities in administration. This is done through an
examination of test materials prior to scoring.
• Follow-up on reports of irregularities: EQAO
systematically follows up on any reports of irregularities
received from principals, teachers, parents and others.
• Database analyses: EQAO conducts statistical analyses
of student response data to identify student response
patterns that suggest the possibility of collusion between
two or more students.
Scoring
EQAO scoring procedures are designed to ensure accurate,
fair and reliable results for all students. Before scoring takes
place, all student booklets are scrambled so that they can be
distributed randomly to scorers. All student booklets go through
“blind scoring,” with no information on the student work that
could identify a student. EQAO’s scoring process includes
scorer training, which requires successful completion of a
qualifying test, and monitoring for validity and reliability. The
validity and reliability of scoring is tracked daily at the scoring
site, and retraining occurs if it is required. Students’ responses
to open-response mathematics questions, reading questions
and writing prompts are scored by qualified Ontario educators.
Given the EQAO scoring process, parents and students can
be assured that the results obtained are a reliable indication of
the students’ work and that the work has been scored against
the same standard, which has been applied consistently for all
students across the province and from year to year.
Reporting
For the primary- and junior-division assessments, EQAO
uses a four-level scale to report on student achievement.
This scale is based on The Ontario Curriculum, which sets
Level 3 as the provincial standard. Levels 1 and 2 indicate
achievement below the provincial standard, while Level 4
indicates achievement above it.
The results of the tests yield individual, school and school-
board data on student achievement. EQAO posts board
and school results on its website for public access. As well,
EQAO publishes an annual provincial report for education
stakeholders and the general public.
Data from the tests provide valuable information to support
improvement planning at the school, school-board and
provincial levels.


1 EQAO’s Provincial Elementary School Report, 2018–2019
Key Observations
Assessments of Reading, Writing and Mathematics, Primary and Junior Divisions . . . . . . . . . . . . . . . . . . . . . . . . . . . . . . 2
Contextual Information—Questionnaire Results Over Time
Student Questionnaire Results . . . . . . . . . . . . . . . . . . . . . . . . . . . . . . . . . . . . . . . . . . . . . . . . . . . . . . . . . . . . . . . . . . . . . . . 5
Teacher and Principal Questionnaire Results . . . . . . . . . . . . . . . . . . . . . . . . . . . . . . . . . . . . . . . . . . . . . . . . . . . . . . . . . . 16
Contextual Information—Demographic Information and Participation Rates Over Time . . . . . . . . . . . . . . 24
Achievement Results—Primary Division
Results for All Students . . . . . . . . . . . . . . . . . . . . . . . . . . . . . . . . . . . . . . . . . . . . . . . . . . . . . . . . . . . . . . . . . . . . . . . . . . . 26
Results by Gender . . . . . . . . . . . . . . . . . . . . . . . . . . . . . . . . . . . . . . . . . . . . . . . . . . . . . . . . . . . . . . . . . . . . . . . . . . . . . . . 29
Results by Student Status . . . . . . . . . . . . . . . . . . . . . . . . . . . . . . . . . . . . . . . . . . . . . . . . . . . . . . . . . . . . . . . . . . . . . . . . . 30
Achievement Results—Junior Division
Results for All Students . . . . . . . . . . . . . . . . . . . . . . . . . . . . . . . . . . . . . . . . . . . . . . . . . . . . . . . . . . . . . . . . . . . . . . . . . . . 32
Results by Gender . . . . . . . . . . . . . . . . . . . . . . . . . . . . . . . . . . . . . . . . . . . . . . . . . . . . . . . . . . . . . . . . . . . . . . . . . . . . . . . 35
Results by Student Status . . . . . . . . . . . . . . . . . . . . . . . . . . . . . . . . . . . . . . . . . . . . . . . . . . . . . . . . . . . . . . . . . . . . . . . . . 36
Cohort Tracking—Grade 3 to Grade 6
Tracking Student Progress from Grade 3 in 2016 to Grade 6 in 2019 . . . . . . . . . . . . . . . . . . . . . . . . . . . . . . . . . . . . . . . . 38
Explanation of Terms
Primary and Junior Assessments of Reading, Writing and Mathematics . . . . . . . . . . . . . . . . . . . . . . . . . . . . . . . . . . . . . 39
Contents

EQAO’s Provincial Elementary School Report, 2018–2019 2
Key Observations
ASSESSMENTS OF READING, WRITING AND MATHEMATICS, PRIMARY AND JUNIOR DIVISIONS
Learners’ Context
Data from EQAO’s Student Questionnaires offer valuable attitudinal and behavioural information about student learning in reading, writing and mathematics. This type of information is important and should be considered alongside assessment results and data from other sources to build a full understanding of student learning in Ontario.
Below is information about responses from students who completed EQAO’s Student Questionnaire.
• While less than half of elementary-level students like to read (44% in Grade 3 and 42% in Grade
6), most students see themselves as good readers (62% in Grade 3 and 67% in Grade 6).
• Fewer than half of elementary-level students like to write (45% in Grade 3 and 39% in Grade 6),
and a similar percentage see themselves as good writers (48% in Grade 3 and 40% in Grade 6).
• Higher percentages of Grade 3 students like mathematics and see themselves as good at
mathematics (57% and 55% respectively) than do Grade 6 students (50% and 52% respectively).
Assessment Results
Reading
The percentages of Grades 3 and 6 students who met the provincial reading standard (Levels 3
and 4) have remained stable since 2016. In 2019,
• 74% of Grade 3 students met the provincial reading standard on the primary-division
assessment.
• 81% of Grade 6 students met the provincial reading standard on the junior-division assessment.
• 47% of Grade 3 students with special education needs met the provincial reading standard.
• 53% of Grade 6 students with special education needs met the provincial reading standard.
Writing
The percentages of Grade 3 and of Grade 6 students who met the provincial writing standard have
decreased and increased respectively since 2016. In 2019,
• 69% of Grade 3 students met the provincial writing standard on the primary-division assessment.
• 82% of Grade 6 students met the provincial writing standard on the junior-division assessment.
• 47% of Grade 3 students with special education needs met the provincial writing standard.
• 54% of Grade 6 students with special education needs met the provincial writing standard.

3 EQAO’s Provincial Elementary School Report, 2018–2019
Key Observations: Assessments of Reading, Writing and Mathematics, Primary and Junior Divisions
Mathematics
The percentages of Grade 3 and Grade 6 students who met the provincial standard in mathematics
have decreased since 2016. In 2019,
• 58% of Grade 3 students met the provincial mathematics standard on the primary-division
assessment.
• 48% of Grade 6 students met the provincial mathematics standard on the junior-division
assessment.
• 26% of Grade 3 students with special education needs met the provincial mathematics standard.
• 17% of Grade 6 students with special education needs met the provincial mathematics standard.
Over the past five years, the share of Grade 3 and Grade 6 students achieving Level 3 has declined,
while the share of students achieving Level 4 has remained stable.
Data Observations
• The persistent discrepancy in achievement between students with special education needs and
those without requires attention.
• EQAO data show that students with learning disabilities are the largest group in the cohort
of students identified as having special education needs. Historically, students with learning
disabilities have had a low level of achievement despite having average to above average
intelligence. It would be beneficial to review supports available and strategies for success.
• The fact that reading and writing achievement trends in Grade 6 are consistently higher than
those in Grade 3 may be a reflection of students’ developmental growth.


5 EQAO’s Provincial Elementary School Report, 2018–2019
Sec. StartContextual Information—Questionnaire Results Over Time
STUDENT QUESTIONNAIRE RESULTS*
The following tables provide results for items from the questionnaires completed by students during the 2018–2019 assessments.
Attitudes Toward Reading and Writing—Grade 3
2014–2015
2015–2016
2016–2017
2017–2018
2018–2019
2014–2015
2015–2016
2016–2017
2017–2018
2018–2019
Female Male
Grade 3 students who completed the questionnaire
EC # = 59 170
# = 62 721
# = 61 939
# = 61 742 EC # =
61 384# =
65 256# =
64 373# =
63 822
Percentage of students who answered “most of the time” to the following statements:†
I like to read. EC 53% 51% 51% 49% EC 42% 40% 41% 39%
I am a good reader. EC 66% 65% 65% 64% EC 63% 62% 62% 61%
I am able to understand difficult reading passages.
EC 27% 28% 27% 27% EC 31% 32% 30% 31%
I do my best when I do reading activities in class.
EC 77% 77% 76% 77% EC 69% 68% 67% 67%
I like to write. EC 60% 54% 58% 51% EC 45% 40% 43% 39%
I am a good writer. EC 57% 55% 55% 54% EC 44% 42% 43% 42%
I am able to communicate my ideas in writing.
EC 46% 45% 46% 45% EC 43% 42% 43% 42%
I do my best when I do writing activities in class.
EC 76% 73% 75% 73% EC 67% 63% 66% 63%
* Numbers and percentages are based on the total number of students who completed the questionnaire and for whom gender data were available.† The other response options were “never” and “sometimes.”EC: Due to exceptional circumstances, provincial data for 2014–2015 are unavailable for the reporting of provincial results.

Attitudes Toward Reading and Writing—Grade 6
2014–2015
2015–2016
2016–2017
2017–2018
2018–2019
2014–2015
2015–2016
2016–2017
2017–2018
2018–2019
Female Male
Grade 6 students who completed the questionnaire
EC # = 58 364
# = 61 577
# = 62 073
# = 64 024 EC # =
61 087# =
64 445# =
64 350# =
66 514
Percentage of students who answered “most of the time” to the following statements:*
I like to read. EC 54% 53% 51% 49% EC 38% 37% 36% 35%
I am a good reader. EC 71% 71% 71% 70% EC 64% 64% 64% 64%
I am able to understand difficult reading passages.
EC 40% 41% 41% 41% EC 42% 43% 42% 43%
I do my best when I do reading activities in class.
EC 76% 78% 77% 76% EC 66% 68% 66% 66%
I like to write. EC 55% 51% 54% 50% EC 31% 28% 30% 28%
I am a good writer. EC 51% 50% 50% 47% EC 35% 34% 34% 33%
I am able to communicate my ideas in writing.
EC 54% 53% 55% 53% EC 45% 44% 45% 44%
I do my best when I do writing activities in class.
EC 76% 75% 77% 75% EC 64% 63% 64% 62%
* The other response options were “never” and “sometimes.”EC: Due to exceptional circumstances, provincial data for 2014–2015 are unavailable for the reporting of provincial results.
Contextual Information—Questionnaire Results Over Time
6 EQAO’s Provincial Elementary School Report, 2018–2019

Contextual Information—Questionnaire Results Over Time
7 EQAO’s Provincial Elementary School Report, 2018–2019
Learning Strategies Used in Reading and Writing
2014–2015
2015–2016
2016–2017
2017–2018
2018–2019
2014–2015
2015–2016
2016–2017
2017–2018
2018–2019
Female Male
Grade 3 students who completed the questionnaire
EC # = 59 170
# = 62 721
# = 61 939
# = 61 742 EC # =
61 384# =
65 256# =
64 373# =
63 822
Percentage of students who answered “most of the time” to the following statements:*
I make sure I understand what I am reading.
EC 68% 67% 67% 67% EC 62% 62% 62% 62%
I organize my ideas before I start to write. EC 44% 44% 43% 43% EC 38% 36% 37% 36%
I edit my writing to make it better. EC 47% 45% 45% 43% EC 40% 36% 38% 36%
I check my writing for spelling and grammar.
EC 49% 48% 48% 47% EC 42% 40% 41% 40%
2014–2015
2015–2016
2016–2017
2017–2018
2018–2019
2014–2015
2015–2016
2016–2017
2017–2018
2018–2019
Female Male
Grade 6 students who completed the questionnaire
EC # = 58 364
# = 61 577
# = 62 073
# = 64 024 EC # =
61 087# =
64 445# =
64 350# =
66 514
Percentage of students who answered “most of the time” to the following statements:*
I make sure I understand what I am reading.
EC 76% 75% 75% 74% EC 68% 68% 68% 68%
I organize my ideas before I start to write. EC 39% 36% 38% 35% EC 30% 27% 30% 27%
I edit my writing to make it better. EC 58% 54% 58% 53% EC 45% 40% 45% 41%
I check my writing for spelling and grammar.
EC 59% 56% 59% 56% EC 48% 45% 49% 47%
* The other response options were “never” and “sometimes.”EC: Due to exceptional circumstances, provincial data for 2014–2015 are unavailable for the reporting of provincial results.

Contextual Information—Questionnaire Results Over Time
8 EQAO’s Provincial Elementary School Report, 2018–2019
Attitudes Toward Mathematics
2014–2015
2015–2016
2016–2017
2017–2018
2018–2019
2014–2015
2015–2016
2016–2017
2017–2018
2018–2019
Female Male
Grade 3 students who completed the questionnaire
EC # = 59 170
# = 62 721
# = 61 939
# = 61 742 EC # =
61 384# =
65 256# =
64 373# =
63 822
Percentage of students who answered “most of the time” to the following statements:*
I like mathematics. EC 54% 53% 53% 51% EC 63% 63% 63% 62%
I am good at mathematics. EC 49% 49% 49% 48% EC 63% 62% 63% 62%
I am able to answer difficult mathematics questions.
EC 31% 31% 31% 29% EC 46% 46% 46% 45%
I do my best when I do mathematics activities in class.
EC 80% 78% 80% 78% EC 78% 75% 77% 75%
2014–2015
2015–2016
2016–2017
2017–2018
2018–2019
2014–2015
2015–2016
2016–2017
2017–2018
2018–2019
Female Male
Grade 6 students who completed the questionnaire
EC # = 58 364
# = 61 577
# = 62 073
# = 64 024 EC # =
61 087# =
64 445# =
64 350# =
66 514
Percentage of students who answered “most of the time” to the following statements:*
I like mathematics. EC 42% 43% 42% 41% EC 57% 58% 58% 58%
I am good at mathematics. EC 45% 46% 44% 44% EC 59% 61% 60% 60%
I am able to answer difficult mathematics questions.
EC 30% 31% 29% 30% EC 46% 48% 47% 48%
I do my best when I do mathematics activities in class.
EC 77% 77% 78% 76% EC 77% 77% 78% 76%
* The other response options were “never” and “sometimes.”EC: Due to exceptional circumstances, provincial data for 2014–2015 are unavailable for the reporting of provincial results.

Contextual Information—Questionnaire Results Over Time
9 EQAO’s Provincial Elementary School Report, 2018–2019
Learning Strategies Used in Mathematics
2014–2015
2015–2016
2016–2017
2017–2018
2018–2019
2014–2015
2015–2016
2016–2017
2017–2018
2018–2019
Female Male
Grade 3 students who completed the questionnaire
EC # = 59 170
# = 62 721
# = 61 939
# = 61 742 EC # =
61 384# =
65 256# =
64 373# =
63 822
Percentage of students who indicated they do the following “most of the time” when working on a mathematics problem:*
I read over the problem first to make sure I know what I am supposed to do.
EC 73% 72% 72% 72% EC 65% 63% 64% 63%
I think about the steps I will use to solve the problem.
EC 46% 51% 45% 49% EC 44% 47% 43% 47%
2014–2015
2015–2016
2016–2017
2017–2018
2018–2019
2014–2015
2015–2016
2016–2017
2017–2018
2018–2019
Female Male
Grade 6 students who completed the questionnaire
EC # = 58 364
# = 61 577
# = 62 073
# = 64 024 EC # =
61 087# =
64 445# =
64 350# =
66 514
Percentage of students who indicated they do the following “most of the time” when working on a mathematics problem:*
I read over the problem first to make sure I know what I am supposed to do.
EC 86% 84% 84% 84% EC 77% 76% 76% 77%
I think about the steps I will use to solve the problem.
EC 52% 54% 51% 55% EC 49% 51% 50% 53%
* The other response options were “never” and “sometimes.”EC: Due to exceptional circumstances, provincial data for 2014–2015 are unavailable for the reporting of provincial results.

Contextual Information—Questionnaire Results Over Time
10 EQAO’s Provincial Elementary School Report, 2018–2019
* The other response options were “never,” “1 or 2 times a month” and “1 to 3 times a week.”† The percentages are based on the number of students who answered “1 to 3 times a week” or “every day or almost every day.”EC: Due to exceptional circumstances, provincial data for 2014–2015 are unavailable for the reporting of provincial results.
Out of School Activities
2014–2015
2015–2016
2016–2017
2017–2018
2018–2019
2014–2015
2015–2016
2016–2017
2017–2018
2018–2019
Female Male
Grade 3 students who completed the questionnaire
EC # = 59 170
# = 62 721
# = 61 939
# = 61 742 EC # =
61 384# =
65 256# =
64 373# =
63 822
Percentage of students who indicated that they do the following “every day or almost every day” when they are not at school:*
Participate in sports or other physical activities
EC 36% 33% 34% 32% EC 48% 44% 44% 42%
Percentage of students who indicated that they do the following at least once a week when they are not at school:†
Participate in art, music or drama activities
EC 54% 53% 53% 53% EC 37% 34% 36% 35%
Participate in after-school clubs EC 29% 29% 29% 29% EC 25% 24% 25% 24%
2014–2015
2015–2016
2016–2017
2017–2018
2018–2019
2014–2015
2015–2016
2016–2017
2017–2018
2018–2019
Female Male
Grade 6 students who completed the questionnaire
EC # = 58 364
# = 61 577
# = 62 073
# = 64 024 EC # =
61 087# =
64 445# =
64 350# =
66 514
Percentage of students who indicated that they do the following “every day or almost every day” when they are not at school:*
Participate in sports or other physical activities
EC 37% 35% 36% 36% EC 49% 48% 48% 47%
Percentage of students who indicated that they do the following at least once a week when they are not at school:†
Participate in art, music or drama activities
EC 49% 49% 50% 51% EC 30% 29% 32% 31%
Participate in after-school clubs EC 32% 32% 33% 33% EC 26% 26% 26% 26%

Contextual Information—Questionnaire Results Over Time
11 EQAO’s Provincial Elementary School Report, 2018–2019
* In 2015–2016 and 2017–2018, this item was not included in the questionnaire.† The other response options were “never,” “1 or 2 times a month” and “1 to 3 times a week.”EC: Due to exceptional circumstances, provincial data for 2014–2015 are unavailable for the reporting of provincial results.
Out of School Activities (continued)
2014–2015
2015–2016*
2016–2017
2017–2018*
2018–2019
2014–2015
2015–2016*
2016–2017
2017–2018*
2018–2019
Female Male
Grade 3 students who completed the questionnaire
EC # = 62 721
# = 61 742 EC # =
65 256# =
63 822
Percentage of students who indicated they read the following “every day or almost every day” when they are not at school:†
Stories or novels EC 42% 40% EC 33% 34%
Comics EC 15% 17% EC 23% 25%
Books, newspapers, magazines or websites for information
EC 21% 19% EC 19% 19%
E-mail, text or instant messages EC 25% 24% EC 20% 20%
Any other type of reading material EC 35% 33% EC 28% 28%
2014–2015
2015–2016*
2016–2017
2017–2018*
2018–2019
2014–2015
2015–2016*
2016–2017
2017–2018*
2018–2019
Female Male
Grade 6 students who completed the questionnaire
EC # = 61 577
# = 64 024 EC # =
64 445# =
66 514
Percentage of students who indicated they read the following “every day or almost every day” when they are not at school:†
Stories or novels EC 35% 32% EC 23% 23%
Comics EC 10% 12% EC 15% 15%
Books, newspapers, magazines or websites for information
EC 25% 20% EC 24% 21%
E-mail, text or instant messages EC 64% 63% EC 49% 47%
Any other type of reading material EC 29% 27% EC 24% 23%

Contextual Information—Questionnaire Results Over Time
12 EQAO’s Provincial Elementary School Report, 2018–2019
* In 2015–2016 and 2017–2018, this item was not included in the questionnaire.† The other response options were “never,” “1 or 2 times a month” and “1 to 3 times a week.”EC: Due to exceptional circumstances, provincial data for 2014–2015 are unavailable for the reporting of provincial results.
Out of School Activities (continued)
2014–2015
2015–2016*
2016–2017
2017–2018*
2018–2019
2014–2015
2015–2016*
2016–2017
2017–2018*
2018–2019
Female Male
Grade 3 students who completed the questionnaire
EC # = 62 721
# = 61 742 EC # =
65 256# =
63 822
Percentage of students who indicated they write the following “every day or almost every day” when they are not at school:†
Stories EC 20% 19% EC 14% 15%
Journal entries EC 17% 17% EC 9% 9%
E-mail, text or instant messages EC 24% 23% EC 19% 18%
Letters EC 13% 13% EC 10% 10%
2014–2015
2015–2016*
2016–2017
2017–2018*
2018–2019
2014–2015
2015–2016*
2016–2017
2017–2018*
2018–2019
Female Male
Grade 6 students who completed the questionnaire
EC # = 61 577
# = 64 024 EC # =
64 445# =
66 514
Percentage of students who indicated they write the following “every day or almost every day” when they are not at school:†
Stories EC 8% 9% EC 5% 6%
Journal entries EC 10% 11% EC 4% 4%
E-mail, text or instant messages EC 61% 62% EC 45% 45%
Letters EC 4% 4% EC 3% 4%

Contextual Information—Questionnaire Results Over Time
13 EQAO’s Provincial Elementary School Report, 2018–2019
* The other response options were “never,” “1 or 2 times a month” and “1 to 3 times a week.”EC: Due to exceptional circumstances, provincial data for 2014–2015 are unavailable for the reporting of provincial results.
Parental Involvement
2014–2015
2015–2016
2016–2017
2017–2018
2018–2019
2014–2015
2015–2016
2016–2017
2017–2018
2018–2019
Female Male
Grade 3 students who completed the questionnaire
EC # = 59 170
# = 62 721
# = 61 939
# = 61 742 EC # =
61 384# =
65 256# =
64 373# =
63 822
Percentage of students who indicated that they do the following “every day or almost every day” with a parent, guardian or another adult who lives with them:*
Talk about the activities they do in school EC 55% 58% 53% 58% EC 46% 49% 44% 50%
Talk about the reading and writing work they do in school
EC 34% 36% 33% 36% EC 28% 29% 27% 30%
Talk about the mathematics work they do in school
EC 39% 39% 38% 38% EC 35% 34% 34% 35%
Read together EC 33% 29% 33% 29% EC 29% 25% 28% 25%
Look at their school agenda EC 54% 47% 47% 43% EC 52% 45% 46% 42%
Use a computer together EC 15% 15% 13% 13% EC 15% 16% 14% 15%
2014–2015
2015–2016
2016–2017
2017–2018
2018–2019
2014–2015
2015–2016
2016–2017
2017–2018
2018–2019
Female Male
Grade 6 students who completed the questionnaire
EC # = 58 364
# = 61 577
# = 62 073
# = 64 024 EC # =
61 087# =
64 445# =
64 350# =
66 514
Percentage of students who indicated that they do the following “every day or almost every day” with a parent, guardian or another adult who lives with them:*
Talk about the activities they do in school EC 49% 59% 51% 60% EC 42% 53% 43% 55%
Talk about the reading and writing work they do in school
EC 24% 33% 25% 33% EC 20% 28% 20% 30%
Talk about the mathematics work they do in school
EC 35% 41% 36% 41% EC 31% 37% 33% 38%
Read together EC 7% 7% 8% 7% EC 8% 7% 9% 8%
Look at their school agenda EC 29% 25% 24% 21% EC 29% 26% 25% 23%
Use a computer together EC 9% 10% 9% 9% EC 10% 11% 11% 11%

Contextual Information—Questionnaire Results Over Time
14 EQAO’s Provincial Elementary School Report, 2018–2019
EC: Due to exceptional circumstances, provincial data for 2014–2015 are unavailable for the reporting of provincial results.
Schools Attended
2014–2015
2015–2016
2016–2017
2017–2018
2018–2019
2014–2015
2015–2016
2016–2017
2017–2018
2018–2019
Female Male
Grade 3 students who completed the questionnaire
EC # = 59 170
# = 62 721
# = 61 939
# = 61 742 EC # =
61 384# =
65 256# =
64 373# =
63 822
Percentage of students indicating they attended the following number of schools before this one:
Only this school/1 other school EC 78% 78% 78% 78% EC 77% 77% 77% 78%
2 other schools/3 other schools EC 16% 16% 15% 15% EC 16% 16% 16% 15%
4 other schools or more EC 4% 4% 4% 4% EC 4% 4% 4% 4%
2014–2015
2015–2016
2016–2017
2017–2018
2018–2019
2014–2015
2015–2016
2016–2017
2017–2018
2018–2019
Female Male
Grade 6 students who completed the questionnaire
EC # = 58 364
# = 61 577
# = 62 073
# = 64 024 EC # =
61 087# =
64 445# =
64 350# =
66 514
Percentage of students indicating they attended the following number of schools before this one:
Only this school/1 other school EC 69% 69% 70% 69% EC 68% 68% 70% 68%
2 other schools/3 other schools EC 22% 22% 22% 23% EC 22% 22% 22% 22%
4 other schools or more EC 6% 6% 6% 6% EC 6% 6% 6% 6%

Contextual Information—Questionnaire Results Over Time
15 EQAO’s Provincial Elementary School Report, 2018–2019
* In 2015–2016 and 2017–2018, this question was not included in the questionnaire.EC: Due to exceptional circumstances, provincial data for 2014–2015 are unavailable for the reporting of provincial results.
Screen Time (Television)
2014–2015
2015–2016*
2016–2017
2017–2018*
2018–2019
2014–2015
2015–2016*
2016–2017
2017–2018*
2018–2019
Female Male
Grade 3 students who completed the questionnaire
EC # = 62 721
# = 61 742 EC # =
65 256# =
63 822
Percentage of students indicating they normally watch the following number of TV programs:
Before School
4 programs or more EC 8% 8% EC 13% 14%
After School
4 programs or more EC 38% 38% EC 43% 43%

Contextual Information—Questionnaire Results Over Time
16 EQAO’s Provincial Elementary School Report, 2018–2019
* The percentages represent teachers who responded “once” or “2–3 times.”† The percentages represent teachers who responded “2–3 times,” “about once a month,” “about once every 2 weeks” or “at least once a week.”
The other response options were “once” and “never.”EC: Due to exceptional circumstances, provincial data for 2014–2015 are unavailable for the reporting of provincial results.
TEACHER AND PRINCIPAL QUESTIONNAIRE RESULTS
The following tables provide results from a sample of items from the questionnaires completed by teachers and principals during the
2018–2019 administration of the Assessments of Reading, Writing and Mathematics, Primary and Junior Divisions.
Teacher Questionnaire Results—Grade 3
2014–2015 2015–2016 2016–2017 2017–2018 2018–2019
Teachers who completed the questionnaire EC # = 6292 # = 6862 # = 6596 # = 5492
COMMUNICATION WITH PARENTS AND GUARDIANS
Percentage of teachers who shared the following with the majority of parents and guardians of their students at least once this year:*
The links between EQAO assessments and The Ontario Curriculum
EC 56% 60% 59% 57%
The links between EQAO results and instructional and/or assessment strategies
EC 48% 53% 51% 49%
Percentage of teachers who shared the following with the majority of parents and guardians of their students at least 2–3 times this year:†
Instructional strategies for their child EC 80% 82% 81% 79%
Suggestions for what to do at home to support learning EC 89% 90% 88% 87%
Suggestions for resources to use at home to support learning EC 86% 86% 85% 84%
Information about their child’s progress EC 93% 94% 93% 91%
USE OF EQAO RESOURCES
Percentage of teachers who indicated that they used EQAO data (demographic data, assessment and questionnaire results) this year, independently or as a group, to do the following:
To identify how well students are meeting curriculum expectations
EC 66% 75% 76% 75%
To identify areas of strength and areas for improvement in elementary programs
EC 69% 77% 76% 74%
To inform planning of elementary programs EC 57% 65% 63% 62%
Percentage of teachers who indicated that they used EQAO sample student assessments and scoring guides this year, independently or as a group, in the following ways:
As a model for designing assessments EC 77% 78% 77% 76%
To inform classroom instruction EC 84% 85% 84% 83%
Contextual Information—Questionnaire Results Over Time
17 EQAO’s Provincial Elementary School Report, 2018–2019
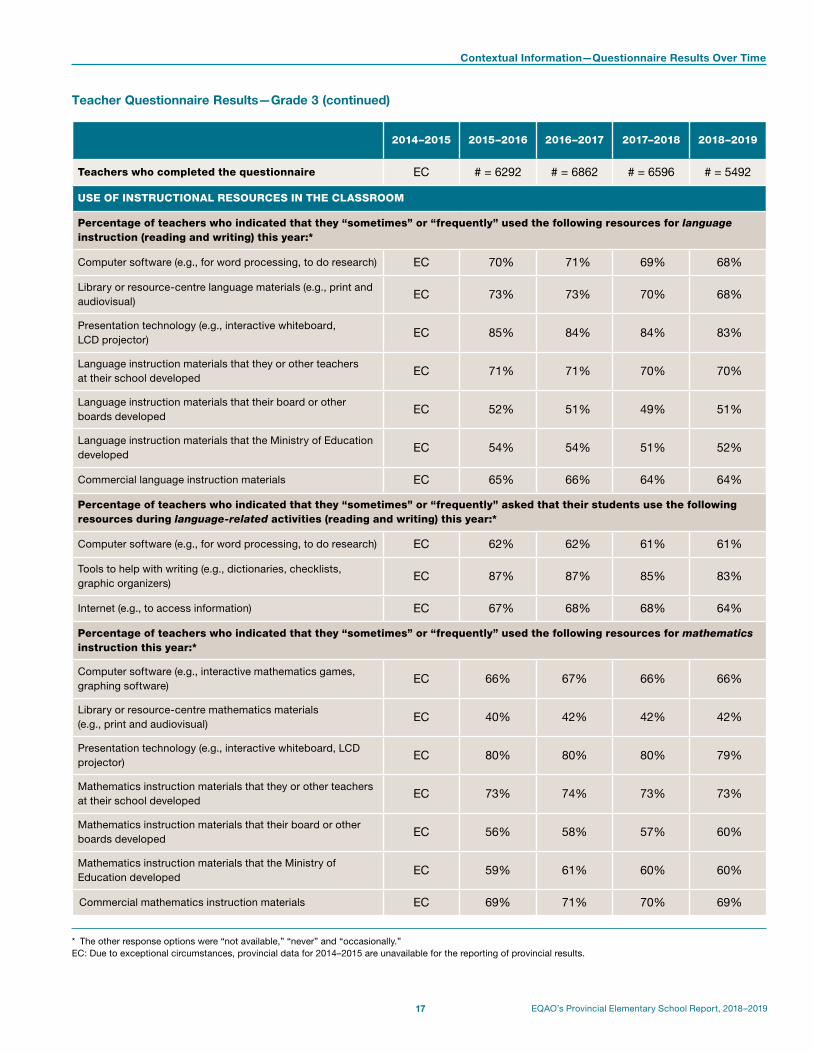
* The other response options were “not available,” “never” and “occasionally.”EC: Due to exceptional circumstances, provincial data for 2014–2015 are unavailable for the reporting of provincial results.
Teacher Questionnaire Results—Grade 3 (continued)
2014–2015 2015–2016 2016–2017 2017–2018 2018–2019
Teachers who completed the questionnaire EC # = 6292 # = 6862 # = 6596 # = 5492
USE OF INSTRUCTIONAL RESOURCES IN THE CLASSROOM
Percentage of teachers who indicated that they “sometimes” or “frequently” used the following resources for language instruction (reading and writing) this year:*
Computer software (e.g., for word processing, to do research) EC 70% 71% 69% 68%
Library or resource-centre language materials (e.g., print and audiovisual)
EC 73% 73% 70% 68%
Presentation technology (e.g., interactive whiteboard, LCD projector)
EC 85% 84% 84% 83%
Language instruction materials that they or other teachers at their school developed
EC 71% 71% 70% 70%
Language instruction materials that their board or other boards developed
EC 52% 51% 49% 51%
Language instruction materials that the Ministry of Education developed
EC 54% 54% 51% 52%
Commercial language instruction materials EC 65% 66% 64% 64%
Percentage of teachers who indicated that they “sometimes” or “frequently” asked that their students use the following resources during language-related activities (reading and writing) this year:*
Computer software (e.g., for word processing, to do research) EC 62% 62% 61% 61%
Tools to help with writing (e.g., dictionaries, checklists, graphic organizers)
EC 87% 87% 85% 83%
Internet (e.g., to access information) EC 67% 68% 68% 64%
Percentage of teachers who indicated that they “sometimes” or “frequently” used the following resources for mathematics instruction this year:*
Computer software (e.g., interactive mathematics games, graphing software)
EC 66% 67% 66% 66%
Library or resource-centre mathematics materials (e.g., print and audiovisual)
EC 40% 42% 42% 42%
Presentation technology (e.g., interactive whiteboard, LCD projector)
EC 80% 80% 80% 79%
Mathematics instruction materials that they or other teachers at their school developed
EC 73% 74% 73% 73%
Mathematics instruction materials that their board or other boards developed
EC 56% 58% 57% 60%
Mathematics instruction materials that the Ministry of Education developed
EC 59% 61% 60% 60%
Commercial mathematics instruction materials EC 69% 71% 70% 69%

Contextual Information—Questionnaire Results Over Time
18 EQAO’s Provincial Elementary School Report, 2018–2019
* The other response options were “not available,” “never” and “occasionally.”EC: Due to exceptional circumstances, provincial data for 2014–2015 are unavailable for the reporting of provincial results.
Teacher Questionnaire Results—Grade 3 (continued)
2014–2015 2015–2016 2016–2017 2017–2018 2018–2019
Teachers who completed the questionnaire EC # = 6292 # = 6862 # = 6596 # = 5492
USE OF INSTRUCTIONAL RESOURCES IN THE CLASSROOM (CONTINUED)
Percentage of teachers who indicated that they “sometimes” or “frequently” asked that their students use the following resources during mathematics-related activities this year:*
Calculators EC 34% 36% 34% 34%
Concrete manipulatives (e.g., cubes, tiles) EC 94% 94% 93% 92%
Computer software (e.g., interactive mathematics games, graphing software)
EC 69% 71% 70% 69%
The Internet (e.g., to access statistics or other sources of mathematical information)
EC 40% 41% 41% 39%

Contextual Information—Questionnaire Results Over Time
19 EQAO’s Provincial Elementary School Report, 2018–2019
* The percentages represent teachers who responded “once” or “2–3 times.”† The percentages represent teachers who responded “2–3 times,” “about once a month,” “about once every 2 weeks” or “at least once a week.” The other
response options were “once” and “never.”EC: Due to exceptional circumstances, provincial data for 2014–2015 are unavailable for the reporting of provincial results.
Teacher Questionnaire Results—Grade 6
2014–2015 2015–2016 2016–2017 2017–2018 2018–2019
Teachers who completed the questionnaire EC # = 5224 # = 5693 # = 5467 # = 5064
COMMUNICATION WITH PARENTS AND GUARDIANS
Percentage of teachers who shared the following with the majority of parents and guardians of their students at least once this year:*
The links between EQAO assessments and The Ontario Curriculum
EC 50% 55% 53% 51%
The links between EQAO results and instructional and/or assessment strategies
EC 44% 50% 47% 46%
Percentage of teachers who shared the following with the majority of parents and guardians of their students at least 2–3 times this year:†
Instructional strategies for their child EC 72% 75% 74% 73%
Suggestions for what to do at home to support learning EC 82% 84% 83% 83%
Suggestions for resources to use at home to support learning EC 79% 81% 80% 80%
Information about their child’s progress EC 92% 94% 92% 91%
USE OF EQAO RESOURCES
Percentage of teachers who indicated that they used EQAO data (demographic data, assessment and questionnaire results) this year, independently or as a group, to do the following:
To identify how well students are meeting curriculum expectations
EC 66% 75% 73% 73%
To identify areas of strength and areas for improvement in elementary programs
EC 68% 77% 75% 73%
To inform planning of elementary programs EC 55% 63% 62% 61%
Percentage of teachers who indicated that they used EQAO sample student assessments and scoring guides this year, independently or as a group, in the following ways:
As a model for designing assessments EC 74% 75% 75% 75%
To inform classroom instruction EC 80% 81% 80% 80%

Contextual Information—Questionnaire Results Over Time
20 EQAO’s Provincial Elementary School Report, 2018–2019
* Only teachers who teach language responded to this section of the questionnaire.† The other response options were “not available,” “never” and “occasionally.”EC: Due to exceptional circumstances, provincial data for 2014–2015 are unavailable for the reporting of provincial results.
Teacher Questionnaire Results—Grade 6 (continued)
2014–2015 2015–2016 2016–2017 2017–2018 2018–2019
Teachers who responded to the questionnaire* EC # = 4767 # = 5223 # = 4957 # = 4553
USE OF INSTRUCTIONAL RESOURCES IN THE CLASSROOM
Percentage of teachers who indicated that they “sometimes” or “frequently” used the following resources for language instruction (reading and writing) this year:†
Computer software (e.g., for word processing, to do research) EC 91% 91% 92% 92%
Library or resource-centre language materials (e.g., print and audiovisual)
EC 72% 70% 68% 69%
Presentation technology (e.g., interactive whiteboard, LCD projector)
EC 92% 92% 93% 93%
Language instruction materials that they or other teachers at their school developed
EC 74% 75% 74% 75%
Language instruction materials that their board or other boards developed
EC 53% 53% 51% 53%
Language instruction materials that the Ministry of Education developed
EC 52% 53% 51% 51%
Commercial language instruction materials EC 61% 62% 62% 63%
Percentage of teachers who indicated that they “sometimes” or “frequently” asked that their students use the following resources during language-related activities (reading and writing) this year:†
Computer software (e.g., for word processing, to do research) EC 89% 91% 92% 92%
Tools to help with writing (e.g., dictionaries, checklists, graphic organizers)
EC 92% 92% 91% 92%
Internet (e.g., to access information) EC 92% 93% 94% 93%

Contextual Information—Questionnaire Results Over Time
21 EQAO’s Provincial Elementary School Report, 2018–2019
* Only teachers who teach mathematics responded to this section of the questionnaire.† The other response options were “not available,” “never” and “occasionally.”EC: Due to exceptional circumstances, provincial data for 2014–2015 are unavailable for the reporting of provincial results.
Teacher Questionnaire Results—Grade 6 (continued)
2014–2015 2015–2016 2016–2017 2017–2018 2018–2019
Teachers who responded to the questionnaire* EC # = 4676 # = 5199 # = 4936 # = 4514
USE OF INSTRUCTIONAL RESOURCES IN THE CLASSROOM (CONTINUED)
Percentage of teachers who indicated that they “sometimes” or “frequently” used the following resources for mathematics instruction this year:†
Computer software (e.g., interactive mathematics games, graphing software)
EC 67% 68% 70% 70%
Library or resource-centre mathematics materials (e.g., print and audiovisual)
EC 36% 39% 37% 37%
Presentation technology (e.g., interactive whiteboard, LCD projector)
EC 86% 85% 87% 88%
Mathematics instruction materials that they or other teachers at their school developed
EC 76% 77% 77% 77%
Mathematics instruction materials that their board or other boards developed
EC 58% 60% 61% 62%
Mathematics instruction materials that the Ministry of Education developed
EC 60% 61% 62% 60%
Commercial mathematics instruction materials EC 70% 70% 69% 70%
Percentage of teachers who indicated that they “sometimes” or “frequently” asked that their students use the following resources during mathematics-related activities this year:†
Calculators EC 86% 85% 85% 84%
Concrete manipulatives (e.g., cubes, tiles) EC 90% 91% 91% 91%
Computer software (e.g., interactive mathematics games, graphing software)
EC 67% 68% 69% 70%
The Internet (e.g., to access statistics or other sources of mathematical information)
EC 55% 57% 57% 57%
Contextual Information—Questionnaire Results Over Time
22 EQAO’s Provincial Elementary School Report, 2018–2019
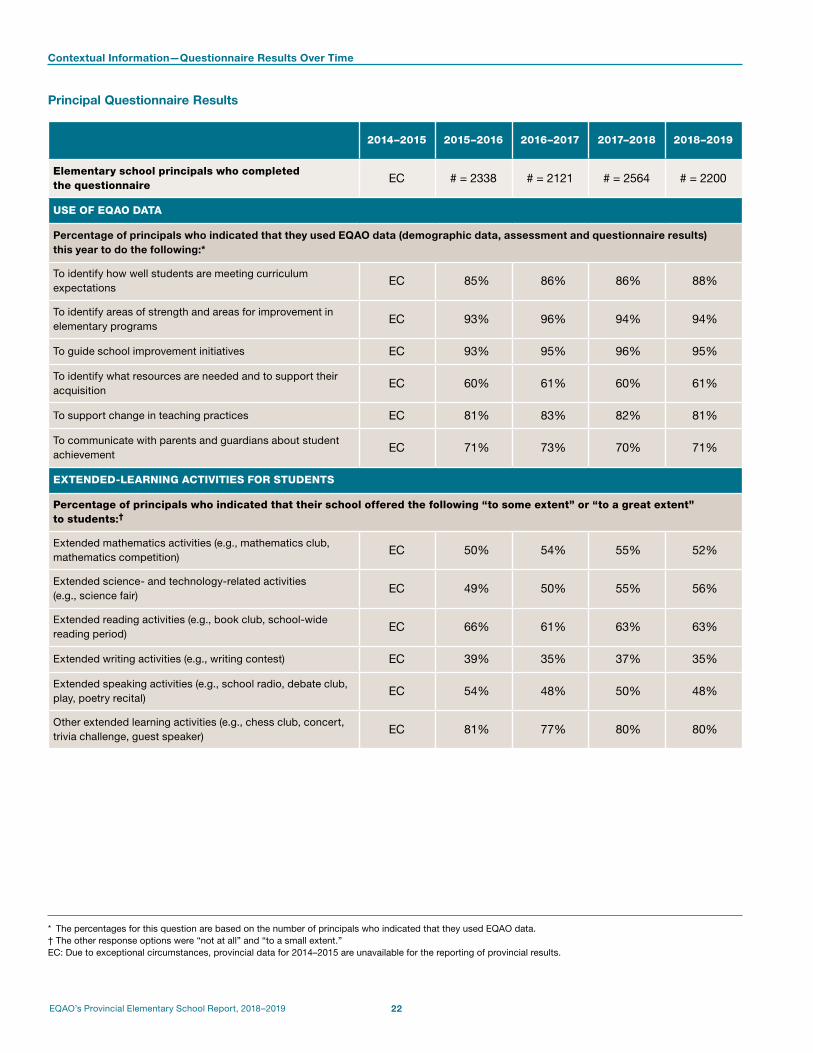
* The percentages for this question are based on the number of principals who indicated that they used EQAO data.† The other response options were “not at all” and “to a small extent.”EC: Due to exceptional circumstances, provincial data for 2014–2015 are unavailable for the reporting of provincial results.
Principal Questionnaire Results
2014–2015 2015–2016 2016–2017 2017–2018 2018–2019
Elementary school principals who completed the questionnaire
EC # = 2338 # = 2121 # = 2564 # = 2200
USE OF EQAO DATA
Percentage of principals who indicated that they used EQAO data (demographic data, assessment and questionnaire results) this year to do the following:*
To identify how well students are meeting curriculum expectations
EC 85% 86% 86% 88%
To identify areas of strength and areas for improvement in elementary programs
EC 93% 96% 94% 94%
To guide school improvement initiatives EC 93% 95% 96% 95%
To identify what resources are needed and to support their acquisition
EC 60% 61% 60% 61%
To support change in teaching practices EC 81% 83% 82% 81%
To communicate with parents and guardians about student achievement
EC 71% 73% 70% 71%
EXTENDED-LEARNING ACTIVITIES FOR STUDENTS
Percentage of principals who indicated that their school offered the following “to some extent” or “to a great extent” to students:†
Extended mathematics activities (e.g., mathematics club, mathematics competition)
EC 50% 54% 55% 52%
Extended science- and technology-related activities (e.g., science fair)
EC 49% 50% 55% 56%
Extended reading activities (e.g., book club, school-wide reading period)
EC 66% 61% 63% 63%
Extended writing activities (e.g., writing contest) EC 39% 35% 37% 35%
Extended speaking activities (e.g., school radio, debate club, play, poetry recital)
EC 54% 48% 50% 48%
Other extended learning activities (e.g., chess club, concert, trivia challenge, guest speaker)
EC 81% 77% 80% 80%
Contextual Information—Questionnaire Results Over Time
23 EQAO’s Provincial Elementary School Report, 2018–2019
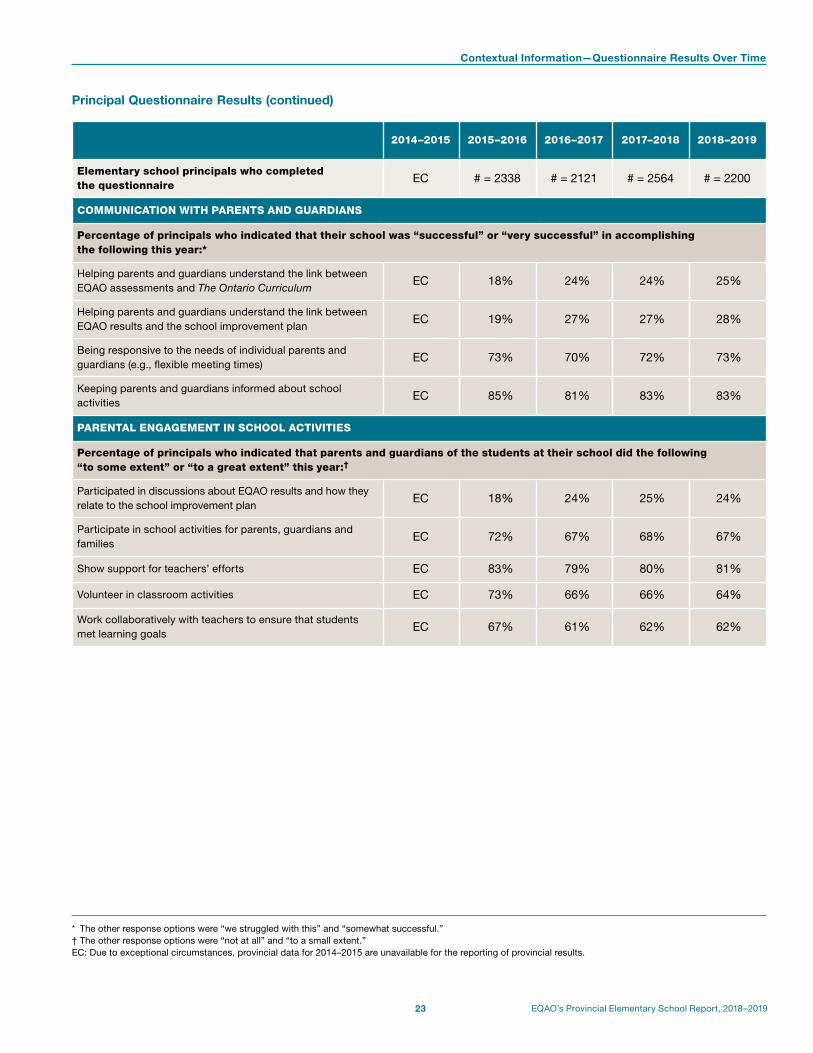
* The other response options were “we struggled with this” and “somewhat successful.”† The other response options were “not at all” and “to a small extent.”EC: Due to exceptional circumstances, provincial data for 2014–2015 are unavailable for the reporting of provincial results.
Principal Questionnaire Results (continued)
2014–2015 2015–2016 2016–2017 2017–2018 2018–2019
Elementary school principals who completed the questionnaire
EC # = 2338 # = 2121 # = 2564 # = 2200
COMMUNICATION WITH PARENTS AND GUARDIANS
Percentage of principals who indicated that their school was “successful” or “very successful” in accomplishing the following this year:*
Helping parents and guardians understand the link between EQAO assessments and The Ontario Curriculum
EC 18% 24% 24% 25%
Helping parents and guardians understand the link between EQAO results and the school improvement plan
EC 19% 27% 27% 28%
Being responsive to the needs of individual parents and guardians (e.g., flexible meeting times)
EC 73% 70% 72% 73%
Keeping parents and guardians informed about school activities
EC 85% 81% 83% 83%
PARENTAL ENGAGEMENT IN SCHOOL ACTIVITIES
Percentage of principals who indicated that parents and guardians of the students at their school did the following “to some extent” or “to a great extent” this year:†
Participated in discussions about EQAO results and how they relate to the school improvement plan
EC 18% 24% 25% 24%
Participate in school activities for parents, guardians and families
EC 72% 67% 68% 67%
Show support for teachers’ efforts EC 83% 79% 80% 81%
Volunteer in classroom activities EC 73% 66% 66% 64%
Work collaboratively with teachers to ensure that students met learning goals
EC 67% 61% 62% 62%
EQAO’s Provincial Elementary School Report, 2018–2019 24
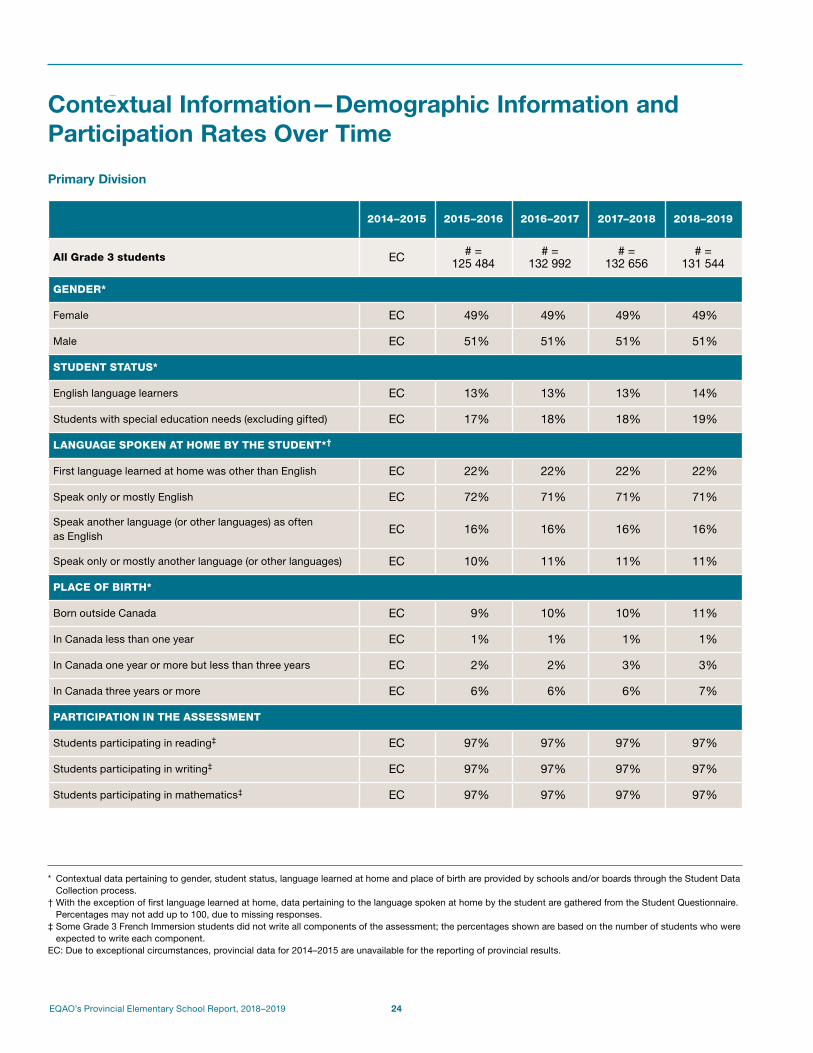
Sec. StartContextual Information—Demographic Information and Participation Rates Over Time
Primary Division
2014–2015 2015–2016 2016–2017 2017–2018 2018–2019
All Grade 3 students EC # = 125 484
# = 132 992
# = 132 656
# = 131 544
GENDER*
Female EC 49% 49% 49% 49%
Male EC 51% 51% 51% 51%
STUDENT STATUS*
English language learners EC 13% 13% 13% 14%
Students with special education needs (excluding gifted) EC 17% 18% 18% 19%
LANGUAGE SPOKEN AT HOME BY THE STUDENT*†
First language learned at home was other than English EC 22% 22% 22% 22%
Speak only or mostly English EC 72% 71% 71% 71%
Speak another language (or other languages) as often as English
EC 16% 16% 16% 16%
Speak only or mostly another language (or other languages) EC 10% 11% 11% 11%
PLACE OF BIRTH*
Born outside Canada EC 9% 10% 10% 11%
In Canada less than one year EC 1% 1% 1% 1%
In Canada one year or more but less than three years EC 2% 2% 3% 3%
In Canada three years or more EC 6% 6% 6% 7%
PARTICIPATION IN THE ASSESSMENT
Students participating in reading‡ EC 97% 97% 97% 97%
Students participating in writing‡ EC 97% 97% 97% 97%
Students participating in mathematics‡ EC 97% 97% 97% 97%
* Contextual data pertaining to gender, student status, language learned at home and place of birth are provided by schools and/or boards through the Student Data Collection process.
† With the exception of first language learned at home, data pertaining to the language spoken at home by the student are gathered from the Student Questionnaire. Percentages may not add up to 100, due to missing responses.
‡ Some Grade 3 French Immersion students did not write all components of the assessment; the percentages shown are based on the number of students who were expected to write each component.
EC: Due to exceptional circumstances, provincial data for 2014–2015 are unavailable for the reporting of provincial results.

Contextual Information—Demographic Information and Participation Rates Over Time
25 EQAO’s Provincial Elementary School Report, 2018–2019
Junior Division
2014–2015 2015–2016 2016–2017 2017–2018 2018–2019
All Grade 6 students EC # = 123 685
# = 130 775
# = 132 766
# = 136 124
GENDER*
Female EC 48% 49% 49% 49%
Male EC 52% 51% 51% 51%
STUDENT STATUS*
English language learners EC 10% 11% 11% 11%
Students with special education needs (excluding gifted) EC 21% 22% 22% 22%
LANGUAGE SPOKEN AT HOME BY THE STUDENT*†
First language learned at home was other than English EC 22% 23% 23% 23%
Speak only or mostly English EC 74% 72% 73% 73%
Speak another language (or other languages) as often as English
EC 15% 16% 17% 17%
Speak only or mostly another language (or other languages) EC 8% 8% 8% 9%
PLACE OF BIRTH*
Born outside Canada EC 12% 12% 12% 12%
In Canada less than one year EC 1% 1% 1% 1%
In Canada one year or more but less than three years EC 2% 2% 2% 2%
In Canada three years or more EC 9% 9% 9% 9%
PARTICIPATION IN THE ASSESSMENT
Students participating in reading EC 97% 97% 97% 97%
Students participating in writing EC 97% 97% 97% 97%
Students participating in mathematics EC 97% 97% 97% 97%
* Contextual data pertaining to gender, student status, language learned at home and place of birth are provided by schools and/or boards through the Student Data Collection process.
† With the exception of first language learned at home, data pertaining to the language spoken at home by the student are gathered from the Student Questionnaire. Percentages may not add up to 100, due to missing responses.
EC: Due to exceptional circumstances, provincial data for 2014–2015 are unavailable for the reporting of provincial results.

EQAO’s Provincial Elementary School Report, 2018–2019 26
Key ObservationsAchievement Results—Primary Division
RESULTS FOR ALL STUDENTS*Reading: Results for All Grade 3 Students Over Time*
2014–2015 2015–2016 2016–2017 2017–2018 2018–2019
EC # = 118 838 # = 126 016 # = 125 213 # = 124 269
Level 4 EC 16% 17% 18% 18%
Level 3 EC 56% 57% 57% 57%
Level 2 EC 21% 19% 19% 20%
Level 1 EC 3% 3% 3% 2%
NE1 EC 1% 1% 1% 1%
No Data EC 1% 1% 1% 1%
Exempt EC 3% 3% 2% 3%
At or Above the Provincial Standard† EC 72% 74% 75% 74%
Reading: Percentage of All Grade 3 Students at Each Level Over Time*
0
20
40
60
80
100
Per
cent
age
of S
tud
ents
EC 1 1 EC 3 3 EC
21 19
EC
56 57
1 3
19
57
EC
16 17 18
1 2
20
57
18
NE1 Level 1 Level 3 Level 4Level 2
At or above the provincial standard
mb1_A__C_trends_rdg_3e_19.eps
2015–2016
2016–2017
2017–2018
2018–2019
2014–2015EC
* Because percentages in tables and graphs are rounded, and because graphs do not show all reporting categories, percentages may not add up to 100.† The percentages of students at Levels 3 and 4 are rounded and may not add up to the percentages of students at or above the provincial standard.EC: Due to exceptional circumstances, provincial data for 2014–2015 are unavailable for the reporting of provincial results.

Achievement Results—Primary Division
27 EQAO’s Provincial Elementary School Report, 2018–2019
Writing: Results for All Grade 3 Students Over Time*
2014–2015 2015–2016 2016–2017 2017–2018 2018–2019
EC # = 118 860 # = 126 036 # = 125 213 # = 124 269
Level 4 EC 4% 3% 3% 3%
Level 3 EC 70% 70% 69% 67%
Level 2 EC 22% 22% 24% 26%
Level 1 EC 1% 1% 1% 1%
NE1 EC <1% <1% <1% <1%
No Data EC 1% 1% 1% 1%
Exempt EC 2% 2% 2% 2%
At or Above the Provincial Standard† EC 74% 73% 72% 69%
Writing: Percentage of All Grade 3 Students at Each Level Over Time*
0
20
40
60
80
100
Per
cent
age
of S
tud
ents
EC <1 <1 <1 EC 1 1 1 EC
22 22 24
EC
70 70 69
EC 4 3 3<1 1
26
67
3
NE1 Level 1 Level 3 Level 4Level 2
At or above the provincial standard
D_trends_wtg_3e_19.eps
2015–2016
2016–2017
2017–2018
2018–2019
2014–2015EC
* Because percentages in tables and graphs are rounded, and because graphs do not show all reporting categories, percentages may not add up to 100.† The percentages of students at Levels 3 and 4 are rounded and may not add up to the percentages of students at or above the provincial standard.EC: Due to exceptional circumstances, provincial data for 2014–2015 are unavailable for the reporting of provincial results.

Achievement Results—Primary Division
28 EQAO’s Provincial Elementary School Report, 2018–2019
* Because percentages in tables and graphs are rounded, and because graphs do not show all reporting categories, percentages may not add up to 100.† The percentages of students at Levels 3 and 4 are rounded and may not add up to the percentages of students at or above the provincial standard.EC: Due to exceptional circumstances, provincial data for 2014–2015 are unavailable for the reporting of provincial results.
Mathematics: Results for All Grade 3 Students Over Time*
2014–2015 2015–2016 2016–2017 2017–2018 2018–2019
EC # = 125 471 # = 132 983 # = 132 656 # = 131 544
Level 4 EC 12% 13% 12% 11%
Level 3 EC 51% 49% 49% 47%
Level 2 EC 28% 29% 30% 32%
Level 1 EC 5% 5% 5% 6%
NE1 EC 1% 1% 1% 1%
No Data EC 1% 1% 1% 1%
Exempt EC 2% 2% 2% 2%
At or Above the Provincial Standard† EC 63% 62% 61% 58%
Mathematics: Percentage of All Grade 3 Students at Each Level Over Time*
0
20
40
60
80
100
Per
cent
age
of S
tud
ents
EC 1 1 EC 5 5 EC
28 29 30
EC
51 49
1 5
49
EC12 13 12
32
1 6
47
11
NE1 Level 1 Level 3 Level 4Level 2
At or above the provincial standard
E_trends_mth_3e_19.eps
2015–2016
2016–2017
2017–2018
2018–2019
2014–2015EC

Achievement Results—Primary Division
29 EQAO’s Provincial Elementary School Report, 2018–2019
* Results by gender include only those students for whom gender data were available.† Some Grade 3 French Immersion students did not write all components of the assessment; the percentages shown are based on the number of students who were
expected to write each component.EC: Due to exceptional circumstances, provincial data for 2014–2015 are unavailable for the reporting of provincial results.
RESULTS BY GENDERPercentage of All Grade 3 Students at or Above the Provincial Standard Over Time*†
2014–2015 2015–2016 2016–2017 2017–2018 2018–2019
Female Male Female Male Female Male Female Male Female Male
Total # % Total # % Total # % Total # % Total # % Total # % Total # % Total # % Total # % Total # %
READING EC EC EC EC 57 356 76% 61 482 68% 60 812 78% 65 204 70% 60 493 79% 64 720 71% 60 030 78% 64 226 71%
WRITING EC EC EC EC 57 363 80% 61 497 69% 60 817 80% 65 219 67% 60 493 78% 64 720 67% 60 030 76% 64 226 64%
MATHEMATICS EC EC EC EC 61 090 63% 64 381 63% 64 685 62% 68 298 63% 64 587 60% 68 069 61% 64 022 57% 67 509 60%
Assessment Year
2014–2015 2015–2016 2016–2017 2017–2018
Assessment Year
2014–2015 2015–2016 2016–2017 2017–2018
Assessment Year
2014–2015 2015–2016 2016–2017 2017–2018
2018–2019 2018–2019
2018–2019
Per
cent
age
of S
tud
ents
Per
cent
age
of S
tud
ents
Per
cent
age
of S
tud
ents
Mathematics
Reading Writing
mb2_1_F_trends_gndr_rwm_3e_19.eps
EC
EC
7668
63 63 62 63 60 61
7870
7971
0
20
40
60
80
100
EC
8069
8067
7867
57 60
7871 76
64
0
20
40
60
80
100
0
20
40
60
80
100
Female
Male

Achievement Results—Primary Division
30 EQAO’s Provincial Elementary School Report, 2018–2019
RESULTS BY STUDENT STATUSPercentage of All Grade 3 English Language Learners at or Above the Provincial Standard Over Time
2014–2015 2015–2016 2016–2017 2017–2018 2018–2019
Total # % Total # % Total # % Total # % Total # %
READING EC EC 15 784 68% 17 475 69% 17 074 68% 17 877 68%
WRITING EC EC 15 784 72% 17 475 70% 17 074 68% 17 877 66%
MATHEMATICS EC EC 16 010 60% 17 849 59% 17 484 56% 18 323 54%
mb2_5_G_ESL_3e_19.eps
68 69 68 68
EC
72 70 68
EC
60 59 5666
54
EC
2015–2016
2016–2017
2017–2018
2018–2019
2014–2015EC
0
20
40
60
80
100
Per
cent
age
of S
tud
ents
Reading Writing Mathematics
EC: Due to exceptional circumstances, provincial data for 2014–2015 are unavailable for the reporting of provincial results.

Achievement Results—Primary Division
31 EQAO’s Provincial Elementary School Report, 2018–2019
Percentage of All Grade 3 Students with Special Education Needs (Excluding Gifted) at or Above the Provincial Standard Over Time
2014–2015 2015–2016 2016–2017 2017–2018 2018–2019
Total # % Total # % Total # % Total # % Total # %
READING EC EC 21 412 43% 23 610 43% 23 296 46% 23 855 47%
WRITING EC EC 21 430 53% 23 630 54% 23 296 51% 23 855 47%
MATHEMATICS EC EC 21 824 29% 24 076 29% 23 789 29% 24 362 26%
mb2_6_H_SpecialNeeds_3e_19.eps
43 43 46
EC
53 54 51
EC
29 29 29
47 47
26
EC0
20
40
60
80
100
Per
cent
age
of S
tud
ents
Reading Writing Mathematics
2015–2016
2016–2017
2017–2018
2018–2019
2014–2015EC
EC: Due to exceptional circumstances, provincial data for 2014–2015 are unavailable for the reporting of provincial results.
EQAO’s Provincial Elementary School Report, 2018–2019 32
Achievement Results—Junior Division
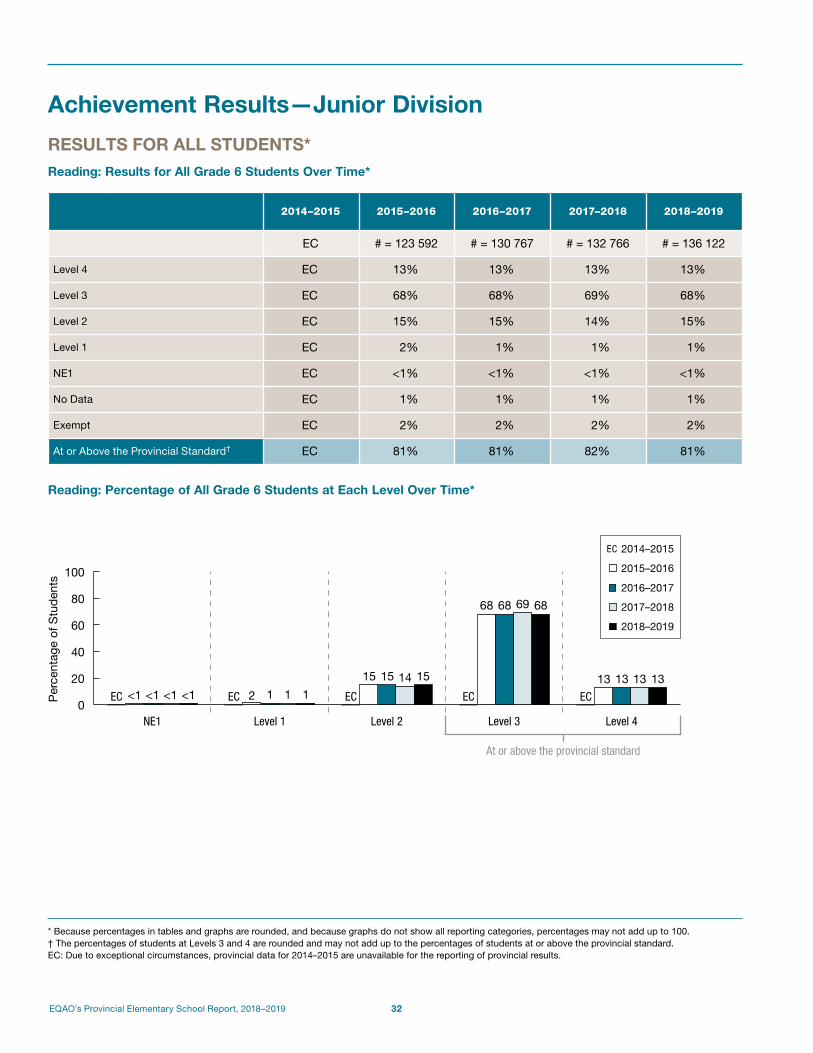
RESULTS FOR ALL STUDENTS*Reading: Results for All Grade 6 Students Over Time*
2014–2015 2015–2016 2016–2017 2017–2018 2018–2019
EC # = 123 592 # = 130 767 # = 132 766 # = 136 122
Level 4 EC 13% 13% 13% 13%
Level 3 EC 68% 68% 69% 68%
Level 2 EC 15% 15% 14% 15%
Level 1 EC 2% 1% 1% 1%
NE1 EC <1% <1% <1% <1%
No Data EC 1% 1% 1% 1%
Exempt EC 2% 2% 2% 2%
At or Above the Provincial Standard† EC 81% 81% 82% 81%
Reading: Percentage of All Grade 6 Students at Each Level Over Time*
0
20
40
60
80
100
Per
cent
age
of S
tud
ents
EC <1 <1 EC 2 1 EC
15 15 14
EC
68 68 69
EC
13 13<1 1
1315
68
<1 113
NE1 Level 1 Level 3 Level 4Level 2
At or above the provincial standard
J_trends_rdg_6e_19.eps
2015–2016
2016–2017
2017–2018
2018–2019
2014–2015EC
* Because percentages in tables and graphs are rounded, and because graphs do not show all reporting categories, percentages may not add up to 100.† The percentages of students at Levels 3 and 4 are rounded and may not add up to the percentages of students at or above the provincial standard.EC: Due to exceptional circumstances, provincial data for 2014–2015 are unavailable for the reporting of provincial results.

Achievement Results—Junior Division
33 EQAO’s Provincial Elementary School Report, 2018–2019
Writing: Results for All Grade 6 Students Over Time*
2014–2015 2015–2016 2016–2017 2017–2018 2018–2019
EC # = 123 617 # = 130 773 # = 132 766 # = 136 123
Level 4 EC 18% 17% 20% 22%
Level 3 EC 62% 62% 60% 59%
Level 2 EC 16% 17% 16% 14%
Level 1 EC 1% 1% 1% 1%
NE1 EC <1% <1% <1% <1%
No Data EC 1% 1% 1% 1%
Exempt EC 2% 2% 2% 2%
At or Above the Provincial Standard† EC 80% 79% 80% 82%
Writing: Percentage of All Grade 6 Students at Each Level Over Time*
0
20
40
60
80
100
Per
cent
age
of S
tud
ents
EC <1 <1 EC 1 1<1 1 EC
16 17 16
EC
62 62 60
EC
18 17 20
<1 1
14
59
22
NE1 Level 1 Level 3 Level 4Level 2
At or above the provincial standard
K_trends_wtg_6e_19.eps
2015–2016
2016–2017
2017–2018
2018–2019
2014–2015EC
* Because percentages in tables and graphs are rounded, and because graphs do not show all reporting categories, percentages may not add up to 100.† The percentages of students at Levels 3 and 4 are rounded and may not add up to the percentages of students at or above the provincial standard.EC: Due to exceptional circumstances, provincial data for 2014–2015 are unavailable for the reporting of provincial results.

Achievement Results—Junior Division
34 EQAO’s Provincial Elementary School Report, 2018–2019
Mathematics: Results for All Grade 6 Students Over Time*
2014–2015 2015–2016 2016–2017 2017–2018 2018–2019
EC # = 123 666 # = 130 652 # = 132 766 # = 136 124
Level 4 EC 13% 12% 13% 13%
Level 3 EC 37% 37% 36% 35%
Level 2 EC 31% 30% 31% 30%
Level 1 EC 16% 17% 17% 18%
NE1 EC <1% 1% 1% 1%
No Data EC 1% 1% 1% 1%
Exempt EC 2% 2% 2% 2%
At or Above the Provincial Standard† EC 50% 50% 49% 48%
Mathematics: Percentage of All Grade 6 Students at Each Level Over Time*
0
20
40
60
80
100
Per
cent
age
of S
tud
ents
EC <1 1 EC
16 17
EC
31 30
EC
3737
EC12
1
17
31 36
131
1830 35
1313
NE1 Level 1 Level 3 Level 4Level 2
At or above the provincial standard
mb1_F__L_trends_mth_6e_19.eps
2015–2016
2016–2017
2017–2018
2018–2019
2014–2015EC
* Because percentages in tables and graphs are rounded, and because graphs do not show all reporting categories, percentages may not add up to 100.† The percentages of students at Levels 3 and 4 are rounded and may not add up to the percentages of students at or above the provincial standard.EC: Due to exceptional circumstances, provincial data for 2014–2015 are unavailable for the reporting of provincial results.

Achievement Results—Junior Division
35 EQAO’s Provincial Elementary School Report, 2018–2019
RESULTS BY GENDERPercentage of All Grade 6 Students at or Above the Provincial Standard Over Time*
2014–2015 2015–2016 2016–2017 2017–2018 2018–2019
Female Male Female Male Female Male Female Male Female Male
Total # % Total # % Total # % Total # % Total # % Total # % Total # % Total # % Total # % Total # %
READING EC EC EC EC 59 914 85% 63 678 77% 63 443 86% 67 324 77% 64 627 86% 68 138 77% 61 168 85% 69 941 77%
WRITING EC EC EC EC 59 927 87% 63 690 73% 63 445 86% 67 328 73% 64 627 87% 68 138 73% 61 168 88% 69 942 76%
MATHEMATICS EC EC EC EC 59 944 50% 63 722 50% 63 378 49% 67 274 50% 63 378 49% 68 138 48% 61 168 48% 69 943 48%
Assessment Year Assessment Year
Assessment Year
Per
cent
age
of S
tud
ents
Per
cent
age
of S
tud
ents
Per
cent
age
of S
tud
ents
Mathematics
Reading Writing
2014–2015 2015–2016 2016–2017 2017–2018 2014–2015 2015–2016 2016–2017 2017–2018
2014–2015 2015–2016 2016–2017 2017–2018
2018–2019 2018–2019
2018–2019
mb2_2_M_trends_gndr_rwm_6e_19.eps
EC
EC
8577
50 50 49 50 49 48
8677
8677
0
20
40
60
80
100
EC
87
73
86
73
87
73
48 48
8577
8876
0
20
40
60
80
100
0
20
40
60
80
100
Female
Male
* Results by gender include only those students for whom gender data were available.EC: Due to exceptional circumstances, provincial data for 2014–2015 are unavailable for the reporting of provincial results.

Achievement Results—Junior Division
36 EQAO’s Provincial Elementary School Report, 2018–2019
RESULTS BY STUDENT STATUSPercentage of All Grade 6 English Language Learners at or Above the Provincial Standard Over Time
2014–2015 2015–2016 2016–2017 2017–2018 2018–2019
Total # % Total # % Total # % Total # % Total # %
READING EC EC 12 549 73% 14 238 73% 14 532 73% 14 991 71%
WRITING EC EC 12 568 76% 14 238 74% 14 532 74% 14 991 76%
MATHEMATICS EC EC 12 568 46% 14 238 44% 14 532 43% 14 992 43%
0
20
40
60
80
100
Per
cent
age
of S
tud
ents
Reading Writing Mathematics
mb2_10_N_ESL_6e_19.eps
73 73 73
EC
76 74 74
EC
46 44 43
71 76
43
EC
2015–2016
2016–2017
2017–2018
2018–2019
2014–2015EC
EC: Due to exceptional circumstances, provincial data for 2014–2015 are unavailable for the reporting of provincial results.
Achievement Results—Junior Division
37 EQAO’s Provincial Elementary School Report, 2018–2019
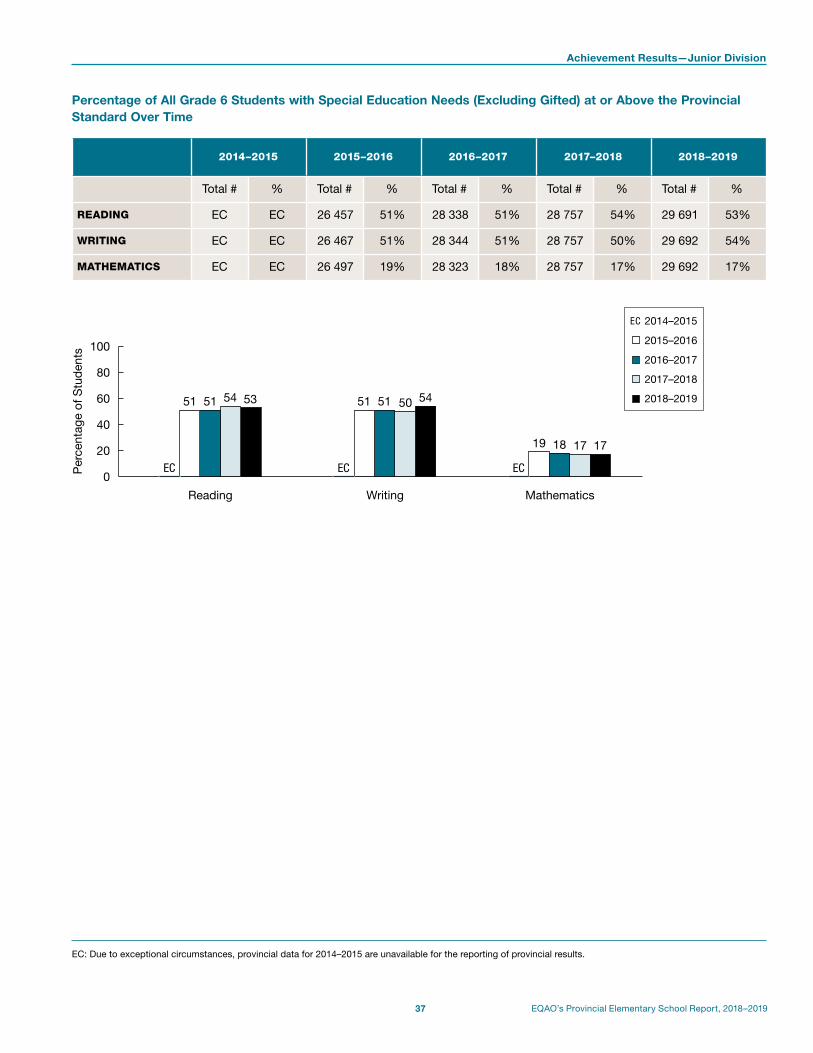
Percentage of All Grade 6 Students with Special Education Needs (Excluding Gifted) at or Above the Provincial Standard Over Time
2014–2015 2015–2016 2016–2017 2017–2018 2018–2019
Total # % Total # % Total # % Total # % Total # %
READING EC EC 26 457 51% 28 338 51% 28 757 54% 29 691 53%
WRITING EC EC 26 467 51% 28 344 51% 28 757 50% 29 692 54%
MATHEMATICS EC EC 26 497 19% 28 323 18% 28 757 17% 29 692 17%
0
20
40
60
80
100
Per
cent
age
of S
tud
ents
Reading Writing Mathematics
2015–2016
2016–2017
2017–2018
2018–2019
2014–2015EC
mb2_11_O_SpecialNeeds_6e_19.eps
51 51 54
EC
51 51 50
EC
19 18 17
53 54
17
EC
EC: Due to exceptional circumstances, provincial data for 2014–2015 are unavailable for the reporting of provincial results.
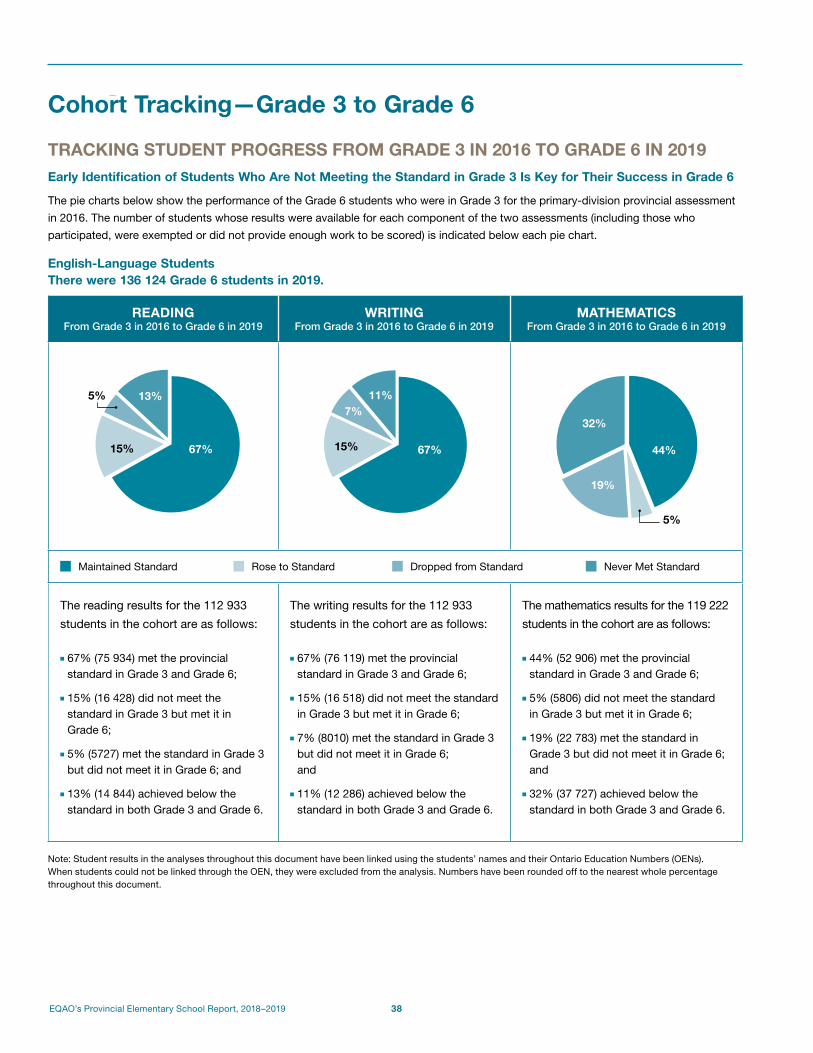
EQAO’s Provincial Elementary School Report, 2018–2019 38
Sec. StartCohort Tracking—Grade 3 to Grade 6
TRACKING STUDENT PROGRESS FROM GRADE 3 IN 2016 TO GRADE 6 IN 2019Early Identification of Students Who Are Not Meeting the Standard in Grade 3 Is Key for Their Success in Grade 6
The pie charts below show the performance of the Grade 6 students who were in Grade 3 for the primary-division provincial assessment
in 2016. The number of students whose results were available for each component of the two assessments (including those who
participated, were exempted or did not provide enough work to be scored) is indicated below each pie chart.
English-Language Students There were 136 124 Grade 6 students in 2019.
READINGFrom Grade 3 in 2016 to Grade 6 in 2019
WRITINGFrom Grade 3 in 2016 to Grade 6 in 2019
MATHEMATICSFrom Grade 3 in 2016 to Grade 6 in 2019
67%
13%
15%
5%
67%
11%
15%
7%
44%
19%
32%
5%
Maintained Standard Rose to Standard Dropped from Standard Never Met Standard
The reading results for the 112 933
students in the cohort are as follows:
■ 67% (75 934) met the provincial standard in Grade 3 and Grade 6;
■ 15% (16 428) did not meet the standard in Grade 3 but met it in Grade 6;
■ 5% (5727) met the standard in Grade 3 but did not meet it in Grade 6; and
■ 13% (14 844) achieved below the standard in both Grade 3 and Grade 6.
The writing results for the 112 933
students in the cohort are as follows:
■ 67% (76 119) met the provincial standard in Grade 3 and Grade 6;
■ 15% (16 518) did not meet the standard in Grade 3 but met it in Grade 6;
■ 7% (8010) met the standard in Grade 3 but did not meet it in Grade 6; and
■ 11% (12 286) achieved below the standard in both Grade 3 and Grade 6.
The mathematics results for the 119 222
students in the cohort are as follows:
■ 44% (52 906) met the provincial standard in Grade 3 and Grade 6;
■ 5% (5806) did not meet the standard in Grade 3 but met it in Grade 6;
■ 19% (22 783) met the standard in Grade 3 but did not meet it in Grade 6; and
■ 32% (37 727) achieved below the standard in both Grade 3 and Grade 6.
Note: Student results in the analyses throughout this document have been linked using the students’ names and their Ontario Education Numbers (OENs). When students could not be linked through the OEN, they were excluded from the analysis. Numbers have been rounded off to the nearest whole percentage throughout this document.

39 EQAO’s Provincial Elementary School Report, 2018–2019
Sec. StartExplanation of Terms
PRIMARY AND JUNIOR ASSESSMENTS OF READING, WRITING AND MATHEMATICS
All StudentsResults are reported for all students in the grade (Grade 3 or 6).
Provincial StandardThe Ministry of Education, in The Ontario Curriculum, has set Level 3 as the provincial standard. Level 3 identifies a considerable level of achievement of provincial expectations. The levels of achievement are aligned with the four-level scale developed by the Ministry of Education and used on the Provincial Report Card.
Level 4The student has demonstrated the required knowledge and skills thoroughly or to a high degree. Achievement exceeds the provincial standard.
Level 3The student has demonstrated the required knowledge and skills to a considerable degree. Achievement meets the provincial standard.
Level 2The student has demonstrated the required knowledge and skills. Achievement approaches the provincial standard.
Level 1The student has demonstrated the required knowledge and skills in limited ways. Achievement falls much below the provincial standard.
NE1“Not Enough Evidence for Level 1” is used when students provided enough information to score but did not demonstrate enough evidence of knowledge and understanding to be assigned Level 1.
No DataThis designates students who did not have a result due to absence or other reasons.
ExemptThis designates students who were formally exempted by the school from participating in the assessment or in one or more components of it.
English Language LearnersThese are students who have been identified by the school in accordance with English Language Learners: ESL and ELD Programs and Services: Policies and Procedures for Ontario Elementary and Secondary Schools, Kindergarten to Grade 12 (2007).
EC (Exceptional Circumstances)Due to exceptional circumstances, provincial data for 2014–2015 are unavailable for the reporting of provincial results.
Students with Special Education Needs (Excluding Gifted)These are students who have been formally identified by an Identification, Placement and Review Committee (IPRC), as well as students who have an Individual Education Plan (IEP). Students whose sole identified exceptionality is giftedness are not included.
2 Carlton Street, Suite 1200, Toronto ON M5B 2M9 Telephone: 1-888-327-7377 Website: www.eqao.com
© 2019 Queen’s Printer for OntarioISBN: 978-1-4868-3743-4 (PDF) Cp
rs_P
Je_0
919