Embed Size (px)
Citation preview

AGENCY FOR INTERNATIONAL DEVELOPMENT 4 0FR10UE ONLY WAUoINGTON 0 C 20523 Z0wU 3SIBLIOARAkIC INPUT SHEET
A PNIIAAR TEMPORARY rtL ASSI -
FICATIONw b centJtIDANV
2 TITLE AND SU3TITLE
Analysis of consumption expenditure patterns in India
3AU THOR[)Desai RM
4 DOCUMENY OT IS NUMBER( PAGES ARC NUMBER1972 16 ARC_________
7 REFERENCE ORGANIZATION NAME AND ADDRESS
Cornell 8 SUPPLEMENTARY NOTES (Sponforing Organization Publilahera Availability)
(InOccasional paper no54) 9 ABSTRACT
(ECONOM ICS RampD)
10 CONTROL NUMBER I1 PRICE OF DOCUMENT
jgt4 -AAb-q4r _
12 DESCRIPTORS 13 PROJECT NUMBER
14 CONTRACT NUMBER
CSD-2805 Res 15 TYPE OF DOCUMENT
AiD 5901 (4-74)
ACKNOWLEGEampCNTS
The author is greatly indebted to Mr Roger Selley for his
assistance in estimating consumption functions The author is also
grateful to Professors William G Tomek John W M ellor and Timothy D
Mount of the Department of Agricultural Economics at Cornell for very
helpful discussion and comments on the earlier draft of this paper
This study is part of the Cornell University-USAID Employment
and Income Distribution Project directed by John W Mellor I wish
to acknowledge the continuing assistance given to me by AID which
makes this research possible
i
TABLE OF CONTENTS
I Introduction 1 Objective bull bull bull Procedure amp
Sequence of Presentation 20
II Data Sampling Design and Concepts 3
a Sampling Design bull bull0 3
Sources of Data 3
Concepts 4
III Methodology 5
Consumption Functions bull se 5 Functional Form 5 Variables bull 6
Expenditure vis-a-vis Land Holding Classes 7
IV Analysis of the Estimated Model 9
Introduction bull 9
Section 1 NSS and NCA2R Consumption Functions 10
Estimated Equations bull a bull bull bull bull0 10 Estimated Expenditure Elasticity and
Marginal Propensity to Expend 11
Section 2 Rural and Urban NSS Consumption Functions 13
Estimated Equations bull bullS 13 Estimated Expenditure Elasticity and
Marginal Propensity to Expend 14
Section 3 NCAER Consumption Functions a 16
Estimated Equations bull e 16 Estimated Expenditure Elasticity and
Marginal Propensity to Expend 19 Estimated Pattern of Additional Demand 19
V Conclusions bull bull bull bull ebull 23
References 24
ii
APPENDICES
l Distribution of Households by Per Capita Monthly Total Consumer Expenditure
Figure 1 NSAER 1964-65 25Figure 2 NSS91963-64 o o 26
2 Classification of Commodities NCAFR 1964-65 bull 27
3 Classification of Commodities NSS 1963-64 29
4 Average Propensity to Expend and Per Capita Expenditure of Food Grains and Milk and Wilk Products by Expenditure Classes All-India 1963-64 and 1964-65 o 31
5 Average Propensity to Expend and Per Capita Expenditure of Food Grains Milk and Milk Products and Clothing by Expenditure Classes Rural and Urban India1963-64 degbullbullbulldegbullbullbull 32
6 Average Propensity to Expend on Various Expenditure Categories by Expenditure Classes NCAER9 1964-65 33
7 Per Capita Monthly Expenditure on Various Expenditure Categories by Expenditure Classes NCAER 1964-65 34
iii
LIST OF TABLES
PaGe
1 Per capita monthly total consumer expenditure by holding size groups and by expenditure classes rural India 1963-64 and 1961-62
2 Marginal propensity to expend and expenditure elasticity of food grains and milk and milk products by expernditure classes All-India 1963-64 and1964-65 deg a 9 amp 0 bull 12
3 Marginal propensity to expend and expenditure elasticity of food grains milk and milk products and clothing by expenditure classes rural an~d urban India 1963-64 0 0 0 0 0 a 0 15
4 The estimated equations for various expenditure categories NCAER 1964-65 17
5 Expenditure elasticities of various expenditure categories by expenditure classes NCAER 1964-65 20
6 Marginal propensity to expend on various expenditure categories by expenditure classes NCAER 1964-65 21
iv
CHAPTER I
INTRODUCTION
ObJective
This study examines the differences in (i) R of consumption and (ii) the elasticity both with respect to income beshytween income groups and corresponding land holding groups This objective ia important for the following reason The absolute and the proporLionate change in the amount of aggregate demand for a commodity associated respectively with an absolute and a proporshytionate change in per capita income are significantly influenced by the percentage distrikution of the increased income between differen income groups This reason gains an added significance due to currunt economic changes in rural India on account of the new foodgrains tech nology It is in the context of these changes in India that Mellor and Lele have examined the effect of different distributions of income on absolute change in the consumption expenditure pattern (7)
Procedure
The above mentioned objective is analyzed by comparing
(a) two data sources viz National Sample Survey (NSS) and National Council of Applied Economic Research (NCAER) used in estishymating consumption functions for food grains and milk and milk proshyducts
(b) the differences in rural and urban consumption functions for food grains milk and milk products and clothing estimated by using NSS data and
(c) 18 consumption functions for 18 commodity categories estishymated by using NCAER data
Comparison (i) is undertaken with a view to examining the similarshyities in the two data sources that have different sampling designs (see Appendix 1) If the consumption functions for food grains and milk and milk products estimated by using NSS and NCAER are similar then the result would imply that the consumption functions for other commodities may also be similar for the two data sources The comparison is restricted to two commodities because the definitions of other commodity categories in the two data sources are different (see Appendices 2 and 3)
Comparison (b) is attempted because we expect differences in rural and urban consumption functions at the same income level because of differences in such factors as tastes and preferences availability of various goods and so on in the two areas This comparison is restricted to NSS data because NCAER did not provide the division of households into rural and urban
2
Comparison (c) is attempted because of the importance of analyzing the allocation of an entire budget of a household on various commodities This comparison is restricted to NCAER data because NSS did not give a jetailed commodity classificaLion (see Appendix 3)
Seauence of Presentation
Chapter II dcals with the sampling design and concepts adopted in the two data sources used for this study
Chapter III deals with the methodology developed
InChapter IV the estimated models of consumption functions are analyzed This chapter is divided into three sections each dealing with the three comparisons mentioned earlier
InChapter V the main conclusions of the study are recapitulated
CHAPTER II
DATA SAMPLING DESIGN AND CCNCEPTS
Sources of Data
Ideally we require data on consumption of various items household size incomes etc of the landless and landholding households for a period after 1966-67 This is because the new food grains technology has occurred in that period The NSS provides such data for ruralv
and urban households However these data were available for 1963-64 (4) In addition we have used the NCAER data for its Consumer Exshypenditure Survey of 1964-65 (8) Further both these sources gave only the grouped data This implies that only one common consumption function could be estimated for landless and various landholding households The number of observations was 26 (13 eacn for rural and urban households) in NSS data and 24 in NCAER data
Sampling Design
NSS data were collected covering a period February 1963 to January 1964 This survey is a repetitive multipurpose fact-finding survey carried out twice every year NCAER data were collected in the All-India Consumer Expenditure Survey covering a period May 1964 to April 1965
Both the surveys used a multistage sample design with stratifishycation suitable to their purposes Although NCAER used the same frame of census blocks as NSS for the purpose of selecting samples NCAER stratified its sample districts into developmental and nondevelopmental areas For classifying places with 10000 or more population into these two areas factory employment and rate of growth of population were used Against this for classifying areas under 10000 population data on such aspects as land use sources of irrigation use of imshyproved seeds fertilizers tractors electricity for agricultural and industrial purposes existence of small and medium industries existence of market facilities of cooperative societies of educational social medical and recreation institutions and facilities for transportation were collected Based on these data appropriate
jr NSS defines rural area as the area with less thaii 10000 population and the urban area as the one with 10000 or more population
2 Although NCAER provided the data for households belonging to deshyveloped and nondeveloped areas separately these households could not be approximated as urban and rural respectively This is because their definition of developed and nondeveloped areas include households from areas with population under 10000 (ie rural area) as well as that with 10000 or more (ie urban area) population
4
weightage was allocated to each of these factors and the villages were classified as developmental on their qualifying for a minimum number of points others were deemed nondevelopmental (8 pp11)
At the household level NSS classified the urban households into five classes and rural households into six classes on the basis of their major source of income and household size NCAER however classified households into high and low income groups An examination of bar charts of the distribution of selected households of the two studies (Appendix 1) into various expenditure groups reveals that NCAER sample seems to have lower weightage to low expenditure households whereas NSS seems to have lower weightage to high expenditure households
NCAER survey was carried out in three rounds each round with a different set of sample households although each set was selected from the two broad income groups viz high and low The first round was conducted during May-August 1964 the second round during September-December 1964 and the third in January-April 1965 The reference period varied from a day to a year for different households depending on whichever seemed most appropriate However the study reported the data for a period of a month Against this NSS was carried out in one round only The reference period was thirty days preceding the date of inquiry for every selected household NCAER sample covered 3395 households whereas NSS covered 26072 households
Concepts
The definitions of a household and monthly household consumer expenditure were the same in the two surveys However the definitions of household size and per capita monthly consumer expenditure in these surveys were different NSS defined household size as family members plus any person who takes principal meals with the household at least 16 days during a period of 30 days preceding the date of the survey NCAER defined household size as family members plus boarders employees occasional visitors or relatives staying with the household sometime during the one month reference period preceding the date of inquiry NSS defined per capita monthly consumer expenditure as total monthly household consumer expenditure divided by the household size NCAER defined per capita monthly expenditure as total monthly household consumer expenditure diviG7d by the family size (ie number of family members in the household)
The details of commodity classification used in the two sources uf data are given in Appendices 2 and 3 Except for food grains and milk and milk products no other commodity classification of NSS and NCAER is closely comparable The preceding discussion on sampling and concepts used by the two surveys sufficiently suggests the difficulties of comparing the estimates of the consumption functions based on these two data sources
CHAPTER III
METHODOLOGY
To analyze whether or not the marginal propensity to consume and elasticity with respect to income for a coumodiiy vary from one income (and the corresponding land holding) group to the other a methodology was evolved fort
(a) estimating consumption functions and
(b) identifying income classes by land holding groups
Consulotion Functions
Two important methodological issues of estimating cross-sectional consumption functions are selection of (i) a functional form and (ii) relevant variables
Functional Form
The question of selecting a proper functional form arises because the marginal propensity to consume and elasticity with respect to income implied by different forms vary significantly Goreux haF shown that the expenditure elasticities are very similar at the middle levels of income for double-log semi-log log-inverse inverse and sigmoid functions But at the extremes of low and high incomes theyshow very large discrepencies (1)
Therefore the different functional forms that may be considered are linear hyperbolic quadratic semi-log log-log inverse double log and log-inverse (1 6 9 10) From the viewpoint of economic theory of consumer behavior a curvilinear function would be desirable This is because the linear function forces the marginal propensity to be constant Further income elasticity according to this function for all goods tends to unify as income increases This may be conshysidered unreasonable (9) We have selected to first estimate the log-log inverse (LLI) function
InY = ln + Plx + 7Jnx
Y = epXX
for the following reasons
First this function satisfies the assumptions of (i) varying marginal propensity to consume and (ii) some initial levels of income
6
for expenditure on certain commodities Second since theoretically this function can turn down it can incorporate the behavior of conshysumption of an inferior good However inasmuch as such behavior is not expected for the observed rangki of data the function in practice would attain an asymptotic levels of consumption expenditure Third the UI function can also provide for increasing as well as decreasing income elasticity depending on the different commodities for which it is fitted This property of the function can be exploited if the sign of p is not restricted Fourth the LLI function provides a direct test on varying elasticity This is because if 0 is zaro then the function results into a double-log function which has a property of constant elasticity Fifth the LLI function includes in it two other functions viz double-log (DL) if 0 is zero and log-inverse (LI) if 7 is zero And thereby facilitates a test of three functions at a time In an empirical estimate of the function however neithor p nor 7 would be zero We shall therefore select one of the three functions viz LI LLI and DL by examining the partial r2 coefficient of partial deterlination of the variables associated with P and 7 If the partial r of the variable under question is less than one pershycent we shall reestimate the function after dropping that variable
Variables
Due to nonavailability of detailed data we selected per capita monthly consumption expenditure on a particular commodity (E)and per capita monthly total consumer expenditureJ (X) respectively as deshypendent and independent variables Although the selection of these variables was guided by the availability of data we shall briefly discuss the limitations and merits of using the selected variables
Total (per capita monthly) consumption expenditure is not exactly equivalent to (per capita monthly) current income- because the latter includes current saving besides consumption expenditure It is because of this difference between current income and total consumption exshypenditure that the elasticities estimated by using expenditure as an independent variable may have an upward bias However inasmuch as total consumption expenditure could be financed from current income past saving and borrowipqs it may be a better explanatory variable than the current incomey In this context total consumption exshypenditure can be considered as a proxy for permanent income--the conshycept modern consumption theory emphasizes (3) although permanent income measured in terms of one years consumption expenditure is
This implies that our regression model would estimate the marginal
propensity and elasticity with respect to expenditure and not income
Income data was not available in NSS alone
5 This advantage is particularly valuable when one does not have as is the case with us separate data on other variables This is beshycause omission of relevant variables also causes a bias in the estimated parameters (2)
7
rather unsatisfactory This Is particularly true for a cross-sectional analysis that involves an inherent aggregation of heterogeneity in such variables as age composition of households indifference mapsp etc
The dependent variable in the model is consumption expenditure (E) rather than consumption which is advocated by the modern consumption theory The theory emphasizes the concept of consumption because it is consumption and not purchases that provides utility Thus maximization of utility rather than purchases would be the goal of an individual However the distinction )etween consumption (use) and consumption expenditure (purchase) seems more meaningful for durable goods Hence until the use of such goods increases in India the concept oi consumption may be of limited use Also obtaining data on consumption is found difficult even in the USA
Furthermore in addition to the distinction between purchase and use there is also a distinction between physical quantities and monetary expenditure The quantity elasticity is generally lower than the exshypenditure elasticity The difference between these two corresponds to the quality elasticity which measures the elasticity of price paid per unit in relation to income (1)
Finally the expenditure data has in it an implicit simultaneity in the variables This is because total expenditure by definition deshypends on the size of expenditure on individual items (the dependent variable in the model) This simultaneity would cause a dependence between the random disturbance terms and an explanatory variable Such dependence in turn may cause a bias in the estimate of the reshygression coefficient However Goreux says When computation is based on grouped data this bias may to a large extent be eliminated without introducing an instrumental variable by classifying the households into income brackets and using the average of the total expenditure for each group as the explanatory variable (1 pp 4-b) Due to nonavailability of required income data we could not use this device Nevertheless this bias is likely to be small for individual food items and may be disregarded for all items except modern durables like cars refrigerators etc(l) However the expenditure on such durables forms a negligible share in the budget of an average household in India
Expenditure vis-a-vis Land Holding Classes
As mentioned earlier the objective of this paper is to examine the marginal propenrity to consume and elasticity with respect to income (more appropriately expenditure) of various landholding groups for different commodities Since the available data on conshysumption expenses did not provide the land holdings corresponding to different total consumer expenditure we evolved the following proshycedure
Using the National Sample Survey of land holding for 1961-62 (5) the cumulative percentage of rural population in various land
holding classes was worked out Similarly from the NSS 1963-64 data on consumption expenditure for rural households the cumulative percentage distribution of rural population in various (per capita monthly) expenditure classes was worked out The two cumulative distrishybutions were then matched by inspection to find out the approximate correspondence between the level of expenditure and land holding The use of cumulative distribution provided a basis to determine the level of expenditure and land holding in various deciles of the population The average per capita expenditure in each expenditure class (and also in the corresponding holding sizes) was weighted by the number of people in each class The expenditure classes are thus defined in terms of deciles of the population Table 1 gives the per capita expenditure in various deciles and the corresponding holding size groups In computing the marginal propensity to expend and the expenditure elasticity from the estimated consumption functions we have used the per capita monthly total consumer expenditure of these classes
Table 1 Per capita monthly total consumer expenditure by holding size groups and by expenditure classes Rural India 1963-64 and 1961-62
Expenditure Holding size Per capita monthly total classes groups consumer expenditure
DECILES ACRES RUPEES
Bottom 2 less than 049 893 3rd 050-099 1314 4 amp 5th 100-499 1780 6 7 amp 8th 500-999 2413 9th 1000-1499 3071 Lower 12 of 10th 1500-2999 4189 Upper 12 of 10th 3000+ 8584
All deciles 2443
Source Compiled from National Sample Surveys 1961-62 and 1963-64 Nos 162 and 142 The Cabinet Secretariate Government of India 1969 and 1968 respectively
CHAPTER IV
ANALYSIS OF THE ESTIMATED MODEL
Introduction
Using the ordinary least squares method the log-log inverse model was first estimated for both the data sources The model ist
In EU = ln (x+03 ln 7+yln Xj Pj
where Eij = per capita monthly consumer expenditure on it commodityin jth per capita monthly total consumer expenditure class
Xi = per capita monthly total consumption expenditure in jth class S= error term in jth class
Each of the variables in the model was weighted by the square root of the number of households in each class to correct for heteroscedasticity that would be caused by the use of grouped data
NSS and NCAER consumption functions for food grains and milk and milk products are analyzed in section 1 Section 2 is devoted to a comparison of rural and urban NSS consumption functions for food grainsmilk and milk products and clothing Section 3 deals with NCAER conshysumption functions for 18 commodity categories In this section we shall also discuss the estimated pattern of additional demand that may be generated by various expenditure (and corresponding land holding) classes
10
Section 1 NSS and NCAER Consumption Functions
Estimated Eouations
The estimated equations (including alternative functional form equations) for the two commodities under study ares
A A
A 7 SSE
1 Food grains NSS--LLI 2746 -9203 004 984 443082
(515) (2587) (125)
LI 2764 -9285 985 443105 (056) (953)
NCAER--LLI 2579 -9150 018 960 33207 (604) (4242) (131)
LI 2663 -9720 962 33240 (050) (1175)
2 Milk amp Milk Products NSS--LLI -1455 -17414 869 984 340391
(452) (2267) (109)
NCAER--LLI -214 -24518 b95 945 125045 (1172) (8232) (254)
Figures in parantheses are standard errors Siqnificant at I percent Significant at 5 percent
-2 R of these equations were high presumably because of use of
grouped data The plot of residuals for akl the^aquations exhibited fair degree of randomness Also the signs of P and 7 were as per exshypectations Most of the regression coefficients which were tested using the t statistic were found significant either at 1 or 5 percent level However y in food grains equation was insignificant for both the data sources This is also true of the y in equation for milk aV milk products estimated by using NSS data More important the r the coefficient of partial determination of the variable asshysociated with y in food grains equation was negligible (00005 for NSS and 0009 for NCAER data) compared to that in milk and milk proshyducts equation (733 for NSS and 207 for NCAER) This suggests that log-inverse (LI) instead of log-log-inverse (LLI) would be a better fit for food grains Thus we estimated the LI function for this commodity for both the data sources
The size ofS the coefficient associated with the inverse of X in each equation being fairly large and significant shows that the exshypenditure elasticity for both the commodities in the two data sources would vary with the per capita total expenditure 19vel We shall examin~e this below for the earlier mentioned seven expenditure classes
Estimated Expenditure Elasticity and Marainal Propensity to Expend
-Using thne above equations and thlo er capita monthly total conshysumer expenditure (as given in Table 1)- for the seven expenditure classes we estimated the expenditure elasticity (1) marginal proshypensity to expend (PE) average propensity to expend (APE ie budget share) and expenditure levels (E) for food grains and milk and milk products The results on I and MPE are given in Table 2 whereas those on APE and E are given in the Appendix 4
Expenditure elasticity for both the commodities declines conshytinuously as per capita total consumer expenditure (and hence the corresponding land holding size) increased irrespective of whether it was estimated from NSS or NCAER data This is because in a broad sense both these commodities are necessities Further the MPE on food grains also behaved similarly But the MPE on milk and milk products first increased and then remained almost constant as the per capita total consumer expenditure increased The PE on milk and milk products remained almost constant for the upper five deciles of the population which constituted mainly the medium and large farmers This is true for both the sources of data
As regards the size of expenditure elasticity and PE for the two commodities from the two data sources their means for all classes toshygether were roughly the same This was true for PE on milk and milk products in all the expenditure classes But the AVE on food grains was higher for NSS than for NCAER data in bottom five deciles Howshyever the expenditure elasticity of both the commodities was higher for NCAER than for NSS data in bottom five deciles The similarities in the results from the two data sources for the two commodities under study imply that such similarities may also exist for other commodities
6 In the case of food grains LI instead of LLI equation is used for both the data sources
7 These expenditure levels lie within the range of the values of the independent variable used in estimating the consumption functions from both data sources
-----------------------------------------------------------
12
Table 2 Aarginal propensity to expend (IE) and expenditure elasticity (1) of food grains and milk and milk products by expenditure classeal All-India 1963-64 and 1964-65
Expenditure classes amp corresponding land holding groups (Acres)
Bottom 2 deciles-shyless than 049
3rd decile-shy050-099
4 amp 5th deciles-shy100-499
6 7 amp 8th deciles-shy500-999
9th decile-shy1000-1499
Lower j of 10th decile-shy1500-2999
Upper j of 10th decile-shy3000+
Per capita mo total consumer expendishyture Rupees
893
1314
1780
2413
3071
4189
8584
NSS NCAER Food Milk amp milk Food Milk amp milk
grains products
WPE NEE M
065 104 007 282
042 071 010 219
028 052 011 185
017 038 012 159
011 030 012 144
007 022 012 128
002 011 011 107
grains products
WE M MPE M1
059 109 007 334
038 074 011 246
025 055 012 197
016 040 013 161
011 032 013 139
006 023 012 118
002 011 009 088
ean for all classes 2443 017 038 012 158 015 039 013 160
Sources Estimated from the functions fitted to data from National Sample Survey 1963-64 No 142 The Cabinet Secretariate Government of India 1968 and also from the National Council of Applied Economic Research All-India Consumer Expenditure Survey 1964-65 Vol II New Delhi 1967
13
Section 2 Rural and Urban NSS Consumption Functions
The use of all-India consumption functions for estimating theexpenditure elasticity and marginal propensity to consume for the rural expenditure (and the corresponding land holding) classes impliesthat a difference does not exist between the rural and urban conshysumption functions In order to examine this hypothesis we estishymated the consumption functions separately for rural and urban houseshyholds for food grains milk and milk products and clothing by using the NSS data
Estimated EQuations
The estimated equations ares
1 Food grains
Rural 1844 -6006 261 999 2751 (076) (359) (019)
Urban 2646 -8610 -048 999 2186 (126) (789) (028)
Rural and Urban Combined 2746 -9203 004 984 443082 (515) (2587) (125)
2 Milk and milk products
Rural 1564 -17115 891 990 153366 (565) (2677) (140)
Urban 1414 -12885 850 996 17332 (355) (2223) (079)
Rural and Urban Combined -1455 -17414 869 984 340391 (452) (2267) (109)
3 Clothing
Rural 3915 -8644 1516 986 274156 (755) (3579) (187)
Urban 1152 -32253 800 997 16408 (346) (2163) (077)
Rural and Urban Combined -2874 -130434i 1222 939 1721483 (1016) (5098) (246)
Figures in parentheses are standard errors Significant at I percent Significant at 5 percent
14
R2 of all the equations were high Both P and 7 in all the equations except ^in food grains equatior for urban househRlds turned out significant in this exceptiontl case even the sign of j wag not as per expectations although~r of the variable associated with y was as high as 222 Further P being negative in all the equationsthe expenditure elasticity of the three commodities would decline (as per capita total consumer expenditure increases) in both the areas The diffarences in the estimated consumption functions of rural and urban areas was tested by the F test The test suggeststhat these two functions are different for the three commodities at 5 percent level of significance Thus the hypothesis of no difference between the rural and urban consumption functions is reshyjected
Estimated Expenditure Elasticity (f) and Marginal Propensity to Expend (E)
The above equations were used to estimate 1 E APE and E on three commodities in rural and urban areas at the same level of percapita total consumer expenditure (as given in Table 1) Table 3 gives the results on I and WE whereas Appendix 5 gives the results on APE and E
The expenditure elasticities for both food grains and milk and milk products are higher in all expenditure classes in rural than in urban areas Indeed the expenditure elasticity of food grains in rural areas declines less rapidly than in urban areas as per capita total consumer expenses rise But the converse is true of the behavior of expenditure elasticity of milk and milk products Expenditure elasticity of clothing is however higher in all expenditure classes except the top decile in urban than in rural areas Over the exshypenditure classes this elasticity declines more rapidly in urban than in rural areas
The WE on food grains and clothing is higher in all expenditureclasses in rural than in urban areas But the WE on milk and milk products is higher in the bottom three deciles in urban than in rural areas In the remaining expenditure classes the WE remained the same in both areas The above discussion also shows that the exshypenditure elasticity and WE for an individual commodity would varyfrom one expenditure group to the other in both rural and urban areas However the E on milk and milk products varied only in the bottom three deciles in the other deciles it remained almost constant
The preceding discussion warrants examination of the consumptionfunctions for all the commodities that comprise a budget of a houseshyhold separately for rural and urban areas However due to nonshyavailability of the required data the ICAER (All-India) data are used in the following section to estimate consumption functions for 18 commodity categories
---------
Table 3 Marginal propensity to expend (APE) and expenditure elasticity (1)of food grains milk and milk products and clothing by expenditure classes Rural and Urban India 1963-64
Expenditure classes amp correspond-ing land
Food grains
APE
Rural Milk amp milk
Products MPIE
Clothing
APE
Food arains
AVE
Urban Milk amp milk oroducts
APE
Clothing
MPE holding groups (acres)
Bottom 2
deciles-shyless than 049 093 060 281 007 248 006 092 050 229 009 441 002
3rd decile-shy050-099 072 043 219 009 217 008 061 030 183 011 325 005
4 amp 5th deciles-shy100-499 060 032 185 011 200 011 044 018 157 012 261 008
6 7 amp 8th deciles-shy500-999 051 024 160 012 187 013 031 011 138 012 214 009
9th decile-shy1000-1499 046 019 145 012 180 016 023 007 127 012 185 010
Lower of 1Oth decile-shy1500-2999 040 014 130 012 172 019 016 004 116 012 157 011
Upper j of 10th decile-shy3000+ 033 007 109 011 162 029 005 001 100 011 118 010
------- m----------------- --------- -------------------Mean for all classes 052 024 159 012 187 014 030 011 138 012 212 009
Source Estimated from the log-log-inverse function fitted to data from NSS1963-64 No 142 The Cabinet Secretariate Government of India 1968
16
Section 3 NCAER Consumption Functions
This section being concerned with examining the allocation of an entire budget of a household on various commoditiesp the individuil commodity consumption functions should bi estimated subject to the budget constraint This approach would ensure that the sum of estimated exshypenditure on individual commodities would not exceed the total budget of a household Formally this additivity condition can be satisfied by the log-log inverse model if the following restrictions are used in the estimation procedures
19 1 0(I)
i=1
19(2)
i=1
where i stands for 1 bull 19 commodities
We have not used the above approach because the commodity category of Miscellaneous (see Appendix 2) included such heterogenous articles as biscuits and confectionery medicines toiletry and sundry goods-shythe details of which were not specified in the original study Thus equations for 18 expenditure categories were individually estimated without using the above two restrictions And the expenditure on the 19th commodity category viz miscellaneous was estimated as a residual
Estimated Eguations
Table 4 gives the estimated equations (including the alternative functional form) for 18 expenditure categories The plot of residuals for different equations except for other textiles footwear and house rent revealed a fair degree of randomness R2 for equations estimated for va5ious expenditure categories ranged between 717 and 979 Such high Rs were presumably due to use of grouped data However use of grouped data implies a loss of degrees of freedom which in turn reduces the (statistical) efficiency of the significance test for regression coefficients Coisidering this implication the number of and Y (in LLI function) that were significant at the specified probability level was reasonable Thus out of 18 each9 andy 8 and 13 respectively weri significant either at 1 or 5 or pershycent level Furthermore r of the variable associated with3 was less than one percent in only four out of 18 (LLI) equations These four equations are for tobacco conveyance consumer services and education This finding suggests that a double-log (DL) instead of LLI function would be a better fit for these four expenditure nateshygories Hence a DL function was fitted to these four categories of expenditure
rhe sign of 3 is consistent with a prior expectation for various expenditure categories Thus 3 is positive in seven out of 18 (LLI)
17
Table 4 The estimated equations for various expenditure categories NCAER 1964-65
Expenditure Functional Regressign Coefficients sect2 SSE Categories Form
a
1 Foodgrains LLI 2579 -9150 018 960 33207 (604) (4242) (131)
LI 2663 -9720 962 33240 (050) (1175)
2 Milk amp Milk Products LLI -024 -24518 595 945 125045
(1172) (8232) (254)
3 Meat Eggs amp Fish LLI -2379 -14246 749 850 227886
(1582) (11112) (343)
4 Other Foods LLI -4642 13122 lb29 971 55970 (784) (5507) (170)
Tobacco LLI -3295 166 741 802 94702 (1019) (7164) (221)
DL -3272 736 811 94704 (212) (061)
6 Vanaspati LLI -45939 754-412 263 909775
(3160) (22203) (685)
7 Other Oils LLI 381 -22971 112 945 38694 (652) (4579) (141)
8 Sweetners LLI -164 -20307 264 891 97936 (1037) (7285) (225)
9 Cotton Textiles LLI -10308-744 524 979 19510 (A63) (3251) (100)
10 Woolen Textiles LLI -21635 890-6752 1521 497655 (2337) (16422) (507)
11 Other Textiles LLI -15646 30405 3341 810 1043426 (3385) (23778) (734)
12 Footwear LLI -3351 -16127 675 810 293063 (1794) (12602) (389)
13 Consumer LLI -7761 8050 9121923 245330 Durables amp Semi- (1641) (11530) (356) durables
Table 4--Continued 9xpenditure Functional ReQression Coefficients -2 SSE
Categories Form a 0
14 Conveyance LLI -8320 3956 2180 933 416770 (2139) (15028) (464)
DL -7770 2063 910 418145 (445) (129)
15 Consumer Services LLI -6052P 3905 1613 923 178207
(1399) (9827) (303) DL -5509 1497 926 179547
(291) (084)
16 Education LLI -8043 0409 2135 941 268895 (1718) (12071) (373)
DL -7986 2123 944 268909 (357) (103)
17 Fuel amp Light LLI -1046N -6552E 553 976 18586 (451) (3173) (098)
18 House Rent LLI -5213 -39198 1547 717 2804972 (5549) (38987) (1203)
Figures in parentheses are standard errors Significant at 1 percent
Significant at 5 percent Significant at 10 percent
equations These seven equations are for other foods (which include fruits nuts vegetables etc) tobacco other textiles durables conveyance consumer services and education Each of these expendshyture categories can be broadly termed as luxury items The expendishyture elasticity of these seven categories would therefore increase as per capita total consumer expenditure increases The exceptions to this would be tobacco and education the expenditure elasticity for which would remain constant even for LLI function This is because the size of in the (LLI) equations for these two items is less than one
Finally the r2 of the variable associated with ^ywas less than one percent in only one (ie food grains) out of 18 (LLI) equations In this one case therefore log-inverse (LI) function was fitted
19
Estimated Expenditure Elasticity and Marginal Propensity to Expend
Using the above equationsgand the per capita total consumerexpenditure of the seven expenditure (and corresponding land holding)classes (as given in Table 1) expenditure elasticity (71)and PAEof the 18 expenditure categories were computed Tables 5 and 6 givethe results Appendices 6 and 7 give the estimated average propensityto expend (APE) and per capita expenditure (E)on the 18 items
Table 5 shows that the expenditure elasticity of all the 18expenditure categories except that of tobacco education conveyanceand consumer services varied from one expenditure group to the otherFurther the expenditure elasticity of other foods other textiles anddurables increased as per capita total consumer expenditure increased
Table 6 on MPE of 18 expenditure categories shows that the MPEalso varied from one class to the other for all categories excepttobacco footwear woolen textiles and other textiles Althoughhowever the MPE for other categories varied the variation was notcontinuous in all categories Thus the MPE on milk and milk productsmeat eggs and fish vanaspati and to an extent durables conveyanceand consumer services remained constant in some (though not in all)particularly in fourth through ninth expenditure deciles
Estimated Pittern of Additional Demand
In the context of increasing incomes in rural areas examinationof marginal propensity to expend on various commodities is relevant tojudge the pattern of additional demand We have below obtained thesum of the marginal propensity to expend on each item that comprise thethree broad groups of expenditure categories for the seven expendishyture and corresponding land holding classess
Expenditure Corresponding Marginal Propensity to expend onclasses land holding Food Non-food Non-agri- MLscshygroups grains grain agr - culturalk ellashy
colturallS_ neous-Deciles Acres Rupees
Bottom 2 less than 049 059 020 021 shy3rd 050-099 038 031 022 0094th amp 5th 100-499 025 034 022 0196th 7th amp 8th 500-999 016 036 026 0229th 1000-1499 011 035 027 027Lower of 10th 1500-2999 006 034 032 028Upper t of 10th 3000+ 002 031 051 016
bgItems 2 through 8 in Table 6 Items 9 through 18 in Table 6
LIEstimated as a residual We have used LI equation for food grains DL equation for tobaccoeducation conveyance and consumer services and LLIequation for theremaining expenditure categories in computing 1 WE APE and E
8
Table 5 Expenditure elasticities f various expenditure categories by expenditure classes NCAER 1964-65
Bottom 2 3rd 4th amp 5th 6th 7th 9th Lower f Upper Mean for deciles decile deciles amp 8th decile of 10th of 10th all classes
deciles decie decile
(less than (050- (100- (500- (1000- (1500- (3000+ 049 acres) 099 499 999 1499 2999 acres)
acles) acres) acres) acres) acres)
Per capita monthly consumer expenditure (Rs) 893 1314 1780 2413 3071 4189 8584 2443
Eg2enditure elasticities of
1 Food grains 104 071 053 040 031 024 012 039 2 Milk amp milk
products 334 246 197 161 139 118 088 160 3 Meat eggs amp fish 234 183 155 134 121 109 091 133 4 Other foods 006 U-53 079 098 110 122 138 099 5 Tobacco 074 074 074 074 074 074 074 074 6 Vanaspati 541 376 284 217 176 136 080 214 7 Other oils 268 1E6 140 106 086 066 038 105 8 Sweetners 254 1E1 140 111 092 075 050 110 9 Cotton textiles 168 131 110 095 086 077 064 095
10 Woolen textiles 394 317 274 242 222 204 177 241
11 Other textiles 0 103 163 208 235 261 299 210
12 Footwear 248 190 158 134 120 106 086 134
13 Durables amp semishydurables 102 131 147 159 166 173 183 159
14 Conveyance 15 Consumer services
206 150
206 150
206 150
206 150
206 150
206 150
206 150
206 150
16 Education 212 212 212 212 212 212 212 212
17 Fuel amp light 18 House rent
129 594
105 453
u92 375
082 317
077 282
071 248
063 200
082 315
Negligible
Estimated from the functions fitted to data from NCAER All-India Consumer Expenditure SurveySource 1964-65 Vol II New Delhi 1967
Table 6 Marginal propensity to expend (APE) on various expenditure categories by expenditure classesAAER 196465
Bottom 2 3rd 4th amp 5th 6th 7th 9th Lower Upper f Mean forueciles decile deciles amp 8th decile of 10th of 10th all classes deciles decilc decile(less hap (050- (100- (500- (1000- (1500- (3000+
049 atres) 099 499 999 1499 2999 acres)acres) acres) acres) acres) acres)
Per capita monthly consumer exenditure (Rs) 893 1314 1780 2413 3071 4189 8584 2443
MPE on
Sources
1 Food grains 059 038 025 016 011 006 002 015 2 Milk amp milk
products 3 Meat eggs amp fish 4 Other foods 5 Tobacco 6 Vanaspati 7 Other oils 8 Sweetners 9 Cotton textiles
10 Woolen textiles 11 Other textiles 12 Footwear
007 002 001 001
005 004 009 0 0 0
011 003 OC5 001 001 005 005 008 0 0 001
012 003 007 001 002 004 005 007 P 0 001
013 003 009 001 002 004 004 006 001 001 001
013 003 010 001 002 003 003 006 001 0
001
012 003 012 001 002 002 002 005 001
001
009 002 016 001 001 001 001 003 002 002 001
013 003 009 001 002 004 004 006 001 0 001
13 Durables amp semishydurables
14 Conveyance 15 Consumer services 16 Education 17 Fuel amp light
001 00 002 001 007
001 001 002 001 007
001 002 002 002 006
002 002 003 003 005
002 003 003 003 005
003 005 004 005 004
005 010 006 011 003
002 003 003 C03 005
18 House rent 19 Miscellaneous
(approx)
- 001
009
001
019
002
022
003
027
004
028 008
016 002
023
Negligible
amp Estimated as a residual Estimated from the functions fitted to data from NCAER All-India Consumer Expenditure Survey1964-65 Vol II New Delhi 1967
22
It can be seen from the above that the marginal propensity to expend on food grains is the highest in the bottom two deciles which are largelycomposed of landless labor households Even the third decile which is comprised of smaller farms would spend 38 perat of their incremental expenditure on food grains Thus quite ironically it is the poor whowould support through his demand for food grains the green revolution Such a support however would require public policy of generatingemployment and income of the poor This policy is particularly reshyquired because this group of people have benefitted directly the least from the green revolution
The rapid decline in AIE on food grains implies that the marginalpropensity to market food grains would increase as we move along the expenditure deciles and the corresponding landholding groups
The WE on nonfood grain agricultural commodities first increased and then gradually declined along the expenditure classes MAre importantly the WE on milk and milk products is relatively high in the 6th through 9th deciles which are comprised of farmers with 5 to 15 acres This is a very happy outcome because expansion of liveshystock enterprises which are at present in rural areas characterized by labor-intensive technology provides the scope for meeting the need of generating employment Credit and marketing facilities wouldhowever be most required for the expansion of livestock enterprise
Furthermore the MPE on other foods (which include fruits andvegetables besides other items) increases rapidly as per capita total consumer expenditure increases Again production of these productsparticularly fruits and vegetables entail labor-intensive techniques
Along the expenditure scale the MPE on nonagricultural commodities increases only in the upper half of the expenditure distribution Onlythe upper half of the 10th decile would spend over 50 percent of its incremental expenditure on nonagricultural items Among the various nonagricultural items the WE for cotton textiles and fuel and lightdeclines along the expenditure scale Against this the correspondingfigures for woolen textiles and footwear remains constant But for durables consumer services education conveyances and house rent it shows a tendency to increase
It should be recognized that the above analysis of WVE on different nonagricultural items has remained incomplete due to lack of details onmiscellaneous category which accounted for more than 10 percent of the incremental expenditure in all but the bottom three deciles The analysis has also suffered due to the outdated nature of the data studied Finally inasmuch as the assumption of all-India consumption pattern being applicable to rural households is not valid the above results show perhaps an underestimation of the incremental demand for food grains and an overest4mation of change in demand for other commodities
CHAPTER V
CONCLUSIONS
The main conclusions aret (1) The expenditure elasticity of foodgrainsp and milk and milk products varied from one expenditure class tothe other in both NSS and NCAER data However in these two datasources the marginal propensity to expend on milk and milk products reshymained almost constant over all expenditure classes beyond the bottomthree deciles (2) The above finding is also appl- able to rural andurban NSS consumption functions (3) The rural conkumption functionswere different irom the urban consumption functions for the threecommodities viz food grains milk and milk products and clothingstudied (4) In NCAER data except for tobacco education conveyanceand consumer services the expenditure elasticity of all other expenditurecategories (food grains milk and milk products meat eggs and fishother foods vanaspati other oils sweetners cotton textiles woolentextiles other textiles footwear durables fuel and light and houserent) varied in different expenditure classes (5) But the variationin marginal propensity to expend on all the items from one expenditureclass to the other was not continuous (6) The bottom three decileswhich comprised landless and smaller farm households would provide themaximum boost to the development of the food grains sector whereas theremaining deciles would provide the maximum market for nonfood grainagricultural goods But the additional demand for nontraditionalnonagricultural items would mainly come from the top decile in rural India
24
References
1 Goreux L M Income and Food Consumption Monthly Bulletin of Agricultural Economics and Statistics Vol IX No 10 October 1960 pp 1-13
2 Griliches Zvi Specification Bias in Estimates of Production Functions Journal of Farm Economics Vol 34 No 1 February 1957 pp 8-20
3 Houthakker H Sdeg and L D Taylor Consumer Demand in the United States Analysis and Projections second and enlarged editionHarvard University Press Cambridge Massachusetts 1970
4 India Government of The Cabinet Secretariate The National SampleSurvey 18th Round February 1963-January 1964 No 142 Tables with notes on Consumer Expenditure 1968
5 The National SampleSurvey 17th Round September 1961-July 1962 No 162 Tables with notes on some Features of Land Holdings in Rural Areas 1969
b Leser C E V Forms of Engel Functions Econometrica Vol 31 No 4 October 1963 pp 694-703
7 Mellor John W and Uma J Lele Growth Linkages of the New Foodshygrain Technologies Occasional Paper 50 Department of Agriculshytural Economics Cornell University USAID-Employment and Income Distribution Project June 1971
8 National Council of Applied Economic Research All India Consumer Expenditure Survey Vol II New Delhi 1967
9 Prais S J and H S Houthakker The Analysis of Family BudgetsThe Syndics of the Cambridge University Press Cambridge England 1955
10 Sinha R P An Analysis of Food Expenditures in India Journalof Farm Economics Vol 48 No 1 February 1966 pp 113-123
FIGURE 2 DISTRIBUTION OF HOUSEHOLDS BY PER CAPITA MONTHLY TOTAL CONSUMER EXPENDITURE)NSS) 1963-64
14
u 12 0
S10-I0
0 o 08 C
06 L
U-
S04
02
10 20 30 40 50 60 70 80 90 100 110 12(
Per Capita Monthly Total Consumer Expenditure (Rupees)
Source Compiled from National Sample Survey No 142 The Cabinet Secretoriate Government of India 1963-64
FIGURE I DISTRIBUTION OF HOUSEHOLDS BY PER CAPITA MONTHLY TOTAL CONSUMER EXPENDITURE NCAER 1964-65
16
14
12 G) 40
o 10
0
9 08
U 06
04
02
10 20 30 40 50 60 70 80 90 100 Per Capita Monthly Total Consumer Expenditure (Rupees)
Source Compiled from National Council of Applied Economic Research All- India Consumer Expenditure Survey Volume II New Delhi
1967
27
Appendix 2
Classification of Comodities NCAER 1964-65
1 Food grains Cereals pulses
Cereals include rice wheat jowar maize bajra barley ragi small millets and their products
Pulses include tur mung moth gram urad peas and their products
2 Milk and Milk Productss Milk buttermilk ghee butter
3 Meat eggs and fish Details not specified in the source
4 Other foodss Vegetables fruits nuts spices salt beverages refreshments jams jelly pickles
5 Tobacco and allied
productss Bidi cigarettes chewing tobacco etc
6 Vanaspati Hydrogenated edible oil
7 Other edible oils Groundnut oil mustard oil
8 Sweeteners Sugar gur and chandsari
9 Cotton textiles Mll-made khadi and handloomed clothing including ready made garments
10 Woolen textiless Woolen clothing
11 Other textiless Silk rayon nylon clothing
12 Footwear Sandals shoes
L To estimate expenditure on other foods log-log-inverse function was estimated on NSS data taking other food expenditures as a function of total expenditure The estimated equation was then used to predictother food expenditure for NCAER From the predicted value of other food expenditures the expenditure on oils meat eggs and fish and sweetening agents as reported in NCAER was subtracted to arrive at expenditure on other foods as defined here This was done because the NSS classification of other foods included oils meat eggs and fish and sweeteners besides the items that are included in the classification of other foods defined here This procedure was followed because NCAER did not give separate data for the items included in other foods
28
13 Durable and Semi-durabless Furniture kitchen equipment sewing
wachines electric fanstransistor =adios radios bicycles motor cars etc
14 Conveyances Expenditure of transportation by bus taxi train aeroplane steamer boat motor car motorcycle scooters rickshyshaws bullock cart horse cart including conveyance charges incurred by children for going to school
15 Consumer Servicesamp Medical care litigation domestic work barbers washermen dry clearners carpenshyters blacksmiths priests plumbers gardeners gold and silversmiths and drivers
16 Educations Books journals newspapers periodicals stationery school fees private tutors fees
17 Fuel and lights Details not specified in the source
18 House rents Details not specified in the source
19 Miscellaneous Biscuits and confectionery intoxicants pan medicines toiletry sports and amusements sundry goods (details unshyspecified in the study) ceremonials and gifts
Consumption functions were estimated for items 1 to 18
Sources National Council of Applied Economic Research All-India Consumer Expenditure Survey Vol II New Delhi 1967
29
Appendix 3
Classification of CModities NSS 1963-64
1 Food grains Cereals pulses
Cereals include rice wheat jowarbara maize barley small millets ragi Bengal gram and their products
Pulses include tur gram moong masoor urad peas aiu wtuir produsts
2 Milk and Milk Products Liquid milk milk (condensed powdered) ghee butter dahi ghol lassi and other milk products
3 Other foods Oil oil seeds and productsvegetables fruits and nuts meat eggs and fish sugar salt spices beverages refreshshyments and processed food pickles jamsand jellies
4 Clothings Cotton (mill made hand-loomed and khadi) woolen silk rayon etc inshycluding bedding and upholstery
5 Fuel and lights Coke coal firewood electricity gas dungcake charcoal kerosene candle matches and other fuel and lighting oil
6 Rents Rents on residential house residential land and other consumer goods No imputation of rent for residential houses owned by the sample households was made
7 Taxess Consumer taxes like road Cess chewkidari taxes municipal rates consumer license fees and other local taxes Income tax or taxes relating to household enterprise are excluded
8 Other nonfood items Pan etc tobacco and products drugs and intoxicants amusements and sportseducation medicine toilets sundrygoods consumer services conveyanceceremonials furniture musical instrushyments ornaments domestic utensils footwear and other durable or semishy
30
durable goods and their repairing exshypense including the maintenance of residential houses
Consumption functions were estimated for item numbers 1 2 and 4
Sources The National Sample Survey No 142 The Cabinet Secretariate Government of India 1968
31
Appendix 4 Average propensity to expend (APE) and per capita expenditure(E) of food grains and milk and milk products by expenditure classes All-India 1963-64 and 1964-65
Expenditure Per classes amp capita NSS NCAER corresponding mo total Food Milk amp milk Food Milk amp milk land holding consumer orains roducts grains -products groups (Acres) expendi- APE E APE E APE E APE E
ture Rurees
Bottom 2 deciles-shyless than 049 893 063 561 002 022 054 483 002 019
3rd decile-- 1314 059 782 004 058 052 684 004 058 050-099
4 amp 5th deciles-- 1780 053 942 006 107 047 831 006 113 100-499
6 7 amp 8th deciles-- 2413 045 1080 007 180 040 958 008 194 500-999
9th decile-- 3071 038 1172 008 260 034 1045 009 279 1000-1499
Lower of 10th decile-- 4189 030 1271 009 395 027 1137 010 415 1500-2999
Upper j of 10th decile-- 8b84 017 1424 011 913 015 1280 010 858 3000+
Mean for all classes 2443 044 1083 008 184 039 960 008 198
Source Estimated from the functions fitted to data from NSS 1963-64 No 142 The Cabinet Secretariate Government of India 1968 and also from NCAER All-India Consumer Expenditure Suiveyp 1964-65 Vol II New Delhi 1967
----------------------------------------------------------- --------
32
Appendix 5 Average propensity to egpend (APE) and per capita expenditure (E) of food grains milk and milk products and clothing by expenditure classesp Rural and Urban India 1963-64
Expenditure classes amp Rural Urban corresponding Food Milk amp milk Clothing Food Milk amp milk Clothing land holding grains Droduc s grains Droducts aruos (Acres) APE E APE E APE E APE E APE E APE E
Bottom 2 deciles-shyless than 049 064 571 002 022 002 021 054 484 004 037 001 005
3rd decile-shy0b0-099 060 784 004 056 004 051 049 647 006 081 002 021
4 amp 5th deciles-shy100-499 054 956 006 104 005 096 042 757 008 136 003 052
6 7 amp 8th deciles-shy500-999 047 1131 007 176 007 174 035 847 009 213 004 106
9th decile-shy1000-1499 041 1271 008 2b3 009 271 029 904 010 294 006 171
Lower j of 10th decile-shylb00-2999 035 1452 009 388 011 467 023 959 010 428 007 290
Upper j of 10th decile-shy3000+ 022 1884 010 906 018 1540 012 1030 011 921 009 765
-Mean for all classes 047 1139 007 179 007 178 03b 850 009 217 004 109
Sources Estimated from the functions fitted to data from NSS 1963-64 No 142 The Cabinet Socretariate Government of India 1968
Appendix 6 Average propensity to expend (APE) on various expenditure categories by expenditure classesNCAER3 1964-65
Bottom 2 deciles
3rd decile
4th amp 5th deciles
6th 7th amp 8th
9th decile
Lower i of 10th
Upper of 10th
Aan for all classes
(less than 049 acres)
(050-099
ac es)
(100-499 acres)
deciles (500-999
acres)
(1000-1499
acres)
decile (1500-2999
acres)
decile (3000shyacres)
Per capita monthly consumer expenditure
893 1314 1780 2413 3071 4189 8584 2443 APE on
1 Food grains 054 052 047 040 034 027 015 0392 Milk amp milkproducts 002 004 006 008 009 0103 Meat eggs amp fish 001 010 008002 002 002 002 003 0034 Other foods 002013 010 009 009 009 009 0125 Tobacco 009002 002 002 002 0016 Vanaspati 0 0
001 001 002001 001 001 001 0017 Other oils 001002 003 003 003 003 0038 Sweetners 002 003002 003 003 003 003 003 0029 Cotton textiles 004005 006 007 007 007 006 00510 Woolen textiles 00700 0 001 011 Other textiles 0 4 4012 Footwear 0 001 00 0 0 001 00113 Durables amp semishydurables 0 4 0 001 001 002 003 00114 Conveyance 0 001 001 00115 Consumer services 002 002 005 001001 001 002 002 002 00316 Education 004 0020 001 001 001 002 002 00517 Fuel amp light 006 007 001007 006 006 00618 House rent 004 0060 6 0 001 001 002 004 00119 Miscellaneous
(approx) 009 007 008 011 015 018 021 011
Negligible a Estimated as a residualSource Estimated from the functions fitted to data from NCAER All-India Consumer Expenditure Survey1964-1965 Vol II New Delhi 1967
Appendix 7 Per capita monthly expenditure on various expenditure categories by expenditure classes NCAER 1964-65
Bottov 2 3zd 4th amp 5th 6th 7th 9th Lower f Upper I Iean for deciles decile deciles amp 8th decile of 10th of 10th all classes
deciles decile decile (less to (050- (100- (500- (1000- (1500- (3000+ 049 acres) 099 499 999 1499 2999 acres)
acresl acres) acres) gcres) acres)
Per caita monthly consumer exoenditure (Rs) - 893 1314 1780 2413 3071 4189 8584 2443
Monthly ger capita expenditure on
1 Food grains 483 684 831 958 1045 1137 1280 968 2 Milk amp milk
products 019 058 113 194 279 415 858 198 3 eat eggs amp fish 01) 022 036 056 016 108 220 057 4 Other foods 119 134 164 216 278 398 1016 219 5 Tobacco 019 025 032 039 047 059 100 040 6 Vanaspati 001 004 011 023 036 059 125 023 7 Other oils 014 034 056 081 102 128 184 082 8 5weetners 016 036 058 085 108 140 217 086 9 Cotton textiles 047 084 120 164 204 263 434 166
10 Woolen textiles 0 001 003 006 011 020 079 006 11 Other textiles 0 001 001 002 004 009 066 002 12 Footwear 0 006 010 015 021 030 059 016 13 Durables amp semishy
durables 007 011 017 027 040 068 245 028 14 Conveyance 004 009 016 030 049 094 412 030 15 Consumer services 011 019 030 048 068 109 319 048
16 Education 0t4 008 015 029 049 094 433 030 17 Fuel amp light 057 089 119 156 189 237 382 157
18 House rent 0 002 005 015 030 069 338 015 19 Miscellaneousm
(approx) 082 087 143 271 435 752 1817 272
oNegligible j Estimated as a residual Sources Estimated from the functions fitted to data from NCAER All-India Consumer Expenditure Survey 1964-65 Vol I1 New Delhi 1967
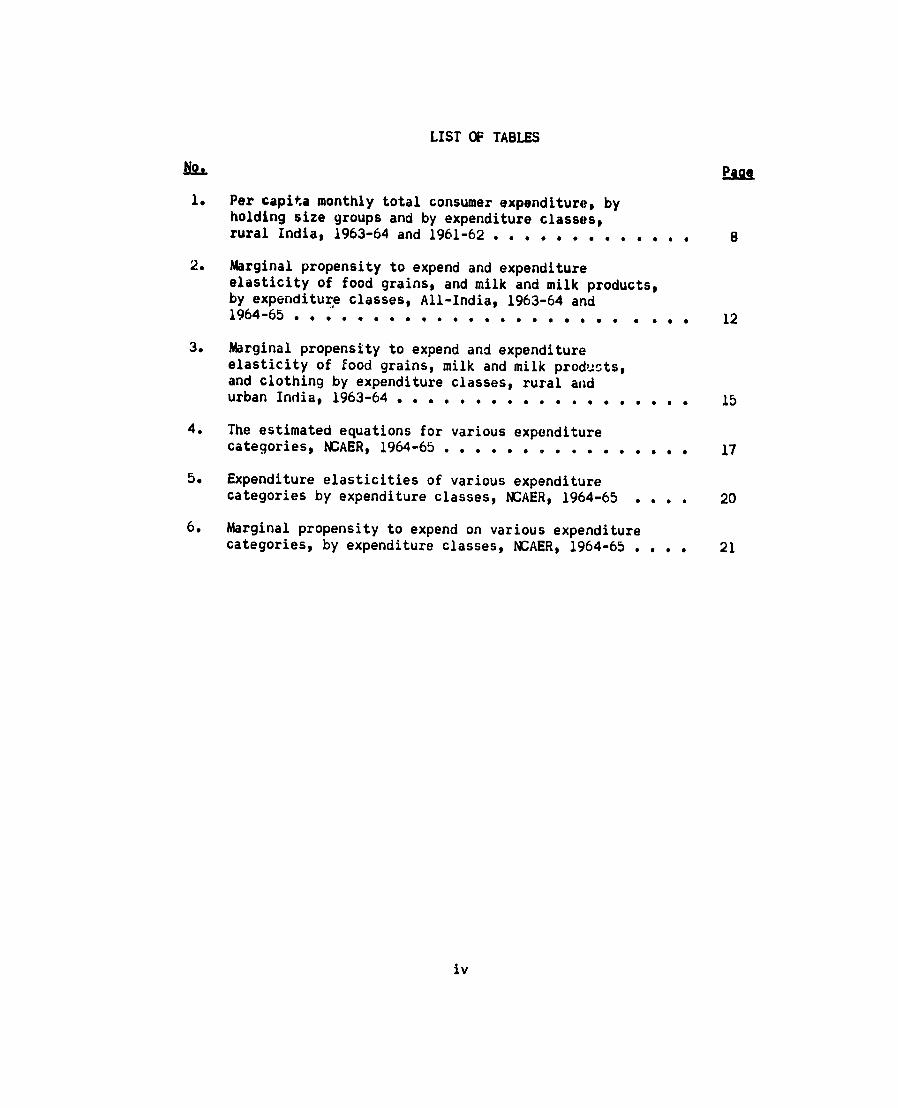
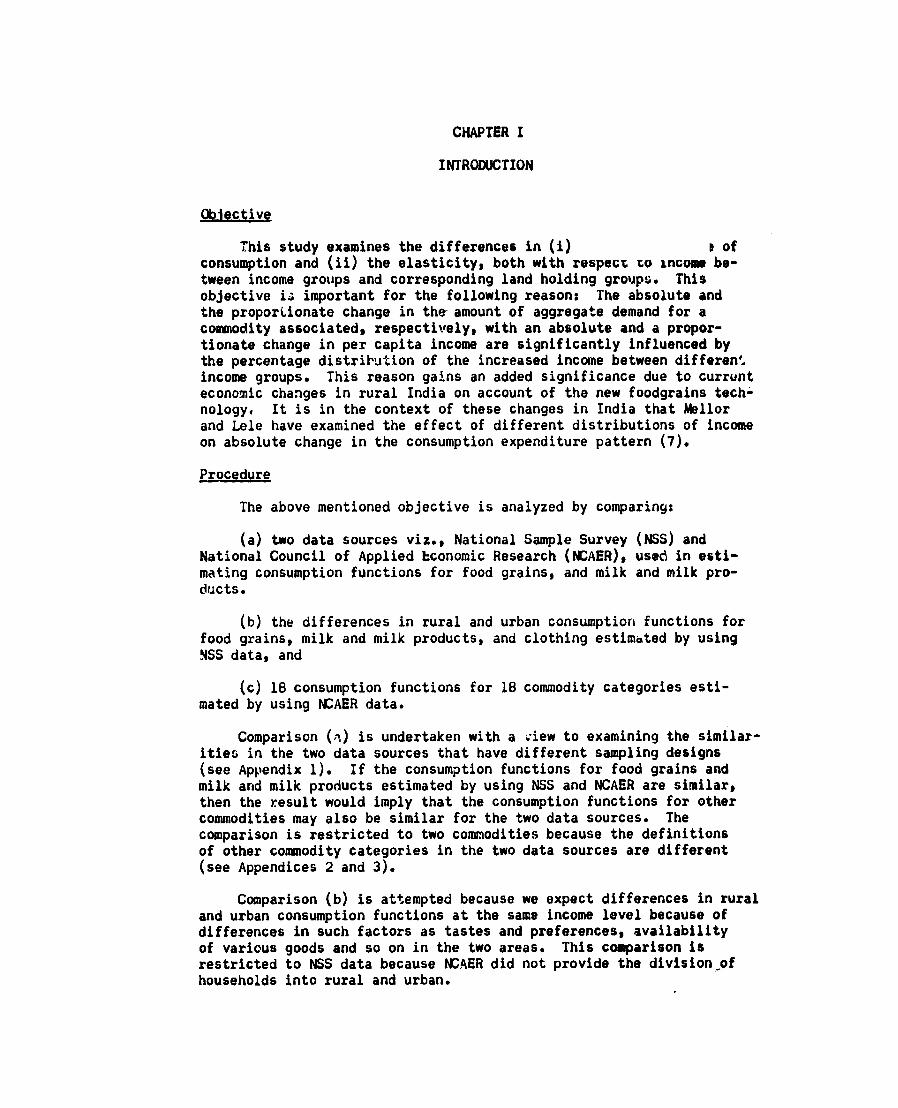
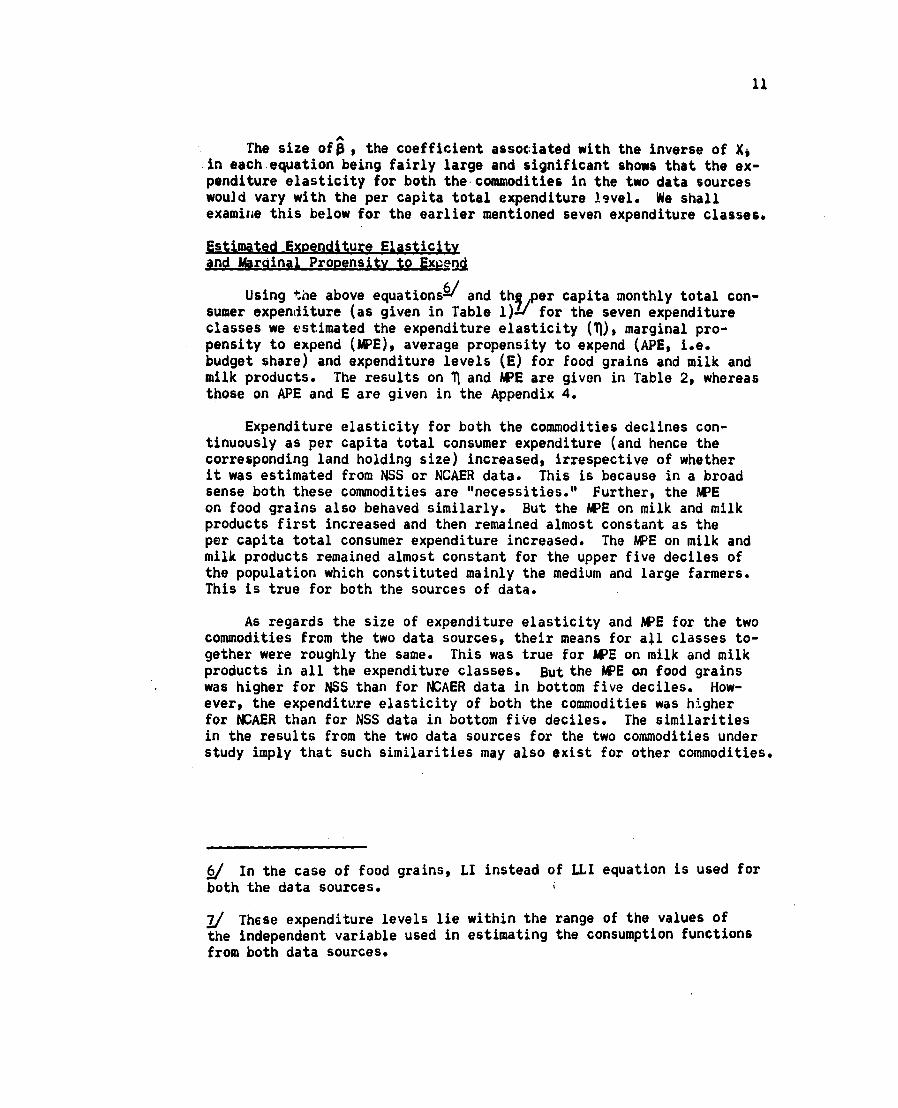

14
R2 of all the equations were high Both P and 7 in all the equations except ^in food grains equatior for urban househRlds turned out significant in this exceptiontl case even the sign of j wag not as per expectations although~r of the variable associated with y was as high as 222 Further P being negative in all the equationsthe expenditure elasticity of the three commodities would decline (as per capita total consumer expenditure increases) in both the areas The diffarences in the estimated consumption functions of rural and urban areas was tested by the F test The test suggeststhat these two functions are different for the three commodities at 5 percent level of significance Thus the hypothesis of no difference between the rural and urban consumption functions is reshyjected
Estimated Expenditure Elasticity (f) and Marginal Propensity to Expend (E)
The above equations were used to estimate 1 E APE and E on three commodities in rural and urban areas at the same level of percapita total consumer expenditure (as given in Table 1) Table 3 gives the results on I and WE whereas Appendix 5 gives the results on APE and E
The expenditure elasticities for both food grains and milk and milk products are higher in all expenditure classes in rural than in urban areas Indeed the expenditure elasticity of food grains in rural areas declines less rapidly than in urban areas as per capita total consumer expenses rise But the converse is true of the behavior of expenditure elasticity of milk and milk products Expenditure elasticity of clothing is however higher in all expenditure classes except the top decile in urban than in rural areas Over the exshypenditure classes this elasticity declines more rapidly in urban than in rural areas
The WE on food grains and clothing is higher in all expenditureclasses in rural than in urban areas But the WE on milk and milk products is higher in the bottom three deciles in urban than in rural areas In the remaining expenditure classes the WE remained the same in both areas The above discussion also shows that the exshypenditure elasticity and WE for an individual commodity would varyfrom one expenditure group to the other in both rural and urban areas However the E on milk and milk products varied only in the bottom three deciles in the other deciles it remained almost constant
The preceding discussion warrants examination of the consumptionfunctions for all the commodities that comprise a budget of a houseshyhold separately for rural and urban areas However due to nonshyavailability of the required data the ICAER (All-India) data are used in the following section to estimate consumption functions for 18 commodity categories
---------
Table 3 Marginal propensity to expend (APE) and expenditure elasticity (1)of food grains milk and milk products and clothing by expenditure classes Rural and Urban India 1963-64
Expenditure classes amp correspond-ing land
Food grains
APE
Rural Milk amp milk
Products MPIE
Clothing
APE
Food arains
AVE
Urban Milk amp milk oroducts
APE
Clothing
MPE holding groups (acres)
Bottom 2
deciles-shyless than 049 093 060 281 007 248 006 092 050 229 009 441 002
3rd decile-shy050-099 072 043 219 009 217 008 061 030 183 011 325 005
4 amp 5th deciles-shy100-499 060 032 185 011 200 011 044 018 157 012 261 008
6 7 amp 8th deciles-shy500-999 051 024 160 012 187 013 031 011 138 012 214 009
9th decile-shy1000-1499 046 019 145 012 180 016 023 007 127 012 185 010
Lower of 1Oth decile-shy1500-2999 040 014 130 012 172 019 016 004 116 012 157 011
Upper j of 10th decile-shy3000+ 033 007 109 011 162 029 005 001 100 011 118 010
------- m----------------- --------- -------------------Mean for all classes 052 024 159 012 187 014 030 011 138 012 212 009
Source Estimated from the log-log-inverse function fitted to data from NSS1963-64 No 142 The Cabinet Secretariate Government of India 1968
16
Section 3 NCAER Consumption Functions
This section being concerned with examining the allocation of an entire budget of a household on various commoditiesp the individuil commodity consumption functions should bi estimated subject to the budget constraint This approach would ensure that the sum of estimated exshypenditure on individual commodities would not exceed the total budget of a household Formally this additivity condition can be satisfied by the log-log inverse model if the following restrictions are used in the estimation procedures
19 1 0(I)
i=1
19(2)
i=1
where i stands for 1 bull 19 commodities
We have not used the above approach because the commodity category of Miscellaneous (see Appendix 2) included such heterogenous articles as biscuits and confectionery medicines toiletry and sundry goods-shythe details of which were not specified in the original study Thus equations for 18 expenditure categories were individually estimated without using the above two restrictions And the expenditure on the 19th commodity category viz miscellaneous was estimated as a residual
Estimated Eguations
Table 4 gives the estimated equations (including the alternative functional form) for 18 expenditure categories The plot of residuals for different equations except for other textiles footwear and house rent revealed a fair degree of randomness R2 for equations estimated for va5ious expenditure categories ranged between 717 and 979 Such high Rs were presumably due to use of grouped data However use of grouped data implies a loss of degrees of freedom which in turn reduces the (statistical) efficiency of the significance test for regression coefficients Coisidering this implication the number of and Y (in LLI function) that were significant at the specified probability level was reasonable Thus out of 18 each9 andy 8 and 13 respectively weri significant either at 1 or 5 or pershycent level Furthermore r of the variable associated with3 was less than one percent in only four out of 18 (LLI) equations These four equations are for tobacco conveyance consumer services and education This finding suggests that a double-log (DL) instead of LLI function would be a better fit for these four expenditure nateshygories Hence a DL function was fitted to these four categories of expenditure
rhe sign of 3 is consistent with a prior expectation for various expenditure categories Thus 3 is positive in seven out of 18 (LLI)
17
Table 4 The estimated equations for various expenditure categories NCAER 1964-65
Expenditure Functional Regressign Coefficients sect2 SSE Categories Form
a
1 Foodgrains LLI 2579 -9150 018 960 33207 (604) (4242) (131)
LI 2663 -9720 962 33240 (050) (1175)
2 Milk amp Milk Products LLI -024 -24518 595 945 125045
(1172) (8232) (254)
3 Meat Eggs amp Fish LLI -2379 -14246 749 850 227886
(1582) (11112) (343)
4 Other Foods LLI -4642 13122 lb29 971 55970 (784) (5507) (170)
Tobacco LLI -3295 166 741 802 94702 (1019) (7164) (221)
DL -3272 736 811 94704 (212) (061)
6 Vanaspati LLI -45939 754-412 263 909775
(3160) (22203) (685)
7 Other Oils LLI 381 -22971 112 945 38694 (652) (4579) (141)
8 Sweetners LLI -164 -20307 264 891 97936 (1037) (7285) (225)
9 Cotton Textiles LLI -10308-744 524 979 19510 (A63) (3251) (100)
10 Woolen Textiles LLI -21635 890-6752 1521 497655 (2337) (16422) (507)
11 Other Textiles LLI -15646 30405 3341 810 1043426 (3385) (23778) (734)
12 Footwear LLI -3351 -16127 675 810 293063 (1794) (12602) (389)
13 Consumer LLI -7761 8050 9121923 245330 Durables amp Semi- (1641) (11530) (356) durables
Table 4--Continued 9xpenditure Functional ReQression Coefficients -2 SSE
Categories Form a 0
14 Conveyance LLI -8320 3956 2180 933 416770 (2139) (15028) (464)
DL -7770 2063 910 418145 (445) (129)
15 Consumer Services LLI -6052P 3905 1613 923 178207
(1399) (9827) (303) DL -5509 1497 926 179547
(291) (084)
16 Education LLI -8043 0409 2135 941 268895 (1718) (12071) (373)
DL -7986 2123 944 268909 (357) (103)
17 Fuel amp Light LLI -1046N -6552E 553 976 18586 (451) (3173) (098)
18 House Rent LLI -5213 -39198 1547 717 2804972 (5549) (38987) (1203)
Figures in parentheses are standard errors Significant at 1 percent
Significant at 5 percent Significant at 10 percent
equations These seven equations are for other foods (which include fruits nuts vegetables etc) tobacco other textiles durables conveyance consumer services and education Each of these expendshyture categories can be broadly termed as luxury items The expendishyture elasticity of these seven categories would therefore increase as per capita total consumer expenditure increases The exceptions to this would be tobacco and education the expenditure elasticity for which would remain constant even for LLI function This is because the size of in the (LLI) equations for these two items is less than one
Finally the r2 of the variable associated with ^ywas less than one percent in only one (ie food grains) out of 18 (LLI) equations In this one case therefore log-inverse (LI) function was fitted
19
Estimated Expenditure Elasticity and Marginal Propensity to Expend
Using the above equationsgand the per capita total consumerexpenditure of the seven expenditure (and corresponding land holding)classes (as given in Table 1) expenditure elasticity (71)and PAEof the 18 expenditure categories were computed Tables 5 and 6 givethe results Appendices 6 and 7 give the estimated average propensityto expend (APE) and per capita expenditure (E)on the 18 items
Table 5 shows that the expenditure elasticity of all the 18expenditure categories except that of tobacco education conveyanceand consumer services varied from one expenditure group to the otherFurther the expenditure elasticity of other foods other textiles anddurables increased as per capita total consumer expenditure increased
Table 6 on MPE of 18 expenditure categories shows that the MPEalso varied from one class to the other for all categories excepttobacco footwear woolen textiles and other textiles Althoughhowever the MPE for other categories varied the variation was notcontinuous in all categories Thus the MPE on milk and milk productsmeat eggs and fish vanaspati and to an extent durables conveyanceand consumer services remained constant in some (though not in all)particularly in fourth through ninth expenditure deciles
Estimated Pittern of Additional Demand
In the context of increasing incomes in rural areas examinationof marginal propensity to expend on various commodities is relevant tojudge the pattern of additional demand We have below obtained thesum of the marginal propensity to expend on each item that comprise thethree broad groups of expenditure categories for the seven expendishyture and corresponding land holding classess
Expenditure Corresponding Marginal Propensity to expend onclasses land holding Food Non-food Non-agri- MLscshygroups grains grain agr - culturalk ellashy
colturallS_ neous-Deciles Acres Rupees
Bottom 2 less than 049 059 020 021 shy3rd 050-099 038 031 022 0094th amp 5th 100-499 025 034 022 0196th 7th amp 8th 500-999 016 036 026 0229th 1000-1499 011 035 027 027Lower of 10th 1500-2999 006 034 032 028Upper t of 10th 3000+ 002 031 051 016
bgItems 2 through 8 in Table 6 Items 9 through 18 in Table 6
LIEstimated as a residual We have used LI equation for food grains DL equation for tobaccoeducation conveyance and consumer services and LLIequation for theremaining expenditure categories in computing 1 WE APE and E
8
Table 5 Expenditure elasticities f various expenditure categories by expenditure classes NCAER 1964-65
Bottom 2 3rd 4th amp 5th 6th 7th 9th Lower f Upper Mean for deciles decile deciles amp 8th decile of 10th of 10th all classes
deciles decie decile
(less than (050- (100- (500- (1000- (1500- (3000+ 049 acres) 099 499 999 1499 2999 acres)
acles) acres) acres) acres) acres)
Per capita monthly consumer expenditure (Rs) 893 1314 1780 2413 3071 4189 8584 2443
Eg2enditure elasticities of
1 Food grains 104 071 053 040 031 024 012 039 2 Milk amp milk
products 334 246 197 161 139 118 088 160 3 Meat eggs amp fish 234 183 155 134 121 109 091 133 4 Other foods 006 U-53 079 098 110 122 138 099 5 Tobacco 074 074 074 074 074 074 074 074 6 Vanaspati 541 376 284 217 176 136 080 214 7 Other oils 268 1E6 140 106 086 066 038 105 8 Sweetners 254 1E1 140 111 092 075 050 110 9 Cotton textiles 168 131 110 095 086 077 064 095
10 Woolen textiles 394 317 274 242 222 204 177 241
11 Other textiles 0 103 163 208 235 261 299 210
12 Footwear 248 190 158 134 120 106 086 134
13 Durables amp semishydurables 102 131 147 159 166 173 183 159
14 Conveyance 15 Consumer services
206 150
206 150
206 150
206 150
206 150
206 150
206 150
206 150
16 Education 212 212 212 212 212 212 212 212
17 Fuel amp light 18 House rent
129 594
105 453
u92 375
082 317
077 282
071 248
063 200
082 315
Negligible
Estimated from the functions fitted to data from NCAER All-India Consumer Expenditure SurveySource 1964-65 Vol II New Delhi 1967
Table 6 Marginal propensity to expend (APE) on various expenditure categories by expenditure classesAAER 196465
Bottom 2 3rd 4th amp 5th 6th 7th 9th Lower Upper f Mean forueciles decile deciles amp 8th decile of 10th of 10th all classes deciles decilc decile(less hap (050- (100- (500- (1000- (1500- (3000+
049 atres) 099 499 999 1499 2999 acres)acres) acres) acres) acres) acres)
Per capita monthly consumer exenditure (Rs) 893 1314 1780 2413 3071 4189 8584 2443
MPE on
Sources
1 Food grains 059 038 025 016 011 006 002 015 2 Milk amp milk
products 3 Meat eggs amp fish 4 Other foods 5 Tobacco 6 Vanaspati 7 Other oils 8 Sweetners 9 Cotton textiles
10 Woolen textiles 11 Other textiles 12 Footwear
007 002 001 001
005 004 009 0 0 0
011 003 OC5 001 001 005 005 008 0 0 001
012 003 007 001 002 004 005 007 P 0 001
013 003 009 001 002 004 004 006 001 001 001
013 003 010 001 002 003 003 006 001 0
001
012 003 012 001 002 002 002 005 001
001
009 002 016 001 001 001 001 003 002 002 001
013 003 009 001 002 004 004 006 001 0 001
13 Durables amp semishydurables
14 Conveyance 15 Consumer services 16 Education 17 Fuel amp light
001 00 002 001 007
001 001 002 001 007
001 002 002 002 006
002 002 003 003 005
002 003 003 003 005
003 005 004 005 004
005 010 006 011 003
002 003 003 C03 005
18 House rent 19 Miscellaneous
(approx)
- 001
009
001
019
002
022
003
027
004
028 008
016 002
023
Negligible
amp Estimated as a residual Estimated from the functions fitted to data from NCAER All-India Consumer Expenditure Survey1964-65 Vol II New Delhi 1967
22
It can be seen from the above that the marginal propensity to expend on food grains is the highest in the bottom two deciles which are largelycomposed of landless labor households Even the third decile which is comprised of smaller farms would spend 38 perat of their incremental expenditure on food grains Thus quite ironically it is the poor whowould support through his demand for food grains the green revolution Such a support however would require public policy of generatingemployment and income of the poor This policy is particularly reshyquired because this group of people have benefitted directly the least from the green revolution
The rapid decline in AIE on food grains implies that the marginalpropensity to market food grains would increase as we move along the expenditure deciles and the corresponding landholding groups
The WE on nonfood grain agricultural commodities first increased and then gradually declined along the expenditure classes MAre importantly the WE on milk and milk products is relatively high in the 6th through 9th deciles which are comprised of farmers with 5 to 15 acres This is a very happy outcome because expansion of liveshystock enterprises which are at present in rural areas characterized by labor-intensive technology provides the scope for meeting the need of generating employment Credit and marketing facilities wouldhowever be most required for the expansion of livestock enterprise
Furthermore the MPE on other foods (which include fruits andvegetables besides other items) increases rapidly as per capita total consumer expenditure increases Again production of these productsparticularly fruits and vegetables entail labor-intensive techniques
Along the expenditure scale the MPE on nonagricultural commodities increases only in the upper half of the expenditure distribution Onlythe upper half of the 10th decile would spend over 50 percent of its incremental expenditure on nonagricultural items Among the various nonagricultural items the WE for cotton textiles and fuel and lightdeclines along the expenditure scale Against this the correspondingfigures for woolen textiles and footwear remains constant But for durables consumer services education conveyances and house rent it shows a tendency to increase
It should be recognized that the above analysis of WVE on different nonagricultural items has remained incomplete due to lack of details onmiscellaneous category which accounted for more than 10 percent of the incremental expenditure in all but the bottom three deciles The analysis has also suffered due to the outdated nature of the data studied Finally inasmuch as the assumption of all-India consumption pattern being applicable to rural households is not valid the above results show perhaps an underestimation of the incremental demand for food grains and an overest4mation of change in demand for other commodities
CHAPTER V
CONCLUSIONS
The main conclusions aret (1) The expenditure elasticity of foodgrainsp and milk and milk products varied from one expenditure class tothe other in both NSS and NCAER data However in these two datasources the marginal propensity to expend on milk and milk products reshymained almost constant over all expenditure classes beyond the bottomthree deciles (2) The above finding is also appl- able to rural andurban NSS consumption functions (3) The rural conkumption functionswere different irom the urban consumption functions for the threecommodities viz food grains milk and milk products and clothingstudied (4) In NCAER data except for tobacco education conveyanceand consumer services the expenditure elasticity of all other expenditurecategories (food grains milk and milk products meat eggs and fishother foods vanaspati other oils sweetners cotton textiles woolentextiles other textiles footwear durables fuel and light and houserent) varied in different expenditure classes (5) But the variationin marginal propensity to expend on all the items from one expenditureclass to the other was not continuous (6) The bottom three decileswhich comprised landless and smaller farm households would provide themaximum boost to the development of the food grains sector whereas theremaining deciles would provide the maximum market for nonfood grainagricultural goods But the additional demand for nontraditionalnonagricultural items would mainly come from the top decile in rural India
24
References
1 Goreux L M Income and Food Consumption Monthly Bulletin of Agricultural Economics and Statistics Vol IX No 10 October 1960 pp 1-13
2 Griliches Zvi Specification Bias in Estimates of Production Functions Journal of Farm Economics Vol 34 No 1 February 1957 pp 8-20
3 Houthakker H Sdeg and L D Taylor Consumer Demand in the United States Analysis and Projections second and enlarged editionHarvard University Press Cambridge Massachusetts 1970
4 India Government of The Cabinet Secretariate The National SampleSurvey 18th Round February 1963-January 1964 No 142 Tables with notes on Consumer Expenditure 1968
5 The National SampleSurvey 17th Round September 1961-July 1962 No 162 Tables with notes on some Features of Land Holdings in Rural Areas 1969
b Leser C E V Forms of Engel Functions Econometrica Vol 31 No 4 October 1963 pp 694-703
7 Mellor John W and Uma J Lele Growth Linkages of the New Foodshygrain Technologies Occasional Paper 50 Department of Agriculshytural Economics Cornell University USAID-Employment and Income Distribution Project June 1971
8 National Council of Applied Economic Research All India Consumer Expenditure Survey Vol II New Delhi 1967
9 Prais S J and H S Houthakker The Analysis of Family BudgetsThe Syndics of the Cambridge University Press Cambridge England 1955
10 Sinha R P An Analysis of Food Expenditures in India Journalof Farm Economics Vol 48 No 1 February 1966 pp 113-123
FIGURE 2 DISTRIBUTION OF HOUSEHOLDS BY PER CAPITA MONTHLY TOTAL CONSUMER EXPENDITURE)NSS) 1963-64
14
u 12 0
S10-I0
0 o 08 C
06 L
U-
S04
02
10 20 30 40 50 60 70 80 90 100 110 12(
Per Capita Monthly Total Consumer Expenditure (Rupees)
Source Compiled from National Sample Survey No 142 The Cabinet Secretoriate Government of India 1963-64
FIGURE I DISTRIBUTION OF HOUSEHOLDS BY PER CAPITA MONTHLY TOTAL CONSUMER EXPENDITURE NCAER 1964-65
16
14
12 G) 40
o 10
0
9 08
U 06
04
02
10 20 30 40 50 60 70 80 90 100 Per Capita Monthly Total Consumer Expenditure (Rupees)
Source Compiled from National Council of Applied Economic Research All- India Consumer Expenditure Survey Volume II New Delhi
1967
27
Appendix 2
Classification of Comodities NCAER 1964-65
1 Food grains Cereals pulses
Cereals include rice wheat jowar maize bajra barley ragi small millets and their products
Pulses include tur mung moth gram urad peas and their products
2 Milk and Milk Productss Milk buttermilk ghee butter
3 Meat eggs and fish Details not specified in the source
4 Other foodss Vegetables fruits nuts spices salt beverages refreshments jams jelly pickles
5 Tobacco and allied
productss Bidi cigarettes chewing tobacco etc
6 Vanaspati Hydrogenated edible oil
7 Other edible oils Groundnut oil mustard oil
8 Sweeteners Sugar gur and chandsari
9 Cotton textiles Mll-made khadi and handloomed clothing including ready made garments
10 Woolen textiless Woolen clothing
11 Other textiless Silk rayon nylon clothing
12 Footwear Sandals shoes
L To estimate expenditure on other foods log-log-inverse function was estimated on NSS data taking other food expenditures as a function of total expenditure The estimated equation was then used to predictother food expenditure for NCAER From the predicted value of other food expenditures the expenditure on oils meat eggs and fish and sweetening agents as reported in NCAER was subtracted to arrive at expenditure on other foods as defined here This was done because the NSS classification of other foods included oils meat eggs and fish and sweeteners besides the items that are included in the classification of other foods defined here This procedure was followed because NCAER did not give separate data for the items included in other foods
28
13 Durable and Semi-durabless Furniture kitchen equipment sewing
wachines electric fanstransistor =adios radios bicycles motor cars etc
14 Conveyances Expenditure of transportation by bus taxi train aeroplane steamer boat motor car motorcycle scooters rickshyshaws bullock cart horse cart including conveyance charges incurred by children for going to school
15 Consumer Servicesamp Medical care litigation domestic work barbers washermen dry clearners carpenshyters blacksmiths priests plumbers gardeners gold and silversmiths and drivers
16 Educations Books journals newspapers periodicals stationery school fees private tutors fees
17 Fuel and lights Details not specified in the source
18 House rents Details not specified in the source
19 Miscellaneous Biscuits and confectionery intoxicants pan medicines toiletry sports and amusements sundry goods (details unshyspecified in the study) ceremonials and gifts
Consumption functions were estimated for items 1 to 18
Sources National Council of Applied Economic Research All-India Consumer Expenditure Survey Vol II New Delhi 1967
29
Appendix 3
Classification of CModities NSS 1963-64
1 Food grains Cereals pulses
Cereals include rice wheat jowarbara maize barley small millets ragi Bengal gram and their products
Pulses include tur gram moong masoor urad peas aiu wtuir produsts
2 Milk and Milk Products Liquid milk milk (condensed powdered) ghee butter dahi ghol lassi and other milk products
3 Other foods Oil oil seeds and productsvegetables fruits and nuts meat eggs and fish sugar salt spices beverages refreshshyments and processed food pickles jamsand jellies
4 Clothings Cotton (mill made hand-loomed and khadi) woolen silk rayon etc inshycluding bedding and upholstery
5 Fuel and lights Coke coal firewood electricity gas dungcake charcoal kerosene candle matches and other fuel and lighting oil
6 Rents Rents on residential house residential land and other consumer goods No imputation of rent for residential houses owned by the sample households was made
7 Taxess Consumer taxes like road Cess chewkidari taxes municipal rates consumer license fees and other local taxes Income tax or taxes relating to household enterprise are excluded
8 Other nonfood items Pan etc tobacco and products drugs and intoxicants amusements and sportseducation medicine toilets sundrygoods consumer services conveyanceceremonials furniture musical instrushyments ornaments domestic utensils footwear and other durable or semishy
30
durable goods and their repairing exshypense including the maintenance of residential houses
Consumption functions were estimated for item numbers 1 2 and 4
Sources The National Sample Survey No 142 The Cabinet Secretariate Government of India 1968
31
Appendix 4 Average propensity to expend (APE) and per capita expenditure(E) of food grains and milk and milk products by expenditure classes All-India 1963-64 and 1964-65
Expenditure Per classes amp capita NSS NCAER corresponding mo total Food Milk amp milk Food Milk amp milk land holding consumer orains roducts grains -products groups (Acres) expendi- APE E APE E APE E APE E
ture Rurees
Bottom 2 deciles-shyless than 049 893 063 561 002 022 054 483 002 019
3rd decile-- 1314 059 782 004 058 052 684 004 058 050-099
4 amp 5th deciles-- 1780 053 942 006 107 047 831 006 113 100-499
6 7 amp 8th deciles-- 2413 045 1080 007 180 040 958 008 194 500-999
9th decile-- 3071 038 1172 008 260 034 1045 009 279 1000-1499
Lower of 10th decile-- 4189 030 1271 009 395 027 1137 010 415 1500-2999
Upper j of 10th decile-- 8b84 017 1424 011 913 015 1280 010 858 3000+
Mean for all classes 2443 044 1083 008 184 039 960 008 198
Source Estimated from the functions fitted to data from NSS 1963-64 No 142 The Cabinet Secretariate Government of India 1968 and also from NCAER All-India Consumer Expenditure Suiveyp 1964-65 Vol II New Delhi 1967
----------------------------------------------------------- --------
32
Appendix 5 Average propensity to egpend (APE) and per capita expenditure (E) of food grains milk and milk products and clothing by expenditure classesp Rural and Urban India 1963-64
Expenditure classes amp Rural Urban corresponding Food Milk amp milk Clothing Food Milk amp milk Clothing land holding grains Droduc s grains Droducts aruos (Acres) APE E APE E APE E APE E APE E APE E
Bottom 2 deciles-shyless than 049 064 571 002 022 002 021 054 484 004 037 001 005
3rd decile-shy0b0-099 060 784 004 056 004 051 049 647 006 081 002 021
4 amp 5th deciles-shy100-499 054 956 006 104 005 096 042 757 008 136 003 052
6 7 amp 8th deciles-shy500-999 047 1131 007 176 007 174 035 847 009 213 004 106
9th decile-shy1000-1499 041 1271 008 2b3 009 271 029 904 010 294 006 171
Lower j of 10th decile-shylb00-2999 035 1452 009 388 011 467 023 959 010 428 007 290
Upper j of 10th decile-shy3000+ 022 1884 010 906 018 1540 012 1030 011 921 009 765
-Mean for all classes 047 1139 007 179 007 178 03b 850 009 217 004 109
Sources Estimated from the functions fitted to data from NSS 1963-64 No 142 The Cabinet Socretariate Government of India 1968
Appendix 6 Average propensity to expend (APE) on various expenditure categories by expenditure classesNCAER3 1964-65
Bottom 2 deciles
3rd decile
4th amp 5th deciles
6th 7th amp 8th
9th decile
Lower i of 10th
Upper of 10th
Aan for all classes
(less than 049 acres)
(050-099
ac es)
(100-499 acres)
deciles (500-999
acres)
(1000-1499
acres)
decile (1500-2999
acres)
decile (3000shyacres)
Per capita monthly consumer expenditure
893 1314 1780 2413 3071 4189 8584 2443 APE on
1 Food grains 054 052 047 040 034 027 015 0392 Milk amp milkproducts 002 004 006 008 009 0103 Meat eggs amp fish 001 010 008002 002 002 002 003 0034 Other foods 002013 010 009 009 009 009 0125 Tobacco 009002 002 002 002 0016 Vanaspati 0 0
001 001 002001 001 001 001 0017 Other oils 001002 003 003 003 003 0038 Sweetners 002 003002 003 003 003 003 003 0029 Cotton textiles 004005 006 007 007 007 006 00510 Woolen textiles 00700 0 001 011 Other textiles 0 4 4012 Footwear 0 001 00 0 0 001 00113 Durables amp semishydurables 0 4 0 001 001 002 003 00114 Conveyance 0 001 001 00115 Consumer services 002 002 005 001001 001 002 002 002 00316 Education 004 0020 001 001 001 002 002 00517 Fuel amp light 006 007 001007 006 006 00618 House rent 004 0060 6 0 001 001 002 004 00119 Miscellaneous
(approx) 009 007 008 011 015 018 021 011
Negligible a Estimated as a residualSource Estimated from the functions fitted to data from NCAER All-India Consumer Expenditure Survey1964-1965 Vol II New Delhi 1967
Appendix 7 Per capita monthly expenditure on various expenditure categories by expenditure classes NCAER 1964-65
Bottov 2 3zd 4th amp 5th 6th 7th 9th Lower f Upper I Iean for deciles decile deciles amp 8th decile of 10th of 10th all classes
deciles decile decile (less to (050- (100- (500- (1000- (1500- (3000+ 049 acres) 099 499 999 1499 2999 acres)
acresl acres) acres) gcres) acres)
Per caita monthly consumer exoenditure (Rs) - 893 1314 1780 2413 3071 4189 8584 2443
Monthly ger capita expenditure on
1 Food grains 483 684 831 958 1045 1137 1280 968 2 Milk amp milk
products 019 058 113 194 279 415 858 198 3 eat eggs amp fish 01) 022 036 056 016 108 220 057 4 Other foods 119 134 164 216 278 398 1016 219 5 Tobacco 019 025 032 039 047 059 100 040 6 Vanaspati 001 004 011 023 036 059 125 023 7 Other oils 014 034 056 081 102 128 184 082 8 5weetners 016 036 058 085 108 140 217 086 9 Cotton textiles 047 084 120 164 204 263 434 166
10 Woolen textiles 0 001 003 006 011 020 079 006 11 Other textiles 0 001 001 002 004 009 066 002 12 Footwear 0 006 010 015 021 030 059 016 13 Durables amp semishy
durables 007 011 017 027 040 068 245 028 14 Conveyance 004 009 016 030 049 094 412 030 15 Consumer services 011 019 030 048 068 109 319 048
16 Education 0t4 008 015 029 049 094 433 030 17 Fuel amp light 057 089 119 156 189 237 382 157
18 House rent 0 002 005 015 030 069 338 015 19 Miscellaneousm
(approx) 082 087 143 271 435 752 1817 272
oNegligible j Estimated as a residual Sources Estimated from the functions fitted to data from NCAER All-India Consumer Expenditure Survey 1964-65 Vol I1 New Delhi 1967

16
Section 3 NCAER Consumption Functions
This section being concerned with examining the allocation of an entire budget of a household on various commoditiesp the individuil commodity consumption functions should bi estimated subject to the budget constraint This approach would ensure that the sum of estimated exshypenditure on individual commodities would not exceed the total budget of a household Formally this additivity condition can be satisfied by the log-log inverse model if the following restrictions are used in the estimation procedures
19 1 0(I)
i=1
19(2)
i=1
where i stands for 1 bull 19 commodities
We have not used the above approach because the commodity category of Miscellaneous (see Appendix 2) included such heterogenous articles as biscuits and confectionery medicines toiletry and sundry goods-shythe details of which were not specified in the original study Thus equations for 18 expenditure categories were individually estimated without using the above two restrictions And the expenditure on the 19th commodity category viz miscellaneous was estimated as a residual
Estimated Eguations
Table 4 gives the estimated equations (including the alternative functional form) for 18 expenditure categories The plot of residuals for different equations except for other textiles footwear and house rent revealed a fair degree of randomness R2 for equations estimated for va5ious expenditure categories ranged between 717 and 979 Such high Rs were presumably due to use of grouped data However use of grouped data implies a loss of degrees of freedom which in turn reduces the (statistical) efficiency of the significance test for regression coefficients Coisidering this implication the number of and Y (in LLI function) that were significant at the specified probability level was reasonable Thus out of 18 each9 andy 8 and 13 respectively weri significant either at 1 or 5 or pershycent level Furthermore r of the variable associated with3 was less than one percent in only four out of 18 (LLI) equations These four equations are for tobacco conveyance consumer services and education This finding suggests that a double-log (DL) instead of LLI function would be a better fit for these four expenditure nateshygories Hence a DL function was fitted to these four categories of expenditure
rhe sign of 3 is consistent with a prior expectation for various expenditure categories Thus 3 is positive in seven out of 18 (LLI)
17
Table 4 The estimated equations for various expenditure categories NCAER 1964-65
Expenditure Functional Regressign Coefficients sect2 SSE Categories Form
a
1 Foodgrains LLI 2579 -9150 018 960 33207 (604) (4242) (131)
LI 2663 -9720 962 33240 (050) (1175)
2 Milk amp Milk Products LLI -024 -24518 595 945 125045
(1172) (8232) (254)
3 Meat Eggs amp Fish LLI -2379 -14246 749 850 227886
(1582) (11112) (343)
4 Other Foods LLI -4642 13122 lb29 971 55970 (784) (5507) (170)
Tobacco LLI -3295 166 741 802 94702 (1019) (7164) (221)
DL -3272 736 811 94704 (212) (061)
6 Vanaspati LLI -45939 754-412 263 909775
(3160) (22203) (685)
7 Other Oils LLI 381 -22971 112 945 38694 (652) (4579) (141)
8 Sweetners LLI -164 -20307 264 891 97936 (1037) (7285) (225)
9 Cotton Textiles LLI -10308-744 524 979 19510 (A63) (3251) (100)
10 Woolen Textiles LLI -21635 890-6752 1521 497655 (2337) (16422) (507)
11 Other Textiles LLI -15646 30405 3341 810 1043426 (3385) (23778) (734)
12 Footwear LLI -3351 -16127 675 810 293063 (1794) (12602) (389)
13 Consumer LLI -7761 8050 9121923 245330 Durables amp Semi- (1641) (11530) (356) durables
Table 4--Continued 9xpenditure Functional ReQression Coefficients -2 SSE
Categories Form a 0
14 Conveyance LLI -8320 3956 2180 933 416770 (2139) (15028) (464)
DL -7770 2063 910 418145 (445) (129)
15 Consumer Services LLI -6052P 3905 1613 923 178207
(1399) (9827) (303) DL -5509 1497 926 179547
(291) (084)
16 Education LLI -8043 0409 2135 941 268895 (1718) (12071) (373)
DL -7986 2123 944 268909 (357) (103)
17 Fuel amp Light LLI -1046N -6552E 553 976 18586 (451) (3173) (098)
18 House Rent LLI -5213 -39198 1547 717 2804972 (5549) (38987) (1203)
Figures in parentheses are standard errors Significant at 1 percent
Significant at 5 percent Significant at 10 percent
equations These seven equations are for other foods (which include fruits nuts vegetables etc) tobacco other textiles durables conveyance consumer services and education Each of these expendshyture categories can be broadly termed as luxury items The expendishyture elasticity of these seven categories would therefore increase as per capita total consumer expenditure increases The exceptions to this would be tobacco and education the expenditure elasticity for which would remain constant even for LLI function This is because the size of in the (LLI) equations for these two items is less than one
Finally the r2 of the variable associated with ^ywas less than one percent in only one (ie food grains) out of 18 (LLI) equations In this one case therefore log-inverse (LI) function was fitted
19
Estimated Expenditure Elasticity and Marginal Propensity to Expend
Using the above equationsgand the per capita total consumerexpenditure of the seven expenditure (and corresponding land holding)classes (as given in Table 1) expenditure elasticity (71)and PAEof the 18 expenditure categories were computed Tables 5 and 6 givethe results Appendices 6 and 7 give the estimated average propensityto expend (APE) and per capita expenditure (E)on the 18 items
Table 5 shows that the expenditure elasticity of all the 18expenditure categories except that of tobacco education conveyanceand consumer services varied from one expenditure group to the otherFurther the expenditure elasticity of other foods other textiles anddurables increased as per capita total consumer expenditure increased
Table 6 on MPE of 18 expenditure categories shows that the MPEalso varied from one class to the other for all categories excepttobacco footwear woolen textiles and other textiles Althoughhowever the MPE for other categories varied the variation was notcontinuous in all categories Thus the MPE on milk and milk productsmeat eggs and fish vanaspati and to an extent durables conveyanceand consumer services remained constant in some (though not in all)particularly in fourth through ninth expenditure deciles
Estimated Pittern of Additional Demand
In the context of increasing incomes in rural areas examinationof marginal propensity to expend on various commodities is relevant tojudge the pattern of additional demand We have below obtained thesum of the marginal propensity to expend on each item that comprise thethree broad groups of expenditure categories for the seven expendishyture and corresponding land holding classess
Expenditure Corresponding Marginal Propensity to expend onclasses land holding Food Non-food Non-agri- MLscshygroups grains grain agr - culturalk ellashy
colturallS_ neous-Deciles Acres Rupees
Bottom 2 less than 049 059 020 021 shy3rd 050-099 038 031 022 0094th amp 5th 100-499 025 034 022 0196th 7th amp 8th 500-999 016 036 026 0229th 1000-1499 011 035 027 027Lower of 10th 1500-2999 006 034 032 028Upper t of 10th 3000+ 002 031 051 016
bgItems 2 through 8 in Table 6 Items 9 through 18 in Table 6
LIEstimated as a residual We have used LI equation for food grains DL equation for tobaccoeducation conveyance and consumer services and LLIequation for theremaining expenditure categories in computing 1 WE APE and E
8
Table 5 Expenditure elasticities f various expenditure categories by expenditure classes NCAER 1964-65
Bottom 2 3rd 4th amp 5th 6th 7th 9th Lower f Upper Mean for deciles decile deciles amp 8th decile of 10th of 10th all classes
deciles decie decile
(less than (050- (100- (500- (1000- (1500- (3000+ 049 acres) 099 499 999 1499 2999 acres)
acles) acres) acres) acres) acres)
Per capita monthly consumer expenditure (Rs) 893 1314 1780 2413 3071 4189 8584 2443
Eg2enditure elasticities of
1 Food grains 104 071 053 040 031 024 012 039 2 Milk amp milk
products 334 246 197 161 139 118 088 160 3 Meat eggs amp fish 234 183 155 134 121 109 091 133 4 Other foods 006 U-53 079 098 110 122 138 099 5 Tobacco 074 074 074 074 074 074 074 074 6 Vanaspati 541 376 284 217 176 136 080 214 7 Other oils 268 1E6 140 106 086 066 038 105 8 Sweetners 254 1E1 140 111 092 075 050 110 9 Cotton textiles 168 131 110 095 086 077 064 095
10 Woolen textiles 394 317 274 242 222 204 177 241
11 Other textiles 0 103 163 208 235 261 299 210
12 Footwear 248 190 158 134 120 106 086 134
13 Durables amp semishydurables 102 131 147 159 166 173 183 159
14 Conveyance 15 Consumer services
206 150
206 150
206 150
206 150
206 150
206 150
206 150
206 150
16 Education 212 212 212 212 212 212 212 212
17 Fuel amp light 18 House rent
129 594
105 453
u92 375
082 317
077 282
071 248
063 200
082 315
Negligible
Estimated from the functions fitted to data from NCAER All-India Consumer Expenditure SurveySource 1964-65 Vol II New Delhi 1967
Table 6 Marginal propensity to expend (APE) on various expenditure categories by expenditure classesAAER 196465
Bottom 2 3rd 4th amp 5th 6th 7th 9th Lower Upper f Mean forueciles decile deciles amp 8th decile of 10th of 10th all classes deciles decilc decile(less hap (050- (100- (500- (1000- (1500- (3000+
049 atres) 099 499 999 1499 2999 acres)acres) acres) acres) acres) acres)
Per capita monthly consumer exenditure (Rs) 893 1314 1780 2413 3071 4189 8584 2443
MPE on
Sources
1 Food grains 059 038 025 016 011 006 002 015 2 Milk amp milk
products 3 Meat eggs amp fish 4 Other foods 5 Tobacco 6 Vanaspati 7 Other oils 8 Sweetners 9 Cotton textiles
10 Woolen textiles 11 Other textiles 12 Footwear
007 002 001 001
005 004 009 0 0 0
011 003 OC5 001 001 005 005 008 0 0 001
012 003 007 001 002 004 005 007 P 0 001
013 003 009 001 002 004 004 006 001 001 001
013 003 010 001 002 003 003 006 001 0
001
012 003 012 001 002 002 002 005 001
001
009 002 016 001 001 001 001 003 002 002 001
013 003 009 001 002 004 004 006 001 0 001
13 Durables amp semishydurables
14 Conveyance 15 Consumer services 16 Education 17 Fuel amp light
001 00 002 001 007
001 001 002 001 007
001 002 002 002 006
002 002 003 003 005
002 003 003 003 005
003 005 004 005 004
005 010 006 011 003
002 003 003 C03 005
18 House rent 19 Miscellaneous
(approx)
- 001
009
001
019
002
022
003
027
004
028 008
016 002
023
Negligible
amp Estimated as a residual Estimated from the functions fitted to data from NCAER All-India Consumer Expenditure Survey1964-65 Vol II New Delhi 1967
22
It can be seen from the above that the marginal propensity to expend on food grains is the highest in the bottom two deciles which are largelycomposed of landless labor households Even the third decile which is comprised of smaller farms would spend 38 perat of their incremental expenditure on food grains Thus quite ironically it is the poor whowould support through his demand for food grains the green revolution Such a support however would require public policy of generatingemployment and income of the poor This policy is particularly reshyquired because this group of people have benefitted directly the least from the green revolution
The rapid decline in AIE on food grains implies that the marginalpropensity to market food grains would increase as we move along the expenditure deciles and the corresponding landholding groups
The WE on nonfood grain agricultural commodities first increased and then gradually declined along the expenditure classes MAre importantly the WE on milk and milk products is relatively high in the 6th through 9th deciles which are comprised of farmers with 5 to 15 acres This is a very happy outcome because expansion of liveshystock enterprises which are at present in rural areas characterized by labor-intensive technology provides the scope for meeting the need of generating employment Credit and marketing facilities wouldhowever be most required for the expansion of livestock enterprise
Furthermore the MPE on other foods (which include fruits andvegetables besides other items) increases rapidly as per capita total consumer expenditure increases Again production of these productsparticularly fruits and vegetables entail labor-intensive techniques
Along the expenditure scale the MPE on nonagricultural commodities increases only in the upper half of the expenditure distribution Onlythe upper half of the 10th decile would spend over 50 percent of its incremental expenditure on nonagricultural items Among the various nonagricultural items the WE for cotton textiles and fuel and lightdeclines along the expenditure scale Against this the correspondingfigures for woolen textiles and footwear remains constant But for durables consumer services education conveyances and house rent it shows a tendency to increase
It should be recognized that the above analysis of WVE on different nonagricultural items has remained incomplete due to lack of details onmiscellaneous category which accounted for more than 10 percent of the incremental expenditure in all but the bottom three deciles The analysis has also suffered due to the outdated nature of the data studied Finally inasmuch as the assumption of all-India consumption pattern being applicable to rural households is not valid the above results show perhaps an underestimation of the incremental demand for food grains and an overest4mation of change in demand for other commodities
CHAPTER V
CONCLUSIONS
The main conclusions aret (1) The expenditure elasticity of foodgrainsp and milk and milk products varied from one expenditure class tothe other in both NSS and NCAER data However in these two datasources the marginal propensity to expend on milk and milk products reshymained almost constant over all expenditure classes beyond the bottomthree deciles (2) The above finding is also appl- able to rural andurban NSS consumption functions (3) The rural conkumption functionswere different irom the urban consumption functions for the threecommodities viz food grains milk and milk products and clothingstudied (4) In NCAER data except for tobacco education conveyanceand consumer services the expenditure elasticity of all other expenditurecategories (food grains milk and milk products meat eggs and fishother foods vanaspati other oils sweetners cotton textiles woolentextiles other textiles footwear durables fuel and light and houserent) varied in different expenditure classes (5) But the variationin marginal propensity to expend on all the items from one expenditureclass to the other was not continuous (6) The bottom three decileswhich comprised landless and smaller farm households would provide themaximum boost to the development of the food grains sector whereas theremaining deciles would provide the maximum market for nonfood grainagricultural goods But the additional demand for nontraditionalnonagricultural items would mainly come from the top decile in rural India
24
References
1 Goreux L M Income and Food Consumption Monthly Bulletin of Agricultural Economics and Statistics Vol IX No 10 October 1960 pp 1-13
2 Griliches Zvi Specification Bias in Estimates of Production Functions Journal of Farm Economics Vol 34 No 1 February 1957 pp 8-20
3 Houthakker H Sdeg and L D Taylor Consumer Demand in the United States Analysis and Projections second and enlarged editionHarvard University Press Cambridge Massachusetts 1970
4 India Government of The Cabinet Secretariate The National SampleSurvey 18th Round February 1963-January 1964 No 142 Tables with notes on Consumer Expenditure 1968
5 The National SampleSurvey 17th Round September 1961-July 1962 No 162 Tables with notes on some Features of Land Holdings in Rural Areas 1969
b Leser C E V Forms of Engel Functions Econometrica Vol 31 No 4 October 1963 pp 694-703
7 Mellor John W and Uma J Lele Growth Linkages of the New Foodshygrain Technologies Occasional Paper 50 Department of Agriculshytural Economics Cornell University USAID-Employment and Income Distribution Project June 1971
8 National Council of Applied Economic Research All India Consumer Expenditure Survey Vol II New Delhi 1967
9 Prais S J and H S Houthakker The Analysis of Family BudgetsThe Syndics of the Cambridge University Press Cambridge England 1955
10 Sinha R P An Analysis of Food Expenditures in India Journalof Farm Economics Vol 48 No 1 February 1966 pp 113-123
FIGURE 2 DISTRIBUTION OF HOUSEHOLDS BY PER CAPITA MONTHLY TOTAL CONSUMER EXPENDITURE)NSS) 1963-64
14
u 12 0
S10-I0
0 o 08 C
06 L
U-
S04
02
10 20 30 40 50 60 70 80 90 100 110 12(
Per Capita Monthly Total Consumer Expenditure (Rupees)
Source Compiled from National Sample Survey No 142 The Cabinet Secretoriate Government of India 1963-64
FIGURE I DISTRIBUTION OF HOUSEHOLDS BY PER CAPITA MONTHLY TOTAL CONSUMER EXPENDITURE NCAER 1964-65
16
14
12 G) 40
o 10
0
9 08
U 06
04
02
10 20 30 40 50 60 70 80 90 100 Per Capita Monthly Total Consumer Expenditure (Rupees)
Source Compiled from National Council of Applied Economic Research All- India Consumer Expenditure Survey Volume II New Delhi
1967
27
Appendix 2
Classification of Comodities NCAER 1964-65
1 Food grains Cereals pulses
Cereals include rice wheat jowar maize bajra barley ragi small millets and their products
Pulses include tur mung moth gram urad peas and their products
2 Milk and Milk Productss Milk buttermilk ghee butter
3 Meat eggs and fish Details not specified in the source
4 Other foodss Vegetables fruits nuts spices salt beverages refreshments jams jelly pickles
5 Tobacco and allied
productss Bidi cigarettes chewing tobacco etc
6 Vanaspati Hydrogenated edible oil
7 Other edible oils Groundnut oil mustard oil
8 Sweeteners Sugar gur and chandsari
9 Cotton textiles Mll-made khadi and handloomed clothing including ready made garments
10 Woolen textiless Woolen clothing
11 Other textiless Silk rayon nylon clothing
12 Footwear Sandals shoes
L To estimate expenditure on other foods log-log-inverse function was estimated on NSS data taking other food expenditures as a function of total expenditure The estimated equation was then used to predictother food expenditure for NCAER From the predicted value of other food expenditures the expenditure on oils meat eggs and fish and sweetening agents as reported in NCAER was subtracted to arrive at expenditure on other foods as defined here This was done because the NSS classification of other foods included oils meat eggs and fish and sweeteners besides the items that are included in the classification of other foods defined here This procedure was followed because NCAER did not give separate data for the items included in other foods
28
13 Durable and Semi-durabless Furniture kitchen equipment sewing
wachines electric fanstransistor =adios radios bicycles motor cars etc
14 Conveyances Expenditure of transportation by bus taxi train aeroplane steamer boat motor car motorcycle scooters rickshyshaws bullock cart horse cart including conveyance charges incurred by children for going to school
15 Consumer Servicesamp Medical care litigation domestic work barbers washermen dry clearners carpenshyters blacksmiths priests plumbers gardeners gold and silversmiths and drivers
16 Educations Books journals newspapers periodicals stationery school fees private tutors fees
17 Fuel and lights Details not specified in the source
18 House rents Details not specified in the source
19 Miscellaneous Biscuits and confectionery intoxicants pan medicines toiletry sports and amusements sundry goods (details unshyspecified in the study) ceremonials and gifts
Consumption functions were estimated for items 1 to 18
Sources National Council of Applied Economic Research All-India Consumer Expenditure Survey Vol II New Delhi 1967
29
Appendix 3
Classification of CModities NSS 1963-64
1 Food grains Cereals pulses
Cereals include rice wheat jowarbara maize barley small millets ragi Bengal gram and their products
Pulses include tur gram moong masoor urad peas aiu wtuir produsts
2 Milk and Milk Products Liquid milk milk (condensed powdered) ghee butter dahi ghol lassi and other milk products
3 Other foods Oil oil seeds and productsvegetables fruits and nuts meat eggs and fish sugar salt spices beverages refreshshyments and processed food pickles jamsand jellies
4 Clothings Cotton (mill made hand-loomed and khadi) woolen silk rayon etc inshycluding bedding and upholstery
5 Fuel and lights Coke coal firewood electricity gas dungcake charcoal kerosene candle matches and other fuel and lighting oil
6 Rents Rents on residential house residential land and other consumer goods No imputation of rent for residential houses owned by the sample households was made
7 Taxess Consumer taxes like road Cess chewkidari taxes municipal rates consumer license fees and other local taxes Income tax or taxes relating to household enterprise are excluded
8 Other nonfood items Pan etc tobacco and products drugs and intoxicants amusements and sportseducation medicine toilets sundrygoods consumer services conveyanceceremonials furniture musical instrushyments ornaments domestic utensils footwear and other durable or semishy
30
durable goods and their repairing exshypense including the maintenance of residential houses
Consumption functions were estimated for item numbers 1 2 and 4
Sources The National Sample Survey No 142 The Cabinet Secretariate Government of India 1968
31
Appendix 4 Average propensity to expend (APE) and per capita expenditure(E) of food grains and milk and milk products by expenditure classes All-India 1963-64 and 1964-65
Expenditure Per classes amp capita NSS NCAER corresponding mo total Food Milk amp milk Food Milk amp milk land holding consumer orains roducts grains -products groups (Acres) expendi- APE E APE E APE E APE E
ture Rurees
Bottom 2 deciles-shyless than 049 893 063 561 002 022 054 483 002 019
3rd decile-- 1314 059 782 004 058 052 684 004 058 050-099
4 amp 5th deciles-- 1780 053 942 006 107 047 831 006 113 100-499
6 7 amp 8th deciles-- 2413 045 1080 007 180 040 958 008 194 500-999
9th decile-- 3071 038 1172 008 260 034 1045 009 279 1000-1499
Lower of 10th decile-- 4189 030 1271 009 395 027 1137 010 415 1500-2999
Upper j of 10th decile-- 8b84 017 1424 011 913 015 1280 010 858 3000+
Mean for all classes 2443 044 1083 008 184 039 960 008 198
Source Estimated from the functions fitted to data from NSS 1963-64 No 142 The Cabinet Secretariate Government of India 1968 and also from NCAER All-India Consumer Expenditure Suiveyp 1964-65 Vol II New Delhi 1967
----------------------------------------------------------- --------
32
Appendix 5 Average propensity to egpend (APE) and per capita expenditure (E) of food grains milk and milk products and clothing by expenditure classesp Rural and Urban India 1963-64
Expenditure classes amp Rural Urban corresponding Food Milk amp milk Clothing Food Milk amp milk Clothing land holding grains Droduc s grains Droducts aruos (Acres) APE E APE E APE E APE E APE E APE E
Bottom 2 deciles-shyless than 049 064 571 002 022 002 021 054 484 004 037 001 005
3rd decile-shy0b0-099 060 784 004 056 004 051 049 647 006 081 002 021
4 amp 5th deciles-shy100-499 054 956 006 104 005 096 042 757 008 136 003 052
6 7 amp 8th deciles-shy500-999 047 1131 007 176 007 174 035 847 009 213 004 106
9th decile-shy1000-1499 041 1271 008 2b3 009 271 029 904 010 294 006 171
Lower j of 10th decile-shylb00-2999 035 1452 009 388 011 467 023 959 010 428 007 290
Upper j of 10th decile-shy3000+ 022 1884 010 906 018 1540 012 1030 011 921 009 765
-Mean for all classes 047 1139 007 179 007 178 03b 850 009 217 004 109
Sources Estimated from the functions fitted to data from NSS 1963-64 No 142 The Cabinet Socretariate Government of India 1968
Appendix 6 Average propensity to expend (APE) on various expenditure categories by expenditure classesNCAER3 1964-65
Bottom 2 deciles
3rd decile
4th amp 5th deciles
6th 7th amp 8th
9th decile
Lower i of 10th
Upper of 10th
Aan for all classes
(less than 049 acres)
(050-099
ac es)
(100-499 acres)
deciles (500-999
acres)
(1000-1499
acres)
decile (1500-2999
acres)
decile (3000shyacres)
Per capita monthly consumer expenditure
893 1314 1780 2413 3071 4189 8584 2443 APE on
1 Food grains 054 052 047 040 034 027 015 0392 Milk amp milkproducts 002 004 006 008 009 0103 Meat eggs amp fish 001 010 008002 002 002 002 003 0034 Other foods 002013 010 009 009 009 009 0125 Tobacco 009002 002 002 002 0016 Vanaspati 0 0
001 001 002001 001 001 001 0017 Other oils 001002 003 003 003 003 0038 Sweetners 002 003002 003 003 003 003 003 0029 Cotton textiles 004005 006 007 007 007 006 00510 Woolen textiles 00700 0 001 011 Other textiles 0 4 4012 Footwear 0 001 00 0 0 001 00113 Durables amp semishydurables 0 4 0 001 001 002 003 00114 Conveyance 0 001 001 00115 Consumer services 002 002 005 001001 001 002 002 002 00316 Education 004 0020 001 001 001 002 002 00517 Fuel amp light 006 007 001007 006 006 00618 House rent 004 0060 6 0 001 001 002 004 00119 Miscellaneous
(approx) 009 007 008 011 015 018 021 011
Negligible a Estimated as a residualSource Estimated from the functions fitted to data from NCAER All-India Consumer Expenditure Survey1964-1965 Vol II New Delhi 1967
Appendix 7 Per capita monthly expenditure on various expenditure categories by expenditure classes NCAER 1964-65
Bottov 2 3zd 4th amp 5th 6th 7th 9th Lower f Upper I Iean for deciles decile deciles amp 8th decile of 10th of 10th all classes
deciles decile decile (less to (050- (100- (500- (1000- (1500- (3000+ 049 acres) 099 499 999 1499 2999 acres)
acresl acres) acres) gcres) acres)
Per caita monthly consumer exoenditure (Rs) - 893 1314 1780 2413 3071 4189 8584 2443
Monthly ger capita expenditure on
1 Food grains 483 684 831 958 1045 1137 1280 968 2 Milk amp milk
products 019 058 113 194 279 415 858 198 3 eat eggs amp fish 01) 022 036 056 016 108 220 057 4 Other foods 119 134 164 216 278 398 1016 219 5 Tobacco 019 025 032 039 047 059 100 040 6 Vanaspati 001 004 011 023 036 059 125 023 7 Other oils 014 034 056 081 102 128 184 082 8 5weetners 016 036 058 085 108 140 217 086 9 Cotton textiles 047 084 120 164 204 263 434 166
10 Woolen textiles 0 001 003 006 011 020 079 006 11 Other textiles 0 001 001 002 004 009 066 002 12 Footwear 0 006 010 015 021 030 059 016 13 Durables amp semishy
durables 007 011 017 027 040 068 245 028 14 Conveyance 004 009 016 030 049 094 412 030 15 Consumer services 011 019 030 048 068 109 319 048
16 Education 0t4 008 015 029 049 094 433 030 17 Fuel amp light 057 089 119 156 189 237 382 157
18 House rent 0 002 005 015 030 069 338 015 19 Miscellaneousm
(approx) 082 087 143 271 435 752 1817 272
oNegligible j Estimated as a residual Sources Estimated from the functions fitted to data from NCAER All-India Consumer Expenditure Survey 1964-65 Vol I1 New Delhi 1967
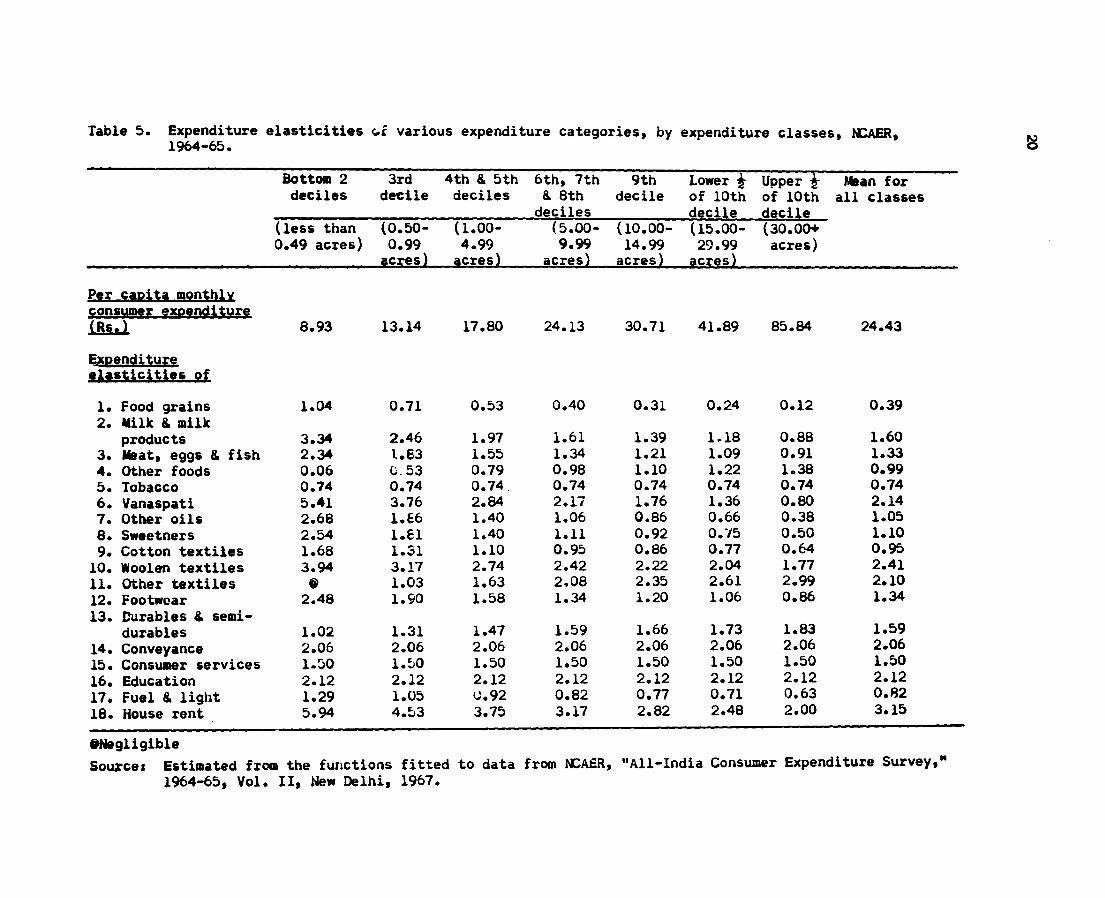
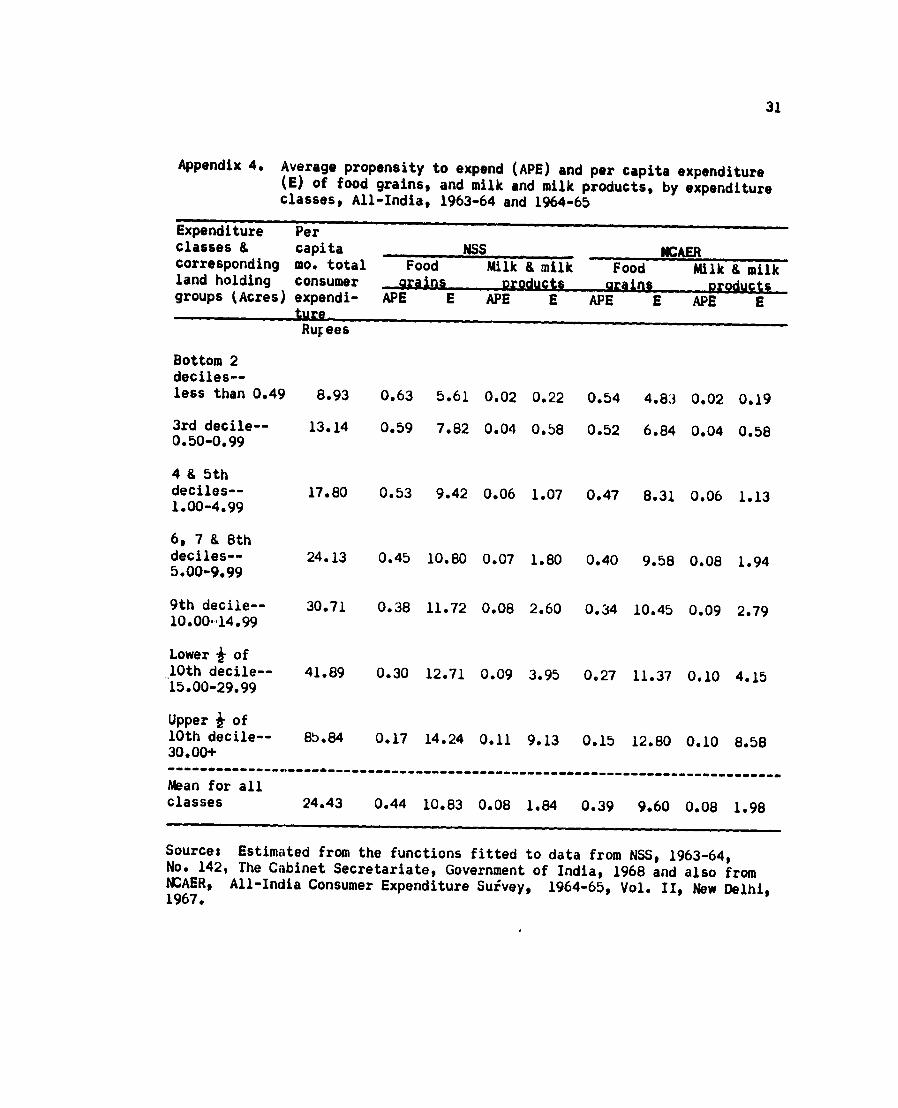