Embed Size (px)
Citation preview
1
Online Tests – Quiz Reports Create a Quiz Report After your students' have completed a quiz, you can create a Quiz Report. You can view a number of different report types and export quiz reports to CSV or Excel file. To create a quiz report: Step 1 - Go to Assessment – Quizzes
Step 2 - On the Manage Quizzes page, click to Edit the quiz from which you want a report.
2
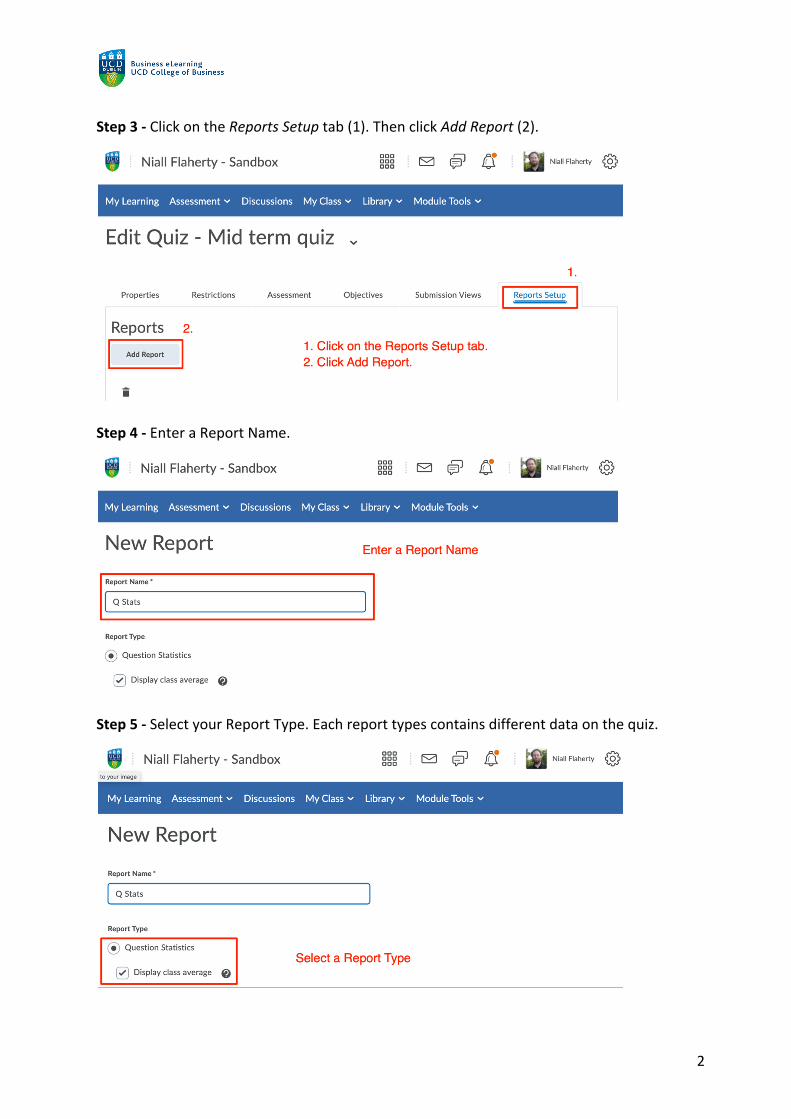
Step 3 - Click on the Reports Setup tab (1). Then click Add Report (2).
Step 4 - Enter a Report Name.
Step 5 - Select your Report Type. Each report types contains different data on the quiz.
3
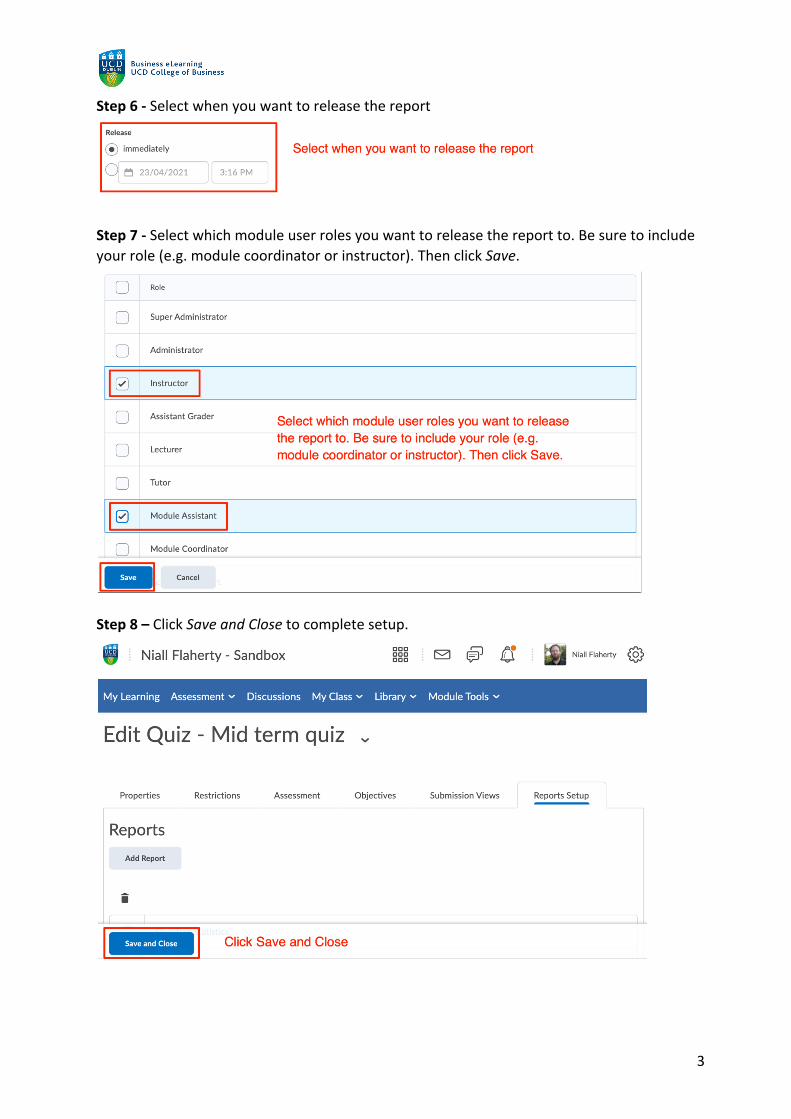
Step 6 - Select when you want to release the report
Step 7 - Select which module user roles you want to release the report to. Be sure to include your role (e.g. module coordinator or instructor). Then click Save.
Step 8 – Click Save and Close to complete setup.
4
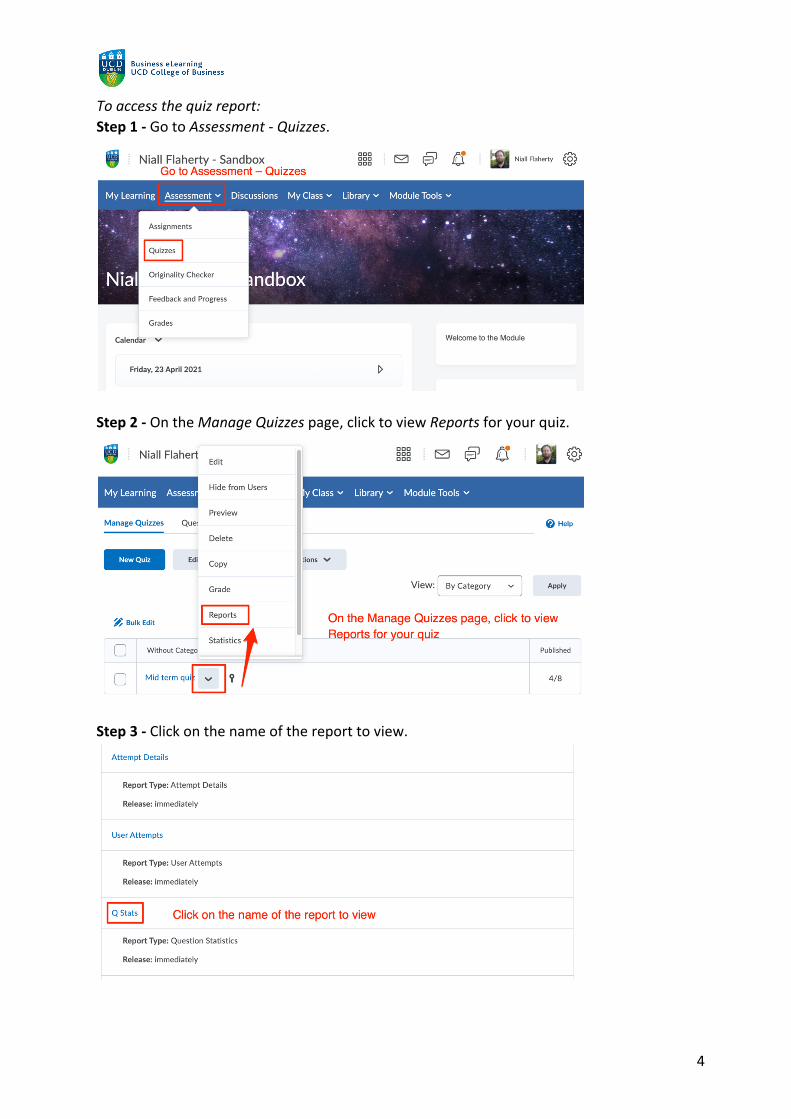
To access the quiz report: Step 1 - Go to Assessment - Quizzes.
Step 2 - On the Manage Quizzes page, click to view Reports for your quiz.
Step 3 - Click on the name of the report to view.
5
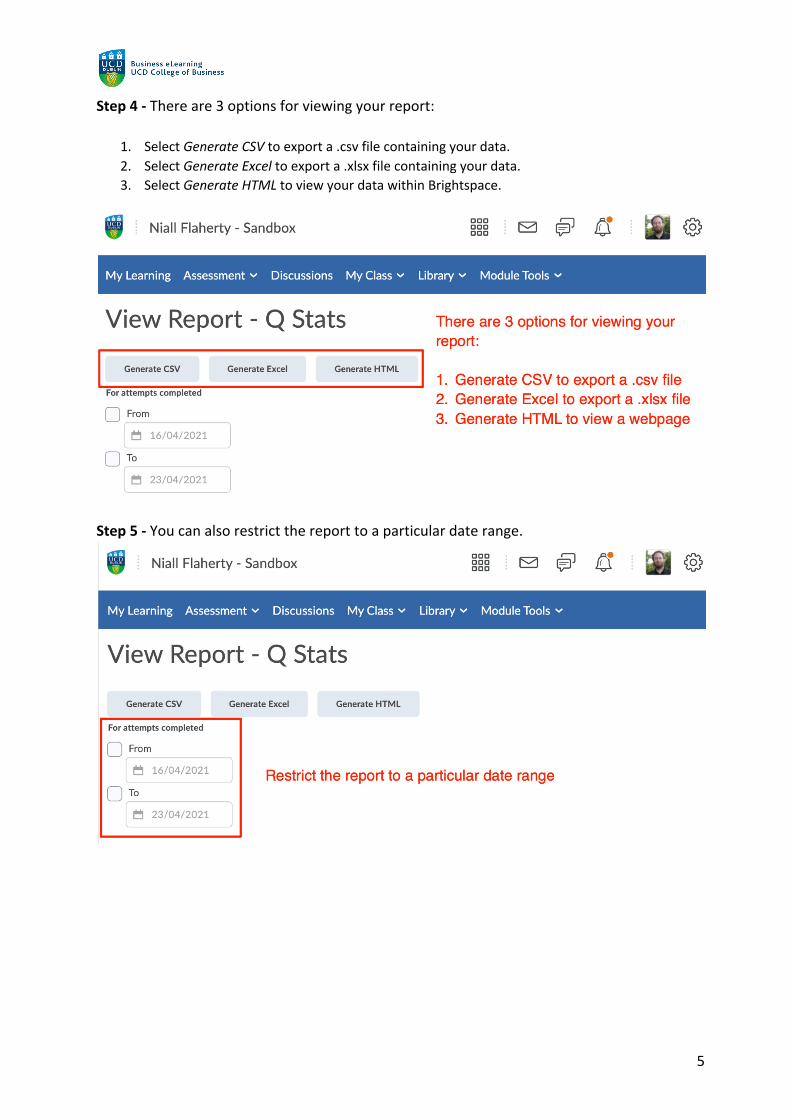
Step 4 - There are 3 options for viewing your report:
1. Select Generate CSV to export a .csv file containing your data. 2. Select Generate Excel to export a .xlsx file containing your data. 3. Select Generate HTML to view your data within Brightspace.
Step 5 - You can also restrict the report to a particular date range.
6
There are 5 quiz report types available. They are:
1. Question Statistics 2. Question Details 3. User Statistics 4. Attempt Details and 5. User Attempts
Question Statistics The Question Statistics report allows you to view the average score on questions by points and percentage. You can choose to include or exclude the class average, score distribution, bonus questions, the Out Of value, standard deviation, point biserial, and the discrimination index. Question Details The Question Details report allows you to view all of the answers provided for each quiz attempt, how many users chose each possible answer, the total number of responses, and the average score on each question. You can choose to include or exclude the level of difficulty, text responses, bonus questions, private comments added to the report, standard deviation, point biserial, and discrimination index. User Statistics The User Statistics report allows you to view the class average and standard deviation, score distribution, and the grade of each user. You can choose to include or exclude the class average, score distribution, and Org Defined ID. Attempt Details The Attempt Details report allows you to view the Org Defined ID, username, first name, and last name of each user. Detailed information about each question. The users’ responses for each question organised by attempt, including how long each attempt took. You can choose to include or exclude the Org Defined ID and attempt duration. User Attempts The User Attempts report allows you to view the Org Defined ID, username, first name, and last name of each user. The users’ score for each question in points and percentage organised by attempt, including how long each attempt took. You can choose to include or exclude the Org Defined ID and attempt duration. Note: These reports can tell you the degree to which each question was typical of the other questions in the quiz, and how the question deviated in difficulty for your students. Use these reports to identify questions that are outliers in a quiz, more difficult than expected, or require more instruction.