Embed Size (px)
Citation preview
S1
Online Supplemental Data
Glucagon-Secreting Alpha Cell Selective Two-Photon Fluorescent
Probe TP-: For Live Pancreatic Islet Imaging
Bikram Keshari Agrawalla,† Yogeswari Chandran,‡ Wut Hmone Phue,† Sung-Chan Lee,‡ Yun-Mi Jeong,‡
Si Yan Diana Wan,‡ Nam-Young Kang,,‡ and Young-Tae Chang*,†,‡
† Department of Chemistry & Medicinal Chemistry Program of Life Sciences Institute, National
University of Singapore, Singapore 117543, Singapore ‡Laboratory of Bio-imaging Probe Development, Singapore Bio-imaging Consortium, Agency of Science,
Technology and Research, Singapore 138667, Singapore
Corresponding Authors
S2
Table of Contents
Figure S1. Screening format and overview with hit confirmation.
Figure S2. Chemical structure and optical property of TP- and GY
Figure S3. Cell viability study
Figure S4. One-photon and two-photon live islet imaging
Figure S5. TP- excitation spectral profiles
Figure S6. TP-emission spectral profiles
Figure S7. Flow cytometry for TP- stained and control islet cells
Figure S8. Flow cytometry for TP- staining in Intact and dissociated condition
Figure S9. Dual staining of TP- with GABAA receptor or Insulin Antibody.
Figure S10. Binding curve of TP- and Glucagon
Video S1. Two-photon 3D projection video of TP- stained islet
Scheme S1. Synthesis of TPG acid intermediate
Scheme S2. Solid phase synthesis of TPG library compounds
Table S1. Amine building blocks for TPG library synthesis
Table S2. Spectroscopic properties and purity table for TPG library
S3
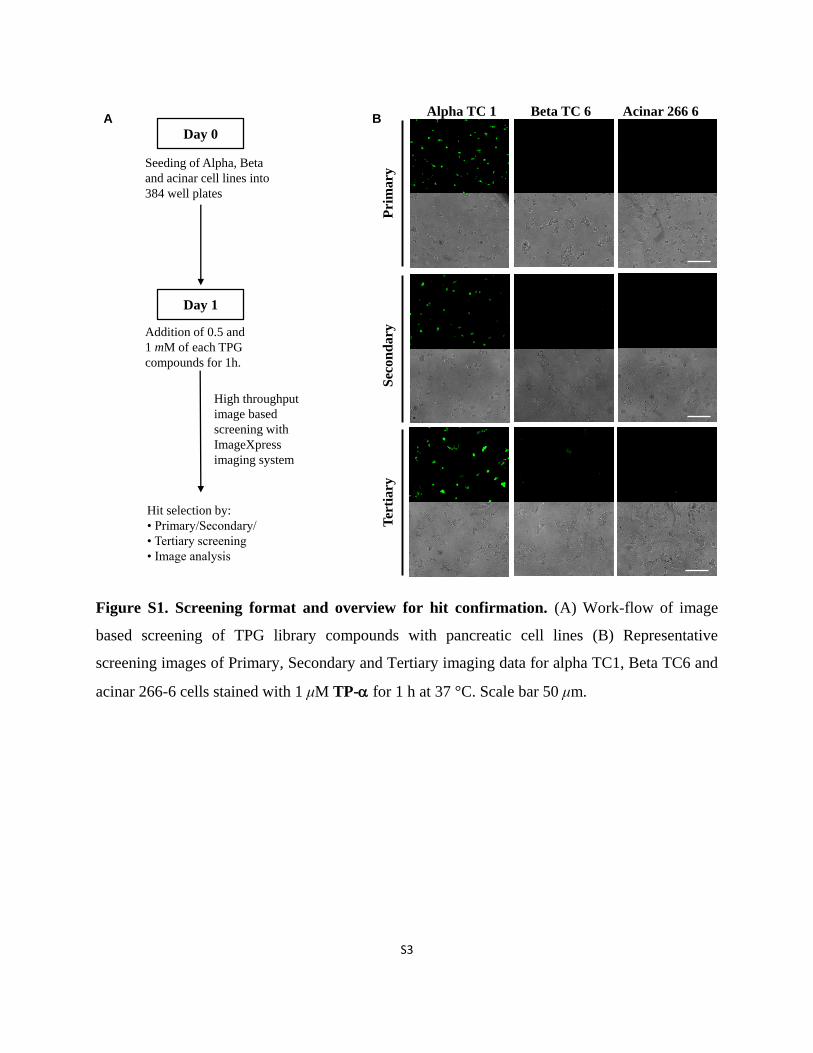
Figure S1. Screening format and overview for hit confirmation. (A) Work-flow of image
based screening of TPG library compounds with pancreatic cell lines (B) Representative
screening images of Primary, Secondary and Tertiary imaging data for alpha TC1, Beta TC6 and
acinar 266-6 cells stained with 1 μM TP- for 1 h at 37 °C. Scale bar 50 μm.
Day 0
Day 1
Seeding of Alpha, Beta
and acinar cell lines into
384 well plates
Addition of 0.5 and
1 mM of each TPG
compounds for 1h.
High throughput
image based
screening with
ImageXpress
imaging system
Hit selection by:
• Primary/Secondary/
• Tertiary screening
• Image analysis
A
Pri
mary
Sec
on
dary
Ter
tiary
Alpha TC 1 Acinar 266 6 Beta TC 6 B
S4
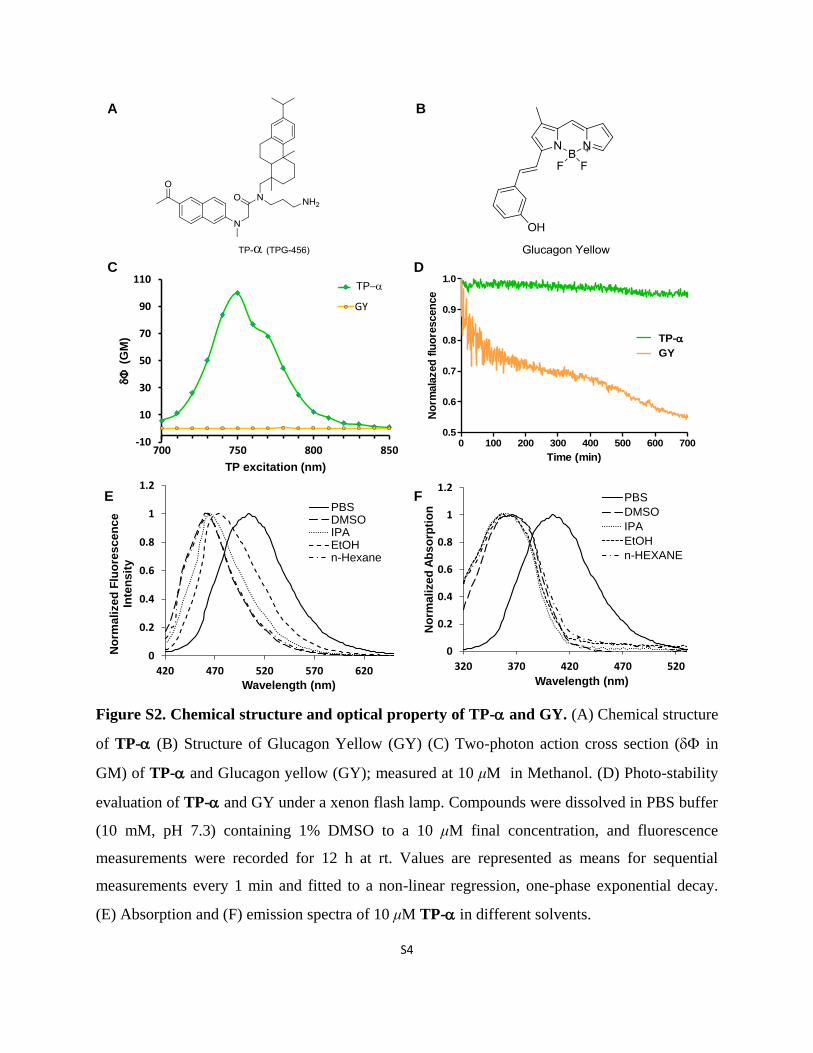
Figure S2. Chemical structure and optical property of TP- and GY. (A) Chemical structure
of TP- (B) Structure of Glucagon Yellow (GY) (C) Two-photon action cross section ( in
GM) of TP- and Glucagon yellow (GY); measured at 10 μM in Methanol. (D) Photo-stability
evaluation of TP- and GY under a xenon flash lamp. Compounds were dissolved in PBS buffer
(10 mM, pH 7.3) containing 1% DMSO to a 10 μM final concentration, and fluorescence
measurements were recorded for 12 h at rt. Values are represented as means for sequential
measurements every 1 min and fitted to a non-linear regression, one-phase exponential decay.
(E) Absorption and (F) emission spectra of 10 μM TP- in different solvents.
A B
0 100 200 300 400 500 600 7000.5
0.6
0.7
0.8
0.9
1.0
TP-
GY
Time (min)
No
rmala
zed
flu
ore
scen
ce
-10
10
30
50
70
90
110
700 750 800 850
(GM
)
TP excitation (nm)
TP-a
GY
C D
TP-
E
0
0.2
0.4
0.6
0.8
1
1.2
320 370 420 470 520
No
rma
lize
d A
bs
orp
tio
n
Wavelength (nm)
PBS
DMSO
IPA
EtOH
n-HEXANE
0
0.2
0.4
0.6
0.8
1
1.2
420 470 520 570 620
No
rma
lize
d F
luo
res
ce
nc
e
Inte
ns
ity
Wavelength (nm)
PBSDMSOIPAEtOHn-Hexane
F
S5
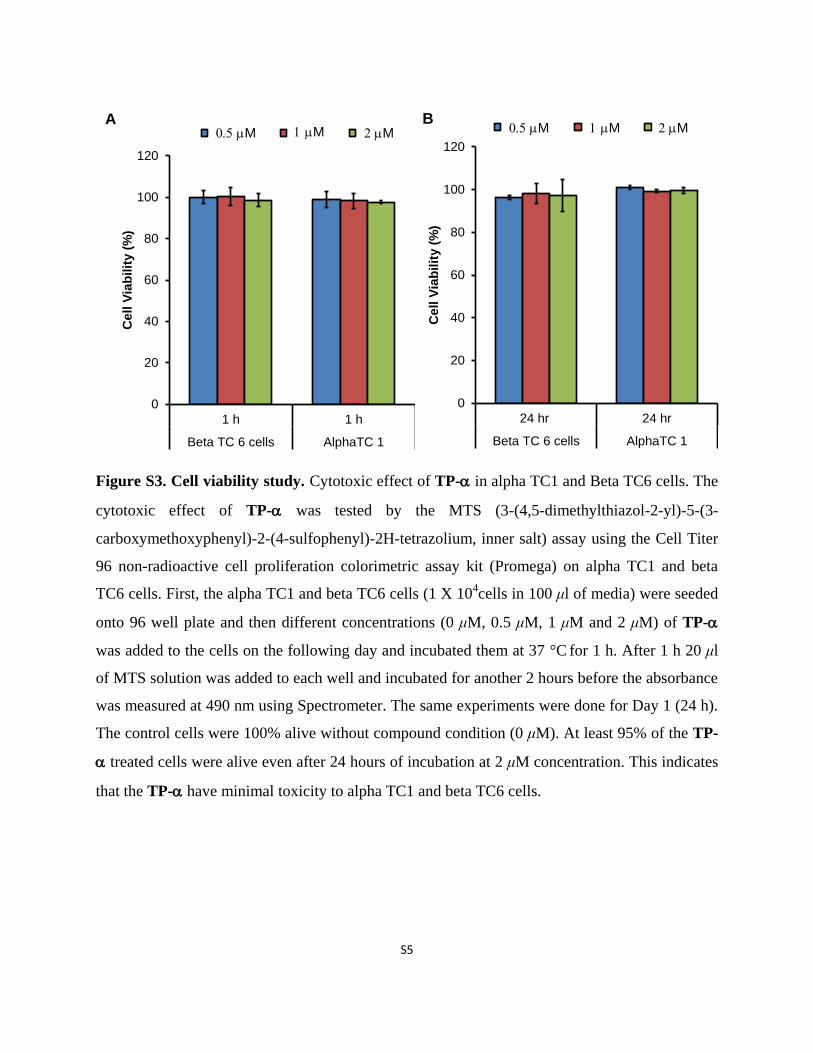
Figure S3. Cell viability study. Cytotoxic effect of TP- in alpha TC1 and Beta TC6 cells. The
cytotoxic effect of TP- was tested by the MTS (3-(4,5-dimethylthiazol-2-yl)-5-(3-
carboxymethoxyphenyl)-2-(4-sulfophenyl)-2H-tetrazolium, inner salt) assay using the Cell Titer
96 non-radioactive cell proliferation colorimetric assay kit (Promega) on alpha TC1 and beta
TC6 cells. First, the alpha TC1 and beta TC6 cells (1 X 10⁴cells in 100 μl of media) were seeded
onto 96 well plate and then different concentrations (0 μM, 0.5 μM, 1 μM and 2 μM) of TP-
was added to the cells on the following day and incubated them at 37 °C for 1 h. After 1 h 20 μl
of MTS solution was added to each well and incubated for another 2 hours before the absorbance
was measured at 490 nm using Spectrometer. The same experiments were done for Day 1 (24 h).
The control cells were 100% alive without compound condition (0 μM). At least 95% of the TP-
treated cells were alive even after 24 hours of incubation at 2 μM concentration. This indicates
that the TP- have minimal toxicity to alpha TC1 and beta TC6 cells.
0
20
40
60
80
100
120
1 h 1 h
Beta TC 6 cells AlphaTC 1
Ce
ll V
iab
ilit
y (
%)
0.5 uM 1 uM 2 uM
0
20
40
60
80
100
120
24 hr 24 hr
Beta TC 6 cells AlphaTC 1C
ell
Via
bil
ity (
%)
0.5 uM 1 uM 2 uMA B
0.5mM 1mM 2mM0.5mM 1mM 2mM
S6
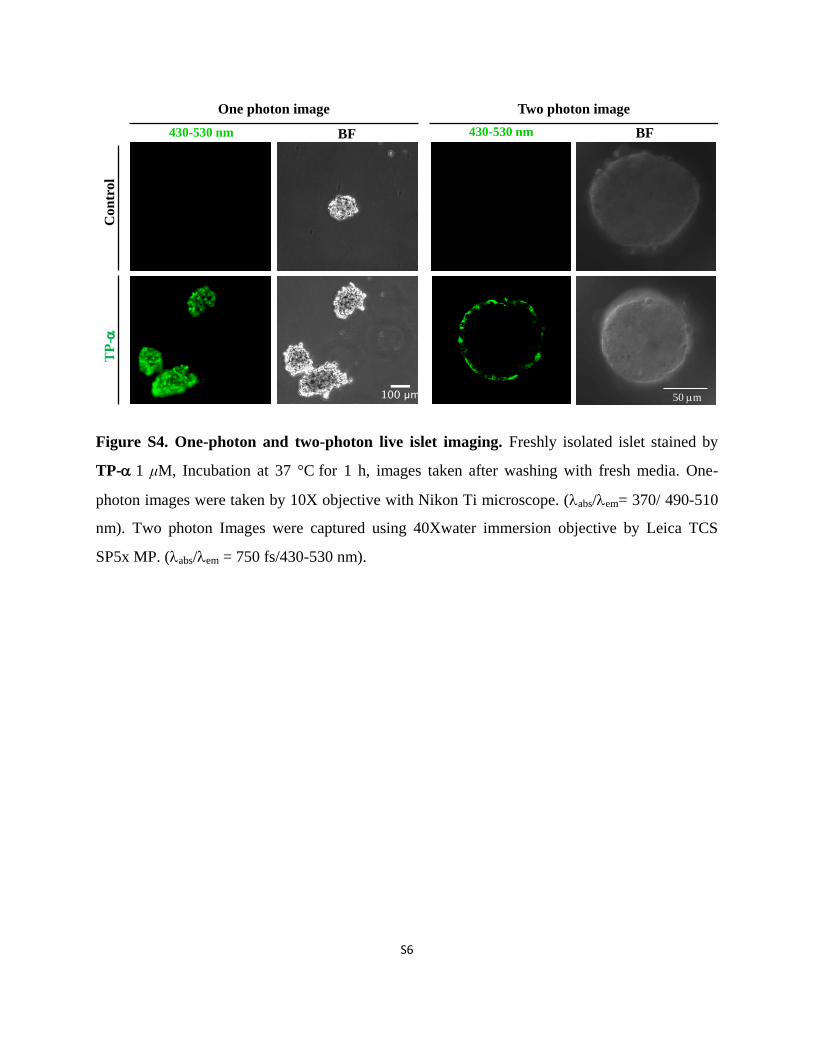
Figure S4. One-photon and two-photon live islet imaging. Freshly isolated islet stained by
TP-1 μM, Incubation at 37 °C for 1 h, images taken after washing with fresh media. One-
photon images were taken by 10X objective with Nikon Ti microscope. (abs/em= 370/ 490-510
nm). Two photon Images were captured using 40Xwater immersion objective by Leica TCS
SP5x MP. (abs/em = 750 fs/430-530 nm).
BF
TP
-C
on
tro
lOne photon image Two photon image
50 mm
430-530 nm BF430-530 nm

S7
Figure S5. TP- excitation spectral profiles. (A) Two-photon excitation spectral imaging of
TP- stained islet. Excitation by fs laser light 710 nm to 820 nm. 750 nm fs laser shows the
maximum emission signal. (B) Two photon action spectra of TP- based on emission intensity
measurement from images.
710 nm
770 nm760 nm750 nm
740 nm730 nm720 nm
780 nm
790 nm 800 nm 810 nm
TP-Excitation/(nm)
A
B

S8
Figure S6. TP- emission spectral profile. (A) Emission spectra of TP- stained islet over the
range of 440 nm to 540 nm with 10 nm step size. Excitation with 750 nm fs laser light (3.5 mW
laser power). (B) One photon emission spectra for TP- based on image intensity measurement.
440 nm
480 nm
470 nm460 nm450 nm
520 nm
510 nm500 nm490 nm
550 nm540 nm530 nm
A
B
S9
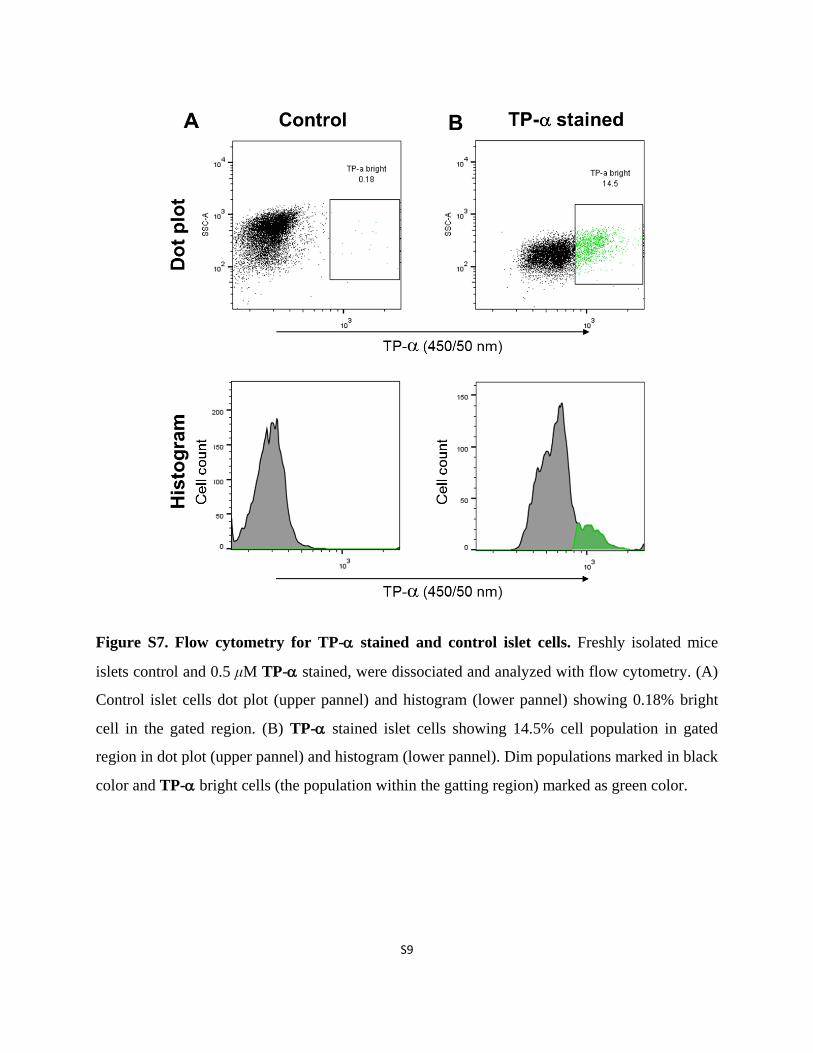
Figure S7. Flow cytometry for TP- stained and control islet cells. Freshly isolated mice
islets control and 0.5 μM TP- stained, were dissociated and analyzed with flow cytometry. (A)
Control islet cells dot plot (upper pannel) and histogram (lower pannel) showing 0.18% bright
cell in the gated region. (B) TP- stained islet cells showing 14.5% cell population in gated
region in dot plot (upper pannel) and histogram (lower pannel). Dim populations marked in black
color and TP- bright cells (the population within the gatting region) marked as green color.
S10
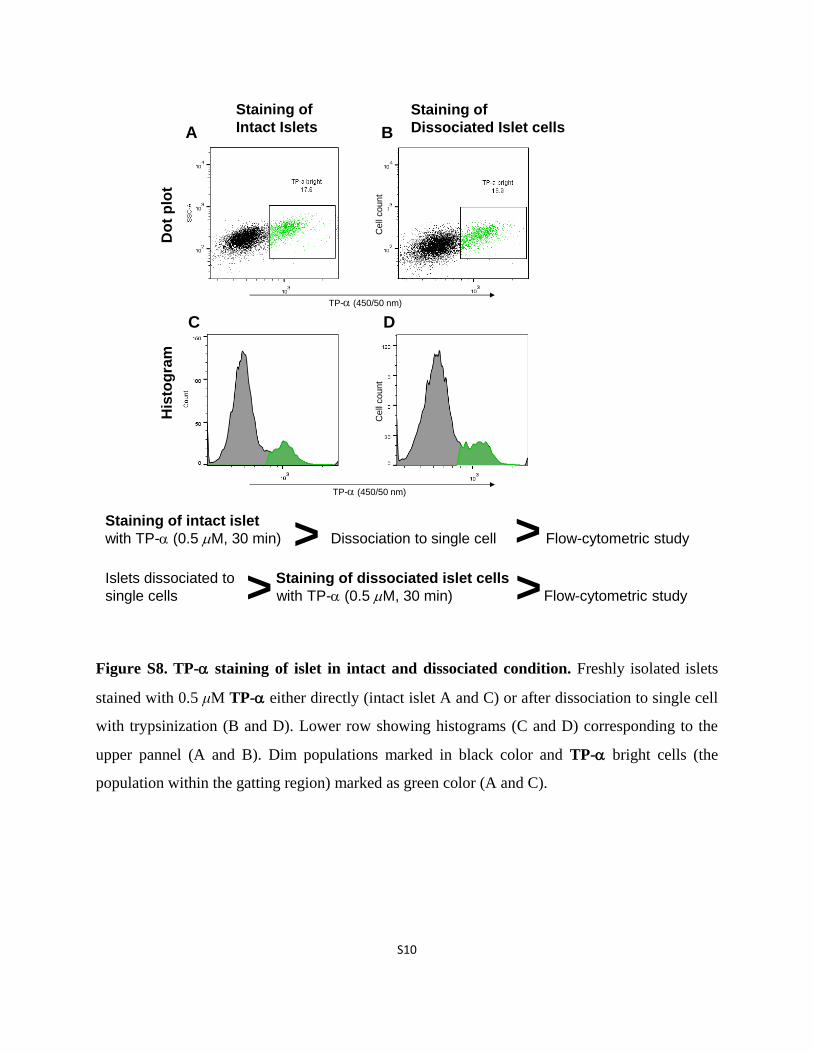
Figure S8. TP- staining of islet in intact and dissociated condition. Freshly isolated islets
stained with 0.5 μM TP- either directly (intact islet A and C) or after dissociation to single cell
with trypsinization (B and D). Lower row showing histograms (C and D) corresponding to the
upper pannel (A and B). Dim populations marked in black color and TP- bright cells (the
population within the gatting region) marked as green color (A and C).
Staining of
Intact Islets
Staining of
Dissociated Islet cells
Ce
ll co
un
tC
ell
co
un
t
TP- (450/50 nm)
TP- (450/50 nm)
Do
t p
lot
His
tog
ram
A
C D
B
Staining of intact islet
with TP- (0.5 mM, 30 min) Dissociation to single cell Flow-cytometric study
Islets dissociated to Staining of dissociated islet cells
single cells with TP- (0.5 mM, 30 min) Flow-cytometric study> >
>>
S11
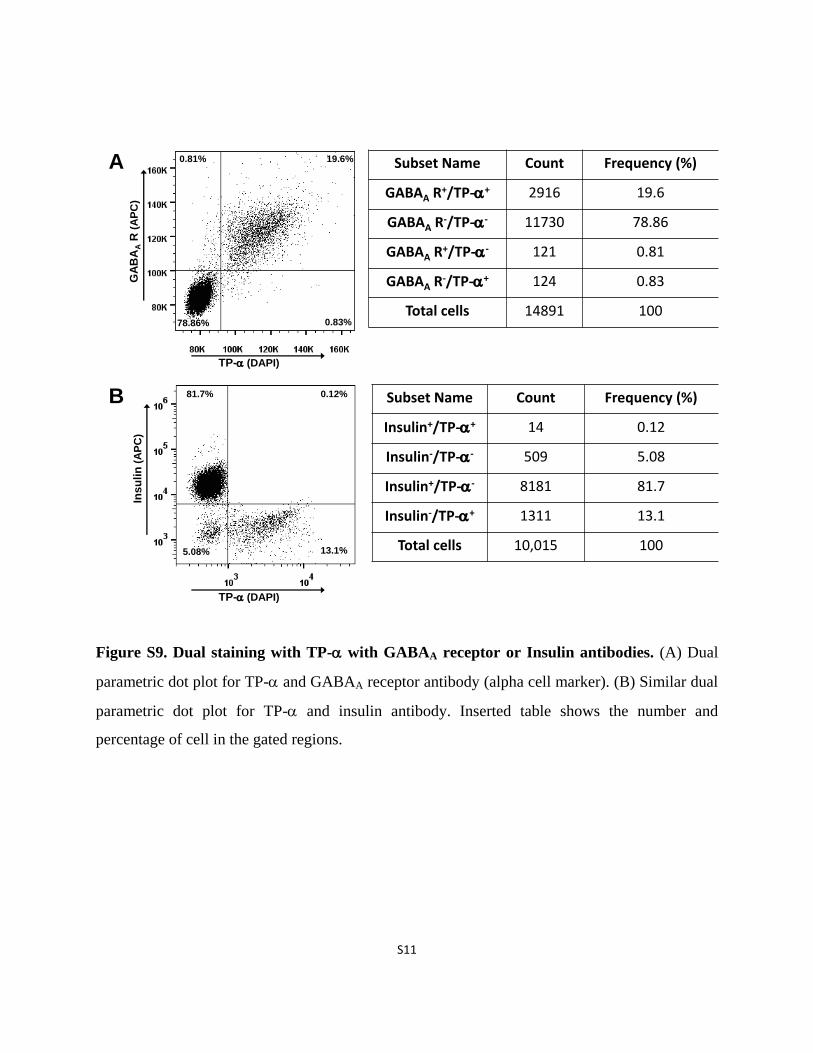
Figure S9. Dual staining with TP- with GABAA receptor or Insulin antibodies. (A) Dual
parametric dot plot for TP- and GABAA receptor antibody (alpha cell marker). (B) Similar dual
parametric dot plot for TP- and insulin antibody. Inserted table shows the number and
percentage of cell in the gated regions.
Subset Name Count Frequency (%)
GABAA R+/TP-+ 2916 19.6
GABAA R-/TP-- 11730 78.86
GABAA R+/TP-- 121 0.81
GABAA R-/TP-+ 124 0.83
Total cells 14891 100
TP-(DAPI)
GA
BA
AR
(A
PC
)
78.86%
0.81% 19.6%
0.83%
Subset Name Count Frequency (%)
Insulin+/TP-+ 14 0.12
Insulin-/TP-- 509 5.08
Insulin+/TP-- 8181 81.7
Insulin-/TP-+ 1311 13.1
Total cells 10,015 100
TP-(DAPI)
Insu
lin
(A
PC
)
5.08%
81.7% 0.12%
13.1%
A
B
S12
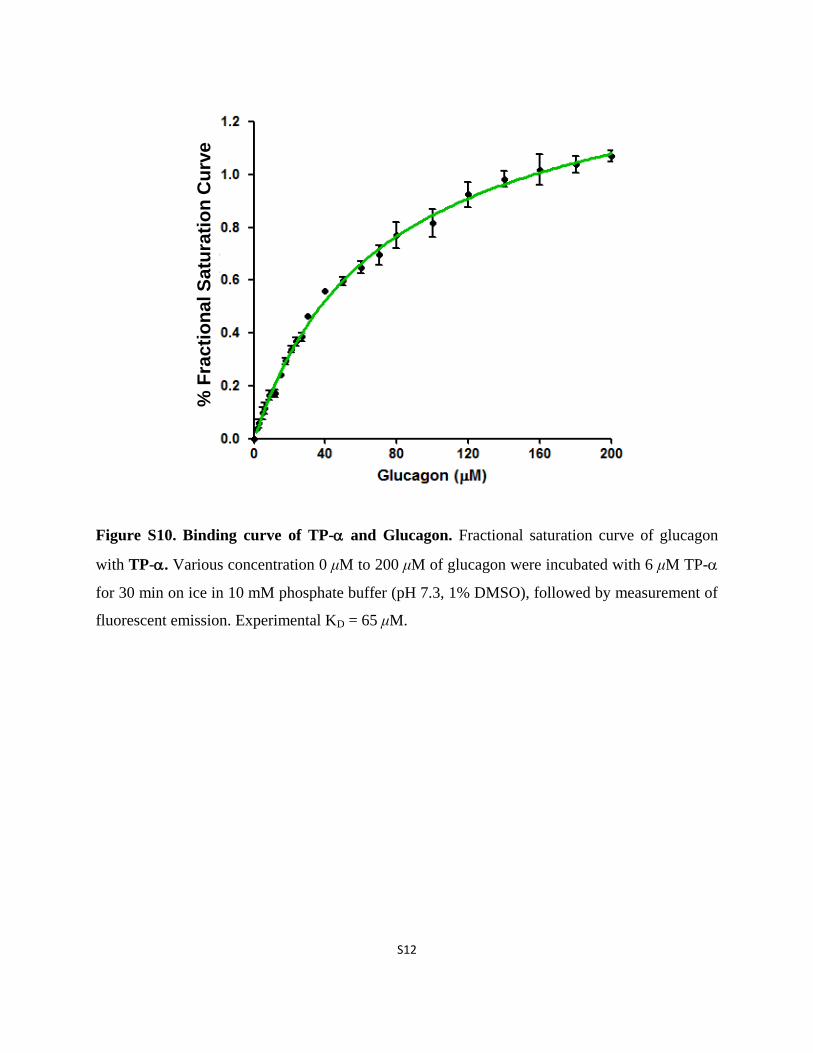
Figure S10. Binding curve of TP- and Glucagon. Fractional saturation curve of glucagon
with TP-. Various concentration 0 μM to 200 μM of glucagon were incubated with 6 μM TP-
for 30 min on ice in 10 mM phosphate buffer (pH 7.3, 1% DMSO), followed by measurement of
fluorescent emission. Experimental KD = 65 μM.
% F
racti
on
al S
atu
rati
on
Cu
rve
S13
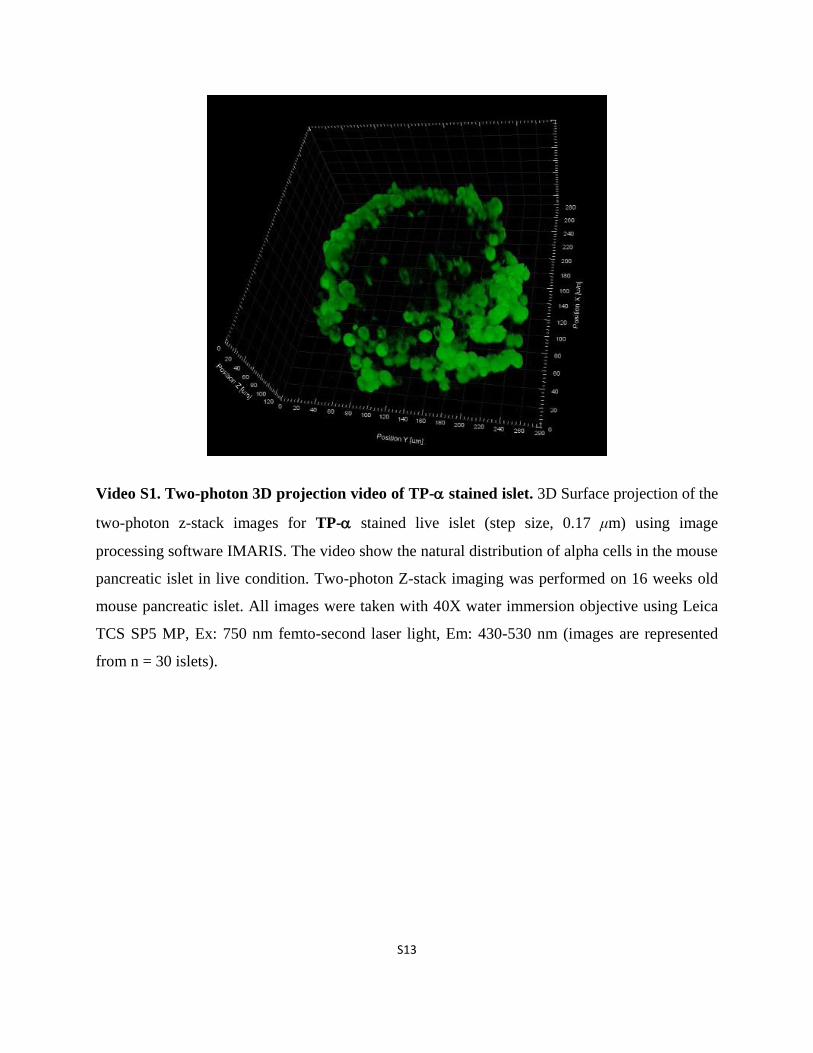
Video S1. Two-photon 3D projection video of TP- stained islet. 3D Surface projection of the
two-photon z-stack images for TP- stained live islet (step size, 0.17 μm) using image
processing software IMARIS. The video show the natural distribution of alpha cells in the mouse
pancreatic islet in live condition. Two-photon Z-stack imaging was performed on 16 weeks old
mouse pancreatic islet. All images were taken with 40X water immersion objective using Leica
TCS SP5 MP, Ex: 750 nm femto-second laser light, Em: 430-530 nm (images are represented
from n = 30 islets).
S14
General synthetic procedures and characterizations of TPG library
compounds.
General information. All the chemicals (including building block amines) and solvents were
purchased from Sigma Aldrich, Alfa Aesar, Fluka, MERCK or Acros and used without further
purification. 2-chlorotrityl chloride polystyrene resin (100-200 mesh, 1% DVB cross-linking)
was purchased from BeadTech (Korea). Normal phase purifications were carried out using
Merck Silica Gel 60 (particle size: 0.040-0.063 mm, 230-400 mesh). CEM Discover SP
Microwave Synthesis System was used for the microwave assisted synthesis. Analytical
characterization was performed on a HPLC-MS (Agilent-1200 series) with a DAD detector and a
single quadrupole mass spectrometer (6130 series) with an ESI probe. Analytical method, unless
indicated, gradient solvent system was: A: H2O: ACN (95:5 to 5:95) with 0.1% HCOOH in run
time of 10 min; C18 (2) Luna column (4.6 × 50 mm 2, 5 mm particle size). 1H-NMR and
13C-
NMR spectra were recorded on a Bruker Avance 300 MHz NMR spectrometer, and chemical
shifts were expressed in parts per million (ppm). Quantum yields and all other photo-physical
properties, photo-stability evaluation study of TPG derivatives were performed in
SpectraMax®
M2 spectrophotometer (Molecular Devices) instrument and the obtained data were
analyzed using the Microsoft Office Excel 2007.
S15
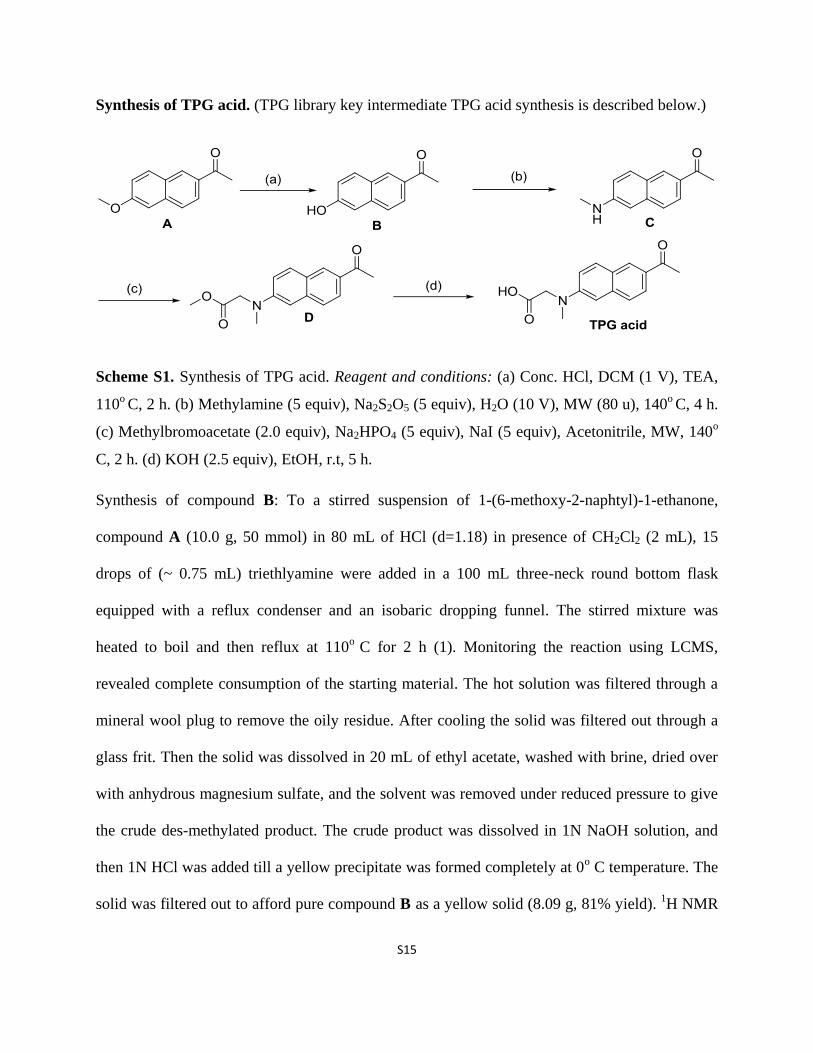
Synthesis of TPG acid. (TPG library key intermediate TPG acid synthesis is described below.)
Scheme S1. Synthesis of TPG acid. Reagent and conditions: (a) Conc. HCl, DCM (1 V), TEA,
110o C, 2 h. (b) Methylamine (5 equiv), Na2S2O5 (5 equiv), H2O (10 V), MW (80 u), 140
o C, 4 h.
(c) Methylbromoacetate (2.0 equiv), Na2HPO4 (5 equiv), NaI (5 equiv), Acetonitrile, MW, 140o
C, 2 h. (d) KOH (2.5 equiv), EtOH, r.t, 5 h.
Synthesis of compound B: To a stirred suspension of 1-(6-methoxy-2-naphtyl)-1-ethanone,
compound A (10.0 g, 50 mmol) in 80 mL of HCl (d=1.18) in presence of CH2Cl2 (2 mL), 15
drops of (~ 0.75 mL) triethlyamine were added in a 100 mL three-neck round bottom flask
equipped with a reflux condenser and an isobaric dropping funnel. The stirred mixture was
heated to boil and then reflux at 110o
C for 2 h (1). Monitoring the reaction using LCMS,
revealed complete consumption of the starting material. The hot solution was filtered through a
mineral wool plug to remove the oily residue. After cooling the solid was filtered out through a
glass frit. Then the solid was dissolved in 20 mL of ethyl acetate, washed with brine, dried over
with anhydrous magnesium sulfate, and the solvent was removed under reduced pressure to give
the crude des-methylated product. The crude product was dissolved in 1N NaOH solution, and
then 1N HCl was added till a yellow precipitate was formed completely at 0o C temperature. The
solid was filtered out to afford pure compound B as a yellow solid (8.09 g, 81% yield). 1H NMR
S16
(CD3OD, 500 MHz), δ (ppm) = 8.44 (s, 1H), 7.89 (dd, J= 8.5, 4.0 Hz, 2H), 7.67 (d, J=8.5 Hz,
1H), 7.15 (d, J=8.5 Hz, 2H), 4.88 (br s, 1H), 3.02 (s, 3H); 13
C NMR (CD3OD, 500 MHz), δ
(ppm) = 200.58, 159.52, 139.36, 133.13, 132.73, 132.06, 128.69, 127.70, 125.21, 120.51,
110.11, 26.63.
Synthesis of compound C. To a stirred suspension of 2-hydroxy-6-acetylnapthalene B (1.0 g,
5.37 mmol) in 30 mL H2O, Na2S2O5 (2 g, 10.74 mmol) and 40% MeNH2 solution in water (0.8 g,
27 mmol) were added. The mixture was heated at 140o C under microwave conditions (80 u) for
4h. The reactor was allowed to cool gradually to attain room temperature (2). Monitoring the
reaction using LCMS, revealed complete consumption of the starting material. The reaction
mixture was filtered and washed thoroughly with copious amount of cold water. The obtained
solid was crystallized from CHCl3/EtOH (3:1) to afford pure compound C as pale yellow crystals
(0.67 g, 67%). 1H NMR (CDCl3, 300 MHz); δ (ppm) = 8.28 (s, 1H), 7.92 (dd, J= 8.5, 3.0 Hz,
1H), 7.71 (d, J= 8.5 Hz, 1H), 7.63 (d, J= 8.5 Hz, 1H), 6.93 (dd, J= 8.5 Hz, 2H), 6.7 (s, 1H), 2.94
(s, 3H), 2.65 (s, 3H); 13
C NMR (CDCl3, 500 MHz); δ (ppm) = 198.14, 148.90, 138.15, 131.01,
130.88, 130.55, 126.19, 124.88, 118.62, 103.77, 30.70, 26.52.
Synthesis of TPG acid. To a mixture of C (3.0 g, 8.8 mmol) in MeCN, methyl bromoacetate
(2.0 g, 13 mmol), Na2HPO4 (1.9 g, 13 mmol), and NaI (0.5 g, 3.5 mmol) (50 mL) was added and
heated at 140o
C for 4 h under microwave condition (2). Monitoring the reaction using LCMS,
revealed complete consumption of the starting material. The reaction mixture was cooled to
room temperature, water was added followed by EtOAc and the layers were separated. The
organic layer was washed with water followed by brine, and was evaporated to dryness to give
the crude compound. The crude compound was purified by crystallization from EtOH to obtain a
S17
light yellow powder; yield 2.5 g (70% yield). To this ester intermediate (2.0 g, 4.9 mmol), KOH
(0.70 g, 12 mmol) in EtOH (50 mL) was added and stirred for 5 h. The resultant solution was
diluted with ice cold water (100 mL) and was acidified slowly using conc HCL (aq) to pH 3. The
resulting precipitate was filtered, washed with distilled water and purified by crystallization from
chloroform/petroleum ether to afford dark yellow solid (1.5 g, 63%). 1H NMR TPG acid
(CD3OD, 500 MHz), δ (ppm) = 8.34 (s, 1H), 7.82 (dd, J= 9, 3 Hz, 1H), 7.61 (d, J= 9.0 Hz, 1H),
7.15 (d, J= 9.0 Hz, 1H), 6.89 (s, 1H), 4.22 (s, 2H), 3.14 (14 (s, 3H), 2.60 (s, 3H); 13
C NMR TPG
acid (CD3OD, 500 MHz), δ (ppm) = 200.42, 174.35, 150.94, 139.32, 132.02, 131.97, 131.92,
127.46, 125.19, 117.11, 106.57, 54.85, 39.82, 26.45.
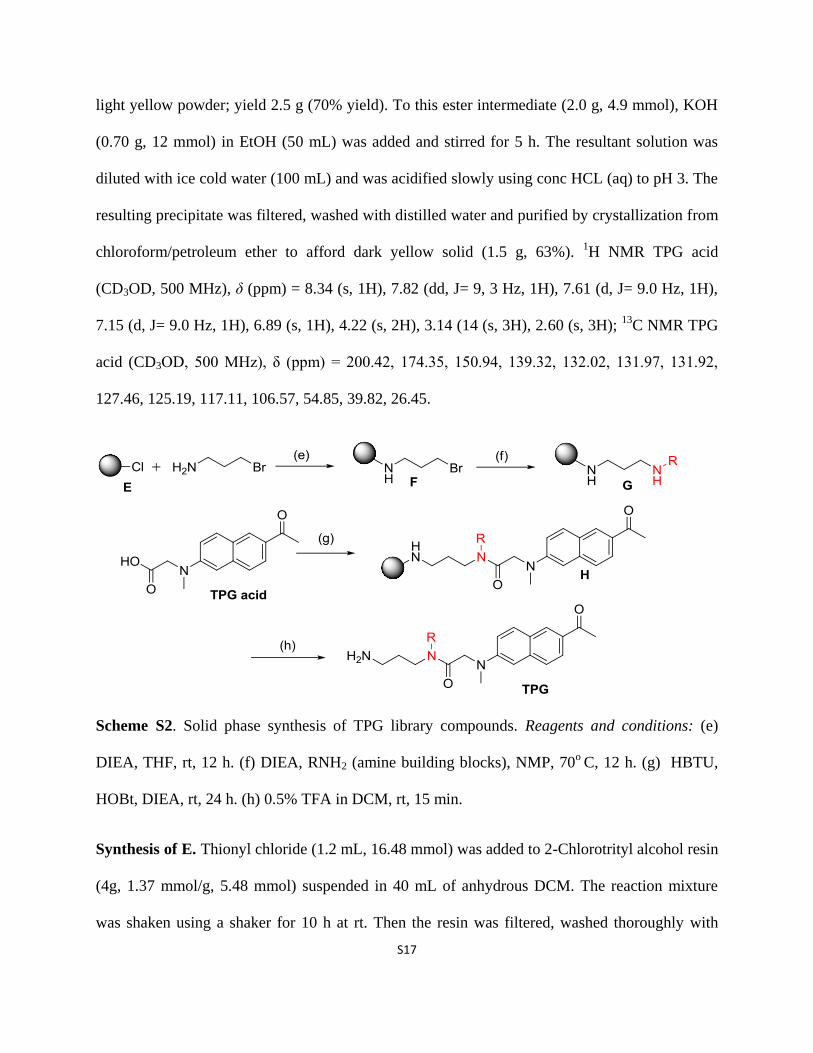
Scheme S2. Solid phase synthesis of TPG library compounds. Reagents and conditions: (e)
DIEA, THF, rt, 12 h. (f) DIEA, RNH2 (amine building blocks), NMP, 70o
C, 12 h. (g) HBTU,
HOBt, DIEA, rt, 24 h. (h) 0.5% TFA in DCM, rt, 15 min.
Synthesis of E. Thionyl chloride (1.2 mL, 16.48 mmol) was added to 2-Chlorotrityl alcohol resin
(4g, 1.37 mmol/g, 5.48 mmol) suspended in 40 mL of anhydrous DCM. The reaction mixture
was shaken using a shaker for 10 h at rt. Then the resin was filtered, washed thoroughly with

S18
DMF (3X 40 mL) followed by DCM (3X 40 mL). The obtained resin was dried under high
vacuum till a free flowing solid was obtained.
Synthesis of compound F. To 3-bromopropylamine (3.5 g, 15.75 mmol, 5 eq) THF (5 mL/g),
DIPEA (6 mL, 32.5 mmol, 10 eq) was added. The resulting solution was then added to 2-
chlorotrityl chloride resin (2.5 g, 3.25 mmol, 1 eq, 1.3 mmol/g) suspended in dichloromethane
(10 mL/g). After shaking for 12 h at rt, the resin was filtered through 10 mL cartridge, washed
with DMF (5X 40 mL), methanol (5X 40 mL), and dichloromethane (10X 40 mL). The
unreacted resin was then capped using 10 ml of 20% MeOH in DMF for 2h. The resin obtained
was again washed with DMF (5X 40 mL), methanol (5X 20 mL), and dichloromethane (5X 20
mL) and was dried under high vacuum till a free flowing solid was obtained.
Synthesis of compound G. (loading of amine building blocks to the resign). For each
reaction, resin (solid supported 3-bromopropylamine) (100 mg, 0.1 mmol, 1 eq, 1 mmol/g) was
suspended in 2 mL of N-Methylpyrrolidone (NMP) in a 20 mL of glass vial. 7 eq of each amine
(0.7 mmol) and 14 eq of DIEA (1.4 mmol) were then added in 2 mL of the same solvent. The
reaction mixture was shaken for 12 h at 70o
C on a heating block. The reaction mixture was
cooled and the resin was filtered through 10 mL cartridge and washed with DMF (5X 5 mL),
methanol (5X 5mL), and dichloromethane (5X 5mL). The solid supported secondary amine
resins obtained, were dried under high vacuum and was used for next steps.
Synthesis of compound H (coupling of TPG acid to the amine containing resign). To
synthesize TPG library, each of (solid supported secondary amine) resin (50 mg, 0.035 mmol,
1eq, 0.7 mmol/g ) was suspended in 3 mL of DMF in a 10 mL syringe then (28 mg, 0.07 mmol, 1
eq) TPG acid, (30 mg, 0.77 mmol, 2.2 eq), 2-(7-Aza-1H-benzotriazole-1-yl)-1,1,3,3-
S19
tetramethyluronium hexafluorophosphate (HATU) and (30 μL, 0.168 mmol, 4.8 eq) DIEA were
added. At a time 40 individual reaction mixtures were placed on orbital shaker for 24 h at room
temperature. After which, the resin was filtered through a 10 mL cartridge and washed with
DMF (5X5 mL), methanol (5X 5 mL), and dichloromethane (5X 5mL). The resin was dried
under high vacuum to afford solid supported compounds resin and then the subsequently the
dried resin of 50 mg was treated with 2% TFA in dichloromethane (5 mL) for 10 min. The
solution was drained to the 20 mL vial and then organic layer was washed with the saturated
NaHCO3 solution, and then the organic layer was separated and dried using vacuum to afford the
TPG library products. Each of TPG compound was solid and primarily characterized by LC-MS.
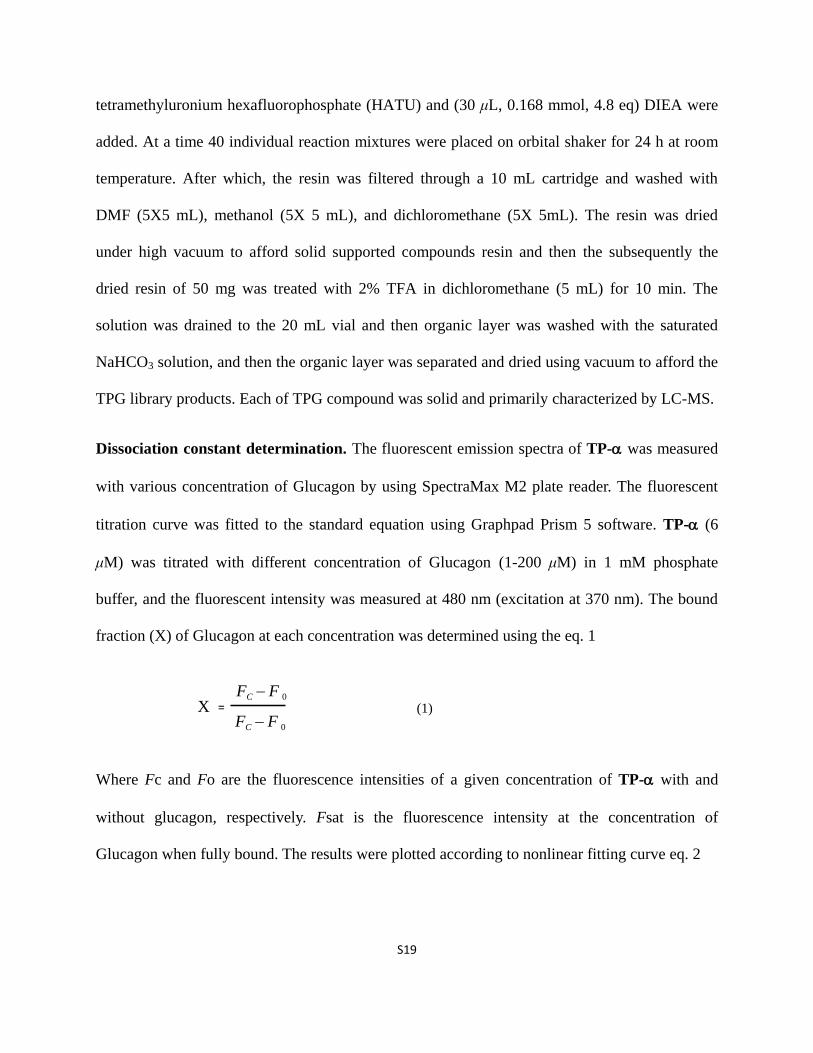
Dissociation constant determination. The fluorescent emission spectra of TP- was measured
with various concentration of Glucagon by using SpectraMax M2 plate reader. The fluorescent
titration curve was fitted to the standard equation using Graphpad Prism 5 software. TP- (6
μM) was titrated with different concentration of Glucagon (1-200 μM) in 1 mM phosphate
buffer, and the fluorescent intensity was measured at 480 nm (excitation at 370 nm). The bound
fraction (X) of Glucagon at each concentration was determined using the eq. 1
Where Fc and Fo are the fluorescence intensities of a given concentration of TP- with and
without glucagon, respectively. Fsat is the fluorescence intensity at the concentration of
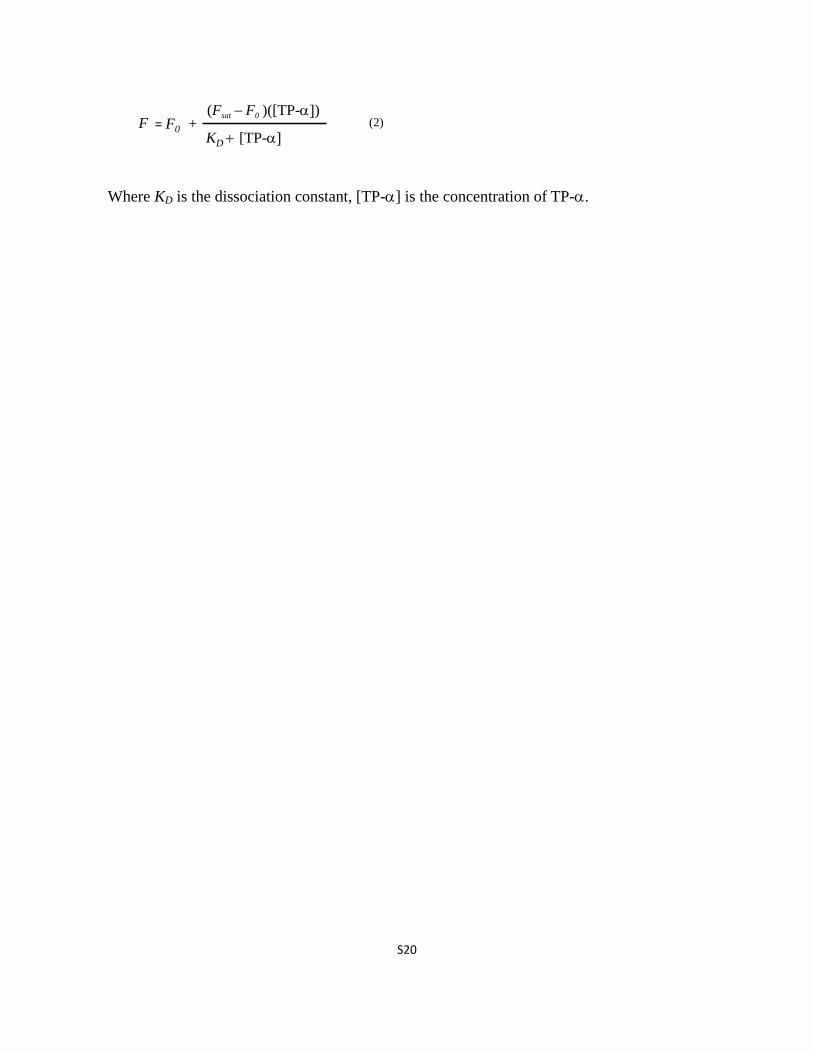
Glucagon when fully bound. The results were plotted according to nonlinear fitting curve eq. 2
X =FC- F 0
(1)FC- F 0
S20
Where KD is the dissociation constant, [TP-] is the concentration of TP-.
F =(Fsat- F0 )([TP-])
(2)
KD + [TP-]F0 +
S21
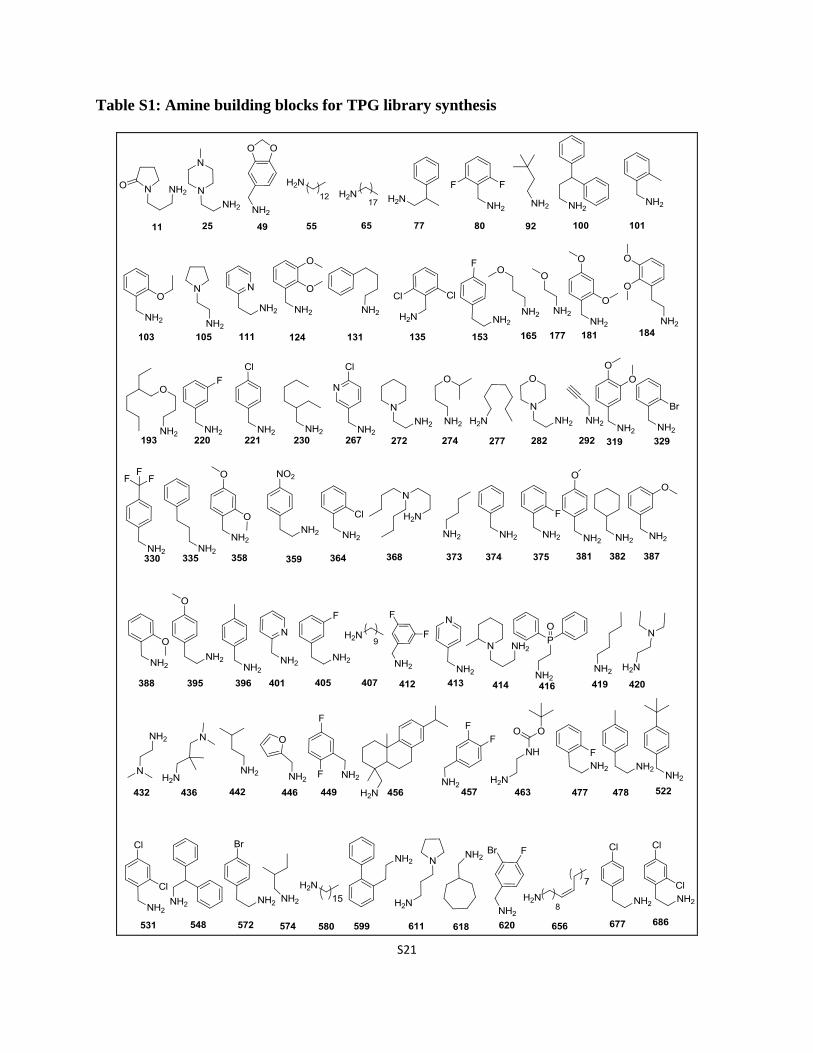
Table S1: Amine building blocks for TPG library synthesis
S22
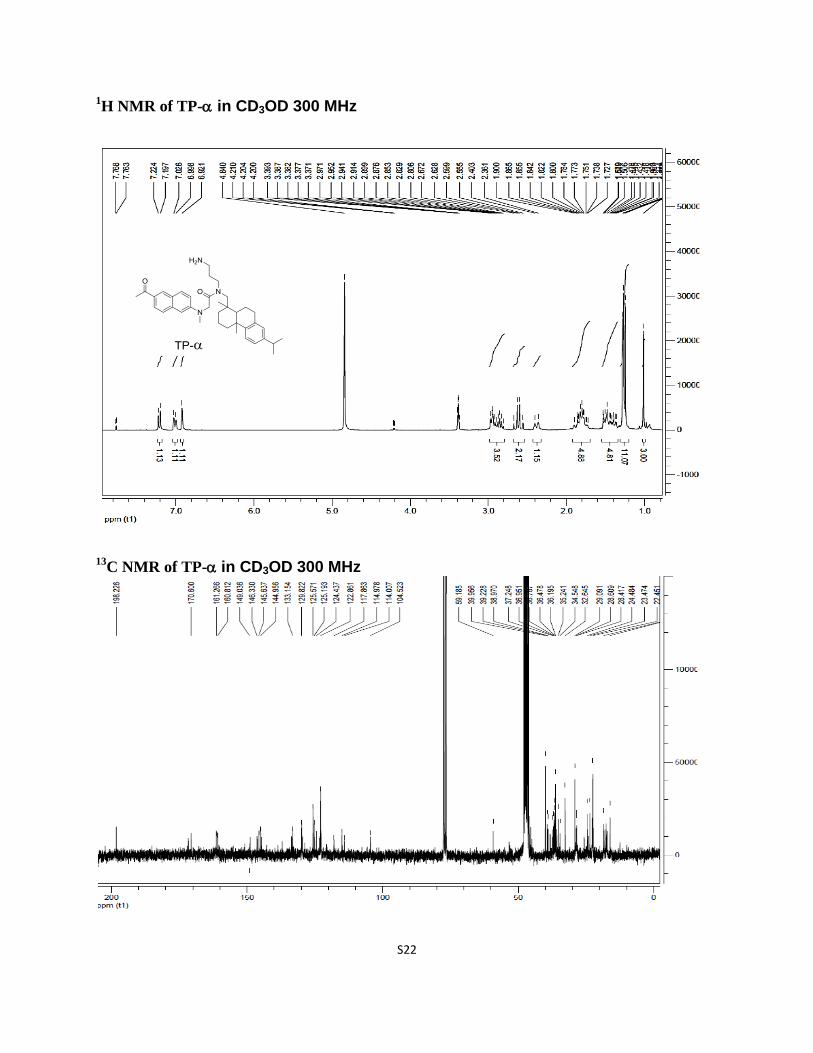
1H NMR of TP- in CD3OD 300 MHz
13C NMR of TP-in CD3OD 300 MHz
S23
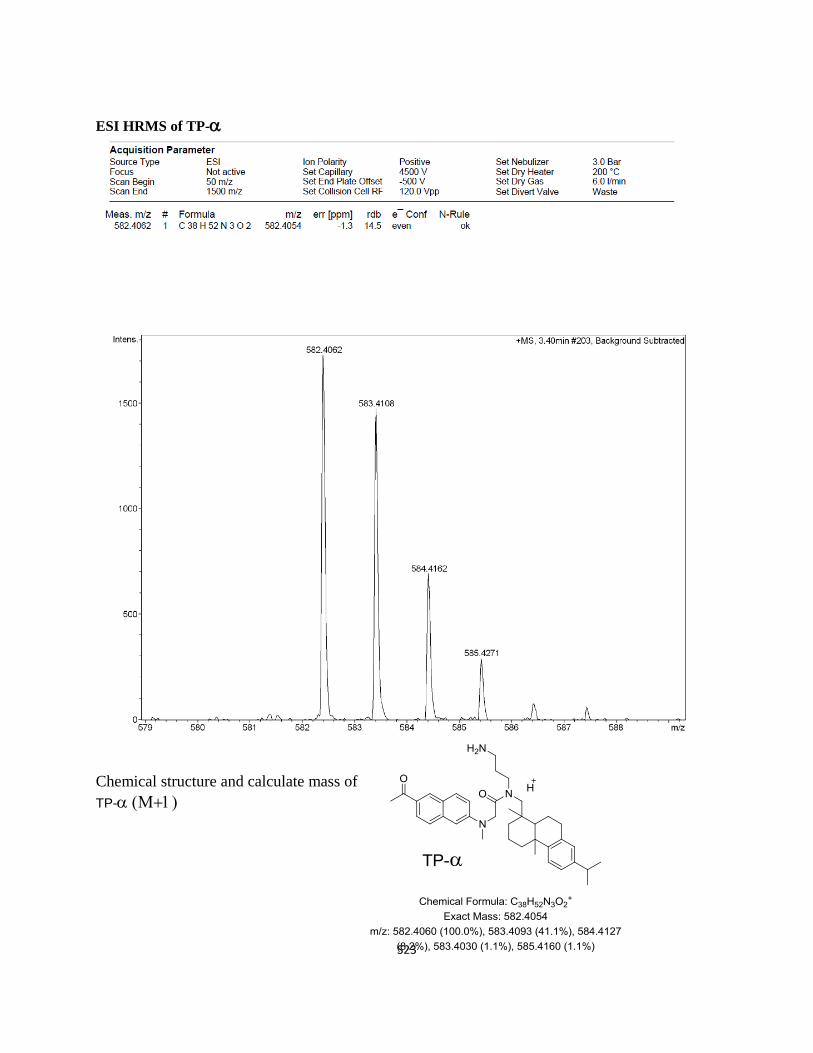
ESI HRMS of TP-
Chemical structure and calculate mass of
TP-+1

S24
SupportingTable S2.Spectroscopic properties and purity table for TPG library: absorbance
maximum (λabs), fluorescent emission maximum (λem), and quantum yield.
UC M+
(cal) M+1(exp.) Abs(nm) Em(nm) QY Purity (%)
TPG-11 438.26 439.26 363 460 0.49 98
TPG-25 439.29 440.29 361 460 0.42 93
TPG-49 447.22 448.22 361 461 0.48 85
TPG-55 495.38 496.38 361 461 0.37 91
TPG-65 565.46 566.46 355 460 0.44 85
TPG-77 431.26 432.26 367 460 0.60 98
TPG-80 439.21 440.21 363 460 0.49 98
TPG-92 397.27 398.27 359 460 0.38 98
TPG-100 507.29 508.29 360 460 0.52 97
TPG-101 417.24 418.24 361 462 0.48 99
TPG-103 447.25 448.25 363 460 0.43 95
TPG-105 410.27 411.27 362 460 0.50 97
TPG-111 418.24 419.24 363 462 0.29 95
TPG-124 463.25 464.25 359 461 0.39 97
TPG-131 445.27 446.27 363 460 0.23 98
TPG-135 471.15 472.15 358 460 0.53 96
TPG-153 471.21 472.21 364 461 0.44 97
TPG-165 385.24 386.24 352 464 0.30 98
TPG-177 371.22 372.22 369 461 0.31 98
TPG-181 463.25 464.25 361 460 0.65 99
TPG-184 477.26 478.26 358 460 0.78 97
TPG-193 483.35 484.35 361 463 0.35 92
TPG-220 421.22 422.22 362 460 0.63 96
TPG-221 437.19 438.19 360 460 0.36 97
TPG-230 425.30 426.30 361 460 0.59 95
TPG-266 477.26 478.26 368 460 0.59 95
TPG-267 438.18 439.18 360 461 0.42 91
TPG-274 413.27 414.27 366 460 0.29 99
TPG-277 411.29 412.29 369 462 0.32 97
TPG-282 426.26 427.26 363 460 0.38 91
TPG-292 351.19 352.19 359 455 0.66 81
TPG-319 463.25 464.25 359 461 0.59 96
TPG-329 517.11 518.11 353 458 0.42 89
TPG-330 471.21 472.21 360 460 0.68 95
TPG-335 431.26 432.26 369 460 0.34 97
TPG-358 499.22 500.22 362 460 0.48 98
TPG-359 498.20 499.20 376 450 0.17 92
TPG-364 437.19 438.19 361 462 0.54 97
TPG-368 482.36 483.36 361 460 0.36 93

S25
TPG-373 369.24 370.24 363 460 0.41 97
TPG-374 403.23 404.23 358 460 0.52 98
TPG-375 421.22 422.22 363 462 0.44 94
TPG-381 433.24 434.24 369 460 0.68 95
TPG-382 409.27 410.27 368 460 0.45 92
TPG-387 433.24 434.24 360 460 0.40 97
TPG-388 433.24 434.24 361 462 0.43 97
TPG-395 447.25 448.25 367 461 0.62 98
TPG-396 417.24 418.24 359 461 0.32 98
TPG-401 404.22 405.22 360 462 0.42 91
TPG-405 435.23 436.23 358 461 0.35 92
TPG-407 453.34 454.34 361 460 0.56 96
TPG-412 439.21 440.21 359 460 0.72 98
TPG-413 404.22 405.22 361 461 0.95 92
TPG-414 452.32 453.32 365 460 0.39 93
TPG-416 541.25 542.25 371 460 0.43 85
TPG-419 383.26 384.26 369 464 0.39 93
TPG-420 412.28 413.28 377 455 0.56 85
TPG-432 384.25 385.25 363 460 0.59 86
TPG-436 426.30 427.30 363 460 0.34 81
TPG-442 383.26 384.26 361 460 0.65 96
TPG-446 393.21 394.21 364 460 0.42 98
TPG-449 439.21 440.21 363 460 0.47 97
TPG-456 581.40 582.40 357 464 0.69 75
TPG-457 439.21 440.21 360 460 0.73 95
TPG-463 456.27 457.27 374 460 0.44 96
TPG-477 435.23 436.23 367 460 0.53 98
TPG-478 431.26 432.26 362 460 0.71 97
TPG-522 459.29 460.29 358 460 0.66 98
TPG-531 471.15 472.15 363 460 0.47 97
TPG-548 493.27 494.27 361 460 0.56 97
TPG-572 495.15 496.15 362 460 0.76 98
TPG-574 383.26 384.26 362 460 0.81 99
TPG-580 537.43 538.43 362 462 0.81 97
TPG-599 493.27 494.27 363 461 0.69 98
TPG-611 424.28 425.28 357 462 0.94 91
TPG-618 423.29 424.29 365 460 0.78 96
TPG-620 499.13 500.13 358 459 0.91 93
TPG-656 563.45 564.45 363 460 0.65 95
TPG-677 451.20 452.20 377 460 0.58 99
TPG-686 485.16 486.16 361 460 0.69 98
S26
Reference:
1. Rong, L. J.; Guang, Z. J. Chem. Crystallogr. 2005, 35, 789.
2. Kim, H. M.; Choo, H. J.; Jung, S. Y.; Ko, Y. G.; Park, W. H.; Jeon, S. J.; Kim, C. H.; Joo, T.;
Cho, B. R. Chembiochem 2007, 8, 553.
3. Ghosh, K. K.; Ha, H. H.; Kang, N. Y.; Chandran, Y.; Chang, Y. T. Chem. Commun. 2011, 47,
7488.