Embed Size (px)
Citation preview

1
Online-only Supplement
BMJ Publishing Group Limited (BMJ) disclaims all liability and responsibility arising from any relianceSupplemental material placed on this supplemental material which has been supplied by the author(s) Heart
doi: 10.1136/heartjnl-2020-318430–9.:10 2021;Heart, et al. Zimmermann T
2
Table of Content
Study details (derivation cohort) ......................................................................................................... 4
Follow-up and adjudication of the final diagnosis ........................................................................ 4
Clinical assessment .......................................................................................................................... 5
Definition of MACE ........................................................................................................................... 6
Definition of Integrated Clinical Judgment .................................................................................... 6
Recruitment centres ......................................................................................................................... 6
Details regarding Results – Study population .............................................................................. 6
Details regarding Results – Sensitivity analyses ......................................................................... 6
Online Table 1: Distribution of adjudicated diagnoses across the derivation cohort. ........... 7
Online Table 2: MACE within 30 days in the rule-in and rule-out group, as classified by the
ALERT-CS. ........................................................................................................................................ 8
Online Table 3: Baseline characteristics of patients with a missing ECG. ........................... 10
Statistical methods ............................................................................................................................. 11
General Statistics ............................................................................................................................ 11
Model derivation and calibration ................................................................................................... 11
Sensitivity analysis ......................................................................................................................... 12
External validation .......................................................................................................................... 12
Results .................................................................................................................................................. 13
Online Table 5: Predictors in the reduced model with their respective OR, lower- and
upper 95%-CI and p-value from the univariable and multivariable regression analysis
(before shrinkage). ......................................................................................................................... 13
Online Table 6: Predictors and their prevalence in patients stratified by tachyarrhythmic
and bradyarrhythmic causes of cardiac syncope as per the adjudicated final diagnosis. ... 14
Online Table 7: Details of the chosen 99%-sensitivity (A) and 95%-specificity (B) cutoff of
ALERT-CS for rule-out and rule-in of cardiac syncope. ........................................................... 15
Online Table 8: Characteristics of different sensitivity cutoffs of ALERT-CS for the rule-out
(A) and specificity cut-offs for the rule-in (B) of cardiac syncope. ........................................... 16
Study details (validation cohort) ....................................................................................................... 17
Validation cohort – Improving Risk Stratification in Older Adults (SRS) Study ..................... 17
Online Table 9: Baseline characteristics of the validation cohort. ......................................... 19
Online Table 10: Prevalence of grouped ECG predictors in the validation cohort, stratified
by the discharge diagnosis. Given p-value is for differences between non cardiac and
cardiac. ............................................................................................................................................. 20
Online Table 11: Distribution of discharge diagnoses of the validation cohort. ................... 21
Validation of the ALERT-CS: Results .......................................................................................... 22
Figures .................................................................................................................................................. 23
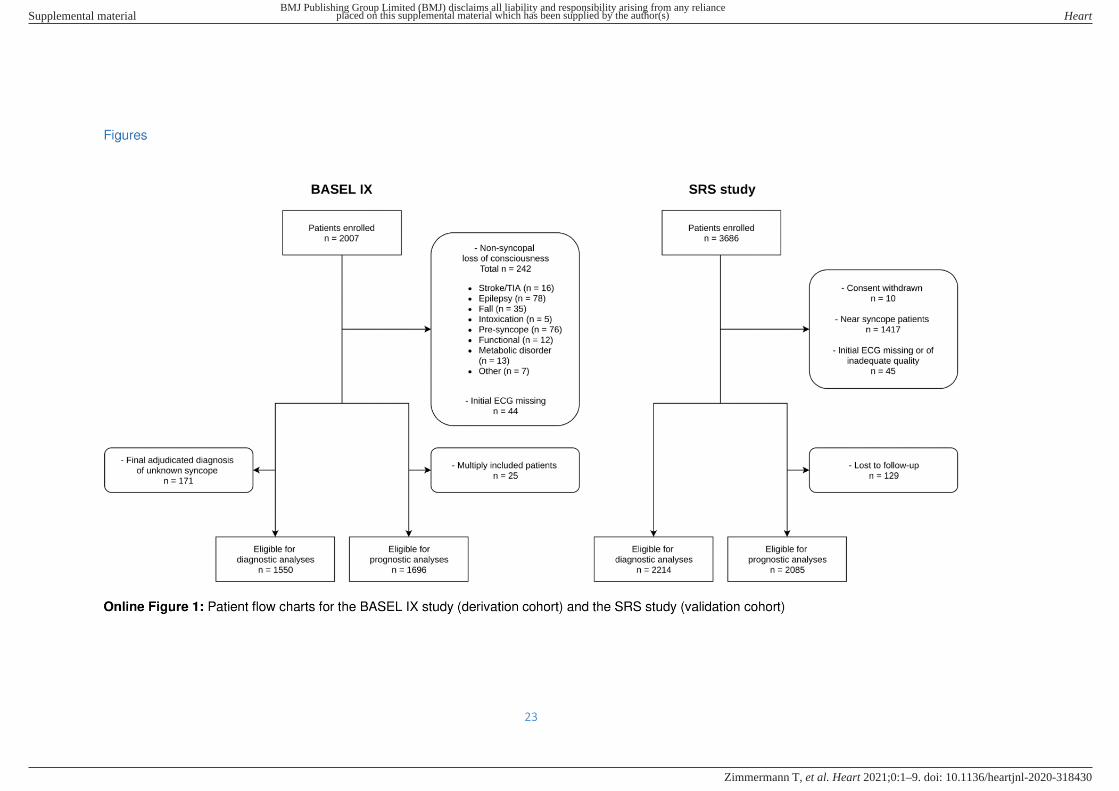
Online Figure 1: Patient flow charts for the BASEL IX study (derivation cohort) and the SRS
study (validation cohort) ..................................................................................................................... 23
BMJ Publishing Group Limited (BMJ) disclaims all liability and responsibility arising from any relianceSupplemental material placed on this supplemental material which has been supplied by the author(s) Heart
doi: 10.1136/heartjnl-2020-318430–9.:10 2021;Heart, et al. Zimmermann T
3
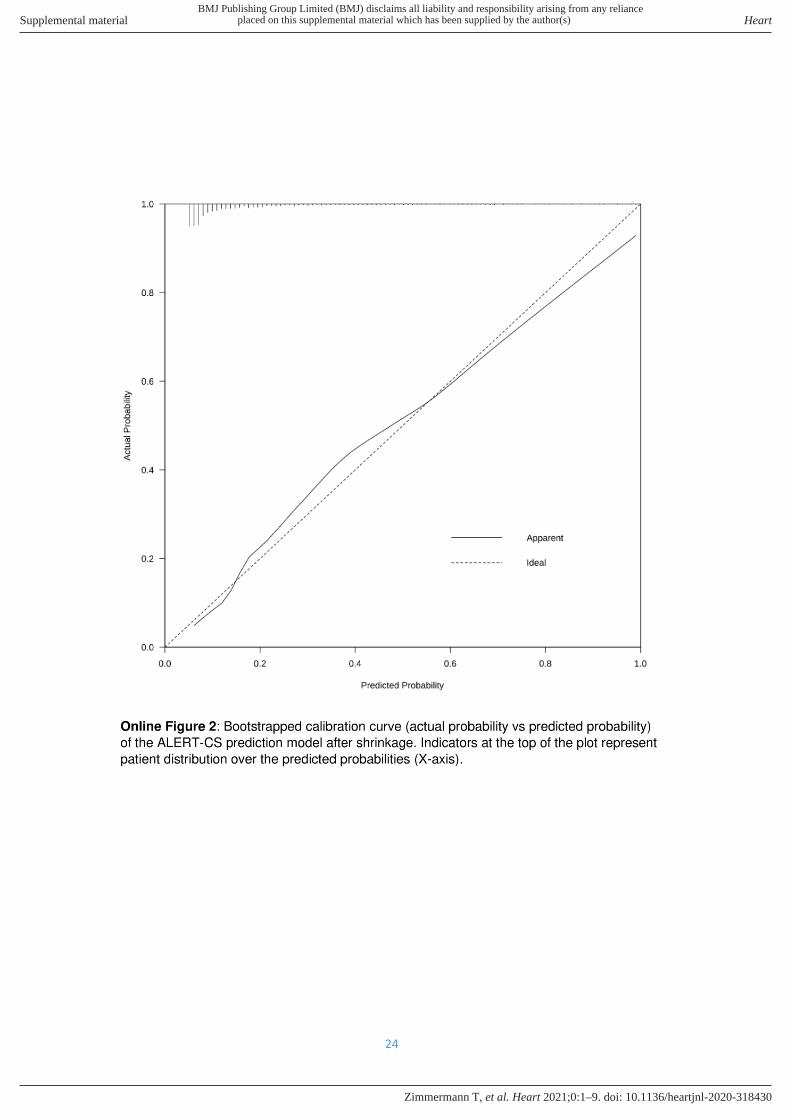
Online Figure 2: Bootstrapped calibration curve (actual probability vs predicted probability)
of the ALERT-CS prediction model after shrinkage. ..................................................................... 24
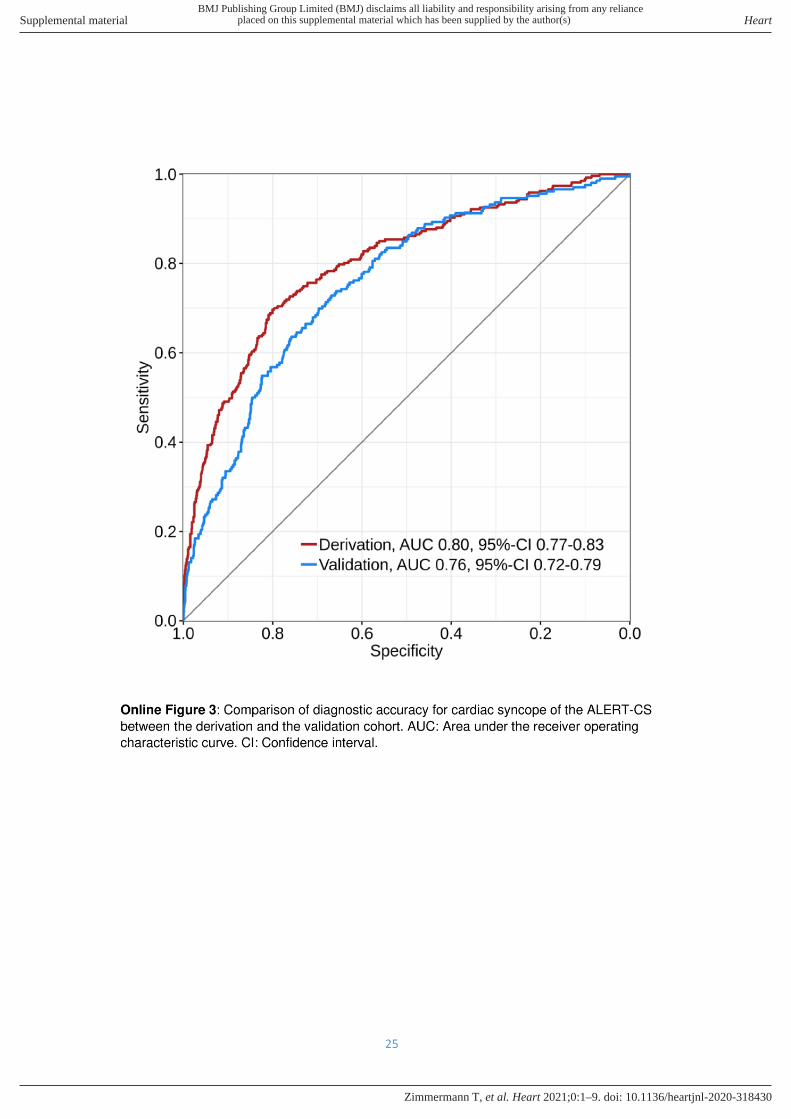
Online Figure 3: Comparison of diagnostic accuracy for cardiac syncope of the ALERT-CS
between the derivation and the validation cohort. ......................................................................... 25
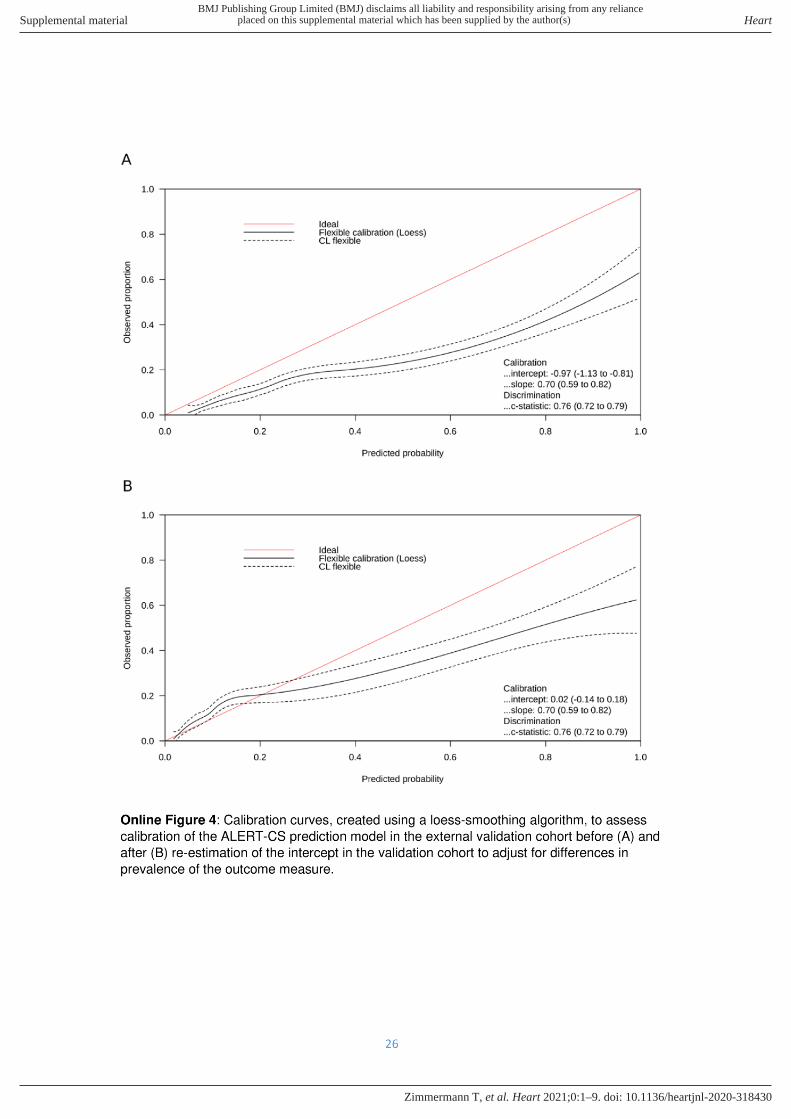
Online Figure 4: Calibration curves, created using a loess-smoothing algorithm, to assess
calibration of the ALERT-CS prediction model in the external validation cohort before (A) and
after (B) re-estimation of the intercept in the validation cohort to adjust for differences in
prevalence of the outcome measure. .............................................................................................. 26
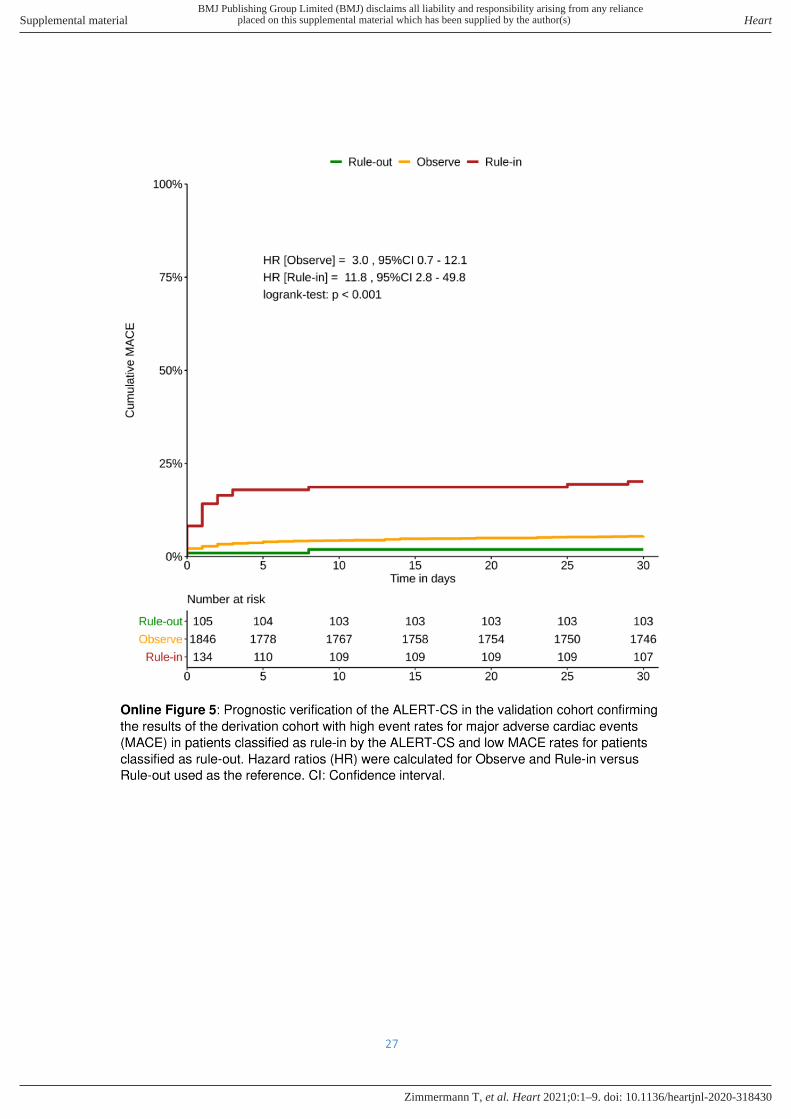
Online Figure 5: Prognostic verification of the ALERT-CS in the validation cohort confirming
the results of the derivation cohort with high event rates for major adverse cardiac events
(MACE) in patients classified as rule-in by the ALERT-CS and low MACE rates for patients
classified as rule-out. Hazard ratios (HR) were calculated for Observe and Rule-in versus
Rule-out used as the reference. ....................................................................................................... 27
Used R packages ............................................................................................................................... 28
Disclaimer ............................................................................................................................................ 28
Bibliography ......................................................................................................................................... 29
BMJ Publishing Group Limited (BMJ) disclaims all liability and responsibility arising from any relianceSupplemental material placed on this supplemental material which has been supplied by the author(s) Heart
doi: 10.1136/heartjnl-2020-318430–9.:10 2021;Heart, et al. Zimmermann T
4
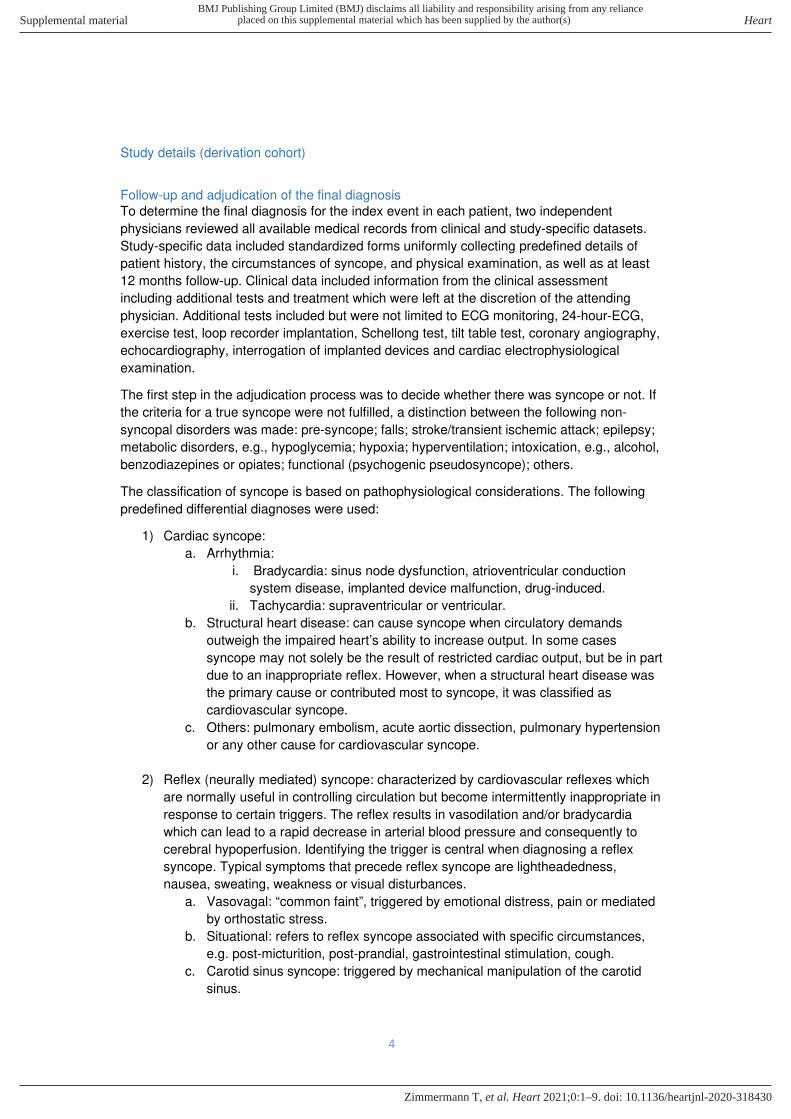
Study details (derivation cohort)
Follow-up and adjudication of the final diagnosis
To determine the final diagnosis for the index event in each patient, two independent
physicians reviewed all available medical records from clinical and study-specific datasets.
Study-specific data included standardized forms uniformly collecting predefined details of
patient history, the circumstances of syncope, and physical examination, as well as at least
12 months follow-up. Clinical data included information from the clinical assessment
including additional tests and treatment which were left at the discretion of the attending
physician. Additional tests included but were not limited to ECG monitoring, 24-hour-ECG,
exercise test, loop recorder implantation, Schellong test, tilt table test, coronary angiography,
echocardiography, interrogation of implanted devices and cardiac electrophysiological
examination.
The first step in the adjudication process was to decide whether there was syncope or not. If
the criteria for a true syncope were not fulfilled, a distinction between the following non-
syncopal disorders was made: pre-syncope; falls; stroke/transient ischemic attack; epilepsy;
metabolic disorders, e.g., hypoglycemia; hypoxia; hyperventilation; intoxication, e.g., alcohol,
benzodiazepines or opiates; functional (psychogenic pseudosyncope); others.
The classification of syncope is based on pathophysiological considerations. The following
predefined differential diagnoses were used:
1) Cardiac syncope:
a. Arrhythmia:
i. Bradycardia: sinus node dysfunction, atrioventricular conduction
system disease, implanted device malfunction, drug-induced.
ii. Tachycardia: supraventricular or ventricular.
b. Structural heart disease: can cause syncope when circulatory demands
outweigh the impaired heart’s ability to increase output. In some cases
syncope may not solely be the result of restricted cardiac output, but be in part
due to an inappropriate reflex. However, when a structural heart disease was
the primary cause or contributed most to syncope, it was classified as
cardiovascular syncope.
c. Others: pulmonary embolism, acute aortic dissection, pulmonary hypertension
or any other cause for cardiovascular syncope.
2) Reflex (neurally mediated) syncope: characterized by cardiovascular reflexes which
are normally useful in controlling circulation but become intermittently inappropriate in
response to certain triggers. The reflex results in vasodilation and/or bradycardia
which can lead to a rapid decrease in arterial blood pressure and consequently to
cerebral hypoperfusion. Identifying the trigger is central when diagnosing a reflex
syncope. Typical symptoms that precede reflex syncope are lightheadedness,
nausea, sweating, weakness or visual disturbances.
a. Vasovagal: “common faint”, triggered by emotional distress, pain or mediated
by orthostatic stress.
b. Situational: refers to reflex syncope associated with specific circumstances,
e.g. post-micturition, post-prandial, gastrointestinal stimulation, cough.
c. Carotid sinus syncope: triggered by mechanical manipulation of the carotid
sinus.
BMJ Publishing Group Limited (BMJ) disclaims all liability and responsibility arising from any relianceSupplemental material placed on this supplemental material which has been supplied by the author(s) Heart
doi: 10.1136/heartjnl-2020-318430–9.:10 2021;Heart, et al. Zimmermann T
5
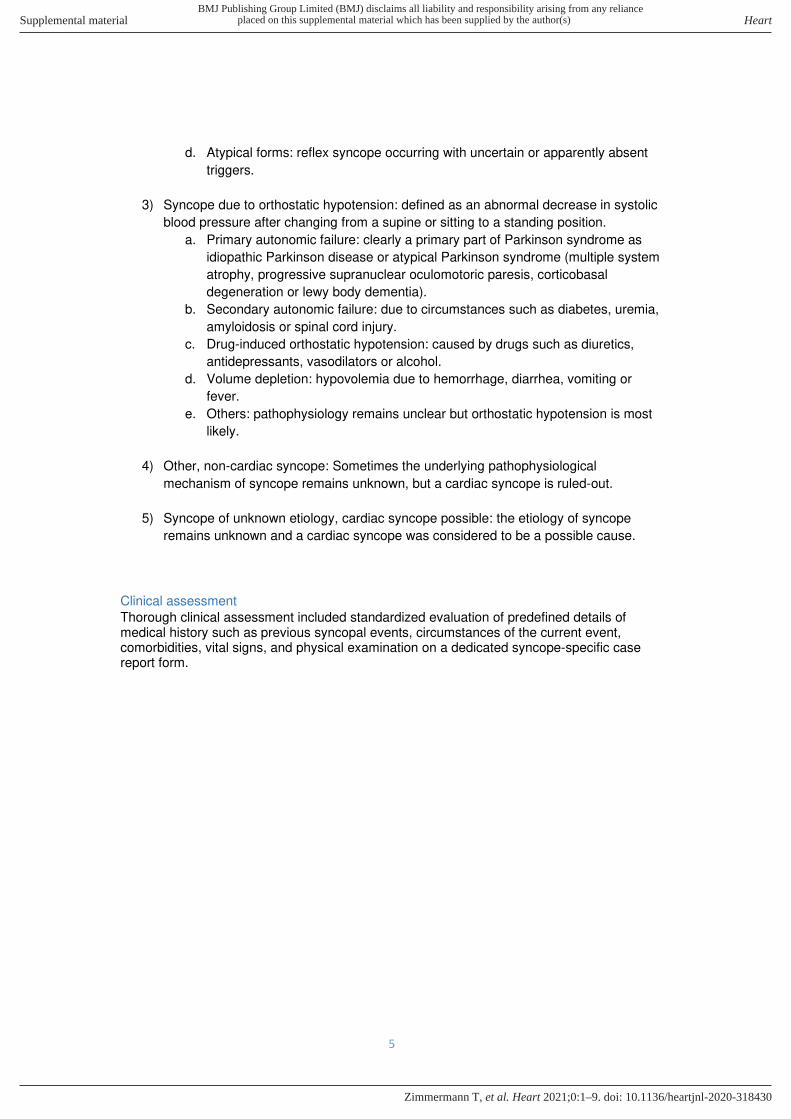
d. Atypical forms: reflex syncope occurring with uncertain or apparently absent
triggers.
3) Syncope due to orthostatic hypotension: defined as an abnormal decrease in systolic
blood pressure after changing from a supine or sitting to a standing position.
a. Primary autonomic failure: clearly a primary part of Parkinson syndrome as
idiopathic Parkinson disease or atypical Parkinson syndrome (multiple system
atrophy, progressive supranuclear oculomotoric paresis, corticobasal
degeneration or lewy body dementia).
b. Secondary autonomic failure: due to circumstances such as diabetes, uremia,
amyloidosis or spinal cord injury.
c. Drug-induced orthostatic hypotension: caused by drugs such as diuretics,
antidepressants, vasodilators or alcohol.
d. Volume depletion: hypovolemia due to hemorrhage, diarrhea, vomiting or
fever.
e. Others: pathophysiology remains unclear but orthostatic hypotension is most
likely.
4) Other, non-cardiac syncope: Sometimes the underlying pathophysiological
mechanism of syncope remains unknown, but a cardiac syncope is ruled-out.
5) Syncope of unknown etiology, cardiac syncope possible: the etiology of syncope
remains unknown and a cardiac syncope was considered to be a possible cause.
Clinical assessment Thorough clinical assessment included standardized evaluation of predefined details of medical history such as previous syncopal events, circumstances of the current event, comorbidities, vital signs, and physical examination on a dedicated syncope-specific case report form.
BMJ Publishing Group Limited (BMJ) disclaims all liability and responsibility arising from any relianceSupplemental material placed on this supplemental material which has been supplied by the author(s) Heart
doi: 10.1136/heartjnl-2020-318430–9.:10 2021;Heart, et al. Zimmermann T
6
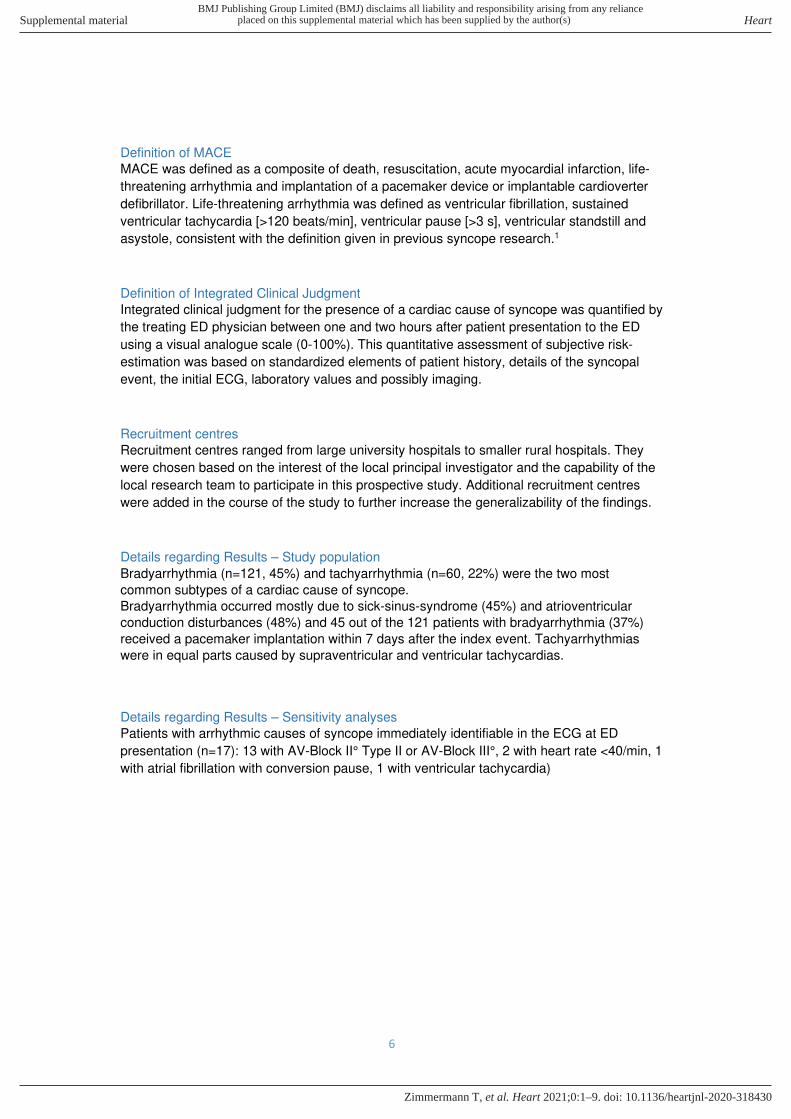
Definition of MACE
MACE was defined as a composite of death, resuscitation, acute myocardial infarction, life-
threatening arrhythmia and implantation of a pacemaker device or implantable cardioverter
defibrillator. Life-threatening arrhythmia was defined as ventricular fibrillation, sustained
ventricular tachycardia [>120 beats/min], ventricular pause [>3 s], ventricular standstill and
asystole, consistent with the definition given in previous syncope research.1
Definition of Integrated Clinical Judgment
Integrated clinical judgment for the presence of a cardiac cause of syncope was quantified by
the treating ED physician between one and two hours after patient presentation to the ED
using a visual analogue scale (0-100%). This quantitative assessment of subjective risk-
estimation was based on standardized elements of patient history, details of the syncopal
event, the initial ECG, laboratory values and possibly imaging.
Recruitment centres
Recruitment centres ranged from large university hospitals to smaller rural hospitals. They
were chosen based on the interest of the local principal investigator and the capability of the
local research team to participate in this prospective study. Additional recruitment centres
were added in the course of the study to further increase the generalizability of the findings.
Details regarding Results – Study population
Bradyarrhythmia (n=121, 45%) and tachyarrhythmia (n=60, 22%) were the two most
common subtypes of a cardiac cause of syncope.
Bradyarrhythmia occurred mostly due to sick-sinus-syndrome (45%) and atrioventricular
conduction disturbances (48%) and 45 out of the 121 patients with bradyarrhythmia (37%)
received a pacemaker implantation within 7 days after the index event. Tachyarrhythmias
were in equal parts caused by supraventricular and ventricular tachycardias.
Details regarding Results – Sensitivity analyses
Patients with arrhythmic causes of syncope immediately identifiable in the ECG at ED
presentation (n=17): 13 with AV-Block II° Type II or AV-Block III°, 2 with heart rate <40/min, 1
with atrial fibrillation with conversion pause, 1 with ventricular tachycardia)
BMJ Publishing Group Limited (BMJ) disclaims all liability and responsibility arising from any relianceSupplemental material placed on this supplemental material which has been supplied by the author(s) Heart
doi: 10.1136/heartjnl-2020-318430–9.:10 2021;Heart, et al. Zimmermann T
7
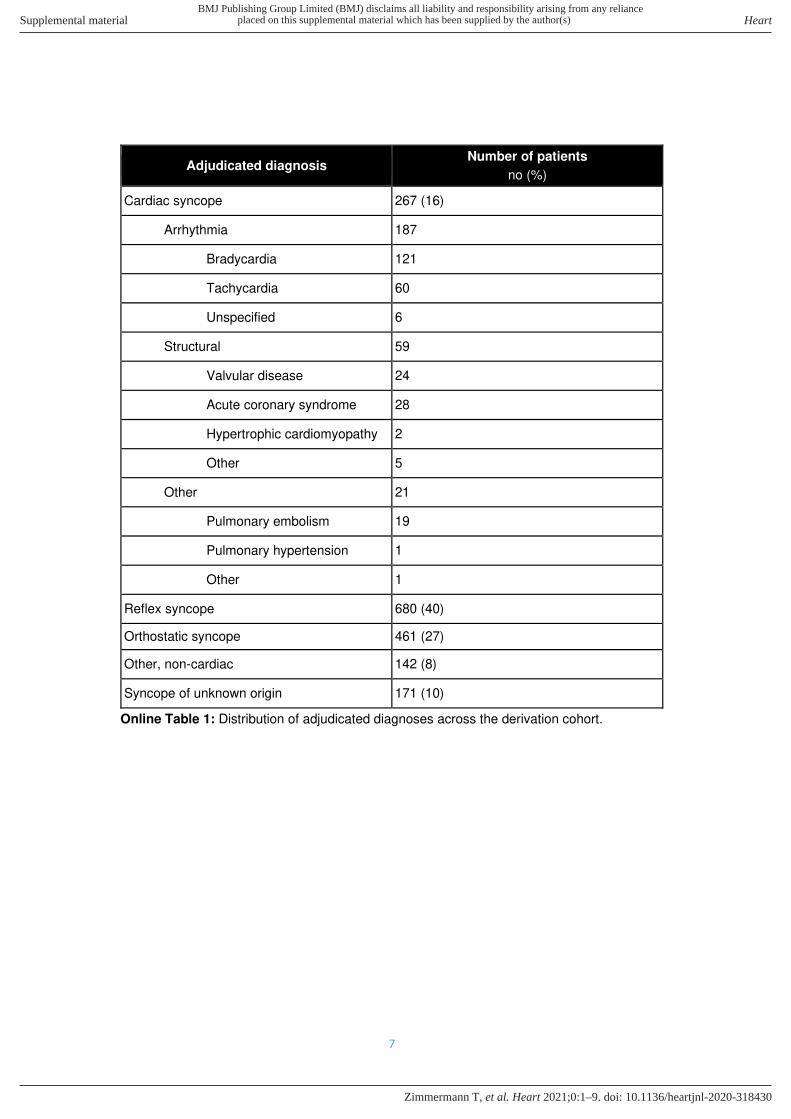
Adjudicated diagnosis Number of patients
no (%)
Cardiac syncope 267 (16)
Arrhythmia 187
Bradycardia 121
Tachycardia 60
Unspecified 6
Structural 59
Valvular disease 24
Acute coronary syndrome 28
Hypertrophic cardiomyopathy 2
Other 5
Other 21
Pulmonary embolism 19
Pulmonary hypertension 1
Other 1
Reflex syncope 680 (40)
Orthostatic syncope 461 (27)
Other, non-cardiac 142 (8)
Syncope of unknown origin 171 (10)
Online Table 1: Distribution of adjudicated diagnoses across the derivation cohort.
BMJ Publishing Group Limited (BMJ) disclaims all liability and responsibility arising from any relianceSupplemental material placed on this supplemental material which has been supplied by the author(s) Heart
doi: 10.1136/heartjnl-2020-318430–9.:10 2021;Heart, et al. Zimmermann T

8
MACE Rule-out Rule-in
Death - 3
Acute myocardial infarction 1 7
PM-/ICD Implantation 1 47
Life-threatening arrhythmia - 18
Resuscitation - -
Online Table 2: MACE within 30 days in the rule-in and rule-out group, as classified by the
ALERT-CS.
BMJ Publishing Group Limited (BMJ) disclaims all liability and responsibility arising from any relianceSupplemental material placed on this supplemental material which has been supplied by the author(s) Heart
doi: 10.1136/heartjnl-2020-318430–9.:10 2021;Heart, et al. Zimmermann T
9
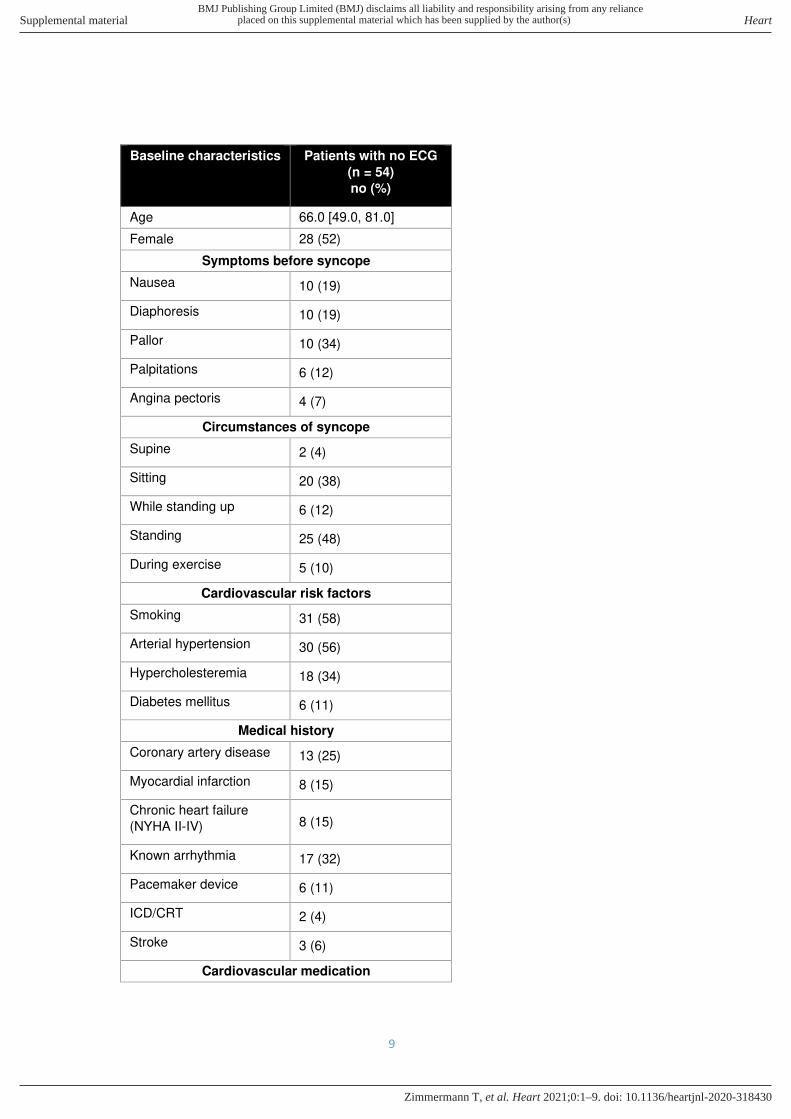
Baseline characteristics Patients with no ECG
(n = 54)
no (%)
Age 66.0 [49.0, 81.0]
Female 28 (52)
Symptoms before syncope
Nausea 10 (19)
Diaphoresis 10 (19)
Pallor 10 (34)
Palpitations 6 (12)
Angina pectoris 4 (7)
Circumstances of syncope
Supine 2 (4)
Sitting 20 (38)
While standing up 6 (12)
Standing 25 (48)
During exercise 5 (10)
Cardiovascular risk factors
Smoking 31 (58)
Arterial hypertension 30 (56)
Hypercholesteremia 18 (34)
Diabetes mellitus 6 (11)
Medical history
Coronary artery disease 13 (25)
Myocardial infarction 8 (15)
Chronic heart failure
(NYHA II-IV) 8 (15)
Known arrhythmia 17 (32)
Pacemaker device 6 (11)
ICD/CRT 2 (4)
Stroke 3 (6)
Cardiovascular medication
BMJ Publishing Group Limited (BMJ) disclaims all liability and responsibility arising from any relianceSupplemental material placed on this supplemental material which has been supplied by the author(s) Heart
doi: 10.1136/heartjnl-2020-318430–9.:10 2021;Heart, et al. Zimmermann T
10
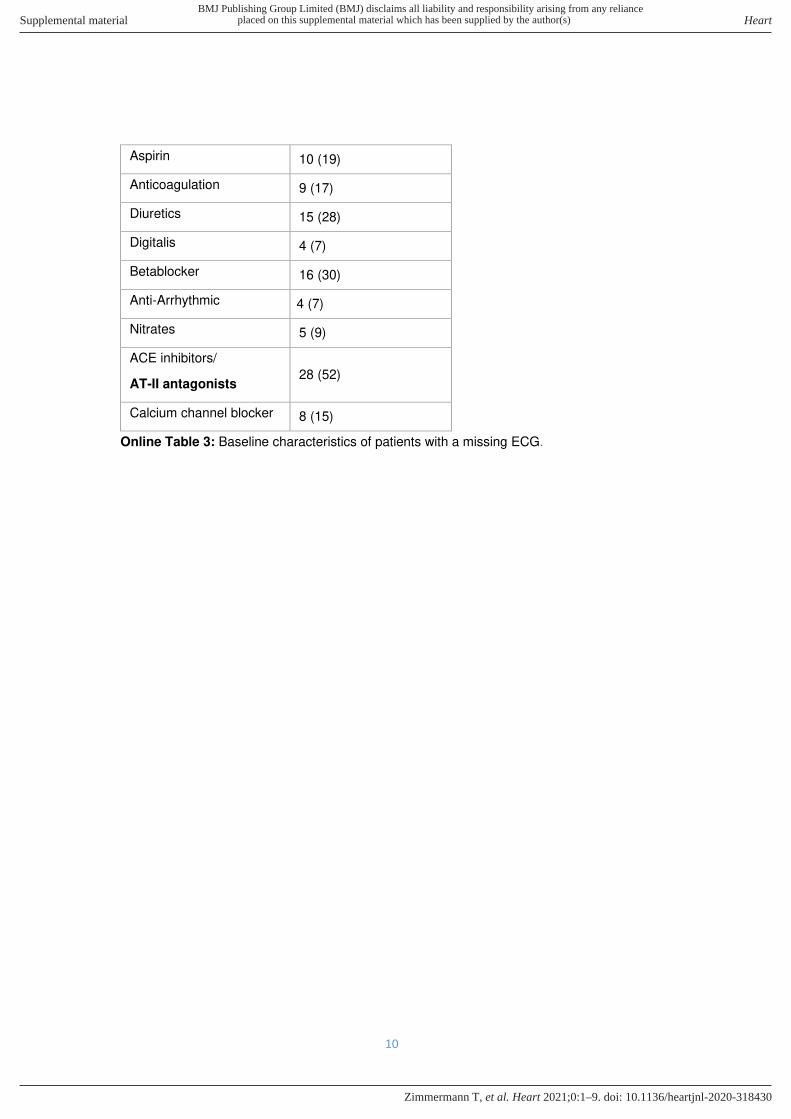
Aspirin 10 (19)
Anticoagulation 9 (17)
Diuretics 15 (28)
Digitalis 4 (7)
Betablocker 16 (30)
Anti-Arrhythmic 4 (7)
Nitrates 5 (9)
ACE inhibitors/
AT-II antagonists 28 (52)
Calcium channel blocker 8 (15)
Online Table 3: Baseline characteristics of patients with a missing ECG.
BMJ Publishing Group Limited (BMJ) disclaims all liability and responsibility arising from any relianceSupplemental material placed on this supplemental material which has been supplied by the author(s) Heart
doi: 10.1136/heartjnl-2020-318430–9.:10 2021;Heart, et al. Zimmermann T
11
Statistical methods
General Statistics
Confidence intervals (CI) of proportions were computed according to Agresti and Coull.2
Areas under the receiver operating characteristic curves (AUC) were used to determine
diagnostic rank discrimination. Confidence intervals (CI) of AUCs and p-values for
comparison of AUCs were calculated according to DeLong.3 For prognostic analyses, the
occurrence of MACE, stratified by different risk groups, is depicted by Kaplan-Meier curves.
Model derivation and calibration
Prolonged PQ-intervals were classified as AV-Block I according to international guidelines.4
However, the PQ-interval was not considered as a potential continuous predictor variable as
it cannot be reliably measured in patients with arrhythmias.
There were no missing values for candidate predictors or outcome variables in the cohort
used for the analyses after excluding all patients who did not have an initial ECG.
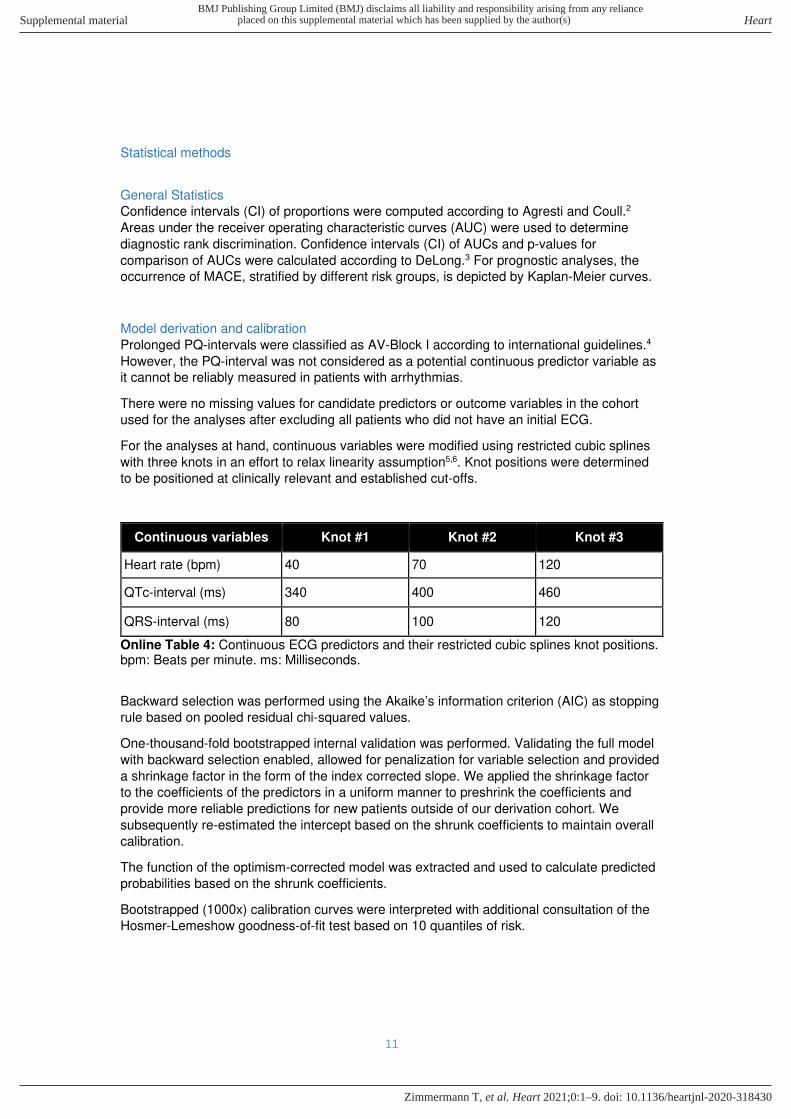
For the analyses at hand, continuous variables were modified using restricted cubic splines
with three knots in an effort to relax linearity assumption5,6. Knot positions were determined
to be positioned at clinically relevant and established cut-offs.
Continuous variables Knot #1 Knot #2 Knot #3
Heart rate (bpm) 40 70 120
QTc-interval (ms) 340 400 460
QRS-interval (ms) 80 100 120
Online Table 4: Continuous ECG predictors and their restricted cubic splines knot positions. bpm: Beats per minute. ms: Milliseconds.
Backward selection was performed using the Akaike’s information criterion (AIC) as stopping
rule based on pooled residual chi-squared values.
One-thousand-fold bootstrapped internal validation was performed. Validating the full model
with backward selection enabled, allowed for penalization for variable selection and provided
a shrinkage factor in the form of the index corrected slope. We applied the shrinkage factor
to the coefficients of the predictors in a uniform manner to preshrink the coefficients and
provide more reliable predictions for new patients outside of our derivation cohort. We
subsequently re-estimated the intercept based on the shrunk coefficients to maintain overall
calibration.
The function of the optimism-corrected model was extracted and used to calculate predicted
probabilities based on the shrunk coefficients.
Bootstrapped (1000x) calibration curves were interpreted with additional consultation of the
Hosmer-Lemeshow goodness-of-fit test based on 10 quantiles of risk.
BMJ Publishing Group Limited (BMJ) disclaims all liability and responsibility arising from any relianceSupplemental material placed on this supplemental material which has been supplied by the author(s) Heart
doi: 10.1136/heartjnl-2020-318430–9.:10 2021;Heart, et al. Zimmermann T
12
Sensitivity analysis
Three predefined sensitivity analyses were performed: first, in the whole cohort, including
patients with a final adjudicated diagnosis of syncope of unknown origin, when considered to
be either of non-cardiac origin or cardiac origin; second, excluding patients with an obvious
arrhythmic cause of syncope (atrioventricular-block type Mobitz Type II, atrioventricular-block
Type III, heart rate below 40/min and ventricular tachycardia, Table 6 in the online-only
Supplement) in the ECG upon ED presentation, in whom no unmet clinical need for new
strategies exists30; third, in all recruited patients, including patients with an adjudicated
diagnosis of non-syncope e.g. epilepsy to evaluate the generalizability of the ECG criteria to
a broader population that may include epilepsy.
External validation
External validation was performed in the SRS cohort. The lack of central diagnostic
adjudication in the external validation cohort required the use of ED discharge diagnoses
“arrhythmic syncope” and “non-arrhythmic, cardiopulmonary syncope” as diagnostic
reference standard (Table 11 in the online-only Supplement). Diagnostic discrimination of the
original prediction model in the validation cohort was assessed by predicting probabilities
based on the regression coefficients determined in the derivation cohort, and is reported as
AUC. Calibration was assessed using calibration curves with a loess-smoothing algorithm
after updating the intercept in the validation cohort to adjust for differences in prevalence of
the outcome measure.7
BMJ Publishing Group Limited (BMJ) disclaims all liability and responsibility arising from any relianceSupplemental material placed on this supplemental material which has been supplied by the author(s) Heart
doi: 10.1136/heartjnl-2020-318430–9.:10 2021;Heart, et al. Zimmermann T
13
Results
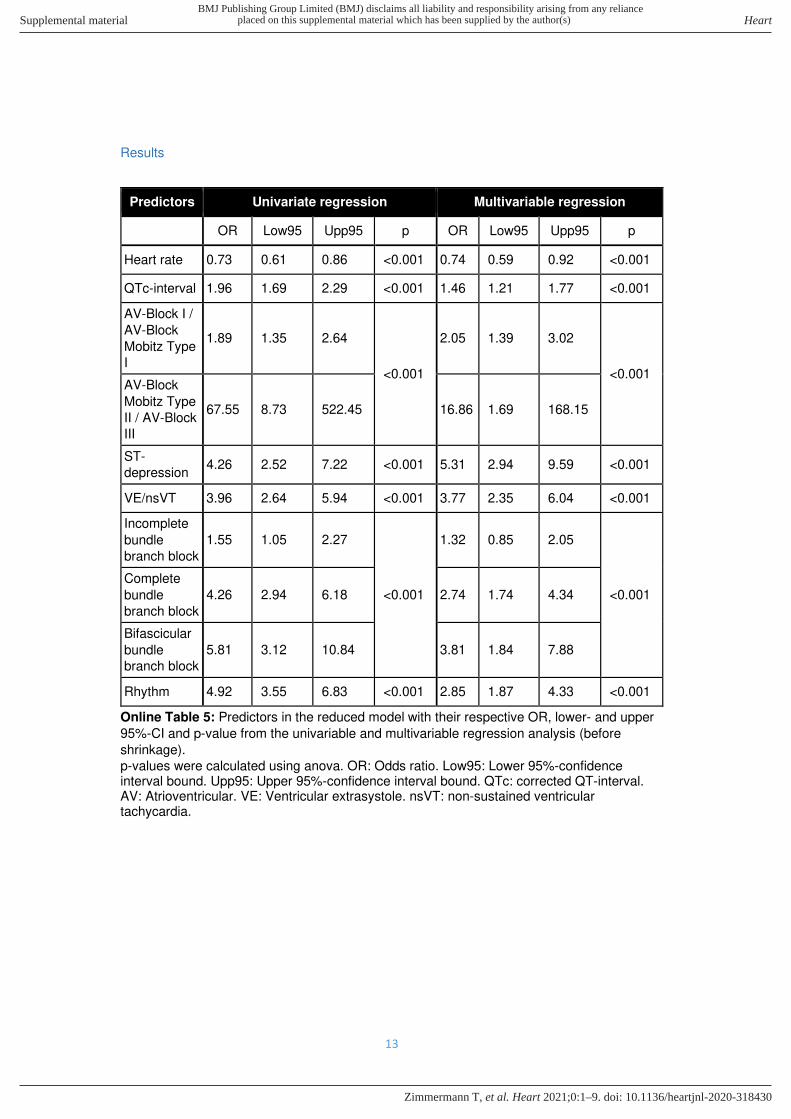
Predictors Univariate regression Multivariable regression
OR Low95 Upp95 p OR Low95 Upp95 p
Heart rate 0.73 0.61 0.86 <0.001 0.74 0.59 0.92 <0.001
QTc-interval 1.96 1.69 2.29 <0.001 1.46 1.21 1.77 <0.001
AV-Block I /
AV-Block
Mobitz Type
I
1.89 1.35 2.64
<0.001
2.05 1.39 3.02
<0.001 AV-Block
Mobitz Type
II / AV-Block
III
67.55 8.73 522.45 16.86 1.69 168.15
ST-
depression 4.26 2.52 7.22 <0.001 5.31 2.94 9.59 <0.001
VE/nsVT 3.96 2.64 5.94 <0.001 3.77 2.35 6.04 <0.001
Incomplete
bundle
branch block
1.55 1.05 2.27
<0.001
1.32 0.85 2.05
<0.001
Complete
bundle
branch block
4.26 2.94 6.18 2.74 1.74 4.34
Bifascicular
bundle
branch block
5.81 3.12 10.84 3.81 1.84 7.88
Rhythm 4.92 3.55 6.83 <0.001 2.85 1.87 4.33 <0.001
Online Table 5: Predictors in the reduced model with their respective OR, lower- and upper
95%-CI and p-value from the univariable and multivariable regression analysis (before
shrinkage).
p-values were calculated using anova. OR: Odds ratio. Low95: Lower 95%-confidence interval bound. Upp95: Upper 95%-confidence interval bound. QTc: corrected QT-interval. AV: Atrioventricular. VE: Ventricular extrasystole. nsVT: non-sustained ventricular tachycardia.
BMJ Publishing Group Limited (BMJ) disclaims all liability and responsibility arising from any relianceSupplemental material placed on this supplemental material which has been supplied by the author(s) Heart
doi: 10.1136/heartjnl-2020-318430–9.:10 2021;Heart, et al. Zimmermann T
14
Overall diagnostic cohort
Patients with no obvious
arrhythmic cause of syncope
upon presentation
ECG criteria Tachy
no. (%)
Brady
no. (%)
p Tachy
no. (%)
Brady
no. (%)
p
n 60 121 59 108
Rhythm 29 (48) 33 (27) 0.007 28 (47) 23 (21) 0.001
Heart rate
(median [IQR])
82.5 [67.8,
106.8]
61.0 [52.0,
73.0] <0.001
82.0
[67.5,
104.0]
63.0
[54.0,
74.2]
<0.001
QTc-interval
(median [IQR])
474.0
[444.5,
503.8]
444.0
[420.0,
467.0]
<0.001
473.0
[443.0,
503.0]
446.5
[424.5,
466.2]
<0.001
AV-Block I / AV-
Block Mobitz
Type I
4 (7) 39 (32) <0.001 4 (7) 38 (35) <0.001
AV-Block Mobitz
Type II / AV-
Block III
0 (0) 10 (8) 0.032 excluded excluded
Incomplete
bundle branch
block
14 (23) 14 (12) 0.050 14 (24) 12 (11) 0.044
Complete bundle
branch block 11 (18) 32 (26) 0.268 11 (19) 25 (23) 0.559
Bifascicular
bundle branch
block
2 (3) 16 (13) 0.037 2 (3) 15 (14) 0.034
ST-depression 4 (7) 10 (8) 1.000 4 (7) 10 (9) 0.772
VE/nsVT 15 (25) 20 (17) 0.230 15 (25) 16 (15) 0.100
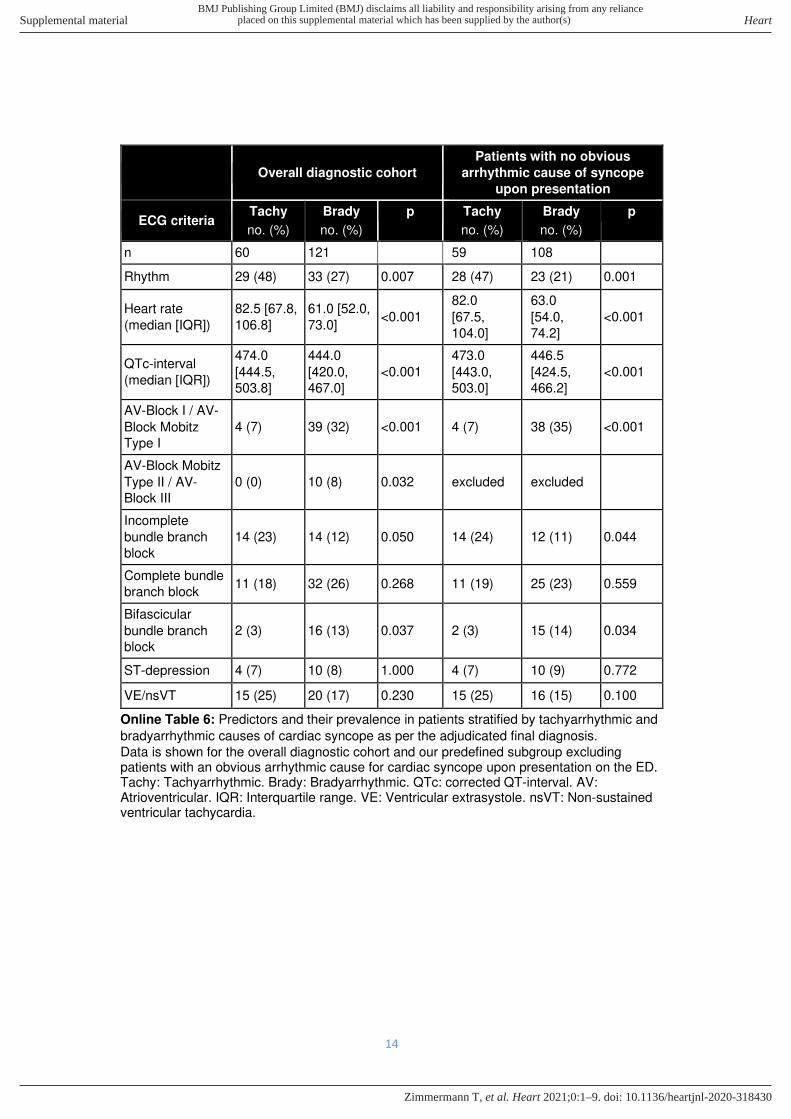
Online Table 6: Predictors and their prevalence in patients stratified by tachyarrhythmic and
bradyarrhythmic causes of cardiac syncope as per the adjudicated final diagnosis.
Data is shown for the overall diagnostic cohort and our predefined subgroup excluding patients with an obvious arrhythmic cause for cardiac syncope upon presentation on the ED. Tachy: Tachyarrhythmic. Brady: Bradyarrhythmic. QTc: corrected QT-interval. AV: Atrioventricular. IQR: Interquartile range. VE: Ventricular extrasystole. nsVT: Non-sustained ventricular tachycardia.
BMJ Publishing Group Limited (BMJ) disclaims all liability and responsibility arising from any relianceSupplemental material placed on this supplemental material which has been supplied by the author(s) Heart
doi: 10.1136/heartjnl-2020-318430–9.:10 2021;Heart, et al. Zimmermann T
15
A)
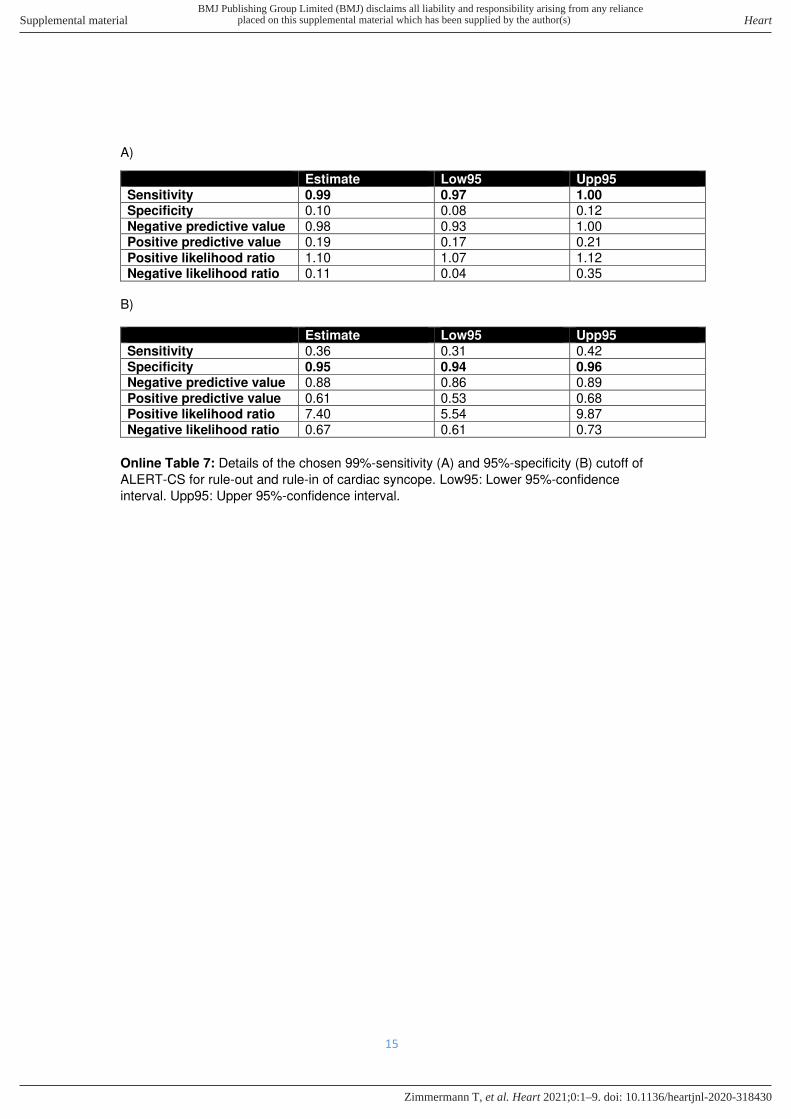
Estimate Low95 Upp95 Sensitivity 0.99 0.97 1.00 Specificity 0.10 0.08 0.12 Negative predictive value 0.98 0.93 1.00 Positive predictive value 0.19 0.17 0.21 Positive likelihood ratio 1.10 1.07 1.12 Negative likelihood ratio 0.11 0.04 0.35
B) Estimate Low95 Upp95 Sensitivity 0.36 0.31 0.42 Specificity 0.95 0.94 0.96 Negative predictive value 0.88 0.86 0.89 Positive predictive value 0.61 0.53 0.68 Positive likelihood ratio 7.40 5.54 9.87 Negative likelihood ratio 0.67 0.61 0.73
Online Table 7: Details of the chosen 99%-sensitivity (A) and 95%-specificity (B) cutoff of
ALERT-CS for rule-out and rule-in of cardiac syncope. Low95: Lower 95%-confidence
interval. Upp95: Upper 95%-confidence interval.
BMJ Publishing Group Limited (BMJ) disclaims all liability and responsibility arising from any relianceSupplemental material placed on this supplemental material which has been supplied by the author(s) Heart
doi: 10.1136/heartjnl-2020-318430–9.:10 2021;Heart, et al. Zimmermann T
16
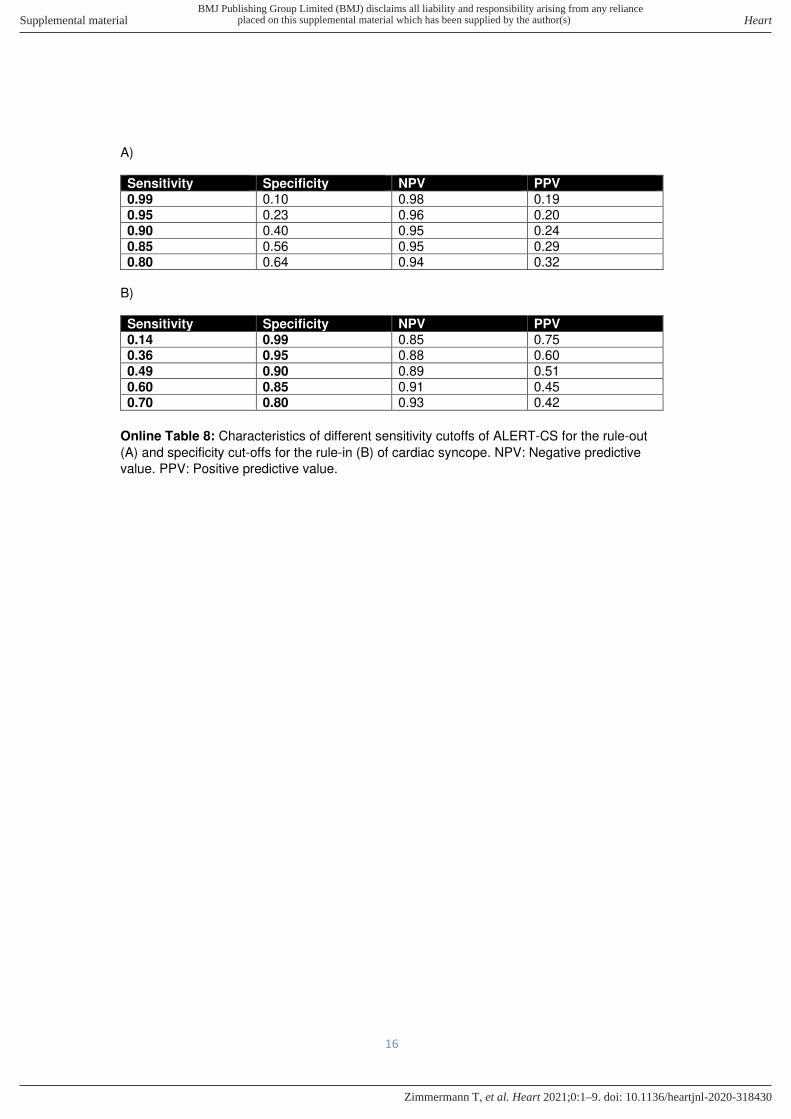
A) Sensitivity Specificity NPV PPV 0.99 0.10 0.98 0.19 0.95 0.23 0.96 0.20 0.90 0.40 0.95 0.24 0.85 0.56 0.95 0.29 0.80 0.64 0.94 0.32
B) Sensitivity Specificity NPV PPV 0.14 0.99 0.85 0.75 0.36 0.95 0.88 0.60 0.49 0.90 0.89 0.51 0.60 0.85 0.91 0.45 0.70 0.80 0.93 0.42
Online Table 8: Characteristics of different sensitivity cutoffs of ALERT-CS for the rule-out
(A) and specificity cut-offs for the rule-in (B) of cardiac syncope. NPV: Negative predictive
value. PPV: Positive predictive value.
BMJ Publishing Group Limited (BMJ) disclaims all liability and responsibility arising from any relianceSupplemental material placed on this supplemental material which has been supplied by the author(s) Heart
doi: 10.1136/heartjnl-2020-318430–9.:10 2021;Heart, et al. Zimmermann T
17
Study details (validation cohort)
Validation cohort – Improving Risk Stratification in Older Adults (SRS) Study
The SRS Study (Improving Syncope Risk Stratification in Older Adults, NCT01802398) is a multi-site prospective observational cohort study which enrolled older adults (≥60 years of age) at 11 United States EDs who presented with the primary chief complaint of syncope or near syncope as confirmed by the treating physician. The study ended upon attaining enrollment goals. The study was approved by the institutional review boards at all sites. Written informed consent was obtained from subjects or their legally authorized representative. This study was supported by by the National Heart, Lung, and Blood Institute of the National Institutes of Health under Award Number R01HL111033.
Study Setting and Population Eligible patients were screened and enrolled at 11 United States EDs between April 28, 2013 and September 21, 2016. Patient inclusion criteria for eligibility were age ≥60 years presenting with a chief complaint of syncope or near syncope as determined by the treating physician. Participating subjects agreed to have blood drawn for biomarkers. Syncope was defined as a transient loss of consciousness with loss of postural tone followed by spontaneous and complete recovery. This definition was the same as the one used in the BASEL IX study (main cohort). Near-syncope was defined as the sensation of imminent loss of postural tone without loss of consciousness. For the present validation, patients were only included if they had an ECG reading of sufficient quality available. Patients who presented with seizure, stroke, transient ischemic attack (TIA), head trauma, intoxication from drugs or alcohol, or hypoglycemia as the presumptive cause of symptoms were excluded. Patients with persistent confusion relative to baseline mental status and those who required medical or electrical interventions (e.g., intravenous glucose, defibrillation) to restore consciousness or with prior enrollment were also excluded. To minimize attrition, patients unlikely to complete follow-up, including those who lacked phone access, lacked a permanent address, or did not speak either English or Spanish were excluded. Patients or those with legally authorized representatives who were unable or unwilling to provide informed consent or follow-up information were also excluded.
Study Protocol Consistent with published research reporting guidelines pertaining to syncope risk-stratification, all participating patients underwent a standardized evaluation, including history, physical exam, and an initial 12-lead ECG. Clinical testing at the participating hospitals was at the sole discretion of the clinical providers, and patient disposition was unaffected by this protocol. Research personnel collected objective information about age, gender, and triage vital signs from the ED electronic medical record and symptom data directly from the patients or their legally authorized representatives. The treating physician provided information about co-morbidities, exam findings and physician risk assessment. All 12-lead ECGs were initially interpreted by a study physician both locally and at the coordinating centre, however for the current analysis, all ECGs were re-interpreted by study physicians of the BASEL IX study. All local patient records were reviewed for subsequent hospital visits, serious cardiac out- comes, and death within 30-days of the index ED visit by site physician investigators. Follow-up phone calls performed by the coordinating centre at 30 days identified additional medical visits and 30 day serious outcomes. Medical records were obtained and reviewed by the coordinating centre for these visits. To assess inter-rater reliability of chart review, records for the first 5 sequentially enrolled patients at each of the 10 external sites (excluding the coordinating centre) were independently reviewed by local research staff and the coordinating centre. The specific number of charts chosen for this review was restricted by availability of research staff
BMJ Publishing Group Limited (BMJ) disclaims all liability and responsibility arising from any relianceSupplemental material placed on this supplemental material which has been supplied by the author(s) Heart
doi: 10.1136/heartjnl-2020-318430–9.:10 2021;Heart, et al. Zimmermann T
18
resources. All 5 serious cardiac outcomes in the training set were identified by local site reviewers.
Outcome definition
The SRS study predefined serious cardiac events. These included: sustained ventricular
arrhythmia (>30 seconds) or symptomatic ventricular tachycardia; sinus pause ≥3 seconds; third- degree or Mobitz II atrioventricular block; symptomatic supraventricular tachycardia
pacemaker / defibrillator malfunctions; symptomatic bradycardia (heart rate ≤40 beats per minute); myocardial infarction as defined by the universal definition8; a new diagnosis of
severe aortic stenosis (area ≤0.9 cm2); severe pulmonary hypertension; hypertrophic
cardiomyopathy, or atrial mass causing outflow obstruction; aortic dissection; and pulmonary
embolism. Symptomatic was defined as the “simultaneous occurrence of dizziness,
lightheadedness, hypotension (systolic blood pressure <90 mm Hg), or syncope with an
arrhythmia on ECG monitoring”. Atrial fibrillation, atrial flutter, paroxysmal atrial tachycardia
and supraventricular tachycardia were all included in the category of supraventricular
tachycardia if symptomatic. Research staff coded serious cardiac events as identified during
or after the index ED visit.
In order to validate the prognostic accuracy of the ALERT-CS, similar MACE definitions in the SRS study cohort were used: MACE was therefore defined as the occurrence of all-cause death, a symptomatic pacemaker or ICD dysfunction, a symptomatic sinus pause > 3 seconds, an episode of ventricular fibrillation or ventricular tachycardia lasting >30 seconds (the latter four being considered as life-threatening arrhythmia, as defined in the BASEL IX study), a pacemaker or ICD implantation, the need for resuscitation and acute myocardial infarction, whichever came first.
BMJ Publishing Group Limited (BMJ) disclaims all liability and responsibility arising from any relianceSupplemental material placed on this supplemental material which has been supplied by the author(s) Heart
doi: 10.1136/heartjnl-2020-318430–9.:10 2021;Heart, et al. Zimmermann T
19
Baseline characteristics
Overall validation
cohort
(n=2214)
no. (%)
Overall derivation
cohort
(n=1721)
no. (%)
Age (median [IQR]) 72.0 [65.0, 79.8] 71.0 [58.0, 80.0]
Female 1055 (48) 693 (40)
Symptoms before syncope
Palpitations 230 (10) 117 (7)
Angina pectoris 168 (8) 101 (6)
Circumstances of syncope
Supine 49 (2) 43 (3)
During exertion 372 (17) 143 (8)
Standing 621 (28) 769 (45)
Sitting 830 (37) 675 (40)
Cardiovascular risk factors
Diabetes mellitus 531 (24) 256 (15)
Arterial Hypertension 1420 (64) 1031 (60)
Medical history
Chronic heart failure 254 (11) 127 (8)
Coronary artery disease 584 (26) 379 (22)
Pacemaker 156 (7) 80 (5)
ICD/CRT 99 (4) 46 (3)
Stroke 261 (12) 143 (8)
Known arrhythmia 454 (21) 369 (22)
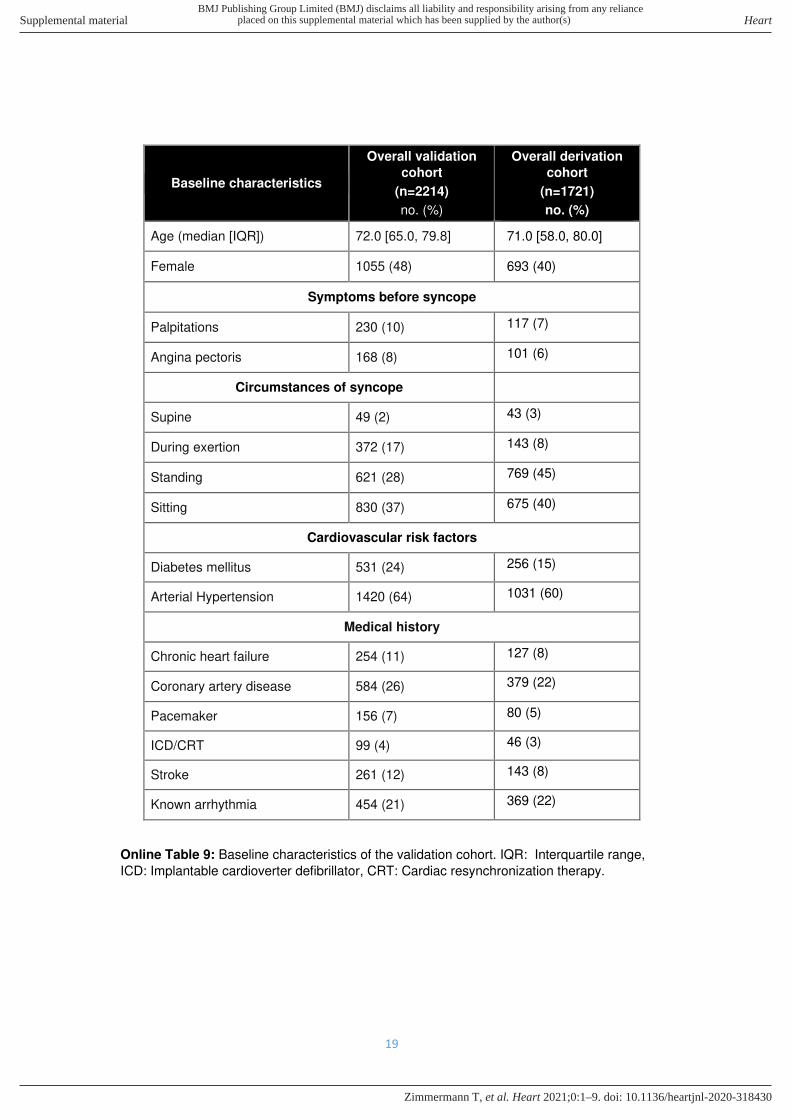
Online Table 9: Baseline characteristics of the validation cohort. IQR: Interquartile range,
ICD: Implantable cardioverter defibrillator, CRT: Cardiac resynchronization therapy.
BMJ Publishing Group Limited (BMJ) disclaims all liability and responsibility arising from any relianceSupplemental material placed on this supplemental material which has been supplied by the author(s) Heart
doi: 10.1136/heartjnl-2020-318430–9.:10 2021;Heart, et al. Zimmermann T
20
Grouped ECG
Predictors
(Validation cohort)
Overall
(n=2214)
no. (%)
Non Cardiac
(n=2008)
no. (%)
Cardiac
(n=206)
no. (%)
p
Non-Sinus rhythm 294 (13) 216 (11) 78 (38) <0.001
Heart rate (median [IQR]) 72.0 [62.0, 83.0] 71.0 [63.0, 83.0]
74.0 [61.0,
91.8] 0.039
QTc-interval (median [IQR])
446.0 [426.0,
469.0]
445.0 [426.0,
467.2]
459.0 [433.0,
485.8] <0.001
AV-Block I /
AV-Block Mobitz Type I 318 (14) 276 (14) 42 (20) 0.012
AV-Block Mobitz Type II /
AV-Block III 6 (0) 2 (0) 4 (2) 0.001
Incomplete bundle branch block
376 (17) 337 (17) 39 (19) 0.436
Complete bundle branch block
217 (10) 182 (9) 35 (17) 0.001
Bifascicular bundle branch block
82 (4) 67 (3) 15 (7) 0.010
ST-depression 105 (5) 86 (4) 19 (9) 0.003
VE/nsVT 191 (9) 162 (8) 29 (14) 0.006
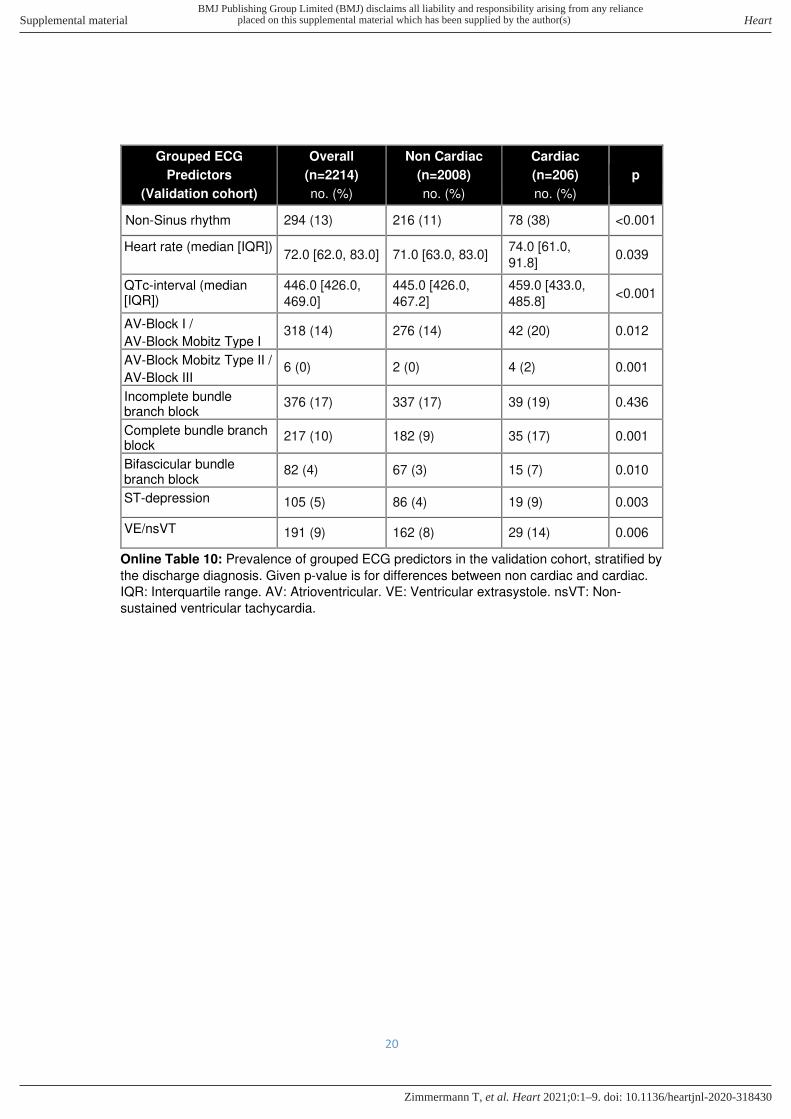
Online Table 10: Prevalence of grouped ECG predictors in the validation cohort, stratified by
the discharge diagnosis. Given p-value is for differences between non cardiac and cardiac.
IQR: Interquartile range. AV: Atrioventricular. VE: Ventricular extrasystole. nsVT: Non-
sustained ventricular tachycardia.
BMJ Publishing Group Limited (BMJ) disclaims all liability and responsibility arising from any relianceSupplemental material placed on this supplemental material which has been supplied by the author(s) Heart
doi: 10.1136/heartjnl-2020-318430–9.:10 2021;Heart, et al. Zimmermann T
21
Discharge diagnosis Number of patients
no (%)
Arrhythmia 159 (7)
Non-arrhythmic, cardiopulmonary 47 (2)
Epilepsy 7 (<1)
Stroke / Transient Ischemic Attack (TIA) 7 (<1)
Orthostatic 479 (22)
Other 213 (10)
Reflex 408 (18)
Severe anemia 59 (3)
Unknown 836 (38)
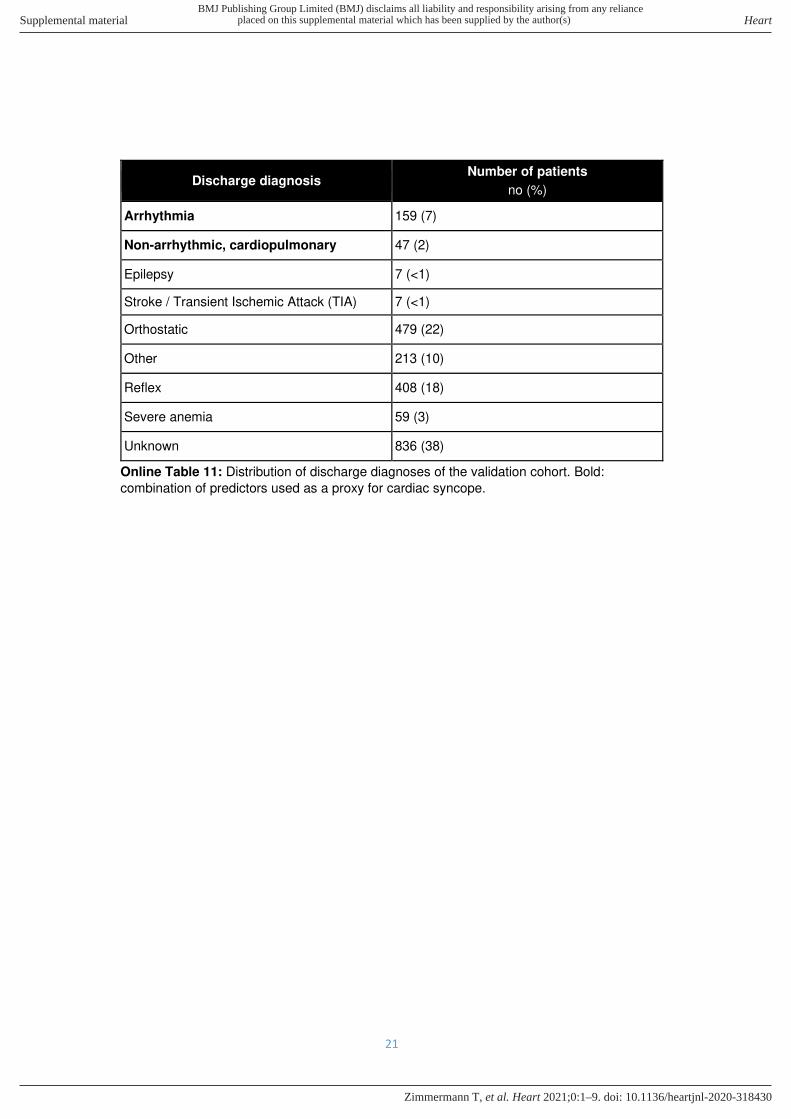
Online Table 11: Distribution of discharge diagnoses of the validation cohort. Bold:
combination of predictors used as a proxy for cardiac syncope.
BMJ Publishing Group Limited (BMJ) disclaims all liability and responsibility arising from any relianceSupplemental material placed on this supplemental material which has been supplied by the author(s) Heart
doi: 10.1136/heartjnl-2020-318430–9.:10 2021;Heart, et al. Zimmermann T

22
Validation of the ALERT-CS: Results
Applying the ALERT-CS to the validation cohort (using ED discharge diagnoses as diagnostic reference standard) showed similar diagnostic discrimination to that in the derivation cohort (AUC 0.76, 95%CI 0.73-0.79, Figure 3 in the online-only Supplement). The calibration curve in the validation cohort showed a tendency towards over-estimating the risk for cardiac syncope (Figure 4 in the online-only Supplement). The incidence of MACE was lower in the SRS study with MACE occurring in only 6% (n=132) of patients (vs 10% (n=175) in the derivation cohort), while death occurred in 1% of patients in both cohorts. Prognostic verification in the validation cohort with adapted cut-offs for rule-in (26.0% for 95% Specificity) and rule-out (2.1% for 99% Sensitivity) overall confirmed the results of our derivation cohort (Figure 5 in the online-only Supplement).
BMJ Publishing Group Limited (BMJ) disclaims all liability and responsibility arising from any relianceSupplemental material placed on this supplemental material which has been supplied by the author(s) Heart
doi: 10.1136/heartjnl-2020-318430–9.:10 2021;Heart, et al. Zimmermann T
BMJ Publishing Group Limited (BMJ) disclaims all liability and responsibility arising from any relianceSupplemental material placed on this supplemental material which has been supplied by the author(s) Heart
doi: 10.1136/heartjnl-2020-318430–9.:10 2021;Heart, et al. Zimmermann T
BMJ Publishing Group Limited (BMJ) disclaims all liability and responsibility arising from any relianceSupplemental material placed on this supplemental material which has been supplied by the author(s) Heart
doi: 10.1136/heartjnl-2020-318430–9.:10 2021;Heart, et al. Zimmermann T
BMJ Publishing Group Limited (BMJ) disclaims all liability and responsibility arising from any relianceSupplemental material placed on this supplemental material which has been supplied by the author(s) Heart
doi: 10.1136/heartjnl-2020-318430–9.:10 2021;Heart, et al. Zimmermann T
BMJ Publishing Group Limited (BMJ) disclaims all liability and responsibility arising from any relianceSupplemental material placed on this supplemental material which has been supplied by the author(s) Heart
doi: 10.1136/heartjnl-2020-318430–9.:10 2021;Heart, et al. Zimmermann T
BMJ Publishing Group Limited (BMJ) disclaims all liability and responsibility arising from any relianceSupplemental material placed on this supplemental material which has been supplied by the author(s) Heart
doi: 10.1136/heartjnl-2020-318430–9.:10 2021;Heart, et al. Zimmermann T

28
Used R packages
In alphabetical order:
- CalibrationCurves - epiR - flextable - foreign - generalhoslem - ggplot2 - ggsignif - gridExtra - haven - lubridate - officer - pROC - rms - shiny - shinyjs - shinyWidgets - survival - survminer - tableone - tidytidbits - tidyverse
Disclaimer
The authors designed the study and vouch for the accuracy and completeness of the data and
analysis. They wrote the manuscript and made the decision to submit it for publication.
BMJ Publishing Group Limited (BMJ) disclaims all liability and responsibility arising from any relianceSupplemental material placed on this supplemental material which has been supplied by the author(s) Heart
doi: 10.1136/heartjnl-2020-318430–9.:10 2021;Heart, et al. Zimmermann T
29
Bibliography
1. Reed MJ, Newby DE, Coull AJ, Prescott RJ, Jacques KG, Gray AJ. The ROSE (Risk Stratification of Syncope in the Emergency Department) Study. J Am Coll Cardiol. 2010;55(8):713-721. doi:10.1016/j.jacc.2009.09.049
2. Agresti A, Coull BA. Approximate Is Better than “Exact” for Interval Estimation of Binomial Proportions. 1998;52(2):119-126. http://links.jstor.org/sici?sici=0003-1305%28199805%2952%3A2%3C119%3AAIBT%22F%3E2.0.CO%3B2-S.
3. DeLong ER, DeLong DM, Clarke-Pearson DL. Comparing the areas under two or more correlated receiver operating characteristic curves: a nonparametric approach. Biometrics. 1988;44(3):837-845.
4. Tracy CM, Epstein AE, Darbar D, et al. 2012 ACCF/AHA/HRS focused update of the 2008 guidelines for device-based therapy of cardiac rhythm abnormalities. J Thorac Cardiovasc Surg. 2012;144(6):e127-e145. doi:10.1016/j.jtcvs.2012.08.032
5. Stone CJ, Koo CY. Additive Splines in Statistics. Proc Stat Comput Sect ASA. 1985:45-48. doi:10.1002/(SICI)1097-4598(199705)20:5<616::AID-MUS14>3.0.CO;2-U
6. Stone CJ. Comment: Generalized additive models. Stat Sci. 1986;1(420):312-314. doi:10.1214/aos/1176348654
7. Steyerberg EW, Borsboom GJJM, van Houwelingen HC, Eijkemans MJC, Habbema JDF. Validation and updating of predictive logistic regression models: A study on sample size and shrinkage. Stat Med. 2004;23(16):2567-2586. doi:10.1002/sim.1844
8. Thygesen K, Alpert JS, White HD. Universal definition of myocardial infarction. Circulation. 2007;116(22):2634-2653. doi:10.1161/CIRCULATIONAHA.107.187397
BMJ Publishing Group Limited (BMJ) disclaims all liability and responsibility arising from any relianceSupplemental material placed on this supplemental material which has been supplied by the author(s) Heart
doi: 10.1136/heartjnl-2020-318430–9.:10 2021;Heart, et al. Zimmermann T