Embed Size (px)
Citation preview

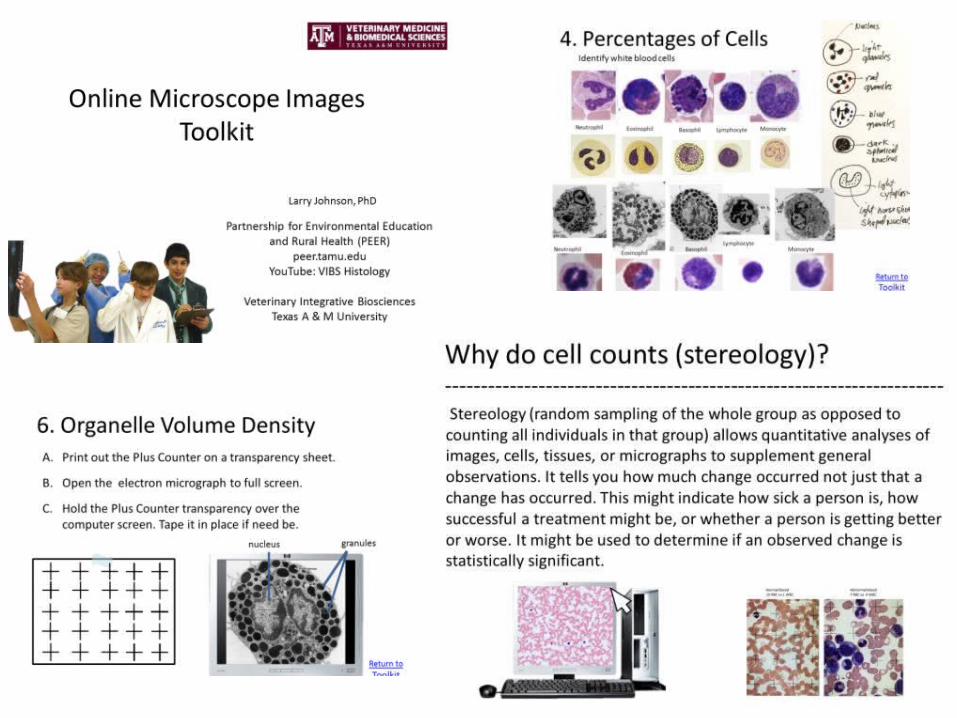
Online Microscope ImagesToolkit
Partnership for Environmental Education and Rural Health (PEER)
peer.tamu.eduYouTube: VIBS Histology
Veterinary Integrative BiosciencesTexas A & M University
Larry Johnson, PhD
YouTube video of toolkithttp://www.youtube.com/vibshistology
Toolkit Contents
1. Operating Online Microscope Images
2. Cell Count
3. Cell/Tissue Volume Density
4. Percentages of Cells
5. Diameter of Cells
6. Organelle Volume Density
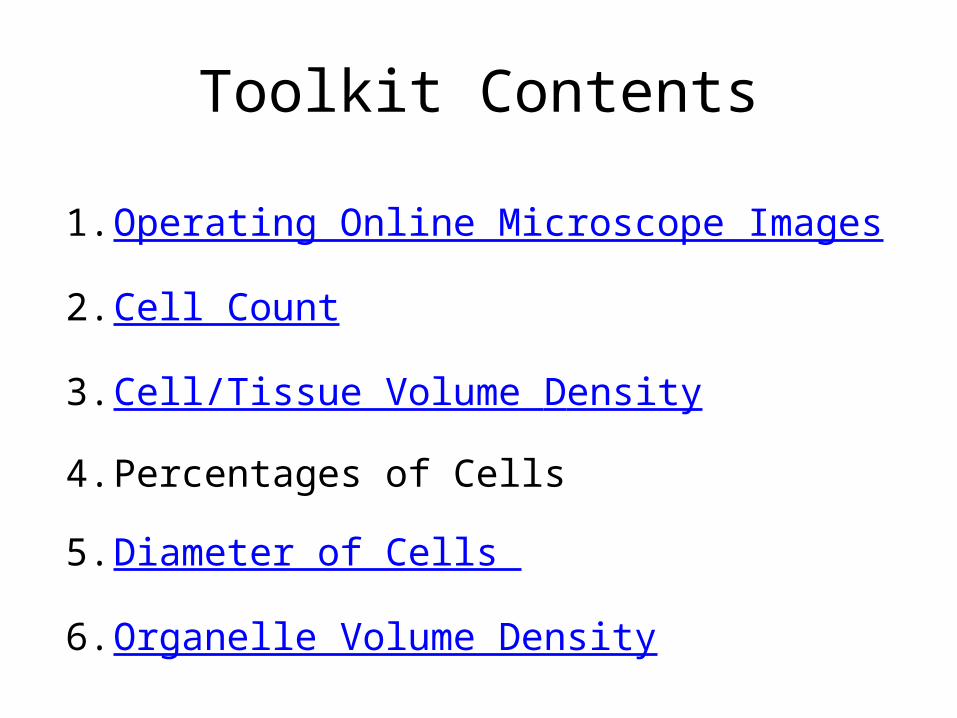
Why do cell counts (stereology)?---------------------------------------------------------------------- Stereology (random independent sampling of the whole group as opposed to counting all individuals in that group) allows quantitative analyses of images, cells, tissues, or micrographs to supplement general observations. It tells you how much change occurred not just that a change has occurred. This might indicate how sick a person is, how successful a treatment might be, or whether a person is getting better or worse. It might be used to determine if an observed change is statistically significant.
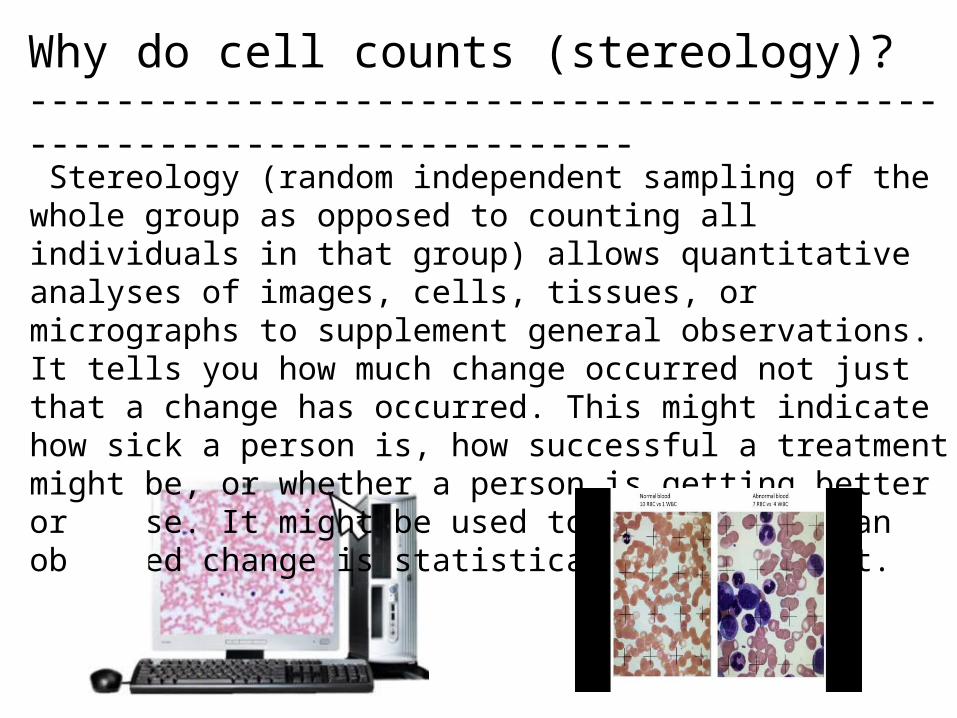
Why do stereology and integrate technology and math (STEM) in science?---------------------------------------------------------------------------
Use of this toolkit gives students an opportunity to evaluate microscopic images where they interact with images of specimens (each student makes his/her own measurements) and use technology to do so as they integrate math and science. They see the value of and use math in scientific investigation to determine the amount of difference between samples. One might hypothesize that abnormal blood has 10 to 100 times the concentration of white blood cells as does the normal blood, but does the conclusion of the stereological analyses agree?
Calculations/technology
1. Operating Microscope Images
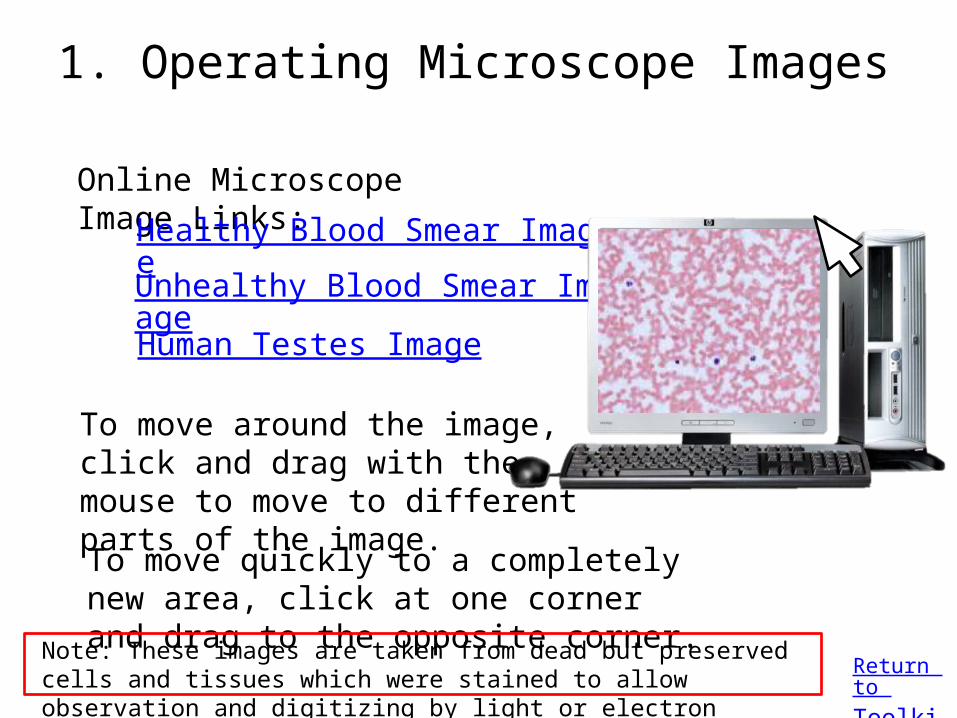
Online Microscope Image Links:
Healthy Blood Smear Image
Unhealthy Blood Smear Image
To move around the image, click and drag with the mouse to move to different parts of the image.
To move quickly to a completely new area, click at one corner and drag to the opposite corner.
Return to Toolkit
Human Testes Image
Note: These images are taken from dead but preserved cells and tissues which were stained to allow observation and digitizing by light or electron microscopy.
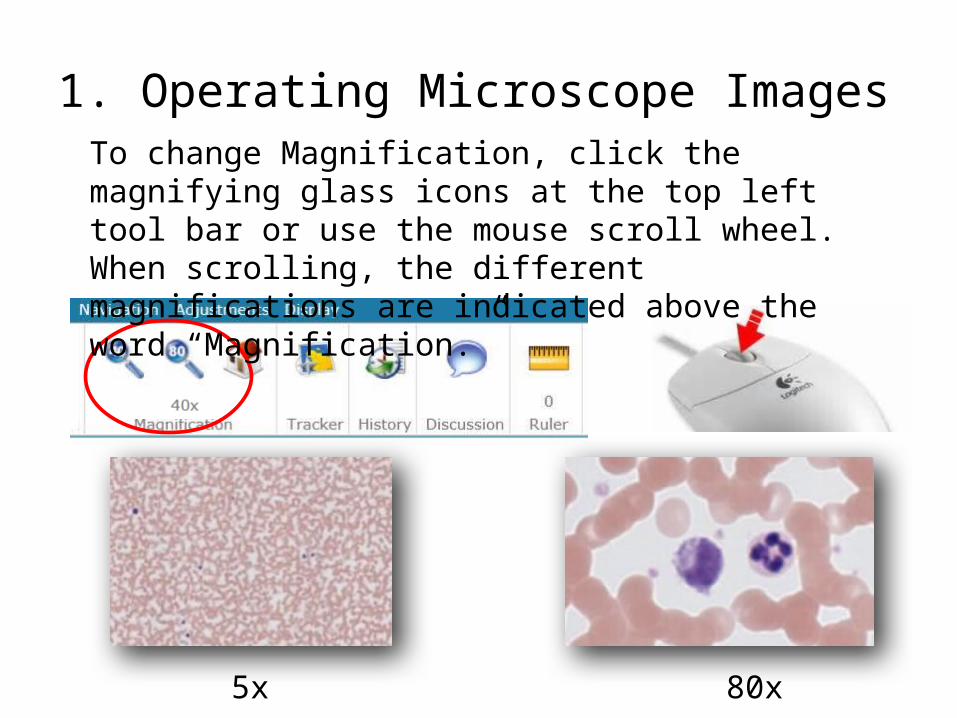
1. Operating Microscope Images To change Magnification, click the magnifying glass icons at the top left tool bar or use the mouse scroll wheel. When scrolling, the different magnifications are indicated above the word “Magnification.”
5x 80x
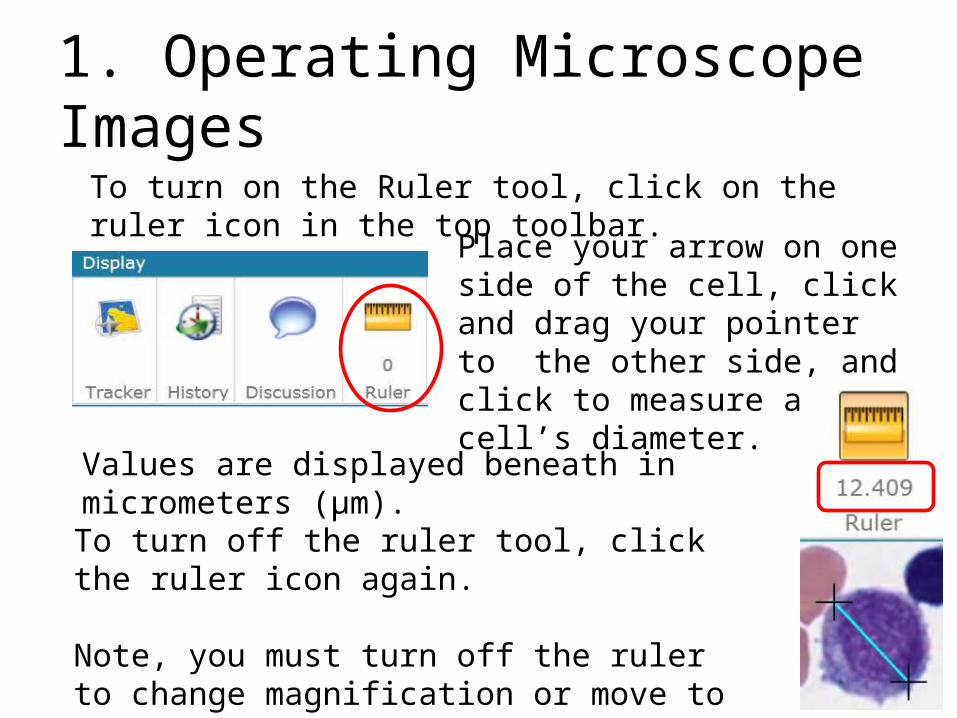
1. Operating Microscope Images To turn on the Ruler tool, click on the ruler icon in the top toolbar.
Place your arrow on one side of the cell, click and drag your pointer to the other side, and click to measure a cell’s diameter.
Values are displayed beneath in micrometers (µm).
To turn off the ruler tool, click the ruler icon again. Note, you must turn off the ruler to change magnification or move to a different area.
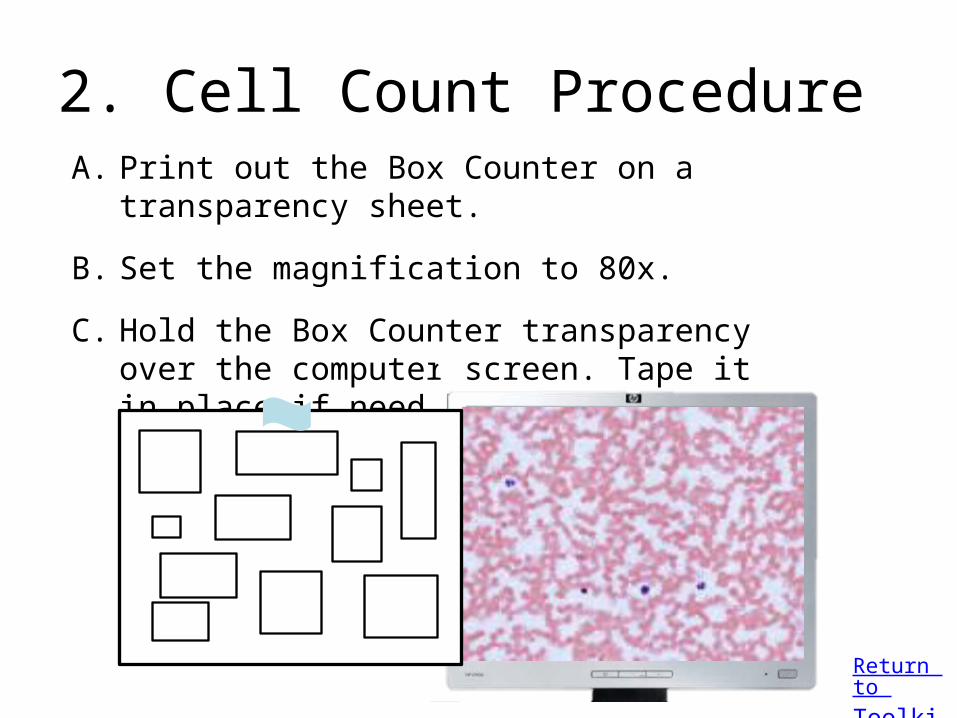
2. Cell Count ProcedureA. Print out the Box Counter on a transparency sheet.
B. Set the magnification to 80x.
C. Hold the Box Counter transparency over the computer screen. Tape it in place if need be.
Return to Toolkit
2. Cell Count Procedure
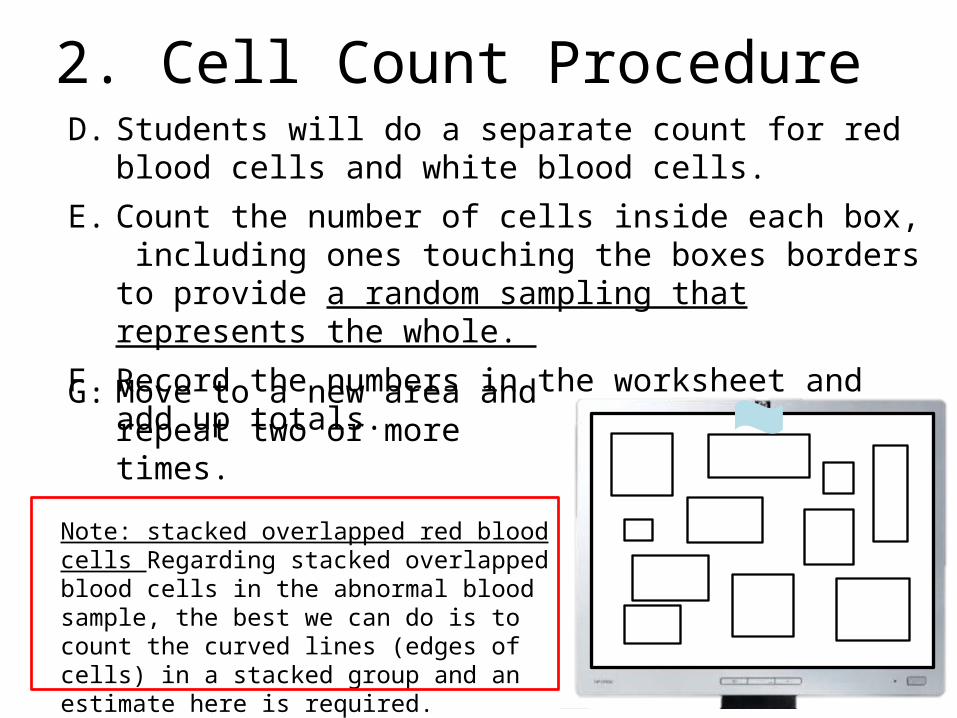
A. Print out the Box Counter on a transparency sheet. B. Set the magnification to 80x. C. Hold the Box Counter transparency over the computer screen. Tape it in place if need be. D. Students will do a separate count for red blood cells and white blood cells.
E. Count the number of cells inside each box, including ones touching the boxes borders. F. Record the numbers in the worksheet and add up totals.
G. Move to a new area and repeat two or more times.
A. Print out the Box Counter on a transparency sheet. B. Set the magnification to 80x. C. Hold the Box Counter transparency over the computer screen. Tape it in place if need be.
D. Students will do a separate count for red blood cells and white blood cells.
E. Count the number of cells inside each box, including ones touching the boxes borders to provide a random sampling that represents the whole.
F. Record the numbers in the worksheet and add up totals.
Note: stacked overlapped red blood cells Regarding stacked overlapped blood cells in the abnormal blood sample, the best we can do is to count the curved lines (edges of cells) in a stacked group and an estimate here is required.
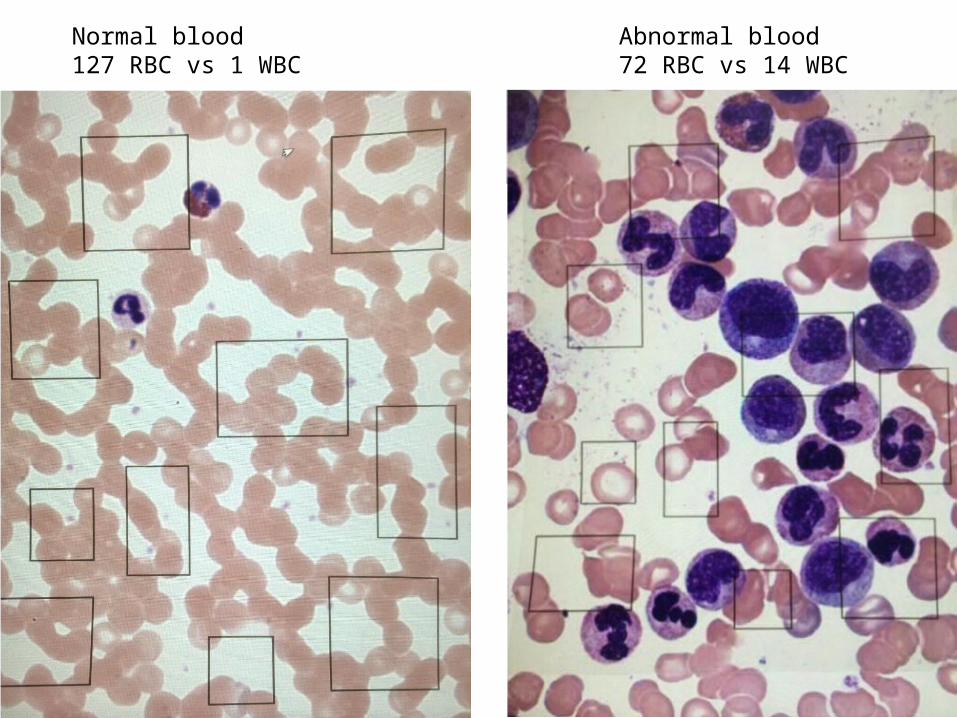
Normal blood127 RBC vs 1 WBC
Abnormal blood72 RBC vs 14 WBC
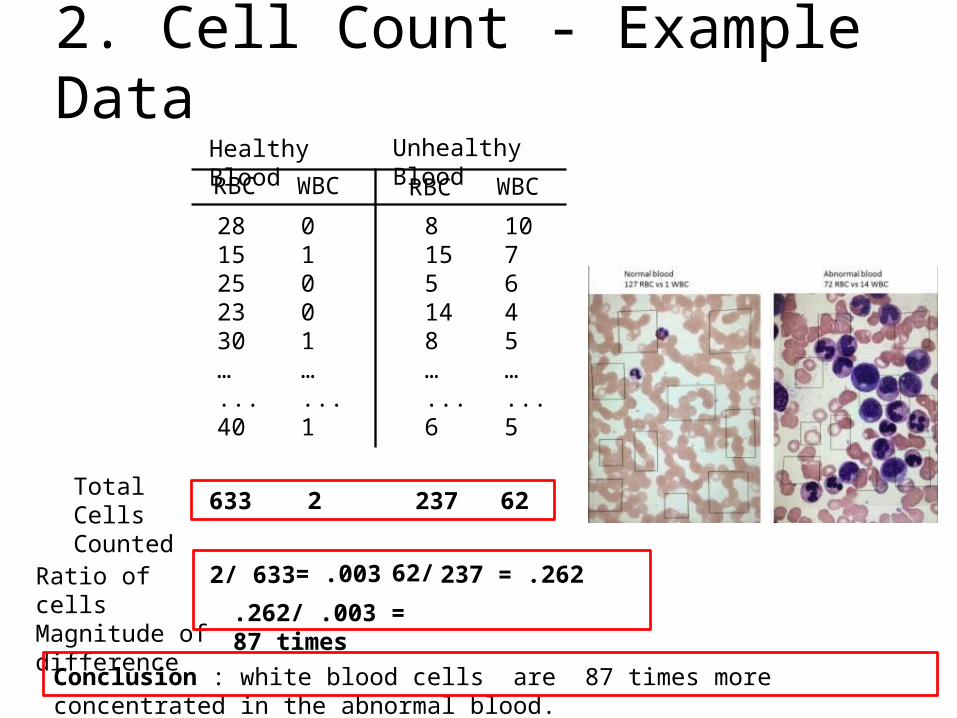
2. Cell Count - Example DataHealthy Blood Unhealthy Blood
RBC RBC WBC WBC
2815252330…...40
01001…...1
8155148…...6
107645…...5
Total Cells Counted 633 2 237 62
Ratio of cellsMagnitude of difference
2/ 633 = .003 62/ 237 = .262
.262/ .003 = 87 times
Conclusion : white blood cells are 87 times more concentrated in the abnormal blood.
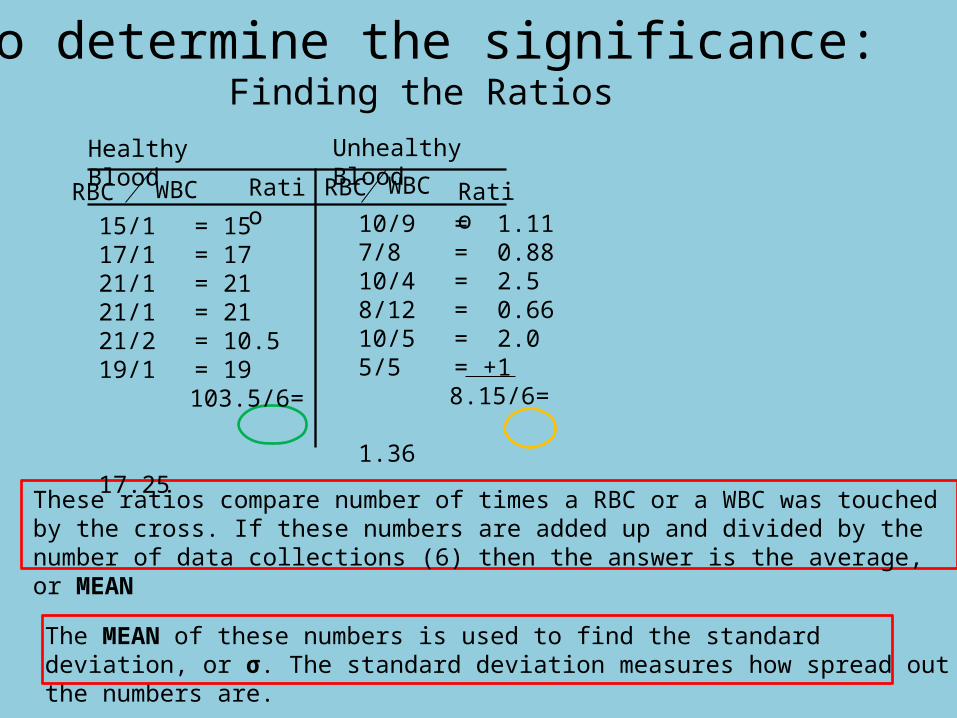
To determine the significance:Finding the Ratios
These ratios compare number of times a RBC or a WBC was touched by the cross. If these numbers are added up and divided by the number of data collections (6) then the answer is the average, or MEAN
The MEAN of these numbers is used to find the standard deviation, or σ. The standard deviation measures how spread out the numbers are.
Ratio Ratio
Healthy Blood Unhealthy Blood
RBC RBC WBC WBC
10/9 = 1.117/8 = 0.8810/4 = 2.58/12 = 0.6610/5 = 2.05/5 = +1
8.15/6= 1.36
15/1 = 1517/1 = 1721/1 = 2121/1 = 2121/2 = 10.519/1 = 19
103.5/6= 17.25
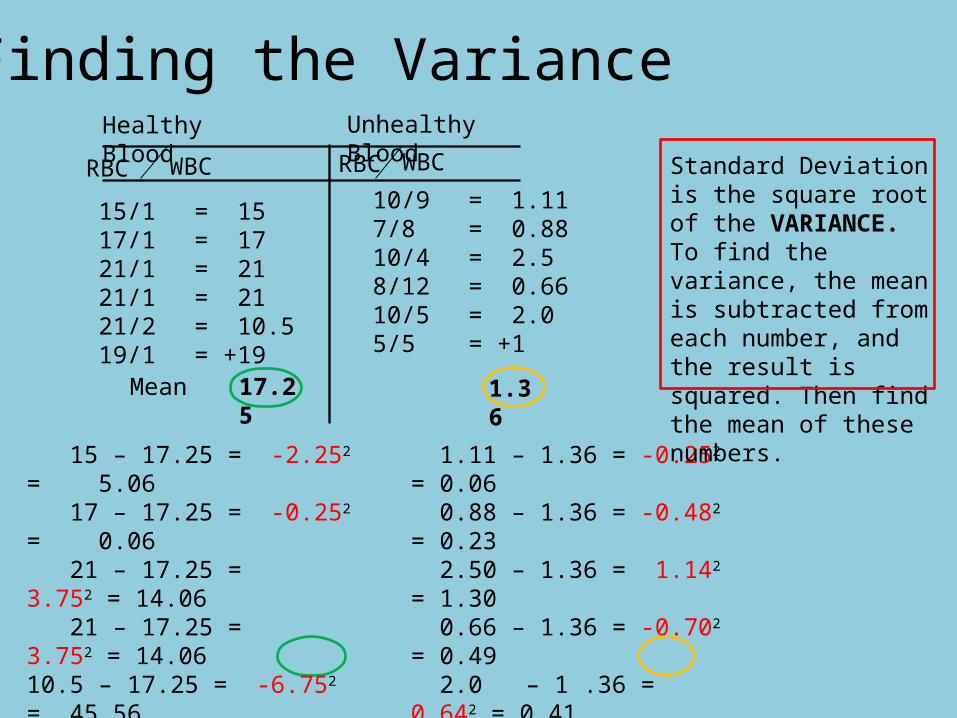
1.11 – 1.36 = -0.252 = 0.06 0.88 – 1.36 = -0.482 = 0.23 2.50 – 1.36 = 1.142 = 1.30 0.66 – 1.36 = -0.702 = 0.49 2.0 – 1 .36 = 0.642 = 0.41 1.0 - 1.36 = -0.362 = 0.13
2.62/6= 0.44
Finding the Variance
Mean 17.25 1.36
Standard Deviation is the square root of the VARIANCE. To find the variance, the mean is subtracted from each number, and the result is squared. Then find the mean of these numbers.
15 – 17.25 = -2.252 = 5.06 17 – 17.25 = -0.252 = 0.06 21 – 17.25 = 3.752 = 14.06 21 – 17.25 = 3.752 = 14.0610.5 – 17.25 = -6.752 = 45.56 19 – 17.25 = 1.752 = 3.06 81.86/6= 13.64
Healthy Blood Unhealthy Blood
RBC RBC WBC WBC
10/9 = 1.117/8 = 0.8810/4 = 2.58/12 = 0.6610/5 = 2.05/5 = +1
15/1 = 1517/1 = 1721/1 = 2121/1 = 2121/2 = 10.519/1 = +19
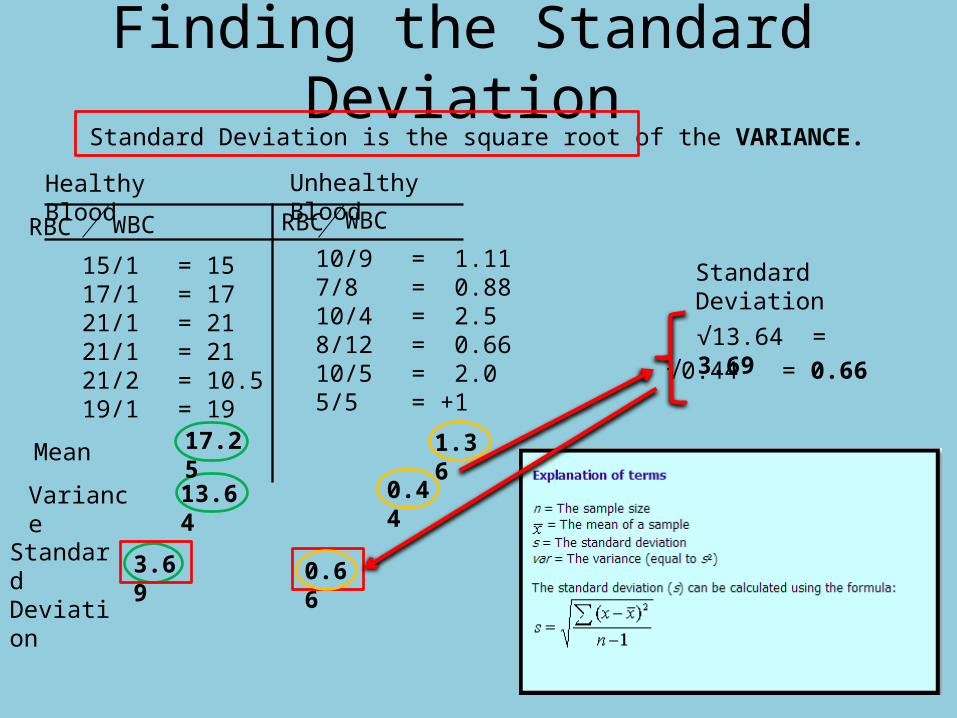
Finding the Standard DeviationStandard Deviation is the square root of the VARIANCE.
Variance 13.64 0.44
Standard Deviation
√13.64 = 3.69√0.44 = 0.66
Standard Deviation 0.663.69
Healthy Blood Unhealthy Blood
RBC RBC WBC WBC
10/9 = 1.117/8 = 0.8810/4 = 2.58/12 = 0.6610/5 = 2.05/5 = +1
Mean 17.25 1.36
15/1 = 1517/1 = 1721/1 = 2121/1 = 2121/2 = 10.519/1 = 19
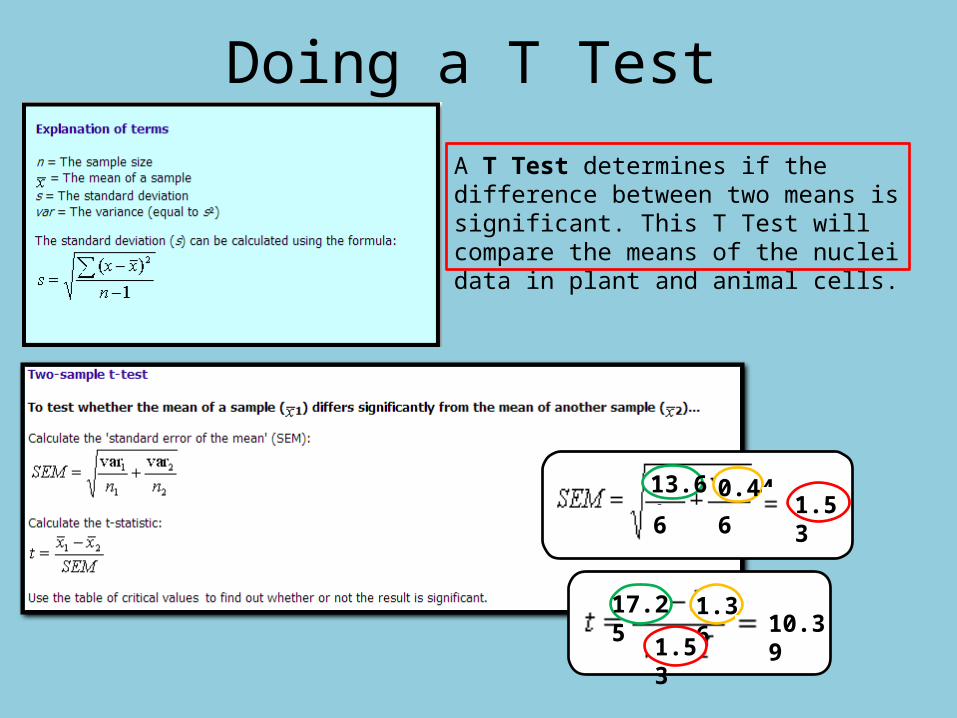
Doing a T Test
A T Test determines if the difference between two means is significant. This T Test will compare the means of the nuclei data in plant and animal cells.
17.25 1.36
1.5310.39
1.5313.64 0.44
6 6
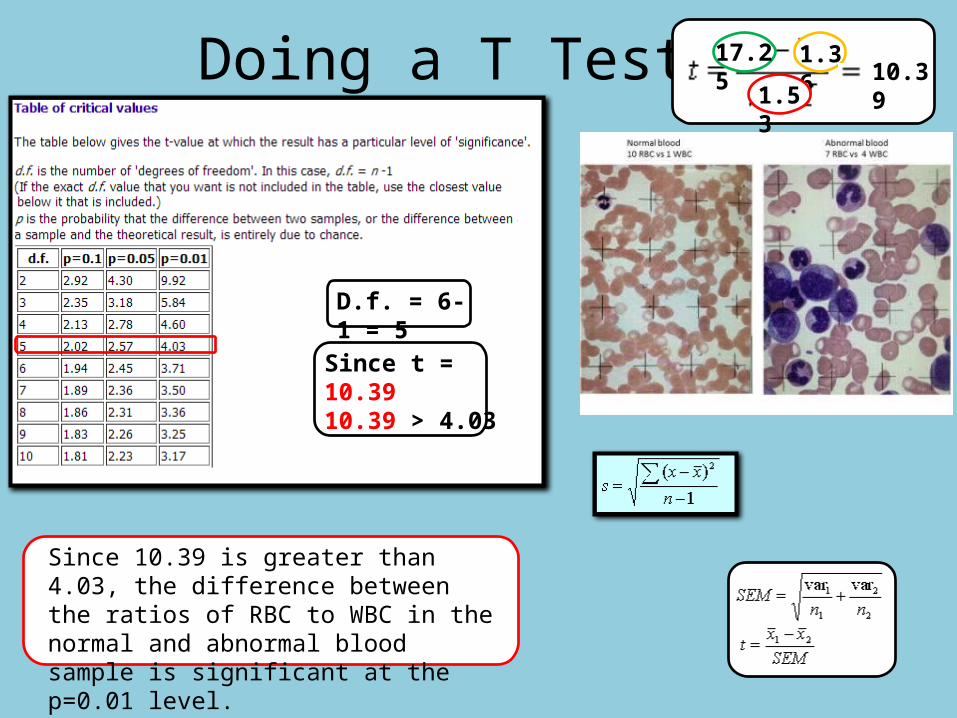
Doing a T Test
D.f. = 6-1 = 5
Since t = 10.3910.39 > 4.03
Since 10.39 is greater than 4.03, the difference between the ratios of RBC to WBC in the normal and abnormal blood sample is significant at the p=0.01 level.
17.25 1.36
1.5310.39
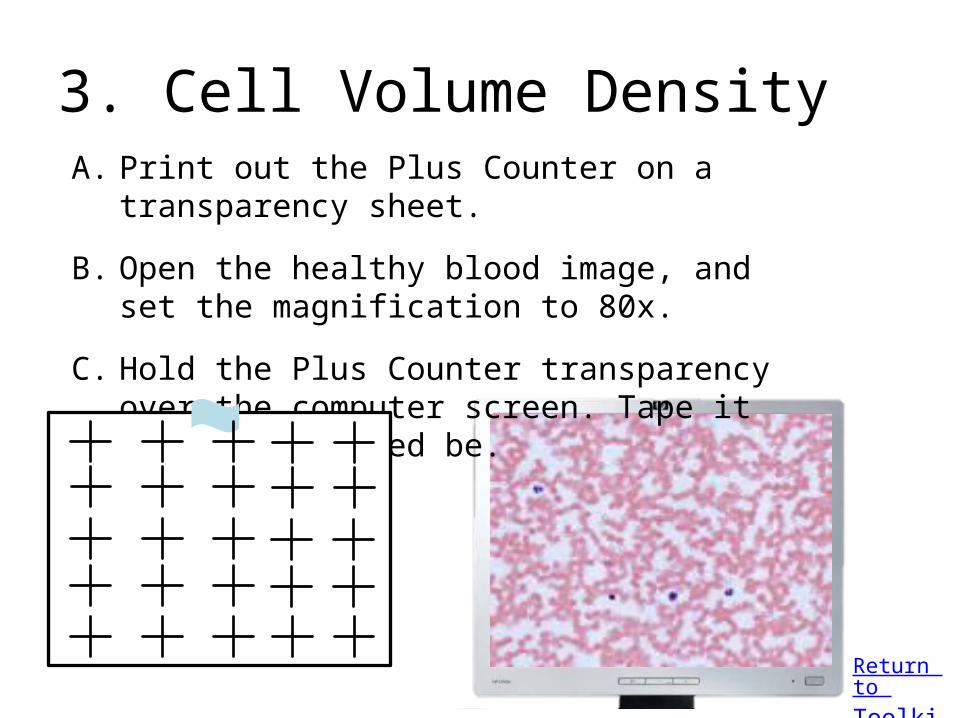
3. Cell Volume Density A. Print out the Plus Counter on a transparency sheet.
B. Open the healthy blood image, and set the magnification to 80x.
C. Hold the Plus Counter transparency over the computer screen. Tape it in place if need be.
Return to Toolkit
3. Cell Volume Density A. Print out the Plus Counter on a transparency sheet. B. Set the magnification to 80x. C. Hold the Plus Counter transparency over the computer screen. Tape it in place if need be.
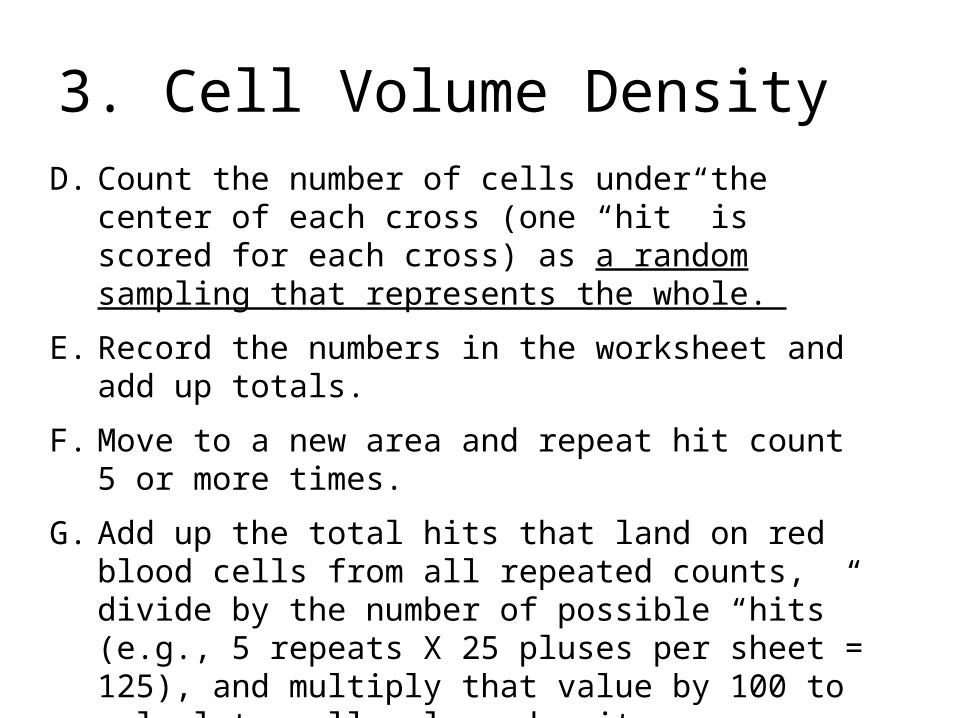
D. Count the number of cells under the center of each cross (one “hit” is scored for each cross) as a random sampling that represents the whole.
E. Record the numbers in the worksheet and add up totals.
F. Move to a new area and repeat hit count 5 or more times.
G. Add up the total hits that land on red blood cells from all repeated counts, divide by the number of possible “hits” (e.g., 5 repeats X 25 pluses per sheet = 125), and multiply that value by 100 to calculate cell volume density.
H. Repeat for white blood cells.
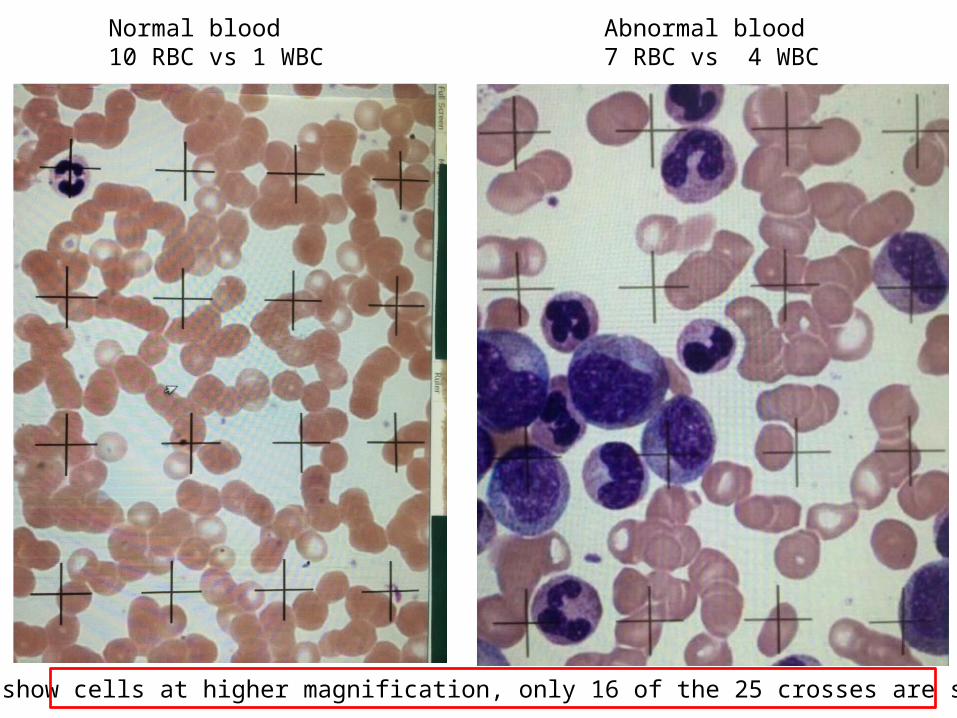
Normal blood10 RBC vs 1 WBC
Abnormal blood7 RBC vs 4 WBC
Note: To show cells at higher magnification, only 16 of the 25 crosses are shown here
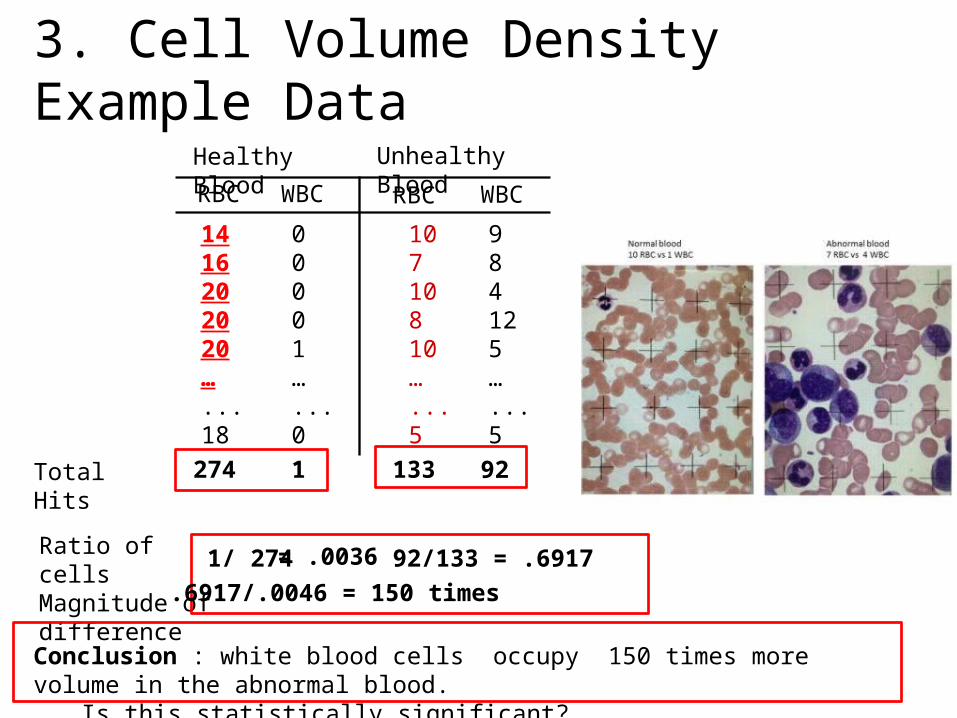
3. Cell Volume Density Example Data Healthy Blood Unhealthy Blood
RBC RBC WBC WBC
1416202020…...18
00001…...0
10710810…...5
984125…...5
Total Hits 274 1 133 92
Ratio of cellsMagnitude of difference
1/ 274 = .0036 92/133 = .6917.6917/.0046 = 150 times
Conclusion : white blood cells occupy 150 times more volume in the abnormal blood.Is this statistically significant?
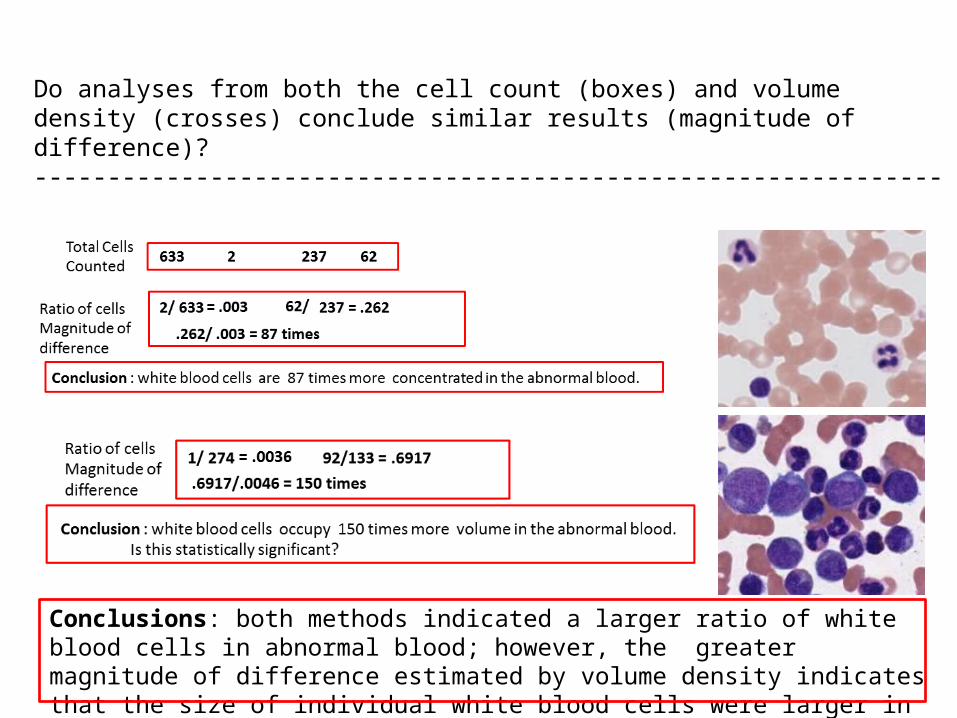
Do analyses from both the cell count (boxes) and volume density (crosses) conclude similar results (magnitude of difference)?--------------------------------------------------------------
Conclusions: both methods indicated a larger ratio of white blood cells in abnormal blood; however, the greater magnitude of difference estimated by volume density indicates that the size of individual white blood cells were larger in the abnormal blood.
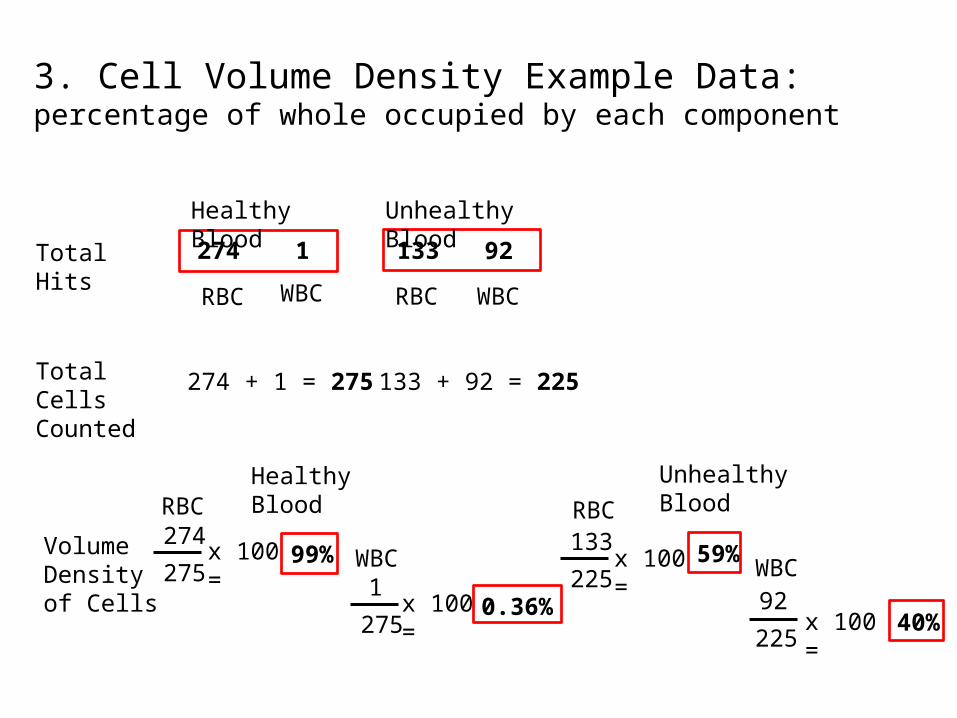
3. Cell Volume Density Example Data:percentage of whole occupied by each component
Total Hits
Total Cells Counted
274 + 1 = 275 133 + 92 = 225
Volume Density of Cells
274
275x 100 =
1
275x 100 =
133
225x 100 =
92
225x 100 =
99%
0.36%
59%
40%
274 1 133 92
Healthy Blood Unhealthy Blood
Healthy Blood Unhealthy BloodRBC RBC
WBC WBC
WBC WBC RBC RBC
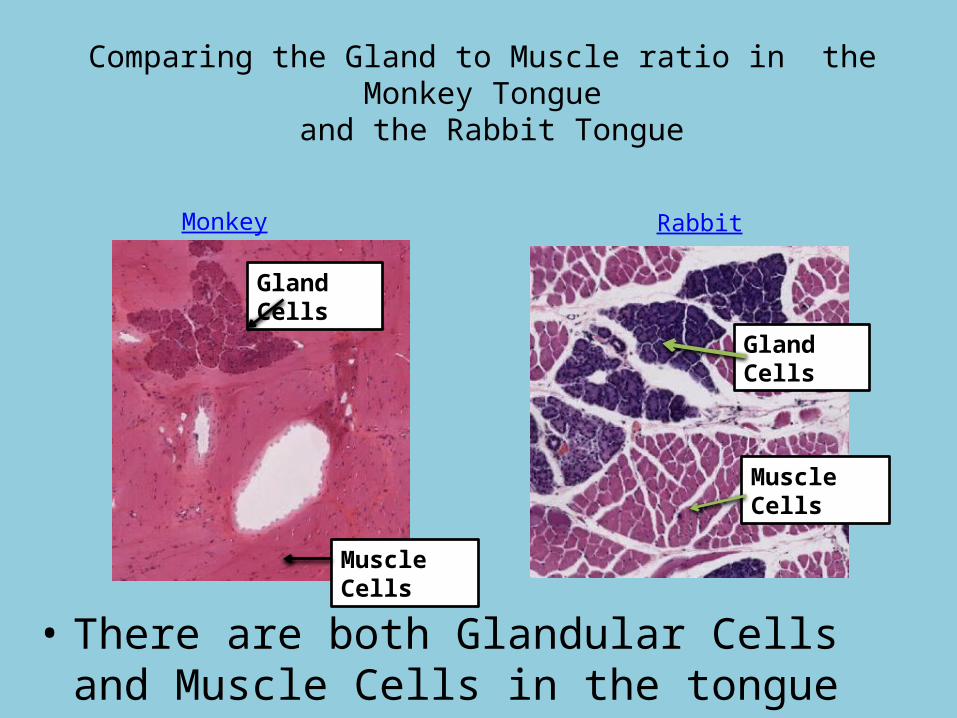
Comparing the Gland to Muscle ratio in the Monkey Tongue and the Rabbit Tongue
• There are both Glandular Cells and Muscle Cells in the tongue of both species.
Gland Cells
Muscle Cells
Gland Cells
Muscle Cells
RabbitMonkey
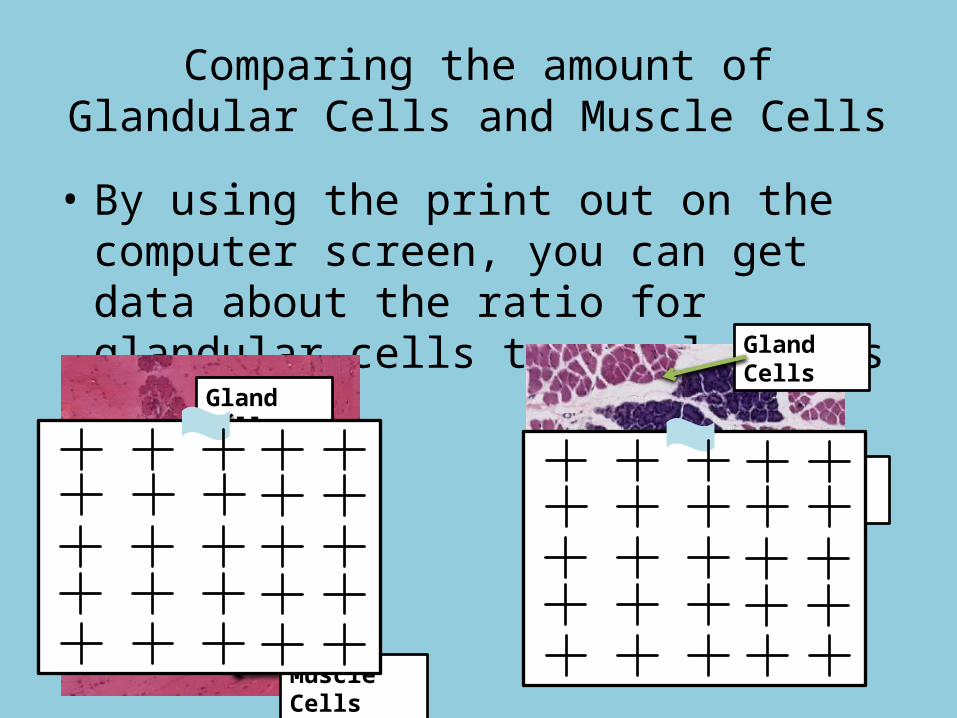
Comparing the amount of Glandular Cells and Muscle Cells
• By using the print out on the computer screen, you can get data about the ratio for glandular cells to muscle cells
Gland Cells
Muscle Cells
Gland Cells
Muscle Cells
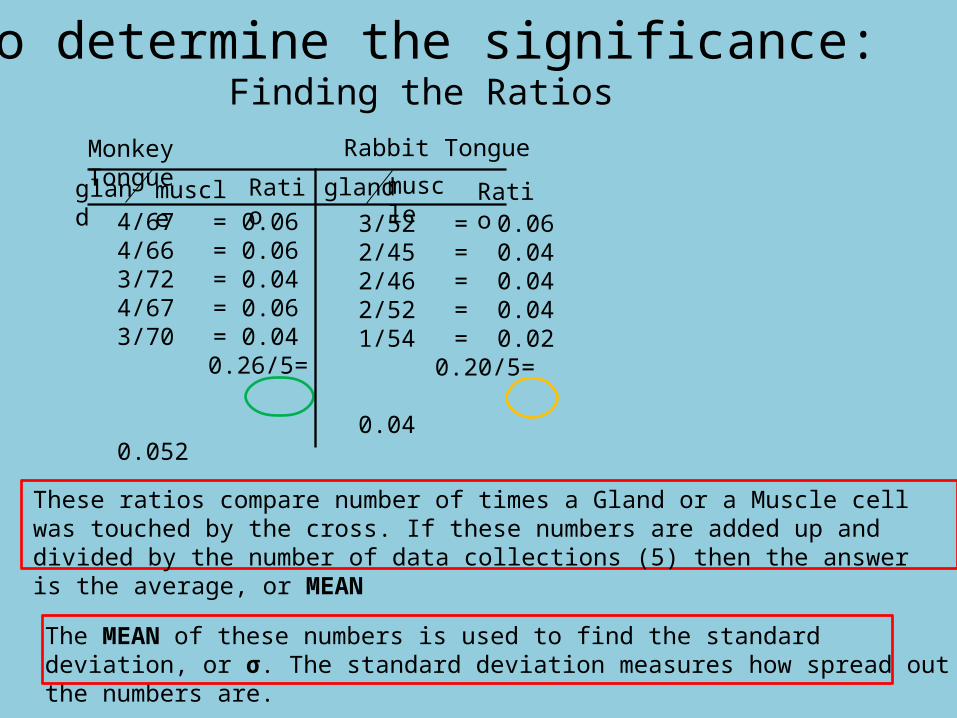
To determine the significance:Finding the Ratios
These ratios compare number of times a Gland or a Muscle cell was touched by the cross. If these numbers are added up and divided by the number of data collections (5) then the answer is the average, or MEAN
The MEAN of these numbers is used to find the standard deviation, or σ. The standard deviation measures how spread out the numbers are.
Ratio Ratio
Monkey Tongue Rabbit Tongue
gland gland muscle muscle
3/52 = 0.062/45 = 0.042/46 = 0.042/52 = 0.041/54 = 0.02
0.20/5= 0.04
4/67 = 0.064/66 = 0.063/72 = 0.044/67 = 0.063/70 = 0.04
0.26/5= 0.052
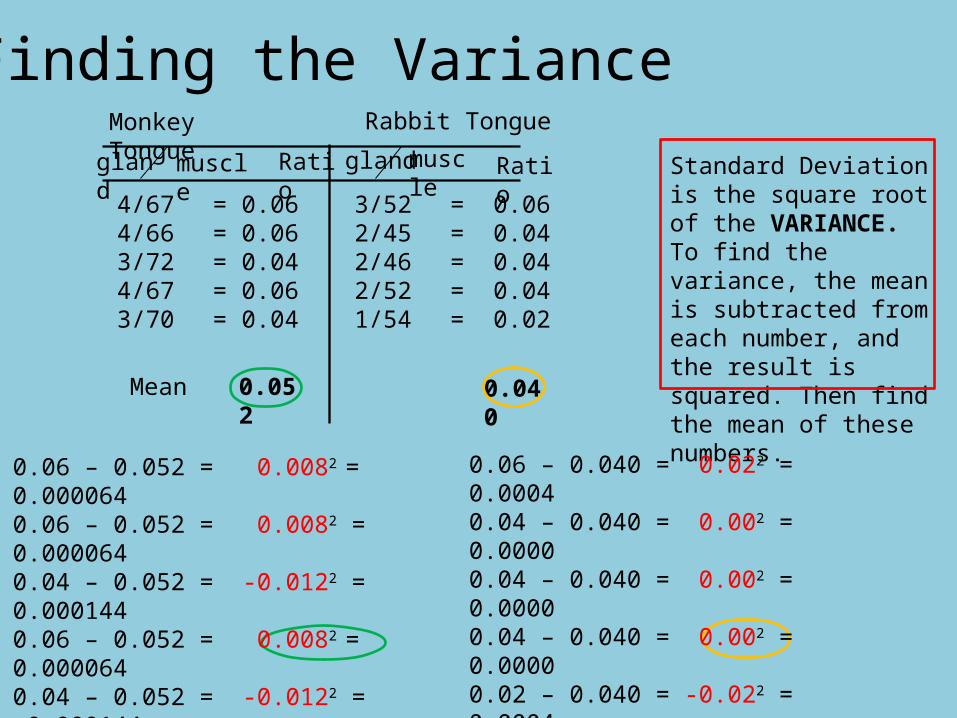
Finding the Variance
Mean 0.052 0.040
Standard Deviation is the square root of the VARIANCE. To find the variance, the mean is subtracted from each number, and the result is squared. Then find the mean of these numbers.
0.06 – 0.052 = 0.0082 = 0.0000640.06 – 0.052 = 0.0082 = 0.0000640.04 – 0.052 = -0.0122 = 0.0001440.06 – 0.052 = 0.0082 = 0.0000640.04 – 0.052 = -0.0122 = 0.000144
=0.000544/5 0.0001088
0.06 – 0.040 = 0.022 = 0.00040.04 – 0.040 = 0.002 = 0.00000.04 – 0.040 = 0.002 = 0.00000.04 – 0.040 = 0.002 = 0.00000.02 – 0.040 = -0.022 = 0.0004
0.0008/5= 0.00016
Monkey Tongue Rabbit Tongue
gland gland muscle muscle Ratio Ratio
4/67 = 0.064/66 = 0.063/72 = 0.044/67 = 0.063/70 = 0.04
3/52 = 0.062/45 = 0.042/46 = 0.042/52 = 0.041/54 = 0.02
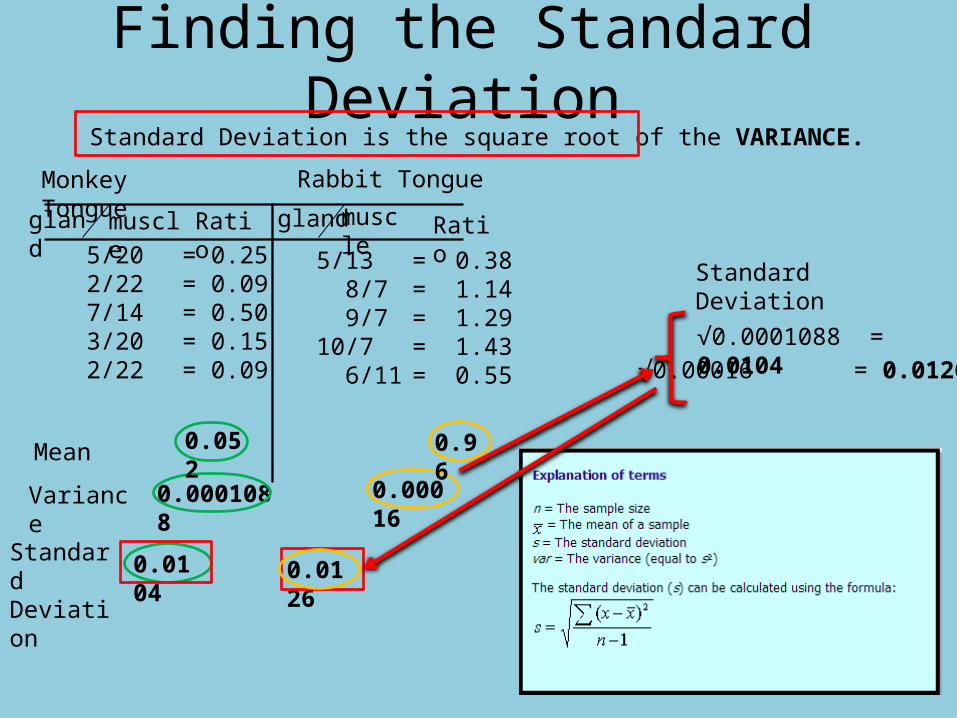
Finding the Standard DeviationStandard Deviation is the square root of the VARIANCE.
Variance 0.0001088 0.00016
Standard Deviation
√0.0001088 = 0.0104√0.00016 = 0.0126
Standard Deviation 0.01260.0104
Mean 0.052 0.96
5/20 = 0.252/22 = 0.097/14 = 0.503/20 = 0.152/22 = 0.09
5/13 = 0.38 8/7 = 1.14 9/7 = 1.2910/7 = 1.43 6/11 = 0.55
Monkey Tongue Rabbit Tongue
gland gland muscle muscle Ratio Ratio
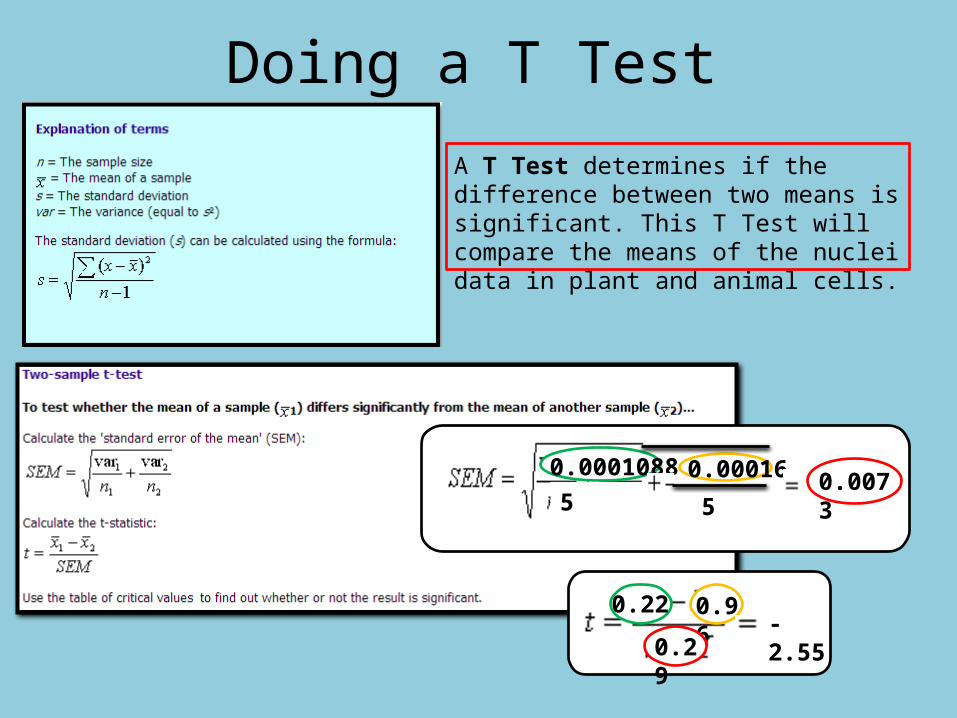
Doing a T Test
A T Test determines if the difference between two means is significant. This T Test will compare the means of the nuclei data in plant and animal cells.
0.22 0.96
0.29-2.55
0.00730.0001088 0.00016
55
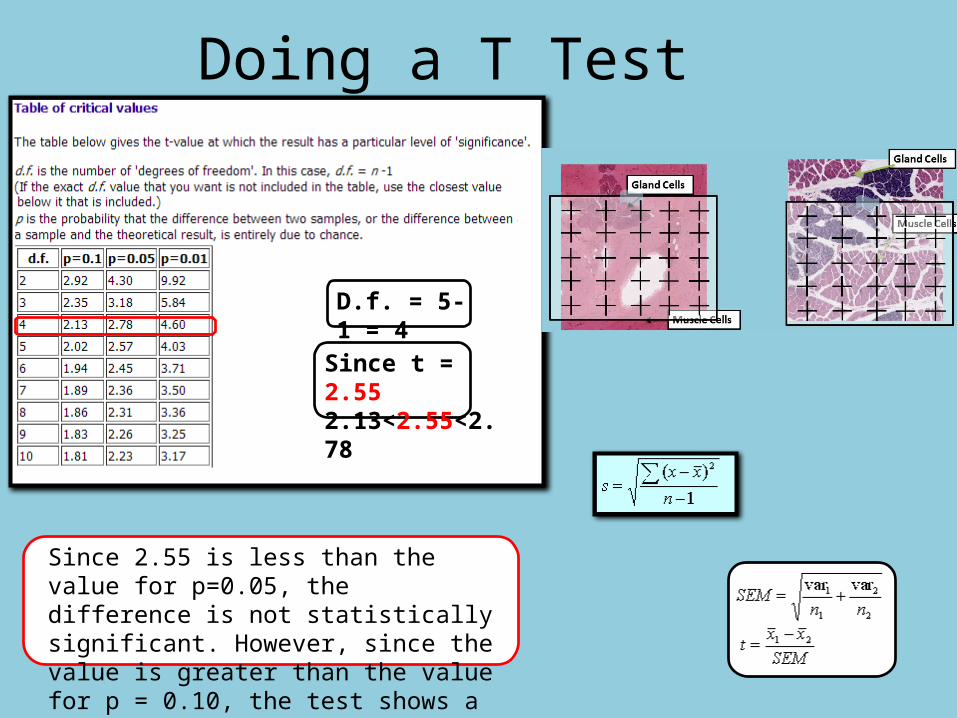
Doing a T Test
D.f. = 5-1 = 4
Since t = 2.552.13<2.55<2.78
Since 2.55 is less than the value for p=0.05, the difference is not statistically significant. However, since the value is greater than the value for p = 0.10, the test shows a trend.
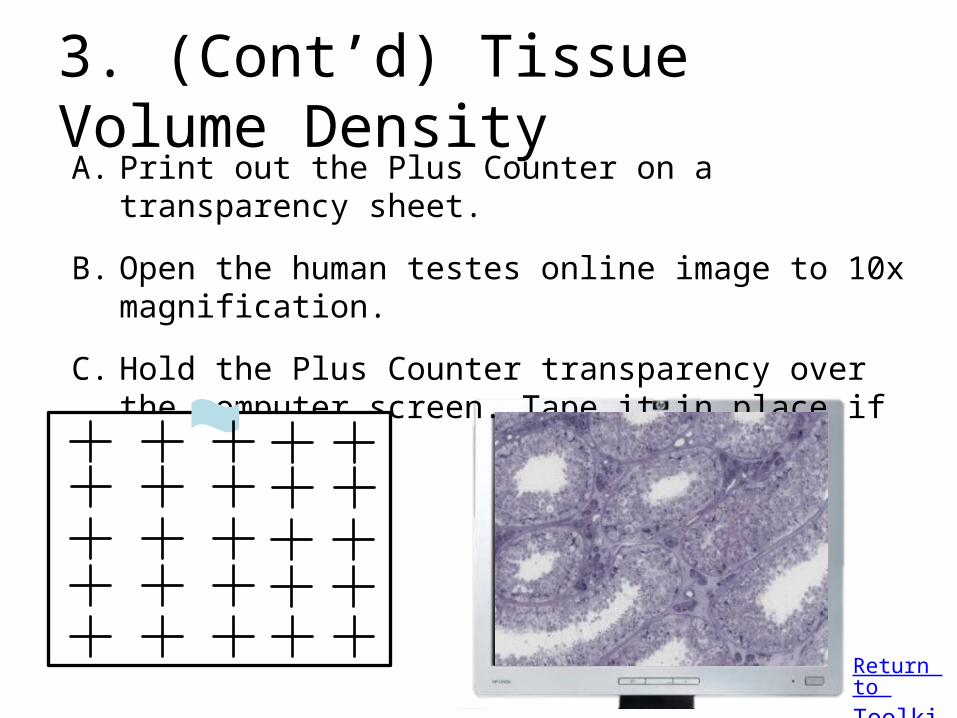
3. (Cont’d) Tissue Volume Density A. Print out the Plus Counter on a transparency sheet.
B. Open the human testes online image to 10x magnification.
C. Hold the Plus Counter transparency over the computer screen. Tape it in place if need be.
Return to Toolkit
3. Tissue Volume Density A. Print out the Plus Counter on a transparency sheet. B. Set the magnification to 80x. C. Hold the Plus Counter transparency over the computer screen. Tape it in place if need be.
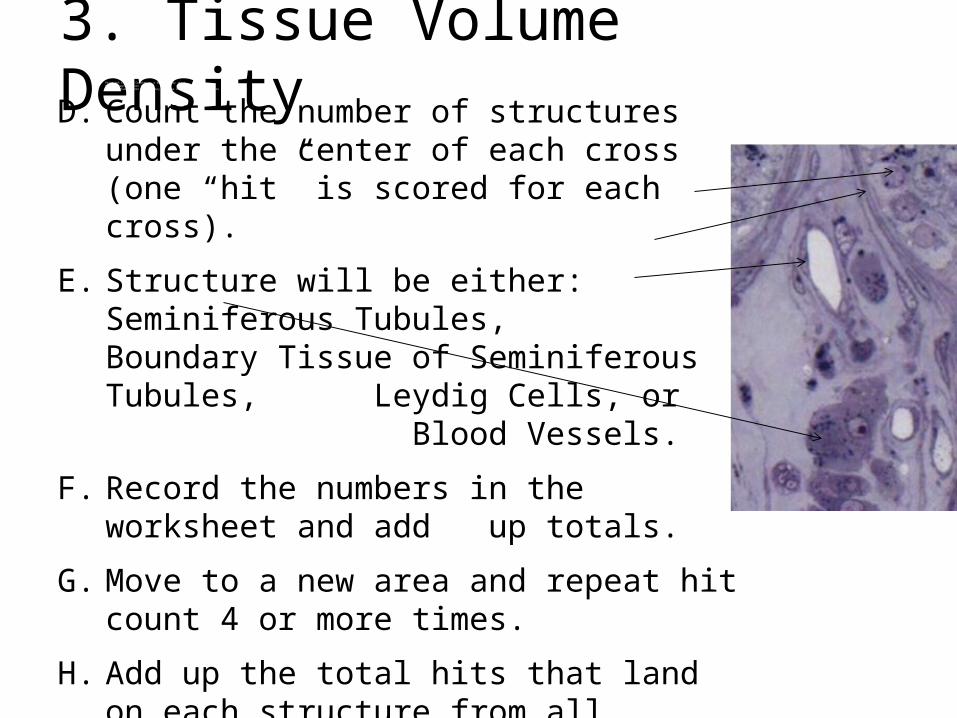
D. Count the number of structures under the center of each cross (one “hit” is scored for each cross).
E. Structure will be either: Seminiferous Tubules, Boundary Tissue of Seminiferous Tubules, Leydig Cells, or Blood Vessels.
F. Record the numbers in the worksheet and add up totals.
G. Move to a new area and repeat hit count 4 or more times.
H. Add up the total hits that land on each structure from all repeated counts, divide by the number of possible “hits” (e.g., 5 repeats X 25 pluses per sheet = 125), and multiply that value by 100 to calculate tissue volume density.
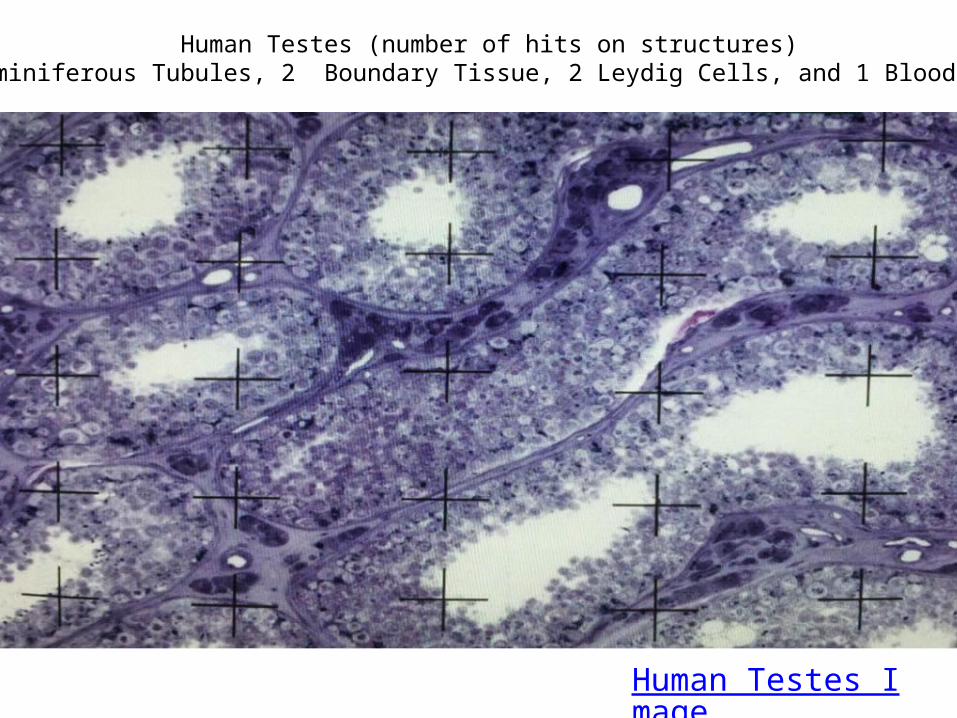
Human Testes Image
Human Testes (number of hits on structures)21 Seminiferous Tubules, 2 Boundary Tissue, 2 Leydig Cells, and 1 Blood Vessel
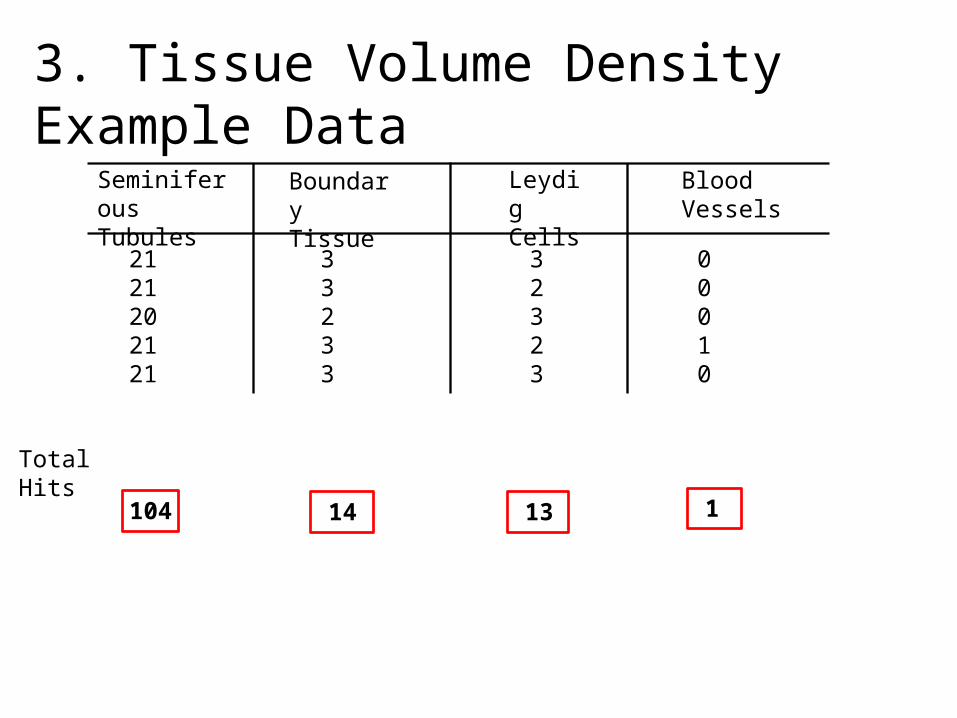
3. Tissue Volume Density Example Data
Total Hits
104
Seminiferous Tubules
Boundary Tissue
Leydig Cells
Blood Vessels
2121202121
32323
33233
00010
14 113
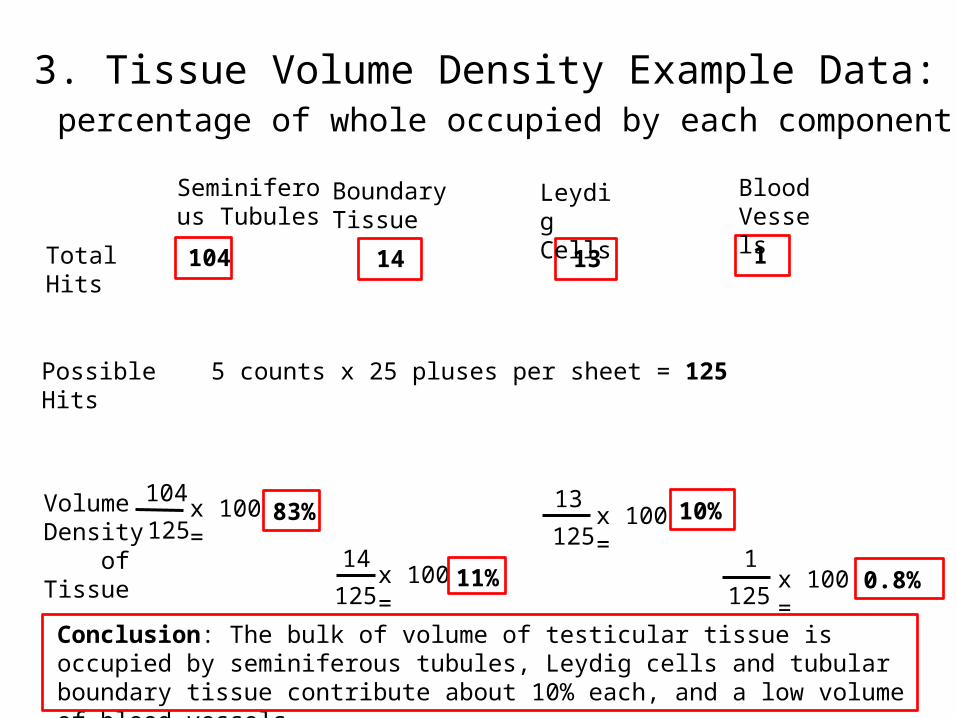
3. Tissue Volume Density Example Data: percentage of whole occupied by each component
Total Hits
Possible Hits 5 counts x 25 pluses per sheet = 125
Volume Density of Tissue
104
125x 100 =
14
125x 100 =
13
125x 100 =
1
125x 100 =
83%
11%
10%
0.8%
Seminiferous Tubules
104 14 113
Boundary Tissue
Leydig Cells
Blood Vessels
Conclusion: The bulk of volume of testicular tissue is occupied by seminiferous tubules, Leydig cells and tubular boundary tissue contribute about 10% each, and a low volume of blood vessels.
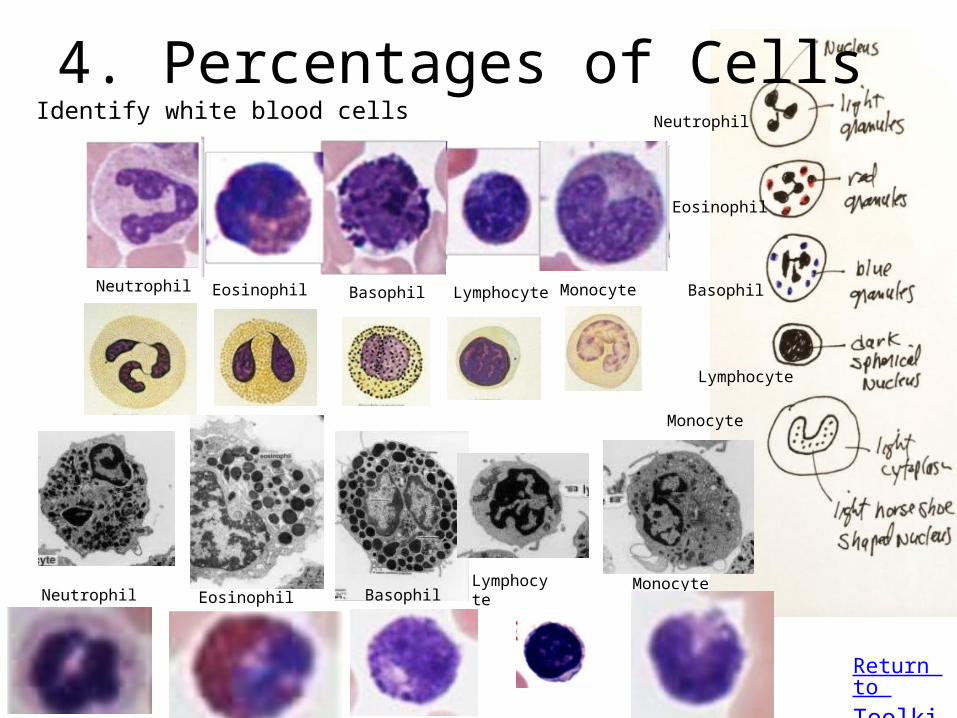
4. Percentages of Cells
Return to Toolkit
Neutrophil Lymphocyte MonocyteEosinophil Basophil
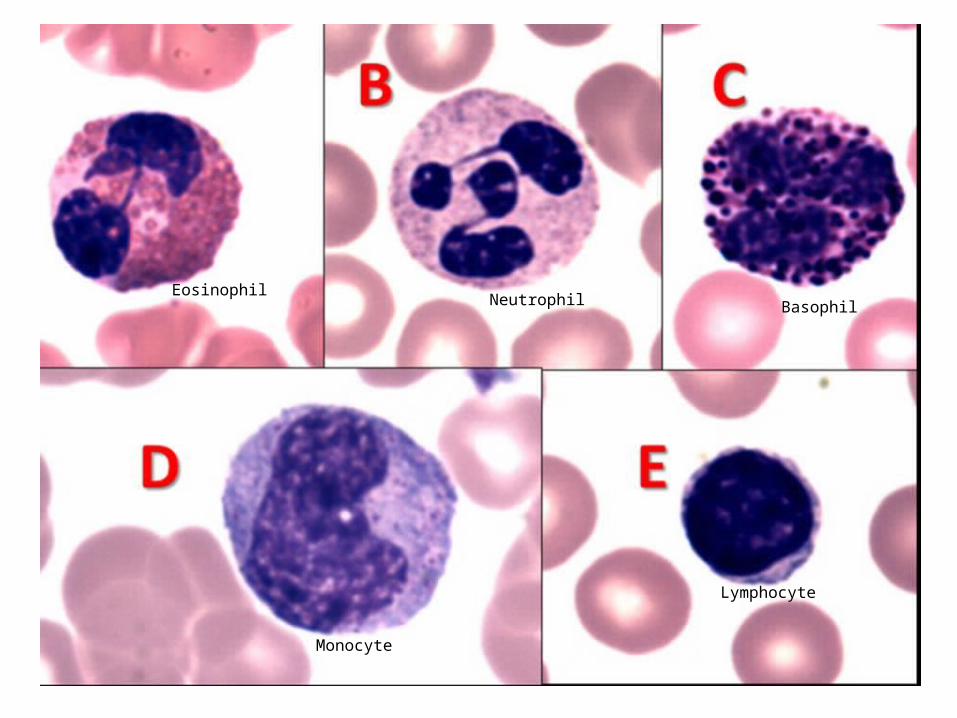
Identify white blood cells
Neutrophil Eosinophil BasophilLymphocyte Monocyte
Neutrophil
Eosinophil
Basophil
Lymphocyte
Monocyte
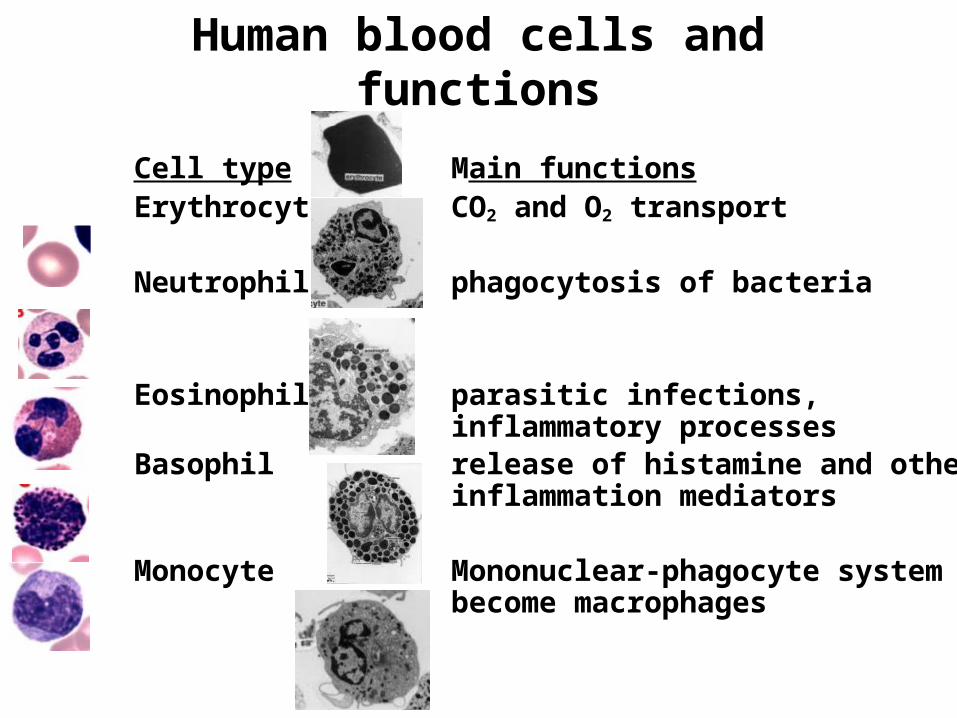
Human blood cells and functions
Cell type Main functions Erythrocyte CO2 and O2 transport
Neutrophil phagocytosis of bacteria
Eosinophil parasitic infections, inflammatory processes
Basophil release of histamine and other inflammation mediators
Monocyte Mononuclear-phagocyte system become macrophages
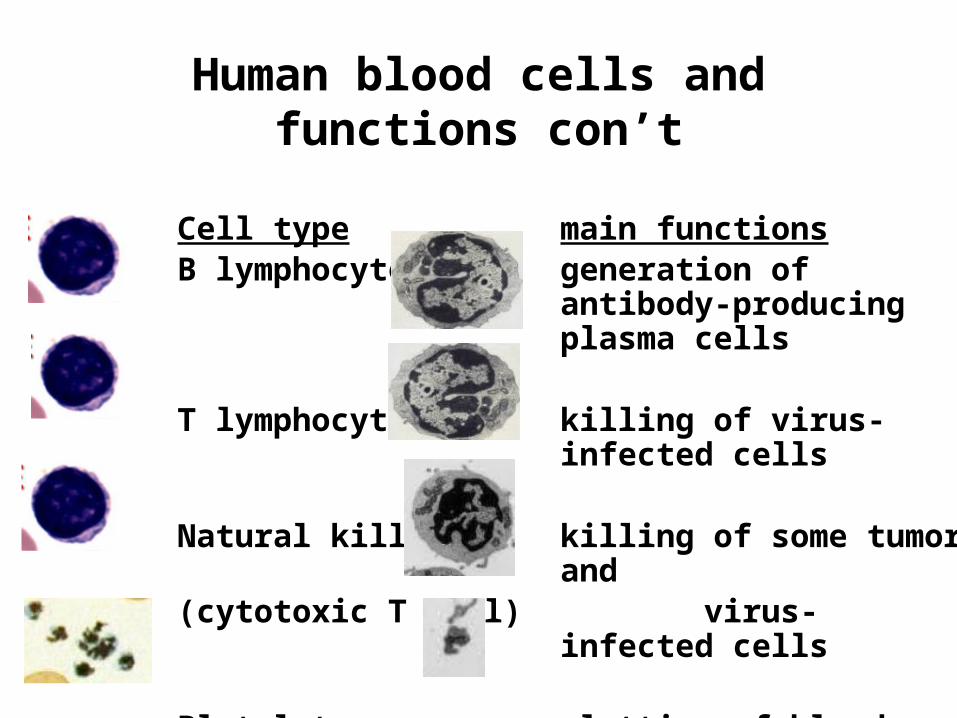
Human blood cells and functions con’t
Cell type main functionsB lymphocytes generation of antibody-
producing plasma cells
T lymphocytes killing of virus-infected cells
Natural killer killing of some tumor and(cytotoxic T cell) virus-infected cells
Platelets clotting of blood
NeutrophilEosinophil
Basophil
Monocyte
Lymphocyte
4. Percentages of Cells
Return to Toolkit
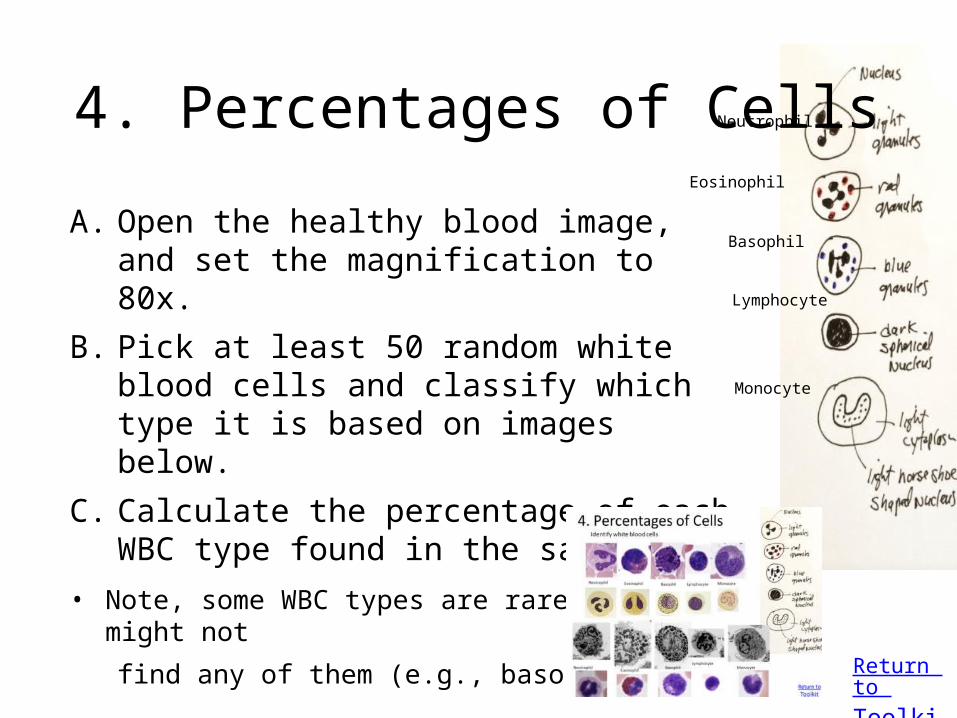
A. Open the healthy blood image, and set the magnification to 80x.
B. Pick at least 50 random white blood cells and classify which type it is based on images below.
C. Calculate the percentage of each WBC type found in the sample.
• Note, some WBC types are rare and you might not
find any of them (e.g., basophils).
Neutrophil
Lymphocyte
Monocyte
Eosinophil
Basophil
Number of Cells in Healthy Blood
LymphocyteNeutrophil EosinophilMonocyte Basophil
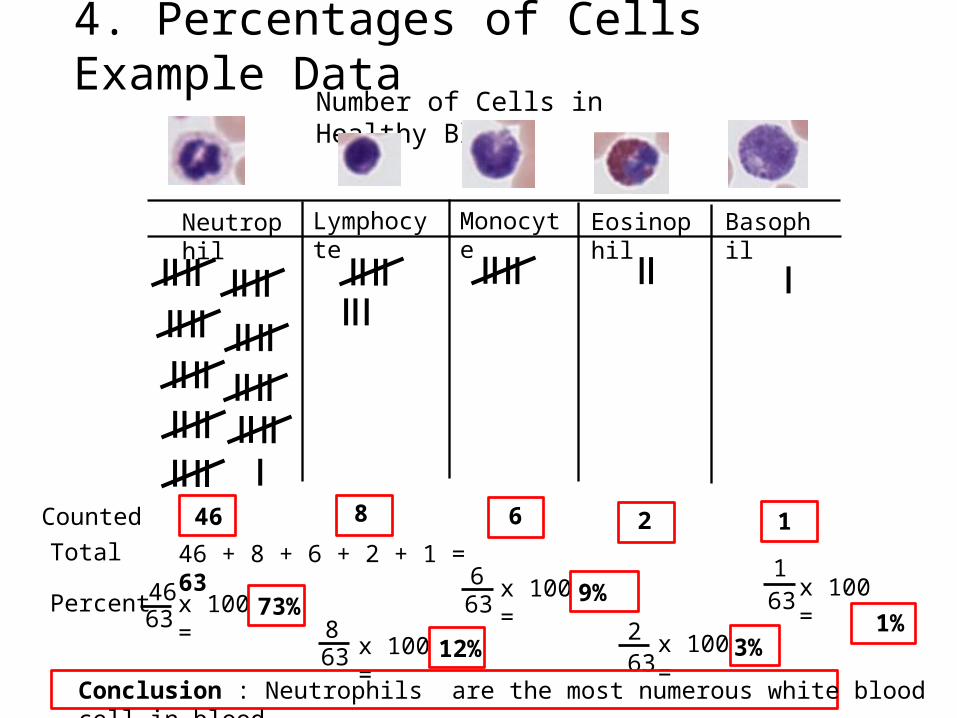
4. Percentages of Cells Example Data
CountedTotal
Percent
46 + 8 + 6 + 2 + 1 = 63
6346 x 100 =
863 x 100 =
663
x 100 =
263
x 100 =
163 x 100 =
73%
12%
9%
3%1%
46 6 2 18
NeutrophilConclusion : Neutrophils are the most numerous white blood cell in blood.
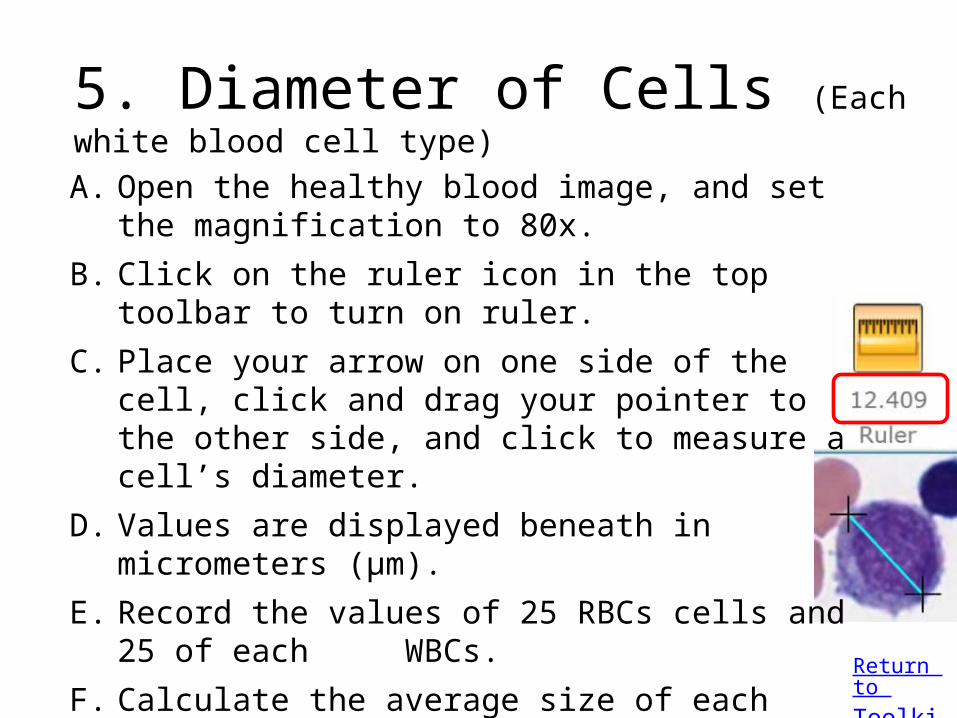
5. Diameter of Cells (Each white blood cell type)
Return to Toolkit
A. Open the healthy blood image, and set the magnification to 80x.
B. Click on the ruler icon in the top toolbar to turn on ruler.
C. Place your arrow on one side of the cell, click and drag your pointer to the other side, and click to measure a cell’s diameter.
D. Values are displayed beneath in micrometers (µm).
E. Record the values of 25 RBCs cells and 25 of each WBCs.
F. Calculate the average size of each cell.
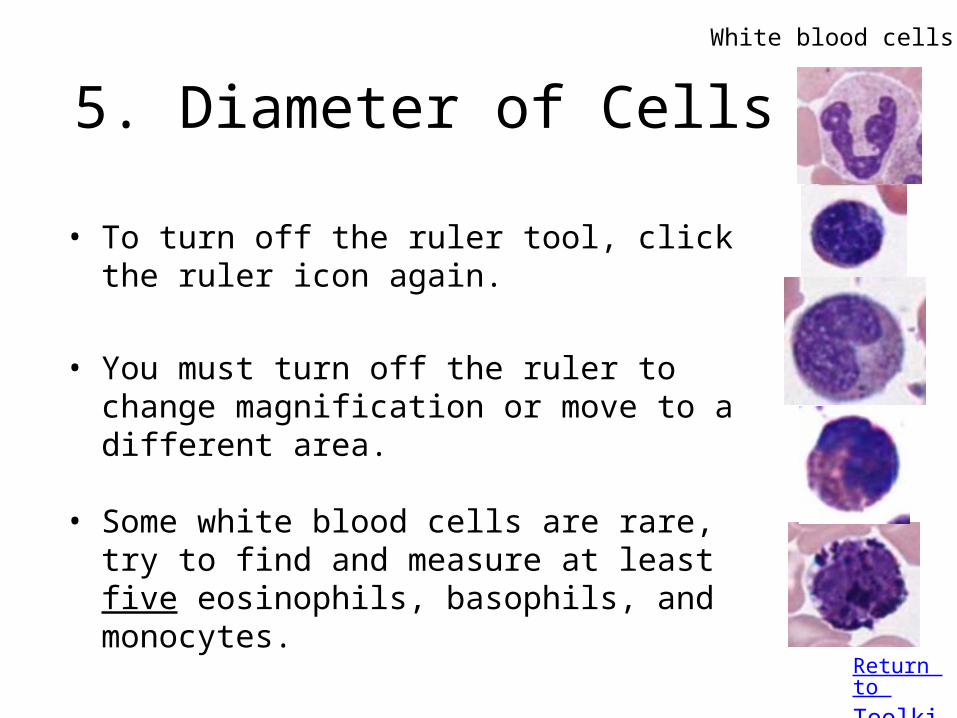
5. Diameter of Cells
Return to Toolkit
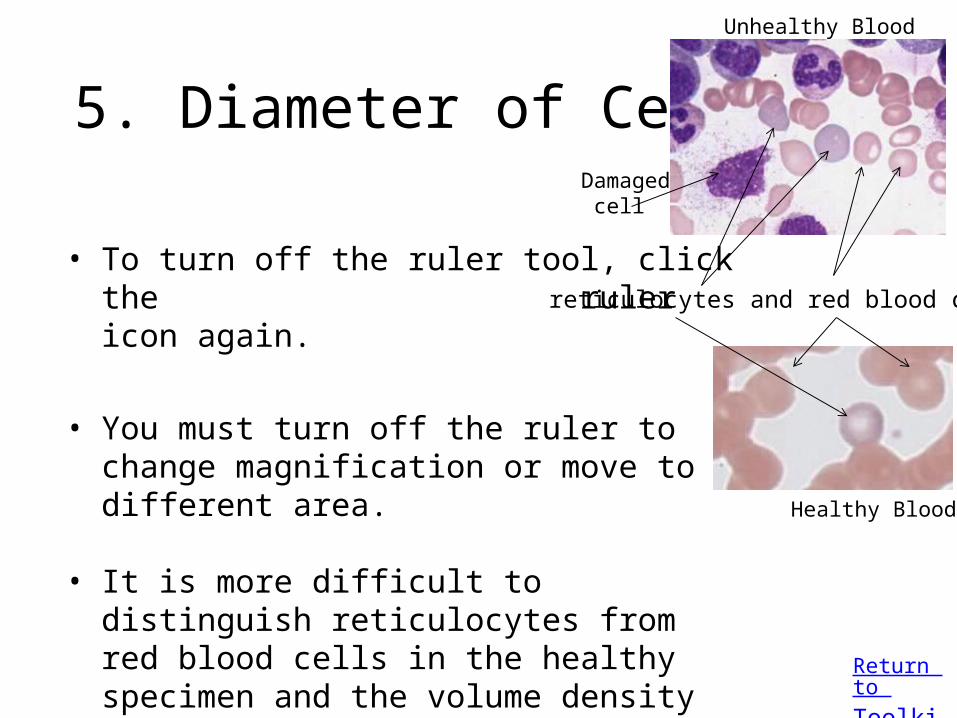
• To turn off the ruler tool, click the ruler icon again.
• You must turn off the ruler to change magnification or move to a different area.
• Some white blood cells are rare, try to find and measure at least five eosinophils, basophils, and monocytes.
White blood cells
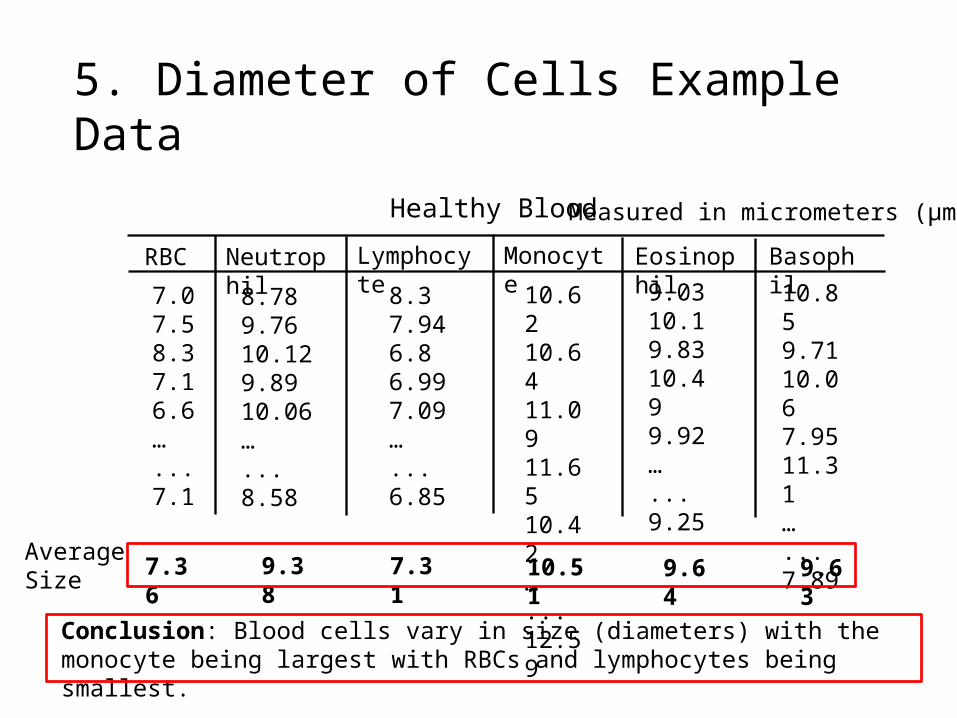
5. Diameter of Cells Example Data
Healthy Blood
RBC LymphocyteNeutrophil Eosinophil
7.07.58.37.16.6…...7.1
8.789.7610.129.8910.06…...8.58
10.6210.6411.0911.6510.42…...12.59
9.0310.19.8310.499.92…...9.25
Monocyte
8.37.946.86.997.09…...6.85
10.859.7110.067.9511.31…...7.89
Basophil
Average Size 7.36 9.38 7.31 10.51 9.64 9.63
Measured in micrometers (µm).
Conclusion: Blood cells vary in size (diameters) with the monocyte being largest with RBCs and lymphocytes being smallest.
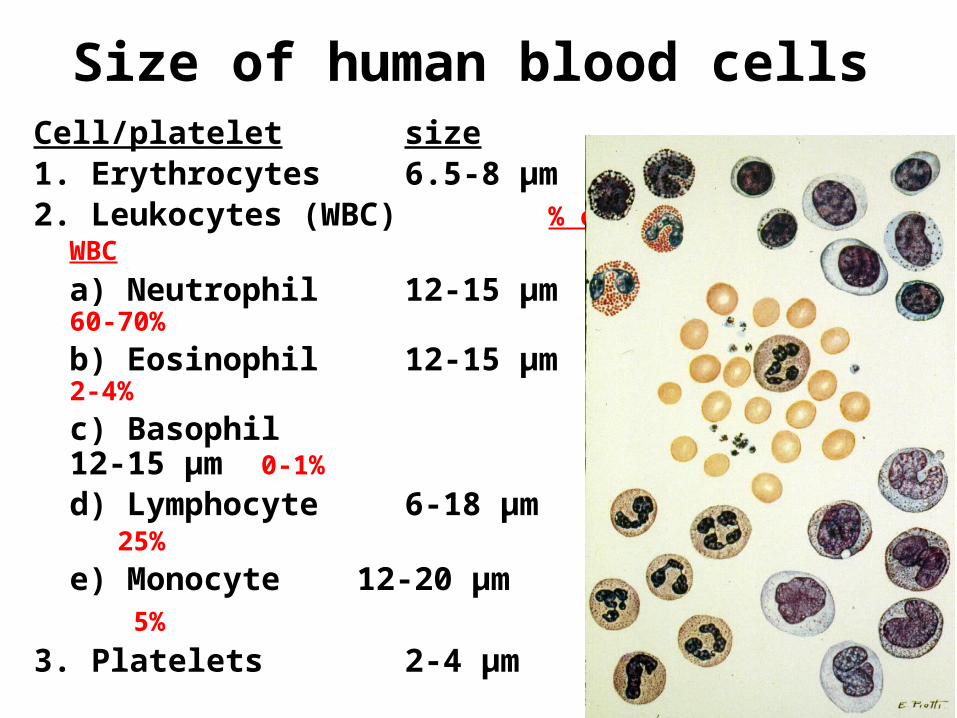
Size of human blood cells Cell/platelet size1. Erythrocytes 6.5-8 µm2. Leukocytes (WBC)
% of WBC
a) Neutrophil 12-15 µm 60-70%b) Eosinophil 12-15 µm 2-4%
c) Basophil 12-15 µm0-1%
d) Lymphocyte 6-18 µm 25%
e) Monocyte 12-20 µm 5%
3. Platelets 2-4 µm
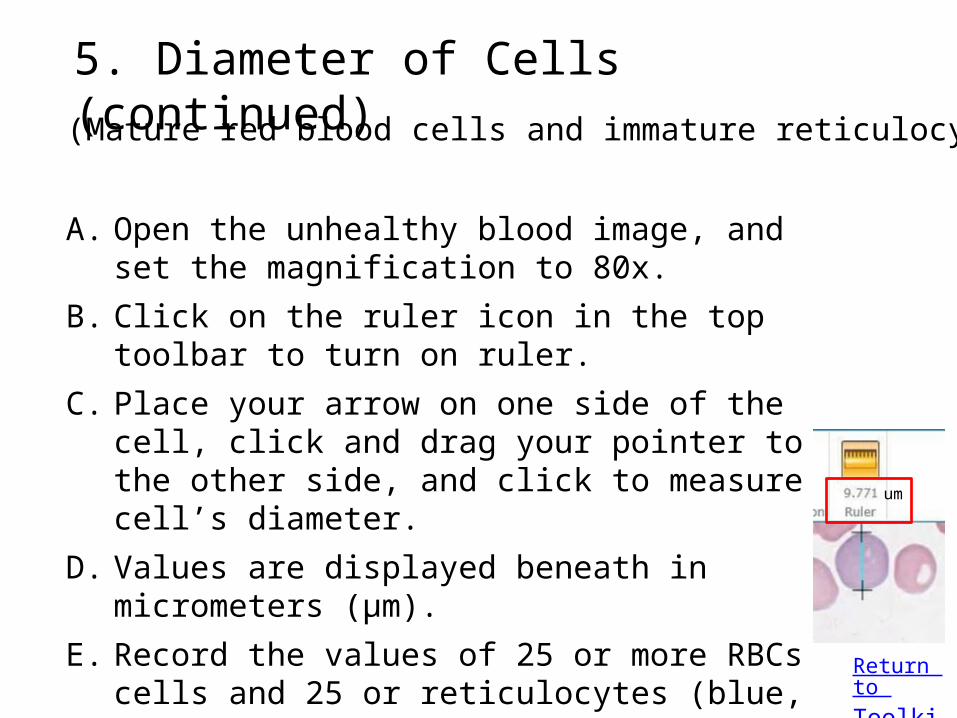
5. Diameter of Cells (continued)
Return to Toolkit
A. Open the unhealthy blood image, and set the magnification to 80x.
B. Click on the ruler icon in the top toolbar to turn on ruler.
C. Place your arrow on one side of the cell, click and drag your pointer to the other side, and click to measure a cell’s diameter.
D. Values are displayed beneath in micrometers (µm).
E. Record the values of 25 or more RBCs cells and 25 or reticulocytes (blue, immature red blood cells).
F. Calculate the average size of each cell.
um
(Mature red blood cells and immature reticulocytes)
5. Diameter of Cells
Return to Toolkit
• To turn off the ruler tool, click the ruler icon again.
• You must turn off the ruler to change magnification or move to a different area.
• It is more difficult to distinguish reticulocytes from red blood cells in the healthy specimen and the volume density is much lower in the health specimen. They may be too hard to find.
reticulocytes and red blood cells
Damaged cell
Unhealthy Blood
Healthy Blood
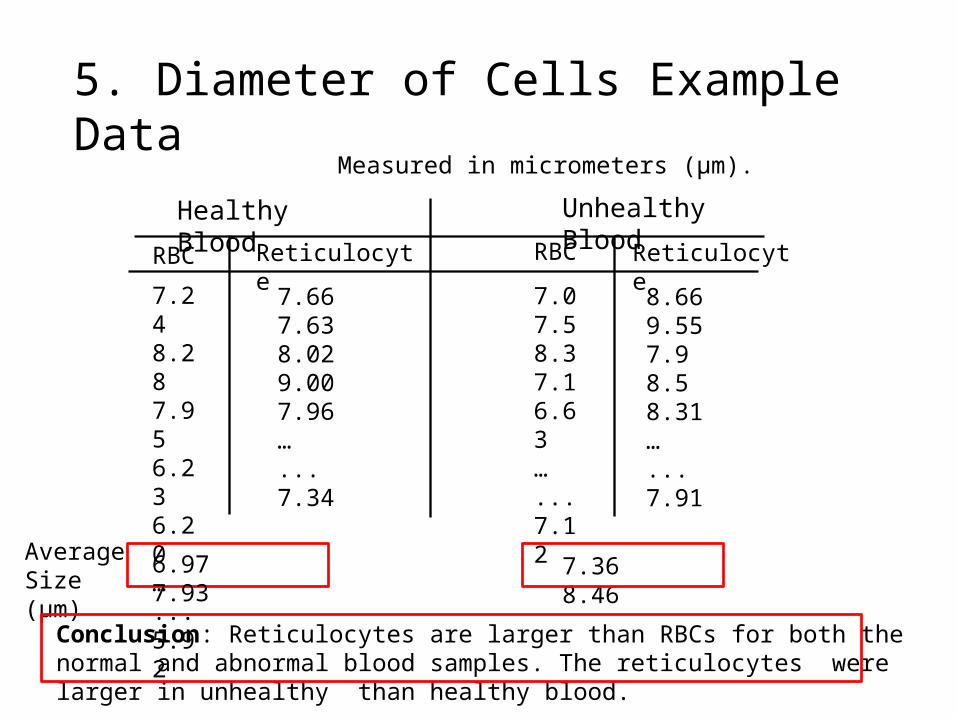
5. Diameter of Cells Example Data
Healthy Blood
RBC Reticulocyte
7.248.287.956.236.20…...5.92
7.667.638.029.007.96…...7.34
Average Size (µm)
Measured in micrometers (µm).
Unhealthy Blood
RBC Reticulocyte
7.07.58.37.16.63…...7.12
8.669.557.98.58.31…...7.91
6.97 7.93 7.36 8.46
Conclusion: Reticulocytes are larger than RBCs for both the normal and abnormal blood samples. The reticulocytes were larger in unhealthy than healthy blood.
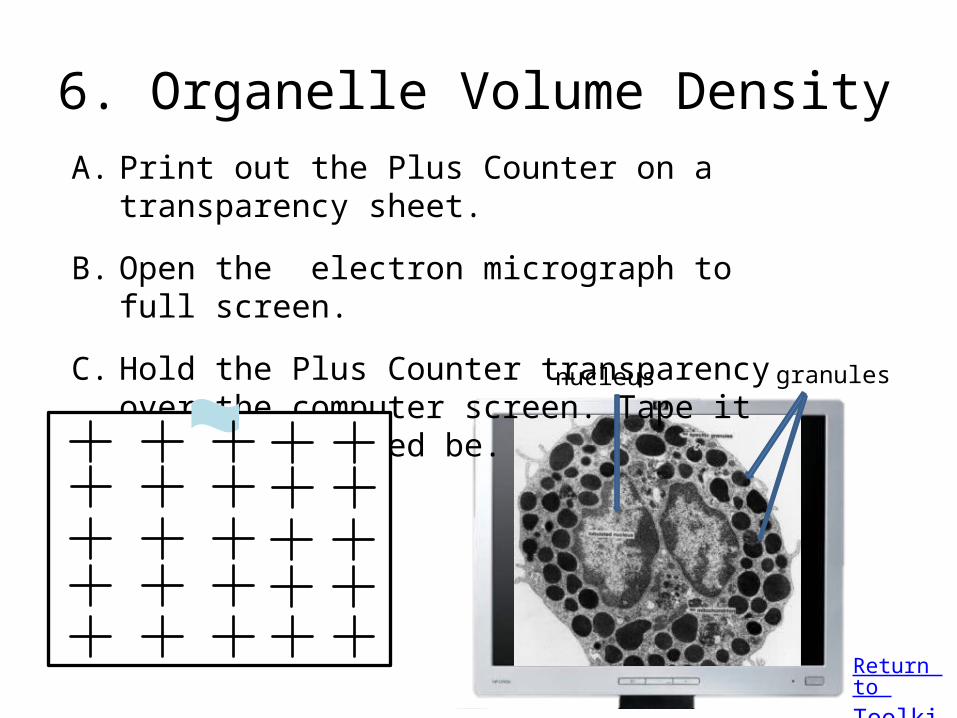
6. Organelle Volume DensityA. Print out the Plus Counter on a transparency sheet.
B. Open the electron micrograph to full screen.
C. Hold the Plus Counter transparency over the computer screen. Tape it in place if need be.
Return to Toolkit
granulesnucleus
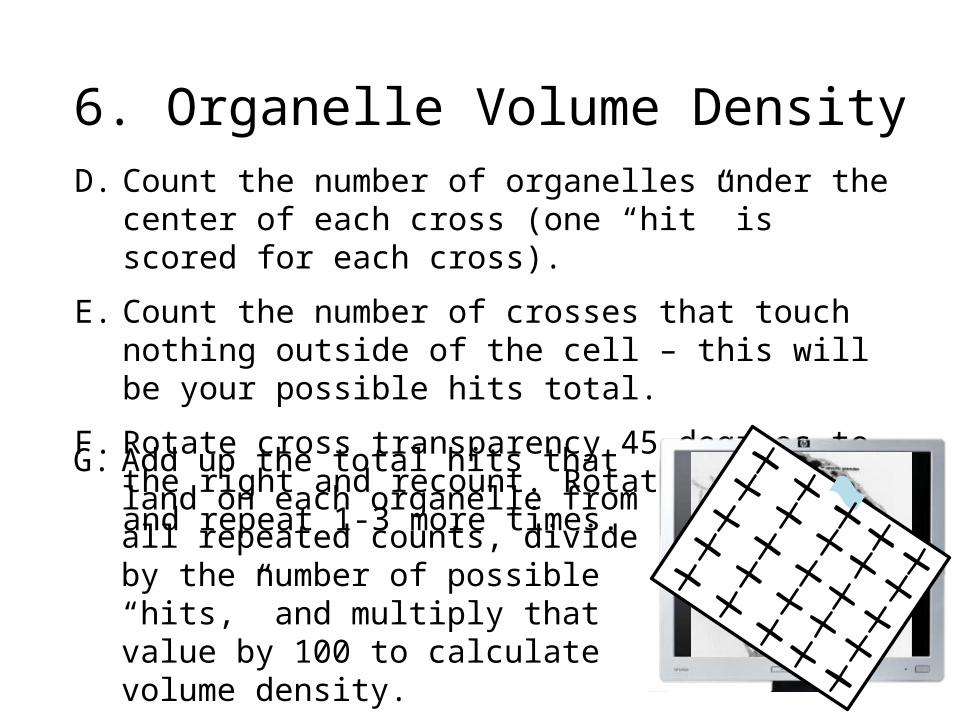
A. Print out the Plus Counter on a transparency sheet. B. Set the magnification to 80x. C. Hold the Plus Counter transparency over the computer screen. Tape it in place if need be. D. Count the number of organelles under the center of each cross (one “hit” is scored for each cross).
E. Count the number of crosses that touch nothing outside of the cell – this will be your possible hits total.
F. Rotate cross transparency 45 degrees to the right and recount. Rotate another 45 and repeat 1-3 more times.
G. Add up the total hits that land on each organelle from all repeated counts, divide by the number of possible “hits,” and multiply that value by 100 to calculate volume density.
A. Print out the Plus Counter on a transparency sheet. B. Set the magnification to 80x. C. Hold the Plus Counter transparency over the computer screen. Tape it in place if need be.
D. Count the number of organelles under the center of each cross (one “hit” is scored for each cross).
E. Count the number of crosses that touch nothing outside of the cell – this will be your possible hits total.
F. Rotate cross transparency 45 degrees to the right and recount. Rotate another 45 and repeat 1-3 more times.
6. Organelle Volume Density
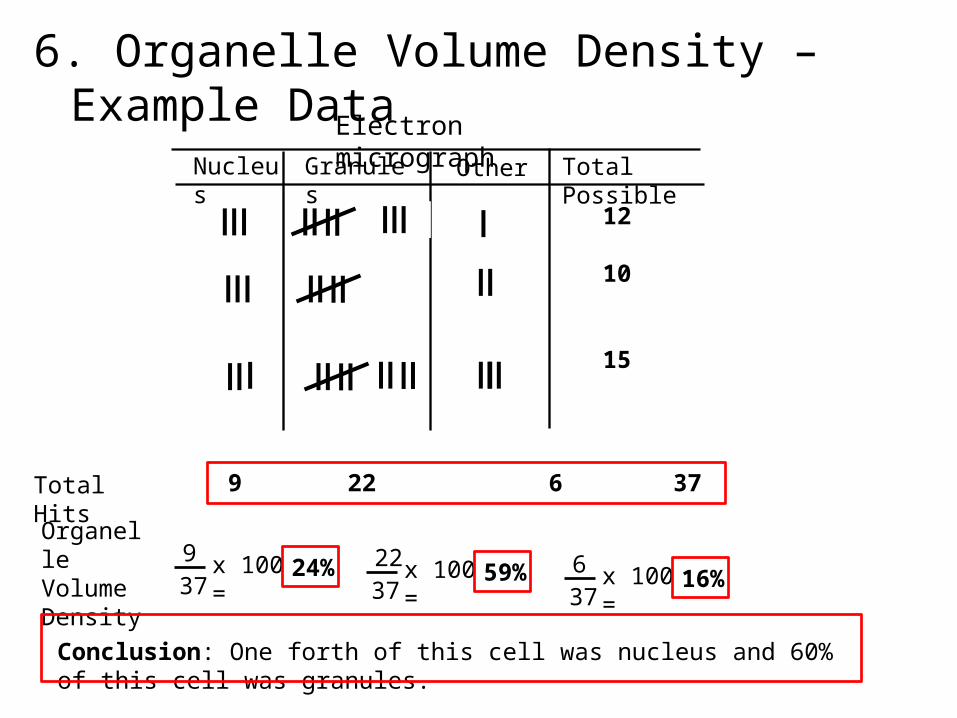
Total Hits 9 22 6 37
6. Organelle Volume Density – Example Data
OrganelleVolume Density 37
9 x 100 = 24%3722 x 100 = 59%
376 x 100 = 16%
Total Possible
Electron micrographNucleus Granules Other
12
10
15
Conclusion: One forth of this cell was nucleus and 60% of this cell was granules.
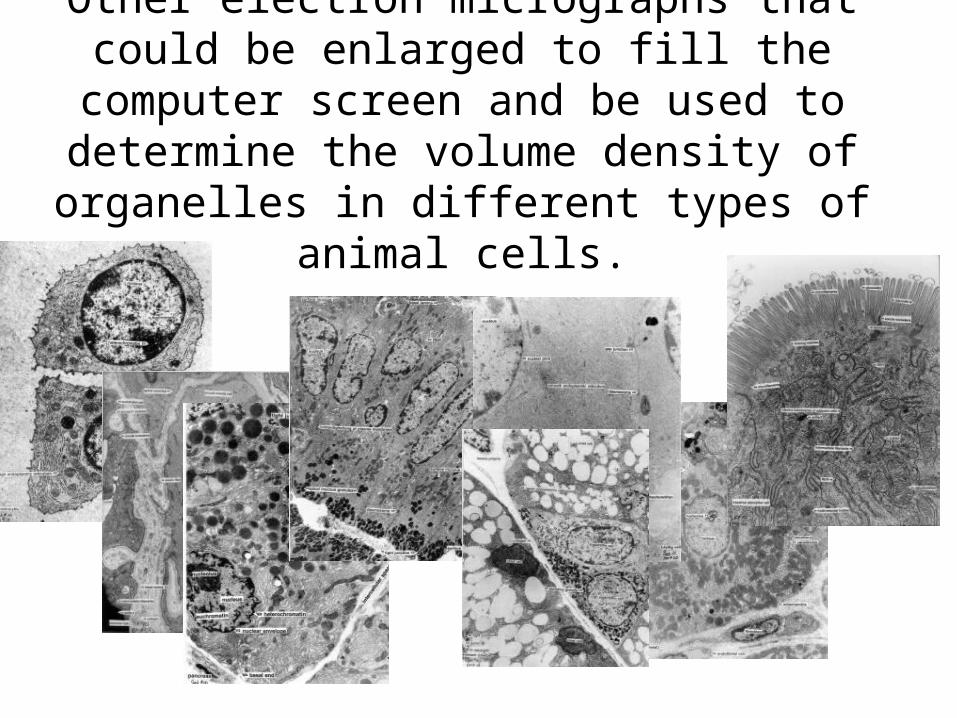
Other electron micrographs that could be enlarged to fill the computer screen and be used to determine the volume density of organelles in
different types of animal cells.

Toolkit Contents
1. Operating Online Microscope Images
2. Cell Count
3. Cell/Tissue Volume Density
4. Percentages of Cells
5. Diameter of Cells
6. Organelle Volume Density
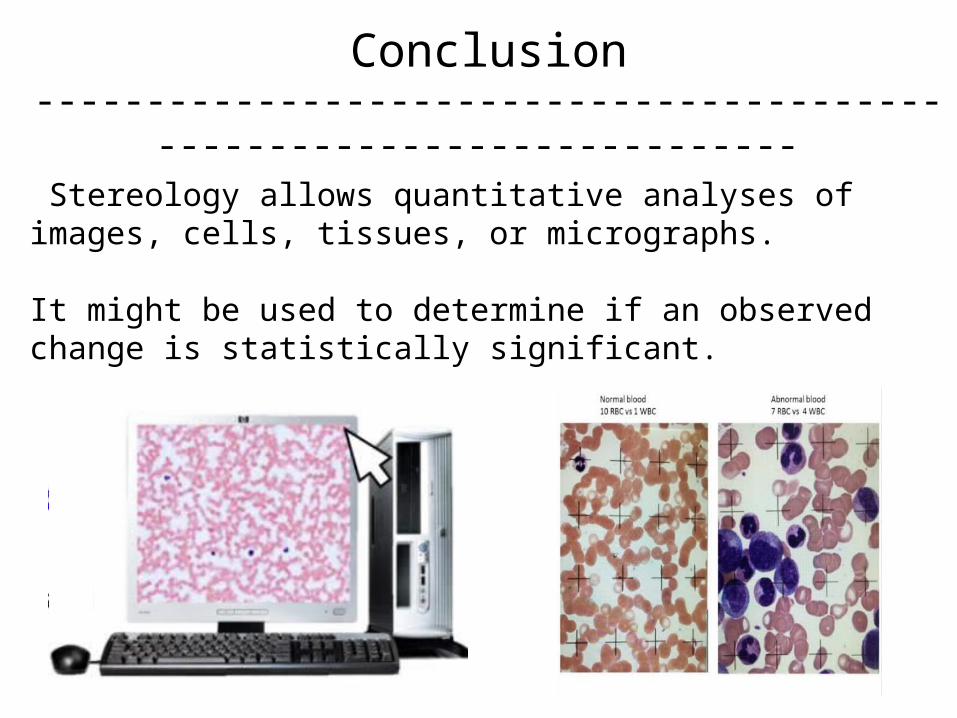
Conclusion---------------------------------------------------------------------- Stereology allows quantitative analyses of images, cells, tissues, or micrographs.
It might be used to determine if an observed change is statistically significant.
The end of
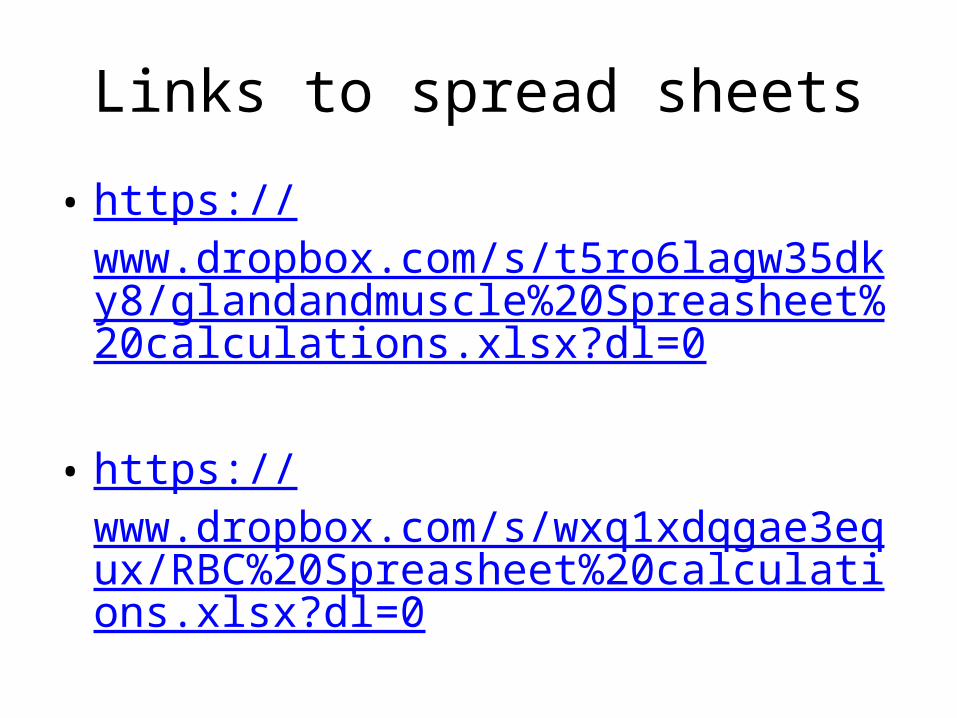
Links to spread sheets
• https://www.dropbox.com/s/t5ro6lagw35dky8/glandandmuscle%20Spreasheet%20calculations.xlsx?dl=0
• https://www.dropbox.com/s/wxq1xdqgae3equx/RBC%20Spreasheet%20calculations.xlsx?dl=0