Embed Size (px)
Citation preview

1
Online formative MCQs to supplement traditional teaching: a very
significant positive impact on student performance in the short and
long run1
Abstract
The paper builds on the research underpinning One Lecturer’s Experience
of Blending E-learning with Traditional Teaching (Catley, 2005). It analyses
the earlier findings in more depth and examines the longer term impact of
online quizzes on student performance. Engagement with formative online
MCQs is explored generally and the links between MCQ engagement and a
range of student characteristics: seminar attendance, “A” level performance,
age, nationality, gender and prior study of the discipline are analysed. The
relative impact on performance of online formative quiz taking in one 15
credit first year module is compared to the impact of these other
characteristics at modular, year and degree level. The case study involves
in total 897 students, with particular focus on the results of one year’s
results (n=201). Analysis of the data for this year found the A level grades of
those who engaged with the formative MCQs were identical to those who
did not engage. However, the research identified certain groups as more
likely to make use of the online support: namely mature students,
international students and non-A level entry students. Students who took the
1 I am indebted to Ros Clow of the Department of Education at Oxford Brookes University and Dr.
Lisa Claydon of the Department of Law at the University of Manchester for reading and commenting
on previous drafts of this research. I am also indebted to Dr. Paul Redford of the Psychology
Department of the University of the West of England for his willingness to give me a crash course in
statistics and for his willingness to discuss the best statistical models to adopt to interrogate the data.
Finally I would like to thank JISC for featuring the early stages of this research in their guide
Effective Practice with e-learning: A good practice guide in designing for learning published in
2004.

2
online quizzes offered in the first year module performed better in the
module, in the first year of their studies and over the degree as a whole. The
conclusion is that engagement with online formative MCQs had a very
significant impact on performance: an impact that was more significant than
that for any other variable: being nearly twice as significant as seminar
attendance and five times more significant than prior qualifications.
Background
The original article (Catley, 2005) focused on the impact of online quizzes
on the performance of students on Legal Method: a compulsory law module
undertaken by all undergraduate law students in the first term of their first
year at Oxford Brookes University. The course was central to their future
law studies providing the building blocks on which that study is based. In
particular the course focused on developing a lawyer-like way of thinking,
through assisting students in reading, understanding and applying case law
and statutes.
A comment on the figures
The original article considered the performance of all students taking the
module. Subsequently the data was re-assessed excluding students who
were re-taking the module. The reasons for excluding these students were
multiple. For example, if they had failed and had no medical or other
extenuating circumstances they would have been capped to a maximum
mark of 40%. Whilst the data used originally had incorporated these
students’ actual marks rather than their capped marks, the demotivating

3
impact of knowing that your mark is capped meant that these results should
probably have been excluded. Additionally, if they had progressed to year
two they would probably be taking a full complement of second year
modules at the same time as retaking Legal Method. The tiny number of
students registered for the module, who submitted no assessed work have
also been excluded. The exclusion of these students had only a very small
impact on the overall figures, largely because the number of re-taking
students and registered, but non-active students was very small. However,
their exclusion, arguably, gives a more accurate assessment of the impact
of the introduction of the online quizzes.
The Perceived Problem
The module teaching team were aware that the results could be better. The
results for 1999-2000 and 2000-2001 were typical of the situation before the
introduction of any online elements into the course.
Chart 1

4
0%
5%
10%
15%
20%
25%
30%
35%
Under
40%
40-49% 50-59% 60-69% 70% +
Student Marks
Marks prior to the introduction of any on-line
elements
1999-2000
2000-2001
Table 1 - Marks prior to the introduction of any online elements
Legal Method Results 1999-2000 and 2000-2001
1999-2000 2000-2001 Aggregate results 1999-2001
Mark Grouping
Number of
students
Percentage of cohort in each mark grouping
Number of
students
Percentage of cohort in each mark grouping
Number of
students
Percentage of cohort in each mark grouping
70% +
7 5.6% 9 8.9% 16 7.0%
60 - 69%
21 16.7% 13 12.9% 34 15.0%
50 - 59%
35 27.8% 20 19.8% 55 24.2%
40 - 49%
33 26.2% 31 30.7% 64 28.2%
Under 40%
30 23.8% 28 27.7% 58 25.6%
Size of cohort
126 101 227

5
The results for both years were broadly in line - approximately 25% of the
students failed to reach the pass mark of 40%, a similar percentage got
marks in the 40s. Fewer than 25% achieved marks of 60%+, with
considerably fewer than 10% gaining marks of 70%+. If one wished to put a
positive gloss on the figures then around 75% passed at first attempt, and of
the remaining 25% many passed the re-sit - the overall pass rate after the
re-sit was around 85%. However, this interpretation conceals several issues.
Firstly although the pass rate for those re-sitting was quite good (63% in
2000-01), not all students offered re-sits took up the opportunity to re-sit and
not all students were eligible to re-sit. Secondly the re-sit exam was under
the university modular scheme scheduled for the Saturday of the third week
of the following term. This meant that students, who had struggled in term
one, had in addition to their term two studies to prepare for the re-sit exam.
Perhaps even more importantly, as stated above, the knowledge acquired in
Legal Method is central to the students’ future legal studies. Therefore the
hope would be that all students would acquire a sound basis for their future
studies - the results indicated that not only were 25% not achieving sufficient
understanding to pass at first attempt, but that less than 25% were
achieving a very good understanding - assuming that such a level of
understanding was reflected by a mark of 60% and above.
Linked to this, the tutors were trying to impress on the students that if they
wanted to pursue a career in the legal professions they would have to
perform well in their law degree. Tutors were explaining that each year there

6
were approximately twice as many law graduates as there were training
places to become solicitors and barristers and that as a consequence their
final degree classification was likely to be critical in the selection process
and that if they wanted to enter the profession (as most did at the start of
their studies) then they should be aiming for an upper second class honours
degree or better (i.e. a graduating average of 60% and above). This advice
was felt necessary so that students appreciated that if they were to enter the
profession they needed to do more than just pass. However, with less than
25% of students achieving this 60% target in Legal Method, the risk was that
many would feel dispirited at an early point of their legal studies.
Possible reasons for poor performance
There were a number of explanations for the low marks. Many of these
reasons would apply not just to this particular module but to virtually all first
year courses at virtually all universities. Many students were away from
home for the first time. Some were homesick. Some were enjoying the
opportunities afforded by their new found freedom. Some were forced to
seek paid employment in order to fund their studies. Some were studying in
a foreign country and possibly not in their first language.
Some of the reasons stemmed from the fact that Law is one of a number of
undergraduate courses where typically most students have never studied
the subject prior to university and therefore do not know what is expected of
them. Of the 2003-04 cohort only 44 out of 201 (21.9%) had studied Law at
A-level or AS-level. Ten years later, the percentage of law undergraduates

7
to have taken law prior to university will typically be higher, but is still likely
at most institutions to be a minority.
Other reasons were peculiar to the Brookes’ modular scheme. The modular
structure at this time was that each single module was worth 15 credits and
ran for 8 teaching weeks. There was then one week for revision followed by
one week for exams. The whole Legal Method module was therefore
completed before Christmas. The module was assessed by a coursework
exercise and an exam (75% exam, 25% coursework). In order to allow
students sufficient time to reflect on the feedback for the coursework, the
course team considered that the coursework had to be returned by week 7 -
this meant that, in order to allow time for marking, the coursework had to be
submitted in week 5. Therefore students who had never studied law before
were submitting coursework on which 25% of their marks would rest after
only five weeks and were sitting the exam in their tenth week at university.
Given the distractions of university life and the conflicting pressures on their
time it was perhaps a major achievement that around 75% of students were
passing the module at first attempt. Nevertheless, the aim of the changes
was to improve that rate without making the course academically less
rigorous.
Considering change
As previously stated, Legal Method is a skills based module aimed at
developing a lawyer-like way of approaching legal problems and handling
legal materials. The course content reflected this and the course team and

8
colleagues teaching other first year law modules agreed that the course
content should not be changed.
Similarly the assessment was felt appropriate. Students were assessed on
statutory interpretation in the coursework exercise. The examination was
split into Section A consisting of ten short questions testing their knowledge
of the material covered in the lectures and Section B in which about six
questions were asked on a case report supplied to students in the final
lecture. All questions in the examination were compulsory as it was felt that
students should have developed all the knowledge and skills covered in the
course and should not think that they could omit some parts from their
revision. In addition the course was assessed by means of a library exercise
testing their ability to retrieve paper and electronic resources. The library
exercise was assessed on a pass/fail basis.
The module was taught by a mixture of lectures and seminars. Each student
had two hours of lectures on the module each week and one hour of
seminars. The seminars provided the main opportunity for students to
develop the skills involved in reading, understanding and applying case law
and statutes. Average seminar group size was, assuming full attendance,
around 15. Resource constraints meant that is was not feasible to reduce
teaching group sizes or offer additional class contact.
In addition to lectures and seminars, students were also provided with a
Skills Booklet which gave guidance as to the assessment criteria that would

9
be used and detailed the skills that students were expected to develop
during the module. The Skills Booklet also contained details of past
assessment exercises together with examples of good and bad answers
with explanations as to why certain answers were better than others.
Whilst the teaching team considered that students should have been well
prepared for the assessment, a recurrent feature of end of module student
feedback was that a minority of students wished they had been better
prepared.
The first change
This was done for the 2001-02 cohort. The guidance covered both the
coursework and the examination. The online coursework guidance was
based on the previous year’s coursework exercise. The approach adopted
was, looking back, hardly sophisticated! Students were shown on screen an
extract from a statute and an accompanying question. They were then
asked to work out their answer and write it down. Once they had done this
they were instructed to click “next”. This took them to a screen which
detailed the issues that they should have covered. Again they were given
the opportunity of clicking “next” when they had read through this guidance.
This linked to the marking criteria. It was then suggested that they use this
to assess their earlier written answer. Students were then given the
opportunity to consider three more coursework questions - all following the
same procedure.

10
The exam guidance followed a similar approach and was based on the
previous year’s exam. Instead of the three stage approach adopted for the
coursework - (1) question, (2) guidance, (3) mark scheme - the exam
guidance followed a two stage approach - (1) question, (2) mark scheme.
This slightly amended scheme was adopted because it was felt that with 10
Section A questions and 6 Section B questions student might tire of the
three stage approach and prefer a two stage approach. The system was
very low tech in that they were not writing their answers online and they had
to mark themselves rather than receiving automated feedback and marks.
However, this approach of self-marking could be argued to be preferable in
that it encouraged self assessment and enabled students to engage with
and reflect on the assessment criteria (Boud, 2013). However, it was not
known who had visited the site and whether once there they had followed
the instructions and completed the task. Students were asked, in the end of
term feedback, whether they had used it for the coursework exercise. 42%
of respondents (70% response rate) stated that they had done so and of
these 86% said that they considered that it had been valuable. As the
feedback was collected in the final lecture it was not possible to gauge
whether the exam guidance would be used or whether it would be found to
be of use. A question was asked as to whether students intended to make
use of the online guidance relating to the examination before they sat the
exam. 100% of respondents said that they intended to make use of the
guidance. There are various possible explanations for this response: were
students simply responding in the manner they thought the module leader

11
wanted (but if so, why did only 42% report using the coursework guidance),
were they expressing their true intent or was it more a case of wishful
thinking. As the end of module questionnaire was anonymous and as there
was no follow up survey the true meaning of the unanimous response will
remain unknown.
The impact of the first change
The results for 2001-02 showed a marked improvement.
Table 2 Results before and after the introduction of online guidance
Aggregate results 1999-2001
(before the introduction of online guidance)
Results 2001-2002
(after the introduction of online guidance)
Mark Grouping
Number of students
Percentage of cohort in each mark grouping
Number of students
Percentage of cohort in each mark grouping
70% +
16 7.0% 17 11.4%
60 - 69%
34 15.0% 37 24.8%
50 - 59%
55 24.2% 41 27.5%
40 - 49%
64 28.2% 34 22.8%
Under 40%
58 25.6% 20 13.4%
Size of cohort
227 149
Chart 2

12
0%
5%
10%
15%
20%
25%
30%
Under
40%
40-
49%
50-
59%
60-
69%
70% +
Student Marks
Impact of the online guidance
Prior to online
guidance
Following online
guidance
As Chart 2 shows the distribution of marks after the introduction of online
guidance became much closer to a classic bell curve distribution - more
results fell into the 50-59% category than any of the other groupings,
roughly equivalent numbers got marks in the 60s as in the 40s and similarly
the number gaining marks of 70% and above was broadly in line with the
number getting marks of under 40%. This was a very different shaped curve
to that achieved in the two previous years which had seen most of the
students getting under 50% and hardly any getting marks in excess of 70%.
The improved results were also reflected in the improvement in average
marks.
Table 3
13
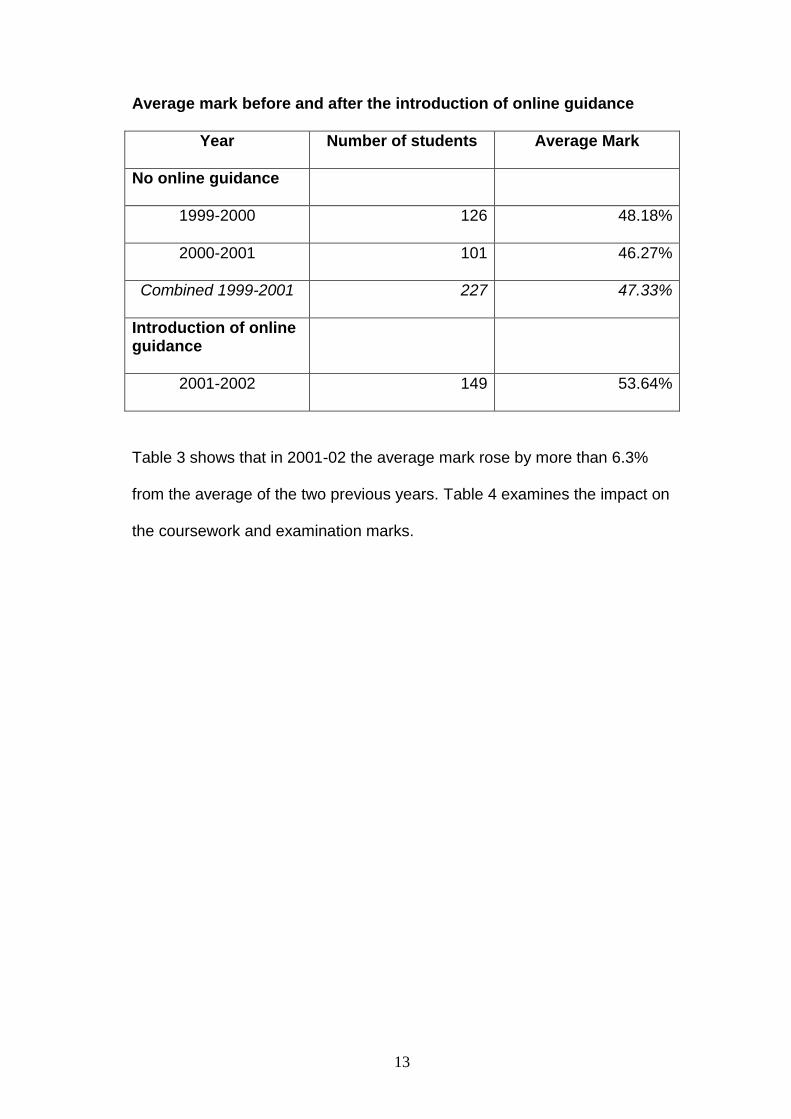
Average mark before and after the introduction of online guidance
Year Number of students Average Mark
No online guidance
1999-2000
126 48.18%
2000-2001
101 46.27%
Combined 1999-2001
227 47.33%
Introduction of online guidance
2001-2002
149 53.64%
Table 3 shows that in 2001-02 the average mark rose by more than 6.3%
from the average of the two previous years. Table 4 examines the impact on
the coursework and examination marks.

14
Table 4
Average marks for coursework and examination before and after the
introduction of online guidance
1999-2001 2001-2002 Difference between 2001-02 results and 1999-2001 results
Number of students
227 149
Average Coursework mark (out of 25)
12.51 13.54 + 1.03
Average coursework mark expressed as a percentage
50.02% 54.16% + 4.14%
Average exam mark (out of 75)
34.83 40.11 + 5.28
Average exam mark expressed as a percentage
46.44% 53.48% + 7.04%
Table 4 shows that the average mark for both the coursework and the exam
increased after the introduction of online guidance. Interestingly most of the
improved performance relates to improved exam performance. Average
marks for the coursework rose by just over one mark, whereas average
marks for the exam increased by more than five marks. This is partly
explained by the greater weighting given to the exam, 75% as against 25%.
However, even allowing for this if one looks at the improvement in terms of
the percentage of marks available for each part then in percentage terms
the 7% improvement in exam performance exceeded the 4.1% improvement
in coursework performance.
15
Cause or coincidence?
The introduction of online guidance had coincided with a fairly dramatic
improvement in the marks. Other course elements had remained unchanged
and yet it was not possible to prove a causal link between the online
guidance and the improved performance. The system providing guidance
did not enable those students who accessed the site to be identified, indeed
it did not even monitor whether anyone accessed the site at all. The end of
course feedback suggested that a significant minority had accessed the
coursework guidance and found it useful. As this feedback was anonymous
it was not possible to examine whether those using the guidance had
outperformed those who had not. The same feedback also suggested that
every respondent intended to look at the guidance before the exam. It was
impossible to know whether they had in fact done so.
Aside from the introduction of the online guidance, the course had not
changed in 2001 from the course that had been run over the previous two
years. The same lecturer continued to deliver all the lectures and the lecture
content remained unchanged. Similarly the seminars remained unchanged
as did the assessment scheme. Entry requirements for the course were
unaltered and the recommended course textbook was unchanged.
Obviously the questions asked in the coursework and exam did vary, but the
aim was to retain a comparable level of difficulty. Therefore the only
apparent change was the introduction of the online coursework and exam

16
guidance. There was a strong suspicion that the introduction of the online
guidance had led to better results. However, there was no evidence that the
change was not simply a one-off occurrence which would not be sustained.
Similarly there was no evidence that those who had done better were those
who had accessed and utilised the guidance.
The improved performance needed to be investigated. However, in view of
the scepticism expressed in some quarters about the effectiveness of e-
learning, it seemed advisable to investigate this scepticism as well as
assessing the drivers behind the growth of online learning.
Context: reviewing the literature of the time
The second half of the twentieth century heralded the advent of mass higher
education in the United Kingdom. Dearing noted that the number of students
in higher education had over the previous twenty years “much more than
doubled” whilst the “unit of funding per student has fallen by 40 per cent”
(NCIHE,1997: summary report - para. 14). As Lindsay and Breen
commented
“massification of HE simultaneously increased student: staff ratios
requiring recruitment from further down the population ability curve.
Universities were forced to reduce lecturer input per student just as
there was an increase in the input needed by the average student to
maintain existing standards.” (2000: 9)

17
As universities have looked for means to bridge the funding shortfall this has
led to additional pressures on teaching staff including pressure to publish
fuelled by the Research Assessment Exercise and now the Research
Excellence Framework, pressure to act as consultants and pressure to
develop so-called full-cost courses. In this new world there has been a
danger that the undergraduate degree which remains the core business for
most universities becomes the forgotten Cinderella starved of resources and
attention. Even the introduction of £9,000 per year fees does not seem to
have transformed the undergraduate degree from its Cinderella status.
Adverts for academic posts, even outside the research intensive
universities, still typically focus on research rather than teaching. The
apparent ability to produce 3* and 4* publications and attract research
income is typically given much more prominence in recruitment and
promotion decisions than the ability to deliver successful undergraduate
courses and achieve high National Student Survey results.
Changes in secondary schooling have arguably exacerbated this position.
Preoccupation with league tables has led schools to place great emphasis
on assisting their students to do as well as possible. Changes in
assessment at GCSE and A-level have led to students arriving at university
with less experience of the approaches to teaching and assessment
adopted in subjects such as law at university. As an anonymous Head of a
University Law Department said:
“Students do modular ‘A’ levels now and they are not used to
studying for a year and taking a three hour exam. That culture is

18
gone. You hit students with that kind of thing these days and it has a
massive impact on them. They are not used to doing it. It’s not that
they are not as bright, they are, but they are being skilled differently
at school and we have to appreciate that.” (Clegg, 2004: 30)
This change is also borne out by Bermingham and Hodgson when they note
that:
“students entering higher education, at least in the subject of law,
experience a culture shock as they move from a system where
previously they were given regular feedback on essays and
encouraged to submit drafts of coursework assignments for formative
comments, to an environment where they are largely left to their own
devices, and with contact time dropping from 20 (or more) hours to
less than ten.” (2006: 153)
This pressure on resources appears to apply across the sector. Clegg
(2004) in her review of undergraduate law teaching at a selection of different
universities noted that resources were considered a problem for all the
departments. Bermingham and Hodgson’s assessment of current contact
time appears in line with Harris and Beinart’s larger survey of law schools
(2005) which found 77% of qualifying2 law degree courses involved students
in attendance at less than 10 hours of lectures per week.
This pressure on resources has also meant a general decline in the quantity
of feedback provided for students (Higgins et. al., 2002). This paucity of
formative feedback has also been witnessed in undergraduate law teaching
2 A qualifying law degree course is one that satisfies the Law Society and Bar Council’s
requirements as an appropriate training for a student wishing to become a solicitor or a barrister. The vast majority of law degree courses have this status.

19
(Bermingham & Hodgson, 2005; Bone, 2006). The picture is not however
unique to the United Kingdom, Peat (2000) writing about the Australian
experience notes the pressure of increasing student numbers and declining
resources and comments that in such a context formative feedback is seen
as expensive and expendable. It is also interesting to note that British
academics’ concerns that school students are ill prepared for university with
its focus on independent higher level learning are mirrored by Peat’s view of
first year biology students at the University of Sydney: “many students have
an expectation of being spoonfed, a residue of a high school surface
approach to learning” (2000: 2).
To summarise higher education in the early twenty first century faces a
multiplicity of problems: increased student numbers have been combined
with reduced resources per student, a position which changed briefly with
the introduction of higher fees in 2012, though the extent to which such
improved income streams have been directed towards undergraduate law
teaching is perhaps questionable in many universities. A more diverse
student body, drawing in students who would previously not have gone to
university and who probably have greater need of academic support, can
expect less class contact as teaching staff are diverted into other activities
to attempt to address the funding shortfall. Students who have emerged
from increasingly supportive school environments arrive at university to find
that previous support mechanisms such as formative feedback on practice
essays are now rarely available. The result seems likely to be that more

20
students will fail or that standards will fall unless a low cost solution can be
found.
E-learning to the rescue?
Lord Dearing’s National Committee of Inquiry into Higher Education was of
the view that “… C&IT3 will have a central role in maintaining the quality of
higher education in an era when there are likely to be continuing pressures
on costs and a need to respond to an increasing demand for places in
institutions." (NCIHE, 1997: para. 13.2) Universities appear to have acted
upon Dearing’s advice. Jenkins et. al. (2001) noted that, just four years after
Dearing, 80% of the 70 higher education institutions surveyed ran a Virtual
Learning Environment (“VLE”) for their students. It is likely that if that survey
were to be repeated today the figure would be 100%. This interest in e-
learning is not entirely new. Whilst Gibbs and Jenkins’ seminal work
Teaching Large Classes in Higher Education: How to Maintain Quality with
Reduced Resources (1992) made no mention of it, Graham Gibbs’
subsequent work Improving Student Learning through Assessment and
Evaluation (1995) did include consideration of the educational effectiveness
of computer-based learning. Prior to 1995 computer based learning may not
have been the norm but it did exist, for example Wang et. al. (2004) citing
Bork (1981) trace references to computer based teaching in science back to
the 1970s. The primary driver for the expansion of e-learning in the late
1990s appears to have been the belief that it could provide a quick fix
(McArthur & Lewis, 2001).
3 Communications and Information Technology.

21
The change also links to a perception that students are changing. Lindsay &
Breen see computers as having “become part of a learning support triarchy
with teachers and books as the other two elements” (2000: 10). This view
that today’s students use computers and the internet so routinely outside the
university context has led Gipps to suggest that students “using mainly
paper-and-pencil approaches within education makes the formal learning
setting seem anachronistic.” (2005: 174). Mackie (2006) has charted the
way in which computers have become a part not only of the student’s every
day life, but also part of the school student’s school life from researching
coursework via Google and Wikipedia to revising by means of sites such as
GCSE Bitesize, Sam Learning, Exams Tutor, S-Cool! and Tutor2U. This
new style learner has been termed “Homo Zappiens” by Veen (2003, 2005)
who views the changes as being educationally more significant than the
normal changes from generation to generation.
There is a considerable body of support for the incorporation of e-learning
into higher education generally (Laurillard, 1993) and into law teaching more
specifically (Migdal & Cartwright, 2000). However, this support, together with
the changes in students’ approaches to learning, has not been met by
wholesale changes in teaching methods. Although class contact may have
fallen (Bermingham & Hodgson, 2005), the basic approach to university law
teaching has according to Clegg (2004) remains the tried and trusted model
of lectures, seminars and tutorials.

22
There has been a growth of purely or primarily online courses, but these
have tended to be restricted to students studying by means of distance
learning (Bates, 2005) and this approach has tended to be reserved for
courses aimed at students studying part-time whilst working full-time.
Generally such courses have also been dogged by low completion rates
(Brennan, 2003). Massive open online courses have been particularly
dogged by poor completion rates (Breslow et. al., 2013; Jordan, 2014;
Simpson, 2012, 2013). This may be explained by students feeling a sense
of isolation without the face to face communication provided in the traditional
classroom setting (March, 1995) and difficulties in discussing and
developing ideas online (Duffy et. al, 1998). Low completion rates may also
stem from technological problems (Kerka, 1996) which may themselves link
into problems of sustaining student motivation in an online environment
(Muilenberg & Zane, 2005). These problems may explain why purely or
primarily online courses have rarely been offered to full-time undergraduate
students studying at university. In addition they run counter to the student
expectation that higher education will involve classes and face to face
dialogue with staff and with their fellow students.
However, Clegg (2004) notes that, whilst some law lecturers were
enthusiastic about incorporating e-learning into their teaching, the majority
were not. These findings mirror other accounts such as that of Challis &
Lidgey who bemoaned staff reluctance “to convert existing learning resource
material into electronic form”, explaining it in terms not only of staff having
insufficient time and technical expertise, but also citing technophobia and a

23
failure on the part of staff to perceive any benefit in the change. Challis &
Lidgey’s conclusion was that e-learning action plans “must address these
blocks and find a way to overcome them.” (2000: 6). Schoepp’s findings
(2005) reinforce the view that uncertainty as to how best to integrate
technology and lack of technical and pedagogic support are significant
barriers to the more widespread adoption of e-learning techniques.
Evidential support for e-learning?
Staff failure to embrace e-learning may be well grounded. Even if they did
have sufficient time and expertise would more online learning enhance the
courses taught?
Russell’s review (1999) of 355 research projects suggests that in terms of
student performance there is very often no statistically significant difference
between how courses are taught. However, his investigation (covering the
period 1928 - 1998) largely predates the growth of computer based learning
and of the 355 projects examined only 40 of the studies cover computer
based instruction. Since the publication of Russell’s book more
investigations have been published many of which support his basic
premise that “[t]here is nothing inherent in the technology that elicits
improvements in learning (1999: xiii). Many of these can be accessed on the
self-styled “no significant difference phenomenon website”.4 In addition to
4 “The no significant difference website” is hosted by the Western Cooperative for
Educational Telecommunications (“WCET”) and is accessible at: http://nosignificantdifference.org/ . In addition to promoting Russell’s book it also includes numerous articles on the impact or otherwise of different teaching approaches.

24
work referred to on that site, there is further research which supports the
contention that the method of delivery does not affect student performance.
Ryan (2001, 2002) found no significant difference in terms of final course
grades between students taught in traditional lecture based classes and
those taught by means of distance learning whether by means of a web-
based course or a telecourse. Schutte’s findings (1997, 1998) that students
performed on average 20% better on an online course were not replicated
by Jones (1999) when he attempted the same experiment. On the other
hand not all research indicates that the approach adopted had no impact, for
example Radhakrishnan & Bailey (1997) found that a web-based approach
led to better results than a classroom based approach. However, it is
important to note that the primary focus of Russell (1999) and that of Ryan
and of Radhakrishnan & Bailey was on the impact or otherwise of distance
education as against traditional face-to-face instruction and that they were
therefore not examining the impact of e-learning as a supplement to
traditional teaching approaches.
Some investigations have suggested that including course materials online
to support traditional teaching methods can improve student performance.
Hellweg et. al. (1996) found that student pass rates improved when course-
related material was made available online as well as through traditional
means. Pearson & Trinidad noted, based on previous work in which Trinidad
had been involved (Aldridge et al, 2003; Trinidad et al 2001), that student
retention and achievement could be improved in an “outcomes focussed
and technology-rich learning environment” (2005: 396). However, Pearson &
25
Trinidad’s assessment of the effectiveness of the online learning activities
when they subsequently trialled them at the University of Hong Kong does
indicate some problems: “student comments about ‘too much information’,
‘too many online forums’ and the content of the module being ‘out of touch’.”
(2005: 397) Given that the students in question were part-time students
studying for a Masters in Information Technology in Education one might
have anticipated that they would be very ready to embrace e-learning
initiatives; the fact that there were problems is disturbing. The paper
explains how these problems were tackled, but in many ways the account
appears to support the need for close monitoring of courses and the need to
be outcome focussed rather than supporting the inherent merits of e-
learning as a supplemental tool. Notwithstanding research such as that of
Hellweg et. al. and Pearson & Trinidad, there appears to still be
considerable justification for Coates & Humphreys’ comment that:
“Little is known about the effectiveness of these web-based
supplements to face-to-face instruction. How intensively will
students utilize online course materials? Does access to
online course materials increase student comprehension and
retention? Despite the paucity of answers to these and similar
questions the rush to make online technologies an important
component of higher education continues.” (2001: 133)
Searching for a model that works.
The lecturer who decides to embrace e-learning faces a choice of
methods to adopt. The Dearing Report, when advocating e-learning was not

26
specific as to what should be done. It was simply stated that “C&IT5 will
have a central role in maintaining the quality of higher education in an era
when there are likely to be continuing pressures on costs and a need to
respond to an increasing demand for places in institutions." (NCIHE, 1997:
para. 13.2).6 Cliff Allan, Director of Programmes for the Higher Education
Academy, in his foreword to the 2005 HEFCE strategy for e-learning wrote
about the need to “carry forward strategies based on evidence of what
works” (HEFCE, 2005a: 1). Elsewhere the strategy document talks about
“embedding e-learning appropriately, using technology to transform higher
education into a more student-focused and flexible system” and meeting
“the needs of learners and their own aspirations for development” (HEFCE,
2005a: 5). However, whilst the strategy recognises the need to base
developments on “what works” the policy document does not provide
answers as to what does and does not work.
Online quizzes / formative tests
The idea of using online formative tests or quizzes is well established
(Byrnes et. al., 1995; Carbone & Schendzielorz, 1997; Hammer &
Henderson 1972). However, the ease of introduction is now much easier
with almost all VLEs providing this facility. The potential of online multiple
choice questions (MCQs) is also well documented (Bailey et. al., 2001;
Bonham et. al., 2000; Bower, 2005; Buchanan, 2000; Dalziel & Gazzard
1998, 1999; Khan et. al., 2001). Some of the benefits include improved
student performance by those who score well in quizzes (Bailey et. al.,
5 Communications and Information Technology.
6 For a discussion of this quotation see page 19 above.

27
2001), the value of timely and immediate feedback (Brass & Pilven, 1999;
Dalziel, 2001; Hammer & Henderson, 1972; Mazzolini, 1999) and linked to
this the benefit for students of easy access coupled with the ability to
monitor personal progress (MacDougall et. al. 1998). In the circumstances it
is perhaps not surprising that online MCQs have received positive feedback
from students (Hammer & Henderson, 1972) and are perceived by students
to be a valuable educational tool (Hester, 1999). Online quizzes also provide
valuable information for tutors (Mazzolini, 1999) in that the tutor can
discover how many and which students are taking the quizzes, how well
each student is performing and how well students are doing on particular
questions.
Online MCQs appeared to me to be a useful supplement to the existing
course. The system available at Brookes at the time of introduction offered
the facility to set questions in six different MCQ formats. The question setter
could determine when the questions would become available and when they
would cease to be available, which mark would be recorded, if any, for
example the first, the highest or the last, how many attempts students would
be given and also provided the facility to provide feedback tailored to the
particular answer chosen. Whilst not experienced in setting MCQs the
technology itself proved easy to use and the main difficulty I found was in
finding suitable “wrong” answers and precisely wording questions so that
only one answer was correct. Additionally designing feedback for wrong
answers that would provide pointers to the correct answer, but would not
give it away was also surprisingly time consuming. In this my experience

28
supported Ruzic’s finding (2000) that the creation of e-learning materials is
usually very time consuming.
I chose to create a quiz for each of the eight lectures, these would become
available online immediately after the lecture and would remain available
throughout the duration of the module. In this way they would provide an
opportunity for students to test whether they had understood the material
covered in the lecture. Additionally or alternatively they could be used as a
revision aid. I also produced a ninth quiz testing student understanding of
some of the legal abbreviations used during the lecture series; this quiz
became available at the end of the course. Whilst the exam and the
coursework contained no MCQs, one element of the exam7 tested
knowledge of the material covered in the lectures by means of ten short
questions each of which was worth three marks. Therefore the material
covered in the quizzes was potentially, though not necessarily, relevant to
one element of their final assessment. Accepting the Hedberg & Corrent
argument that “assessment drives learning” (2000: 83), but not wanting to
change the assessment methods for the module, this appeared a good
compromise. Students would hopefully see a reason for attempting the
quizzes and the knowledge they developed would prove useful in their
subsequent assessment. This aim was hopefully not unrealistic: Ellis (2000)
and Gluck et. al. (1998) both found that students welcome the idea of
computer based learning being offered as a supplement to traditional
teaching approaches.
7 Section A – worth 30% of the total marks for the module.

29
One worry I had about the use of online materials related to their
accessibility for students with special educational needs. However,
reassurances from those involved in maintaining Brookes’ WebCT provision
indicated that adaptations were in place to enable all our students to access
and use the online materials. Further the work of Kiser (2001) and
particularly that of Slem & Kane (2001) which indicated that students with
known or suspected learning disabilities found Web resources particularly
useful and used them more heavily than other students, suggested that far
from disadvantaging such students, the online materials might provide
particularly effective support for such students. More recently Seale (2006)
has set out detailed guidance as to good practice in terms of eliminating
barriers and producing e-learning materials that are accessible for all.
Assessing the impact
One issue on which there was a paucity of information was whether the
introduction of online materials would lead to better student performance.
Whilst there were guides to good practice (Bates, 1995; Salmon, 2000;),
there was a distinct shortage of material as to how many students could be
expected to engage with e-learning materials or on whether particular types
of students would be more likely to engage. Since introducing online testing
a glut of further guides to best practice have been produced (including:
Bates, 2005; Billings, 2004; Brennan, 2003; Clarke, 2004; Essom, 2005;
Garrison & Anderson, 2003; Hills, 2004; Jochems et. al. 2003; Khan, 2005;

30
Macdonald, 2006; McConnell, 2006; Quinn, 2005; Salmon, 2002; Schank,
2002; Thorne, 2003). Yet despite this wealth of publications these new
works still do not focus on detailed quantitative analysis as to what works.
Other things being equal
Throughout the period the standard entry requirement for the undergraduate
law degree remained on the old measure as 22 points at A-level. 22 points
equates to BBC or 280 points using the current UCAS points system.
Similarly the number, order and content of the lectures and seminars
remained unchanged. The format of the assessed exercises and the
proportion of marks for each element were unchanged. I remained module
leader and sole course lecturer. The recommended textbook was
unchanged. There were minor changes amongst the team of staff involved
in running seminars, but each year the majority of seminar leaders remained
unchanged.
The need to try to minimise the other changes led to the focus on the period
1999-2000 to 2003-2004. Prior to 1999 the course had been taught over 11
weeks rather than 10, with an additional one teaching week. The pre-1999
longer course format meant that there was one more two hour lecture, one
more seminar and meant the coursework could be submitted one week
later.8 These changes were considered potentially important and therefore
the 1999 cut off point was considered appropriate. 2003-2004 was
considered the final year that could usefully be compared as in 2004-2005
8 The later coursework hand in date had also allowed for a different order in which topics
were taught.

31
there were major changes to the Brookes’ modular degree. The results in
2004-05 are briefly explored in Appendix B. This analyses the increased
take up of the online quizzes after the results of the earlier research were
explained to students. However, because the module had changed as a
result of university modular changes the results of this cohort are not
included in the main analysis of the impact of the changes.
For the period 1999-2004 there were four possible groups to consider: (1)
those students who were not offered the opportunity to take the quizzes, (2)
those students who were offered the opportunity to take the quizzes, (3)
from within the second group that subgroup who chose to take the quizzes
and (4) those offered the chance to do the quizzes but who did not avail
themselves of the opportunity. As there were nine quizzes that students
could take then the third group could be subdivided in a variety of ways: for
example, according to the number of quizzes taken or the number of marks
achieved in answering quizzes.
The research had stemmed in part from the improved results in 2001-02
when online guidance had been provided. In that year, as previously
discussed, it had not been possible to know which students had accessed
the online materials and which had not. Therefore from the point of view of
results analysis this year was rather problematic as I could not accurately
categorise the students from that year as either ICT users or non-users.
Accordingly for the purposes of my evaluation I have disregarded the results
from that year and instead concentrate on comparing (1) those who had no

32
access to ICT materials (i.e. students in 1999-2000 and 2000-01), (2) those
who had access to online quizzes and availed themselves of the opportunity
and (3) those who had access to online quizzes but did not take any
quizzes.
Table 5 Results after the introduction of online quizzes
Legal Method Results 2002-2003 and 2003-2004
2002-2003 2003-2004 Aggregate results 2002-2004
Mark Grouping
Number of
students
Percentage of cohort in each mark grouping
Number of
students
Percentage of cohort in each mark grouping
Number of
students
Percentage of cohort in each mark grouping
70% +
25 14.5% 33 16.4% 58 15.5%
60 - 69%
35 20.2% 51 25.4% 86 23.0%
50 - 59%
45 26.0% 49 24.4% 94 25.1%
40 - 49%
39 22.5% 43 21.4% 82 21.9%
Under 40%
29 16.8% 25 12.4% 54 14.4%
Size of cohort
173 201 374
The results for the two years are broadly similar. In 2003-04 the results were
very slightly better that those for the preceding year. There were two
differences between 2002-03 and 2003-04. In 2002-03 the quizzes were
made available in two batches. The first batch was made available after the
week 4 lecture and the second batch after the final lecture. In 2003-04 the
quizzes became available each week after the lecture. The timing in 2003-
04 may have been slightly more helpful to students as it enabled them to
test their understanding straight after the lecture. Additionally in 2003-04
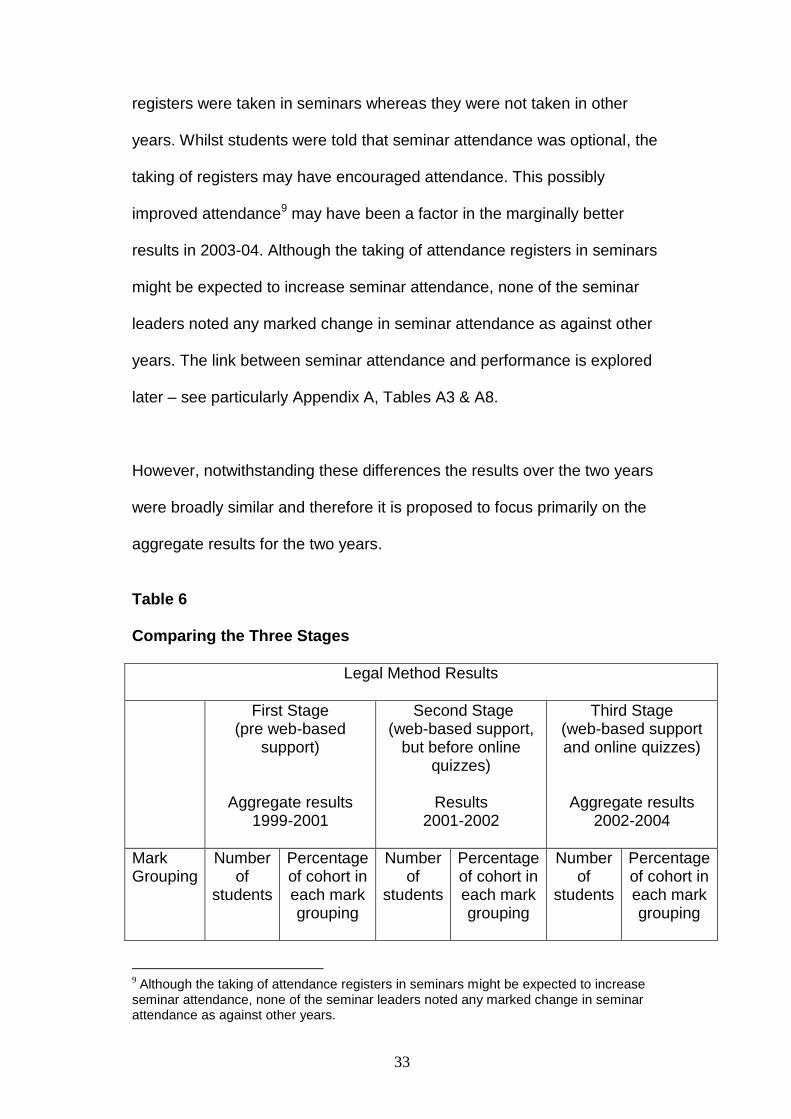
33
registers were taken in seminars whereas they were not taken in other
years. Whilst students were told that seminar attendance was optional, the
taking of registers may have encouraged attendance. This possibly
improved attendance9 may have been a factor in the marginally better
results in 2003-04. Although the taking of attendance registers in seminars
might be expected to increase seminar attendance, none of the seminar
leaders noted any marked change in seminar attendance as against other
years. The link between seminar attendance and performance is explored
later – see particularly Appendix A, Tables A3 & A8.
However, notwithstanding these differences the results over the two years
were broadly similar and therefore it is proposed to focus primarily on the
aggregate results for the two years.
Table 6 Comparing the Three Stages
Legal Method Results
First Stage (pre web-based
support)
Aggregate results 1999-2001
Second Stage (web-based support,
but before online quizzes)
Results
2001-2002
Third Stage (web-based support and online quizzes)
Aggregate results 2002-2004
Mark Grouping
Number of
students
Percentage of cohort in each mark grouping
Number of
students
Percentage of cohort in each mark grouping
Number of
students
Percentage of cohort in each mark grouping
9 Although the taking of attendance registers in seminars might be expected to increase
seminar attendance, none of the seminar leaders noted any marked change in seminar attendance as against other years.

34
70% +
14 6.3% 17 11.6% 58 15.5%
60 - 69%
34 15.1% 36 24.5% 86 23.0%
50 - 59%
53 23.7% 42 28.6% 94 25.1%
40 - 49%
63 28.1% 31 21.1% 82 21.9%
Under 40%
60 26.8% 21 14.3% 54 14.4%
Size of cohort
224 147 374
Table 6 shows that the improved results following the introduction of online
support were maintained. Prior to the introduction of online support over one
quarter of students failed the module at first attempt. After the introduction of
online support this figure dropped to less than 15%. If one categorises all
results of below 50% as disappointing, then prior to online support almost
55% of results were disappointing, but after the introduction of online
support this figure fell to just over 35%. In terms of the top results then the
percentage of marks of 70% and over rose sharply from 6.3% in the period
prior to the introduction of online support, to 11.6% when online guidance
was offered and rose further to 15.5% when online quizzes were added.
The results over the three periods are shown graphically in Chart 3 below.
Chart 3

35
0%
5%
10%
15%
20%
25%
30%
Under
40%
40-
49%
50-
59%
60-
69%
70% +
Student Marks
Comparing the Three Stages
First Stage - No ICT
Second Stage - Web
based Guidance
Third Stage - Online
quizzes
The above chart and table demonstrate that the improvement noted in the
2001-02 cohort was maintained in the following two academic years. This
supports the contention that the introduction of online support had improved
performance. However, as discussed earlier, the question that emerges is
whether this change was coincidental or whether it could be shown to be
causally linked to the introduction of online support. The first intervention,
when online guidance was offered, did not include any mechanism to test
who had accessed the online guidance and who had not – as a result it had
been impossible to test whether those who had accessed the information
had outperformed those who had not. One of the main advantages of
offering online quizzes through WebCT was that information as to who had
taken the quizzes, how often they had taken the quizzes and how well they
had performed on them was readily available. This therefore meant that the

36
thesis that those who accessed the quizzes would do better could be tested.
It also meant that any differences between those who chose to take the
quizzes and those who chose not to take the quizzes could be examined.
The number of quiz takers
If one simply splits the cohort into quiz takers (interpreted simply as those
who took a minimum of one quiz) and non-quiz takers (those who did not
attempt any of the quizzes) then over the two academic years 2002-03 and
2003-04 there were roughly equivalent numbers of quiz takers (183) and
non-quiz takers (191). In percentage terms 48.1% were quiz takers and
51.9% were non-quiz takers. These results are remarkably close to the
findings of Hester (1999) who found that 49% of students tried the
interactive sample test he introduced as a supplement to a large lecture
course on which he was teaching and broadly in line with Mackie’s finding of
a 59.6% take up rate (2006). Mackie divided users into those who attempted
less than a quarter of the quizzes and those who attempted more than a
quarter of all the quizzes. My findings see particularly Table 18 below
suggest that most who attempted less than a quarter of quizzes in fact
attempted none. It is not known whether Mackie’s findings are similar in this
respect.
Table 7 Comparing the Marks in Legal Method of Quiz Takers and Non-Quiz
Takers

37
Quiz Takers
Aggregate results 2002-2004
Non-Quiz Takers
Aggregate results 2002-2004
Mark Grouping
Number of students
Percentage of cohort in each mark grouping
Number of students
Percentage of cohort in each mark grouping
70% +
45 24.6% 13 6.8%
60 - 69%
53 29.0% 33 17.3%
50 - 59%
52 28.4% 42 21.9%
40 - 49%
25 13.7% 57 30.1%
Under 40%
8 4.4% 46 24.1%
Size of cohort
183 191
Chart 4

38
0%
5%
10%
15%
20%
25%
30%
35%
Under
40%
40-
49%
50-
59%
60-
69%
70% +
Student Marks
Comparing the final marks of
Quiz-takers and Non-Quiz takers
Quiz takers
Non-Quiz takers
Table 7 and Chart 4 above show a dramatic difference between the results
of quiz takers and non-quiz takers. Almost one quarter of the quiz takers
(24.6%) obtained marks of 70% and above as against only 6.8% of the non-
quiz takers. Over half (53.6%) of the quiz takers got marks of over 60%
compared to less than one quarter of the non-quiz takers (24.1%). In terms
of fails: less than one quiz taker in twenty failed (4.4%), as against almost
one non-quiz taker in four (24.1%).
The results might suggest that quiz takers’ results were enhanced because
they took the quizzes, but before this conclusion can be drawn it is
necessary to compare those who took the quizzes as against those who did
not. Students were free to do the MCQs or not, therefore whether they

39
ended up classed as quiz takers or not was a matter of self selection. It is
therefore important to understand how the composition of the two groups
compared – were the quiz takers simply the harder working students who
were always more likely to succeed? Whilst initially plausible, on further
reflection, this was unlikely to be the whole answer.
Apart from the introduction of online guidance and quizzes the course was
run unchanged from the module that had run in 1999-2000 and 2000-2001.
The lectures, seminars, methods of assessment, course entry requirements
and duration and timing of the course had all remained unchanged. It might
be plausible to think that the harder working, more conscientious students,
who were always more likely to succeed, would be the ones most likely to
take the quizzes. However, this would not explain any improvement in
overall marks when comparing the results before the provision of any e-
learning support with those after the introduction of such support. Logically,
one would anticipate that the proportion of hard working, conscientious
students would remain broadly constant. Therefore, other things being
equal, the marks would remain broadly comparable. However, as shown in
Table 6 and Chart 3 above, the final marks of students in the module
demonstrated a marked improvement after the introduction of e-learning
support.
In looking at the impact of the quizzes and online support it is interesting to
compare the results of the non-quiz takers with the results of the entire

40
cohort prior to the introduction of any e-learning support. This is shown in
Table 8 and Chart 5 below:
Table 8 Comparing non-quiz takers with the situation prior to intervention
First Stage (pre web-based support)
Aggregate results
1999-2001
Non-Quiz Takers
Aggregate results 2002-2004
Mark Grouping
Number of students
Percentage of cohort in each mark grouping
Number of students
Percentage of cohort in each mark grouping
70% +
14 6.3% 13 6.8%
60 - 69%
34 15.1% 33 17.3%
50 - 59%
53 23.7% 42 21.9%
40 - 49%
63 28.1% 57 30.1%
Under 40%
60 26.8% 46 24.1%
Size of cohort
224 191
Chart 5

41
0%
5%
10%
15%
20%
25%
30%
35%
Under
40%
40-
49%
50-
59%
60-
69%
70% +
Student Marks
Comparing Non-Quiz takers with the position before
the first intervention
Before the firstintervention
Non-Quiz takers
Table 8 and Chart 5 show a very marked similarity between the results of
students before the introduction of e-learning support with the results of
those who chose not to take the quizzes that were on offer. In both groups
around 25% failed the module at first attempt (26.8% cf. 24.1%). Similarly
around 55% obtained marks of under 50% (54.9% cf. 54.2%). At the top
end, less than 7% obtained marks of over 70% (6.3% cf. 6.8%) and less
than 25% got marks of 60% and over (21.4% cf. 24.1%). The similarity of
the two groups would support the contention that as the course assessment,
course delivery and type of student was largely unchanged so the results
should be broadly in line. The non-quiz takers, by not taking advantage of
the quizzes on offer (and presumably not taking advantage of the online
guidance either) were essentially following the same course as the entire
cohort had been following before the introduction of e-learning and their

42
results were very similar. This analysis suggests that the non-quiz takers
were fairly typical of the entire cohort. The truth of this preliminary
conclusion was then tested.
What sort of student took the quizzes?
The foregoing analysis, based on the similarity of the results of non-quiz
takers with the results of the entire pre-e-learning cohort, led to the
development of a hypothesis that the non-quiz takers were fairly typical of
the entire cohort and therefore broadly similar to the quiz takers except that
by definition they did not avail themselves of the opportunity to take the
quizzes. This thesis ran counter to the initial thesis that the quiz takers were
most likely to be the hardest working, most conscientious students. If the
original hypothesis had been true the expectation was that the non-quiz
takers’ results would be worse than the results of the entire pre-e-learning
cohort. However, as shown in Table 8 and Chart 5 above the results of the
non-quiz takers were no worse than and indeed were remarkably similar to
those of the pre-e-learning cohort.
Factors affecting quiz taking
Having divided the cohort into two broadly similar sized halves, those who
took one or more quiz and those who attempted none of the quizzes it was
then possible to interrogate the data to see whether certain types of student
were more likely to attempt the quizzes. In doing this I decided to
concentrate on the 2003-04 cohort. There were a number of reasons for this
decision. It reduced the amount of data to be handled to a more

43
manageable amount – 201 student records as against 374. It also enabled
me to consider a potentially significant variable namely seminar attendance
– information about which was only available for 2002-03.
The entry qualifications of quiz takers and non-quiz takers
The main route by which students were assessed for entry onto the law
degree was by means of A-level grades. Of the 201 students in the 2003-04
cohort, 157 (78%) were accepted mainly or wholly on the basis of their A-
level results. If the revised hypothesis was correct then it was likely that the
A-level grades of quiz takers were going to be broadly similar to the A-level
grades of non-quiz takers. If the original hypothesis was correct then, on the
assumption, that harder working, more conscientious students were more
likely to do better at A-level then the expectation would have been that,
assuming they carried on being harder working and more conscientious
when they arrived at university, the quiz takers would have better A-level
grades than the non-quiz takers.
Table 9 Average A-level points of quiz takers and non-quiz takers
Number Average A-level points
Quiz takers with A-levels
81 22.12
Non-quiz takers with A-levels
76 22.63
All students with A-levels
157 22.37

44
Table 9 shows that the average A-level points of the quiz takers and non-
quiz takers were virtually identical; with the average A-level grades of the
non-quiz takers actually being fractionally higher. This would seem to
support the revised hypothesis that there was very little difference between
the quiz takers and non-quiz takers and run counter to the original
hypothesis that the “better” students (in this case measured in terms of A-
level entry) would be more likely to take the quizzes.
Throughout the period in question entry onto the Brookes’ law degree for A-
level students was primarily based on students’ A-level results, but in
common with many other universities during the period Brookes was also
taking account of students’ AS-level results.
Table 10 Average UCAS points of quiz takers and non-quiz takers
Like Table 9, this calculation of average entry qualifications shows
very little difference between the quiz takers and the non-quiz takers. The
quiz takers averaged just under 6 points more than the average UCAS
points of that part of the cohort admitted on the basis of their A-levels,
whereas the non-quiz takers averaged a fraction over 6 points under the
average. However, since 6 points is less than 2% of the average point score
Number Average UCAS points
Quiz takers with A-levels
81 335.55
Non-quiz takers with A-levels
76 323.68
All students with A-levels
157 329.81

45
of 329.81 the main point to note is the similarity of the average entry
qualifications of the two groups. The extent to which the results of the two
groups was similar is evidenced by the fact that it was so close that the
method of counting affected which came out higher - on the basis of A-level
results alone the non-quiz takers were marginally better qualified on
average, whereas adding in the ‘AS’ results it was the quiz takers who
emerged as on average the slightly better qualified.
Gender
The 2003-04 cohort showed little difference in terms of quiz taking and
gender. Female students were more likely to be quiz takers, this is in line
with the findings of Mackie (2006). Mackie found that 64% of female
students attempted over a quarter of the tests in her first year Business
Studies module as against 56% of male students. This runs counter to the
expectations that could be developed from Chmielewski (1998) that men
generally have more knowledge of the web. Research on student use of
web learning differentiated by gender is limited and inconclusive. Arbaugh
(2000) and Jackson et. al. (2001) both found that male students were less
likely to enter into dialogue via the web. However, Hoskins & van Hooff
(2005) found the opposite. This last piece of research also looked at quiz
taking and found that male students were more likely to repeat an online
quiz than female students.

46
Table 11 Quiz takers by gender
Total Quiz Takers Non-Quiz Takers
Number Percentage Number Percentage
Female 118 67 56.8% 51 43.2%
Male 83 42 50.6% 41 49.4%
Male students taking Legal Method at Oxford Brookes divided equally
between quiz takers and non-quiz takers. Female students were slightly
more likely to take the quizzes, but for both groups the take up could be
described as being between 5 or 6 out of 10 taking the quizzes.
Age
The average age is calculated on the basis of the students’ age in years at
the beginning of the academic year.
Table 12 Average age of quiz takers and non-quiz takers
Table 12 suggests that there was little difference between the
average age of quiz takers (20.71 years old) and the average age of non-
quiz takers (19.5 years old). However, this does not give the full picture. 103
Number Average Age
Quiz takers 109 20.71
Non-quiz takers 92 19.50
All students 201 20.15

47
(51.2%) of the 201 students in the cohort were 18 at the start of the course.
A further 45 students were aged 19 (22.4%) - therefore almost three
quarters of the cohort (73.6%) were 18 or 19. Given the numbers involved
any assessment of the average age is going to be dominated by this group
who make up the bulk of the cohort. What this analysis misses is whether
mature students were more or less likely to take the quizzes. Table 13 below
addresses this question.
Table 13 Quiz Taking by Age Grouping
Age
Number in cohort
Quiz Takers Non-Quiz Takers
Number
Percentage
of age group
Number
Percentage
of age group
18 103 52 50.5% 51 49.5%
19 45 23 51.1% 22 48.9%
20 16 7 43.8% 9 56.3%
18 - 20 164 82 50.0% 82 50.0%
21 - 29 24 17 70.8% 7 29.2%
30 + 13 10 76.9% 3 23.1%
Chart 6

48
0%
10%
20%
30%
40%
50%
60%
70%
80%
18-20 21-29 30+
Age of students
Percentage of quiz takers by age
Quiz takers
Young students (i.e. those aged 18 - 20) were equally divided between
those who took the quizzes and those who did not. However, older students
were considerably more likely to take the quizzes - over 70% of students
aged between 21 and 29 took the quizzes and nearly 77% of those aged 30
and above took the quizzes. Owing to the small number of students aged
over 30 it is perhaps more appropriate to group all 37 students aged 21+
together: of this group 73% took at least one quiz.
These findings would seem to run counter to the idea that the major change
is amongst the younger generation (Lindsay & Breen, 2000; Veen 2003,
2005) whose learning styles have been transformed by embracing computer
technology. However, it is in line with the findings of Mackie (2006) and
Hoskins & van Hooff (2005).
49
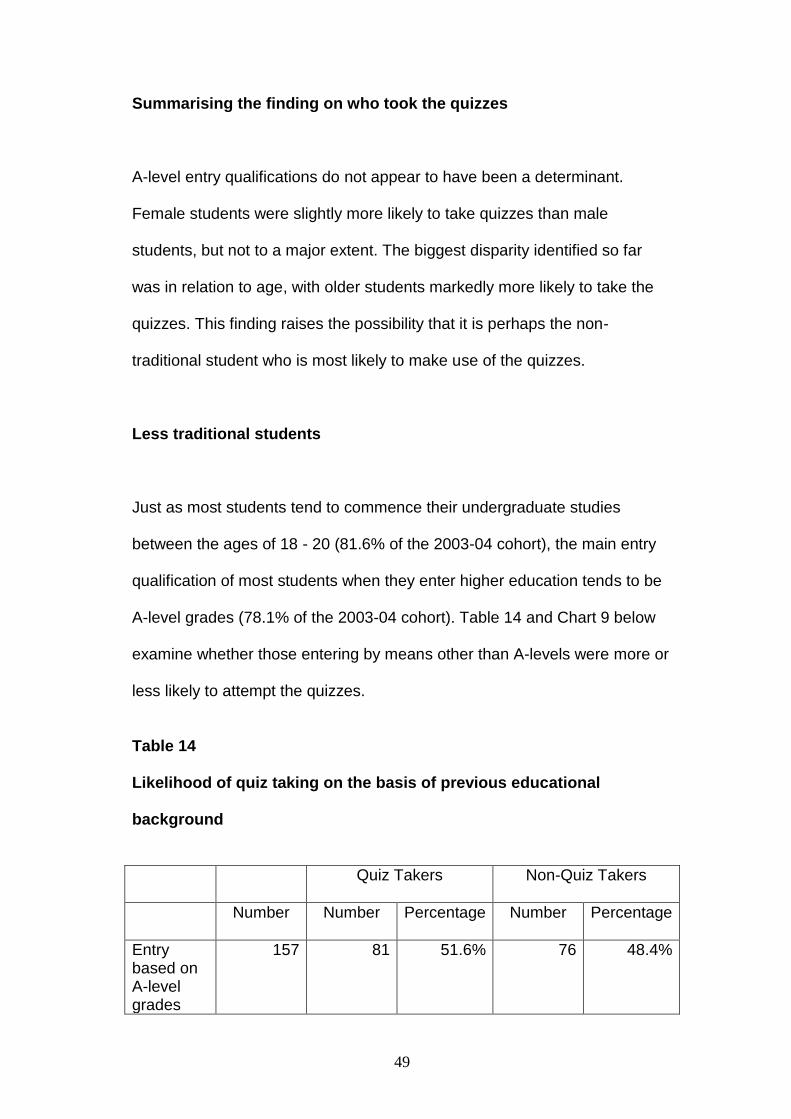
Summarising the finding on who took the quizzes
A-level entry qualifications do not appear to have been a determinant.
Female students were slightly more likely to take quizzes than male
students, but not to a major extent. The biggest disparity identified so far
was in relation to age, with older students markedly more likely to take the
quizzes. This finding raises the possibility that it is perhaps the non-
traditional student who is most likely to make use of the quizzes.
Less traditional students
Just as most students tend to commence their undergraduate studies
between the ages of 18 - 20 (81.6% of the 2003-04 cohort), the main entry
qualification of most students when they enter higher education tends to be
A-level grades (78.1% of the 2003-04 cohort). Table 14 and Chart 9 below
examine whether those entering by means other than A-levels were more or
less likely to attempt the quizzes.
Table 14 Likelihood of quiz taking on the basis of previous educational
background
Quiz Takers
Non-Quiz Takers
Number
Number Percentage Number Percentage
Entry based on A-level grades
157 81 51.6% 76 48.4%

50
Entry not based on A-level grades
44 28 63.6% 16 36.4%
All students
201 109 54.2% 92 45.8%
Chart 7
0%
10%
20%
30%
40%
50%
60%
70%
Entry based on 'A'
levels
Entry not based on
'A' levels
Percentage of quiz takers by basis of entry
Quiz takers
Table 14 and Chart 7 show that whilst those entering university having
previously taken A-levels were split roughly evenly between quiz takers and
non-quiz takers, the percentage of those whose entry was not based on A-
levels who were quiz takers was 12% higher. In part this disparity and the
age disparity reflect the attitudes of the same students as 28 students fell
within both categories (i.e. they were students aged 21 and over whose
entry was not based on A-level grades).

51
Nationality Just as most of the students were aged 18 - 20 (81.6%) and had gained
entry on the basis of their A-levels (78.1%), so similarly most of the students
were UK nationals (77.6%). Table 15 and Chart 8 below show the
percentage of quiz takers according to nationality. No more than four of the
2003-04 cohort were of the same non-UK nationality and therefore the main
comparison has been made simply between UK nationals and non-UK
nationals. However, the figures for non-UK EU nationals are interestingly
slightly at variants with those of non-EU nationals and therefore in Table 15
the non-UK category is subdivided into these two categories. However,
before any strong conclusions are made the small sample size (especially of
the non-UK EU national category) should be noted. Nevertheless the
greater uptake of quizzes by non-European students is supported by Mackie
(2006). Mackie found that 68% of non-European students engaged with the
quiz as against 59% of UK and 59% of non-UK European students.
Table 15 Quiz Taking by National Grouping
Nationality
Number in cohort
Quiz Takers
Non-Quiz Takers
Number
Percentage
Number
Percentage
UK
156 78 50.0% 78 50.0%
Other European
Union
12 7 58.3% 5 41.7%
International (non-EU)
33 24 72.7% 9 27.3%
All non-UK 45 31 68.9% 14 31.1%

52
national students
All students
201 109 54.2% 92 45.8%
Chart 8
0%
10%
20%
30%
40%
50%
60%
70%
UK Non-UK
Nationality of students
Percentage of quiz takers by nationality
Quiz takers
Table 15 and Chart 8 above show that non-UK nationals were significantly
more likely to have taken quizzes than their UK counterparts. Whereas only
half the UK nationals attempted one or more of the quizzes, the figure for
non-UK nationals was almost 69% and the figure for non-EU nationals was
nearly 73%.
Prior study of law
The cohort was divided into three parts: those students who had studied law
at either A or AS-level, those students whose entry qualifications did not

53
give a clear indication as to whether they had or had not studied law and
those who appeared never to have studied law prior to university.
Table 16 Prior study of Law and quiz taking
Quiz Takers Non-quiz takers
Number Number Percentage Number Percentage
Previously studied law at A-level or AS-level10
44 26 59.1% 18 40.9%
No evidence of prior study of law11
114 57 50.0% 57 50.0%
Prior study of law unclear12
43 26 60.0% 17 40.0%
All students
201 109 54.2% 92 45.2%
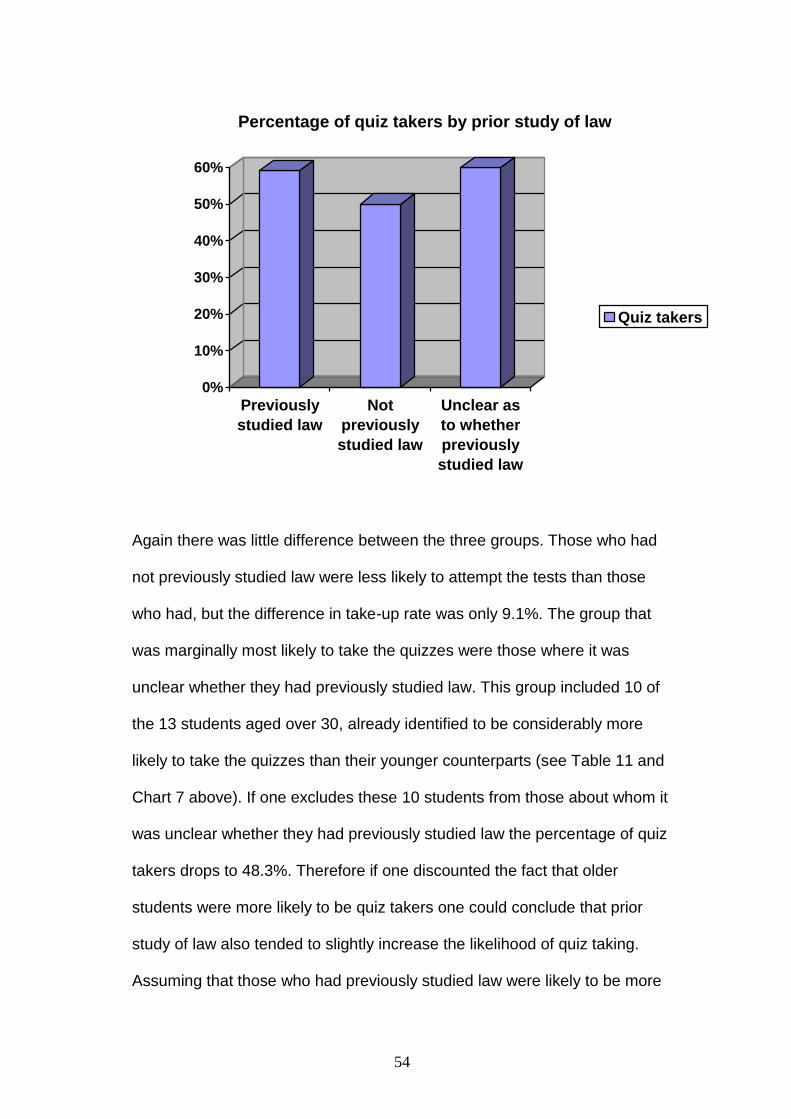
Chart 9
10
Most years at the start of the module I asked for a show of hands to indicate what proportion of students had studied law prior to university. Typically about a quarter of the students raised a hand. This would seem to indicate that the 44/201 (21.9%) constituted the bulk of those who had previously studied law. 11
These students had gained admission on the basis of subjects that clearly did not include law. Whilst, it was possible that at other points in their studies (for example at GCSE) they might have studied law there was no indication of this in their student record and it seemed unlikely that many (or possibly any) of these students would have studied law, then given it up, only to take it up again at degree level. 12
These students had entry qualifications which might or might not have included law; for example an Access course or a BTEC national course qualification. Unfortunately the data I could access did not identify the subjects actually studied on such courses.
54
0%
10%
20%
30%
40%
50%
60%
Previously
studied law
Not
previously
studied law
Unclear as
to whether
previously
studied law
Percentage of quiz takers by prior study of law
Quiz takers
Again there was little difference between the three groups. Those who had
not previously studied law were less likely to attempt the tests than those
who had, but the difference in take-up rate was only 9.1%. The group that
was marginally most likely to take the quizzes were those where it was
unclear whether they had previously studied law. This group included 10 of
the 13 students aged over 30, already identified to be considerably more
likely to take the quizzes than their younger counterparts (see Table 11 and
Chart 7 above). If one excludes these 10 students from those about whom it
was unclear whether they had previously studied law the percentage of quiz
takers drops to 48.3%. Therefore if one discounted the fact that older
students were more likely to be quiz takers one could conclude that prior
study of law also tended to slightly increase the likelihood of quiz taking.
Assuming that those who had previously studied law were likely to be more

55
confident in their legal skills when tackling a first term, first year law module
this might suggest that willingness to engage with quizzes was in part a
question of confidence - with those more confident in their abilities more
prepared to attempt the quizzes. However, before developing this line of
thought much further it should be noted that the difference in the percentage
taking quizzes between those who had and those who had not previously
studied law was quite small and that this conclusion was not borne out if one
assumed that those with better A-level results were more likely to be more
confident in their abilities.
Quiz taking and seminar attendance
As stated earlier, in 2003-04 seminar attendance was monitored. This
monitoring did not arise directly out of this research project. It arose
because student representatives on the course management committee
wanted to investigate whether attendance at seminars affected student
performance. This enabled an assessment to be made as to whether those
who attended seminars more regularly were more likely to be quiz takers. As
seen in Table 17 below, those who took at least one quiz generally attended
more seminars. The data, whilst showing a link between quiz taking and
seminar attendance, does not prove a causal relationship. It is impossible to
state whether seminar attendance led to quiz taking or whether quiz taking
led to increased seminar attendance. However, it is possible to note that
those who took at least one quiz were generally more engaged with the
course (if one measures engagement by seminar attendance).

56
Table 17
Quiz taking and seminar attendance
Number Average number of seminars attended
Percentage of the 8 seminars attended
Quiz takers
109 6.1 76.3%
Non-quiz takers
92 4.5 56.3%
All students
201 5.4 67.5%
Subdividing the quiz takers
Thus far, the analysis has been of the basis of categorising students into
two sub-categories: quiz takers and non-quiz takers. This has the advantage
of focussing on two large, approximately equal sized groupings. However,
by lumping together students who attempted one quiz with those who
attempted all the quizzes the analysis is not as nuanced as it might be.

57
Table 18
Number of quizzes attempted
Number of quizzes
attempted
Number of students Percentage of cohort
None 92 45.8%
One 7 3.5%
Two 12 6.0%
Three 7 3.5%
Four 4 2.0%
Five 5 2.5%
Six 9 4.5%
Seven 4 2.0%
Eight 6 3.0%
Nine 55 27.4%
In 2003-04 the majority of students (54.2%) attempted at least one quiz.
However, as can be seen from Table 18 above, whilst half of quiz takers
took all the quizzes (55 of the 109 quiz takers = 50.5%), the remainder were
spread fairly evenly between the other options. This meant that there was a
very small sample size for any of the other totals of quizzes attempted.

58
Table 19
Number of quizzes attempted by sub-grouping
Number of quizzes attempted
Number of students Percentage of cohort
None 92 45.8%
At least one but less than half
30 14.9%
More than half but less than all
24 11.9%
All nine quizzes 55 27.4%
On the basis of the earlier conclusions it might be expected that those who
attempted more quizzes would have performed better in the Legal Method
module. This is in part borne out in Table 20 below. As expected those who
attempted no quizzes did perform less well than any of the sub-categories of
quiz taking. Similarly those who attempted less than half the quizzes did
less well than those who attempted over half the quizzes. The one
surprising finding was that those who did all nine quizzes actually performed
slightly less well than those who attempted between five and eight of the
nine quizzes.

59
Table 20
Performance in quizzes by sub-grouping
Number of quizzes attempted
Number of students Mean percentage in Legal Method
None 92 49.8%
At least one but less than half
30 55.5%
More than half but less than all
24 61.4%
All nine quizzes 55 59.5%
It is worth noting that the group who took between five and eight quizzes
were numerically quite small (only 24 students). It is also worth noting that
within this grouping taking more quizzes was generally linked with higher
performance. Perhaps one explanation of the discrepancy is that the sub-
grouping of students who attempted all nine quizzes included a certain
number of students who felt that they were struggling on the course and
were driven to attempt all the quizzes because of fear of failure – however,
this is just conjecture.
Table 21 and Chart 10 below arguably lend some support to this hypothesis.
However, having started with relatively small sample sizes for the two
groupings based on students taking some, but not all of the quizzes, by
further sub categorising these groups there is a danger in drawing definite
conclusions.

60
Table 21 Comparing performance in Legal Method by number of quizzes
attempted
Non-quiz takers Quiz takers
Attempted less than half of the quizzes
Attempted more than half but less
than nine
Attempted all nine quizzes
Mark Grouping
Number of
students
% of cohort in
each mark
grouping
Number of
students
% of cohort in
each mark
grouping
Number of
students
% of cohort in
each mark
grouping
Number of
students
% of cohort in
each mark
grouping
70% +
7 7.6% 5 16.7% 7 29.2% 14 25.5%
60 - 69%
16 17.4% 6 20.0% 10 41.7% 19 34.5%
50 - 59%
23 25.0% 10 33.3% 5 20.8% 11 20.0%
40 - 49%
27 29.3% 8 26.7% 2 8.3% 6 10.9%
Under 40%
19 20.7% 1 3.3% 0 0.0% 5 9.1%
Size of cohort
92 30 24 55
Chart 10

61
0
5
10
15
20
25
30
35
40
45
Under
40%
40-
49%
50-
59%
60-
69%
70% +
Student Marks
Comparing performance in Legal Method
by number of quizzes attempted
Non-quiz takers
Some but not most
Most but not all
All nine quizzes
The above Chart and Table clearly demonstrate that students who did
between five and nine of the quizzes were considerably more likely to gain
marks of 60% and above. Conversely those who did less than five of the
quizzes were much more likely to achieve marks of less than 50%.
Assessing the impact of quiz taking on performance statistically
The foregoing examination of results, particularly Tables 4, 5, 6, 18 and 19
together with Charts 3, 4, 5 and 10, have suggested that quiz taking may
improve student performance.

62
Table 22
Correlation - Quiz Attempts and Legal Method Marks
Quizzes
attempted
Marks for Legal Method
Quizzes attempted
Pearson Correlation
1 .348(**)
Sig. (1-tailed)
.000
N
201 201
The significance level indicates that there is a less than 0.01 probability that
a correlation coefficient this large in a sample of 201 people would have
occurred by chance. This does not however, automatically mean that quiz
taking is leading to better exam performance. There could be a third variable
affecting both quiz taking and exam performance. Additionally the existence
of the link between exam performance and quiz taking does not prove the
direction of any causal link. However, the finding is in line with the thesis
that quiz taking improves performance. Furthermore, as quiz taking
precedes exam performance logically it seems logical that if there is any link
it must be that quiz taking that affects performance. On the basis of the
research model adopted it would seem that there is no third variable. When
quizzes were introduced in 2002-03 every effort was made to ensure that
other variables remained unchanged. The performance of the entire cohort
in 2002-04 was markedly better than that achieved prior to the introduction
of online support (see Table 4 and Chart 3 above) and the performance of
non-quiz takers was remarkably similar to that of the entire cohort prior to
the introduction of online support (see Table 6 and Chart 5 above).

63
Thus far it has been shown that quiz taking appears linked to
improved performance in the module. The measurement of the Pearson
correlation coefficient suggests that there is a more than 99% chance that
quiz taking and student performance are linked. Furthermore the square of
the Pearson correlation coefficient (r2) should indicate the effect of the
quizzes on student performance: r2 = .1211 indicating that 12% of student
marks in Legal Method can be attributed to quiz taking. This is examined in
more detail in Appendix A which explores the impact of quiz taking and
other variables on performance in Legal Method.
The research examined so far has also shown that those most likely to avail
themselves of the opportunity to take quizzes were non-traditional students:
in particular mature students, non-UK students and students with entry
qualifications other than “A” levels. The next stage was to consider whether
the impact of the quizzes extended beyond the Legal Method module in
which they were set.

64
Measuring the Impact beyond the Module
During first year
Full-time law students at Oxford Brookes at the time could take up to five
other law modules in their first year. None of these modules included online
quizzes or any other form of interactive online support. Given that the
quizzes were designed simply to support the Legal Method module it might
be assumed that there would be no difference in the performance of the
Legal Method quiz takers and non-quiz takers in these other modules.
However, Table 23 below shows that in all modules the Legal Method quiz
takers outperformed the non-quiz takers.
Table 23
Performance of Quiz Takers and Non-Quiz Takers in other first year
law modules (2003-04 cohort)
Quiz Takers
Non-Quiz Takers Percentage by which Legal Method quiz
takers outperformed
non-quiz takers
Pearson correlation coefficient (1-tailed)
Number of
students
Average Mark
Number of
students
Average Mark
Legal Method Term 1 15 credits
109 58.8% 92 49.8% + 9.0% .348**
Legal Process Term 1 15 credits
71 56.8% 43 50.0% + 6.8% .362**
Contract Terms 1 & 2 30 credits
96 46.8% 77 36.0% + 10.8% .392**
Constitutional Law Term 2 15 credits
86 47.7% 54 43.9% + 3.8% .230**

65
** Indicates correlation is significant at the .001 level. In other words in
relation to all modules (except Law and Morality) there is a less than a one
in 1,000 chance that the apparent link between the number of quizzes taken
and performance in the module in question was simply down to chance. In
the case of Law and Morality, whilst there did appear to be some positive
link between quiz taking in Legal Method and performance in Law and
Morality, the possibility that this was simply down to chance was greater
than 5%.
The one module that showed a much lower correlation between student
performance and the number of quizzes attempted in Legal Method was
Law and Morality. This module was assessed in a different way to the other
modules, being the only first year law module assessed entirely by
coursework. Furthermore the assessment involved group tasks and oral
presentations unlike the other first year module, which were all assessed on
the basis of individual written work. Finally the style of teaching in Law and
Morality was different with workshops being used rather than lectures and
seminars. Perhaps these many differences explain the fact that Legal
Method quiz taking did not seem to have such an impact on performance,
though it should still be noted that Legal Method quiz takers still
outperformed non-quiz takers by 5% in Law and Morality.
Tort Term 2 & 3 30 credits
105 44.6% 83 36.9% + 7.7% .335**
Law and Morality Term 3 15 credits
75 60.4% 52 55.4% + 5.0% .124

66
It is interesting to note that amongst the other modules the biggest disparity
between the performance of quiz takers and non-quiz takers was found in
the two 30 credit two term modules. Indeed the disparity in Contract Law
was even greater than the disparity in Legal Method, with quiz takers out
performing non-quiz takers by 10.8%. This is at first sight surprising. The
quizzes were specifically designed to support the Legal Method module and
therefore one might have anticipated the biggest impact would be in that
module.
A possible explanation lies within the structure of Contract and Tort. Both
are two term modules and amongst staff there has been a concern that
students, in their first term of these two term modules, tend to focus on their
studies less than they do when studying a one term module. This
impression is supported by the fact that marks in the two term modules have
tended to be lower. Arguably, if the problem with the two term modules
does relate to disengagement then possibly the quizzes are, at least for the
quiz takers, helping to maintain engagement across the whole programme.
Certainly quiz taking was linked within Legal Method with better seminar
attendance and so perhaps this better seminar attendance was replicated
across the first year programme. Seminar attendance records were not kept
in any of the other modules – therefore this theory could not be tested.
Over the Degree
The earlier article included no longer term analysis of the performance of
students beyond first year.

67
Whilst a strong statistical link had been discerned between quiz taking and
module performance in first year, this did not indicate whether this link would
continue into the rest of the students’ studies. Under the modular course
rules at Oxford Brookes the results of Level 1 modules such as Legal
Method and the other first year modules considered in Table 21 above do
not contribute to degree classification or final graduating average. Full-time
students studying Legal Method in 2003-04 should normally expect to
graduate in June 2006. Given that virtually all Brookes’ undergraduate law
students are full-time and given the problems, at the time, of differentiating
between full and part-time students under the Brookes’ modular scheme,
the following analysis treats the whole cohort as if full-time.
Table 24 Graduating averages of Legal Method quiz takers and non-quiz takers
(2003-04 cohort)
* Correlation is significant at the 0.05 level (one-tailed). In other words there
was a less than 5% likelihood that this link arose purely by chance.
Quiz Takers Non-Quiz Takers
Percentage by which Legal Method quiz
takers outperformed
non-quiz takers
Pearson correlation coefficient
(1-tailed) Number
of students
Average Mark
Number of
students
Average Mark
Graduating Average
69 58.5% 41 57.6% + 0.9% .162*

68
Whilst Table 24 does show a significant positive correlation between
the number of quizzes taken and final graduating average, the Table also
shows little difference in the graduating average of quiz takers and non-quiz
takers. At first sight, this would tend toward a conclusion that the impact of
the online quizzes was largely short-lived and that whilst it did survive
through to graduation it had to an extent dissipated by the time students
completed their degree. However, if one examines the data further a more
complex picture emerges.
Table 25 Results after three years (students taking Legal Method in 2002-03)
Quiz Takers Non-Quiz Takers
Number of students
Percentage of quiz takers
Number of students
Percentage of non-quiz
takers
Graduated on time with first class honours
0 0.0% 0 0.0%
Graduated on time with upper second class honours
35 33.3% 13 14.4%
Graduated on time with lower second class honours
32 30.5% 26 28.9%
Graduated on time with third class honours
2 1.9% 2 2.2%
Graduated with honours on time
69 65.7% 41 45.6%
Not yet completed but still studying
23 21.9% 26 28.9%
Graduated with an ordinary degree
2 1.9% 1 1.1%
Graduated with a Certificate in Higher Education
2 1.9% 3 3.3%
Withdrawn voluntarily
8 7.6% 13 14.4%
Academic failure
1 0.9% 6 6.7%
Completed studies 11 10.5% 21 23.3%

69
without graduating with honours
Almost two-thirds of quiz takers graduated with honours on time as against
less than half of non-quiz takers. A third of quiz takers graduated on time
with a 2:1 as against one in seven of the non-quiz takers. By June 2006
approaching one quarter of non-quiz takers had completed their studies
without graduating with honours, whereas the comparable figure for quiz
takers was closer to one in ten. These findings are shown graphically in
Chart 11.
Chart 11
0%
5%
10%
15%
20%
25%
30%
35%
Did not
graduate
with
honours
Continuing
student
Graduated
on time
with a 2:2
or a third
Graduated
on time
with a 2:1
or a first
Student Marks
Results achieved by June 2006
Quiz Takers
Non-Quiz Takers
From the foregoing, two possible explanations for the better performance of
the quiz takers emerge. One is that the quizzes encourage students to

70
engage not just with the module but with the degree programme as a whole
and that this engagement continued throughout their studies. A second
explanation relates to the view that Legal Method is a building block for
future legal studies and that the quizzes helped quiz-taking students to
develop these essential skills which then helped them in their future studies.
These explanations are not mutually exclusionary. The quizzes could both
have fostered engagement and helped in the development of skills.
Alternatively, as highlighted earlier, there may be a third, as yet
undiscovered, explanation. However, given the attempts to keep all other
variables unchanged and the similarity between the performance of non-
quiz takers with the performance of the entire cohort before the introduction
of online support it would seem that the evidence does point to quiz taking
having a significant impact not just in the module in which the quizzes were
situated but throughout the degree programme.
Conclusions
The introduction of online quizzes resulted in markedly better
performance in the module in question. The percentage of fails dropped
from 26.8% before the introduction of online support to 14.4% and the
percentage of marks under 50% similarly fell from 54.9% to 36.3%. The
percentage of marks of 60% and above went up from 21.4% to 38.5% and
of these the percentage that were marks of 70% and above went up from
6.3% to 15.5% (see Table 4 and Chart 3 above). This was achieved despite
the fact that only 48.9% of students in the period 2002-04 attempted any of
the quizzes. If one looks at the performance of quiz takers alone then the

71
results are particularly impressive. The fail rate for quiz takers was only
4.4% and only 18.1% got marks of below 50%. The improvement was seen
not just in terms of a reduction in poor results: 53.6% of quiz takers gaining
marks of 60%+, with 24.6% of quiz takers achieving marks of 70%+ (see
Table 5 and Chart 4 above).
In 2003-04 the quizzes were released, as planned, immediately after the
lectures. In this year the quiz take-up rate rose to 54.2%, with half of quiz
takers attempting all nine quizzes (see Table 16 above). Analysis of this
cohort showed that non-traditional students (non-UK, mature, non-A-level
entry students) were most likely to make use of the quizzes (see Tables 13,
14 and 15 above). These are groups who are often viewed as more likely to
struggle on courses designed for the traditional entrant. The fact that these
students embraced the quizzes is particularly welcome. Interestingly non-
quiz takers were performing very much in line with the whole cohort prior to
the introduction of online support.
The impact on performance was also seen in terms of performance on other
first year modules - with the impact in one module actually exceeding that in
the module in which the quizzes were based (see Table 21). This impact
persisted throughout the students’ studies so that 65.7% of quiz takers
graduated on time whereas only 45.6% of non-quiz takers did so. The
difference was even more marked when one considered the proportion
graduating on time with a 2:1 or better: one in three quiz takers as against
one in seven non-quiz takers (see Table 25 and Chart 11). This startling

72
finding was achieved despite the fact that when looked at in terms of “A”
level entry qualifications there was no difference between the quiz takers
and non-quiz takers (see Tables 9 and 10).
Further Research
This research establishes a very strong link between quiz taking and
performance. However, it only demonstrates the impact of quiz taking in one
undergraduate law module in one degree programme. The question remains
as to whether it could be replicated on other courses and in other disciplines
or put another way whether it has external validity. “External validity asks the
question of generalizability: To what populations, settings, treatment
variables can the effect be generalized?” (Campbell & Stanley, 1963: 175).
As Kratwohl asserts “The heart of external validity is replicability.” (1985:
123).
As, Schofield concludes “the worth of a summative evaluation is greatly
enhanced to the extent it can inform program and policy decisions relating to
other sites.” (1993: 203) For me this relates back to the literature review of
e-learning explored earlier. Whilst many writers see ICT as a solution, there
is a paucity of data as to what works and in what circumstances it will and
will not work. Cliff Allan’s call that there is a need to “carry forward strategies
based on evidence of what works” (HEFCE, 2005a: 1) is made much more
difficult because of the absence of data as to what does and what does not
work. It is seventeen years since the Dearing Report identified e-learning as
an answer to widening participation and worsening SSRs (NCIHE,1997:

73
especially para. 13.2). However, despite many guides having been
produced on e-learning in the last ten years there has been little attempt to
address the questions posed by Coates & Humphreys: “How intensively will
students utilize online course materials? Does access to online course
materials increase student comprehension and retention? (2001: 133)
Hopefully this research will help in starting to address these questions. Its
structure provides a model which can be easily replicated. Modern VLEs
provide easy means of monitoring student engagement with online
materials. Thus, providing that in other ways the course remains
unchanged, the impact of online quizzes can be readily tested. In this way
what Smith described as “the goal of science” namely the ability “to
generalize findings to diverse populations and times” (1975: 88) can
hopefully be achieved. Certainly the model adopted for this research is one
which can readily be replicated and from this it can be seen whether the
findings have external validity. Further research should be undertaken as
this research suggests online quiz taking improves retention, progression
and performance for all students, particularly non-traditional entrants.
The research also raises further questions. The original research simply set
out to assess whether online quiz taking would have a positive impact on
student performance. It did not aim to quantify that impact. In fact the
foregoing analysis does identify in percentage terms the extent to which quiz
takers outperformed non-quiz takers in the module, in other first year
modules and in terms of their position after three years of study. It also

74
provides data which can easily be utilised to measure the size of the effect
of quiz taking on student performance. It is also apparent that there may be
a number of factors at work affecting student performance. HEFCE identified
A-level points as “the single most important factor in determining the
expected HE achievement” (2003: 3) but acknowledged that other factors
such as gender, the type of school previously attended and the subject
studied could affect final degree classification. Questions such as whether
quiz taking had a greater impact on performance than for example A-level
grades lay outside the original project and yet the data gathered enabled
these issues to be addressed. As a result Appendix A has been included.
This explores the impact of a number of potential predictors of success and
assesses the impact and effect size of three potentially major factors (A-
level points, seminar attendance and quiz attempts) in more detail. The
finding is that all have a positive impact, but that quiz attempts have the
greatest impact.
As stated the original research project simply aimed to identify whether
online quiz taking had a positive impact on achievement. It did not aim to
identify the reason for that positive impact. There are a number of reasons
why it might. Students may be benefiting from the feedback which is
otherwise often lacking in modern day higher education (Bone, 2006; Clegg,
2004; Orsmond et.al, 2002). The result could be connected with immediacy
of the feedback. It may be, as Driscoll (2001) suggests, that actively
engaging the learner increases learning. It may simply be as Bone (2006)
reported that students feel that feedback early in the course boosts

75
confidence and understanding. However, the findings in Appendix A suggest
that it may be more than simply a relationship between quiz taking and
engagement. The finding that quiz taking has a greater effect on student
performance than seminar attendance raises questions as to whether there
is a further more complex explanation possibly relating to the power of such
online tests to foster self belief, an area explored briefly at the conclusion to
Appendix A.
Just as the research raises questions as to whether it can be replicated, it
also raises questions as to why it works. Much more research is needed,
including qualitative research to find out more about why some students
engage with online materials and why others do not and assuming the
success of online quizzes can be replicated to increase our understanding
of how they work. For the moment it remains work in progress, but the clear
message is that online quizzes can have a very significant impact on
student performance in both the short and the long-term.

76
Appendix A Identifying Success Predictors
The aims of the original research project were to discover:
whether the apparent positive impact of online guidance in 2001-02
was maintained,
to assess what proportion of students engaged with the online
quizzes,
to assess the extent to which those students who engaged with
online quizzes were typical of the student cohort as a whole in terms
of such variables as age, gender, prior academic qualifications, prior
study of law and nationality,
to assess whether those who engaged with the online quizzes
performed better or worse in the module than those who did not
engage with the quizzes,
to assess whether those who engaged with the online quizzes
performed better or worse than other students in other first year law
modules, and
to assess whether those who engaged with the online quizzes
performed better or worse than other students in terms of final degree
classification.
In examining these questions it became apparent that those who
engaged with the online quizzes performed better than those who did not. A
question which emerged during the course of the project was the extent to
which quiz taking as against other factors was a predictor for success. This
question lay beyond the original project and was therefore not considered in
the main body. However, in gathering and analysing the data it became

77
possible to identify apparent linkages between certain factors and student
performance. Tables A1 and A2 examine in some detail the performance of
students in 2003-04 in the Legal Method module.
Table A1
Possible predictors of success
Number in that part of the cohort
Average Mark for Legal Method
Performance against average
All students 201 54.7% -
Quiz Takers 109 58.8% + 4.1%
Non-Quiz Takers
92 49.8% - 4.9%
Female students 118 56.1% + 1.4%
Male students 83 52.7% - 2.0%
Age 18 - 20 164 54.5% - 0.2%
Age 21 - 29 24 53.9% - 0.8%
Age 30+ 13 57.6% + 2.9%
UK national 156 55.5% + 0.8%
Non-UK national 45 51.9% - 2.8%
Non A -level entry
45 52.7% - 2.0%
6 - 18 A level points
31 53.3% - 1.4%
20 A-level points 27 51.4% - 3.3%
22 A-level points 30 53.6% - 1.1%
24 A-level points 26 58.3% + 3.6%
26 - 42 A-level points
41 58.4% + 3.7%
Previously studied law
44 57.2% + 2.5%
Attended 0 - 2 Legal Method seminars
32 49.1% -5.6%
Attended 3 - 4 Legal Method seminars
32 49.8% - 4.9%
Attended 5 - 6 Legal Method seminars
53 52.5% - 2.2%
Attended 7 - 8 Legal Method seminars
84 60.0% +5.3%

78
Table A2 Possible predictors of success ranked in terms of apparent positive impact on Legal Method performance in 2003-04
Number in that part of the cohort
Average Mark for Legal Method
Performance against average
Ranking
All students 201 54.7% -
Attended 7 - 8 Legal Method seminars
84 60.0% +5.3% 1
Quiz Takers 109 58.8% + 4.1% 2
26 - 42 A-level points
41 58.4% + 3.7% 3
24 A-level points
26 58.3% + 3.6% 4
Age 30+ 13 57.6% + 2.9% 5
Previously studied law
44 57.2% + 2.5% 6
Female students
118 56.1% + 1.4% 7
UK national 156 55.5% + 0.8% 8
Age 18 - 20 164 54.5% - 0.2% 9
Age 21 - 29 24 53.9% - 0.8% 10
22 A-level points
30 53.6% - 1.1% 11
6 - 18 A level points
31 53.3% - 1.4% 12
Male students 83 52.7% - 2.0% 13=
Non A -level entry
45 52.7% - 2.0% 13=
Attended 5 - 6 Legal Method seminars
53 52.5% - 2.2% 15
Non-UK national
45 51.9% - 2.8% 16
20 A-level points
27 51.4% - 3.3% 17
Non-Quiz Takers
92 49.8% - 4.9% 18=
Attended 3 - 4 Legal Method seminars
32 49.8% - 4.9% 18=
Attended 0 - 2 Legal Method seminars
32 49.1% -5.6% 20

79
The above two Tables suggest that quiz taking was more important
than A-level point score in terms of student performance, but slightly less
important than regular seminar attendance. This appears to lend support to
the tentative conclusion in the main body that the impact of quiz taking may
have been linked to engagement as it would seem that student engagement
(assuming that this could be measured by seminar attendance) would seem
to be linked to student performance.
Extracting the results for seminar attendance alone it can immediately
be seen that there was a link between attendance and performance.
Table A3 Performance in Legal Method and seminar attendance
Number in that part of the cohort
Average Mark for Legal Method
Performance against average
Ranking out of 20 factors (see Tables A1 and A2 above)
All students
201 54.7% -
Attended 7 - 8 Legal Method seminars
84 60.0% +5.3% 1
Attended 5 - 6 Legal Method seminars
53 52.5% - 2.2% 15
Attended 3 - 4 Legal Method seminars
32 49.8% - 4.9% 18=
Attended 0 - 2 Legal Method seminars
32 49.1% -5.6% 20
Table A3 appears to show a fairly simple relationship. In general
terms, the more seminars a student attended, the better the student
performed.

80
Extracting the figures on A-level points the position is slightly more
complex.
Table A4 Performance in Legal Method and A-level grades
Number in that part of the cohort
Average Mark for Legal Method
Performance against average
Ranking out of 20 factors (see Tables A1 and A2 above)
All students
201 54.7% -
26 - 42 A-level points
41 58.4% + 3.7% 3
24 A-level points
26 58.3% + 3.6% 4
22 A-level points
30 53.6% - 1.1% 11
6 - 18 A level points
31 53.3% - 1.4% 12
Non A -level entry
45 52.7% - 2.0% 13=
20 A-level points
27 51.4% - 3.3% 17
In general, higher A-level grades were linked to better student
performance. The linkage supports the hypothesis developed in the main
body of the dissertation that better qualified students could, in general, be
expected to outperform less well qualified students. This reinforces the
finding that quiz taking had a positive impact on performance. Quiz takers
and non-quiz takers had virtually identical A-level grades and yet quiz takers
significantly outperformed non-quiz takers.
The one anomaly in the apparent link between A-level grade and
performance is that the 27 students with 20 A-level points on average

81
performed slightly less well than those with fewer A-level points and those
who were non A-level entrants. The relatively small sample size may explain
this anomaly. Alternatively it could possibly be explained on the basis that
some of those with fewer A-level points were accepted on the basis of
several factors only one of which was their A-level grades, whereas those
with 20 points were probably accepted exclusively on their A-level grades.
As the standard A-level offer for the Law degree at Brookes throughout this
period was 22 points, it is likely that those with markedly fewer points had to
demonstrate additional qualities in order to be accepted.13
Other information that can be gleaned from Tables A1 and A2 above
includes the fact that female students outperformed male students in Legal
Method by an average of 3.4%. There are a number of possible
explanations for this. Female students were slightly more likely to be quiz
takers14 and on average took more quizzes than their male counterparts.15
Female students also attended more seminars.16 However, differential A-
level grades do not seem to be the explanation as they were virtually
identical for male and female students.17
UK nationals outperformed non-UK nationals in the Legal Method
module by an average of 3.6%. This is interesting as non-UK nationals were
more avid quiz takers.18 A possible explanation for the disparity is that the
Legal Method module requires high level English comprehension skills
13
Unfortunately this cannot be easily checked as the online registration details of students at the time only recorded other qualifications for students who had not got A-level grades. 14
56.8% of female students attempted at least one quiz as against 50.6% of male students. 15
Mean number of quizzes taken: female students - 4.1; male students - 2.8. 16
Mean number of seminars attended: female students - 5.6; male students - 5.0. 17
Male students with A-levels averaged 22.6 points as compared to female students with A-levels averaging very slightly less with 22.2 points. 18
68.9% of non-UK nationals attempted at least one quiz as against just 50.0% of UK nationals.

82
which are likely to present more of a problem for the student for whom
English is not their first language.
Table A5 Performance in Legal Method and age
Number in that part of the cohort
Average Mark for Legal Method
Performance against average
Ranking out of 20 factors (see Tables A1 and A2 above)
All students
201 54.7% -
Age 30+
13 57.6% + 2.9% 5
Age 18 - 20
164 54.5% - 0.2% 9
Age 21 - 29
24 53.9% - 0.8% 10
Students aged 30 and above in general outperformed their younger
counterparts.19 This may be explained by the fact that they were the keenest
age group in terms of quiz taking;20 however this does not explain the
relatively poor performance of those aged 21 - 29 who were also in general
keen quiz takers.21 Those aged over 30 were also more likely to attend
seminars.22
19
However, before any general conclusions are drawn the small size of the sample of students aged 30 and above should be noted. 20
76.9% of students aged 30 and above attempted at least one quiz as against only 50.0% of those aged 18 - 20. Students aged 30 and above took an average of 5.2 quizzes as against an average for those aged 18 - 20 of 3.2 quizzes. 21
70.8% of students aged 21 - 29 attempted at least one quiz and on average they took 5.3 quizzes - fractionally more than the average of those aged 30 and above. 22
Students aged 30 and above attended on average 6.2 seminars as against an average of 5.3 for those aged 18-20 and 5.6 for those aged 21 - 29.

83
The relatively poor performance of students aged 21 - 29 is in line
with similar findings by the author into student performance on law courses
at another university (Catley & Bilotto, 2006). Those results led to a tentative
conclusion, supported by anecdotal evidence, that students in this age
group may face more financial and other pressures than the other age
groups.
Tables A1 to A5 above suggest that students who attended seminars
more often, attempted the quizzes and had better entry qualifications
generally performed better. These findings are possibly unsurprising, though
the fact that seminar attendance and quiz taking seemed a better predictor
of success than A-level grades does suggest that engagement is perhaps a
better predictor of success than prior achievement.
Tables 22 and 23 of the main report considered the impact of quiz
taking both on final degree average23 and arguably more importantly the
impact of quiz taking on whether students graduated on time and if so, with
what qualification.24 Tables A6 and A7 consider the same factors as were
considered in Tables A1 and A2 in terms of final degree classification
concentrating simply on the question of whether students graduated with a
2:1 or higher after three years of study. Whilst this is a less nuanced
approach than that adopted in Table 23 it does allow for measurement
against what many staff and students would categorise as a good degree
result.
23
See Table 22. 24
See Table 23.

84
Table A6
Predictors of success and graduate performance after three years
Number in that part of the cohort
Number graduating on time with a 2:1 or above
Percentage graduating on time with a 2:1 or above
Performance against average
All students 195 48 24.9%
Quiz Takers 105 35 33.3% + 8.4%
Non-Quiz Takers
90 13 14.4% - 10.5%
Female students
114 33 28.9% + 4.0%
Male students 81 15 18.5% - 6.4%
Age 18 - 20 163 39 23.9% - 1.0%
Age 21 - 29 22 7 31.8% + 6.9%
Age 30+ 10 2 20.0% - 4.9%
UK national 153 37 24.1% - 0.8%
Non-UK national
42 11 26.2% + 1.3%
Non A -level entry
40 7 17.5% - 7.4%
6 - 18 A level points
31 7 22.6% - 2.3%
20 A-level points
27 5 18.5% - 6.4%
22 A-level points
30 5 16.7% - 8.2%
24 A-level points
26 8 30.7% + 5.8%
26 - 42 A-level points
41 16 39.0% + 14.1%
Previously studied law
44 9 20.5% - 4.4%
Attended 0 - 2 Legal Method
seminars
30 2 6.7% - 18.2%
Attended 3 - 4 Legal Method
seminars
31 3 9.7% - 15.2%
Attended 5 - 6 Legal Method
seminars
52 13 25.0% + 0.1%
Attended 7 - 8 Legal Method
seminars
82 30 36.6% + 11.7%
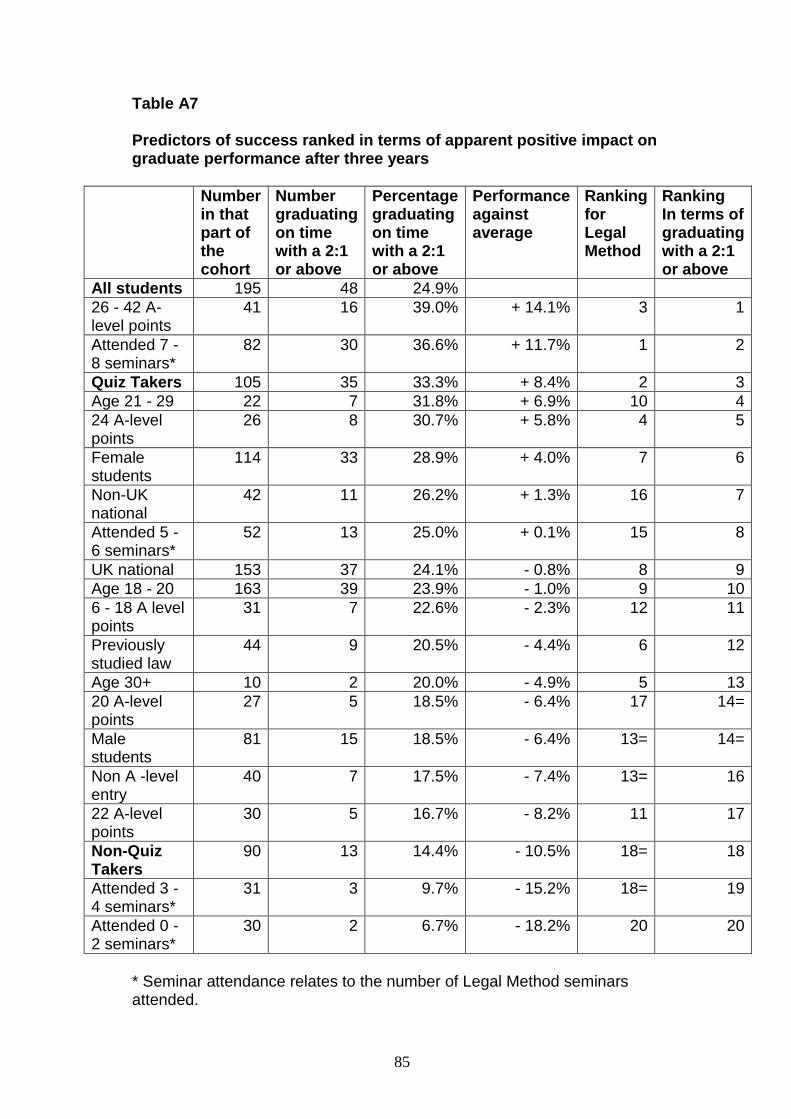
85
Table A7 Predictors of success ranked in terms of apparent positive impact on graduate performance after three years
Number in that part of the cohort
Number graduating on time with a 2:1 or above
Percentage graduating on time with a 2:1 or above
Performance against average
Ranking for Legal Method
Ranking In terms of graduating with a 2:1 or above
All students 195 48 24.9%
26 - 42 A-level points
41 16 39.0% + 14.1% 3 1
Attended 7 - 8 seminars*
82 30 36.6% + 11.7% 1 2
Quiz Takers 105 35 33.3% + 8.4% 2 3
Age 21 - 29 22 7 31.8% + 6.9% 10 4
24 A-level points
26 8 30.7% + 5.8% 4 5
Female students
114 33 28.9% + 4.0% 7 6
Non-UK national
42 11 26.2% + 1.3% 16 7
Attended 5 - 6 seminars*
52 13 25.0% + 0.1% 15 8
UK national 153 37 24.1% - 0.8% 8 9
Age 18 - 20 163 39 23.9% - 1.0% 9 10
6 - 18 A level points
31 7 22.6% - 2.3% 12 11
Previously studied law
44 9 20.5% - 4.4% 6 12
Age 30+ 10 2 20.0% - 4.9% 5 13
20 A-level points
27 5 18.5% - 6.4% 17 14=
Male students
81 15 18.5% - 6.4% 13= 14=
Non A -level entry
40 7 17.5% - 7.4% 13= 16
22 A-level points
30 5 16.7% - 8.2% 11 17
Non-Quiz Takers
90 13 14.4% - 10.5% 18= 18
Attended 3 - 4 seminars*
31 3 9.7% - 15.2% 18= 19
Attended 0 - 2 seminars*
30 2 6.7% - 18.2% 20 20
* Seminar attendance relates to the number of Legal Method seminars attended.

86
Interestingly student engagement in terms of seminar attendance in
Legal Method remained a major predictor of subsequent performance. Not
only did, as discussed in the main report,25 one third of quiz takers graduate
with a 2:1 or better26 as against only one seventh of non-quiz takers, but there
was also a link between seminar attendance and degree classification.
Table A8
Degree classification after three years of study and seminar attendance in Legal Method
Number in that part of the cohort
Number graduating on time with a 2:1 or above
Percentage graduating on time with a 2:1 or above
Performance against average
Ranking for Legal Method
Ranking In terms of graduating with a 2:1 or above
All students
195 48 24.9%
Attended 7 - 8 seminars
82 30 36.6% + 11.7% 1 2
Attended 5 - 6 seminars
52 13 25.0% + 0.1% 15 8
Attended 3 - 4 seminars
31 3 9.7% - 15.2% 18= 19
Attended 0 - 2 seminars
30 2 6.7% - 18.2% 20 20
More than one student in three who attended 7 or 8 seminars out of 8
in Legal Method went on to graduate with a 2:1 after three years of study as
against only one student in 15 of those who had attended 0 - 2 Legal Method
seminars. Indeed poor Legal Method seminar attendance was the single
25
See Table 25 and Chart 11 in the main report. 26
In fact no student from the September 2003 intake graduated with a first class honours degree in June 2006. Therefore all the 2:1 and above results are actually 2:1s.

87
greatest predictor of future poor degree performance. The findings are
interesting and would seem to support the tentative conclusion in the main
report that student engagement is a pivotal factor in student success.
However, whilst it might be anticipated that those who were engaged with
Legal Method remained engaged not only throughout their first year27 but
throughout their studies, there is no evidence to support this contention. As
seminar attendance was not charted in other modules and as online quizzes
were not incorporated in other modules it is not possible to identify whether,
as surmised, these students remained more engaged. Another possible
explanation is that quiz taking and seminar attendance in Legal Method gave
students the good grounding that they required for their future studies. This
interpretation supports the view that Legal Method provides the foundations
on which future legal studies were built.
Looking at Legal Method performance both quiz taking and excellent
seminar attendance were most closely linked to the best performance.
However, when it came to degree result after three years (as shown in Tables
A6 and A7 above), it was those students with the very highest A-level entry
qualifications who were performing best - with 39% of these students already
having graduated with a 2:1.
27
As apparently evidenced by Table 20 in the main report.

88
Table A9 Degree classification after three years of study and A-level grades Number
in that part of the cohort
Number graduating on time with a 2:1 or above
Percentage graduating on time with a 2:1 or above
Performance against average
Ranking for Legal Method
Ranking In terms of graduating with a 2:1 or above
All students
195 48 24.9%
26 - 42 A-level points
41 16 39.0% + 14.1% 3 1
24 A-level points
26 8 30.7% + 5.8% 4 5
6 - 18 A level points
31 7 22.6% - 2.3% 12 11
20 A-level points
27 5 18.5% - 6.4% 17 14=
Non A -level entry
40 7 17.5% - 7.4% 13= 16
22 A-level points
30 5 16.7% - 8.2% 11 17
Table A9 demonstrates that in general those with higher A-level points
achieved better results after three years. However, the picture as shown
above is not simple or clear cut. Those with 24 A-level points and above
performed better than the others, as might have been predicted. However,
below that the picture was confused - with those with 22 points performing
least well and those with 20 points performing less well than those with less
than 20 points. There is no obvious explanation of these findings and they
may simply be down to relatively small sample sizes. The possible conclusion
that A-level grades are not a predictor of success over a three year degree
programme does not explain why those with the best A-level grades did best.
Bringing seminar attendance into the equation does not provide an
easy explanation.

89
Table A10
Legal Method seminar attendance and A-level grades
Number of
students
Average number of Legal
Method seminars attended
Non A -level entry 40 5.8
6 - 18 A level points 31 4.9
20 A-level points 27 4.5
22 A-level points 30 5.6
24 A-level points 26 5.8
26 - 42 A-level points 41 5.4
Table A10 also shows that those with better A-level grades generally
attended more seminars than those with poorer A-level grades. This would
seem to reflect the general outcome in both Legal Method and after three
years study where overall those with better A-level grades did better. The
performance of those A-level entrants with 20 A-level points and below
supports this link. These were the groups with the lowest A-level points and
also the poorest rate of seminar attendance. They also achieved a below
average level of performance in both Legal Method and after three years. The
performance of those with 24 A-level points and above similarly supports the
thesis that there is a connection between A-level grades, seminar attendance
and performance both after one term and after three years. These students
attended more Legal Method seminars than those A-level entrants with 20
points and below, had better A-levels and gained better grades throughout
their studies. However, those with 22 A-level points had almost the highest

90
rate of Legal Method seminar attendance but the worst results after three
years. Clearly more research needs to be undertaken if a robust explanation
is to be discerned.
In examining degree performance after three years study it can be
seen from Tables A6 and A7 that female students outperformed male
students with 28.9% of female students graduating with a 2:1 after three
years as against only 18.5% of male students. As examined earlier the female
students had virtually identical A-level scores as the male students,28 so the
explanation is more likely to relate to engagement - evidenced by their better
seminar attendance and their greater willingness to engage with the quizzes.
The finding runs counter to the HEFCE (2003) finding that male
undergraduates very slightly outperformed female undergraduates with the
same A-level entry qualifications. The HEFCE study was just looking at 18
year old degree entrants whereas this analysis is based on entrants of all
ages and this may explain the disparity. Additionally the HEFCE study was
based on university entrants in 1997-98, whereas this research project was
focussing on entrants in 2003-04 - possibly in the intervening years there had
been changes either within the education system or outside to affect the
relationship. Finally and possibly most significantly as noted by HEFCE
(2005b) there are differences in the subjects studied by male and female
undergraduates, with a greater preponderance of male students in the
sciences where traditionally more firsts have tended to be awarded. The
HEFCE (2003) report looks at performance in higher education generally
28
Male students with A-levels averaged 22.6 points as compared to female students with A-levels averaging very slightly less with 22.2 points.

91
whereas this research project was simply looking at performance in one
discipline at one university.
Interestingly those who had studied Law A-level or AS-level performed
better than average in Legal Method, but performed below par after three
years of study. In Legal Method this group achieved an average of 57.2% as
against a cohort average of 54.7% (see Tables A1 and A2). However, when it
came to graduating within three years with a 2:1 or better only 20.5% of those
who had previously studied Law at A or AS-level achieved a 2:1 as against a
cohort average of 24.9%. A possible explanation is that prior study of law was
a considerable advantage in first year law modules. However, as students got
further into the course those who had previously studied Law were
increasingly studying unfamiliar topics and their advantage was disappearing.
This might explain a reduction in their advantage, but does not explain why
they eventually performed less well. Another possible explanation is that
after the first year they felt that they did not need to work as hard in order to
succeed - an approach which turned out to be based on a false confidence.
However, there is no evidence to either support or challenge this theory. The
evidence from Legal Method is that those who had passed A-level law
attended the same number of seminars on average as those who had not
previously studied law29 suggesting an equivalent level of engagement.
However, whether this level of engagement was maintained is unknown.
An interesting finding in terms of quiz taking was that less traditional
students in terms of age, nationality and entry qualifications were more likely
to take quizzes. When looking at performance in Legal Method these groups
29
Those with A-level law attended on average 5.2 seminars out of 8 in Legal Method. The figure for those who had clearly not studied law prior to university was virtually identical at 5.3 seminars.

92
with the exception of those students aged 30 and above generally performed
less well.30 In looking at performance after three years the picture is
interestingly different.
Non-UK nationals proved slightly more likely to graduate with a 2:1
within three years - 26.2% as against 24.1% of UK nationals. Whilst the
closeness of the result and the small sample size of the non-UK national
group makes it dangerous to generalise from this finding,31 it is noteworthy
that the non-UK nationals were no longer after three years performing less
well. Therefore possibly the increased engagement evidenced by a greater
willingness to engage with the quizzes could possibly explain their improved
performance, alternatively the explanation may simply relate to improved
language skills acquired during three years of undergraduate study.
The increased engagement leading to better performance explanation
does not apply to non A-level entrants. These students continued to perform
less well than average after three years.32 The point can be made that with a
small sample only a few changed results would alter the picture - for example
had three more non A-level entrants gained a 2:1 rather than a 2:2 the
percentage gaining a 2:1 within three years would have equated to the cohort
average. Nevertheless it seems that in general non A-level entrants, despite
being more prepared than the average to attempt the online quizzes, did less
well. If success is simply linked to engagement, the comparatively poor
performance of non A-level entrants is surprising. In Legal Method these
30
See Tables A1 and A2 generally. See Table A4 for performance in terms of entry qualifications and see Table A5 for performance by age grouping. See also the general discussion on performance in Legal Method on pages v to viii. 31
If one non-UK national had graduated with a 2:2 rather than a 2:1 the percentage of non-UK nationals graduating with a 2:1 would have dropped to 23.8%. A figure 0.3% below the average for UK nationals. 32
See Table A9 above.

93
students were more prepared to attempt the quizzes33 and as shown in Table
A10 above they attended more Legal Method seminars than those who had
entered on the basis of A-level results. Generally this research has identified
quiz taking and Legal Method seminar attendance as being positively
associated with performance after three years.34 However, non A-level
entrants were generally still performing less well than average after three
years. There is no obvious explanation arising from the data gathered.
Various theories could be postulated. Perhaps these students start with a
disadvantage which they are never able to overcome. Perhaps they have
more external pressures that prevent them being able to focus on their
studies. Answers to these questions deserve further examination but lie
outside the remit of this research project.
In terms of age, then in relation to Legal Method the picture had been
slightly confused with students aged over 30 performing better than average
but those aged 21-29 performing less well than average. However three
years later the picture was reversed.
33
63.6% of non-A-level entrants were quiz takers as against 51.6% of A-level entrants. 34
See Tables A6 and A7 above.

94
Table A11
Degree classification after three years of study and age grouping Number
in that part of the cohort
Number graduating on time with a 2:1 or above
Percentage graduating on time with a 2:1 or above
Performance against average
Ranking for Legal Method
Ranking In terms of graduating with a 2:1 or above
All students
195 48 24.9%
Age 21 - 29
22 7 31.8% + 6.9% 10 4
Age 18 - 20
163 39 23.9% - 1.0% 9 10
Age 30+ 10
2 20.0% - 4.9% 5 13
Those aged 21 - 29 had after three years become the best performing
age grouping with 31.8% gaining a 2:1 within that timeframe. Conversely
those aged 30 and above were the least likely to gain a 2:1 within three years,
despite having been the best performing age group in Legal Method and the
age group most likely to engage with quizzes and attend seminars.35 Again
sample size raises a major caveat; if one more student aged 30 and above
had gained a 2:1 rather than a 2:2 within the three year period then the
performance of the age grouping would have exceeded the average.
One means of coping with the small sample size when breaking the
cohort up into a number of sub-groupings is to examine the entire cohort in
terms of a number of measures applicable to them all (or at least substantially
all of them). Three factors that appear linked to student performance are quiz
35
Those aged 30 and above attended an average of 6.2 seminars in Legal Method. Those aged 21 - 29 attended 5.6 seminars and those aged 18 - 20 attended an average of 5.3 seminars.

95
taking, seminar attendance and A-level grades. There are 157 students36 on
which there is data on all three criteria.
Performance in Legal Method reconsidered
Table A12 Descriptive Statistics
Mean Std. Deviation
N
Marks in Legal Method
55.1592 12.92905 157
A-level Points 22.37 5.874 157
Seminars attended in Legal Method
5.2484 2.51574 157
Quizzes attempted in Legal Method
3.3376 3.86064 157
Table A12 shows the mean and standard deviation for each of the four
variables being considered.
36
The 44 students who gained entry without A-levels have been excluded from this part of the analysis.
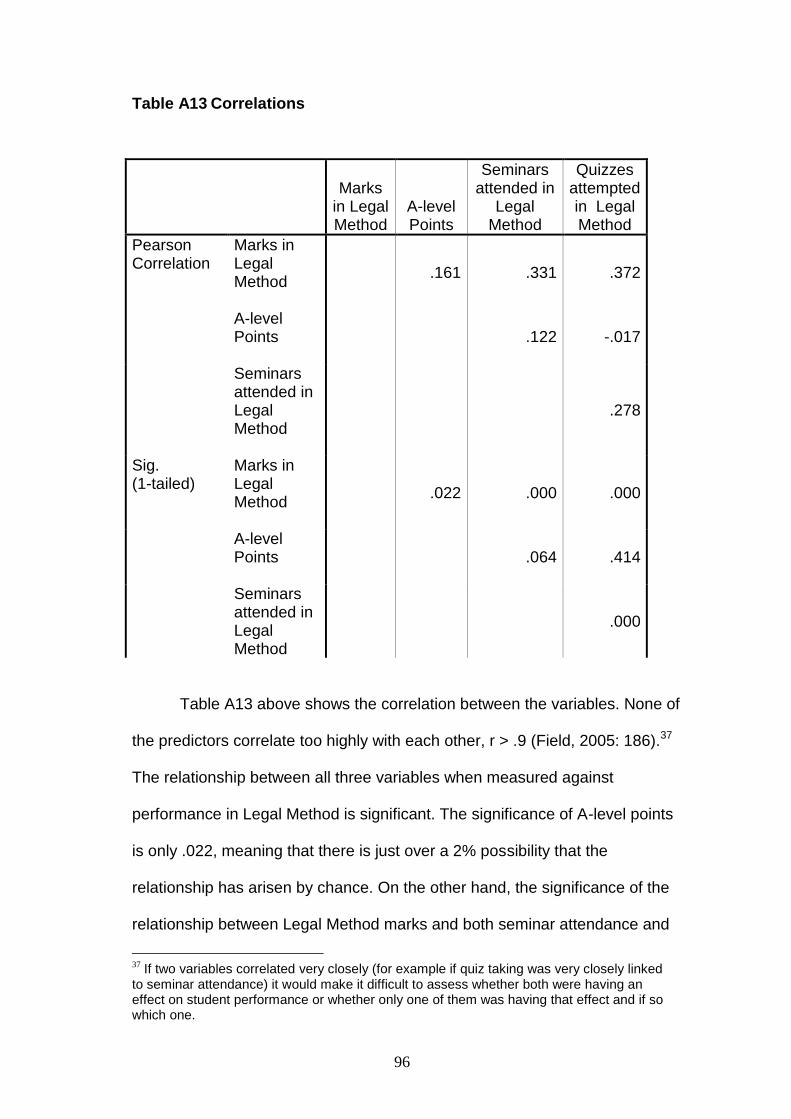
96
Table A13 Correlations
Marks
in Legal Method
A-level Points
Seminars attended in
Legal Method
Quizzes attempted in Legal Method
Pearson Correlation
Marks in Legal Method
.161 .331 .372
A-level Points
.122 -.017
Seminars attended in Legal Method
.278
Sig. (1-tailed)
Marks in Legal Method
.022 .000 .000
A-level Points
.064 .414
Seminars attended in Legal Method
.000
Table A13 above shows the correlation between the variables. None of
the predictors correlate too highly with each other, r > .9 (Field, 2005: 186).37
The relationship between all three variables when measured against
performance in Legal Method is significant. The significance of A-level points
is only .022, meaning that there is just over a 2% possibility that the
relationship has arisen by chance. On the other hand, the significance of the
relationship between Legal Method marks and both seminar attendance and
37
If two variables correlated very closely (for example if quiz taking was very closely linked to seminar attendance) it would make it difficult to assess whether both were having an effect on student performance or whether only one of them was having that effect and if so which one.

97
quiz attempts is less than .001. This means that there is less than one chance
in a thousand of the null hypothesis i.e. that there is no relationship between
either quiz taking or seminar attendance and performance in Legal Method.
The Pearson Correlation Coefficient for the marks in Legal Method is
interestingly higher for both seminar attendance and for quiz taking than they
are for A-level points. This supports the contention that these factors are a
greater predictor of success than A-level grades. This is particularly
noteworthy in the light of the HEFCE (2003) finding that A-level grades of 18
year old university entrants are the most important pre-university predictor of
higher education achievement. In relation to Legal Method performance the
Pearson Correlation Coefficient for quiz taking is higher than that for seminars
suggesting a closer link between quiz taking and performance than there is
between seminar attendance and performance.

98
Table A14 Model Summaryb
Model 1
R .462a
R Square .214
Adjusted R
Square
.198
Std. Error of the
Estimate
11.57709
Change Statistics R Square Change .214
F Change 13.854
df1 3
df2 153
Sig. F Change .000
Durbin-Watson 1.9038
a Predictors: (Constant), Quizzes attempted in Legal Method, A-level Points,
Seminars attended in Legal Method
b Dependent Variable: Marks in Legal Method
The r2 figure of .214 indicates that the three variables (A-level points,
quiz taking and seminar attendance) are capable of predicting 21.4% of the
marks in Legal Method.
38
The closeness of the Durbin-Watson statistic to 2 indicates that the errors in regression
are independent. A result of less than 1 or greater than 3 would have called for further investigation (Field, 2005: 190).

99
Table A15 ANOVAb
Model
Sum of
Squares df
Mean
Square F Sig.
1 Regression 5570.596 3 1856.865 13.854 .000a
Residual 20506.423 153 134.029
Total 26077.019 156
a Predictors: (Constant), Quizzes attempted in Legal Method A-level Points,
Seminars attended in Legal Method
b Dependent Variable: Marks in Legal Method
Table A16.1
Coefficientsa
Model Unstandardized
coefficients
Standardized
Coefficients
t Sig.
B Std. Error Beta
1 (Constant)
A-level Points
Seminars attended
Quizzes attempted
38.723
.305
1.170
1.043
3.976
.159
.387
.250
.138
.228
.312
9.738
1.913
3.023
4.169
.000
.058
.003
.000
a Dependent Variable: Marks in Legal Method

100
Results in the Sig column of less than .05 are significant, results of less
than .005 are very significant. Both the figure for seminars attempted and for
quizzes attempted are very significant. The figure for quizzes attempted being
less than .001. The standardized beta values indicate the importance of each
predictor. As with the sig results these indicate that the number of quizzes
attempted was the most important factor, followed by the number of seminars
attended. The A-level points achieved prior to the start of the course have a
much lower standardized beta value and fall just outside the .05 significance
threshold.
Table A16.2
Coefficientsa
Model
95% Confidence Interval for B
Lower Bound Upper Bound
1 (Constant)
A-level Points
Seminars attended
Quizzes attempted
30.868
-.010
.405
.549
46.579
.619
1.934
1.538
All values within the 95% confidence interval for both seminars
attended and quizzes attempted are positive, reinforcing the message that
attending seminars and attempting quizzes leads to better results. Whilst
most values for A-level points are positive the lower bound of the 95%
confidence interval is negative raising a slight question as to whether better
A-level grades are necessarily a predictor of Legal Method success.
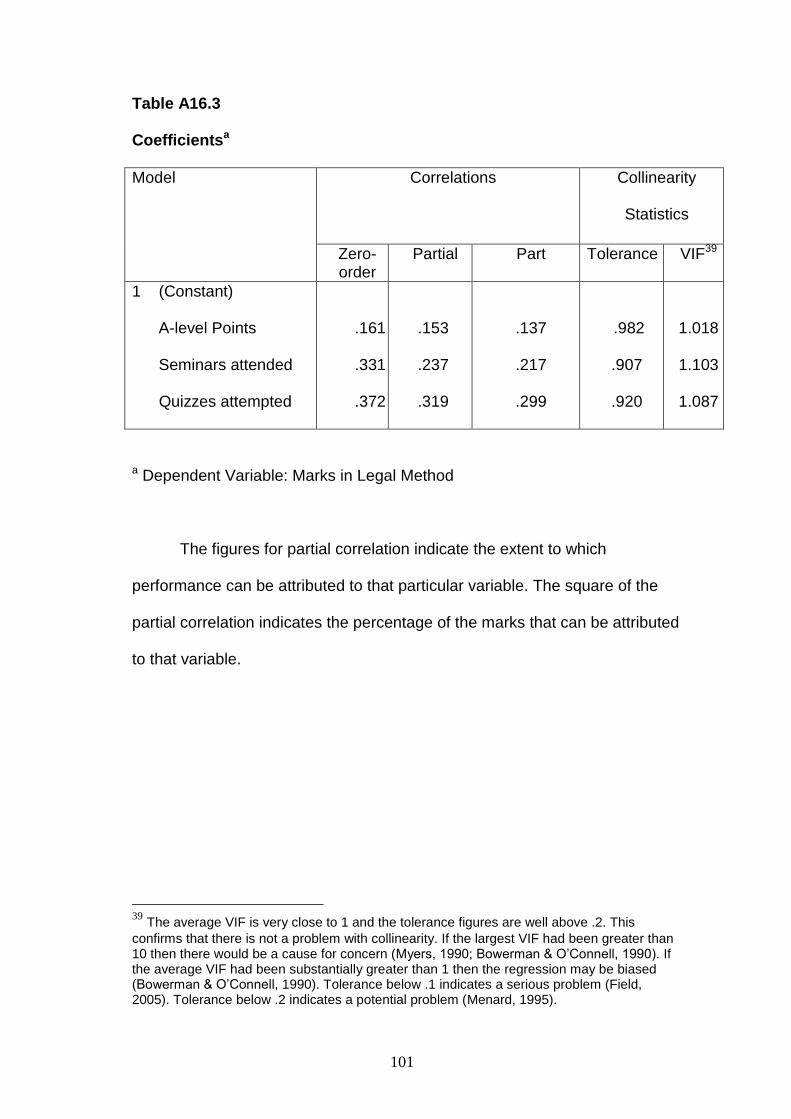
101
Table A16.3
Coefficientsa
Model Correlations Collinearity
Statistics
Zero-order
Partial Part Tolerance VIF39
1 (Constant)
A-level Points
Seminars attended
Quizzes attempted
.161
.331
.372
.153
.237
.319
.137
.217
.299
.982
.907
.920
1.018
1.103
1.087
a Dependent Variable: Marks in Legal Method
The figures for partial correlation indicate the extent to which
performance can be attributed to that particular variable. The square of the
partial correlation indicates the percentage of the marks that can be attributed
to that variable.
39
The average VIF is very close to 1 and the tolerance figures are well above .2. This
confirms that there is not a problem with collinearity. If the largest VIF had been greater than 10 then there would be a cause for concern (Myers, 1990; Bowerman & O’Connell, 1990). If the average VIF had been substantially greater than 1 then the regression may be biased (Bowerman & O’Connell, 1990). Tolerance below .1 indicates a serious problem (Field, 2005). Tolerance below .2 indicates a potential problem (Menard, 1995).

102
Table A 16.4
Partial Correlation2
Partial Correlation2
A-level Points .019
Seminars attended .056
Quizzes attempted .102
Table A 16.4 indicates that 10.2% of the Legal Method results could
be attributed solely to quiz attempts. This compares to 5.6% of the result
being capable of being explained by seminar attendance and 1.9% being
attributable to A-level grades.40 This is in line with the earlier findings
indicating that quiz attempts had the most impact on student performance,
with seminar attendance the second most influential factor and A-level
grades the third most influential. However, the finding is quite dramatic in
that it indicates that quiz attempts are almost twice as important an influence
as seminar attendance and more than five times as important as A-level
points as a predictor of success.
40
The total of these three effect sizes (10.2% + 5.6% + 1.9% = 17.7%) does not equate to the 21.4% calculated earlier as being the influence of the three factors combined. The difference is explained by the fact that there is some overlap between the three factors where two or more factors are working together to affect the marks. The calculation in the above Table seeks to isolate the effect of each variable and in so doing avoids the uncertainty as to which variable is having the impact where there is an overlap.

103
Table A17
Casewise Diagnosticsa
Case
Number
Std.
Residual
Marks in Legal
Method
Predicted
Value Residual
40 -3.023 31.00 66.0013 -35.00132
a Dependent Variable: Marks in Legal Method
Table A17 identifies only one student with a mark which is very
different from that which would be predicted given the student’s A-level
grades, seminar attendance and record of quiz attempts. Field (2005)
suggests that a check should be made if more that 5% of cases have values
above 2. Only one out of 157 (0.6%) falls outside + or - 2. This is also within
Field’s suggestion that results should be investigated further if more than 1%
fall outside + or - 2.5. As the one case is outside = or - 3, it can be viewed as
an outlier.41
41
Whilst it is viewed as acceptable to exclude occasional outliers from an analysis, the analysis was not re-run excluding this one case. As there was only one outlier out of 157 records being examined the impact of excluding this one case was not expected to alter the clear picture that had emerged.
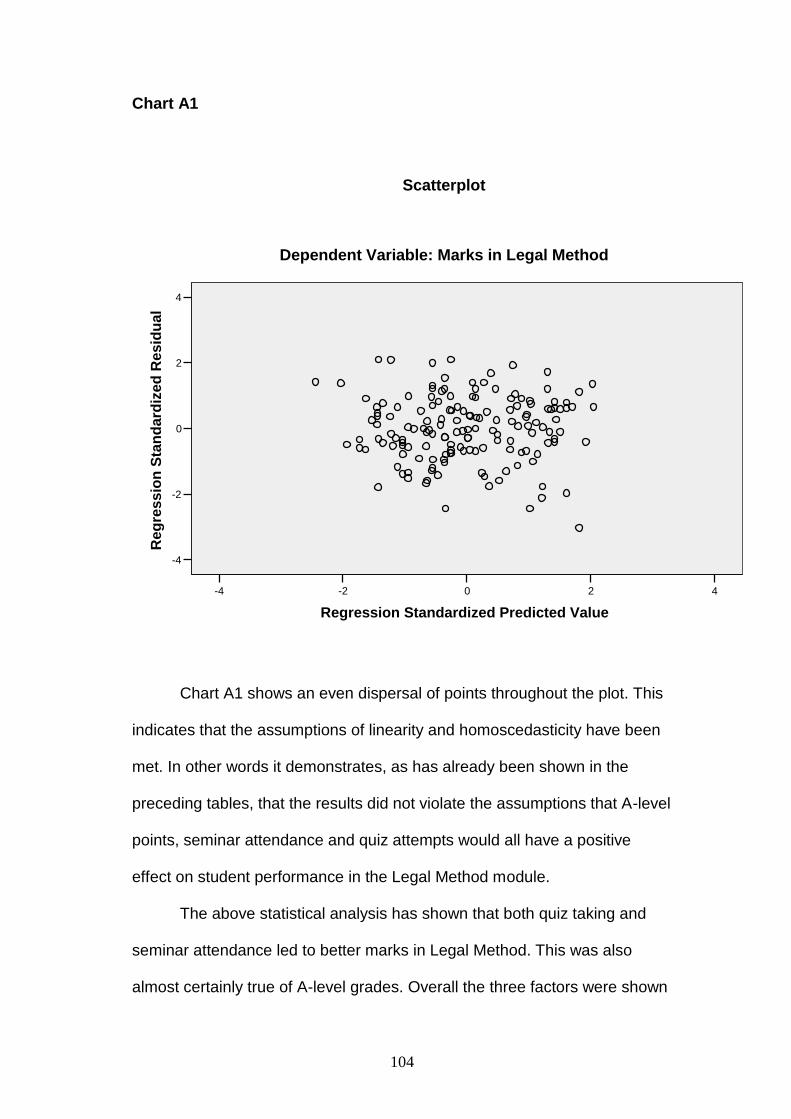
104
Chart A1
420-2-4
Regression Standardized Predicted Value
4
2
0
-2
-4
Reg
ressio
n S
tan
dard
ized
Resid
ual
Dependent Variable: Marks in Legal Method
Scatterplot
Chart A1 shows an even dispersal of points throughout the plot. This
indicates that the assumptions of linearity and homoscedasticity have been
met. In other words it demonstrates, as has already been shown in the
preceding tables, that the results did not violate the assumptions that A-level
points, seminar attendance and quiz attempts would all have a positive
effect on student performance in the Legal Method module.
The above statistical analysis has shown that both quiz taking and
seminar attendance led to better marks in Legal Method. This was also
almost certainly true of A-level grades. Overall the three factors were shown

105
to be able to predict over 21% of the marks awarded in the module.42 The
Beta standardized coefficient results43 indicate that for each quiz attempted
students could be expected to improve their mark by 0.312 marks. This
compared to an average improvement of 0.228 for every seminar attended
and 0.138 for every additional A-level point the student had achieved.
When an attempt was made to separate the impact of each predictor44 it
was found that quiz attempts were a much better predictor of success than
either seminar attendance or A-level points - with 10.2% of the results being
solely attributable to quiz attempts, 5.6% attributable to seminar attendance
and 1.9% to A-level grades.
Whilst providing very strong evidence for the beneficial impact of the
online quizzes, these findings also raise some questions. In the main body a
hypothesis was developed that quiz taking encouraged engagement with
the course and that this was the reason why quiz takers performed better
than non-quiz takers. Such a hypothesis would be likely to lead to an
expectation that a similar level of improvement would be exhibited in relation
to seminar attendance. However, whilst seminar attendance was shown to
be beneficial, the extent of the positive impact of seminar attendance was
not as great. This discrepancy might possibly be explained by the particular
nature of the quizzes and seminars on this particular course. Attempts to
replicate this project in other modules, at other universities and in other
subject areas might help discover whether there was something about this
particular module and the nature of the quizzes and seminars which led to
the results.
42
See Table A14 above. 43
See Table A16.1 above. 44
See Table A16.4 above.

106
Nevertheless the possibility exists that there is something about quiz
taking that goes beyond simply fostering engagement. The ability to
undertake work at a time of the student’s choosing; to repeat the work
whenever the student wants to do so and the ability to receive immediate
feedback tailored to the answers the student has given may mean that
online quizzes have strengths which seminars cannot replicate.
This is clearly an area for further research. As a tentative suggestion
it may be that online quiz taking fosters self belief, linking into the idea that
people’s motivation and success is influenced by their belief in their own
ability to organise and carry out the necessary actions (see for example:
Bandura, 1997; Pajares & Schunk, 2001; Pintrich & De Groot, 1990).

107
Appendix B
Postscript
In 2004-05 there were major changes to the undergraduate degree
structure at Oxford Brookes University. The term based modular course
structure was replaced by a semester based system. Legal Method remained
a 15 credit level 1 module and continued to be completed before Christmas.
However, instead of being typically studied alongside two other modules it
was, as from September 2004, generally studied simultaneously with three
other modules. The course length was also changed. Instead of running for
eight teaching weeks, followed by a revision week and then an examination
week, the structure was changed. An earlier September start enabled the
module to be run over 12 weeks. The number of lectures was increased by
one, a reading week was introduced and the coursework submission date
was delayed by one week. As discussed in the main body this meant that it
was not realistic to include the experience of students studying Legal Method
in 2004 in the assessment of the impact of the online quizzes.
However, there are some interesting points to be gleaned from the
2004-05 cohort. By the time this group took the module, preliminary
assessment of the performance of quiz takers and non-quiz takers had been
undertaken (Catley, 2005). As it had already been decided to exclude these
students from the research project it was decided that they should be told the
findings of this research; this was covered in the extra lecture. This additional
lecture was delivered early in the module.

108
118 of the 152 students on the module (77.6%) attempted at least one
quiz.
Table B1
Number of quizzes attempted
2003-04 cohort 2004-05 cohort
Number of
quizzes
attempted
Number of
students
Percentage
of cohort
Number of
students
Percentage
of cohort
None 92 45.8% 34 22.4%
One 7 3.5% 6 3.9%
Two 12 6.0% 8 5.3%
Three 7 3.5% 5 3.3%
Four 4 2.0% 4 2.6%
Five 5 2.5% 6 3.9%
Six 9 4.5% 5 3.3%
Seven 4 2.0% 7 4.6%
Eight 6 3.0% 6 3.9%
Nine 55 27.4% 71 46.7%
201 152
The above Table suggests that students were more prepared to
engage with the quizzes when they were provided with evidence as to the
advantages of quiz taking. Nevertheless despite the strength of the findings

109
almost a quarter of the cohort did not attempt any of the quizzes and less
than half attempted all of them.
Chart B1
0%
5%
10%
15%
20%
25%
30%
Under
40%
40-
49%
50-
59%
60-
69%
70% +
Student Marks
Comparing the Four Stages
First Stage - No ICT
Second Stage - Web
based Guidance
Third Stage - Online
quizzes
Fourth Stage -
Longer Module
The above Chart shows that the improved results continued after the
major changes that took place in 2004-05. The percentage of firsts rose to
16.5% from 15.5% the previous year and a start point of just 6.3%. The
percentage of marks of 60% and above was very close to that in 2003-04
with 38.2% achieving such marks in 2004-05 as against 38.8% a year
earlier. Both figures were a very marked improvement on the 21.4%
achieved before online support. In terms of fails the 2004-05 results were
the best achieved in any year - with only 9.9% failing at first attempt. The
range of factors that changed in 2004-05 makes it virtually impossible to

110
identify cause and effect. However, an analysis of the performance of quiz
takers against non-quiz takers supports the conclusion in the main body of
the thesis and in Appendix A that quiz takers outperform non-quiz takers.
Table B2 Comparing the Marks in Legal Method of Quiz Takers and Non-Quiz Takers
Quiz Takers
2004-05
Non-Quiz Takers
2004-05
Mark Grouping
Number of students
Percentage of cohort in each mark grouping
Number of students
Percentage of cohort in each mark grouping
70% +
22 18.6% 3 8.8%
60 - 69%
29 24.6% 4 11.8%
50 - 59%
33 28.0% 9 26.5%
40 - 49%
27 22.9% 10 31.3%
Under 40%
7 5.9% 8 23.5%
Size of cohort
118 34
Quiz takers were more than twice as likely to gain marks of 70% and
above. 43.2% of quiz takers gained marks of 60% and above as against just
20.6% of non-quiz takers. Whilst quiz taking did not eliminate the risk of
failure, the percentage failing was only about a quarter that found among
non-quiz takers: 5.9% as against 23.5%. These differences are also shown
in Chart B2 below.

111
Chart B2
0%
5%
10%
15%
20%
25%
30%
35%
Under
40%
40-
49%
50-
59%
60-
69%
70% +
Student Marks
Comparing the final marks of
Quiz-takers and Non-Quiz takers
Legal Method 2004-05
Quiz takers
Non-Quiz takers
Overall the results of the 2004-05 cohort supported the earlier
conclusions. Quiz taking was linked to better student performance. Table B3
shows the statistical link between quiz taking and student performance.

112
Table B3
Correlation - Quiz Attempts and Legal Method Marks
Marks for Legal
Method Quizzes attempted
Pearson Correlation
.400(**)
Sig. (1-tailed)45
.000
N
152
** Correlation is significant at the 0.01 level (1-tailed).
The finding of a Pearson Correlation Coefficient (r) of .400** means
that given the sample size there was a less than one percent probability that
the relationship between quizzes attempted and marks was simply a chance
relationship. This exceeds the .342** Pearson Correlation Coefficient found
when analysing the 2003-04 cohort as shown in Table 22 of the main body.
The r2 figure suggests that 16% of the results could be predicted by the
number of quiz attempts.
As discussed in the main body, this research project has identified a
very strong link between quiz taking and student performance in one law
module in one undergraduate programme. The link has been repeated over
three separate cohorts and in the one year in which it has been followed
through it has also been shown in other first year law modules and in degree
performance after three years. A range of issues remain to be tested for
example whether these results can be replicated in other subject areas and
1 A one-tailed test of significance has been used because it is anticipated that quiz taking
will have a positive impact on performance. A two-tailed test of significance would have been used if it had been anticipated that quiz taking would affect performance, but the direction of that impact was unknown (i.e. it was thought quiz taking would affect performance, but there was no certainty as to whether it would improve or worsen performance).

113
in other universities. However, the 2004-05 cohort results suggest that the
take up of online quizzes can be improved and that by explaining to
students the benefits of quiz taking those positive benefits can be increased
further.

114
Bibliography
Aldridge, J., Fraser, B., Fisher, D., Trinidad, S. & Wood, D. (2003) Monitoring the success of an outcomes-based, technology-rich learning environment. Paper presented at the annual meeting of the American Educational Research Association, Chicago, Illinois, April Arbaugh, J.B. (2000) An exploratory study of the effects of gender on student learning and class participation in an Internet based MBA course Management Learning 31, 503-519 Bailey, M.A., Hall, B. & Cifuentes, L., 2001, Web-based Instructional Modules Designed to Support Fundamental Math Concepts in Entry Level College Mathematics: Their Effects, Characteristics of Successful Learners and Effective Learning Strategies. In WebNet 2001: World Conference on the WWW and Internet Proceedings, Orlando, FL, October 23-27, 2001 Bandura, A. (1997). Self-Efficacy: The Exercise of Control. New York: Freeman Bates, A.W., 1995, Technology, Open Learning and Distance Education, London: Routledge Bates, A.W., 2005, Technology, E-Learning and Distance Education, Abingdon: Routledge Bermingham, V. & Hodgson, J., (2006) Feedback on Assessment: Can We Provide a Better Student Experience by Working Smarter than by Working Harder?, The Law Teacher, Volume 40, Number 2, 151-172 Billings, D.M., (ed.) 2004, Conversations in E-Learning, Pensacola, FL: Pohl Publishing Bone, A, (2006) The impact of formative assessment on student learning, http://www.ukcle.ac.uk/research/projects/bone.html (last accessed 29/03/2014) Bonham, S.W., Beichner, R.J., Titus, A. & Martin, L., (2000) Education Research Using Web-Based Assessment Systems, Journal of Research on Computing in Education, Fall 2000, Volume 33, Number 1, 28 - 44 Bork, A., (1981) Learning with Computers, Digital Press, Bedford, MA Boud, D (2013) Enhancing Learning Through Self-Assessment, Routledge: Abingdon Bower, M., 2005, Online Assessment Feedback: Competitive, Individualistic or Preferred Form!, Journal of Computers in Mathematics and Science Teaching, vol.24, no.2, 121-147
115
Bowerman, B.L. & O’Connell, R.T. (1990). Linear Statistical models: an applied approach. 2nd ed. Belmont, CA: Duxbury Brass, K. & Pilven, P., 1999, Using timely feedback on student progress to facilitate learning. In Cornerstones: what do we value in higher education? Proceedings, Canberra: Higher Education Research and Development Society of Australasia Brennan, R. (2003). One size doesn't fit all: pedagogy in the online environment-Volume 1. NCVER. Breslow, l., Pritchard, D., De Boer, J., Stump, G., Ho, A., & Seaton, D., (2013) Studying Learning in the Worldwide Classroom: Research into edX’s First MOOC, Research & Practice in Assessment 8: 13-25 Buchanan, T., 2000, The efficacy of a World-Wide Web mediated formative assessment, Journal of Computer Assisted Learning 16, 193-200 Byrnes, R., Debreceny, R. & Gilmour, P., 1995, The Development of a Multiple-Choice and True-False Testing Environment on the Web. In AusWeb95, innovation and diversity: the World Wide Web in Australia, proceedings of AusWeb95, the first Australian World Wide Web Conference, Ballina NSW, Australia. 30 April to 2 May 1995 edited by Debreceny, R. & Ellis A., (CD-ROM). Lismore NSW: Norsearch Limited Campbell, D., & Stanley, J., (1963) Experimental and Quasi-Experimental Evaluations in Social Research, Chicago: Rand McNally Carbone, A., & Schendzielorz, P., 1997, Developing and Integrating a Web-Based Quiz into the Curriculum. In WebNet 97 World Conference of the WWW, Internet & Intranet Proceedings (2nd, Toronto, Canada, November 1-5, 1997 Catley, P., (2005) One Lecturer’s experience of Blending E-Learning with Traditional Teaching or How to Improve Retention and Progression by Engaging Students, Brookes eJournal of Learning and Teaching, Volume 1, Issue 2 Catley, P., & Bilotto, P., (2006) An investigation into factors affecting student performance, progression and retention. Paper presented to the Law Faculty Diversity Committee, University of the West of England, June 2006 Challis, L., & Lidgey, J., (2000) Brookes’ Virtual Dimension, Teaching Forum, 48, 3-6 Chmielewski, M.A. (1998). Computer anxiety and learner characteristics: their role in the participation and transfer of Internet training. Dissertation Abstracts International Section A: Humanities and Social Sciences 59, 3-A, 0791

116
Clarke, A., (2004) E-Learning Skills, Basingstoke; Palgrave MacMillan Clegg, K., (2004) Playing safe: learning and teaching in undergraduate law, UK Centre for Legal Education. Coates, D., & Humphreys, B., (2001) Evaluation of Computer-Assisted Instruction in Principles of Economics, Educational Technology and Society, vol.4, no.2, 133-144 Dalziel, J. & Gazzard, S., 1998, WebMC: a web-based multiple choice assessment system. In Fernandez, A., (ed.) Proceedings of the University Science Teaching and the Web Workshop Sydney, UniServe Science, pages 25-27 Dalziel, J. & Gazzard, S., 1999, Beyond traditional use of multiple choice questions: teaching and learning with WebMCQ interactive questions and workgroups. In Open, flexible and distance learning: challenges of the new millennium: collected papers from the 14th Biennial Forum of the Open and Distance Learning Association of Australia, Geelong Vic: Deakin University 93-96 Dalziel, J., 2001, Enhancing web-based learning with computer assisted assessment: pedagogical and technical considerations, Information Technology, Education and Society, vol.2, no.2, p.67-76 Driscoll, M. 10 things we know about teaching online. Training and Development in Australia, vol. 28, no.2, pp 10-12 Duffy, T. M., Dueber, B., & Hawley, C. L. (1998). Critical thinking in a distributed environment: A pedagogical base for the design of conferencing. CRLT Technical Report, 5 (98), 1-27. Ellis, R., (2000) Writing to learn: Designing interactive learning environments to promote engagement in learning through writing. Proceedings of ASCILITE 2000: Learning to choose, choosing to learn. Available on the world wide web at: http://www.ascilite.org.au/conferences/coffs00/ (last accessed 29/03/2014) Essom, J., 2005, Attracting and Motivating New Learners with ICT, Leicester: National Institute of Adult Continuing Education Field, A., (2005), Discovering Statistics Using SPSS, 2nd edn., London, Sage Garrison, D.R. & Anderson, T., 2003, E-Learning in the 21st Century: A Framework for Research and Practice, London: Routledge Gibbs, G & Jenkins, A., (1992) Teaching Large Classes in Higher Education: How to Maintain Quality with Reduced Resources, London: Kogan Page

117
Gibbs, G., (Ed.) (1995) Improving Student Performance through Assessment and Evaluation, Oxford: Oxford Centre for Staff and Learning Development. Gipps, C., (2005) What is the Role for ICT-Based Assessment in Universities? Studies in Higher Education, vol.30, no.2, 171-180 Gluck, R., Vialle, W., Lysaught, P. & Larkin, J., (1998) What have I learned? Proceedings of ASCILITE 1998 (pp297-307) Available on the World Wide Web at: http://www.ascilite.org.au/conferences/wollongong98/asc98-pdf/gluck0063.pdf#search=%22gluck%20what%20have%20I%20learned%22 (last accessed 29/03/2014) Hammer, M., & Henderson, C.O., 1972, Improving Large Enrollment Undergraduate Instruction with Computer Generated, Repeatable Tests, Washington Syte University, Pullman Harris, P., and Beinart, S., (2005) A Survey of Law schools in the United Kingdom, 2004 The Law Teacher, Volume 39, Number 3, 299-374 Hedberg, J.G. & Corrent, A.S., 2000, Creating a postgraduate virtual community: assessment drives learning, Educational Media International, vol.37, no.2, pp 83-90 HEFCE (“Higher Education Funding Council for England”) (2003) Schooling effects on higher education achievement. Issues Paper, July. Bristol: HEFCE. Retrieved from the World Wide Web: http://www.hefce.ac.uk/pubs/hefce/2003/03_32.htm (last accessed 29/03/2014) HEFCE (“Higher Education Funding Council for England”) (2005a) HEFCE strategy for e-learning. Available on the world wide web at: http://www.hefce.ac.uk/pubs/hefce/2005/05_12/ (last accessed 29/03/2014) HEFCE (2005b) Higher Education Admissions: assessment of bias, Issues Paper. November. Bristol: HEFCE. Retrieved from the World Wide Web: http://www.hefce.ac.uk/pubs/hefce/2005/05_47/ (last accessed 29/03/2014) Hellweg, J., Gleadow, A., & McNaught, C. (1996) Paperless lectures on the web. Proceedings of ASCILITE 1996 (pp. 289-299). Hester, J.B., 1999, Using a Web-Based Interactive Test as a Learning Tool, Journalism and Mass Communication Educator, vol. 54, no.1, pp 35-41 Higgins, R., Hartley, P. & Skelton, A. (2002) The conscientious consumer: Reconsidering the role of assessment in feedback in student learning. Studies in Higher Education, 27, 53-64 Hills, H. 2004, Individual Preferences in E-Learning. Aldershot: Gower

118
Hoskins, S., & van-Hooff, J (2005) Motivation and ability: which students use online learning and what influence does it have on their achievement? British Journal of Educational Technology, Vol.36 No.2 177-192 Jackson, L.A., Ervin, K.S., Gardner, P.D. & Scmitt, N. (2001). Gender and the Internet: women communicating and men searching. Sex roles 44, pp 363 - 379 Jenkins, M., Browne, T., & Armitage, S. (2001). Management and implementation of Virtual Learning Environments: A UCISA funded survey. Universities and Colleges Information Systems Association (UCISA). JISC (2004) Effective Practice with e-learning: A good practice guide in designing for learning Bristol: HEFCE Jochems, W., van Merrienboer, J. & Koper, R., (eds.), 2004, Integrated E-Learning: Implications for Pedagogy, Technology and Organization, London: RoutledgeFalmer Jones, E. (1999). A Comparison of an All-Web-Based Class to a Traditional Class, in SITE 99: Society for Information Technology & Teacher Education International Conference (10th San Antonio, TX, February 28 – March 4). Jordan, K. (2014) Initial trends in enrolment and completion of massive open online courses, The International Review of Research in Open and Distance Learning, Vol. 15, No 1 Retrieved on 28th March 2014 from the World Wide Web: http://www.irrodl.org/index.php/irrodl/article/view/1651 Kerka, S. (1996) Distance learning, the internet, and the world wide web, ERIC Clearinghouse on Adult, career and Vocational Education, Ohio (ERIC Documentation Reproduction Service ED 395 214) Khan, B., 2005, E-Learning Strategies: Design, Delivery, Implementation and Evaluation, London: Information Science Publishing Kiser, K., (2001). Web enabled? OnlineLearning Magazine, 5(6), 28.
Kratwohl, D.R., (1985) Social and behavioral science research: A new framework for conceptualizing, implementing, and evaluating research studies San Fransisco: Jossey Bass Laurillard, D. (2002) Rethinking University Teaching: A Framework for the Effective Use of Educational Technology, 2nd edn., London: Routledge Lindsay, R. & Breen, R. (2000) Student Attitudes to IT-Based Learning Resources, Teaching Forum, No. 48, 9 – 11 Macdonald, J., 2006, Blended Learning and Online Tutoring: A Good Practice Guide, Aldershot: Gower

119
MacDougall, G., Place, C. & Currie, D., 1998, Web-Based Testing: A Form-Based Template for Creating Multimedia Enhanced Tests. In Ed-Media/Ed-Telecom 98 World Conference on Educational MultiMedia and Hypermedia & World Conference on Educational Telecommunications. Proceedings (10th, Freiburg, Germany, June 20-25, 1998) Mackie, S. (2006) Enhancing Student Learning through Online Interactive Tests Paper presented to the Faculty of Business Learning and Teaching Away Day, University of the West of England March, T (1997) Working the Web for Education: Theory and Practice on the Integrating the Web for Learning. Retrieved on 1st December 2007 from the World Wide Web: http://tommarch.com/writings/theory/ (last accessed 29/03/2014) Mazzolini, A., 1999, Testing Conceptual Understanding in Physics using a browser-based computer managed system, CAL-laborate, vol. 3, p 21-26 McArthur, D., & Lewis, M. (2001) Untangling the web: Applications of the internet and other information technologies to higher learning, RAND, California available on the internet at: http://www.rand.org/publications/MR/MR975/ (last accessed 29/03/2014) McConnell, D., 2006, E-Learning Groups and Communities, Maidenhead: Open University Press Menard, S. (1995). Applied logistic regression analysis. Thousand Oaks, CA: Sage Migdal, S., & Cartwright, M., (2000) Electronic Delivery in Law: What Difference does it Make to Results?, Web Journal of Current Legal Issues, vol.4: http://www.bailii.org/uk/other/journals/WebJCLI/2000/issue4/migdal4.html (last accessed 29/03/2014) Muilenburg, L., & Zane L.. (2005) Student barriers to online learning: A factor analytic study. Distance education 26.1: 29-48. Myers, R. (1990). Classical and modern regression with applications. 2nd ed. Boston, MA: Duxbury National Committee of Inquiry into Higher Education, (1997) Report of the National Committee of Inquiry into Higher Education, (Dearing Report) Hayes: NCIHE
Orsmond, P., Meery, S. & Reiling, K. (2002). The student use of tutor formative feedback. Paper presented at the Learning Communities and Assessment Cultures Conference organised by the EARLI Special Interest Group on Assessment and Evaluation, University of Northumbria, 28-30

120
August. Retrieved from the World Wide Web: http://www.leeds.ac.uk/educol/documents/00002233.htm (last accessed 29/03/2014) Pajares, F., & Schunk, D.H. (2001). Self-Beliefs and School Successes: Self Efficacy, Self-Concept and School Achievement. In Riding, R. & Rayner, S. Perception. London: Ablex Publishing Pearson, J., & Trinidad, S. (2005) OLES: an instrument for refining the design of e-learning environments Journal of Computer Assisted Learning 21, 399-404 Peat, M. (2000) Online assessment: The use of web based self assessment materials to support self directed learning. In Flexible Futures in Tertiary Teaching. Proceedings of the 9th Annual Teaching Learning Forum (pp. 2-4). Pintrich, P.R. & De Groot, E.V. (1990). Motivational and Self-Regulated Learning Components of Classroom Academic performance. Journal of Education Psychology, 82 (1), pp. 33-40
Quinn, C., 2005, Engaging Learning: Designing E-Learning Simulation Games, San Fransico: Pfeiffer Radhakrishnan, S., & Bailey, J.E. (1997) Web-based Educational Media: Issues and Empirical Testing of Learning in WebNet 97 World Conference of the WWW, Internet and Intranet Proceedings (2nd, Toronto, Canada, November 1-5, 1997) Russell, T.L. (1999) The ‘No Significant Difference’ Phenomenon. Raleigh: North Carolina University Ruzic, R., 2000, New Solutions, New Barriers: Current Uses of the Web in Higher Education. Paper presented at the Annual Meeting of the American Educational Research Association (New Orleans, LA, April 24-28) Ryan, W.J. (2001) Comparison of Student Performance and Attitude in a Lecture Class to Student Performance and Attitude in a Telecourse and a Web-Based Class Ph.D. Dissertation, Nova Southeastern University Ryan W.J. (2002) Online and in the Classroom: The Numbers and What They Might Mean Paper presented at League for Innovation in the Community College Innovations Conference, Boston, MA, March 19, 2002 Salmon, G. (2000), E-moderating: The Key to Teaching and Learning Online, London: Taylor & Francis Salmon, G., (2002), E-tivities: The Key to Active Online Learning, London: Kogan Page

121
Schank, R.C., (2002), Designing World-class E-Learning: How IBM, GE, Harvard Business School and Columbia University are Succeeding at E-Learning, New York: McGrawHill Schoepp, K.W., (2005), Barriers to Technology Integration in a Technology-Rich Environment. Learning and Teaching in Higher Education: Gulf Perspectives, 2 (1), 1 – 24. Retrieved from the World Wide Web: http://www.zu.ac.ae/lthe/vol2no1/lthe02_05.html (last accessed 29/03/2014) Schofield, J.W. (1993) Increasing the Generalizability of Qualitative Research. In Hammersley, M. ed. Social Research: Philosophy, Politics and Practice. London: Sage pp 200-225 Schutte, J. (1997). Virtual learning in higher education: The new intellectual superhighway or just another traffic jam? Retrieved from the World Wide Web: http://english.ttu.edu/kairos/3.2/features/rodrigues/comparison.htm (last accessed 29/03/2014) Schutte, J. (1998). Does using technology in instruction enhance learning? A reply to Ed Neal. The Technology Source, 2009. Seale, J., 2006, E-learning and Disability in Higher Education, Oxford: Routledge Simpson, O., (2012), Supporting Students for Success in Online and Distance Education, 3rd edn. Oxford: Routledge Simpson, O., (2013) Student retention in distance education: are we failing our students? Open Learning: The Journal of Open, Distance and e-Learning 28.2: 105-119. Slem, C.M., & Kane, S.T., 2001, Utility of Course Web Resources for Students with Learning Disabilities. Paper presented at the Annual Conference of the American Psychological Association (109th, San Francisco, CA, August 24-28, 2001) Smith, H.W. (1975) Strategies of Social Research: the Methodological Imagination. Englewood Cliffs, NJ: Prentice Hall Thorne, K., 2003, Blended Learning: How to Integrate Online and Traditional Learning, London: Kogan Page Trinidad, S., Macnish, J., Aldridge, J., Fraser, B., and Wood, D., (2001) Integrating ICT into the learning environment in Sevenoaks Senior College: How teachers and students use educational technology in teaching and learning. Paper presented at the annual conference of the Australian Association for Research in Education, Perth, Western Australia, December. Veen, W. (2003). A new force for change: Homo Zappiens. The Learning Citizen, 7, 5-7.

122
Veen, W. (2005) Net Generation Learning, Teaching Homo Zappiens, Available on the world wide web at: http://www.slideshare.net/guest9200b6/net-generation-learning (last accessed 29/03/2014) Wang, T.H., Wang, K.H., Wang, W.L., Huang, S.C. & Chen, S.Y., (2004) Web-based Assessment and Test Analyses (WATA) system; development and evaluation, Journal of Computer Assisted Learning, 20, 59-71 Western Cooperative for Educational Telecommunications (2006) “The no significant difference website” available on the world wide web at: http://nosignificantdifference.org/ (last accessed 29/03/2014)