Embed Size (px)
Citation preview
Online Estimation of the Remaining Energy Capacity in Mobile SystemsConsidering System-Wide Power Consumption and Battery Characteristics ∗
Donghwa Shin and Naehyuck Chang † Woojoo Lee, Yanzhi Wang,Seoul National University Qing Xie, and Massoud Pedram
dhshin, [email protected] University of Southern Californiawoojoole, yanzhiwa, xqing, [email protected]
ABSTRACT
Emerging mobile systems integrate a lot of functionality intoa small form factor with a small energy source in the form ofrechargeable battery. This situation necessitates accurate esti-mation of the remaining energy in the battery such that userapplications can be judicious on how they consume this scarceand precious resource. This paper thus focuses on estimating theremaining battery energy in Android OS-based mobile systems.This paper proposes to instrument the Android kernel in orderto collect and report accurate subsystem activity values based onreal-time profiling of the running applications. The activity in-formation along with offline-constructed, regression-based powermacro models for major subsystems in the smartphone yield thepower dissipation estimate for the whole system. Next, while ac-counting for the rate-capacity effect in batteries, the total powerdissipation data is translated into the battery’s energy depletionrate, and subsequently, used to compute the battery’s remaininglifetime based on its current state of charge information. Finally,this paper describes a novel application design framework, whichconsiders the batterys state-of-charge (SOC), batterys energy de-pletion rate, and service quality of the target application. Thebenefits of the design framework are illustrated by examining anarchetypical case, involving the design space exploration and op-timization of a GPS-based application in an Android OS.
I. INTRODUCTION
Evolution of mobile systems including smartphones andtablet-PCs has given rise to larger and more power hungry em-bedded systems with advanced functionality and high perfor-mance. Unfortunately, the increase in volumetric/gravimetricenergy density of (rechargeable) batteries has been muchslower than the increase in the power demand of these devices,creating a “power crisis” for the smartphone technology devel-opment and product line expansion.
Accurate power modeling and estimation is a key require-ment of any power-aware design methodology and low powerdesign tool. We need system-level power information in order
∗This work is sponsored by a grant from the National ScienceFoundation, the Brain Korea 21 Project, and the National ResearchFoundation of Korea (NRF) grant funded by the Korean Government(MEST) (No. 2011-0016480 and 2011-0030512). The ICT at SeoulNational University provides research facilities for this study.
†Corresponding author
to develop power-aware applications because modern smart-phone applications utilize many system resources including theapplication processor, display, audio, wireless communication,and so on, simultaneously. There have been several efforts toprovide system-level power estimation models for the smart-phone platforms [1] including battery information-based mod-els [2, 3]. These models are based on the component activitieswithin the system.
The state of charge (SOC) of the battery ultimately deter-mines the service life (also called lifetime) of a smartphone.At the same time, the service quality of an application that isrunning on a smartphone is largely dependent on the systemlifetime since the application-provided services becomes use-less if the smartphone has run out of battery energy. So it isimportant for a smartphone owner/user to have accurate infor-mation about the remaining amount of energy in the battery.All this means that the smartphone users are less interested inhow much power is consumed in the smartphone and more in-terested in how much energy is left in the battery that powersup the smartphone.
From the above discussion, it is evident that one must de-velop a battery capacity loss (depletion) rate estimator and notsimply a power dissipation estimator for mobile systems. Theformer captures important effects related to the battery chem-istry, as well as conversion and distribution losses. The con-version from power dissipation to battery capacity loss rate isnot a constant factor, rather it is a highly nonlinear functiondepending on SOC of the battery, the load power dissipationand the rate capacity effect, and the ambient temperature toname a few. Developing such an estimator is the precise fo-cus of our paper. The proposed method instruments the An-droid kernel to produce accurate subsystem’s activity as thekey factor of the proposed regression-based power consump-tion model based on real-time profiling. The power consump-tion data along with information about the battery SOC is usedto estimate the remaining the battery lifetime.
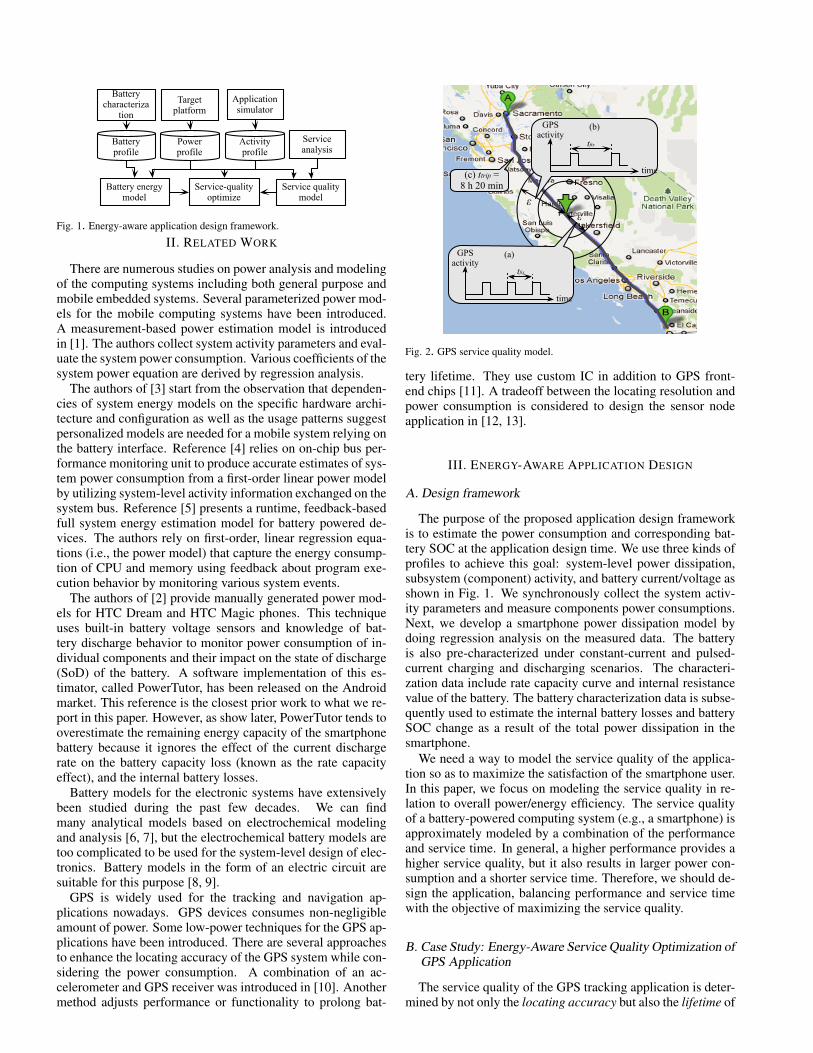
This paper also introduces an energy-aware application de-sign framework for Android OS-based mobile systems withthe system-level power model, battery status model, and ser-vice quality model. We explore the design of a GPS appli-cation as a case study. We maximize the service quality of theGPS application by considering the locating resolution and tripcoverage related to the battery lifetime in the case study.
1
Target platform
Battery energy model
Service-qualityoptimize
Power profile
Activity profile
Service analysis
Battery characteriza
tion
Battery profile
Service quality model
Application simulator
Fig. 1. Energy-aware application design framework.
II. RELATED WORK
There are numerous studies on power analysis and modelingof the computing systems including both general purpose andmobile embedded systems. Several parameterized power mod-els for the mobile computing systems have been introduced.A measurement-based power estimation model is introducedin [1]. The authors collect system activity parameters and eval-uate the system power consumption. Various coefficients of thesystem power equation are derived by regression analysis.
The authors of [3] start from the observation that dependen-cies of system energy models on the specific hardware archi-tecture and configuration as well as the usage patterns suggestpersonalized models are needed for a mobile system relying onthe battery interface. Reference [4] relies on on-chip bus per-formance monitoring unit to produce accurate estimates of sys-tem power consumption from a first-order linear power modelby utilizing system-level activity information exchanged on thesystem bus. Reference [5] presents a runtime, feedback-basedfull system energy estimation model for battery powered de-vices. The authors rely on first-order, linear regression equa-tions (i.e., the power model) that capture the energy consump-tion of CPU and memory using feedback about program exe-cution behavior by monitoring various system events.
The authors of [2] provide manually generated power mod-els for HTC Dream and HTC Magic phones. This techniqueuses built-in battery voltage sensors and knowledge of bat-tery discharge behavior to monitor power consumption of in-dividual components and their impact on the state of discharge(SoD) of the battery. A software implementation of this es-timator, called PowerTutor, has been released on the Androidmarket. This reference is the closest prior work to what we re-port in this paper. However, as show later, PowerTutor tends tooverestimate the remaining energy capacity of the smartphonebattery because it ignores the effect of the current dischargerate on the battery capacity loss (known as the rate capacityeffect), and the internal battery losses.
Battery models for the electronic systems have extensivelybeen studied during the past few decades. We can findmany analytical models based on electrochemical modelingand analysis [6, 7], but the electrochemical battery models aretoo complicated to be used for the system-level design of elec-tronics. Battery models in the form of an electric circuit aresuitable for this purpose [8, 9].
GPS is widely used for the tracking and navigation ap-plications nowadays. GPS devices consumes non-negligibleamount of power. Some low-power techniques for the GPS ap-plications have been introduced. There are several approachesto enhance the locating accuracy of the GPS system while con-sidering the power consumption. A combination of an ac-celerometer and GPS receiver was introduced in [10]. Anothermethod adjusts performance or functionality to prolong bat-
time
GPS activity
tfix
time
GPS activity
tfix
!!
(a)
(b)
(c) ttrip = 8 h 20 min
Fig. 2. GPS service quality model.
tery lifetime. They use custom IC in addition to GPS front-end chips [11]. A tradeoff between the locating resolution andpower consumption is considered to design the sensor nodeapplication in [12, 13].
III. ENERGY-AWARE APPLICATION DESIGN
A. Design framework
The purpose of the proposed application design frameworkis to estimate the power consumption and corresponding bat-tery SOC at the application design time. We use three kinds ofprofiles to achieve this goal: system-level power dissipation,subsystem (component) activity, and battery current/voltage asshown in Fig. 1. We synchronously collect the system activ-ity parameters and measure components power consumptions.Next, we develop a smartphone power dissipation model bydoing regression analysis on the measured data. The batteryis also pre-characterized under constant-current and pulsed-current charging and discharging scenarios. The characteri-zation data include rate capacity curve and internal resistancevalue of the battery. The battery characterization data is subse-quently used to estimate the internal battery losses and batterySOC change as a result of the total power dissipation in thesmartphone.
We need a way to model the service quality of the applica-tion so as to maximize the satisfaction of the smartphone user.In this paper, we focus on modeling the service quality in re-lation to overall power/energy efficiency. The service qualityof a battery-powered computing system (e.g., a smartphone) isapproximately modeled by a combination of the performanceand service time. In general, a higher performance provides ahigher service quality, but it also results in larger power con-sumption and a shorter service time. Therefore, we should de-sign the application, balancing performance and service timewith the objective of maximizing the service quality.
B. Case Study: Energy-Aware Service Quality Optimization ofGPS Application
The service quality of the GPS tracking application is deter-mined by not only the locating accuracy but also the lifetime of
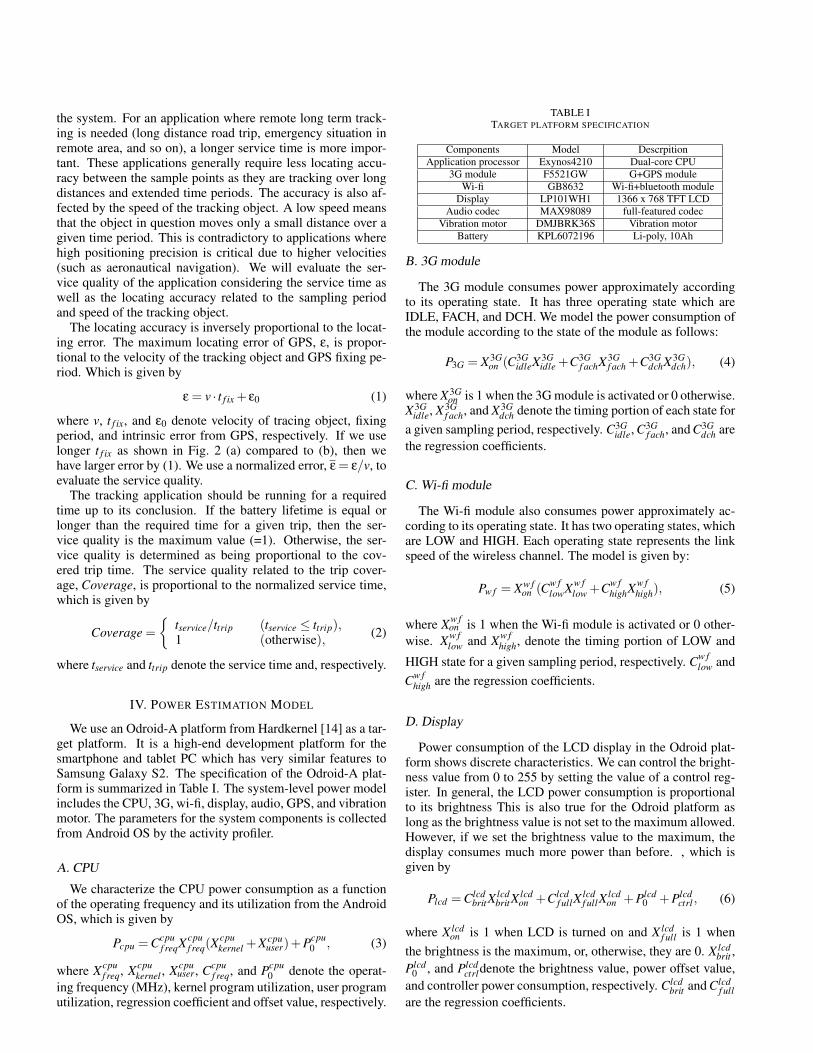
the system. For an application where remote long term track-ing is needed (long distance road trip, emergency situation inremote area, and so on), a longer service time is more impor-tant. These applications generally require less locating accu-racy between the sample points as they are tracking over longdistances and extended time periods. The accuracy is also af-fected by the speed of the tracking object. A low speed meansthat the object in question moves only a small distance over agiven time period. This is contradictory to applications wherehigh positioning precision is critical due to higher velocities(such as aeronautical navigation). We will evaluate the ser-vice quality of the application considering the service time aswell as the locating accuracy related to the sampling periodand speed of the tracking object.
The locating accuracy is inversely proportional to the locat-ing error. The maximum locating error of GPS, ε, is propor-tional to the velocity of the tracking object and GPS fixing pe-riod. Which is given by
ε = v · t f ix + ε0 (1)
where v, t f ix, and ε0 denote velocity of tracing object, fixingperiod, and intrinsic error from GPS, respectively. If we uselonger t f ix as shown in Fig. 2 (a) compared to (b), then wehave larger error by (1). We use a normalized error, ε = ε/v, toevaluate the service quality.
The tracking application should be running for a requiredtime up to its conclusion. If the battery lifetime is equal orlonger than the required time for a given trip, then the ser-vice quality is the maximum value (=1). Otherwise, the ser-vice quality is determined as being proportional to the cov-ered trip time. The service quality related to the trip cover-age, Coverage, is proportional to the normalized service time,which is given by
Coverage =
tservice/ttrip (tservice ≤ ttrip),1 (otherwise), (2)
where tservice and ttrip denote the service time and, respectively.
IV. POWER ESTIMATION MODEL
We use an Odroid-A platform from Hardkernel [14] as a tar-get platform. It is a high-end development platform for thesmartphone and tablet PC which has very similar features toSamsung Galaxy S2. The specification of the Odroid-A plat-form is summarized in Table I. The system-level power modelincludes the CPU, 3G, wi-fi, display, audio, GPS, and vibrationmotor. The parameters for the system components is collectedfrom Android OS by the activity profiler.
A. CPU
We characterize the CPU power consumption as a functionof the operating frequency and its utilization from the AndroidOS, which is given by
Pcpu =Ccpuf reqXcpu
f req(Xcpukernel +Xcpu
user)+Pcpu0 , (3)
where Xcpuf req, Xcpu
kernel , Xcpuuser, Ccpu
f req, and Pcpu0 denote the operat-
ing frequency (MHz), kernel program utilization, user programutilization, regression coefficient and offset value, respectively.
TABLE ITARGET PLATFORM SPECIFICATION
Components Model DescrpitionApplication processor Exynos4210 Dual-core CPU
3G module F5521GW G+GPS moduleWi-fi GB8632 Wi-fi+bluetooth module
Display LP101WH1 1366 x 768 TFT LCDAudio codec MAX98089 full-featured codec
Vibration motor DMJBRK36S Vibration motorBattery KPL6072196 Li-poly, 10Ah
B. 3G module
The 3G module consumes power approximately accordingto its operating state. It has three operating state which areIDLE, FACH, and DCH. We model the power consumption ofthe module according to the state of the module as follows:
P3G = X3Gon (C3G
idleX3Gidle +C3G
f achX3Gf ach +C3G
dchX3Gdch), (4)
where X3Gon is 1 when the 3G module is activated or 0 otherwise.
X3Gidle, X3G
f ach, and X3Gdch denote the timing portion of each state for
a given sampling period, respectively. C3Gidle, C3G
f ach, and C3Gdch are
the regression coefficients.
C. Wi-fi module
The Wi-fi module also consumes power approximately ac-cording to its operating state. It has two operating states, whichare LOW and HIGH. Each operating state represents the linkspeed of the wireless channel. The model is given by:
Pw f = Xw fon (Cw f
lowXw flow +Cw f
highXw fhigh), (5)
where Xw fon is 1 when the Wi-fi module is activated or 0 other-
wise. Xw flow and Xw f
high, denote the timing portion of LOW and
HIGH state for a given sampling period, respectively. Cw flow and
Cw fhigh are the regression coefficients.
D. Display
Power consumption of the LCD display in the Odroid plat-form shows discrete characteristics. We can control the bright-ness value from 0 to 255 by setting the value of a control reg-ister. In general, the LCD power consumption is proportionalto its brightness This is also true for the Odroid platform aslong as the brightness value is not set to the maximum allowed.However, if we set the brightness value to the maximum, thedisplay consumes much more power than before. , which isgiven by
Plcd =ClcdbritX
lcdbritX
lcdon +Clcd
f ullXlcdf ullX
lcdon +Plcd
0 +Plcdctrl , (6)
where X lcdon is 1 when LCD is turned on and X lcd
f ull is 1 whenthe brightness is the maximum, or, otherwise, they are 0. X lcd
brit ,Plcd
0 , and Plcdctrldenote the brightness value, power offset value,
and controller power consumption, respectively. Clcdbrit and Clcd
f ullare the regression coefficients.
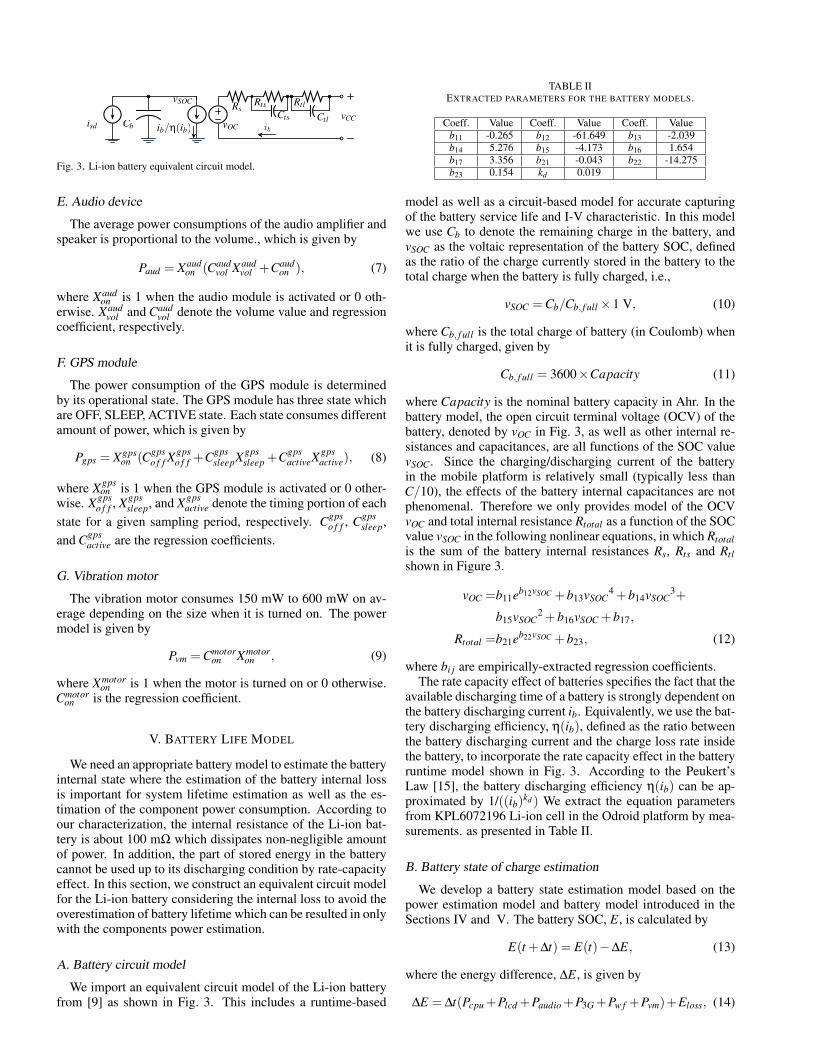
isd Cb ib/η(ib)
vSOC RsRts Rtl
CtlCts vCCvOC ib
Fig. 3. Li-ion battery equivalent circuit model.
E. Audio device
The average power consumptions of the audio amplifier andspeaker is proportional to the volume., which is given by
Paud = Xaudon (Caud
vol Xaudvol +Caud
on ), (7)
where Xaudon is 1 when the audio module is activated or 0 oth-
erwise. Xaudvol and Caud
vol denote the volume value and regressioncoefficient, respectively.
F. GPS module
The power consumption of the GPS module is determinedby its operational state. The GPS module has three state whichare OFF, SLEEP, ACTIVE state. Each state consumes differentamount of power, which is given by
Pgps = Xgpson (Cgps
o f f Xgpso f f +Cgps
sleepXgpssleep +Cgps
activeXgpsactive), (8)
where Xgpson is 1 when the GPS module is activated or 0 other-
wise. Xgpso f f , Xgps
sleep, and Xgpsactive denote the timing portion of each
state for a given sampling period, respectively. Cgpso f f , Cgps
sleep,and Cgps
active are the regression coefficients.
G. Vibration motor
The vibration motor consumes 150 mW to 600 mW on av-erage depending on the size when it is turned on. The powermodel is given by
Pvm =Cmotoron Xmotor
on , (9)
where Xmotoron is 1 when the motor is turned on or 0 otherwise.
Cmotoron is the regression coefficient.
V. BATTERY LIFE MODEL
We need an appropriate battery model to estimate the batteryinternal state where the estimation of the battery internal lossis important for system lifetime estimation as well as the es-timation of the component power consumption. According toour characterization, the internal resistance of the Li-ion bat-tery is about 100 mΩ which dissipates non-negligible amountof power. In addition, the part of stored energy in the batterycannot be used up to its discharging condition by rate-capacityeffect. In this section, we construct an equivalent circuit modelfor the Li-ion battery considering the internal loss to avoid theoverestimation of battery lifetime which can be resulted in onlywith the components power estimation.
A. Battery circuit model
We import an equivalent circuit model of the Li-ion batteryfrom [9] as shown in Fig. 3. This includes a runtime-based
TABLE IIEXTRACTED PARAMETERS FOR THE BATTERY MODELS.
Coeff. Value Coeff. Value Coeff. Valueb11 -0.265 b12 -61.649 b13 -2.039b14 5.276 b15 -4.173 b16 1.654b17 3.356 b21 -0.043 b22 -14.275b23 0.154 kd 0.019
model as well as a circuit-based model for accurate capturingof the battery service life and I-V characteristic. In this modelwe use Cb to denote the remaining charge in the battery, andvSOC as the voltaic representation of the battery SOC, definedas the ratio of the charge currently stored in the battery to thetotal charge when the battery is fully charged, i.e.,
vSOC =Cb/Cb, f ull×1 V, (10)
where Cb, f ull is the total charge of battery (in Coulomb) whenit is fully charged, given by
Cb, f ull = 3600×Capacity (11)
where Capacity is the nominal battery capacity in Ahr. In thebattery model, the open circuit terminal voltage (OCV) of thebattery, denoted by vOC in Fig. 3, as well as other internal re-sistances and capacitances, are all functions of the SOC valuevSOC. Since the charging/discharging current of the batteryin the mobile platform is relatively small (typically less thanC/10), the effects of the battery internal capacitances are notphenomenal. Therefore we only provides model of the OCVvOC and total internal resistance Rtotal as a function of the SOCvalue vSOC in the following nonlinear equations, in which Rtotalis the sum of the battery internal resistances Rs, Rts and Rtlshown in Figure 3.
vOC =b11eb12vSOC +b13vSOC4 +b14vSOC
3+
b15vSOC2 +b16vSOC +b17,
Rtotal =b21eb22vSOC +b23, (12)
where bi j are empirically-extracted regression coefficients.The rate capacity effect of batteries specifies the fact that the
available discharging time of a battery is strongly dependent onthe battery discharging current ib. Equivalently, we use the bat-tery discharging efficiency, η(ib), defined as the ratio betweenthe battery discharging current and the charge loss rate insidethe battery, to incorporate the rate capacity effect in the batteryruntime model shown in Fig. 3. According to the Peukert’sLaw [15], the battery discharging efficiency η(ib) can be ap-proximated by 1/((ib)kd ) We extract the equation parametersfrom KPL6072196 Li-ion cell in the Odroid platform by mea-surements. as presented in Table II.
B. Battery state of charge estimation
We develop a battery state estimation model based on thepower estimation model and battery model introduced in theSections IV and V. The battery SOC, E, is calculated by
E(t +∆t) = E(t)−∆E, (13)
where the energy difference, ∆E, is given by
∆E = ∆t(Pcpu+Plcd +Paudio+P3G+Pw f +Pvm)+Eloss, (14)
Agilent E3610Power supply
NI DAQpad-6016 DAQ
LabView console
Odroid-A platform
Current measurementmodule
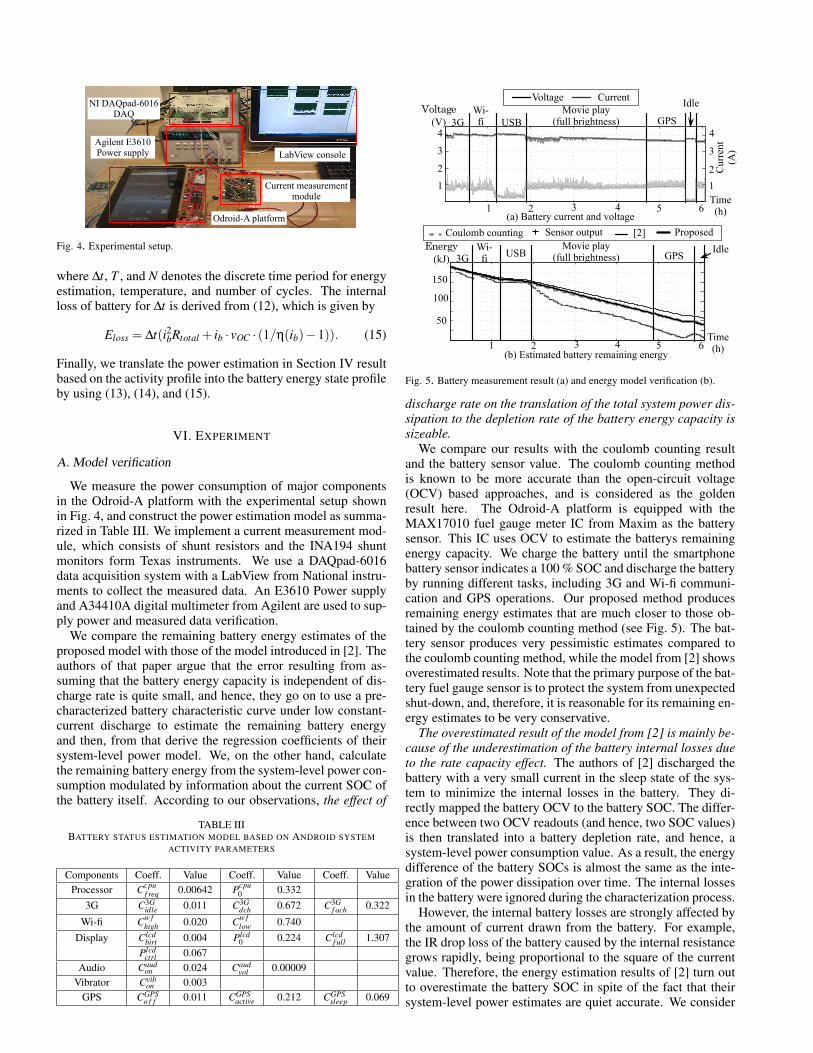
Fig. 4. Experimental setup.
where ∆t, T , and N denotes the discrete time period for energyestimation, temperature, and number of cycles. The internalloss of battery for ∆t is derived from (12), which is given by
Eloss = ∆t(i2bRtotal + ib · vOC · (1/η(ib)−1)). (15)
Finally, we translate the power estimation in Section IV resultbased on the activity profile into the battery energy state profileby using (13), (14), and (15).
VI. EXPERIMENT
A. Model verification
We measure the power consumption of major componentsin the Odroid-A platform with the experimental setup shownin Fig. 4, and construct the power estimation model as summa-rized in Table III. We implement a current measurement mod-ule, which consists of shunt resistors and the INA194 shuntmonitors form Texas instruments. We use a DAQpad-6016data acquisition system with a LabView from National instru-ments to collect the measured data. An E3610 Power supplyand A34410A digital multimeter from Agilent are used to sup-ply power and measured data verification.
We compare the remaining battery energy estimates of theproposed model with those of the model introduced in [2]. Theauthors of that paper argue that the error resulting from as-suming that the battery energy capacity is independent of dis-charge rate is quite small, and hence, they go on to use a pre-characterized battery characteristic curve under low constant-current discharge to estimate the remaining battery energyand then, from that derive the regression coefficients of theirsystem-level power model. We, on the other hand, calculatethe remaining battery energy from the system-level power con-sumption modulated by information about the current SOC ofthe battery itself. According to our observations, the effect of
TABLE IIIBATTERY STATUS ESTIMATION MODEL BASED ON ANDROID SYSTEM
ACTIVITY PARAMETERS
Components Coeff. Value Coeff. Value Coeff. ValueProcessor Ccpu
f req 0.00642 Pcpu0 0.332
3G C3Gidle 0.011 C3G
dch 0.672 C3Gf ach 0.322
Wi-fi Cw fhigh 0.020 Cw f
low 0.740Display Clcd
birt 0.004 Plcd0 0.224 Clcd
f ull 1.307Plcd
ctrl 0.067Audio Caud
on 0.024 Caudvol 0.00009
Vibrator Cvibon 0.003
GPS CGPSo f f 0.011 CGPS
active 0.212 CGPSsleep 0.069
Voltage Current
Coulomb counting
0 0.5 1 1.5 2 2.5 3 3.5 4 4.50
50
100
150
Time (h)
Energ
y (kJ
)
Sensor output Proposed[2]
Idle
Cur
rent
(A
)
GPSMovie play
(full brightness)3GWi-fi USB
Idle
1
2
3
4
(V)
1
2
3
4
Time (h)1 2 3 4
GPSMovie play
(full brightness)3GWi-fi USB
(kJ)
50
100
150
(a) Battery current and voltage
(b) Estimated battery remaining energy
0 1 2 3 4 5 6
1
2
3
4
Time (h)
Voltage
(V)
0 1 2 3 4 5 60
20
40
60
80
100
120
140
160
Time (h)
Energy
(kJ)
5 6
Time (h)1 2 3 4 5 6
Fig. 5. Battery measurement result (a) and energy model verification (b).
discharge rate on the translation of the total system power dis-sipation to the depletion rate of the battery energy capacity issizeable.
We compare our results with the coulomb counting resultand the battery sensor value. The coulomb counting methodis known to be more accurate than the open-circuit voltage(OCV) based approaches, and is considered as the goldenresult here. The Odroid-A platform is equipped with theMAX17010 fuel gauge meter IC from Maxim as the batterysensor. This IC uses OCV to estimate the batterys remainingenergy capacity. We charge the battery until the smartphonebattery sensor indicates a 100 % SOC and discharge the batteryby running different tasks, including 3G and Wi-fi communi-cation and GPS operations. Our proposed method producesremaining energy estimates that are much closer to those ob-tained by the coulomb counting method (see Fig. 5). The bat-tery sensor produces very pessimistic estimates compared tothe coulomb counting method, while the model from [2] showsoverestimated results. Note that the primary purpose of the bat-tery fuel gauge sensor is to protect the system from unexpectedshut-down, and, therefore, it is reasonable for its remaining en-ergy estimates to be very conservative.
The overestimated result of the model from [2] is mainly be-cause of the underestimation of the battery internal losses dueto the rate capacity effect. The authors of [2] discharged thebattery with a very small current in the sleep state of the sys-tem to minimize the internal losses in the battery. They di-rectly mapped the battery OCV to the battery SOC. The differ-ence between two OCV readouts (and hence, two SOC values)is then translated into a battery depletion rate, and hence, asystem-level power consumption value. As a result, the energydifference of the battery SOCs is almost the same as the inte-gration of the power dissipation over time. The internal lossesin the battery were ignored during the characterization process.
However, the internal battery losses are strongly affected bythe amount of current drawn from the battery. For example,the IR drop loss of the battery caused by the internal resistancegrows rapidly, being proportional to the square of the currentvalue. Therefore, the energy estimation results of [2] turn outto overestimate the battery SOC in spite of the fact that theirsystem-level power estimates are quiet accurate. We consider
50 100 150 200 250
50
100
150
200
250
Time (s)
Power (W
)
50 100 150 200 250
1
2
3
Time (s)
GPS stat
e
50 100 150 200 250
Power (mW)
100
200
Time (s)
50 100 150 200 250
50
100
150
200
250
Time (s)
Power (W
)
50 100 150 200 250
1
2
3
Time (s)
GPS stat
e
50 100 150 200 250
GPS state
Sleep
Off
Active
Time (s)
Initialization tfix tfixtactive tgooff
(a) Power consumption of GPS module according to the operating state
(b) State transition behavior of GPS module
Fig. 6. GPS power and state model.
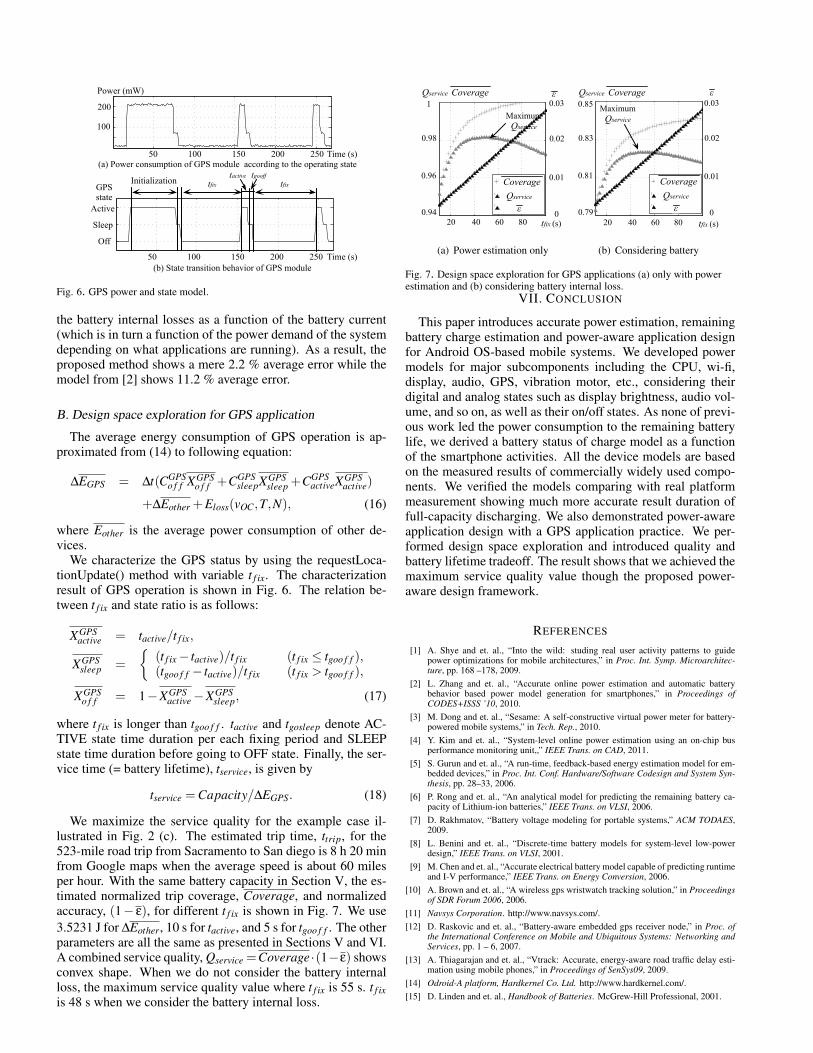
the battery internal losses as a function of the battery current(which is in turn a function of the power demand of the systemdepending on what applications are running). As a result, theproposed method shows a mere 2.2 % average error while themodel from [2] shows 11.2 % average error.
B. Design space exploration for GPS application
The average energy consumption of GPS operation is ap-proximated from (14) to following equation:
∆EGPS = ∆t(CGPSo f f XGPS
o f f +CGPSsleepXGPS
sleep +CGPSactiveXGPS
active)
+∆Eother +Eloss(vOC,T,N), (16)
where Eother is the average power consumption of other de-vices.
We characterize the GPS status by using the requestLoca-tionUpdate() method with variable t f ix. The characterizationresult of GPS operation is shown in Fig. 6. The relation be-tween t f ix and state ratio is as follows:
XGPSactive = tactive/t f ix,
XGPSsleep =
(t f ix− tactive)/t f ix (t f ix ≤ tgoo f f ),(tgoo f f − tactive)/t f ix (t f ix > tgoo f f ),
XGPSo f f = 1−XGPS
active−XGPSsleep, (17)
where t f ix is longer than tgoo f f . tactive and tgosleep denote AC-TIVE state time duration per each fixing period and SLEEPstate time duration before going to OFF state. Finally, the ser-vice time (= battery lifetime), tservice, is given by
tservice =Capacity/∆EGPS. (18)
We maximize the service quality for the example case il-lustrated in Fig. 2 (c). The estimated trip time, ttrip, for the523-mile road trip from Sacramento to San diego is 8 h 20 minfrom Google maps when the average speed is about 60 milesper hour. With the same battery capacity in Section V, the es-timated normalized trip coverage, Coverage, and normalizedaccuracy, (1− ε), for different t f ix is shown in Fig. 7. We use3.5231 J for ∆Eother, 10 s for tactive, and 5 s for tgoo f f . The otherparameters are all the same as presented in Sections V and VI.A combined service quality, Qservice =Coverage ·(1−ε) showsconvex shape. When we do not consider the battery internalloss, the maximum service quality value where t f ix is 55 s. t f ixis 48 s when we consider the battery internal loss.
20 40 60 80 1000.94
0.96
0.98
1
Tfix (h)
Serv
ice
qual
ity
20 40 60 80 1000
0.02
Nor
mal
ized
err
or
tfix (s)
Maximum Qservice
!Qservice Coverage
20 40 60 80 100
0.96
0.97
0.98
0.99
Tfix (h)
Serv
ice
qual
ity
20 40 60 80 100
0.96
0.97
0.98
0.99
Tfix (h)
Serv
ice
qual
ity
Qservice
Coverage
! 0
0.03
0.01
0.02
20 40 60 800.94
1
0.96
0.98
(a) Power estimation only
20 40 60 80 1000.79
0.81
0.83
0.85
Tfix (h)
Serv
ice
qual
ity
20 40 60 80 1000
0.02
Nor
mal
ized
err
or
Maximum Qservice
!Qservice Coverage
20 40 60 80 100
0.96
0.97
0.98
0.99
Tfix (h)
Serv
ice
qual
ity
20 40 60 80 100
0.96
0.97
0.98
0.99
Tfix (h)
Serv
ice
qual
ity
Qservice
Coverage
! 0
0.03
0.01
0.02
20 40 60 800.79
0.85
0.81
0.83
tfix (s)
(b) Considering battery
Fig. 7. Design space exploration for GPS applications (a) only with powerestimation and (b) considering battery internal loss.
VII. CONCLUSION
This paper introduces accurate power estimation, remainingbattery charge estimation and power-aware application designfor Android OS-based mobile systems. We developed powermodels for major subcomponents including the CPU, wi-fi,display, audio, GPS, vibration motor, etc., considering theirdigital and analog states such as display brightness, audio vol-ume, and so on, as well as their on/off states. As none of previ-ous work led the power consumption to the remaining batterylife, we derived a battery status of charge model as a functionof the smartphone activities. All the device models are basedon the measured results of commercially widely used compo-nents. We verified the models comparing with real platformmeasurement showing much more accurate result duration offull-capacity discharging. We also demonstrated power-awareapplication design with a GPS application practice. We per-formed design space exploration and introduced quality andbattery lifetime tradeoff. The result shows that we achieved themaximum service quality value though the proposed power-aware design framework.
REFERENCES
[1] A. Shye and et. al., “Into the wild: studing real user activity patterns to guidepower optimizations for mobile architectures,” in Proc. Int. Symp. Microarchitec-ture, pp. 168 –178, 2009.
[2] L. Zhang and et. al., “Accurate online power estimation and automatic batterybehavior based power model generation for smartphones,” in Proceedings ofCODES+ISSS ’10, 2010.
[3] M. Dong and et. al., “Sesame: A self-constructive virtual power meter for battery-powered mobile systems,” in Tech. Rep., 2010.
[4] Y. Kim and et. al., “System-level online power estimation using an on-chip busperformance monitoring unit,,” IEEE Trans. on CAD, 2011.
[5] S. Gurun and et. al., “A run-time, feedback-based energy estimation model for em-bedded devices,” in Proc. Int. Conf. Hardware/Software Codesign and System Syn-thesis, pp. 28–33, 2006.
[6] P. Rong and et. al., “An analytical model for predicting the remaining battery ca-pacity of Lithium-ion batteries,” IEEE Trans. on VLSI, 2006.
[7] D. Rakhmatov, “Battery voltage modeling for portable systems,” ACM TODAES,2009.
[8] L. Benini and et. al., “Discrete-time battery models for system-level low-powerdesign,” IEEE Trans. on VLSI, 2001.
[9] M. Chen and et. al., “Accurate electrical battery model capable of predicting runtimeand I-V performance,” IEEE Trans. on Energy Conversion, 2006.
[10] A. Brown and et. al., “A wireless gps wristwatch tracking solution,” in Proceedingsof SDR Forum 2006, 2006.
[11] Navsys Corporation. http://www.navsys.com/.[12] D. Raskovic and et. al., “Battery-aware embedded gps receiver node,” in Proc. of
the International Conference on Mobile and Ubiquitous Systems: Networking andServices, pp. 1 – 6, 2007.
[13] A. Thiagarajan and et. al., “Vtrack: Accurate, energy-aware road traffic delay esti-mation using mobile phones,” in Proceedings of SenSys09, 2009.
[14] Odroid-A platform, Hardkernel Co. Ltd. http://www.hardkernel.com/.[15] D. Linden and et. al., Handbook of Batteries. McGrew-Hill Professional, 2001.


![No201[Assessment of Existing Steel Structures Recommendations for Estimation of Remaining Fatigue Life]](https://img.pdfslide.us/doc/110x75/557209e5497959fc0b8bf89d/no201assessment-of-existing-steel-structures-recommendations-for-estimation-of-remaining-fatigue-life.jpg)