Embed Size (px)
Citation preview

© Vaisala
Online DGA-monitoring of power transformers
Senja Leivo
Senior Industry Expert, Vaisala Finland
Member of CIGRE A2/D1.47 and D1.52 WGs
April 2018
© Vaisala
Webinar content
1. Dissolved gases – why and which gases
2. Fault types
3. Online monitoring – why
4. Things to consider when choosing a monitor
5. IR technology in online DGA – Vaisala Optimus™ DGA monitor
6. How to define limit values and interpret the data
7. How to utilize the online data – examples
8. Comparing online data to laboratory results
2018-04-03 2Senja Leivo
© Vaisala
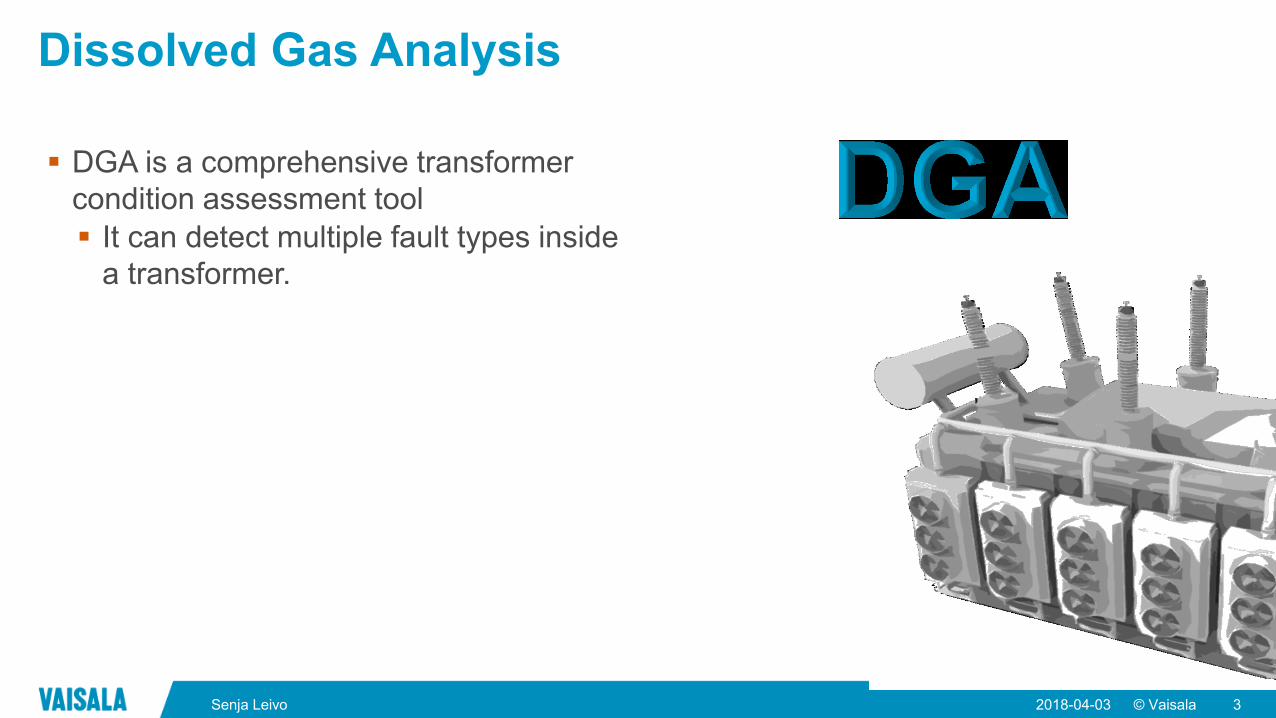
Dissolved Gas Analysis
DGA is a comprehensive transformer
condition assessment tool
It can detect multiple fault types inside
a transformer.
2018-04-03 3Senja Leivo
© Vaisala
Heat
Paper
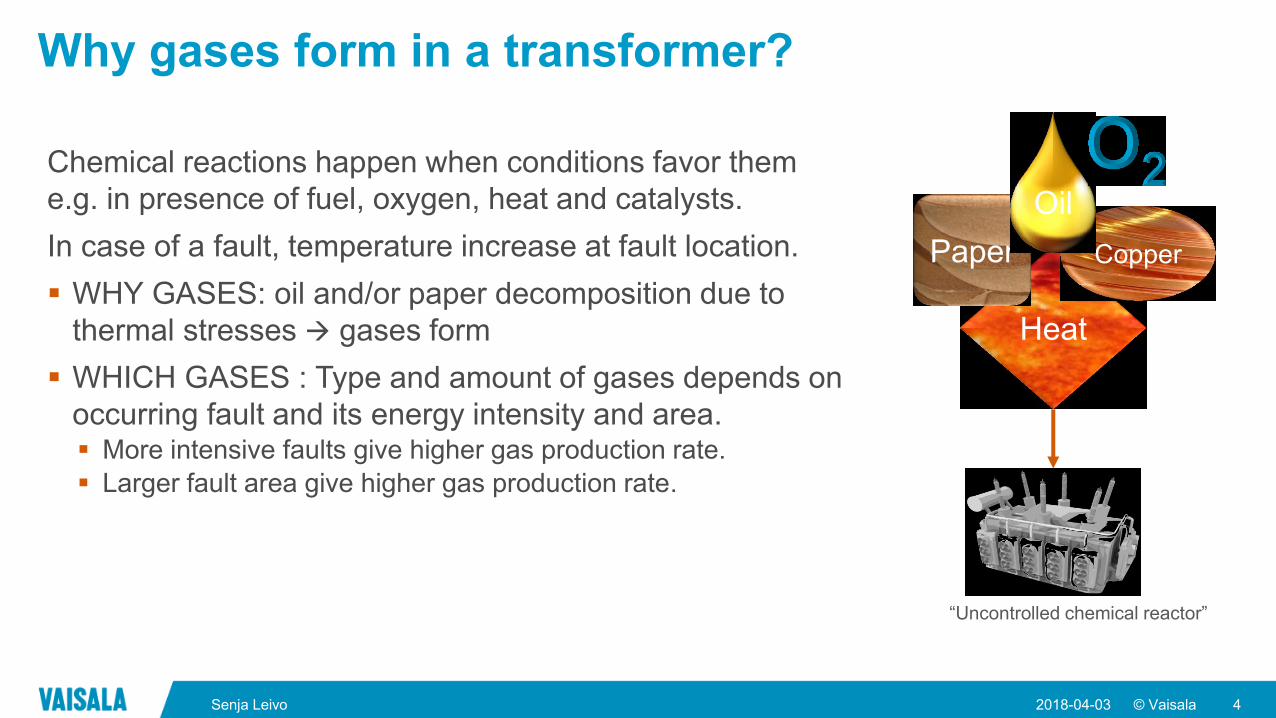
Why gases form in a transformer?
Chemical reactions happen when conditions favor them
e.g. in presence of fuel, oxygen, heat and catalysts.
In case of a fault, temperature increase at fault location.
WHY GASES: oil and/or paper decomposition due to
thermal stresses gases form
WHICH GASES : Type and amount of gases depends on
occurring fault and its energy intensity and area. More intensive faults give higher gas production rate.
Larger fault area give higher gas production rate.
2018-04-03 4Senja Leivo
Copper
Oil
“Uncontrolled chemical reactor”
© Vaisala
Which gases?
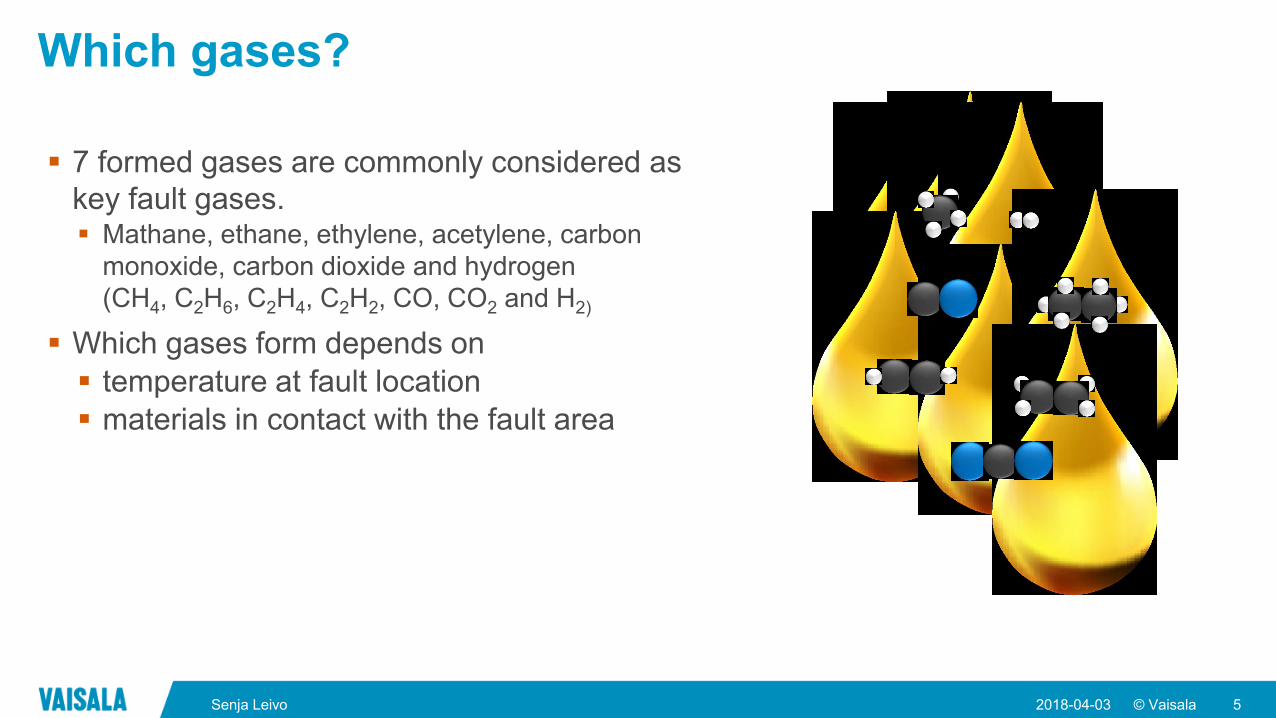
7 formed gases are commonly considered as
key fault gases. Mathane, ethane, ethylene, acetylene, carbon
monoxide, carbon dioxide and hydrogen
(CH4, C2H6, C2H4, C2H2, CO, CO2 and H2)
Which gases form depends on
temperature at fault location
materials in contact with the fault area
2018-04-03 5Senja Leivo
© Vaisala
Fault types
PD partial discharge
T1 thermal fault <300°C
T2 thermal fault 300-700°C
T3 thermal fault >700°C
D1 Low energy discharge (sparking)
D2 High energy discharge (arching)
S Stray gassing of oil < 200 °C
O Overheating < 250 °C
C Carbonization of paper > 300 °C
Most severe thermal faults when also paper is involved!
2018-04-03 6Senja Leivo

© Vaisala
Why online monitoring
© Vaisala
Why online DGA monitoring?
1. Online monitoring detects faults at their early phase
Enables corrective actions before severe transformer failure.
Cost reduction in maintenance and repair
Avoid consequential costs of catastrophic failures.
2. Enables safe use of a transformer at its end-of-life phase
3. In new transformers, reveals faults originated from
manufacturing, transportation or installation
4. Majority internal faults can be detected with online DGA
DGA is only online method that can detect various fault types.
5. Following rate of change of gases with online monitoring is more
reliable than with laboratory samples. (ref. CIGRE TB409, D1.01 TF 15)
6. Detects faults which might otherwise go unnoticed between
regular oil sampling intervals.
2018-04-03 8Senja Leivo
© Vaisala
Why online DGA monitoring?
“On-line monitors are particularly useful for applications
where gas formation in electrical equipment must be
followed at frequent time intervals (e.g., in strategic or expensive
equipment, or where significant faults have already been detected).
/ Cigre TB409 WG D1.01 (TF 15)
2018-04-03 9Senja Leivo
© Vaisala
Why multi-gas online monitoring
“Worldwide experiences using on-line DGA increasingly
show that all types of faults − thermal, low-energy
discharge, high-energy discharge, and partial discharge
− can be identified at an early stage.
Identifying type and severity of a developing fault makes
timely decisions possible for critical installations.”/IEEE Std C57.143™-2012
2018-04-03 10Senja Leivo
© Vaisala
Why multi-gas online monitoring
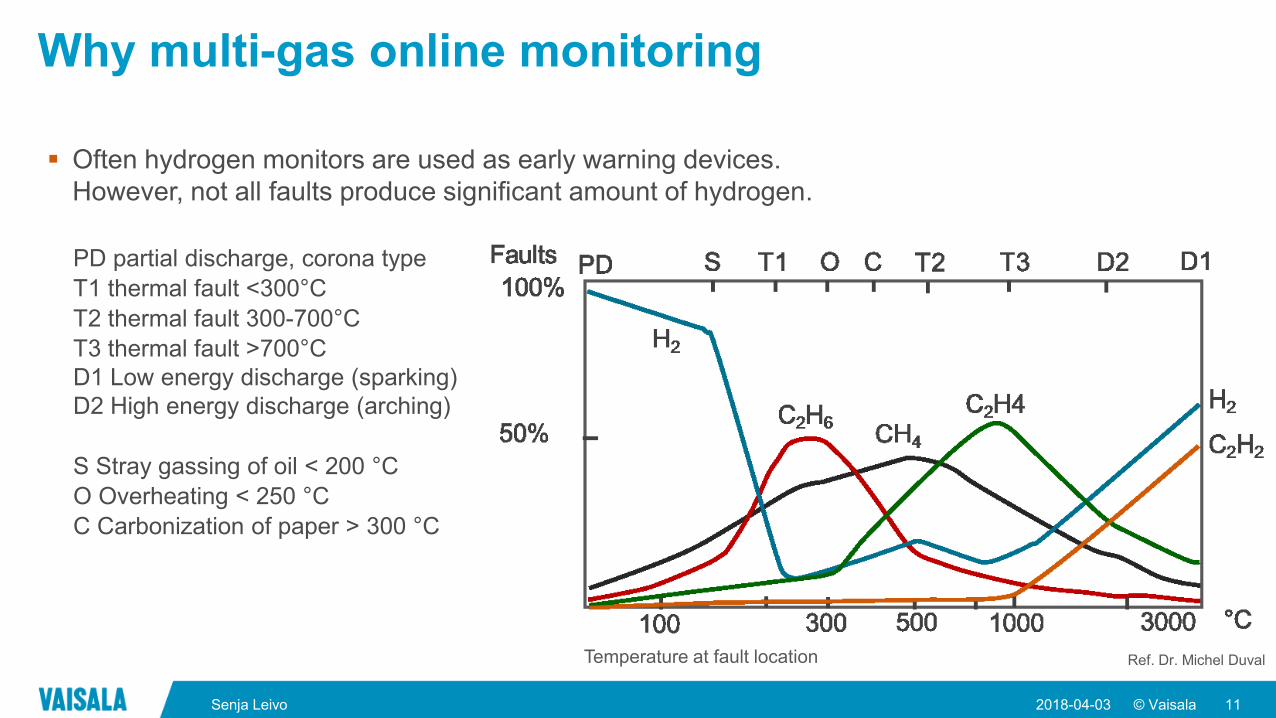
Often hydrogen monitors are used as early warning devices.
However, not all faults produce significant amount of hydrogen.
2018-04-03 11Senja Leivo
Ref. Dr. Michel Duval
PD partial discharge, corona type
T1 thermal fault <300°C
T2 thermal fault 300-700°C
T3 thermal fault >700°C
D1 Low energy discharge (sparking)
D2 High energy discharge (arching)
S Stray gassing of oil < 200 °C
O Overheating < 250 °C
C Carbonization of paper > 300 °C
Temperature at fault location
© Vaisala
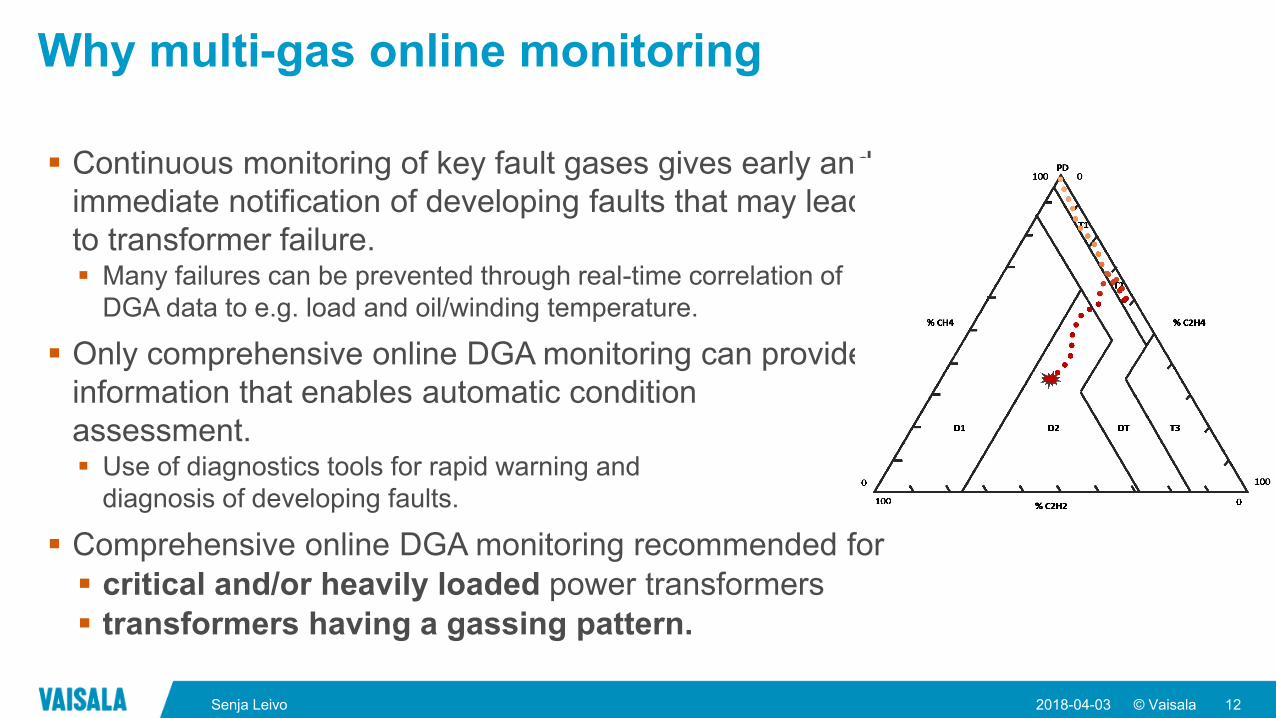
Why multi-gas online monitoring
Continuous monitoring of key fault gases gives early and
immediate notification of developing faults that may lead
to transformer failure. Many failures can be prevented through real-time correlation of
DGA data to e.g. load and oil/winding temperature.
Only comprehensive online DGA monitoring can provide
information that enables automatic condition
assessment. Use of diagnostics tools for rapid warning and
diagnosis of developing faults.
Comprehensive online DGA monitoring recommended for
critical and/or heavily loaded power transformers
transformers having a gassing pattern.
2018-04-03 12Senja Leivo

© Vaisala
Things to consider when choosing a monitor
© Vaisala2018-04-03 14Senja Leivo
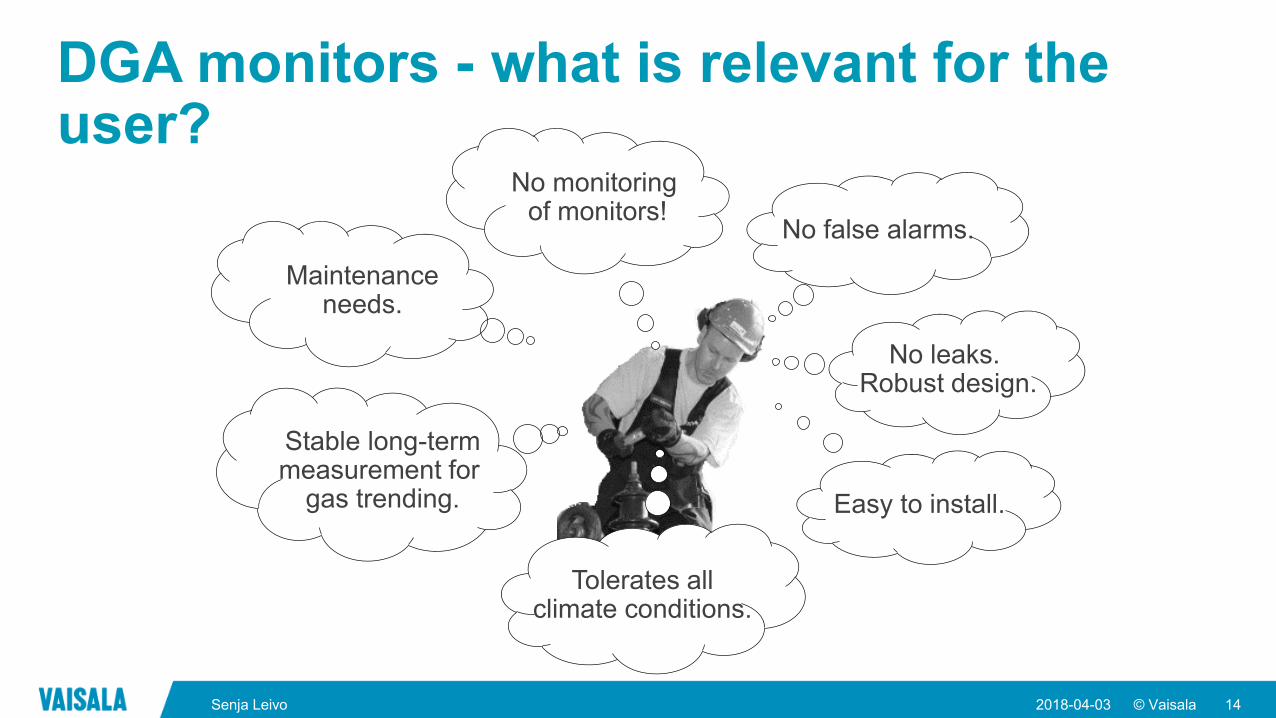
DGA monitors - what is relevant for the user?
No false alarms.
Maintenanceneeds.
Easy to install.
No leaks. Robust design.
Stable long-termmeasurement for
gas trending.
Tolerates allclimate conditions.
No monitoring of monitors!
© Vaisala
Lifetime costs
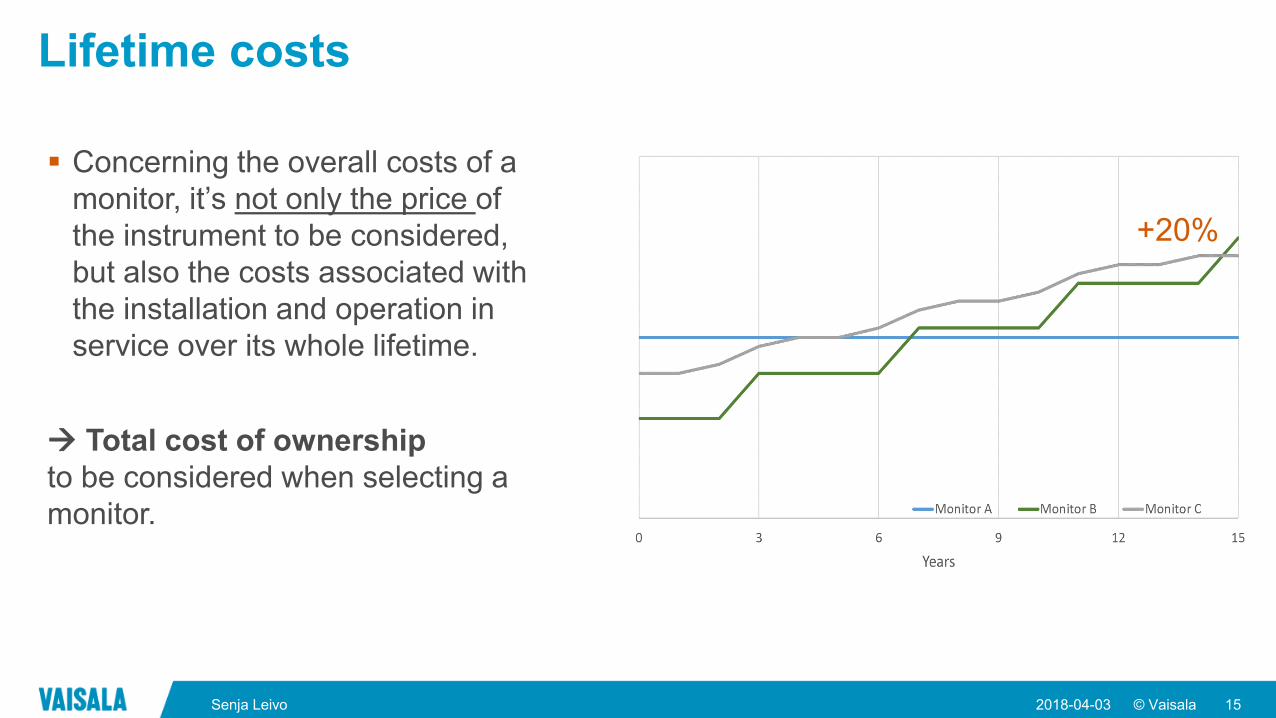
Concerning the overall costs of a
monitor, it’s not only the price of
the instrument to be considered,
but also the costs associated with
the installation and operation in
service over its whole lifetime.
Total cost of ownership
to be considered when selecting a
monitor.
2018-04-03 15Senja Leivo
+20%
© Vaisala
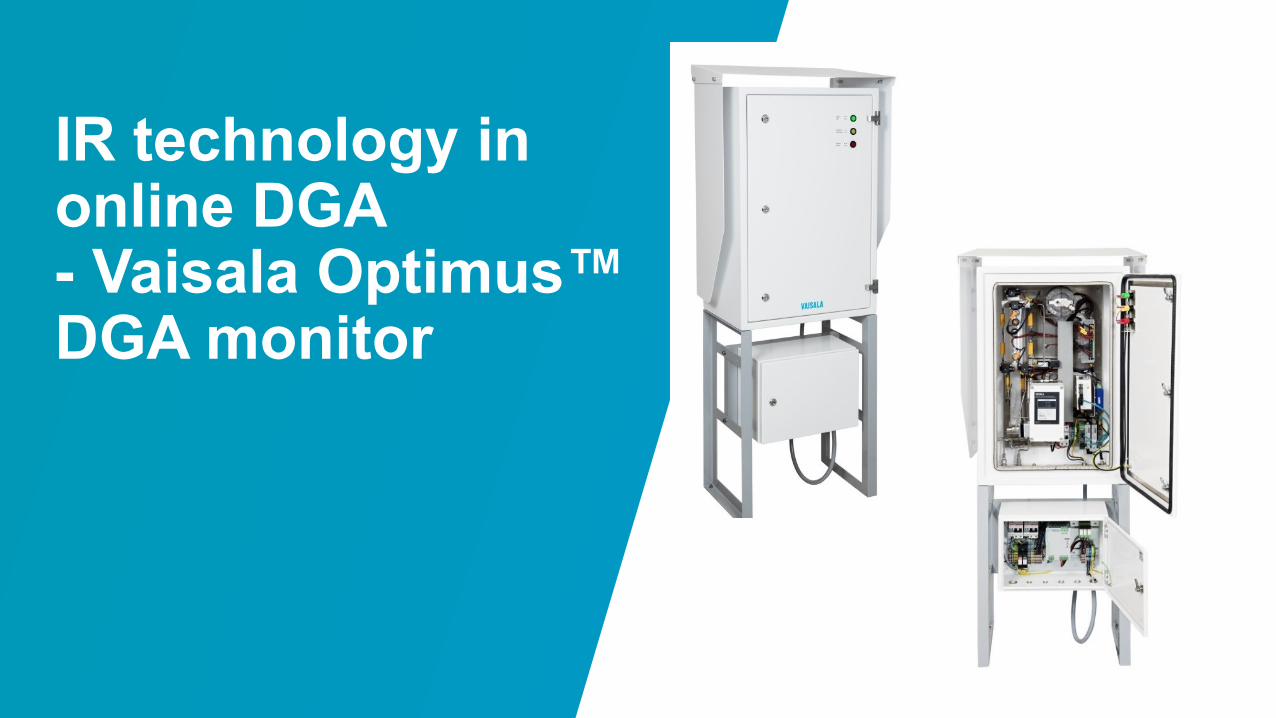
IR technology in online DGA - Vaisala Optimus™ DGA monitor
© Vaisala
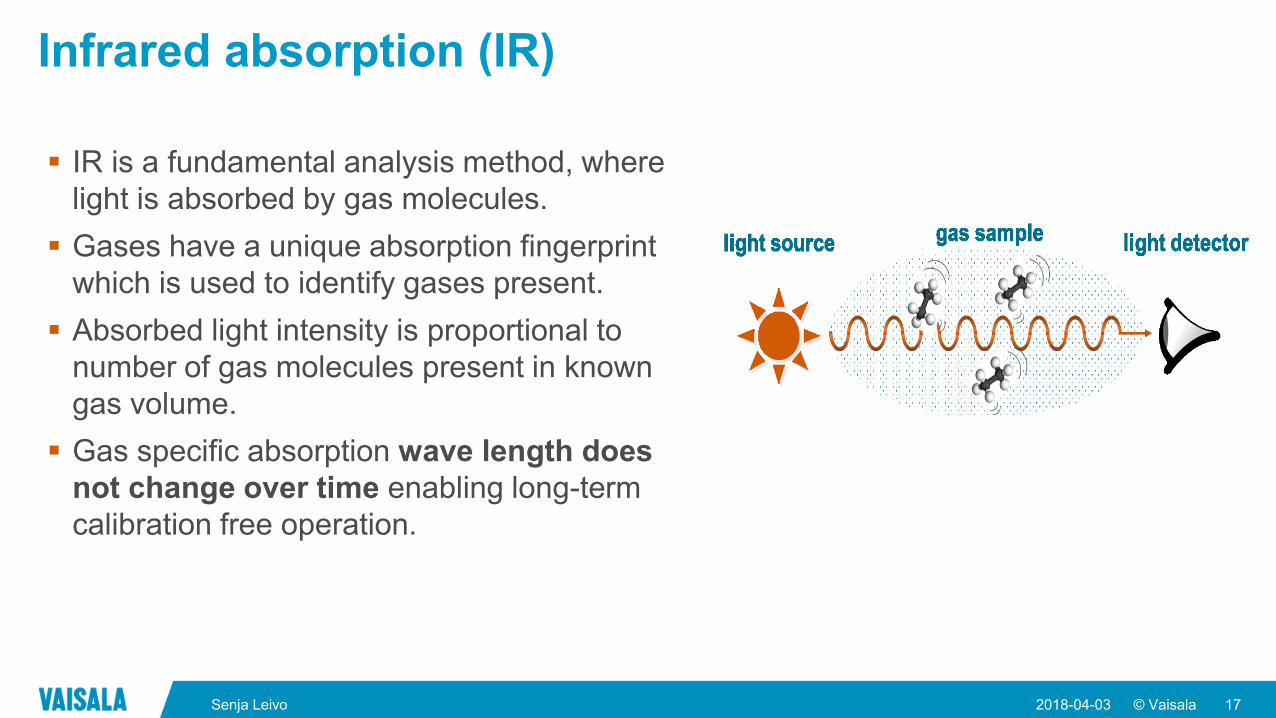
Infrared absorption (IR)
IR is a fundamental analysis method, where
light is absorbed by gas molecules.
Gases have a unique absorption fingerprint
which is used to identify gases present.
Absorbed light intensity is proportional to
number of gas molecules present in known
gas volume.
Gas specific absorption wave length does
not change over time enabling long-term
calibration free operation.
2018-04-03 17Senja Leivo
© Vaisala
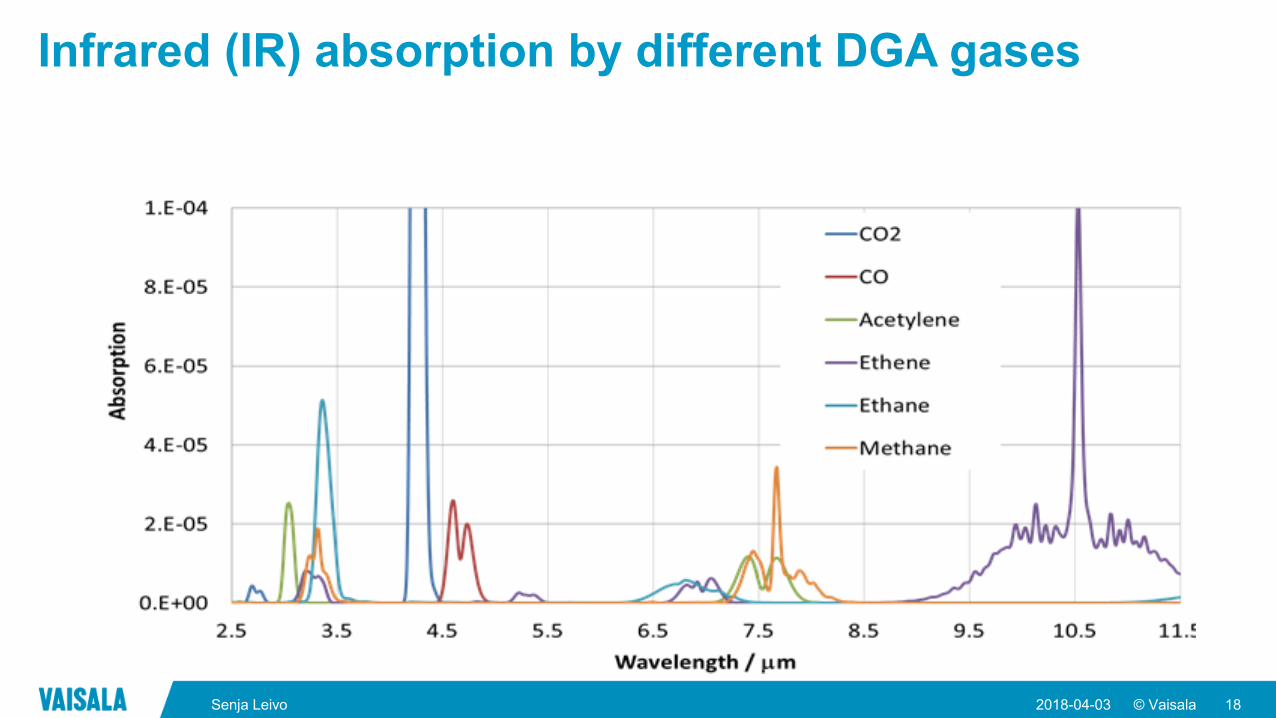
Infrared (IR) absorption by different DGA gases
2018-04-03 18Senja Leivo
© Vaisala
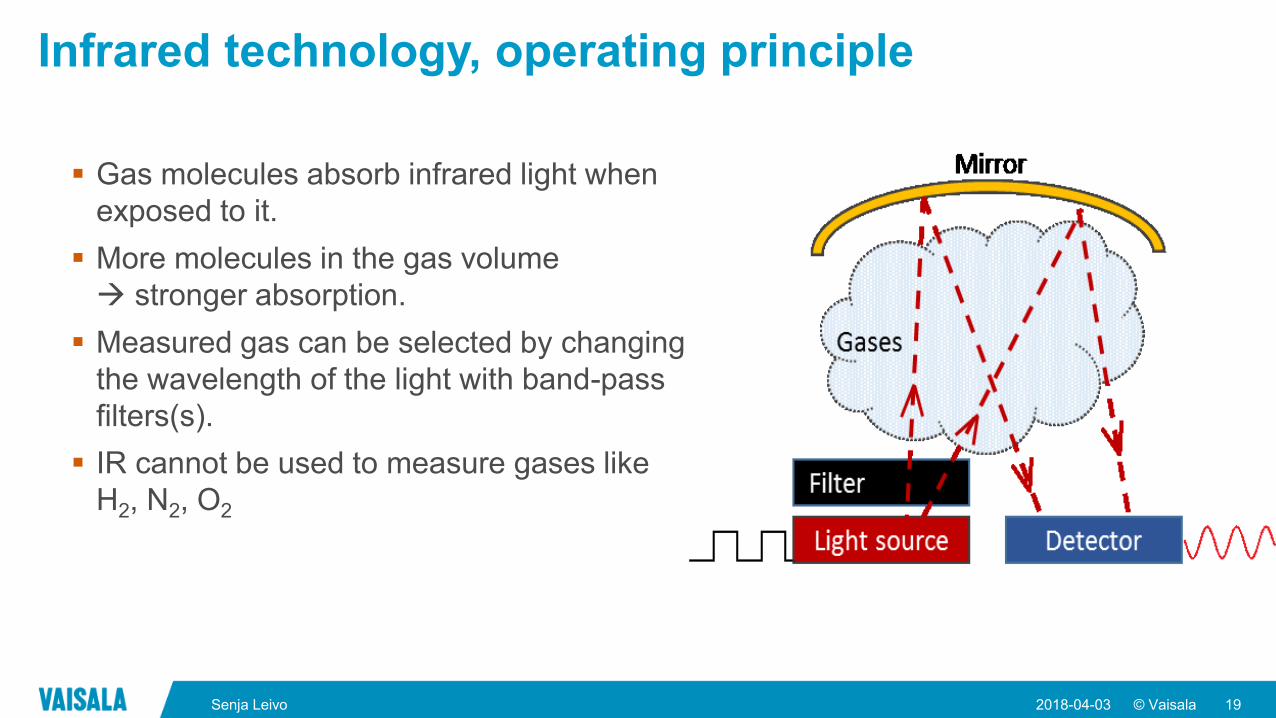
Infrared technology, operating principle
Gas molecules absorb infrared light when
exposed to it.
More molecules in the gas volume
stronger absorption.
Measured gas can be selected by changing
the wavelength of the light with band-pass
filters(s).
IR cannot be used to measure gases like
H2, N2, O2
2018-04-03 19Senja Leivo
© Vaisala
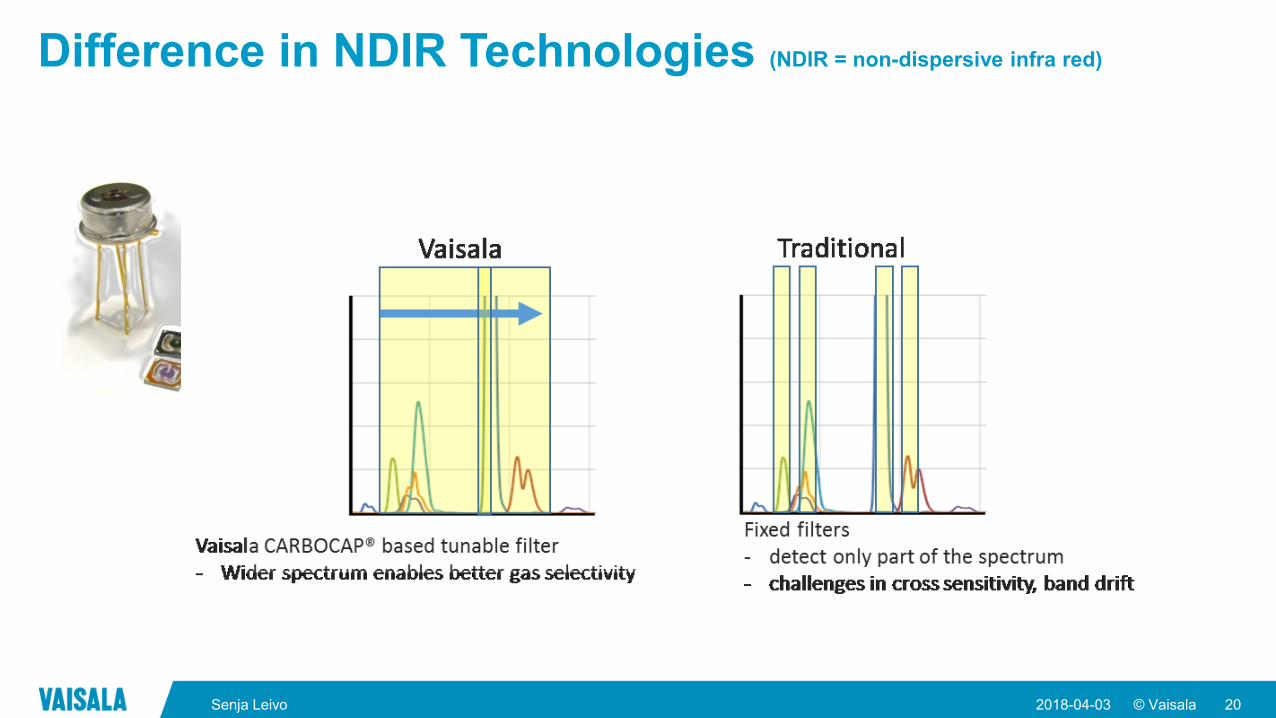
Difference in NDIR Technologies (NDIR = non-dispersive infra red)
2018-04-03 20Senja Leivo
© Vaisala
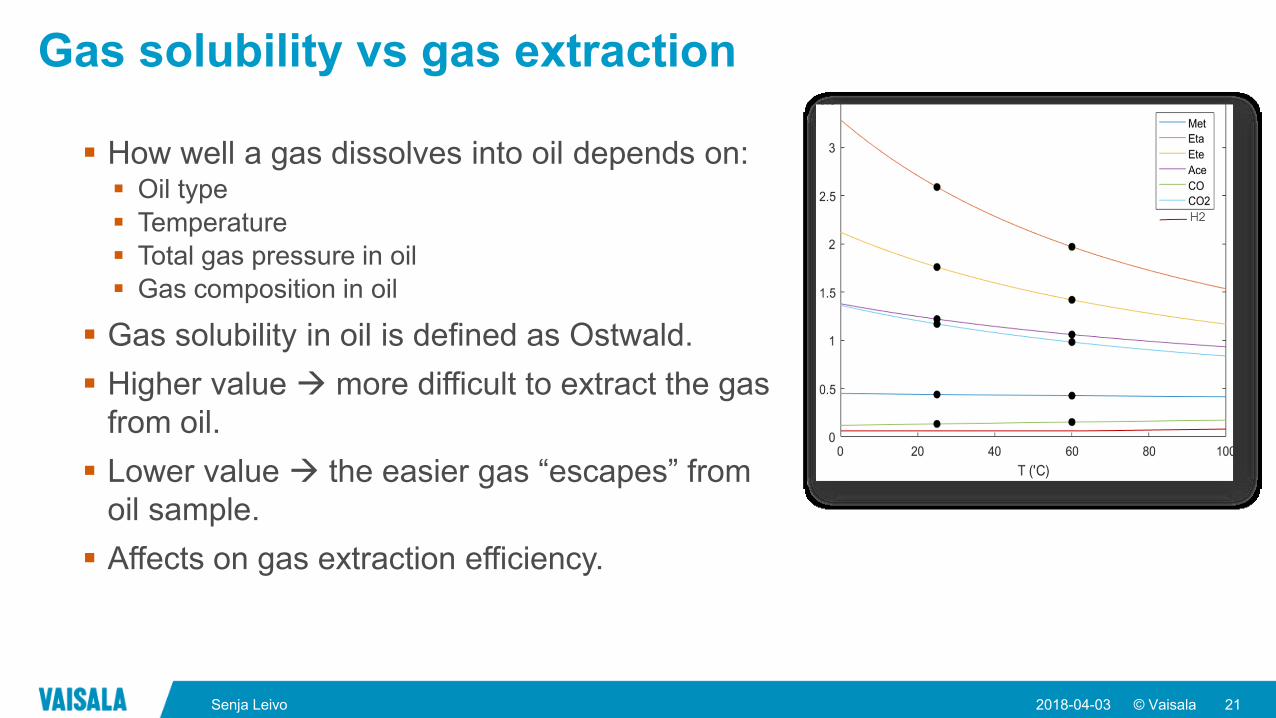
Gas solubility vs gas extraction
How well a gas dissolves into oil depends on: Oil type
Temperature
Total gas pressure in oil
Gas composition in oil
Gas solubility in oil is defined as Ostwald.
Higher value more difficult to extract the gas
from oil.
Lower value the easier gas “escapes” from
oil sample.
Affects on gas extraction efficiency.
2018-04-03 21Senja Leivo
© Vaisala
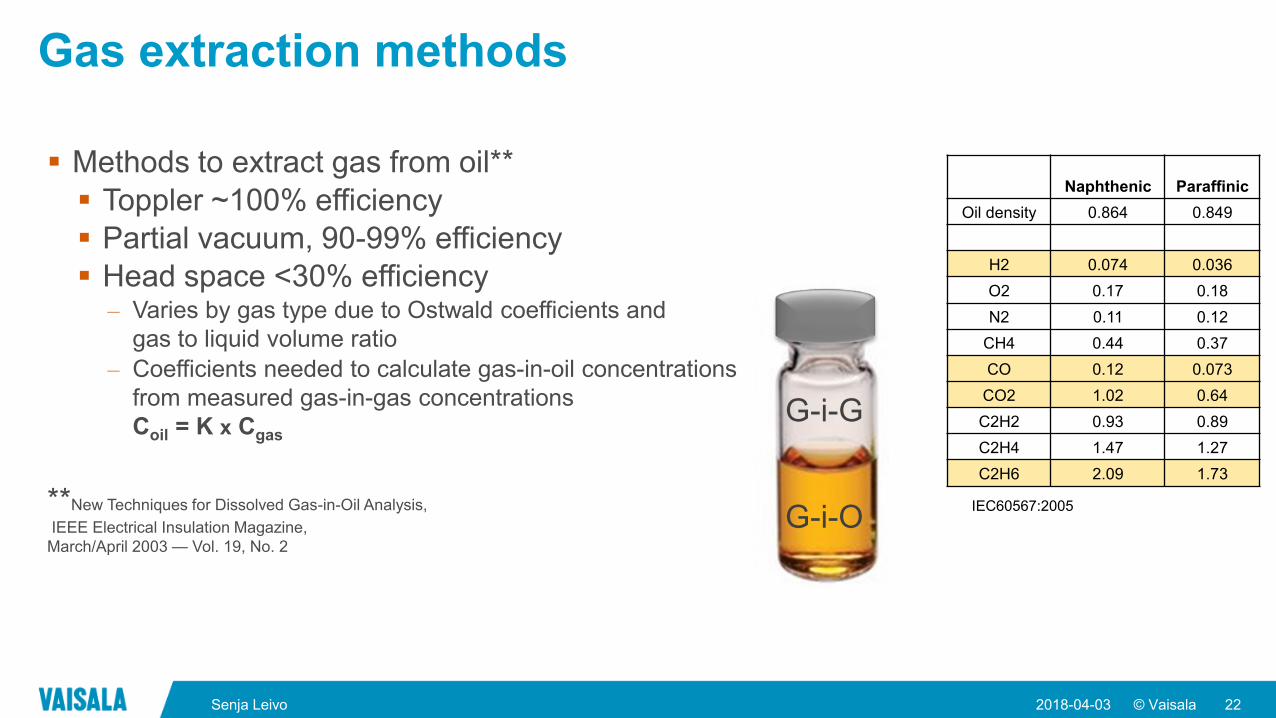
Gas extraction methods
Methods to extract gas from oil**
Toppler ~100% efficiency
Partial vacuum, 90-99% efficiency
Head space <30% efficiency– Varies by gas type due to Ostwald coefficients and
gas to liquid volume ratio
– Coefficients needed to calculate gas-in-oil concentrations
from measured gas-in-gas concentrations
Coil = K x Cgas
**New Techniques for Dissolved Gas-in-Oil Analysis,
IEEE Electrical Insulation Magazine,
March/April 2003 — Vol. 19, No. 2
2018-04-03 22Senja Leivo
Naphthenic Paraffinic
Oil density 0.864 0.849
H2 0.074 0.036
O2 0.17 0.18
N2 0.11 0.12
CH4 0.44 0.37
CO 0.12 0.073
CO2 1.02 0.64
C2H2 0.93 0.89
C2H4 1.47 1.27
C2H6 2.09 1.73
IEC60567:2005G-i-O
G-i-G
© Vaisala
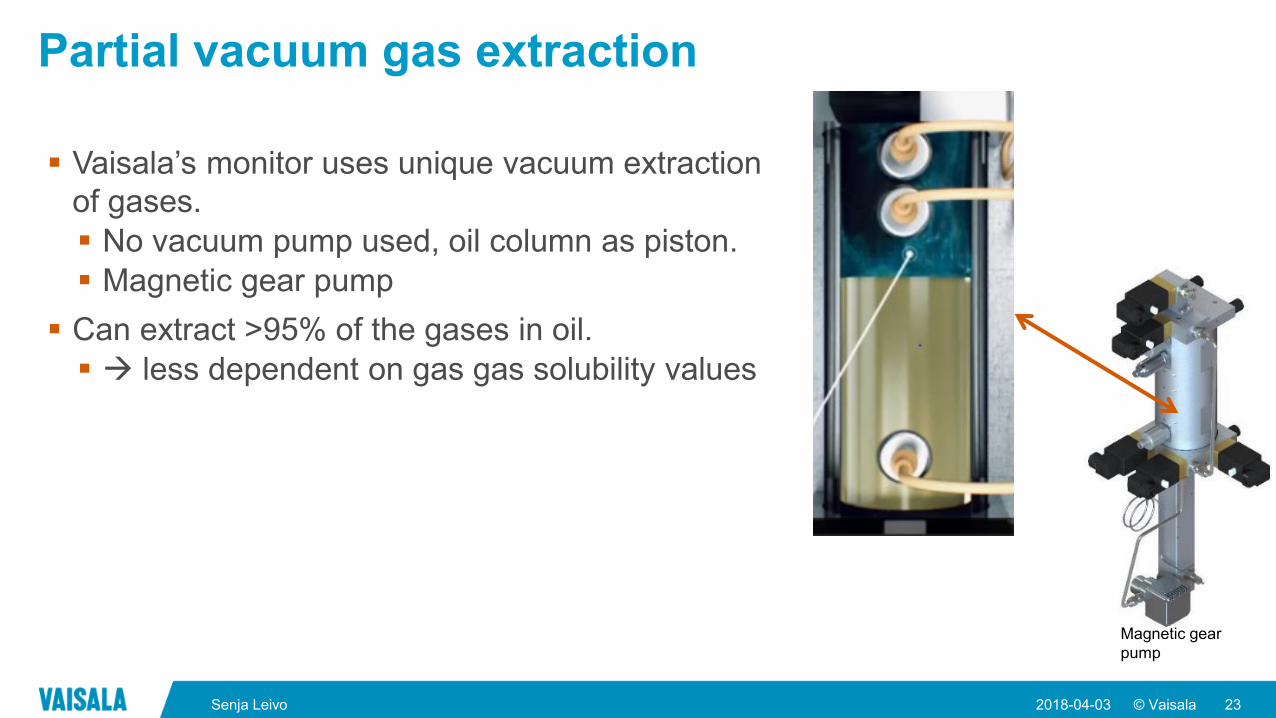
Partial vacuum gas extraction
Vaisala’s monitor uses unique vacuum extraction
of gases.
No vacuum pump used, oil column as piston.
Magnetic gear pump
Can extract >95% of the gases in oil.
less dependent on gas gas solubility values
2018-04-03 23Senja Leivo
Magnetic gear
pump
© Vaisala
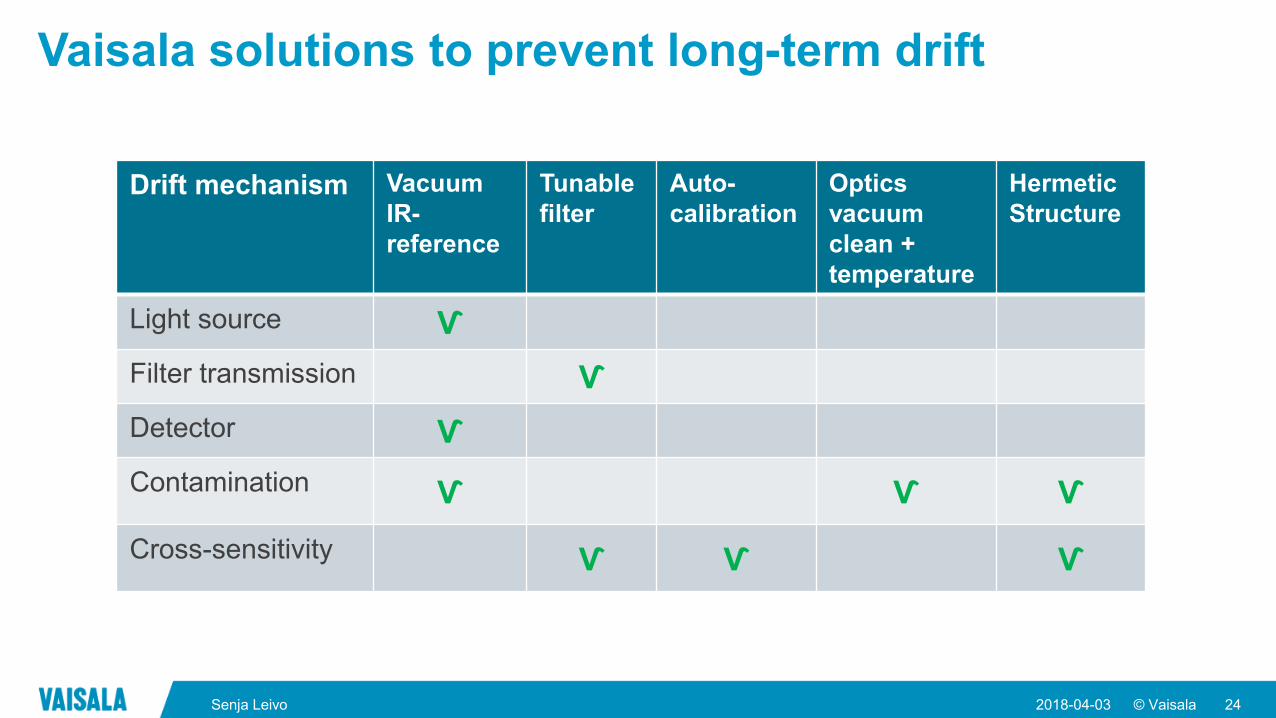
Vaisala solutions to prevent long-term drift
2018-04-03 24Senja Leivo
Drift mechanism Vacuum
IR-
reference
Tunable
filter
Auto-
calibration
Optics
vacuum
clean +
temperature
Hermetic
Structure
Light source Ѵ
Filter transmission Ѵ
Detector Ѵ
Contamination Ѵ Ѵ Ѵ
Cross-sensitivity Ѵ Ѵ Ѵ

© Vaisala
How to define limit values and interpret the data
© Vaisala
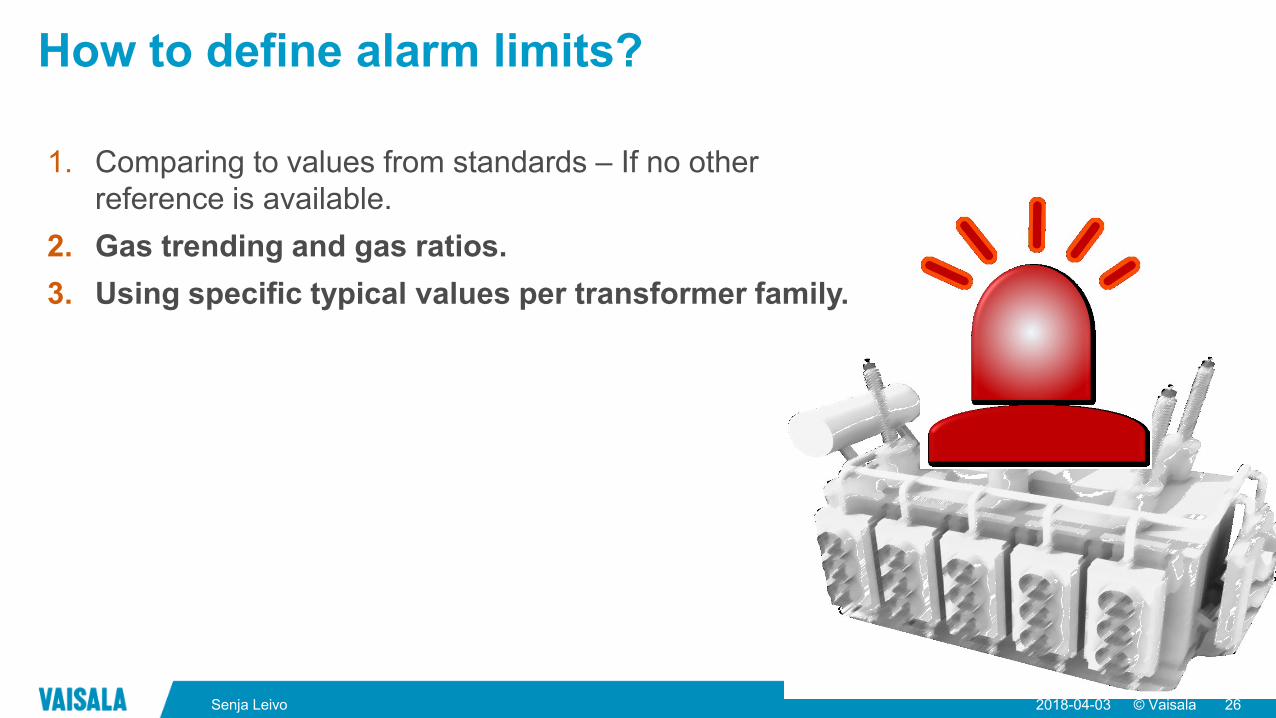
How to define alarm limits?
1. Comparing to values from standards – If no other
reference is available.
2. Gas trending and gas ratios.
3. Using specific typical values per transformer family.
2018-04-03 26Senja Leivo
© Vaisala
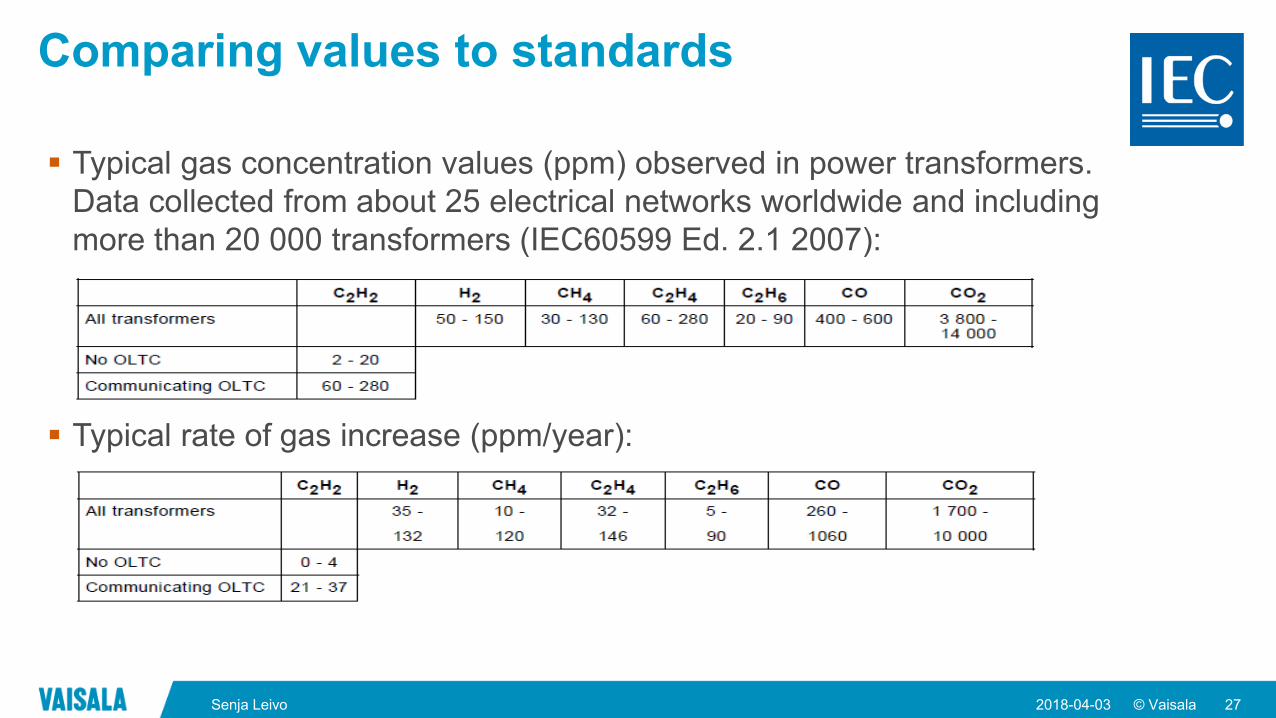
Comparing values to standards
Typical gas concentration values (ppm) observed in power transformers.
Data collected from about 25 electrical networks worldwide and including
more than 20 000 transformers (IEC60599 Ed. 2.1 2007):
Typical rate of gas increase (ppm/year):
2018-04-03 27Senja Leivo
© Vaisala
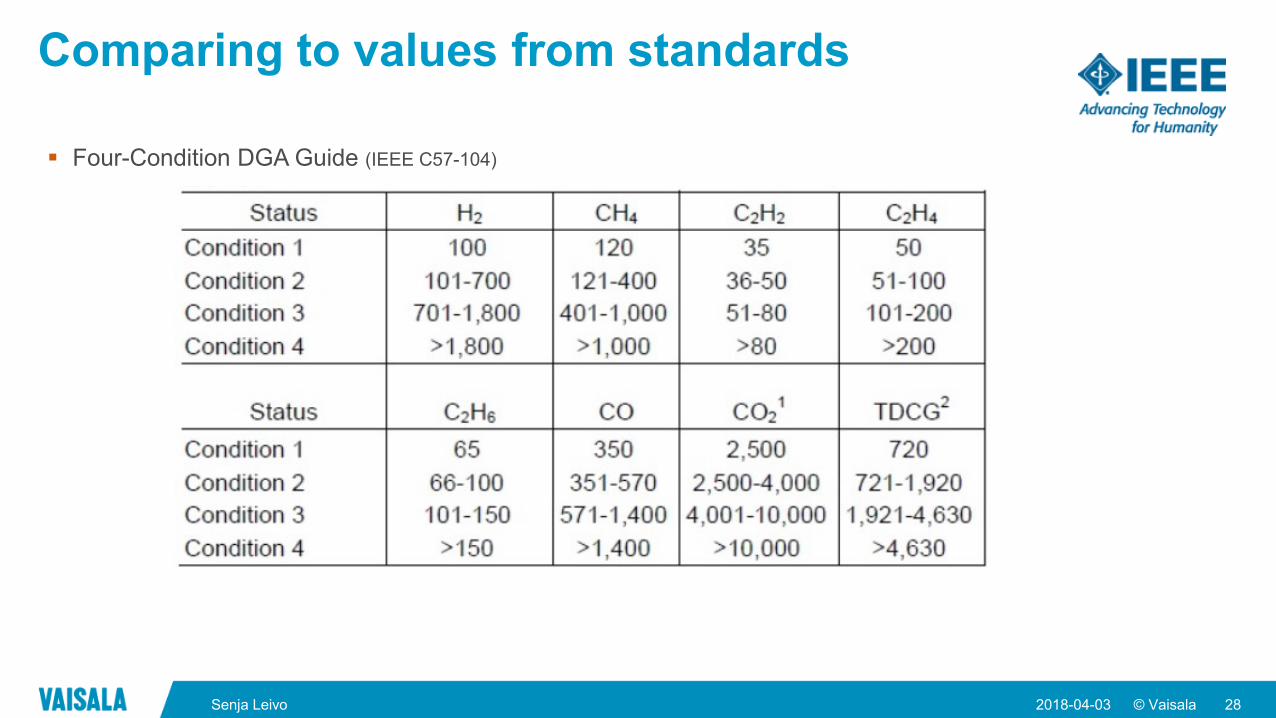
Comparing to values from standards
2018-04-03 28Senja Leivo
Four-Condition DGA Guide (IEEE C57-104)
© Vaisala
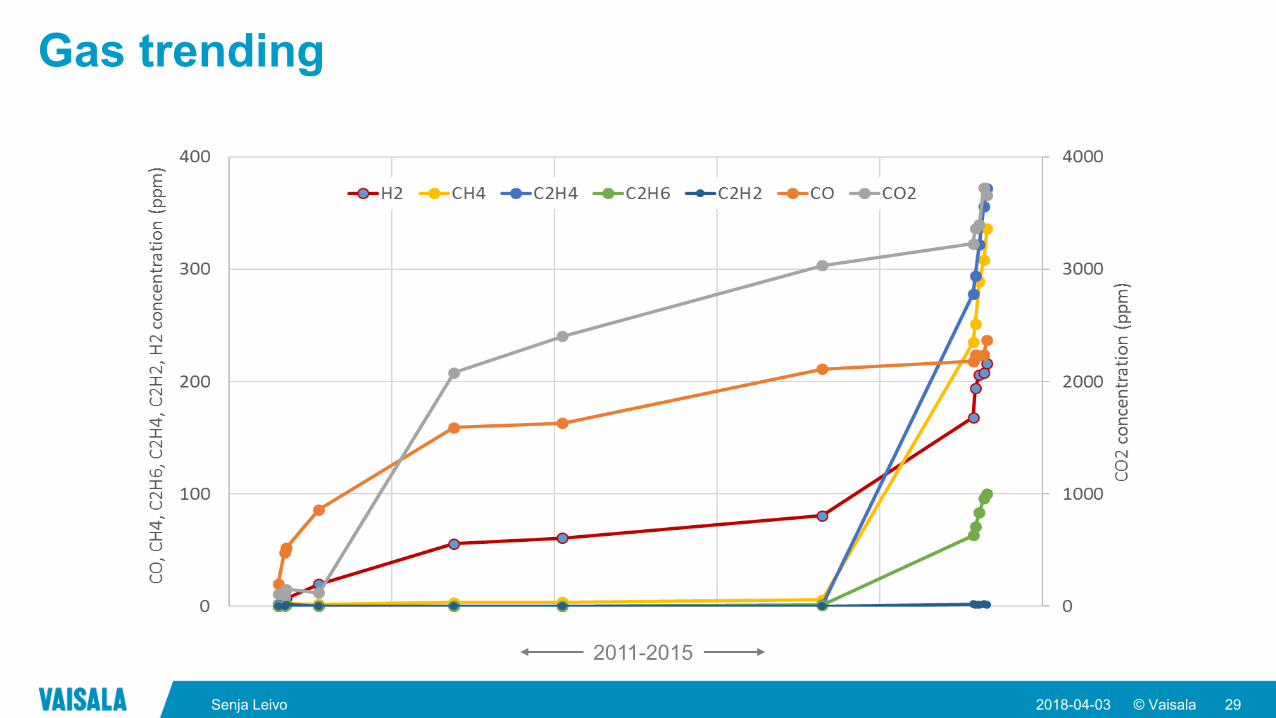
Gas trending
2018-04-03 29Senja Leivo
2011-2015
© Vaisala
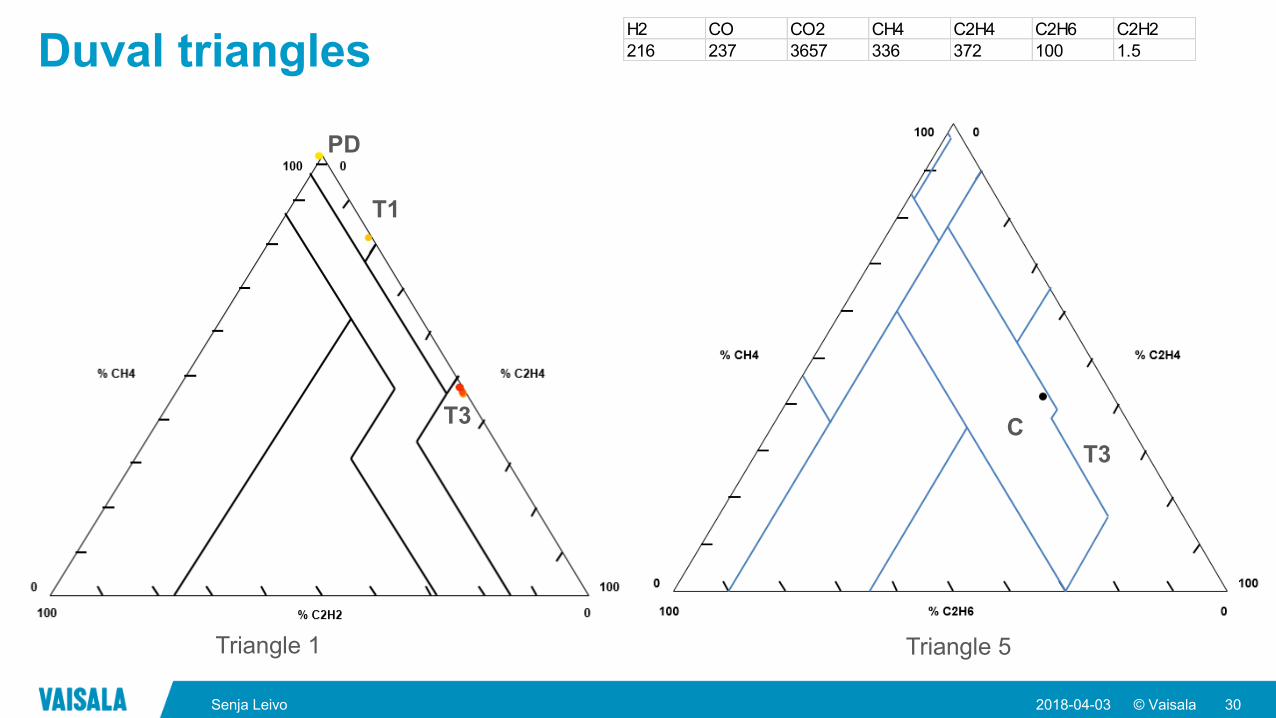
Duval triangles
2018-04-03 30Senja Leivo
PD
T1
T3
T3C
H2 CO CO2 CH4 C2H4 C2H6 C2H2
216 237 3657 336 372 100 1.5
Triangle 1 Triangle 5
© Vaisala
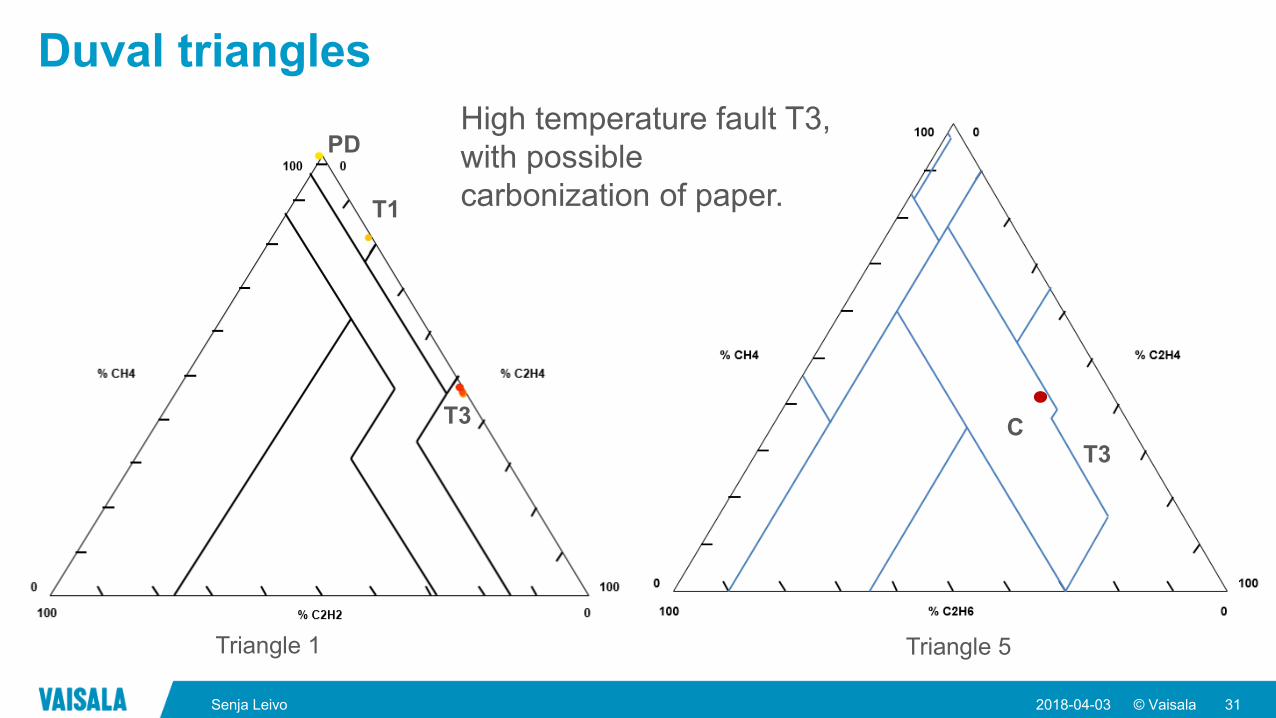
Duval triangles
2018-04-03 31Senja Leivo
PD
T1
T3
T3C
Triangle 1 Triangle 5
High temperature fault T3,
with possible
carbonization of paper.

© Vaisala2018-04-03 32Senja Leivo
PD
T1
T3
T3C
© Vaisala
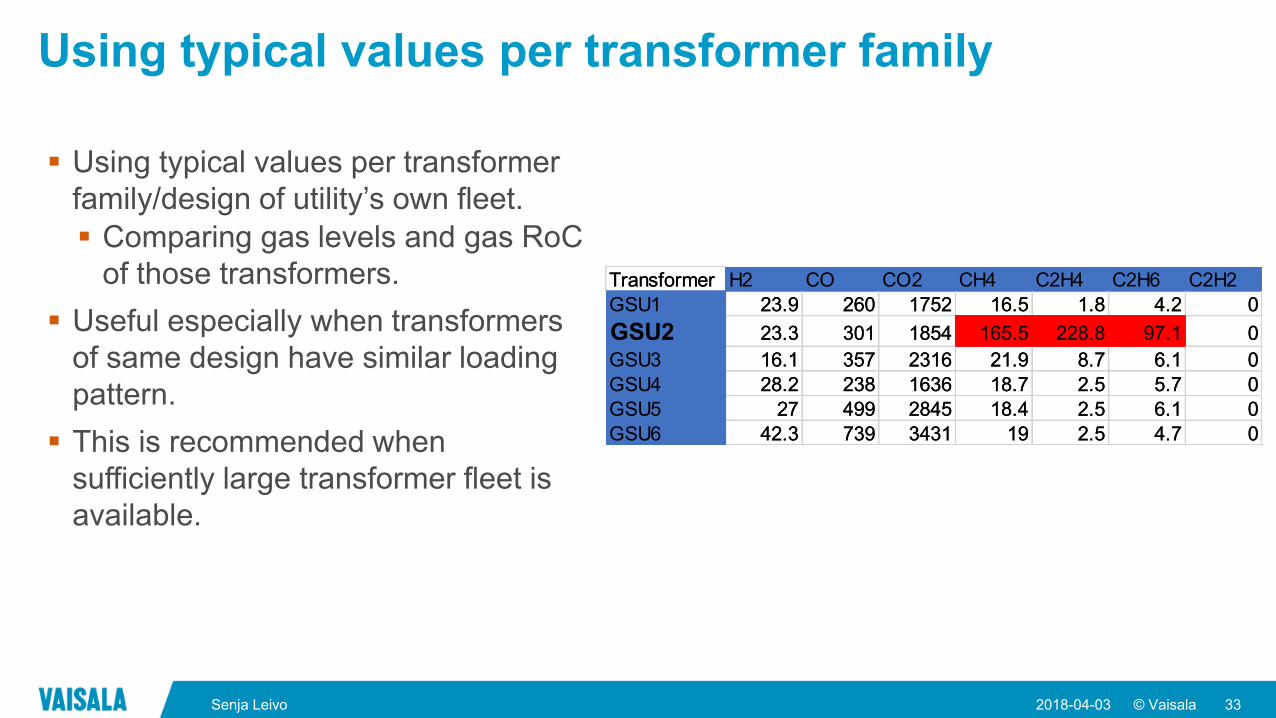
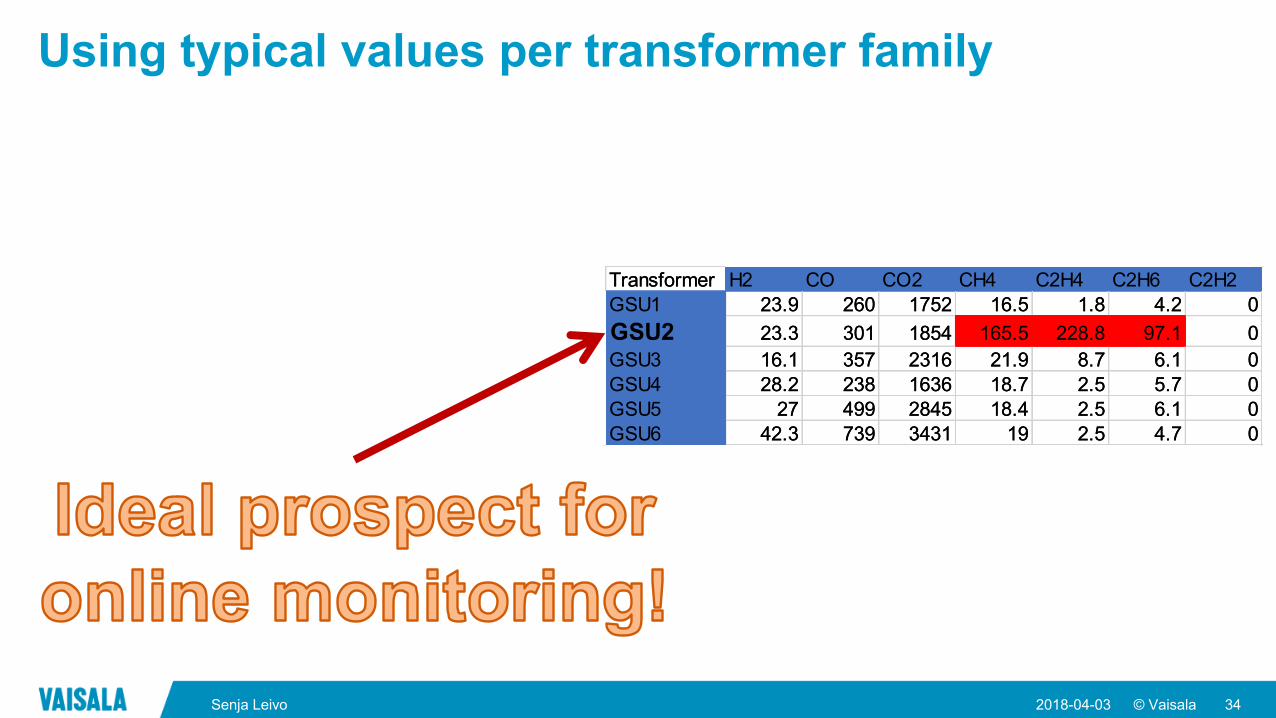
Using typical values per transformer family
Using typical values per transformer
family/design of utility’s own fleet.
Comparing gas levels and gas RoC
of those transformers.
Useful especially when transformers
of same design have similar loading
pattern.
This is recommended when
sufficiently large transformer fleet is
available.
2018-04-03 33Senja Leivo
Transformer H2 CO CO2 CH4 C2H4 C2H6 C2H2
GSU1 23.9 260 1752 16.5 1.8 4.2 0
GSU2 23.3 301 1854 165.5 228.8 97.1 0
GSU3 16.1 357 2316 21.9 8.7 6.1 0
GSU4 28.2 238 1636 18.7 2.5 5.7 0
GSU5 27 499 2845 18.4 2.5 6.1 0
GSU6 42.3 739 3431 19 2.5 4.7 0
Transformer H2 CO CO2 CH4 C2H4 C2H6 C2H2
GSU1 23.9 260 1752 16.5 1.8 4.2 0
GSU2 23.3 301 1854 165.5 228.8 97.1 0
GSU3 16.1 357 2316 21.9 8.7 6.1 0
GSU4 28.2 238 1636 18.7 2.5 5.7 0
GSU5 27 499 2845 18.4 2.5 6.1 0
GSU6 42.3 739 3431 19 2.5 4.7 0
© Vaisala
Using typical values per transformer family
2018-04-03 34Senja Leivo
Transformer H2 CO CO2 CH4 C2H4 C2H6 C2H2
GSU1 23.9 260 1752 16.5 1.8 4.2 0
GSU2 23.3 301 1854 165.5 228.8 97.1 0
GSU3 16.1 357 2316 21.9 8.7 6.1 0
GSU4 28.2 238 1636 18.7 2.5 5.7 0
GSU5 27 499 2845 18.4 2.5 6.1 0
GSU6 42.3 739 3431 19 2.5 4.7 0
Transformer H2 CO CO2 CH4 C2H4 C2H6 C2H2
GSU1 23.9 260 1752 16.5 1.8 4.2 0
GSU2 23.3 301 1854 165.5 228.8 97.1 0
GSU3 16.1 357 2316 21.9 8.7 6.1 0
GSU4 28.2 238 1636 18.7 2.5 5.7 0
GSU5 27 499 2845 18.4 2.5 6.1 0
GSU6 42.3 739 3431 19 2.5 4.7 0

© Vaisala
Utilizing online DGA data - examples
© Vaisala
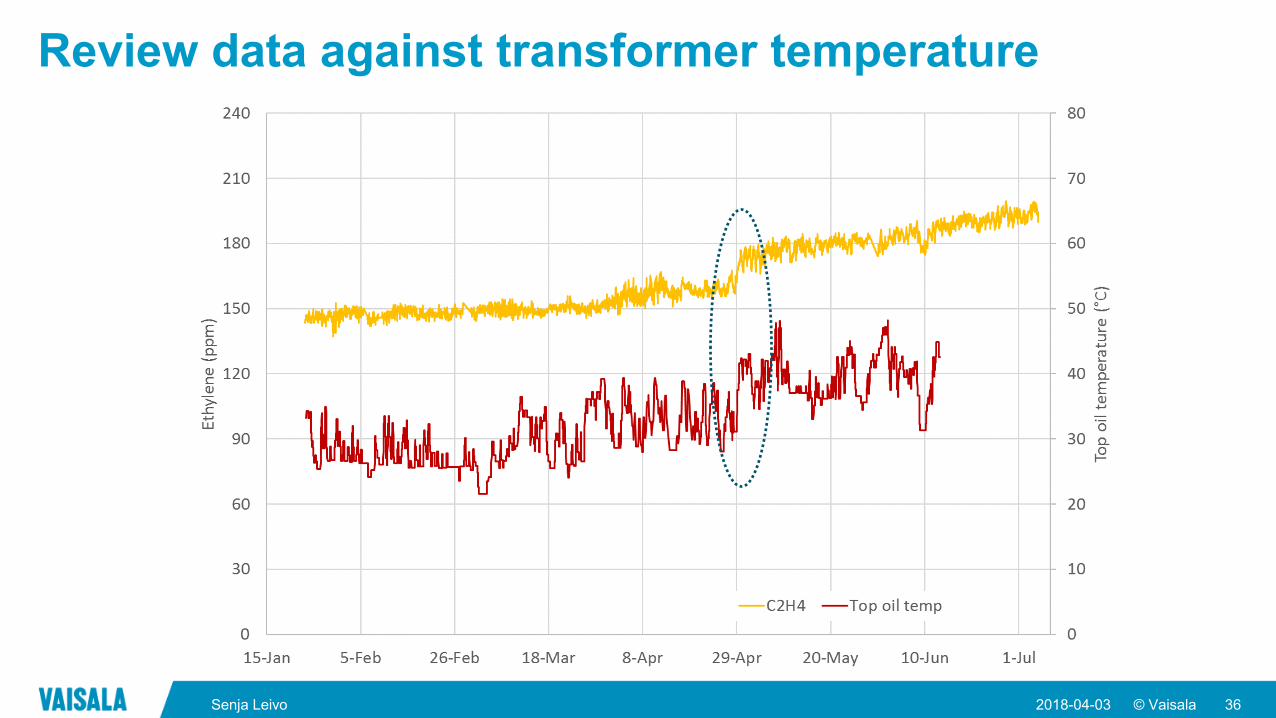
Review data against transformer temperature
2018-04-03 36Senja Leivo
© Vaisala
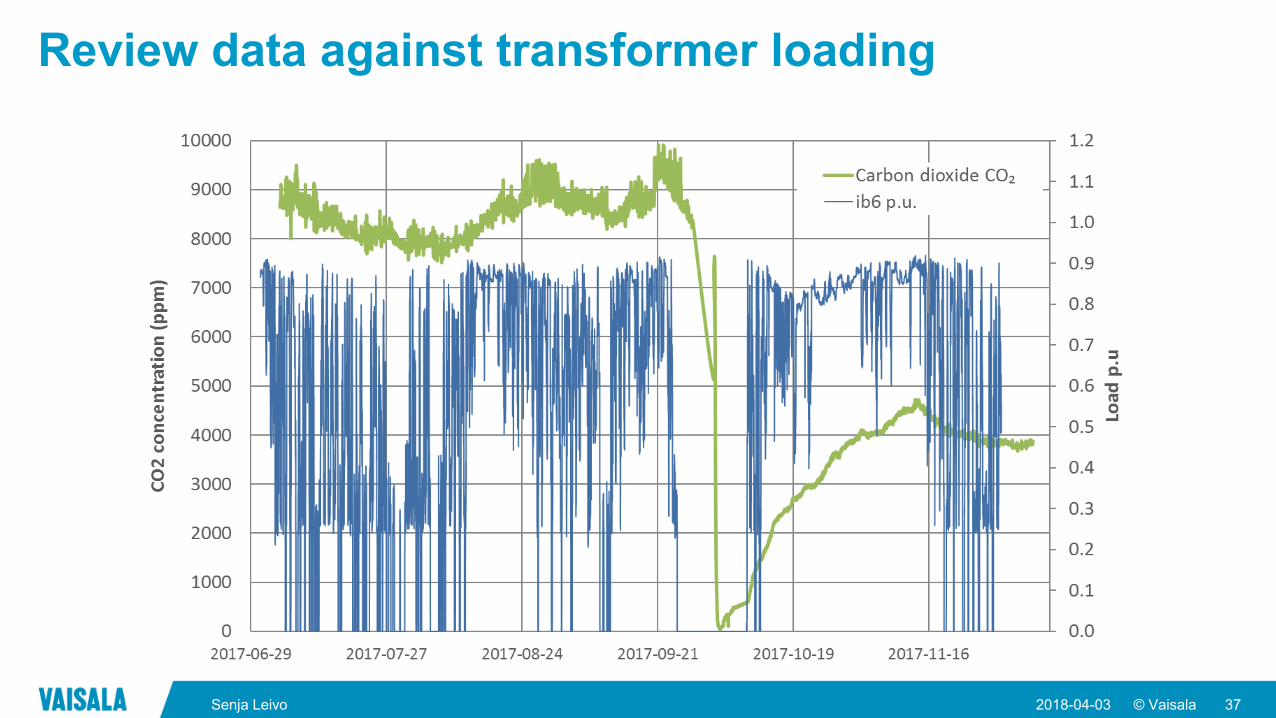
Review data against transformer loading
2018-04-03 37Senja Leivo
© Vaisala
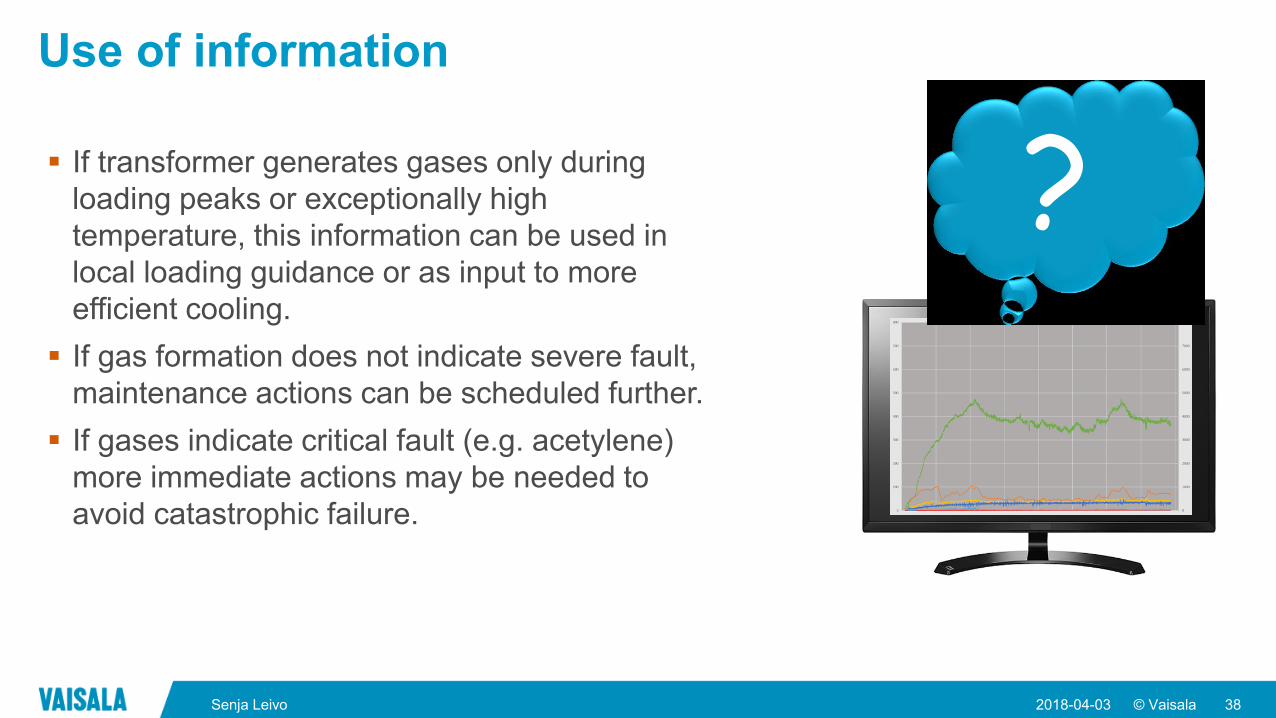
Use of information
If transformer generates gases only during
loading peaks or exceptionally high
temperature, this information can be used in
local loading guidance or as input to more
efficient cooling.
If gas formation does not indicate severe fault,
maintenance actions can be scheduled further.
If gases indicate critical fault (e.g. acetylene)
more immediate actions may be needed to
avoid catastrophic failure.
2018-04-03 38Senja Leivo
?

© Vaisala
How to compare online data and laboratory results
© Vaisala2018-04-03 40Senja Leivo
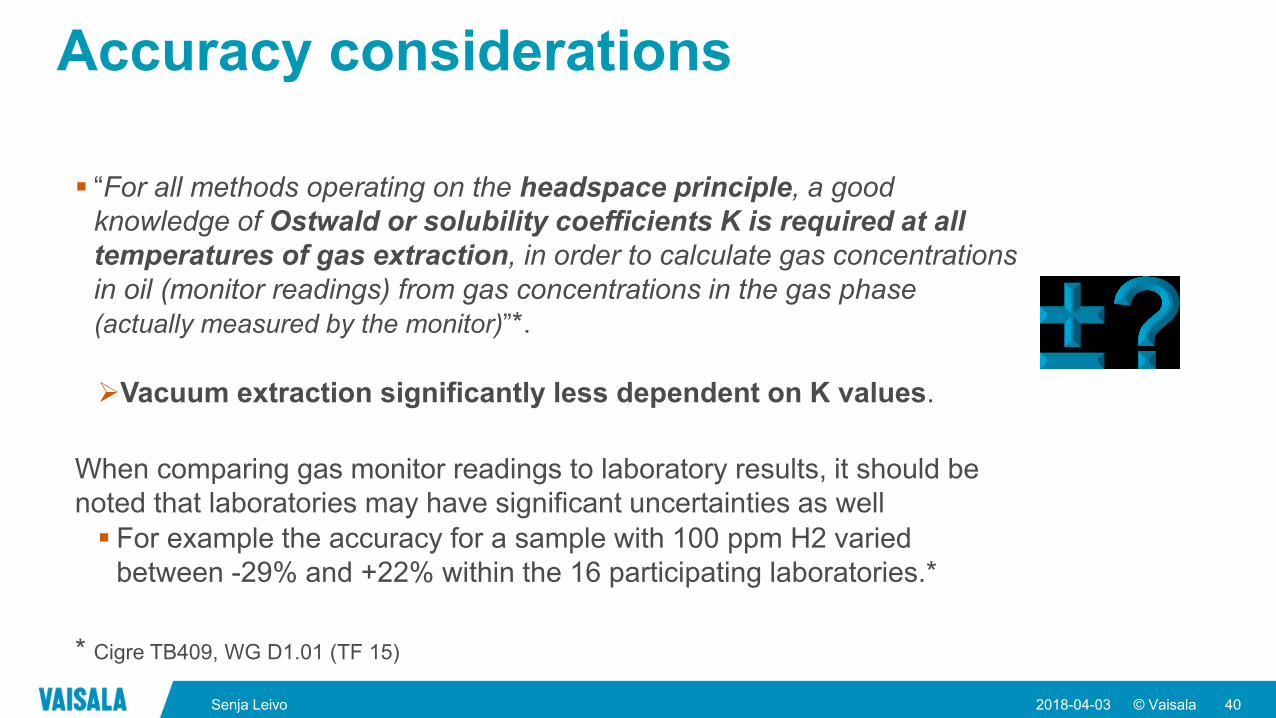
Accuracy considerations
“For all methods operating on the headspace principle, a good
knowledge of Ostwald or solubility coefficients K is required at all
temperatures of gas extraction, in order to calculate gas concentrations
in oil (monitor readings) from gas concentrations in the gas phase
(actually measured by the monitor)”*.
Vacuum extraction significantly less dependent on K values.
When comparing gas monitor readings to laboratory results, it should be
noted that laboratories may have significant uncertainties as well
For example the accuracy for a sample with 100 ppm H2 varied
between -29% and +22% within the 16 participating laboratories.*
* Cigre TB409, WG D1.01 (TF 15)
© Vaisala
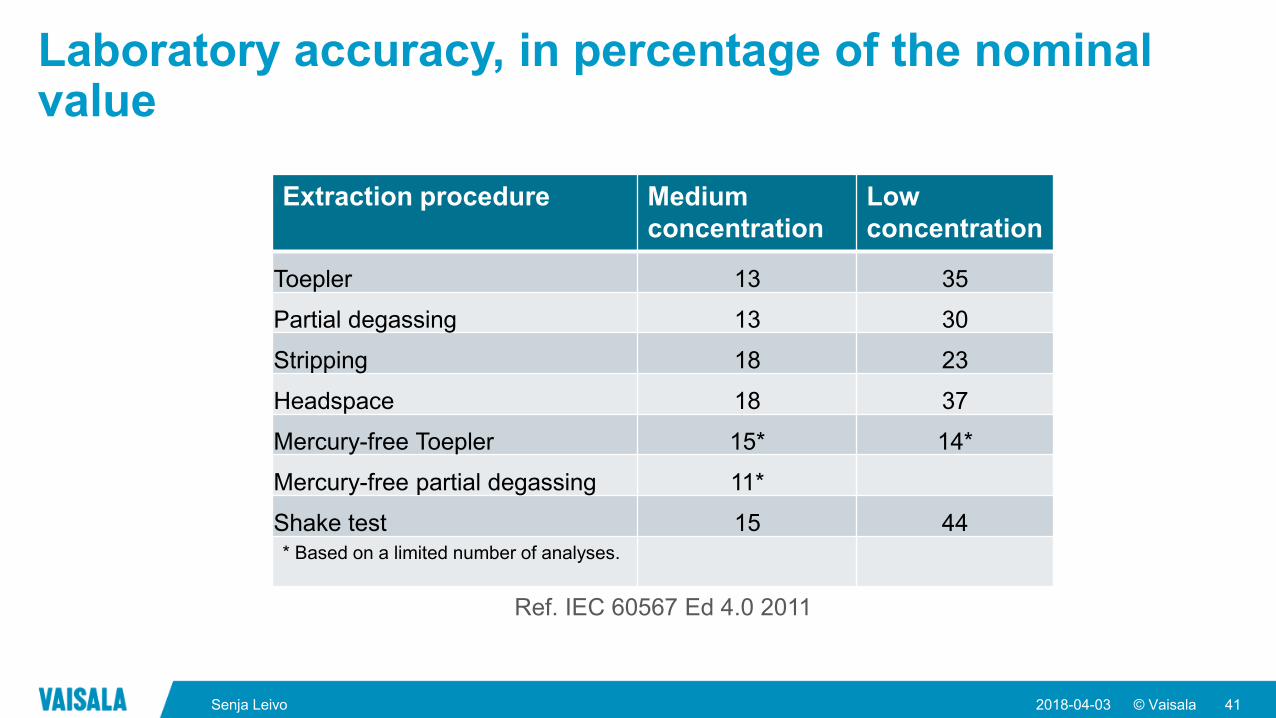
Laboratory accuracy, in percentage of the nominal value
2018-04-03 41Senja Leivo
Extraction procedure Medium
concentration
Low
concentration
Toepler 13 35
Partial degassing 13 30
Stripping 18 23
Headspace 18 37
Mercury-free Toepler 15* 14*
Mercury-free partial degassing 11*
Shake test 15 44
* Based on a limited number of analyses.
Ref. IEC 60567 Ed 4.0 2011
© Vaisala
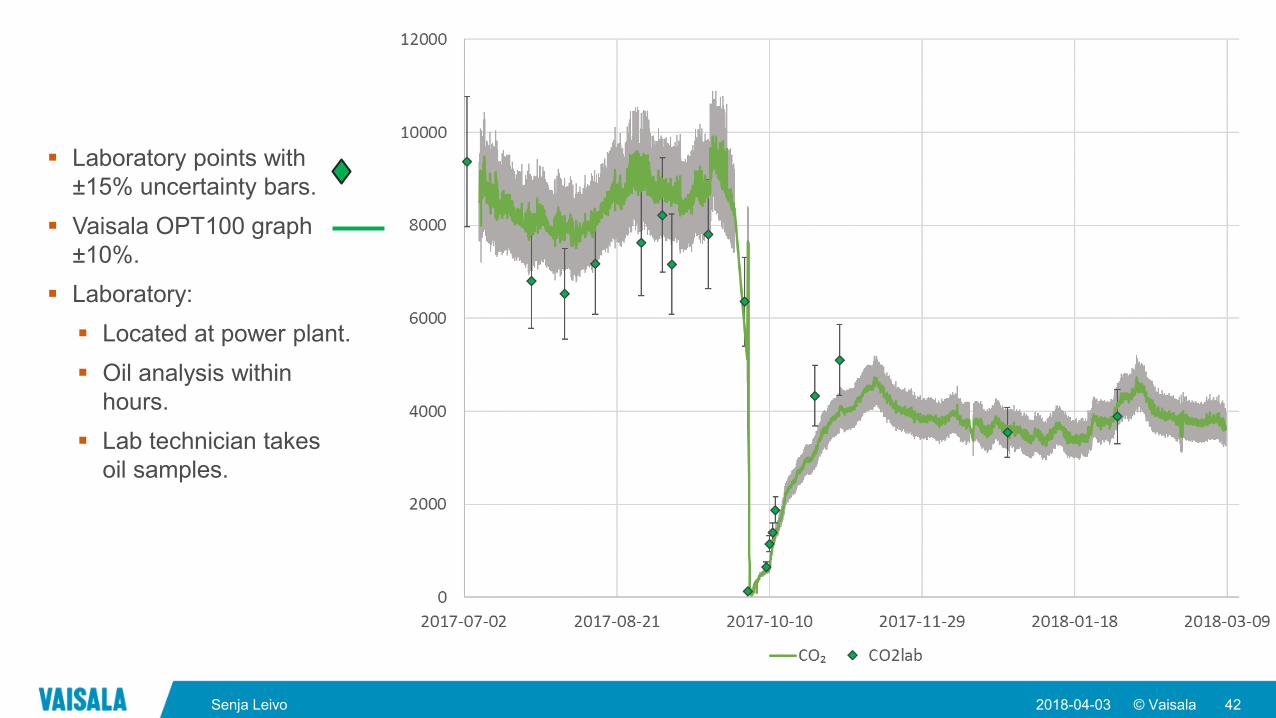
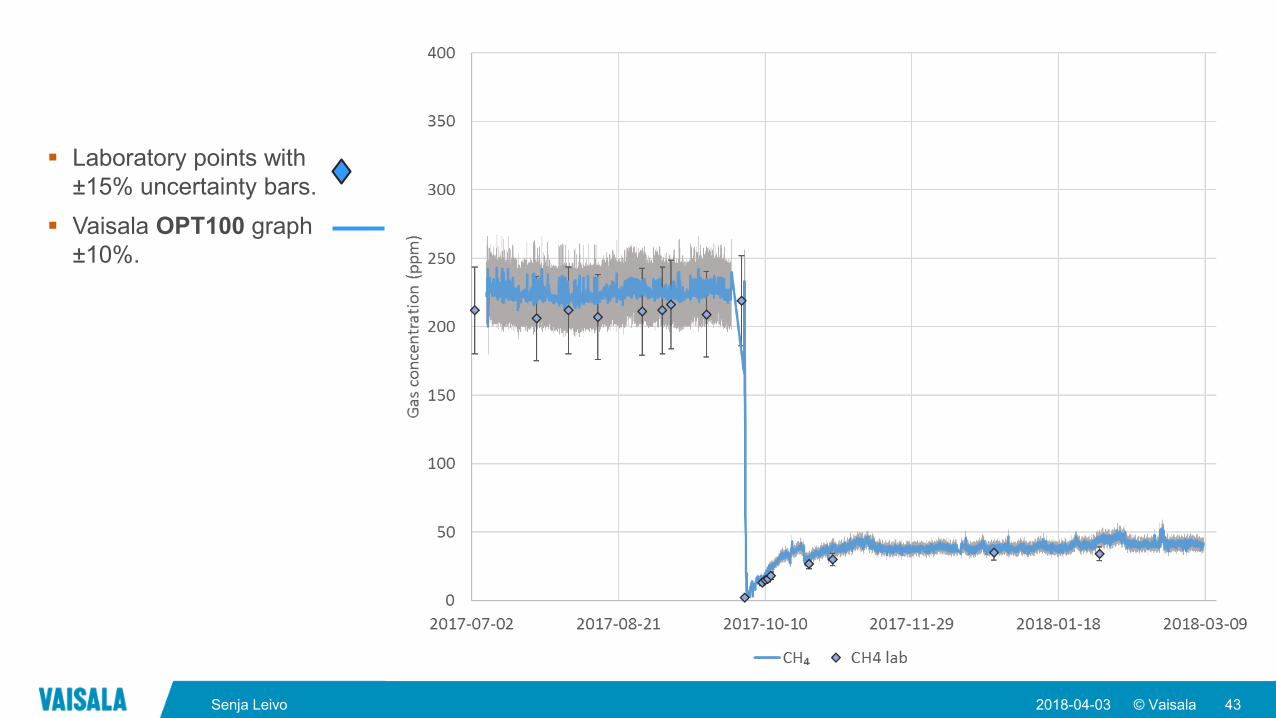
Laboratory points with
±15% uncertainty bars.
Vaisala OPT100 graph
±10%.
Laboratory:
Located at power plant.
Oil analysis within
hours.
Lab technician takes
oil samples.
2018-04-03 42Senja Leivo
© Vaisala2018-04-03 43Senja Leivo
Laboratory points with
±15% uncertainty bars.
Vaisala OPT100 graph
±10%.

© Vaisala
Thank you for joining the webinar.
2018-04-03 44Senja Leivo
![P1040-AppR - Food Standards Australia New Zealand · Web view17 December 2015 [32–15] Approval Report –Proposal P1040 Code Revision – Consequential & Corrective Amendments II](https://img.pdfslide.us/doc/110x75/5b1c92067f8b9a2d258feedc/p1040-appr-food-standards-australia-new-web-view17-december-2015-3215.jpg)