Embed Size (px)
Citation preview

R E P O R T
Online Billing Life Cycle Analysis
Prepared for
Telstra
Level 33 / 242 Exhibition Street Melbourne Victoria 3000
29 April 2008
REPORT NO: 43283300
J:\JOBS\43283300\Reporting\LCA for online billing\Final\Final final\(Cover).doc
O N L I N E B I L L I N G L I F E C Y C L E A N A L Y S I S
Prepared for Telstra, 29 April 2008.
Project Manager:
…………………………… Christophe Brulliard Senior Associate Economist
Project Director:
…………………………… Peter Boyle Principal Environmental Scientist
URS Australia Pty Ltd
Level 6, 1 Southbank Boulevard
Southbank
VIC 3006
Australia
Tel: 61 3 8699 7500
Fax: 61 3 8699 7550
Date: Reference: Status:
29 April 2008 43283300 FINAL
O N L I N E B I L L I N G L I F E C Y C L E A N A L Y S I S
Contents
Prepared for Telstra, 29 April 2008.
i
Contents ES-
Executive Summary ............................................................................................ES-1
1 Introduction ................................................................................................... 1-1
1.1 Context.......................................................................................................................... 1-1 1.2 Objectives..................................................................................................................... 1-2 1.3 Key definitions ............................................................................................................. 1-3 1.4 Goal and scope definition........................................................................................... 1-3
1.4.1 Objective........................................................................................................ 1-3 1.4.2 Functional unit ............................................................................................... 1-3 1.4.3 System boundaries and related assumptions ............................................... 1-4
2 Methodology.................................................................................................. 2-1
2.1 Life cycle assessment tool ......................................................................................... 2-1 2.2 Life cycle mapping....................................................................................................... 2-1 2.3 Allocation procedures................................................................................................. 2-2 2.4 Data collection ............................................................................................................. 2-2 2.5 Modelling ...................................................................................................................... 2-2 2.6 Method .......................................................................................................................... 2-2 2.7 Analysis ........................................................................................................................ 2-4 2.8 Peer review ................................................................................................................... 2-4
3 Life Cycle Inventory ...................................................................................... 3-1
3.1 Online billing ................................................................................................................ 3-1 3.1.1 Customer and bill numbers............................................................................ 3-1 3.1.2 Bill production ................................................................................................ 3-2 3.1.3 Bill distribution ............................................................................................... 3-6 3.1.4 Customer impact ........................................................................................... 3-6
3.2 Paper billing ................................................................................................................. 3-7 3.2.1 Customer and bill numbers............................................................................ 3-7 3.2.2 Bill production ................................................................................................ 3-8 3.2.3 Bill distribution ............................................................................................. 3-11 3.2.4 Customer impact ......................................................................................... 3-11
3.3 Comparative life cycle inventory.............................................................................. 3-12
4 Life Cycle Impact Results............................................................................. 4-1
O N L I N E B I L L I N G L I F E C Y C L E A N A L Y S I S
Contents
Prepared for Telstra, 29 April 2008.
ii
4.1 Introduction .................................................................................................................. 4-1 4.2 Indicator significance .................................................................................................. 4-1 4.3 Interpretation of results............................................................................................... 4-2 4.4 Contribution analysis .................................................................................................. 4-3
5 Sensitivity Analysis ...................................................................................... 5-1
5.1 Global Warming ........................................................................................................... 5-1 5.1.1 Online bill production ..................................................................................... 5-2 5.1.2 Use of the online bill by the customer: .......................................................... 5-6 5.1.3 Paper bill production...................................................................................... 5-9 5.1.4 Distribution of the bill ................................................................................... 5-11
5.2 Land Use..................................................................................................................... 5-11 5.2.1 Applicable to both services.......................................................................... 5-12 5.2.2 Paper bill production.................................................................................... 5-14 5.2.3 Use of the bill by the customer .................................................................... 5-15
6 Data Quality Evaluation ................................................................................ 6-1
6.1 Consistency check ...................................................................................................... 6-1 6.2 Completeness and uncertainty check ....................................................................... 6-1
7 Conclusions and Recommendations .......................................................... 7-1
8 References..................................................................................................... 8-1
9 Limitations..................................................................................................... 9-1
O N L I N E B I L L I N G L I F E C Y C L E A N A L Y S I S
List of Tables, Figures & Appendices
Prepared for Telstra, 29 April 2008.
iii
List of Tables, Figures & Appendices
Tables Page Table 2-1 Definition of Impact Categories............................................................................................. 2-3 Table 3-1 Online billing customers – at capacity .................................................................................. 3-2 Table 3-2 Number, type of servers and proportion of use for online billing purposes .......................... 3-3 Table 3-3 Electricity data relating to server activity............................................................................... 3-4 Table 3-4 Weight of servers .................................................................................................................. 3-5 Table 3-5 Customer energy usage for computers ................................................................................ 3-6 Table 3-6 Paper bill customer and bill numbers.................................................................................... 3-7 Table 3-7 Toner contents ...................................................................................................................... 3-9 Table 3-8 Floor space at Telstra’s print contractor's premises allocated to Telstra's activities .......... 3-10 Table 3-9 Electrical equipment utilised by Telstra’s print contractor to produce the paper bill........... 3-10 Table 3-10 Australia Post Energy Usage.............................................................................................. 3-11 Table 3-11 Comparative life cycle inventory for online billing and paper billing per bill........................ 3-12 Table 4-1 Impacts of online billing compared to paper billing for one bill alongside comparative data 4-2 Table 4-2 Key contributors, processes and inventory for each impact category .................................. 4-4
Figures Figure 1-1 Scope of LCA project ............................................................................................................ 1-6 Figure 4-1 Global Warming flow-chart.................................................................................................... 4-6 Figure 4-2 Human toxicity flow chart ...................................................................................................... 4-7 Figure 4-3 Abiotic depletion flow chart ................................................................................................... 4-8 Figure 4-4 Land use flow chart............................................................................................................. 4-10 Figure 5-1 Global warming impact (difference between online billing and paper billing) associated with varying numbers of online bills produced .................................................................................................. 5-3 Figure 5-2 Global warming impact (difference between an online bill and a paper bill) for the energy use by servers ............................................................................................................................ 5-4 Figure 5-3 Global warming impact (difference between an online bill and a paper bill) for the ratio of energy consumption for the servers’ air conditioners to energy consumption for the servers.................. 5-5 Figure 5-4 Global warming impact (difference between online billing and paper billing) for energy usage by the customer ............................................................................................................................ 5-6 Figure 5-5 Global warming impact (difference between online billing and paper billing) associated with the percentage of customers who print their online bill ............................................................................. 5-7 Figure 5-6 Global warming impact (difference between an online bill and paper bill) associated with the average number of sheets of paper used by customers to print their online bill....................................... 5-8 Figure 5-7 Global warming impact (difference between online billing and paper billing) associated with percentage variations to the average number of sheets per bill ............................................................... 5-9
O N L I N E B I L L I N G L I F E C Y C L E A N A L Y S I S
List of Tables, Figures & Appendices
Prepared for Telstra, 29 April 2008.
iv
Figure 5-8 Global warming impact (difference between online billing and paper billing) associated with varying amounts of energy usage at Telstra's printer contractor ............................................................ 5-10 Figure 5-9 Global warming impact (difference between online billing and paper billing) for energy use by Australia Post .......................................................................................................................... 5-11 Figure 5-10 Land use impact difference between an online bill and a paper bill for varying weights of paper .......................................................................................................................... 5-12 Figure 5-11 Difference in the land use impact associated with an online bill compared to a paper bill associated with the percentage of customers who recycle the paper associated with their bill ............. 5-13 Figure 5-12 Difference in land use impact between an online bill and paper bill as the average number of sheets per bill varies .......................................................................................................................... 5-14 Figure 5-13 Average number of sheets used by the customer to print their bill..................................... 5-15 Figure 5-14 Difference in land use impact between an online bill and a paper bill for the percentage of customers who print their online bill ........................................................................................................ 5-16 Error! No table of figures entries found.
Appendices A. Life Cycle Impact Data for Equipment B. Data Output Tables from SIMAPRO C. Peer Review Report and Responses
O N L I N E B I L L I N G L I F E C Y C L E A N A L Y S I S
Executive Summary
Prepared for Telstra, 29 April 2008.
ES 1
Executive Summary
This report contains the results of a comparative Life Cycle Assessment (LCA) undertaken to compare the environmental impacts from online billing and paper billing. The project has been completed to inform Telstra management and customers about the benefits of a customer choosing pure online billing over paper billing. Telstra, by employing LCA, has ensured that a robust analysis has been completed prior to publicly stating the environmental impacts of its products and services, in this case, of online billing compared to conventional paper billing.
ES 1 Key activities
The key activities associated with the two scenarios (online billing and paper billing) that were incorporated into the model include:
• preparation;
• distribution; and
• use of the bill by the customer.
ES 2 Model The model considers two types of impacts associated with these activities: resource consumption and materials impact. Resource consumption captures the impacts associated with energy usage for different aspects of the scenario, such as powering the online billing servers. The material impacts are the impacts associated with embodied materials, i.e. the impacts associated with manufacturing and disposing of different pieces of equipment and products, such as the servers.
ES 3 Data collection
The data collected for the model was obtained from Telstra, its contractors and scholarly sources. The data was entered into SimaPro V7 software and combined with information from Australian databases (wherever feasible) in SimaPro to construct the LCA model. It is essential to note that the comparative LCA focuses on the differential use of resources between the two scenarios. As a consequence, it is not possible to read the results of this LCA as total values for either scenario. The results are relative. Anything common to both scenarios is considered as outside of the scope of the model (as they cancel each other out).
ES 4 Environmental impacts
The environmental impact categories considered were: global warming, human toxicity, abiotic depletion and land use. The impact categories for the comparative LCA indicate that the environmental burdens associated with online billing are less than those associated with paper billing. Key results are shown in Table ES-1. The data shows a comparison of the impacts associated with one online bill compared to one paper bill. The results illustrate that online billing contributes 25% less to the greenhouse effect, consumes 20% less fossil fuels and scarce metals, produces 125% less toxic substances and saves approximately 160% on land use.
O N L I N E B I L L I N G L I F E C Y C L E A N A L Y S I S
Executive Summary
Prepared for Telstra, 29 April 2008.
ES 2
ES 5 Key findings
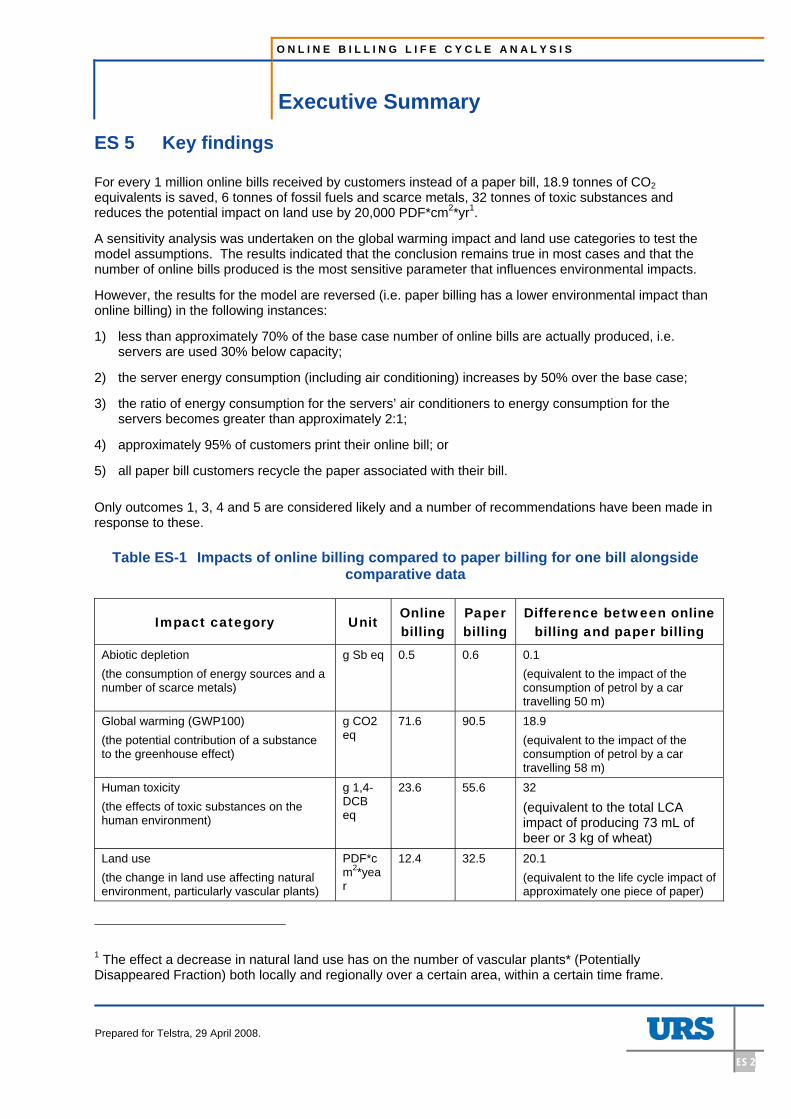
For every 1 million online bills received by customers instead of a paper bill, 18.9 tonnes of CO2 equivalents is saved, 6 tonnes of fossil fuels and scarce metals, 32 tonnes of toxic substances and reduces the potential impact on land use by 20,000 PDF*cm2*yr1.
A sensitivity analysis was undertaken on the global warming impact and land use categories to test the model assumptions. The results indicated that the conclusion remains true in most cases and that the number of online bills produced is the most sensitive parameter that influences environmental impacts.
However, the results for the model are reversed (i.e. paper billing has a lower environmental impact than online billing) in the following instances:
1) less than approximately 70% of the base case number of online bills are actually produced, i.e. servers are used 30% below capacity;
2) the server energy consumption (including air conditioning) increases by 50% over the base case;
3) the ratio of energy consumption for the servers’ air conditioners to energy consumption for the servers becomes greater than approximately 2:1;
4) approximately 95% of customers print their online bill; or
5) all paper bill customers recycle the paper associated with their bill.
Only outcomes 1, 3, 4 and 5 are considered likely and a number of recommendations have been made in response to these.
Table ES-1 Impacts of online billing compared to paper billing for one bill alongside comparative data
Impact category Unit Online billing
Paper billing
Difference between online billing and paper billing
Abiotic depletion (the consumption of energy sources and a number of scarce metals)
g Sb eq 0.5 0.6 0.1 (equivalent to the impact of the consumption of petrol by a car travelling 50 m)
Global warming (GWP100) (the potential contribution of a substance to the greenhouse effect)
g CO2 eq
71.6 90.5 18.9 (equivalent to the impact of the consumption of petrol by a car travelling 58 m)
Human toxicity (the effects of toxic substances on the human environment)
g 1,4-DCB eq
23.6 55.6 32
(equivalent to the total LCA impact of producing 73 mL of beer or 3 kg of wheat)
Land use (the change in land use affecting natural environment, particularly vascular plants)
PDF*cm2*year
12.4 32.5 20.1 (equivalent to the life cycle impact of approximately one piece of paper)
1 The effect a decrease in natural land use has on the number of vascular plants* (Potentially Disappeared Fraction) both locally and regionally over a certain area, within a certain time frame.
O N L I N E B I L L I N G L I F E C Y C L E A N A L Y S I S
Executive Summary
Prepared for Telstra, 29 April 2008.
ES 3
The key recommendations include:
1) Server utilisation should be maximised (as close as possible to their capacity);
2) Consideration should be given to how to best reduce the amount of energy required to cool the online billing servers;
3) Customers should be encouraged not to print their online bill;
4) Communicate the outcomes to suppliers (particularly the print contractor and server supplier) and encourage them to reduce the environmental impacts of their products and services;
5) Review the bill content and structure with the aim of reducing the number of pages, graphics and ink required by the bill;
6) Communicate to clients how they can help reduce their environmental impacts; and
7) Consider buying green energy to offset the servers’ energy use and further reduce the impact of online billing.
O N L I N E B I L L I N G L I F E C Y C L E A N A L Y S I S
Section 1 Introduction
Prepared for Telstra, 29 April 2008.
1-1
1 Introduction
URS was engaged by Telstra Corporation to carry out a Life Cycle Assessment of the environmental impacts of online billing compared to paper billing.
1.1 Context
Many companies are now offering their customers the choice of receiving their bills electronically rather than in paper form. Consolidated statistics for the growth in online billing are difficult to find, however a number of companies have reported the number of online billing or electronic statement customers they have at different points in time. For example, Westpac note as at 30 September, 2006 it had approximately 200,000 customers who receive electronic statements2 and the NTT Group in 2005 had approximately 3.6 million customers using an electronic billing reference service (NTT, 2006). The environmental impacts associated with shifting customers from paper bills to electronic bills are unclear. Westpac notes saving 41 tonnes of paper, and 103 tonnes of greenhouse emissions (Westpac, 2006). NTT states that they saved nearly 698.6 tonnes of paper resources (NTT, 2006). However this information only provides a very limited indication of the environmental impacts associated with online billing or electronic statements.
At the initiation of this project we undertook a desk top review to identify studies that considered the life cycle impacts of online billing and paper billing. A total of over 80 national and international databases including the RMIT based Informit databases and two groups of Thomson Dialog were searched, but no specific studies focused on online billing and paper billing were found. It was assumed that any work completed in the area has been done by private consultants for clients and the results have not been published in the public domain. There were however several studies that provide insights that can be applied to this project.
A case study based on Barclays Bank (Turk et al, 2003) exploring the environmental impact of e-banking versus traditional banking found that traditional banking had a far greater environmental impact (2.76 kg total material required per traditional bill-payment versus 1.09 kg per electronic bill-payment for e-banking). The biggest impacts for both scenarios were associated with building infrastructure and electricity consumption. The results relied on the assumption that e-banking was used as an alternative to traditional banking, and banks reduced their total physical assets accordingly. If e-banking was treated as complementary to traditional banking, then the total material requirement for e-banking becomes greater than that for traditional banking.
The environmental impact of telecommunication services was considered by Zurkirch and Reichart (2002) which examines one company’s internal post service versus email. It was concluded that computer peripherals contributed the most to the environmental impact of telecommunications, rather than the transport of a letter or email transmission. For documents up to 15 pages, the impact of emailing the document was equivalent to the impact of posting it for up to 20 kilometres. The largest impact of postal mail comes from transportation, whereas for email it is the internet server, air conditioning of the network, and the computer itself.
Gard and Keoleian (2003), examined the impact of digital versus paper journal collections, which revealed conflicting results. Out of the five scenarios tested, digital journals proved more energy efficient in two, and neither medium had a superior energy performance in every case. The results were influenced most by the number of times a particular journal article was read.
2 Westpac, 2006, pg 43
O N L I N E B I L L I N G L I F E C Y C L E A N A L Y S I S
Section 1 Introduction
Prepared for Telstra, 29 April 2008.
1-2
Gard and Keoleian’s work is strengthened by a life-cycle analysis of online versus paper newspapers by Hischier and Reichart (2003), which obtained similar results. Hischier and Reichart found that the manufacture of the computer, and power consumption of the computer during use, individually contributed the most to the environmental impact. However, paper newspapers overall still had the highest environmental impact due to the high energy requirements of pulp and paper production. Changing the electricity mix altered the results significantly – changing from the Swiss energy mix (high use of renewable energy) to the average European energy mix tripled the impact of internet newspapers, making them worse for the environment than paper newspapers. The energy mix is one of three key conditions that influence the results - Internet newspapers will only be more environmentally friendly than paper newspapers if:
1) there is no printing of online information;
2) internet surfing is directed at specific sites and limited in time; and
3) computer power consumption is based on renewable energy sources
Another life-cycle analysis of a printed newspaper versus a weekly magazine by INFRAS (1998), also found that the highest environmental impact came from the high energy requirements of pulp and paper production. For both the newspaper and the magazine, the impacts were largely divided between three areas: fresh fibre production (pulp), paper production, and printing.
The outcomes from this project, to compare billing methods, were similar to those observed by the studies mentioned above. In essence this project concluded that a number of environmental benefits could be gained through utilising an online bill compared to a paper bill, based on Telstra as an example. The key impacts were associated with the:
• number of online bills produced;
• amount of energy consumed by the production, test and development servers that support online billing (which includes the energy required for air conditioning);
• percentage of customers who print their online bill; and
• average number of pages per bill.
Similar to the Barclay Bank case study the results rely on online billing acting as an alternative to paper billing. If a customer was to utilise both simultaneously the results would be reversed.
1.2 Objectives
The project objectives are:
• to identify the life cycle environmental impacts associated with online billing and compare them with those associated with paper billing;
• to identify the key contributors to the life cycle impacts of these two scenarios; and
• provide recommendations to Telstra on how to reduce the environmental impact of both online and paper billing services.
O N L I N E B I L L I N G L I F E C Y C L E A N A L Y S I S
Section 1 Introduction
Prepared for Telstra, 29 April 2008.
1-3
1.3 Key definitions
Life Cycle Assessment (LCA) is a quantitative assessment tool. It applies a systems approach to identify, quantify and compare the environmental impacts of a product, service or system. For each key stage, the impact is measured in terms of resources used and resulting environmental impacts. The key stages for a product or service can include raw materials extraction through to processing, transport, use, reuse, recycling or disposal, and the process assessment is often referred to as “cradle to grave”. In this study, a LCA systems analysis was undertaken to assess the impacts associated with online billing and paper billing services. Consideration was given to resource consumption and materials consumption associated with a number of products and equipment which were integrated into the process (refer to Section 3 for more detail).
A comparative LCA has been undertaken, which means that it incorporates only the processes and stages where a difference between the two scenarios, online billing and paper billing has been identified. Practically, this means that this study does not cover the full LCA of online billing nor paper billing.
1.4 Goal and scope definition
1.4.1 Objective
The overall objective of the project was to compare the impact of one online bill with the impact of one paper bill.
1.4.2 Functional unit
The functional unit for the study is one instance of billing information delivery to a standard Telstra client. This includes the following processes:
• Online billing: producing, viewing and (sometimes) printing the online bill, as well as (when applicable) disposing of the paper the bill is printed on; and
• Paper billing: producing, receiving and disposing of a paper bill sent via Australia post.
It should be noted that this assessment was completed in reference to the projected capacity of the online billing servers and not the present online billing utilisation level. As at 21 October 2007, approximately 13 million online bills3 were being produced yearly for Telstra’s customers but only approximately 80,000 individual online billing customers chose not to receive a paper bill with their online bill. The remaining online billing customers received both the online bill and the paper bill.
The model uses the number of online bills that will be generated once the servers are operating at capacity. This is to allow for the accurate determination of the environmental impacts per online bill. The model only considers online billing customers who do not receive a paper bill.
3 Data was provided by John McKenzie, Telstra Online Billing.
O N L I N E B I L L I N G L I F E C Y C L E A N A L Y S I S
Section 1 Introduction
Prepared for Telstra, 29 April 2008.
1-4
1.4.3 System boundaries and related assumptions
In order to set the project boundaries, consideration was given to the work flows for the preparation of the bills and how they are received and handled by the customer. It is essential to note that the comparative LCA focuses on the differential use of resources between the two scenarios. Therefore, anything in common to both scenarios does not need to be included in the model.
The following have not been included in the model:
• Energy inputs associated with air transportation of paper bills – Australia Post was unable to provide this information. Inclusion of this information would increase paper billing’s impacts.
• paper reminders, as they are sent to both online customers and paper billing customers (same profile assumed for contacting both categories of customers);
• payment, as it is assumed that online billing and paper billing customers have the same profile of payment methods (BPay, Australia Post etc);
• collections agency action, fraud, enquiries and disputes;
• storage capacity of online servers, as they store all customer billing information for access by Telstra’s customer service or “front of house” staff; and
• server capacity used by “front of house staff” as this service is available to both online billing and paper billing customers.
The impacts associated with changed levels of customer interaction, such as the reduction in call centre costs and impacts associated with increased online interaction with online billing customers are considered outside the scope of the project.
As marketing material distributed with the bills is not directly related to the billing process, this is also considered outside the scope of the project.
As the Simapro database did not offer the possibility of selecting appropriate paper (printing quality) from an Australian database, we selected relevant paper in the Ecoinvent (European) database and substituted the key inventory elements from an impacts perspective, i.e. the pulp and the electricity input (INFRAS, 1998), to reflect the sourcing of the pulp and the production of electricity in Australia. The amounts (weight of pulp and kWh of electricity) used have been kept at the same level. It should also be noted that the same principle was applied to the recycling of paper.
It is assumed that the contribution of the online bill to the customer’s decision to purchase the home computer and printer is nil, therefore the impacts of the materials associated with home electronic equipment are not included in the LCA, only the impact of the use of such equipment.
Depletion of water resources was excluded from the scope of the project. We hypothesise that water demand could be correlated to other resource use and therefore favour online billing, in terms of environmental burden assessment.
The processes inside the scope boundaries have been grouped into the following categories:
1) bill preparation;
2) distribution; and
3) customer handling.
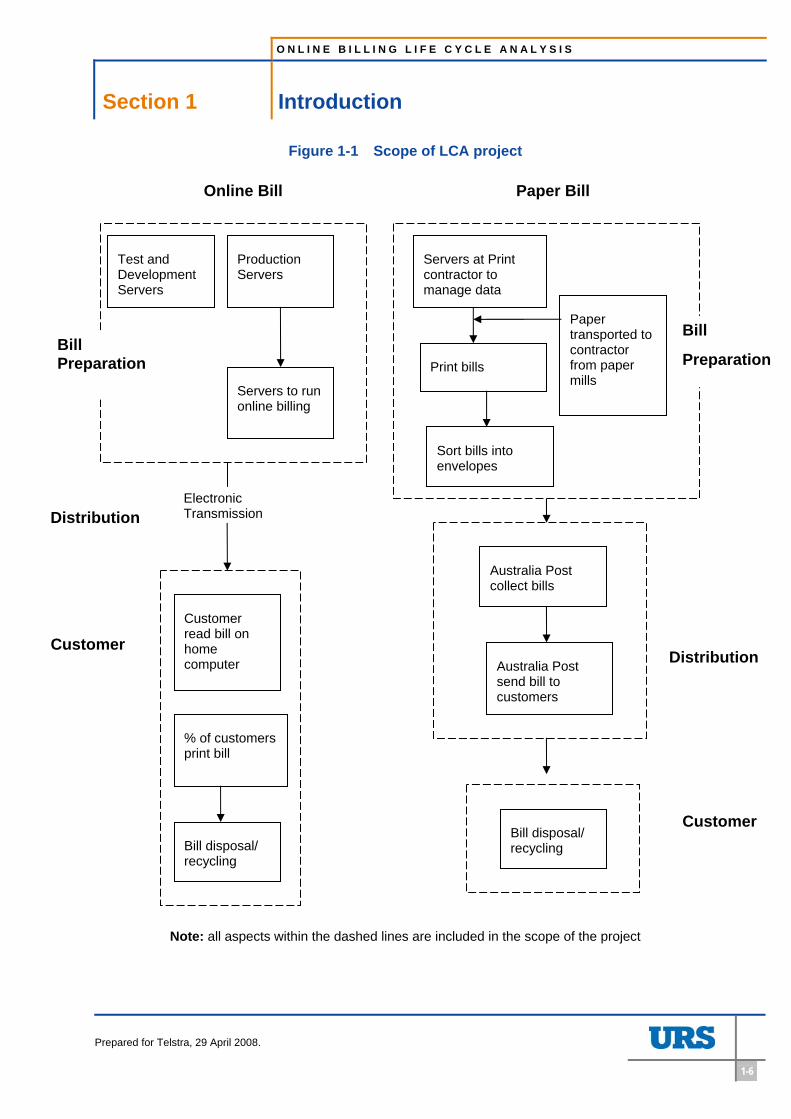
Figure 1-1 shows the scope of the project diagrammatically.
O N L I N E B I L L I N G L I F E C Y C L E A N A L Y S I S
Section 1 Introduction
Prepared for Telstra, 29 April 2008.
1-5
Customer Categories
Telstra has approximately 11.52 million customers. The customer categories are divided into online billing customers or paper bill customers. There are currently approximately 1.4 million individual customers utilising online billing. Of these, approximately 80 000 do not receive a paper bill. The remaining customers receive both the online bill and the paper bill.
There are approximately 11.4 million paper bill customers and in 2006 approximately 105.2 million paper bills were sent to Telstra customers.
In June 2009, it is anticipated that online billing will be operating at full capacity with the equivalent of 3.8 million customers utilising online billing. It is also expected that at this point in time billing will be monthly for all customers that is they will receive 12 bills a year, whereas the average billing frequency is currently 9.2 bills a year.
O N L I N E B I L L I N G L I F E C Y C L E A N A L Y S I S
Section 1 Introduction
Prepared for Telstra, 29 April 2008.
1-6
Figure 1-1 Scope of LCA project
Note: all aspects within the dashed lines are included in the scope of the project
Servers to run online billing
Servers at Print contractor to manage data
Print bills
Sort bills into envelopes
Australia Post send bill to customers
Paper transported to contractor from paper mills
Production Servers
Test and Development Servers
Australia Post collect bills
Customer read bill on home computer
% of customers print bill
Bill disposal/ recycling
Electronic Transmission
Online Bill Paper Bill
Bill Preparation
Customer
Customer
Distribution
Bill disposal/ recycling
Bill
Preparation
Distribution
O N L I N E B I L L I N G L I F E C Y C L E A N A L Y S I S
Section 2 Methodology
Prepared for Telstra, 29 April 2008.
2-1
2 Methodology
The recommendations of the International Standards for Environmental Management - Life Cycle Assessment were used as guidance for this study (AS/NZS ISO 14040:1998, AS/NZS ISO 14041:1999, AS/NZS ISO 14042:2001, AS/NZS ISO 14043:2001 and AS/NZS ISO 14048:2003). The recommended steps for scope and goal definition, life cycle mapping, life cycle inventory and life cycle impact assessment were followed.
2.1 Life cycle assessment tool
To undertake the analysis we used the SimaPro V7 software4. SimaPro contains background data associated with nested and non-nested material, transport, waste treatment, manufacturing, and energy processes from various countries for a wide range of technologies and scales. The quantitative data are entered in matrix (tabular) format. The program performs the matrix multiplication of tables (emission rates multiplied by life cycle impact category potency factor to provide life cycle impact values). The program allows the user to logically link various processes from “cradle to grave”. The processes can be assembled into a life cycle tree and can produce graphical outputs. The project and its outputs can be exported to and/or imported from Microsoft Excel and Access. In addition, the software has a special provision to generate real time LCA reports. The main advantages of the software are life cycle tracing and tracking of all material and energy inputs and outputs and the greater speed and accuracy with which thousands of nested and linear process inputs can be handled and analysed.
2.2 Life cycle mapping
To understand the life cycle of online billing and paper billing and their associated impacts, a literature review was undertaken. To develop an understanding of Telstra’s specific processes, numerous meetings were held between URS and Telstra, and several of Telstra’s contractors. The outcomes from these processes led to identifying the boundary of the project as clarified in Section 1.4 and dividing the impacts into three key areas: bill preparation, distribution and customer use of the bill, as discussed in Section 1.4.
A literature review of the equipment used in the billing process was conducted. This primarily focused on the material composition of the equipment and electronic processing hardware. Time was also spent researching the amount of energy used by key activities within the model such as the air-conditioners which accompany the servers and the client printing their online bill.
Additional liaising with Telstra allowed the development of realistic assumptions. These assumptions were documented and formally validated by Telstra and are described in Section 3.
Based on these assumptions, data sheets were drafted. The data sheets included calculations corresponding to the various processes contributing to the key headings (bill preparation, distribution and customer use) for each scenario (online billing and paper billing). Data gaps were then identified and a data collection process agreed upon.
4 SimaPro stands for System for Integrated Environmental Assessment of Products. It has been developed by PRé Consultants, a company based in the Netherlands and follows the ISO 14040 series recommendations that consist of environmental management, principles and framework of life cycle assessment. It is a database embedded LCA software tool that has been written in Microsoft Access.
O N L I N E B I L L I N G L I F E C Y C L E A N A L Y S I S
Section 2 Methodology
Prepared for Telstra, 29 April 2008.
2-2
2.3 Allocation procedures
Allocation procedures have been uniformly applied throughout the life cycle analysis process. Resource input allocation was done on the basis of items, either the number of pages (paper inputs) or the number of bills.
2.4 Data collection
The data for the online billing and paper billing processes were collected from Telstra (e.g. customer numbers); Telstra’s contractors (e.g. the number of paper bills printed); scholarly journals (e.g. life cycle assessments of computers); and product specification sheets (e.g. materials associated with print and sorting equipment).
Whenever possible, data available in the SimaPro 7 software was used with preference given to products and processes from the Australian databases.
These inputs enabled the completion of the stages in the life cycle assessment known as life cycle inventory (described in Section 3).
2.5 Modelling
A model was then built in SimaPro to bring all the collected data and defined calculations together in a life cycle system. This was done using the SimaPro functionalities which allow the construction of successive “product stages” corresponding to aggregation steps (or modules) of basic processes (for both materials and usage). The model was built along the same three key headings defined above (bill preparation, distribution and use of the bill by the customer), distinguishing between the life cycle impacts associated with each scenario.
To allow comparison of the online billing and the paper bill scenarios, a “product stage” comparing the impact of one online bill equivalent and one paper bill equivalent was built.
The overall impact of the online bill was then calculated using an equivalent number of customers. This calculation was performed by assuming an equivalent number of customers for each major business (retail, business, etc.) using the online billing service. The basis for this calculation was the average number of bill pages received by a customer group and the equivalent number of customer bills required to match this.
The SimaPro model could then be run, and its graphical presentation functionalities used to produce the analyses presented in this report.
2.6 Method
SimaPro offers the possibility to run the model using a range of standard impact assessment methods. Each method uses different approaches (methodologies and weighting systems) to determine the impact associated with an activity. Two methods were chosen for our model CML2001 V2.0 – Australian toxicity factors and Eco-indicator 99. The rationale for using two methods instead of one is to be able to present relevant indicators covering all aspects of the LCA.
O N L I N E B I L L I N G L I F E C Y C L E A N A L Y S I S
Section 2 Methodology
Prepared for Telstra, 29 April 2008.
2-3
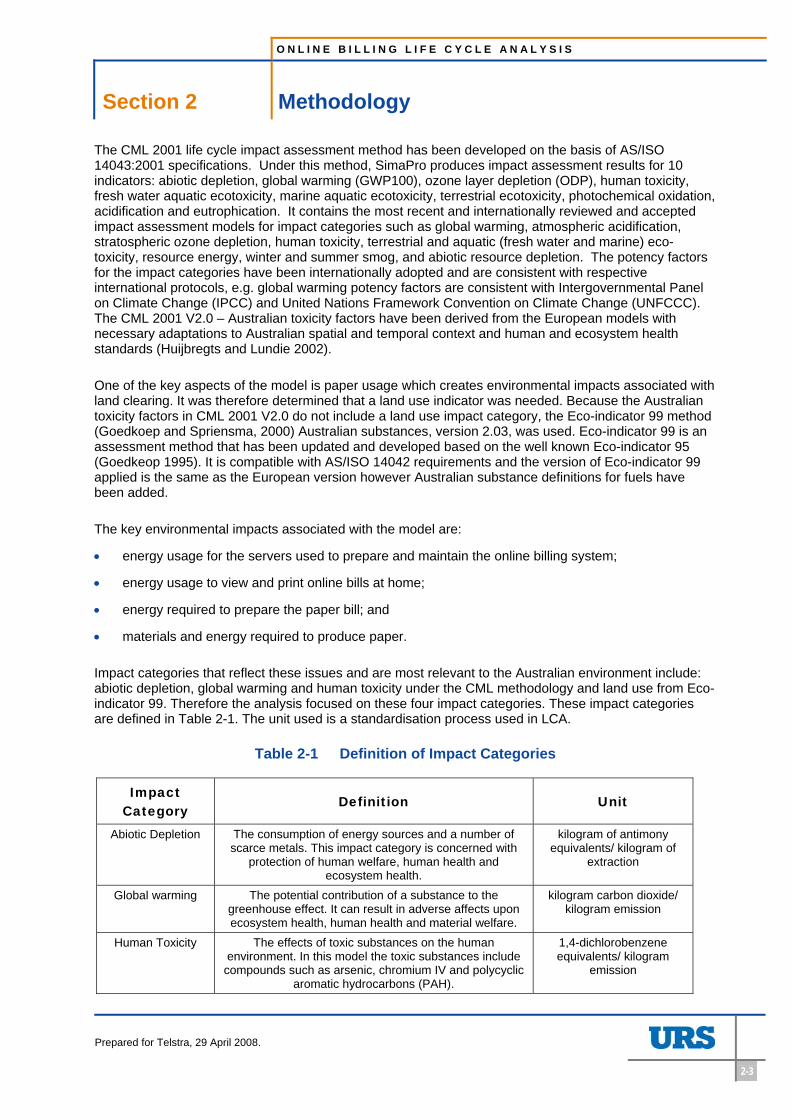
The CML 2001 life cycle impact assessment method has been developed on the basis of AS/ISO 14043:2001 specifications. Under this method, SimaPro produces impact assessment results for 10 indicators: abiotic depletion, global warming (GWP100), ozone layer depletion (ODP), human toxicity, fresh water aquatic ecotoxicity, marine aquatic ecotoxicity, terrestrial ecotoxicity, photochemical oxidation, acidification and eutrophication. It contains the most recent and internationally reviewed and accepted impact assessment models for impact categories such as global warming, atmospheric acidification, stratospheric ozone depletion, human toxicity, terrestrial and aquatic (fresh water and marine) eco-toxicity, resource energy, winter and summer smog, and abiotic resource depletion. The potency factors for the impact categories have been internationally adopted and are consistent with respective international protocols, e.g. global warming potency factors are consistent with Intergovernmental Panel on Climate Change (IPCC) and United Nations Framework Convention on Climate Change (UNFCCC). The CML 2001 V2.0 – Australian toxicity factors have been derived from the European models with necessary adaptations to Australian spatial and temporal context and human and ecosystem health standards (Huijbregts and Lundie 2002).
One of the key aspects of the model is paper usage which creates environmental impacts associated with land clearing. It was therefore determined that a land use indicator was needed. Because the Australian toxicity factors in CML 2001 V2.0 do not include a land use impact category, the Eco-indicator 99 method (Goedkoep and Spriensma, 2000) Australian substances, version 2.03, was used. Eco-indicator 99 is an assessment method that has been updated and developed based on the well known Eco-indicator 95 (Goedkeop 1995). It is compatible with AS/ISO 14042 requirements and the version of Eco-indicator 99 applied is the same as the European version however Australian substance definitions for fuels have been added.
The key environmental impacts associated with the model are:
• energy usage for the servers used to prepare and maintain the online billing system;
• energy usage to view and print online bills at home;
• energy required to prepare the paper bill; and
• materials and energy required to produce paper.
Impact categories that reflect these issues and are most relevant to the Australian environment include: abiotic depletion, global warming and human toxicity under the CML methodology and land use from Eco-indicator 99. Therefore the analysis focused on these four impact categories. These impact categories are defined in Table 2-1. The unit used is a standardisation process used in LCA.
Table 2-1 Definition of Impact Categories
Impact Category
Definition Unit
Abiotic Depletion The consumption of energy sources and a number of scarce metals. This impact category is concerned with
protection of human welfare, human health and ecosystem health.
kilogram of antimony equivalents/ kilogram of
extraction
Global warming The potential contribution of a substance to the greenhouse effect. It can result in adverse affects upon ecosystem health, human health and material welfare.
kilogram carbon dioxide/ kilogram emission
Human Toxicity The effects of toxic substances on the human environment. In this model the toxic substances include
compounds such as arsenic, chromium IV and polycyclic aromatic hydrocarbons (PAH).
1,4-dichlorobenzene equivalents/ kilogram
emission
O N L I N E B I L L I N G L I F E C Y C L E A N A L Y S I S
Section 2 Methodology
Prepared for Telstra, 29 April 2008.
2-4
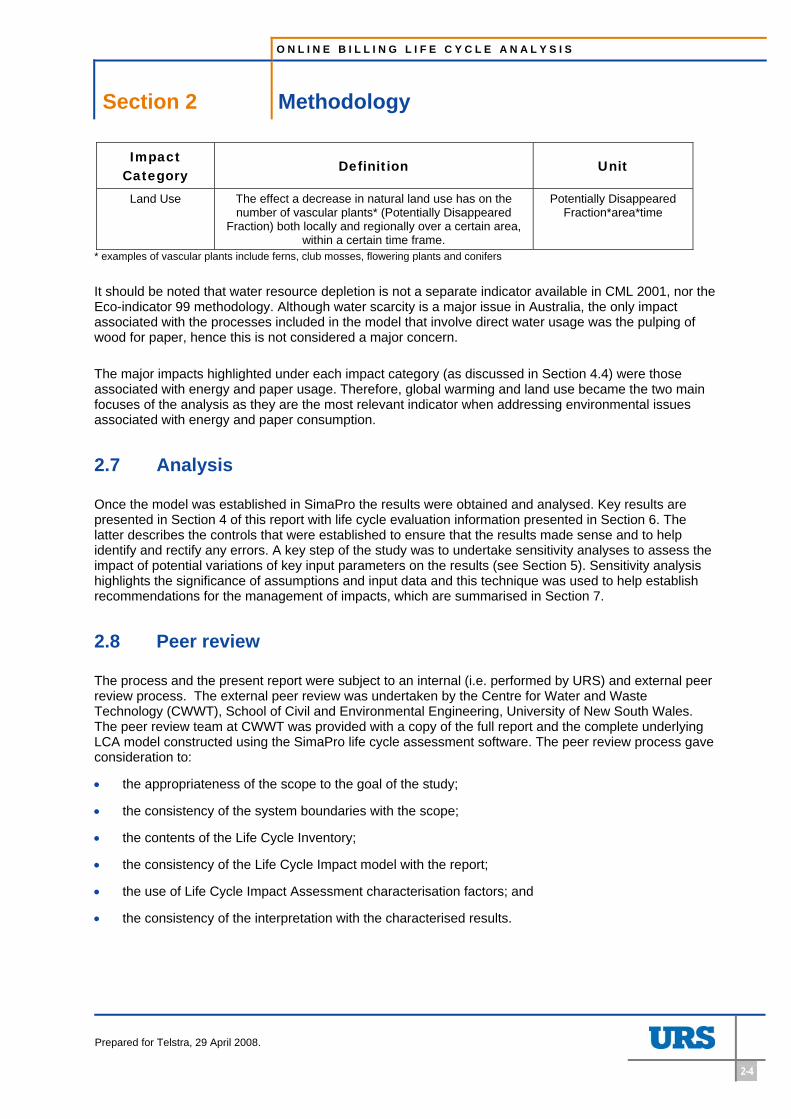
Impact Category
Definition Unit
Land Use The effect a decrease in natural land use has on the number of vascular plants* (Potentially Disappeared
Fraction) both locally and regionally over a certain area, within a certain time frame.
Potentially Disappeared Fraction*area*time
* examples of vascular plants include ferns, club mosses, flowering plants and conifers
It should be noted that water resource depletion is not a separate indicator available in CML 2001, nor the Eco-indicator 99 methodology. Although water scarcity is a major issue in Australia, the only impact associated with the processes included in the model that involve direct water usage was the pulping of wood for paper, hence this is not considered a major concern.
The major impacts highlighted under each impact category (as discussed in Section 4.4) were those associated with energy and paper usage. Therefore, global warming and land use became the two main focuses of the analysis as they are the most relevant indicator when addressing environmental issues associated with energy and paper consumption.
2.7 Analysis
Once the model was established in SimaPro the results were obtained and analysed. Key results are presented in Section 4 of this report with life cycle evaluation information presented in Section 6. The latter describes the controls that were established to ensure that the results made sense and to help identify and rectify any errors. A key step of the study was to undertake sensitivity analyses to assess the impact of potential variations of key input parameters on the results (see Section 5). Sensitivity analysis highlights the significance of assumptions and input data and this technique was used to help establish recommendations for the management of impacts, which are summarised in Section 7.
2.8 Peer review
The process and the present report were subject to an internal (i.e. performed by URS) and external peer review process. The external peer review was undertaken by the Centre for Water and Waste Technology (CWWT), School of Civil and Environmental Engineering, University of New South Wales. The peer review team at CWWT was provided with a copy of the full report and the complete underlying LCA model constructed using the SimaPro life cycle assessment software. The peer review process gave consideration to:
• the appropriateness of the scope to the goal of the study;
• the consistency of the system boundaries with the scope;
• the contents of the Life Cycle Inventory;
• the consistency of the Life Cycle Impact model with the report;
• the use of Life Cycle Impact Assessment characterisation factors; and
• the consistency of the interpretation with the characterised results.
O N L I N E B I L L I N G L I F E C Y C L E A N A L Y S I S
Section 2 Methodology
Prepared for Telstra, 29 April 2008.
2-5
The Peer Review report is presented in Appendix C. Most Peer Review comments were adopted and this report is an amended version taking into account the points made in the review. Appendix C also presents a summary table of how the comments have been taken into account or of the response to the comments when they have not been pursued.
O N L I N E B I L L I N G L I F E C Y C L E A N A L Y S I S
Section 3 Life Cycle Inventory
Prepared for Telstra, 29 April 2008
3-1
3 Life Cycle Inventory
The life cycle inventory analysis of online billing and paper billing involved collecting and collating information regarding customer numbers, billing information, the different pieces of equipment utilised and resources consumed for identified components and processes. This required assumptions to be made as presented in this section. The processes were then aggregated into appropriate product stages and consolidated to produce life cycle results.
The inventory data and key assumptions are presented under four key areas: customer and bill numbers; bill production impacts (direct and indirect); bill distribution impacts and customer impacts, for both online billing and paper billing.
3.1 Online billing
3.1.1 Customer and bill numbers
There are four major categories of customers who receive online bills:
• Individual consumers – an individual or family who has a service provided by Telstra.
• Small Medium Enterprises (SME) – small to medium size businesses that use one or more Telstra services for business communication.
• Enterprise and Government – large business/ government organisations that use one or more Telstra services for business communication.
• Wholesale – telecommunication service providers who use a proportion of Telstra’s network to on-sell communication products to customers external to Telstra.
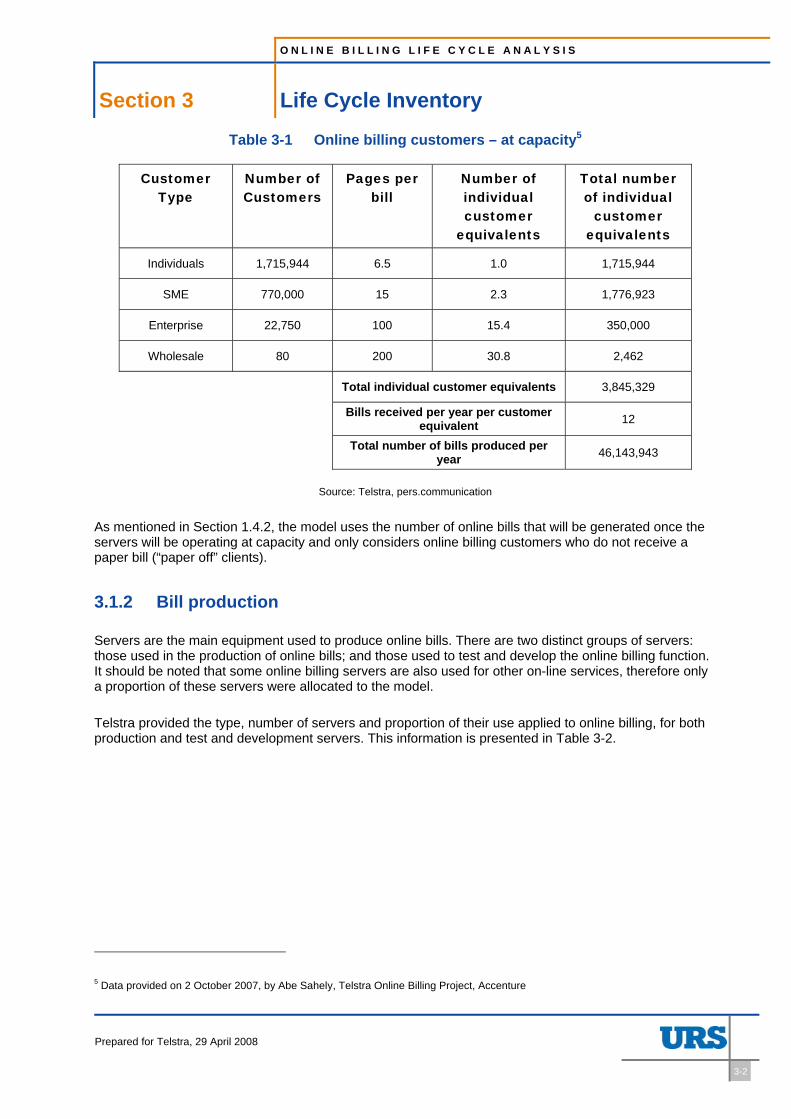
Table 3-1 highlights the number of customers under each type expected to receive online bills when the online billing servers are operating at capacity. All customer numbers have been adjusted to equate to individual customer equivalents. This adjustment has been based on the number of pages received per bill by the different types of customer, for example SMEs on average receive bills 15 pages long and therefore represent 2.3 individual customers equivalent as individual customers only receive 6.5 pages per bill. This approach provides us with a common unit across all customer types which allows a consolidation of the number of bills being produced. The total number of bills is used to apportion the impacts associated with online billing and therefore allows the determination of the impact of one standard online bill. This allows a comparison between the impacts associated with producing one on-line bill with one paper bill.
O N L I N E B I L L I N G L I F E C Y C L E A N A L Y S I S
Section 3 Life Cycle Inventory
Prepared for Telstra, 29 April 2008
3-2
Table 3-1 Online billing customers – at capacity5
Customer Type
Number of Customers
Pages per bill
Number of individual customer
equivalents
Total number of individual
customer equivalents
Individuals 1,715,944 6.5 1.0 1,715,944
SME 770,000 15 2.3 1,776,923
Enterprise 22,750 100 15.4 350,000
Wholesale 80 200 30.8 2,462
Total individual customer equivalents 3,845,329
Bills received per year per customer equivalent 12
Total number of bills produced per year 46,143,943
Source: Telstra, pers.communication
As mentioned in Section 1.4.2, the model uses the number of online bills that will be generated once the servers will be operating at capacity and only considers online billing customers who do not receive a paper bill (“paper off” clients).
3.1.2 Bill production
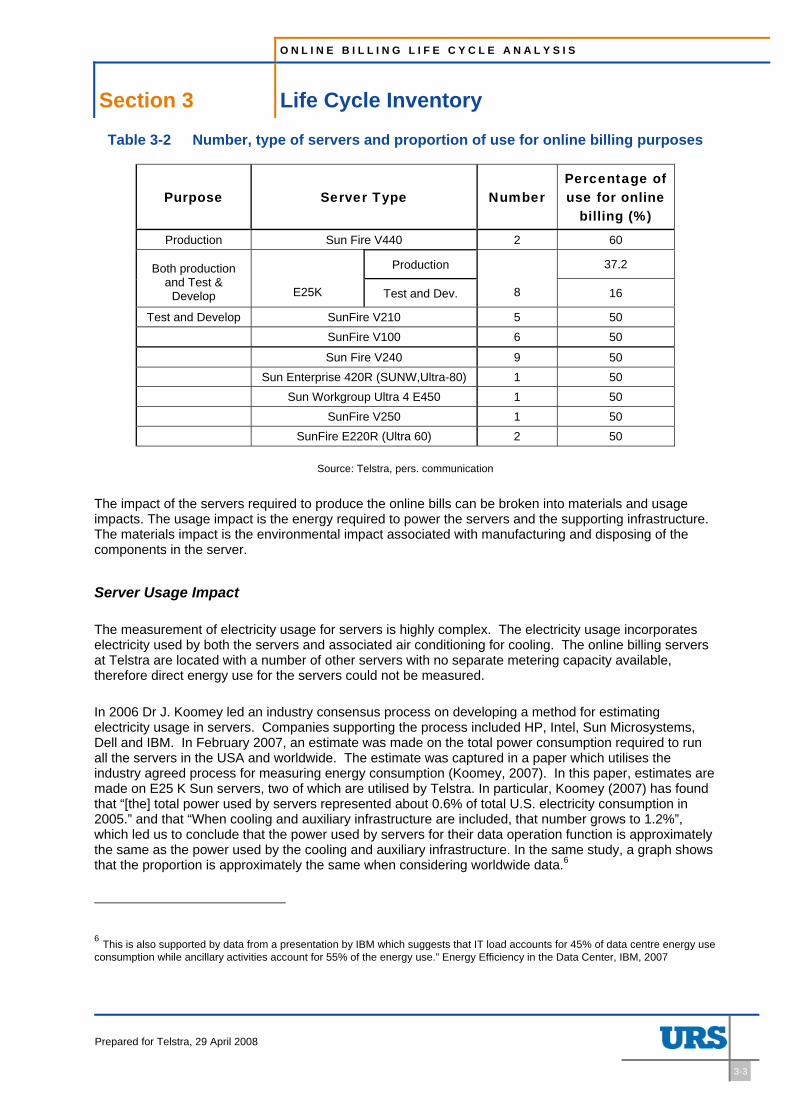
Servers are the main equipment used to produce online bills. There are two distinct groups of servers: those used in the production of online bills; and those used to test and develop the online billing function. It should be noted that some online billing servers are also used for other on-line services, therefore only a proportion of these servers were allocated to the model.
Telstra provided the type, number of servers and proportion of their use applied to online billing, for both production and test and development servers. This information is presented in Table 3-2.
5 Data provided on 2 October 2007, by Abe Sahely, Telstra Online Billing Project, Accenture
O N L I N E B I L L I N G L I F E C Y C L E A N A L Y S I S
Section 3 Life Cycle Inventory
Prepared for Telstra, 29 April 2008
3-3
Table 3-2 Number, type of servers and proportion of use for online billing purposes
Purpose Server Type Number Percentage of use for online
billing (%)
Production Sun Fire V440 2 60
Production 37.2 Both production and Test &
Develop E25K Test and Dev. 8 16
Test and Develop SunFire V210 5 50 SunFire V100 6 50
Sun Fire V240 9 50 Sun Enterprise 420R (SUNW,Ultra-80) 1 50 Sun Workgroup Ultra 4 E450 1 50 SunFire V250 1 50 SunFire E220R (Ultra 60) 2 50
Source: Telstra, pers. communication
The impact of the servers required to produce the online bills can be broken into materials and usage impacts. The usage impact is the energy required to power the servers and the supporting infrastructure. The materials impact is the environmental impact associated with manufacturing and disposing of the components in the server.
Server Usage Impact
The measurement of electricity usage for servers is highly complex. The electricity usage incorporates electricity used by both the servers and associated air conditioning for cooling. The online billing servers at Telstra are located with a number of other servers with no separate metering capacity available, therefore direct energy use for the servers could not be measured.
In 2006 Dr J. Koomey led an industry consensus process on developing a method for estimating electricity usage in servers. Companies supporting the process included HP, Intel, Sun Microsystems, Dell and IBM. In February 2007, an estimate was made on the total power consumption required to run all the servers in the USA and worldwide. The estimate was captured in a paper which utilises the industry agreed process for measuring energy consumption (Koomey, 2007). In this paper, estimates are made on E25 K Sun servers, two of which are utilised by Telstra. In particular, Koomey (2007) has found that “[the] total power used by servers represented about 0.6% of total U.S. electricity consumption in 2005.” and that “When cooling and auxiliary infrastructure are included, that number grows to 1.2%”, which led us to conclude that the power used by servers for their data operation function is approximately the same as the power used by the cooling and auxiliary infrastructure. In the same study, a graph shows that the proportion is approximately the same when considering worldwide data.6
6 This is also supported by data from a presentation by IBM which suggests that IT load accounts for 45% of data centre energy use consumption while ancillary activities account for 55% of the energy use.” Energy Efficiency in the Data Center, IBM, 2007
O N L I N E B I L L I N G L I F E C Y C L E A N A L Y S I S
Section 3 Life Cycle Inventory
Prepared for Telstra, 29 April 2008
3-4
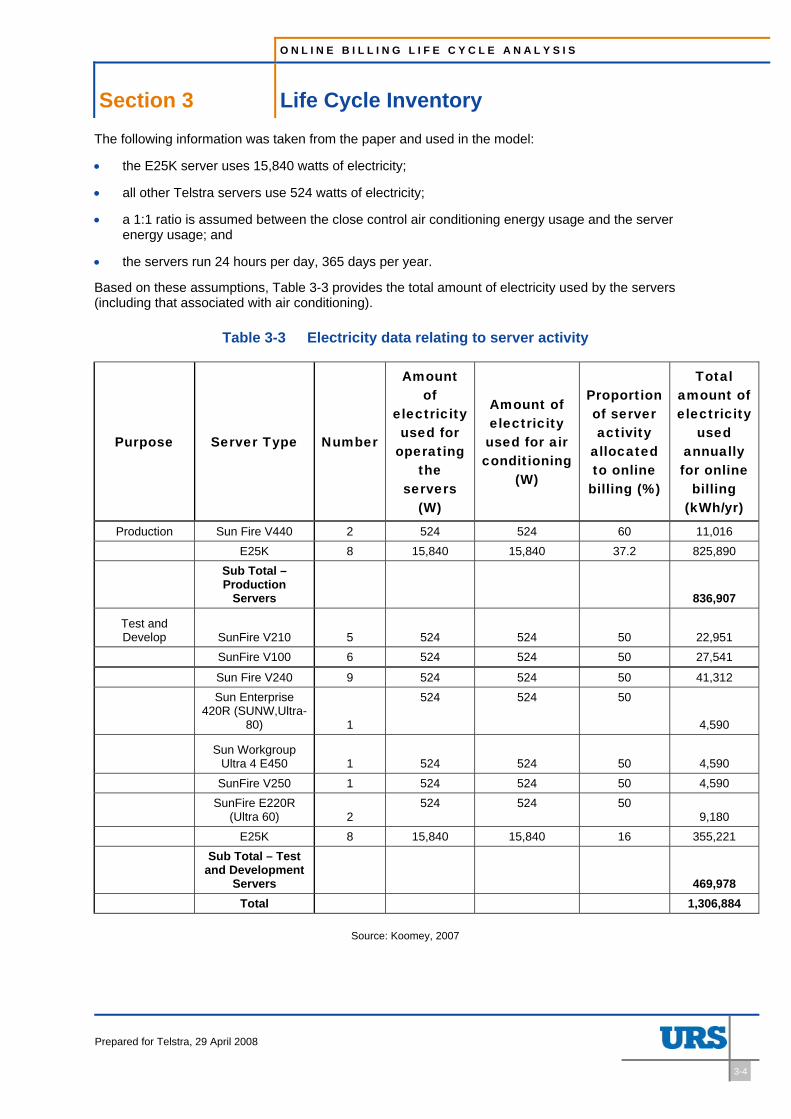
The following information was taken from the paper and used in the model:
• the E25K server uses 15,840 watts of electricity;
• all other Telstra servers use 524 watts of electricity;
• a 1:1 ratio is assumed between the close control air conditioning energy usage and the server energy usage; and
• the servers run 24 hours per day, 365 days per year.
Based on these assumptions, Table 3-3 provides the total amount of electricity used by the servers (including that associated with air conditioning).
Table 3-3 Electricity data relating to server activity
Purpose Server Type Number
Amount of
electricity used for
operating the
servers (W)
Amount of electricity used for air conditioning
(W)
Proportion of server activity
allocated to online
billing (%)
Total amount of electricity
used annually for online
billing (kWh/yr)
Production Sun Fire V440 2 524 524 60 11,016 E25K 8 15,840 15,840 37.2 825,890
Sub Total – Production
Servers
836,907
Test and Develop SunFire V210 5
524
524
50 22,951
SunFire V100 6 524 524 50 27,541
Sun Fire V240 9 524 524 50 41,312
Sun Enterprise 420R (SUNW,Ultra-
80) 1
524 524 50
4,590
Sun Workgroup
Ultra 4 E450 1
524
524
50 4,590 SunFire V250 1 524 524 50 4,590
SunFire E220R
(Ultra 60) 2 524 524 50
9,180 E25K 8 15,840 15,840 16 355,221
Sub Total – Test and Development
Servers
469,978 Total 1,306,884
Source: Koomey, 2007
O N L I N E B I L L I N G L I F E C Y C L E A N A L Y S I S
Section 3 Life Cycle Inventory
Prepared for Telstra, 29 April 2008
3-5
Server materials impact
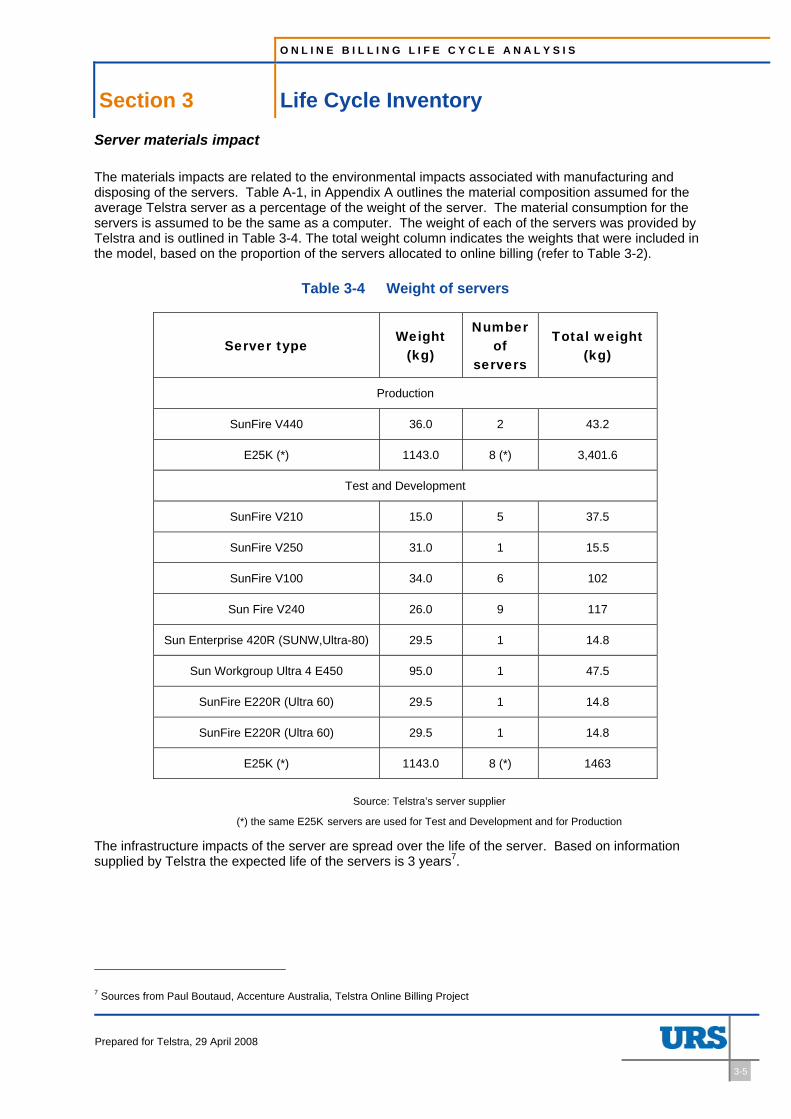
The materials impacts are related to the environmental impacts associated with manufacturing and disposing of the servers. Table A-1, in Appendix A outlines the material composition assumed for the average Telstra server as a percentage of the weight of the server. The material consumption for the servers is assumed to be the same as a computer. The weight of each of the servers was provided by Telstra and is outlined in Table 3-4. The total weight column indicates the weights that were included in the model, based on the proportion of the servers allocated to online billing (refer to Table 3-2).
Table 3-4 Weight of servers
Server type Weight
(kg)
Number of
servers
Total weight (kg)
Production
SunFire V440 36.0 2 43.2
E25K (*) 1143.0 8 (*) 3,401.6
Test and Development
SunFire V210 15.0 5 37.5
SunFire V250 31.0 1 15.5
SunFire V100 34.0 6 102
Sun Fire V240 26.0 9 117
Sun Enterprise 420R (SUNW,Ultra-80) 29.5 1 14.8
Sun Workgroup Ultra 4 E450 95.0 1 47.5
SunFire E220R (Ultra 60) 29.5 1 14.8
SunFire E220R (Ultra 60) 29.5 1 14.8
E25K (*) 1143.0 8 (*) 1463
Source: Telstra’s server supplier
(*) the same E25K servers are used for Test and Development and for Production
The infrastructure impacts of the server are spread over the life of the server. Based on information supplied by Telstra the expected life of the servers is 3 years7.
7 Sources from Paul Boutaud, Accenture Australia, Telstra Online Billing Project
O N L I N E B I L L I N G L I F E C Y C L E A N A L Y S I S
Section 3 Life Cycle Inventory
Prepared for Telstra, 29 April 2008
3-6
Employee Energy Usage
In addition to the energy used by the server, it is estimated that 14 staff are required to run the production and test and development servers8. The average Telstra office annually consumes 246 kWh of electricity per m2 of office space and 0.075 GJ of gas per m2 of office space (Telstra, pers. communication). The average office space per person is 12.5 m2. Therefore 43,050 kWh9 of electricity and 13 GJ of gas per annum correspond to the direct environmental impacts of the staff required to operate and maintain the servers.
Considering all the data in Table 3-2, 47.3% of server capacity was associated with online billing. We used this factor to allocate to the model a fraction the total electricity and gas demands caused by the employment of the server staff. The fractions were 20,363 kWh electricity and 6 GJ gas respectively.
3.1.3 Bill distribution
The impact associated with transmitting the bill from Telstra’s servers to the customer’s computer on the telecommunication network is considered negligible and therefore is not included in the model.
3.1.4 Customer impact
Viewing online bills
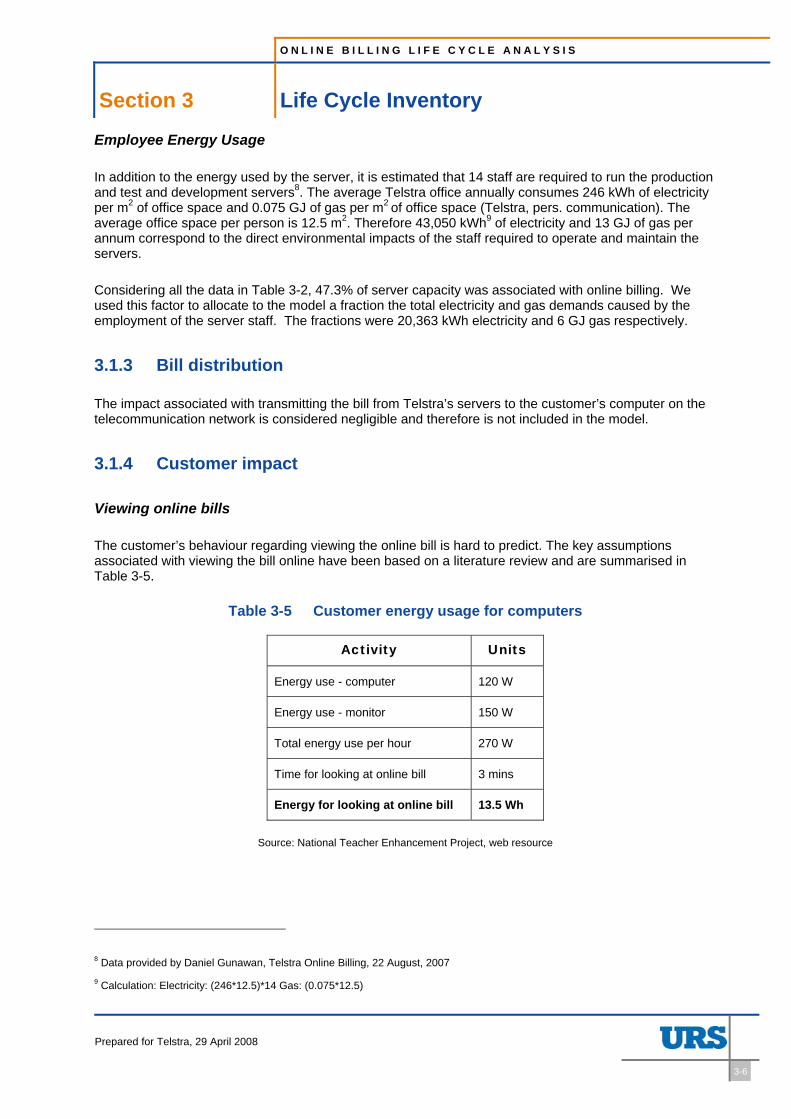
The customer’s behaviour regarding viewing the online bill is hard to predict. The key assumptions associated with viewing the bill online have been based on a literature review and are summarised in Table 3-5.
Table 3-5 Customer energy usage for computers
Activity Units
Energy use - computer 120 W
Energy use - monitor 150 W
Total energy use per hour 270 W
Time for looking at online bill 3 mins
Energy for looking at online bill 13.5 Wh
Source: National Teacher Enhancement Project, web resource
8 Data provided by Daniel Gunawan, Telstra Online Billing, 22 August, 2007 9 Calculation: Electricity: (246*12.5)*14 Gas: (0.075*12.5)
O N L I N E B I L L I N G L I F E C Y C L E A N A L Y S I S
Section 3 Life Cycle Inventory
Prepared for Telstra, 29 April 2008
3-7
Printing online bills
It is assumed that approximately 50% of online billing customers will print their bill to retain a copy. As confidence in the online billing system increases it is anticipated that the number of consumers printing their bill will decrease. Like other key assumptions, this assumption has been tested in the sensitivity analysis.
The other assumptions associated with customers printing their online bill include:
• the energy required to print a bill is 18Wh/bill (Canon);
• 50% of printed online bills are recycled, 50% are sent to landfill10; and
• the distance from the customers’ residence to the landfill or the recycling centre is 50 km (Grant et al, 2001).
The storage of the electronic or printed bill by the customer is assumed to have no significant environmental impact and has therefore not been included in the model.
3.2 Paper billing
3.2.1 Customer and bill numbers
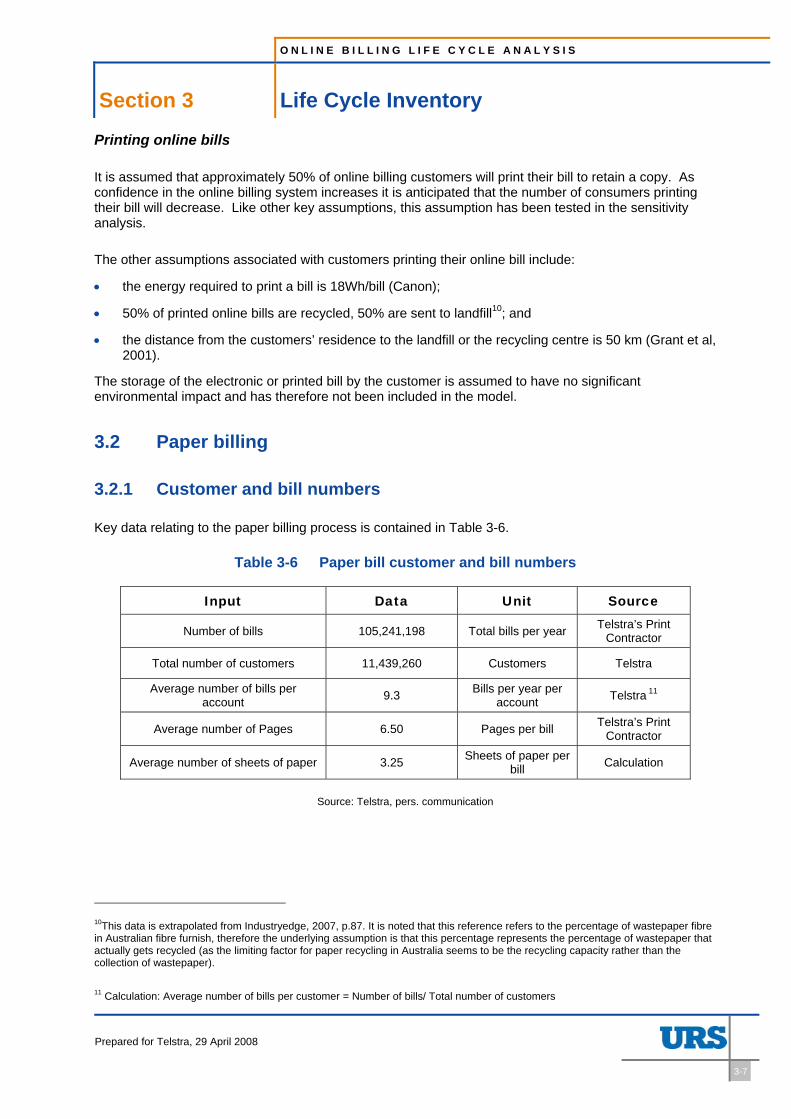
Key data relating to the paper billing process is contained in Table 3-6.
Table 3-6 Paper bill customer and bill numbers
Input Data Unit Source
Number of bills 105,241,198 Total bills per year Telstra’s Print Contractor
Total number of customers 11,439,260 Customers Telstra
Average number of bills per account 9.3 Bills per year per
account Telstra 11
Average number of Pages 6.50 Pages per bill Telstra’s Print Contractor
Average number of sheets of paper 3.25 Sheets of paper per bill Calculation
Source: Telstra, pers. communication
10This data is extrapolated from Industryedge, 2007, p.87. It is noted that this reference refers to the percentage of wastepaper fibre in Australian fibre furnish, therefore the underlying assumption is that this percentage represents the percentage of wastepaper that actually gets recycled (as the limiting factor for paper recycling in Australia seems to be the recycling capacity rather than the collection of wastepaper).
11 Calculation: Average number of bills per customer = Number of bills/ Total number of customers
O N L I N E B I L L I N G L I F E C Y C L E A N A L Y S I S
Section 3 Life Cycle Inventory
Prepared for Telstra, 29 April 2008
3-8
3.2.2 Bill production
The key activities associated with the bill production process that are unique to the paper billing process occur at Telstra’s print contractor and include receiving the billing data, printing the bills, placing each bill in an envelope and sorting the envelopes.
Where possible the information included in this section was provided by Telstra’s print contractor via Telstra, in some instances assumptions were made and are highlighted below along with the key data collected.
Paper
Paper assumptions include:
• the bill paper is sourced from Australian Paper Mills and does not contain any recycled material;
• on average paper is transported 857 km from Australian Paper Mills to Telstra’s Print Contractor12;
• the bill paper weighs 5.0 g per sheet13;
• the envelope paper weighs 4.6 g14; and
• the envelope paper contains 60% recycled paper and 40% non-recycled paper;
As per Table 3-6, each bill consumes 6.5 pages or 3.25 sheets of paper on average. This figure includes any miss-feeds and miss-prints. The average customer therefore is delivered 29.9 sheets of paper and 9.2 envelopes per year. Consequently, a total of approximately 342 million sheets of paper were used for Telstra’s billing process in 2006.
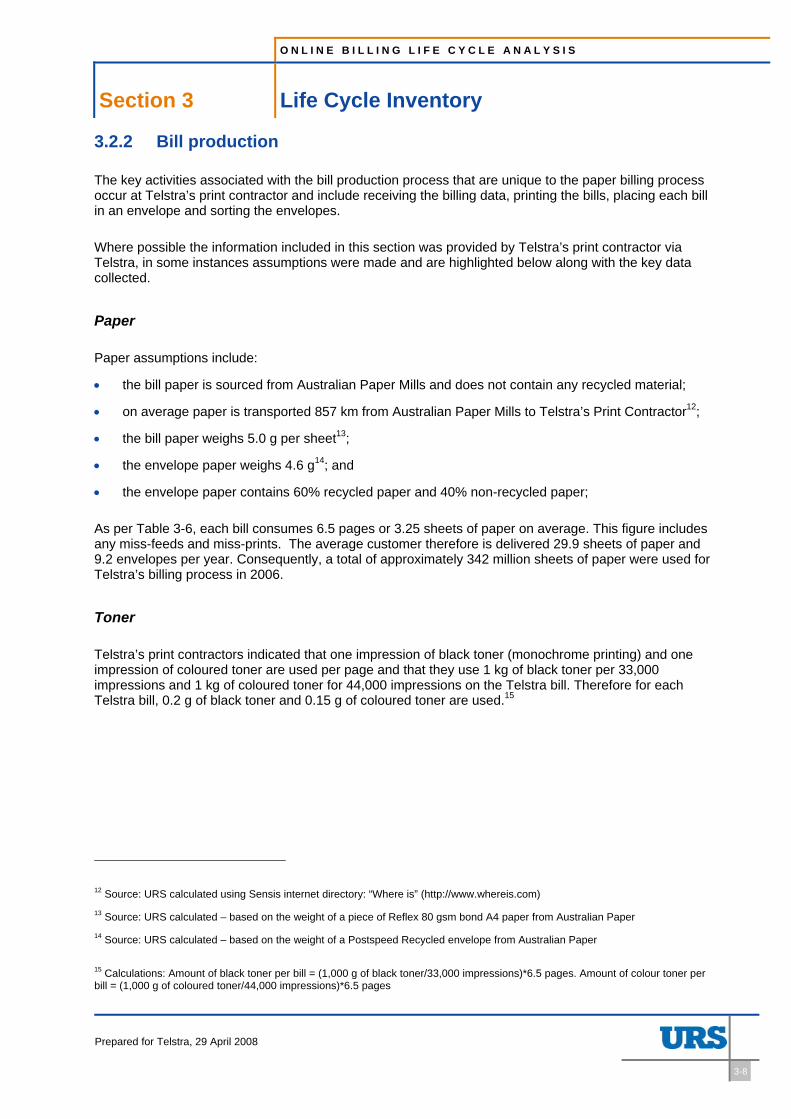
Toner
Telstra’s print contractors indicated that one impression of black toner (monochrome printing) and one impression of coloured toner are used per page and that they use 1 kg of black toner per 33,000 impressions and 1 kg of coloured toner for 44,000 impressions on the Telstra bill. Therefore for each Telstra bill, 0.2 g of black toner and 0.15 g of coloured toner are used.15
12 Source: URS calculated using Sensis internet directory: “Where is” (http://www.whereis.com) 13 Source: URS calculated – based on the weight of a piece of Reflex 80 gsm bond A4 paper from Australian Paper 14 Source: URS calculated – based on the weight of a Postspeed Recycled envelope from Australian Paper
15 Calculations: Amount of black toner per bill = (1,000 g of black toner/33,000 impressions)*6.5 pages. Amount of colour toner per bill = (1,000 g of coloured toner/44,000 impressions)*6.5 pages
O N L I N E B I L L I N G L I F E C Y C L E A N A L Y S I S
Section 3 Life Cycle Inventory
Prepared for Telstra, 29 April 2008
3-9
Table 3-7 Toner contents
Ink Type Content Percentage Styrene/ butadiene
copolymer 78%
Iron Oxide Sulfate 17%
Monochrome Toner
Carbon black 5% Polyster resin 85%
Pigment 10% Colour Toner
Wax 5%
Source: Telstra’s print contractor, pers. communication
All toner cartridges are reused and therefore materials from the cartridge case have not been included in the model.
Energy
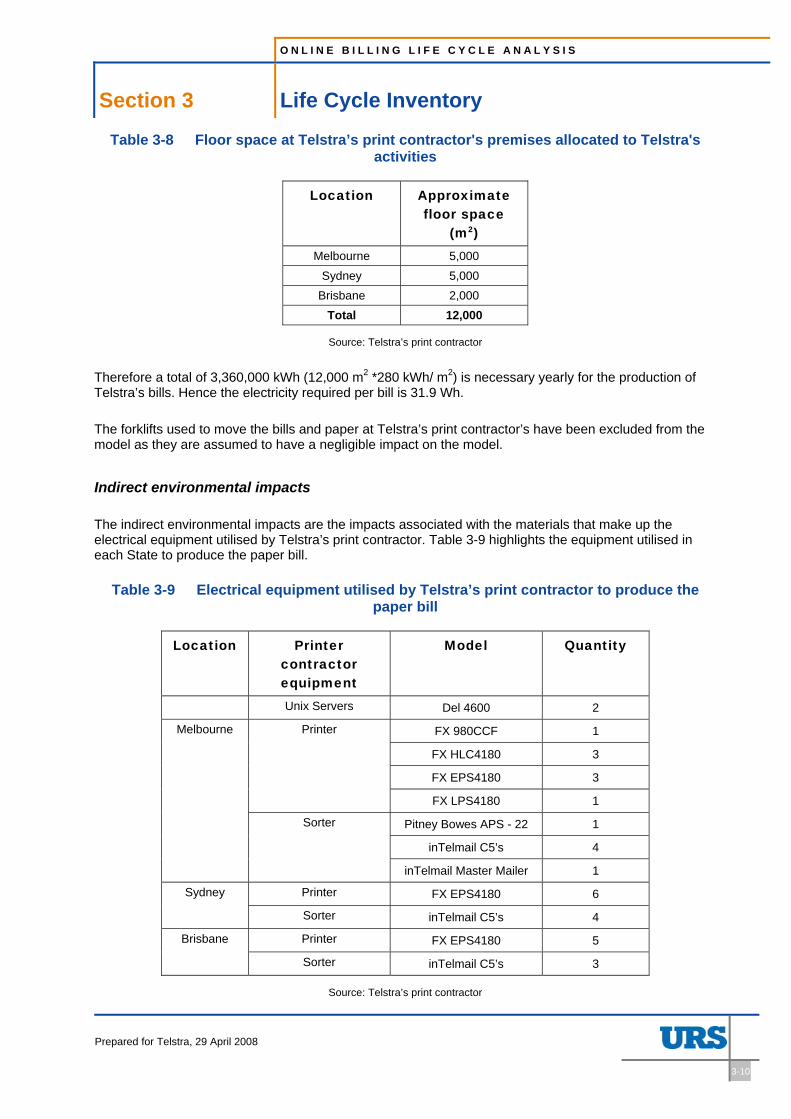
Telstra’s print contractor indicated that they require 280 kWh of energy per year per m2. This includes energy use for storage, printing, lighting, sundry equipment, air conditioning etc. The floor space dedicated to Telstra’s bill production is highlighted in Table 3-8.
O N L I N E B I L L I N G L I F E C Y C L E A N A L Y S I S
Section 3 Life Cycle Inventory
Prepared for Telstra, 29 April 2008
3-10
Table 3-8 Floor space at Telstra’s print contractor's premises allocated to Telstra's activities
Location Approximate floor space
(m2)
Melbourne 5,000 Sydney 5,000
Brisbane 2,000 Total 12,000
Source: Telstra’s print contractor
Therefore a total of 3,360,000 kWh (12,000 m2 *280 kWh/ m2) is necessary yearly for the production of Telstra’s bills. Hence the electricity required per bill is 31.9 Wh.
The forklifts used to move the bills and paper at Telstra’s print contractor’s have been excluded from the model as they are assumed to have a negligible impact on the model.
Indirect environmental impacts
The indirect environmental impacts are the impacts associated with the materials that make up the electrical equipment utilised by Telstra’s print contractor. Table 3-9 highlights the equipment utilised in each State to produce the paper bill.
Table 3-9 Electrical equipment utilised by Telstra’s print contractor to produce the paper bill
Location Printer contractor equipment
Model Quantity
Unix Servers Del 4600 2
FX 980CCF 1
FX HLC4180 3
FX EPS4180 3
Printer
FX LPS4180 1
Pitney Bowes APS - 22 1
inTelmail C5’s 4
Melbourne
Sorter
inTelmail Master Mailer 1
Printer FX EPS4180 6 Sydney
Sorter inTelmail C5’s 4
Printer FX EPS4180 5 Brisbane
Sorter inTelmail C5’s 3
Source: Telstra’s print contractor
O N L I N E B I L L I N G L I F E C Y C L E A N A L Y S I S
Section 3 Life Cycle Inventory
Prepared for Telstra, 29 April 2008
3-11
It has been assumed that the embodied materials in the printing and sorting equipment are the same as those making up a Printer Konica 7085, for which data was available (see Appendix A, Table A -2). For the model, the data was extrapolated based on the weight of the printers and sorters used by Telstra’s print contractor. It was assumed that the average weight of the sorters was 2,300 kg16 and the average weight of the printers was 1,538 kg17 .The Konica 7085 used weighs 325.5kg (Konica, 2002).
The materials embodied in the server were also built into the model, based on the material information provided in Table A-1. The weight of the Dell 4600 server is 10.4 kg (Dell) and Telstra’s print contractor noted that the server life was 5 years.
3.2.3 Bill distribution
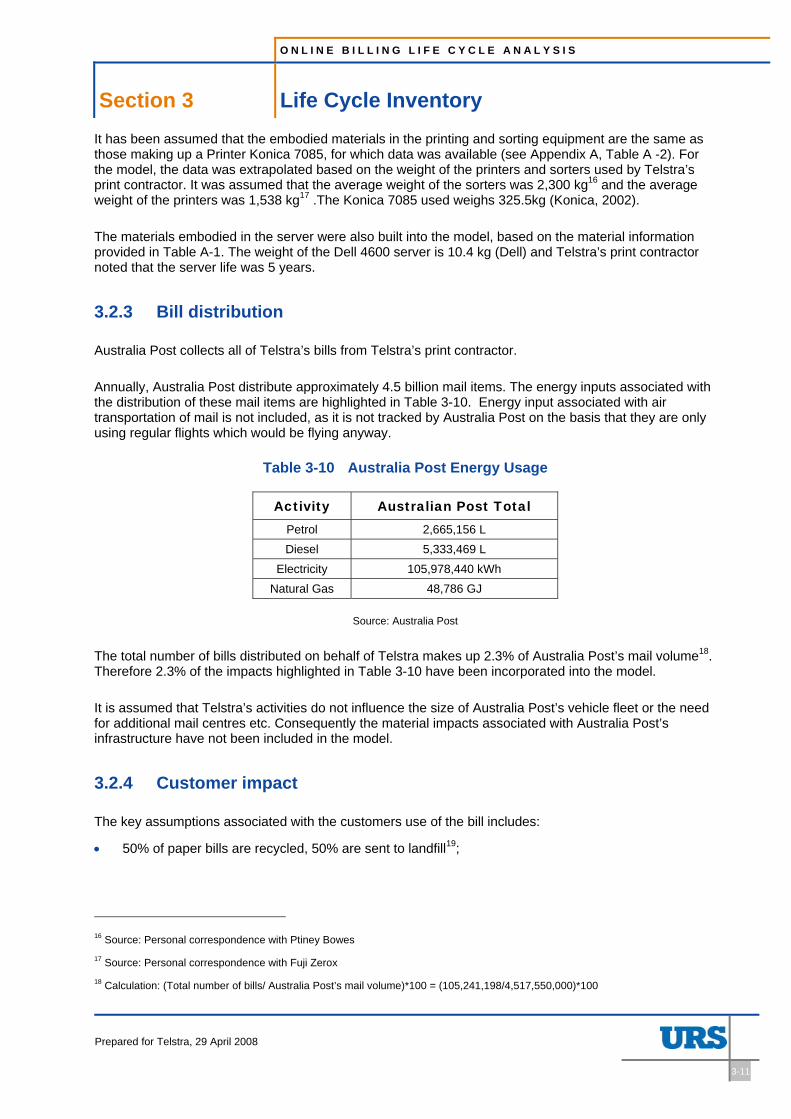
Australia Post collects all of Telstra’s bills from Telstra’s print contractor.
Annually, Australia Post distribute approximately 4.5 billion mail items. The energy inputs associated with the distribution of these mail items are highlighted in Table 3-10. Energy input associated with air transportation of mail is not included, as it is not tracked by Australia Post on the basis that they are only using regular flights which would be flying anyway.
Table 3-10 Australia Post Energy Usage
Activity Australian Post Total Petrol 2,665,156 L Diesel 5,333,469 L
Electricity 105,978,440 kWh Natural Gas 48,786 GJ
Source: Australia Post
The total number of bills distributed on behalf of Telstra makes up 2.3% of Australia Post’s mail volume18. Therefore 2.3% of the impacts highlighted in Table 3-10 have been incorporated into the model.
It is assumed that Telstra’s activities do not influence the size of Australia Post’s vehicle fleet or the need for additional mail centres etc. Consequently the material impacts associated with Australia Post’s infrastructure have not been included in the model.
3.2.4 Customer impact
The key assumptions associated with the customers use of the bill includes:
• 50% of paper bills are recycled, 50% are sent to landfill19;
16 Source: Personal correspondence with Ptiney Bowes 17 Source: Personal correspondence with Fuji Zerox 18 Calculation: (Total number of bills/ Australia Post’s mail volume)*100 = (105,241,198/4,517,550,000)*100
O N L I N E B I L L I N G L I F E C Y C L E A N A L Y S I S
Section 3 Life Cycle Inventory
Prepared for Telstra, 29 April 2008
3-12
• the distance from the customers residence to the landfill or recycling centre is 50 km (Grant et al, 2001); and
• the storage of the paper bill, by the customer is assumed to have no significant environmental impact.
3.3 Comparative life cycle inventory
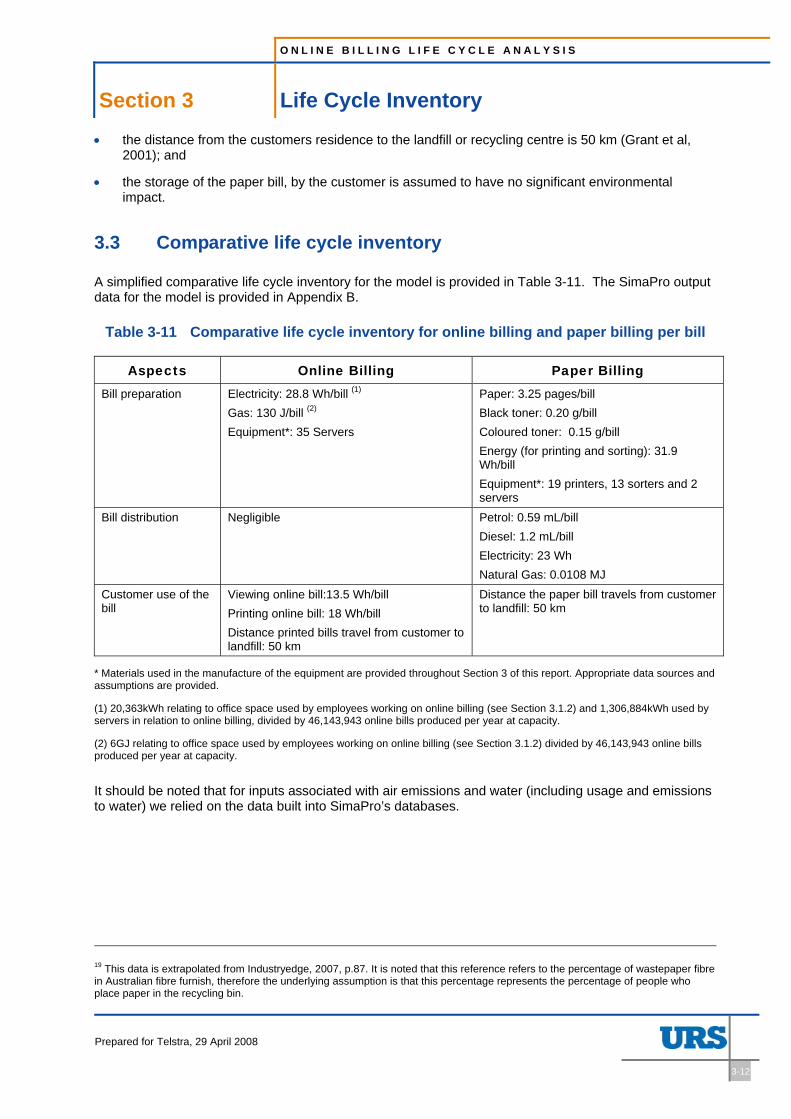
A simplified comparative life cycle inventory for the model is provided in Table 3-11. The SimaPro output data for the model is provided in Appendix B.
Table 3-11 Comparative life cycle inventory for online billing and paper billing per bill
Aspects Online Billing Paper Billing Bill preparation Electricity: 28.8 Wh/bill (1)
Gas: 130 J/bill (2) Equipment*: 35 Servers
Paper: 3.25 pages/bill Black toner: 0.20 g/bill Coloured toner: 0.15 g/bill Energy (for printing and sorting): 31.9 Wh/bill Equipment*: 19 printers, 13 sorters and 2 servers
Bill distribution Negligible Petrol: 0.59 mL/bill Diesel: 1.2 mL/bill Electricity: 23 Wh Natural Gas: 0.0108 MJ
Customer use of the bill
Viewing online bill:13.5 Wh/bill Printing online bill: 18 Wh/bill Distance printed bills travel from customer to landfill: 50 km
Distance the paper bill travels from customer to landfill: 50 km
* Materials used in the manufacture of the equipment are provided throughout Section 3 of this report. Appropriate data sources and assumptions are provided.
(1) 20,363kWh relating to office space used by employees working on online billing (see Section 3.1.2) and 1,306,884kWh used by servers in relation to online billing, divided by 46,143,943 online bills produced per year at capacity.
(2) 6GJ relating to office space used by employees working on online billing (see Section 3.1.2) divided by 46,143,943 online bills produced per year at capacity.
It should be noted that for inputs associated with air emissions and water (including usage and emissions to water) we relied on the data built into SimaPro’s databases.
19 This data is extrapolated from Industryedge, 2007, p.87. It is noted that this reference refers to the percentage of wastepaper fibre in Australian fibre furnish, therefore the underlying assumption is that this percentage represents the percentage of people who place paper in the recycling bin.
O N L I N E B I L L I N G L I F E C Y C L E A N A L Y S I S
Section 4 Life Cycle Impact Results
Prepared for Telstra, 29 April 2008.
4-1
4 Life Cycle Impact Results
4.1 Introduction
SimaPro offers the possibility to run a model using a range of standard impact assessment methods. As explained in Section 2.6, the methods chosen for the project were CML2001 V2.0 – Australian toxicity factors and Eco-indicator 99, Australian Substances, Version 2.03.
The key impacts being considered by the chosen model fall in three main classes:
• exhaustion of raw materials and energy;
• pollution; and
• ecosystem quality.
The indicators for these are specified below and are defined in Section 2.6:
• Exhaustion of raw materials and energy: Abiotic depletion
• Pollution: Global warming and Human toxicity
• Ecosystem quality: Land use
The reason these indicators have been chosen is explained in Section 2.6 of this report.
4.2 Indicator significance
To assess the relative importance of each impact indicator, three approaches are generally adopted by LCA practitioners.
• benchmarking life cycle impact category values for paper vs online billing from other similar LCA studies either Australian or International;
• comparing the life cycle impact category values on a regional or national scale. Drawbacks to this approach include significant gaps and uncertainty regarding data on the state of the national or regional environment; and
• comparing the life cycle impact category values for comparable environmental damage (5% destruction of native/pristine ecosystem) and/or human damage (Disabilities Adjusted Life Years). A potential drawback of this approach is that it is inherently complex and there are uncertainties in estimating pathways and damage functions for a myriad of life cycle impact categories.
The higher the impact category values, the greater the harmful effects of those impacts, and therefore less environmentally preferable are those activities that cause those impacts.
A simpler way is to compare the impacts with other points of reference, such as the impact of well-known activities or product as is the case in Table 4-1. For example, the net abiotic depletion impact value of 0.1 g Sb equivalent, the difference between an online bill compared to a paper bill (Table 4-1) is approximately equal to the abiotic depletion impact associated with the petrol consumed by a car travelling 50 m. The human toxicity impact value of 32 g 1,4-DCB equivalent, the difference between an online bill compared to a paper bill (Table 4-1) is approximately equal to the human toxicity impact
O N L I N E B I L L I N G L I F E C Y C L E A N A L Y S I S
Section 4 Life Cycle Impact Results
Prepared for Telstra, 29 April 2008.
4-2
associated with growing 3 kg of Australian wheat20 or the life cycle impacts of the production of 70 mL of Australian larger beer.
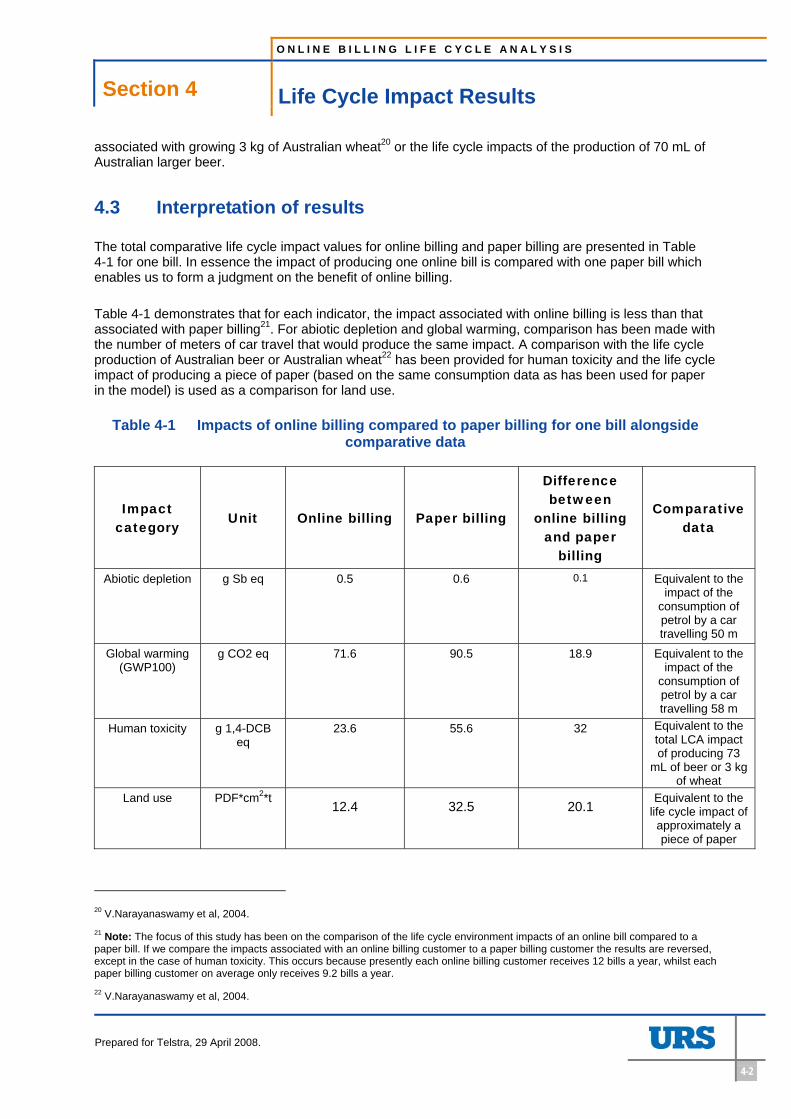
4.3 Interpretation of results
The total comparative life cycle impact values for online billing and paper billing are presented in Table 4-1 for one bill. In essence the impact of producing one online bill is compared with one paper bill which enables us to form a judgment on the benefit of online billing.
Table 4-1 demonstrates that for each indicator, the impact associated with online billing is less than that associated with paper billing21. For abiotic depletion and global warming, comparison has been made with the number of meters of car travel that would produce the same impact. A comparison with the life cycle production of Australian beer or Australian wheat22 has been provided for human toxicity and the life cycle impact of producing a piece of paper (based on the same consumption data as has been used for paper in the model) is used as a comparison for land use.
Table 4-1 Impacts of online billing compared to paper billing for one bill alongside comparative data
Impact category
Unit Online billing Paper billing
Difference between
online billing and paper
billing
Comparative data
Abiotic depletion g Sb eq 0.5 0.6 0.1 Equivalent to the impact of the
consumption of petrol by a car travelling 50 m
Global warming (GWP100)
g CO2 eq 71.6 90.5 18.9 Equivalent to the impact of the
consumption of petrol by a car travelling 58 m
Human toxicity g 1,4-DCB eq
23.6 55.6 32 Equivalent to the total LCA impact of producing 73
mL of beer or 3 kg of wheat
Land use PDF*cm2*t 12.4 32.5 20.1
Equivalent to the life cycle impact of
approximately a piece of paper
20 V.Narayanaswamy et al, 2004. 21 Note: The focus of this study has been on the comparison of the life cycle environment impacts of an online bill compared to a paper bill. If we compare the impacts associated with an online billing customer to a paper billing customer the results are reversed, except in the case of human toxicity. This occurs because presently each online billing customer receives 12 bills a year, whilst each paper billing customer on average only receives 9.2 bills a year. 22 V.Narayanaswamy et al, 2004.
O N L I N E B I L L I N G L I F E C Y C L E A N A L Y S I S
Section 4 Life Cycle Impact Results
Prepared for Telstra, 29 April 2008.
4-3
Some of the avoided impacts are fairly significant if we consider more than just one bill. For example, producing 1 million online bills compared to paper bills leads to avoiding the production of 18.9 tonnes of CO2 equivalent a year, which is equivalent to the amount of annual CO2 emissions produced by approximately 4 cars in Victoria23.
The pathway for each type of impact can be mapped out in a flow-chart produced by SimaPro, as shown in Figure 4-1 through to Figure 4-4 and can be used to help explain the results.
In Figure 4-1 through to Figure 4-4, the numbers associated with online billing are presented as negatives because it is a comparative model. In the model, paper billing impacts were subtracted from the impacts associated with online billing, which determines the overall difference between the impacts caused by the two scenarios. The number presented at the top of the flow chart is the overall difference. A positive number means that the impacts associated with paper billing are greater than those associated with online billing (as is the case in Figure 4-1) and a negative would mean the reverse. The thickness of the lines linking activities represents the contribution that activity makes to the overall impact.
In Figure 4-4 for land use it is noted that the waste scenario associated with recycling the paper bill and envelope is illustrated by two downward facing arrows flowing from the bill paper and envelope paper to recycling paper and board, and a solid line between recycling paper and board to unbleached craft pulp, which is unique to this figure. This occurs because when paper is recycled rather than sent to landfill the waste processing results in a useful by-product (recycled paper). The energy and material flows related to the recycled paper are regarded as an environmental benefit and are illustrated in the model by these unique features.
4.4 Contribution analysis
To assess the contribution of different activities to the overall result, graphs and tables from SimaPro were used. The key flow charts produced and used are found in Figure 4-1 through to Figure 4-4. The key data obtained is captured in Table 4-2. For each impact category, Table 4-2 shows the key contributing processes (including the size of the burden associated with that contributing process). The key processes for each contributor and the percentage of the contributor’s impact that the process represents. The key inventory data (i.e. data representing > 5% of the impact) and its percentage contribution for the key contributors is also shown in this table.
23 Sustainability Victoria – personal communication, date: 25 June 2007
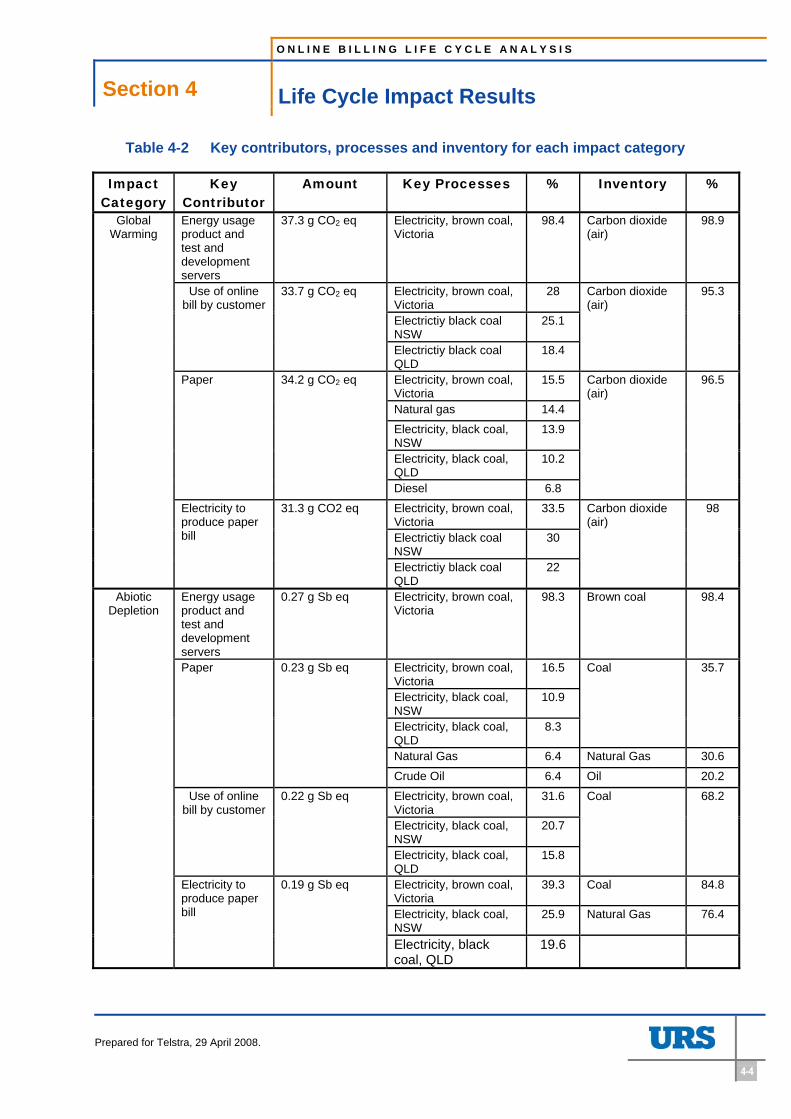
O N L I N E B I L L I N G L I F E C Y C L E A N A L Y S I S
Section 4 Life Cycle Impact Results
Prepared for Telstra, 29 April 2008.
4-4
Table 4-2 Key contributors, processes and inventory for each impact category
Impact Category
Key Contributor
Amount Key Processes % Inventory %
Energy usage product and test and development servers
37.3 g CO2 eq Electricity, brown coal, Victoria
98.4 Carbon dioxide (air)
98.9
Electricity, brown coal, Victoria
28
Electrictiy black coal NSW
25.1
Use of online bill by customer
33.7 g CO2 eq
Electrictiy black coal QLD
18.4
Carbon dioxide (air)
95.3
Electricity, brown coal, Victoria
15.5
Natural gas 14.4
Electricity, black coal, NSW
13.9
Electricity, black coal, QLD
10.2
Paper 34.2 g CO2 eq
Diesel 6.8
Carbon dioxide (air)
96.5
Electricity, brown coal, Victoria
33.5
Electrictiy black coal NSW
30
Global Warming
Electricity to produce paper bill
31.3 g CO2 eq
Electrictiy black coal QLD
22
Carbon dioxide (air)
98
Energy usage product and test and development servers
0.27 g Sb eq Electricity, brown coal, Victoria
98.3 Brown coal 98.4
Electricity, brown coal, Victoria
16.5
Electricity, black coal, NSW
10.9
Electricity, black coal, QLD
8.3
Coal 35.7
Natural Gas 6.4 Natural Gas 30.6
Paper 0.23 g Sb eq
Crude Oil 6.4 Oil 20.2
Electricity, brown coal, Victoria
31.6
Electricity, black coal, NSW
20.7
Use of online bill by customer
0.22 g Sb eq
Electricity, black coal, QLD
15.8
Coal 68.2
Electricity, brown coal, Victoria
39.3 Coal 84.8
Electricity, black coal, NSW
25.9 Natural Gas 76.4
Abiotic Depletion
Electricity to produce paper bill
0.19 g Sb eq
Electricity, black coal, QLD
19.6
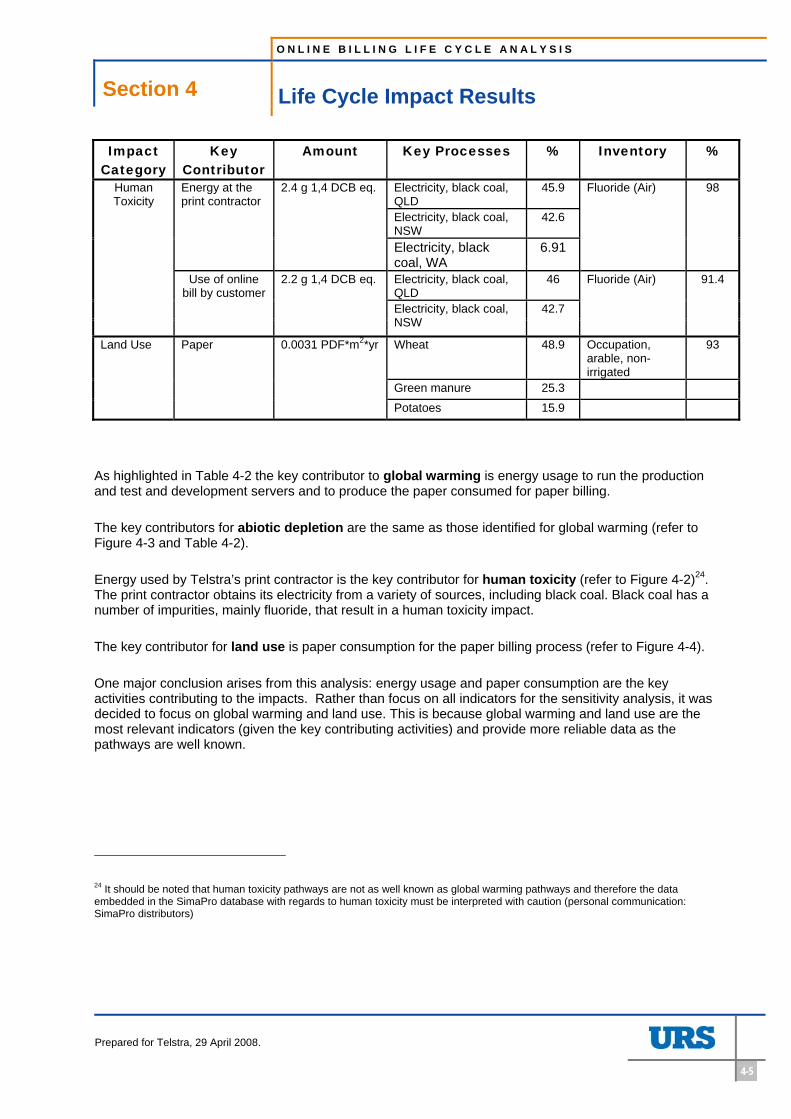
O N L I N E B I L L I N G L I F E C Y C L E A N A L Y S I S
Section 4 Life Cycle Impact Results
Prepared for Telstra, 29 April 2008.
4-5
Impact Category
Key Contributor
Amount Key Processes % Inventory %
Electricity, black coal, QLD
45.9
Electricity, black coal, NSW
42.6
Energy at the print contractor
2.4 g 1,4 DCB eq.
Electricity, black coal, WA
6.91
Fluoride (Air) 98
Electricity, black coal, QLD
46
Human Toxicity
Use of online bill by customer
2.2 g 1,4 DCB eq.
Electricity, black coal, NSW
42.7
Fluoride (Air) 91.4
Wheat 48.9 Occupation, arable, non-irrigated
93
Green manure 25.3
Land Use Paper 0.0031 PDF*m2*yr
Potatoes 15.9
As highlighted in Table 4-2 the key contributor to global warming is energy usage to run the production and test and development servers and to produce the paper consumed for paper billing.
The key contributors for abiotic depletion are the same as those identified for global warming (refer to Figure 4-3 and Table 4-2).
Energy used by Telstra’s print contractor is the key contributor for human toxicity (refer to Figure 4-2)24. The print contractor obtains its electricity from a variety of sources, including black coal. Black coal has a number of impurities, mainly fluoride, that result in a human toxicity impact.
The key contributor for land use is paper consumption for the paper billing process (refer to Figure 4-4).
One major conclusion arises from this analysis: energy usage and paper consumption are the key activities contributing to the impacts. Rather than focus on all indicators for the sensitivity analysis, it was decided to focus on global warming and land use. This is because global warming and land use are the most relevant indicators (given the key contributing activities) and provide more reliable data as the pathways are well known.
24 It should be noted that human toxicity pathways are not as well known as global warming pathways and therefore the data embedded in the SimaPro database with regards to human toxicity must be interpreted with caution (personal communication: SimaPro distributors)
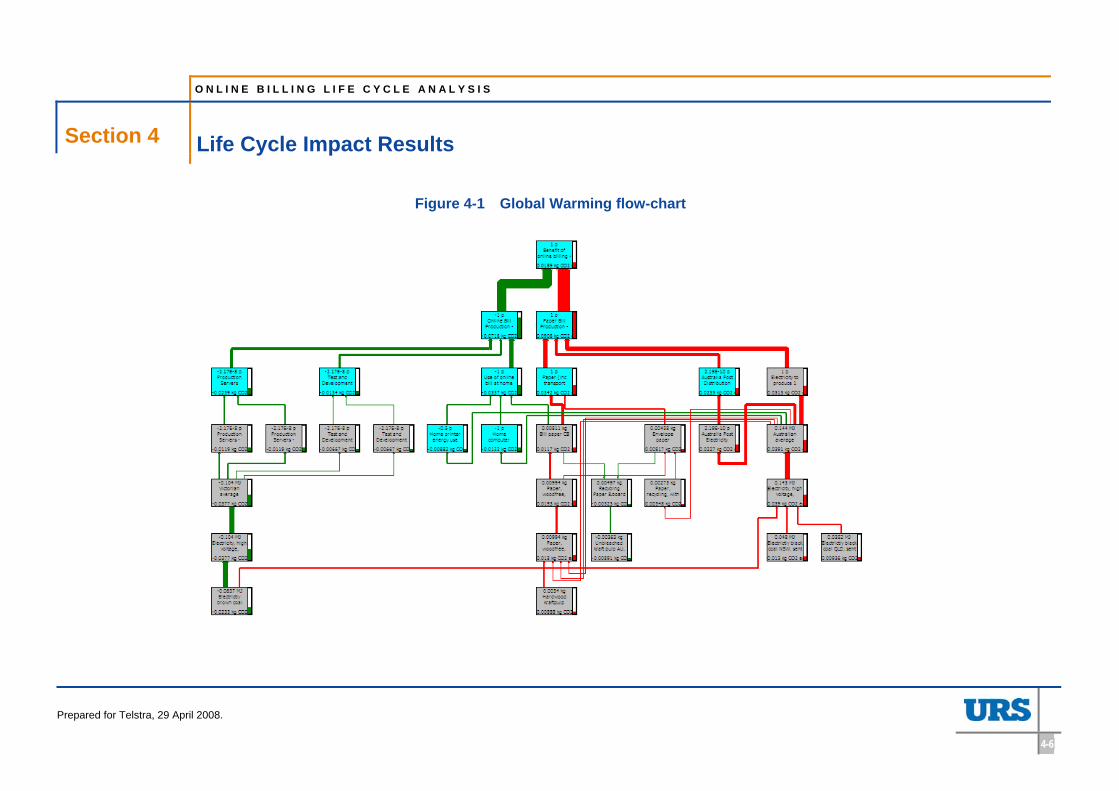
O N L I N E B I L L I N G L I F E C Y C L E A N A L Y S I S
Section 4 Life Cycle Impact Results
Prepared for Telstra, 29 April 2008.
4-6
Figure 4-1 Global Warming flow-chart
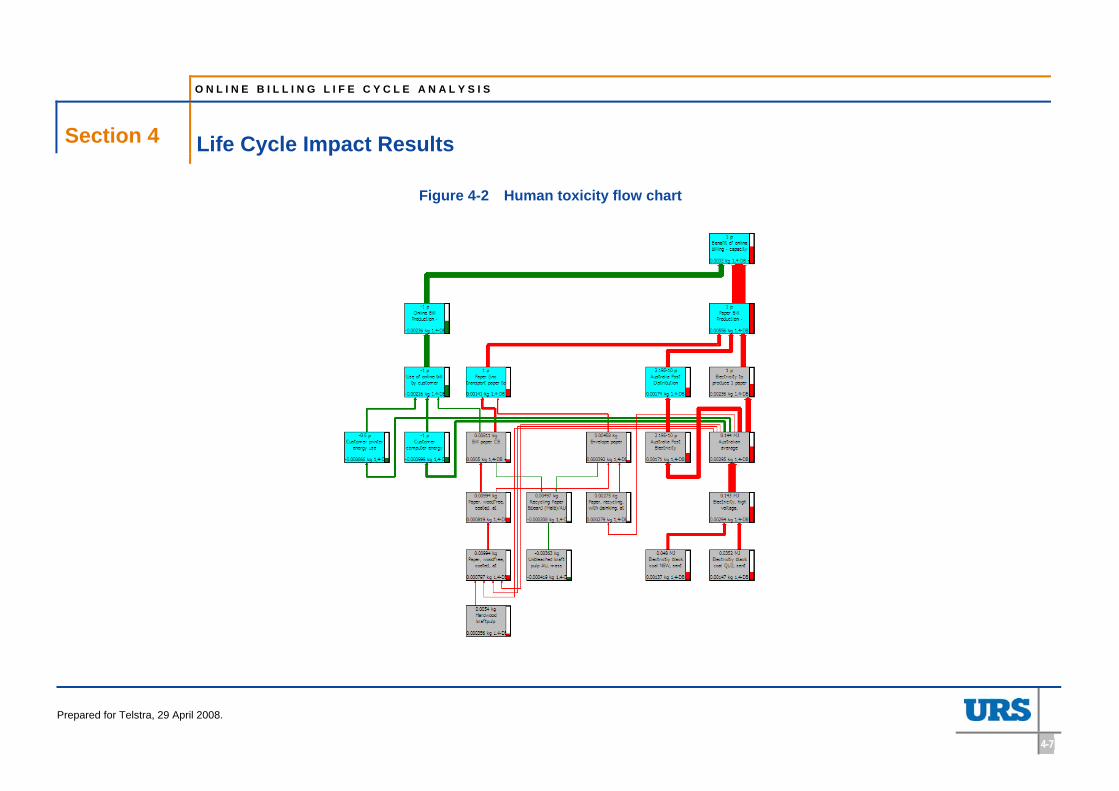
O N L I N E B I L L I N G L I F E C Y C L E A N A L Y S I S
Section 4 Life Cycle Impact Results
Prepared for Telstra, 29 April 2008.
4-7
Figure 4-2 Human toxicity flow chart
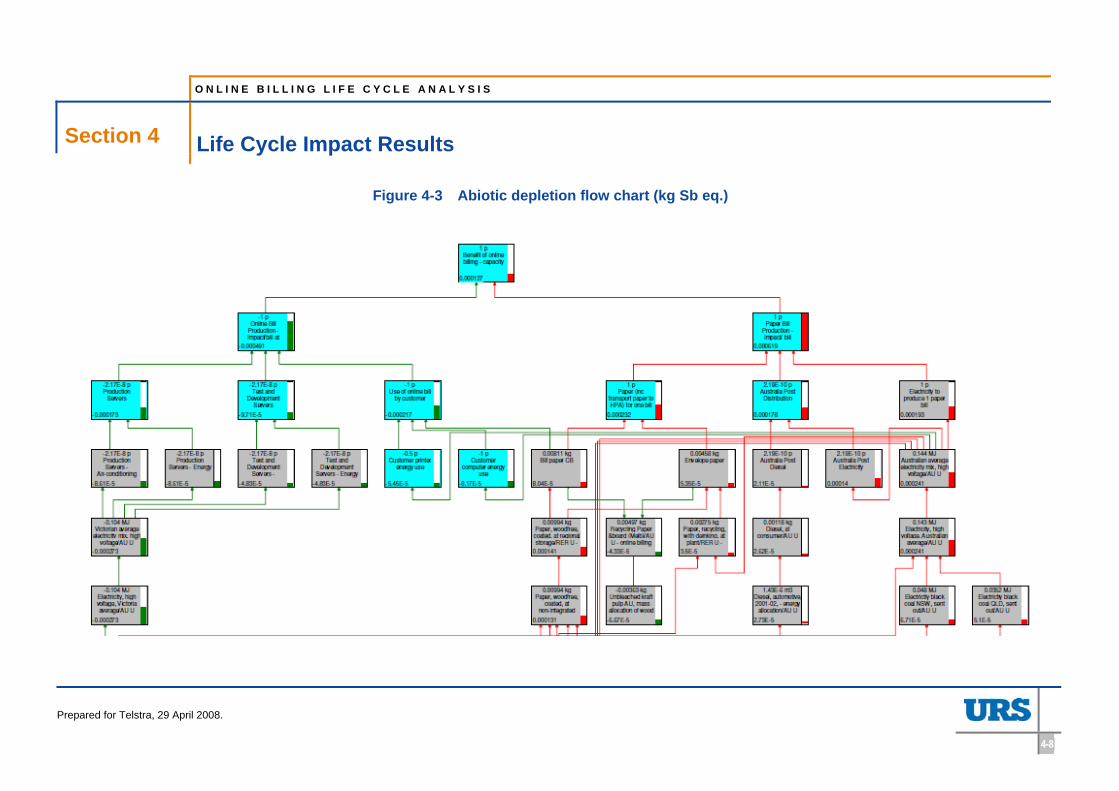
O N L I N E B I L L I N G L I F E C Y C L E A N A L Y S I S
Section 4 Life Cycle Impact Results
Prepared for Telstra, 29 April 2008.
4-8
Figure 4-3 Abiotic depletion flow chart (kg Sb eq.)
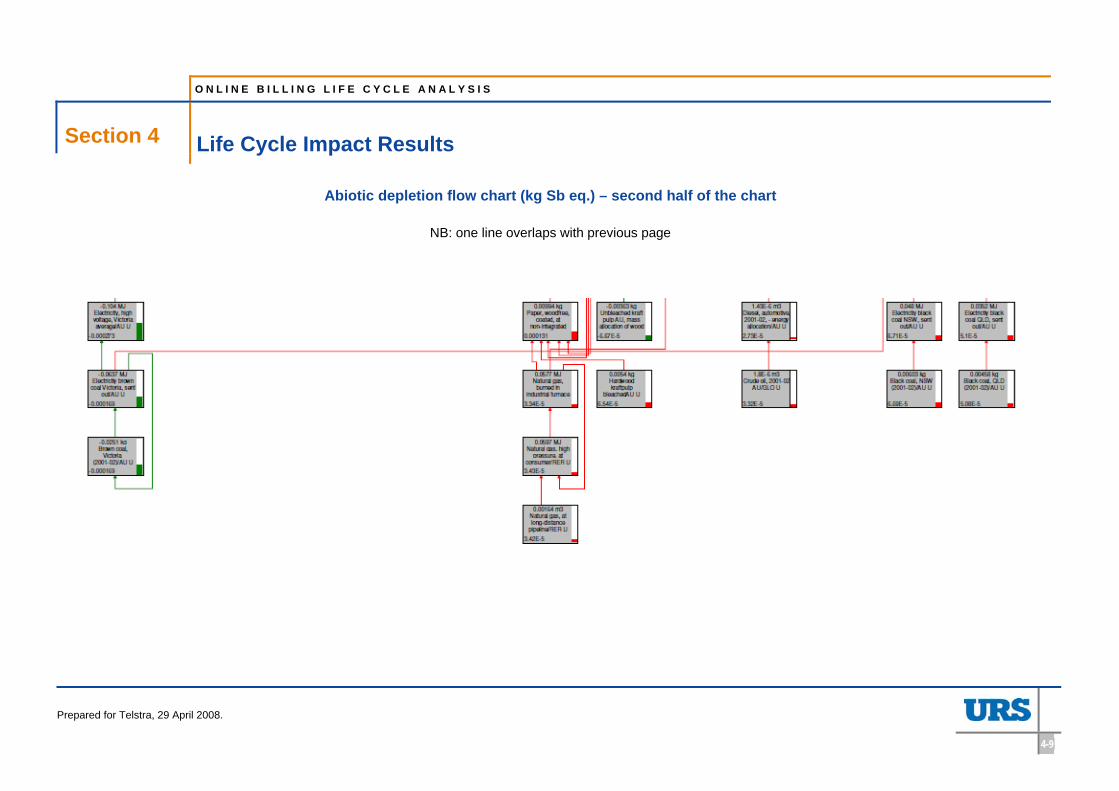
O N L I N E B I L L I N G L I F E C Y C L E A N A L Y S I S
Section 4 Life Cycle Impact Results
Prepared for Telstra, 29 April 2008.
4-9
Abiotic depletion flow chart (kg Sb eq.) – second half of the chart
NB: one line overlaps with previous page
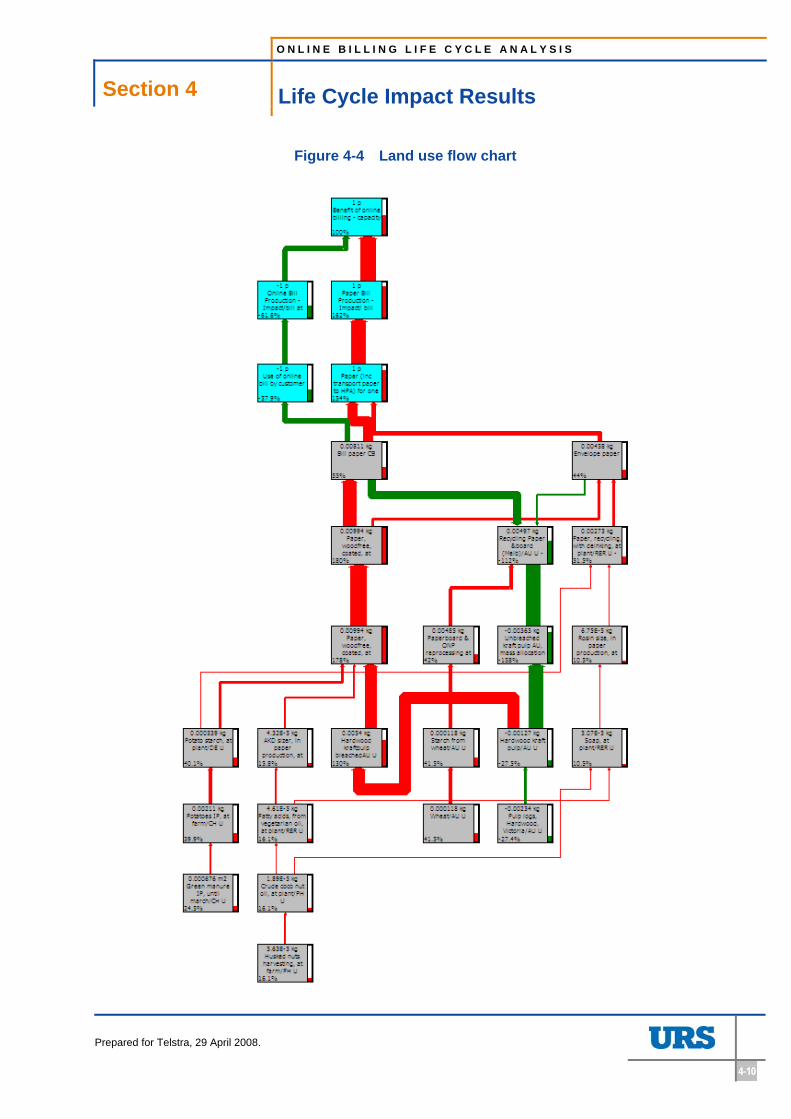
O N L I N E B I L L I N G L I F E C Y C L E A N A L Y S I S
Section 4 Life Cycle Impact Results
Prepared for Telstra, 29 April 2008.
4-10
Figure 4-4 Land use flow chart
O N L I N E B I L L I N G L I F E C Y C L E A N A L Y S I S
Section 5 Sensitivity Analysis
Prepared for Telstra, 29 April 2008.
5-1
5 Sensitivity Analysis
To test the robustness of the initial key conclusion that the impacts associated with online billing are less than those associated with paper billing, we undertook a sensitivity analysis on data associated with the key contributors identified in Section 4.3.
The sensitivity analysis demonstrated that the global warming burdens associated with online billing exceed those associated with paper billing when the number of customers receiving both paper and online bills is reduced to 70% of the base case figure. This also occurs if the server energy increases by 50% or approximately 95% of customers print their online bill. With regards to land use, the land use burdens associated with online billing exceed those associated with paper billing if 100% of customers recycle their paper bills.
5.1 Global Warming
The global warming flowchart, shown in Figure 4-1 in conjunction with the model input data and the information in Table 4-2, was used to determine the most important parameters that the sensitivity analyses should focus on. The most important parameters are those that have the biggest impact on key contributors. For example, for online billing, energy usage associated with the servers consumed the most energy and therefore parameters associated with server energy usage were tested for sensitivity.
The following parameters were used in the sensitivity analysis:
• Online bill production:
– number of online bills produced;
– amount of energy consumed by the production and test and development servers; and
– ratio of the amount of energy consumed by the servers to the amount of energy used by the air-conditioners to cool the servers.
• Use of the online bill by the customer:
– amount of energy consumed by the customer’s computer and printer;
– percentage of customers printing their online bill; and
– number of sheets per bill printed by the customer.
• Paper bill production:
– average number of sheets per bill;
– amount of energy consumed by Telstra’s print contractor to print and sort Telstra’s bill
• Distribution of the paper bill:
– amount of energy consumed by Australia Post.
The sensitivity analysis demonstrates that the most sensitive parameters are:
• number of online bills produced;
• the production and test and development server energy (including energy required for air conditioning); and
• the percentage of customers who print their online bill
O N L I N E B I L L I N G L I F E C Y C L E A N A L Y S I S
Section 5 Sensitivity Analysis
Prepared for Telstra, 29 April 2008.
5-2
The analysis shows that the global warming impacts associated with online billing are greater than those associated with paper billing when:
• less than approximately 70% of the base case number of online bills are actually produced;
• the base case for the server energy (including air conditioning) increases by 50%;
• the ratio of energy consumption for the servers’ air conditioners to energy consumption for the servers becomes greater than approximately 2:1; or
• approximately 95% of customers print their online bill.
The results would also be reversed if Telstra, Telstra’s print contractor or Australia Post was to go carbon neutral and therefore reduce their greenhouse gas emissions to zero.
5.1.1 Online bill production
Number of online bills produced
The results of the sensitivity analysis for the number of online bills produced are shown in Figure 5-1. In the base case it is assumed that when the online billing servers operate at capacity they will generate approximately 46 million bills. In this situation, the difference in the global warming impact caused by an online bill compared to a paper bill is approximately 19 g of CO2 eq. i.e. an online bill produces 19 g of CO2 eq less than a paper bill. This difference decreases, because the impact caused by an online bill compared to a paper bill increases when the number of online bills produced decreases (assuming that the same IT equipment remains.) This is because the energy usage of the servers remains constant regardless of the reduction in the number of bills produced (as data sits on the server and requires approximately the same amount of energy regardless whether it is used or not by the process; Telstra, pers. communication). Therefore, the energy usage of the servers has to be apportioned across a smaller number of bills. If just less than 70% of the base number of online bills is actually produced, the global warming impacts associated with online billing become greater than those associated with paper billing and hence the difference between the two options becomes negative.
Telstra presently produces less than 70% of the base number of online bills to be produced when the servers are operating at capacity.
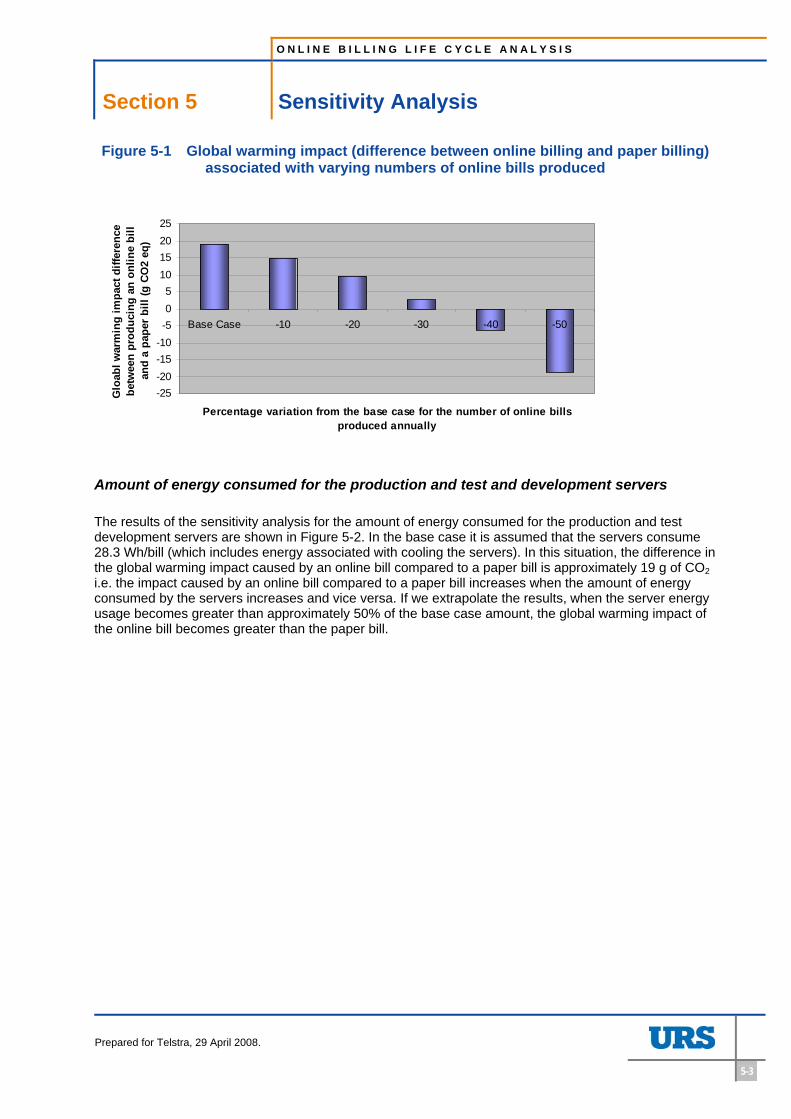
O N L I N E B I L L I N G L I F E C Y C L E A N A L Y S I S
Section 5 Sensitivity Analysis
Prepared for Telstra, 29 April 2008.
5-3
Figure 5-1 Global warming impact (difference between online billing and paper billing) associated with varying numbers of online bills produced
-25-20-15-10-505
10152025
Base Case -10 -20 -30 -40 -50
Percentage variation from the base case for the number of online bills produced annually
Glo
abl w
arm
ing
impa
ct d
iffer
ence
be
twee
n pr
oduc
ing
an o
nlin
e bi
ll an
d a
pape
r bill
(g C
O2
eq)
Amount of energy consumed for the production and test and development servers
The results of the sensitivity analysis for the amount of energy consumed for the production and test development servers are shown in Figure 5-2. In the base case it is assumed that the servers consume 28.3 Wh/bill (which includes energy associated with cooling the servers). In this situation, the difference in the global warming impact caused by an online bill compared to a paper bill is approximately 19 g of CO2 i.e. the impact caused by an online bill compared to a paper bill increases when the amount of energy consumed by the servers increases and vice versa. If we extrapolate the results, when the server energy usage becomes greater than approximately 50% of the base case amount, the global warming impact of the online bill becomes greater than the paper bill.
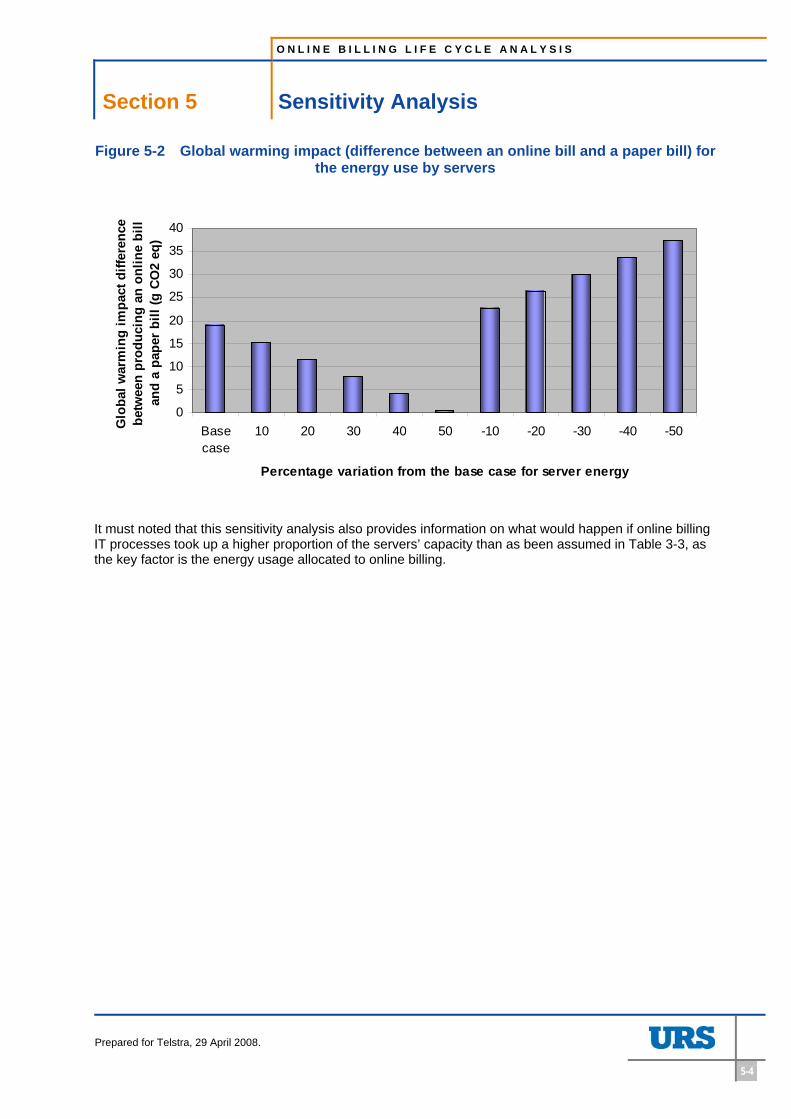
O N L I N E B I L L I N G L I F E C Y C L E A N A L Y S I S
Section 5 Sensitivity Analysis
Prepared for Telstra, 29 April 2008.
5-4
Figure 5-2 Global warming impact (difference between an online bill and a paper bill) for the energy use by servers
0
5
10
15
20
25
30
35
40
Basecase
10 20 30 40 50 -10 -20 -30 -40 -50
Percentage variation from the base case for server energy
Glo
bal w
arm
ing
impa
ct d
iffer
ence
be
twee
n pr
oduc
ing
an o
nlin
e bi
ll an
d a
pape
r bi
ll (g
CO
2 eq
)
It must noted that this sensitivity analysis also provides information on what would happen if online billing IT processes took up a higher proportion of the servers’ capacity than as been assumed in Table 3-3, as the key factor is the energy usage allocated to online billing.
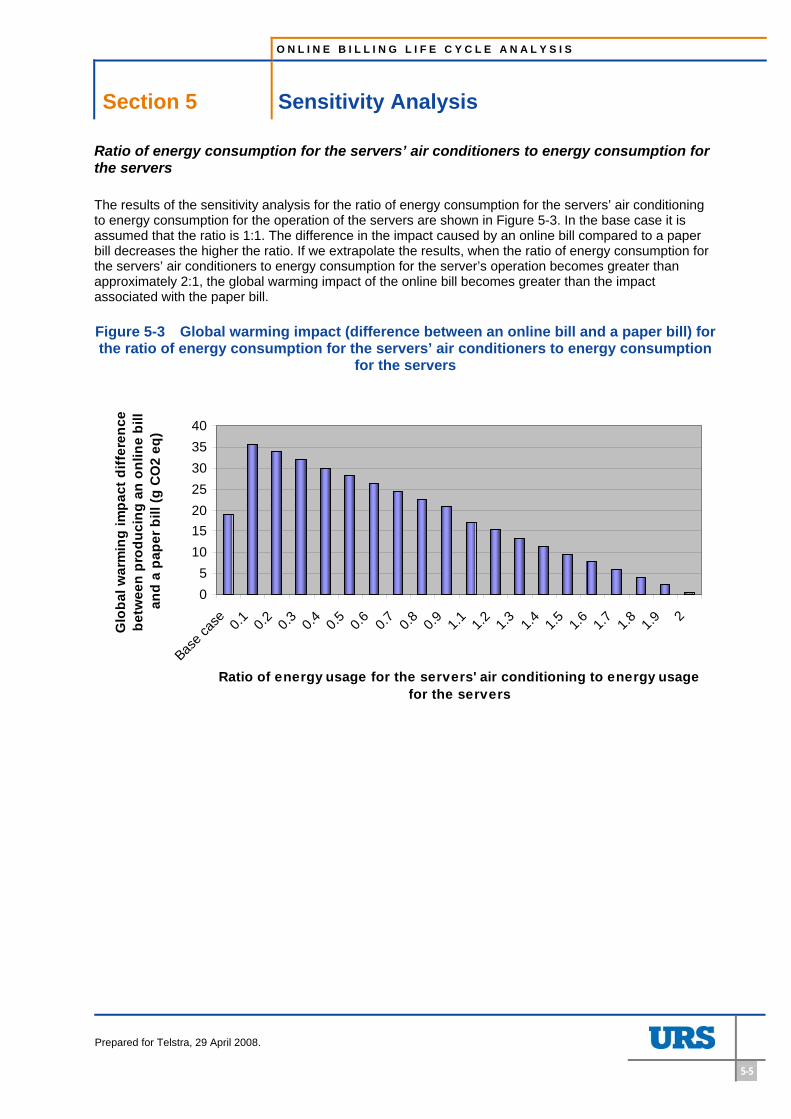
O N L I N E B I L L I N G L I F E C Y C L E A N A L Y S I S
Section 5 Sensitivity Analysis
Prepared for Telstra, 29 April 2008.
5-5
Ratio of energy consumption for the servers’ air conditioners to energy consumption for the servers
The results of the sensitivity analysis for the ratio of energy consumption for the servers’ air conditioning to energy consumption for the operation of the servers are shown in Figure 5-3. In the base case it is assumed that the ratio is 1:1. The difference in the impact caused by an online bill compared to a paper bill decreases the higher the ratio. If we extrapolate the results, when the ratio of energy consumption for the servers’ air conditioners to energy consumption for the server’s operation becomes greater than approximately 2:1, the global warming impact of the online bill becomes greater than the impact associated with the paper bill.
Figure 5-3 Global warming impact (difference between an online bill and a paper bill) for the ratio of energy consumption for the servers’ air conditioners to energy consumption
for the servers
05
10152025303540
Base c
ase 0.1 0.2 0.3 0.4 0.5 0.6 0.7 0.8 0.9 1.1 1.2 1.3 1.4 1.5 1.6 1.7 1.8 1.9 2
Ratio of energy usage for the servers' air conditioning to energy usage for the servers
Glo
bal w
arm
ing
impa
ct d
iffer
ence
be
twee
n pr
oduc
ing
an o
nlin
e bi
ll an
d a
pape
r bill
(g C
O2
eq)
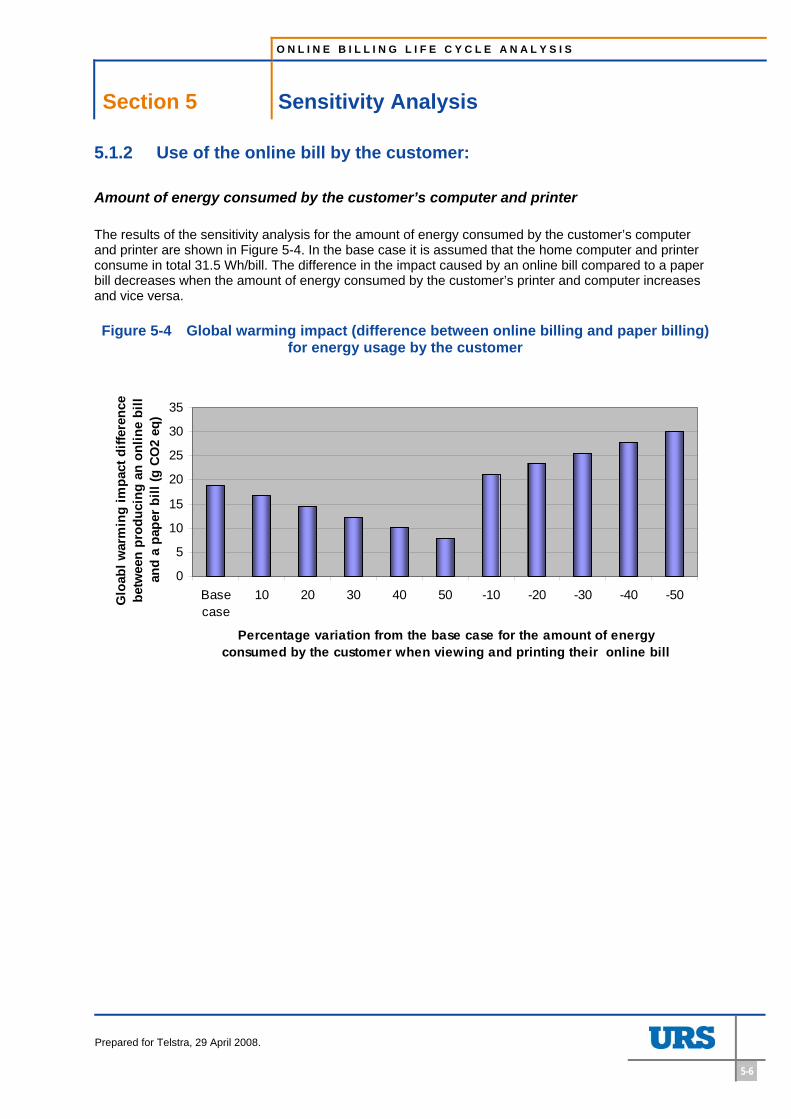
O N L I N E B I L L I N G L I F E C Y C L E A N A L Y S I S
Section 5 Sensitivity Analysis
Prepared for Telstra, 29 April 2008.
5-6
5.1.2 Use of the online bill by the customer:
Amount of energy consumed by the customer’s computer and printer
The results of the sensitivity analysis for the amount of energy consumed by the customer’s computer and printer are shown in Figure 5-4. In the base case it is assumed that the home computer and printer consume in total 31.5 Wh/bill. The difference in the impact caused by an online bill compared to a paper bill decreases when the amount of energy consumed by the customer’s printer and computer increases and vice versa.
Figure 5-4 Global warming impact (difference between online billing and paper billing) for energy usage by the customer
0
5
10
15
20
25
30
35
Basecase
10 20 30 40 50 -10 -20 -30 -40 -50
Percentage variation from the base case for the amount of energy consumed by the customer when viewing and printing their online bill
Glo
abl w
arm
ing
impa
ct d
iffer
ence
be
twee
n pr
oduc
ing
an o
nlin
e bi
ll an
d a
pape
r bill
(g C
O2
eq)
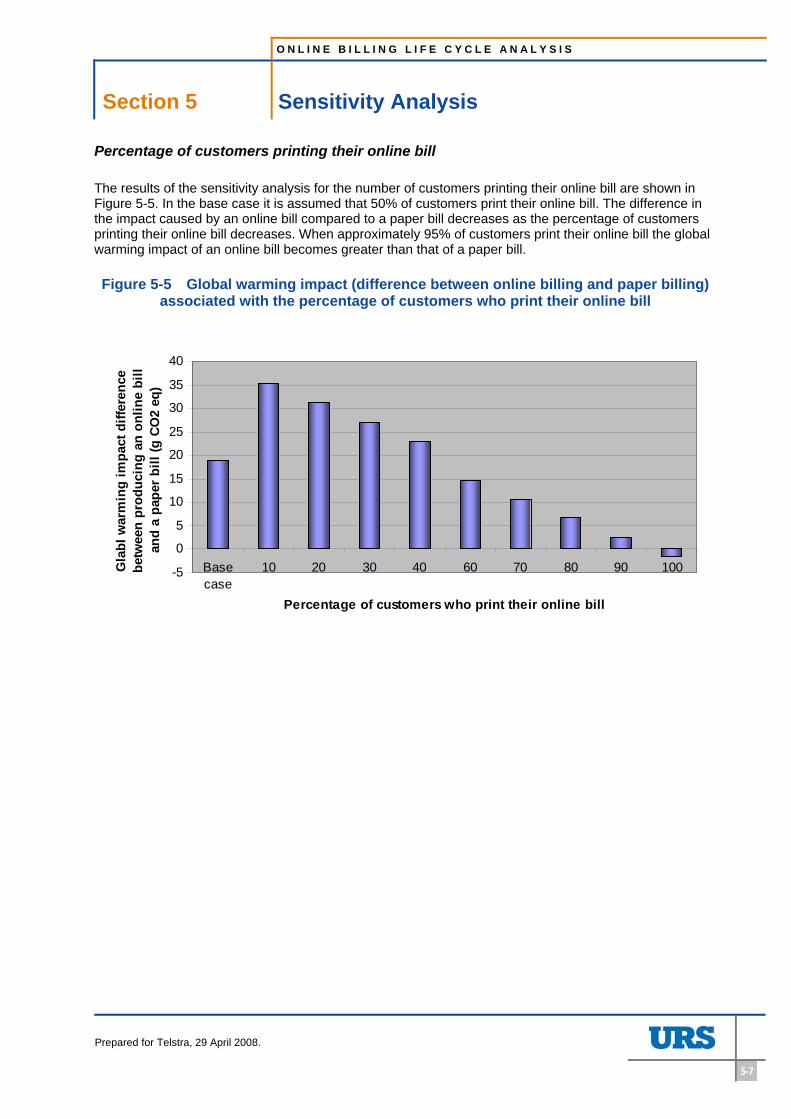
O N L I N E B I L L I N G L I F E C Y C L E A N A L Y S I S
Section 5 Sensitivity Analysis
Prepared for Telstra, 29 April 2008.
5-7
Percentage of customers printing their online bill
The results of the sensitivity analysis for the number of customers printing their online bill are shown in Figure 5-5. In the base case it is assumed that 50% of customers print their online bill. The difference in the impact caused by an online bill compared to a paper bill decreases as the percentage of customers printing their online bill decreases. When approximately 95% of customers print their online bill the global warming impact of an online bill becomes greater than that of a paper bill.
Figure 5-5 Global warming impact (difference between online billing and paper billing) associated with the percentage of customers who print their online bill
-5
0
5
10
15
20
25
30
35
40
Basecase
10 20 30 40 60 70 80 90 100
Percentage of customers who print their online bill
Gla
bl w
arm
ing
impa
ct d
iffer
ence
be
twee
n pr
oduc
ing
an o
nlin
e bi
ll an
d a
pape
r bi
ll (g
CO
2 eq
)
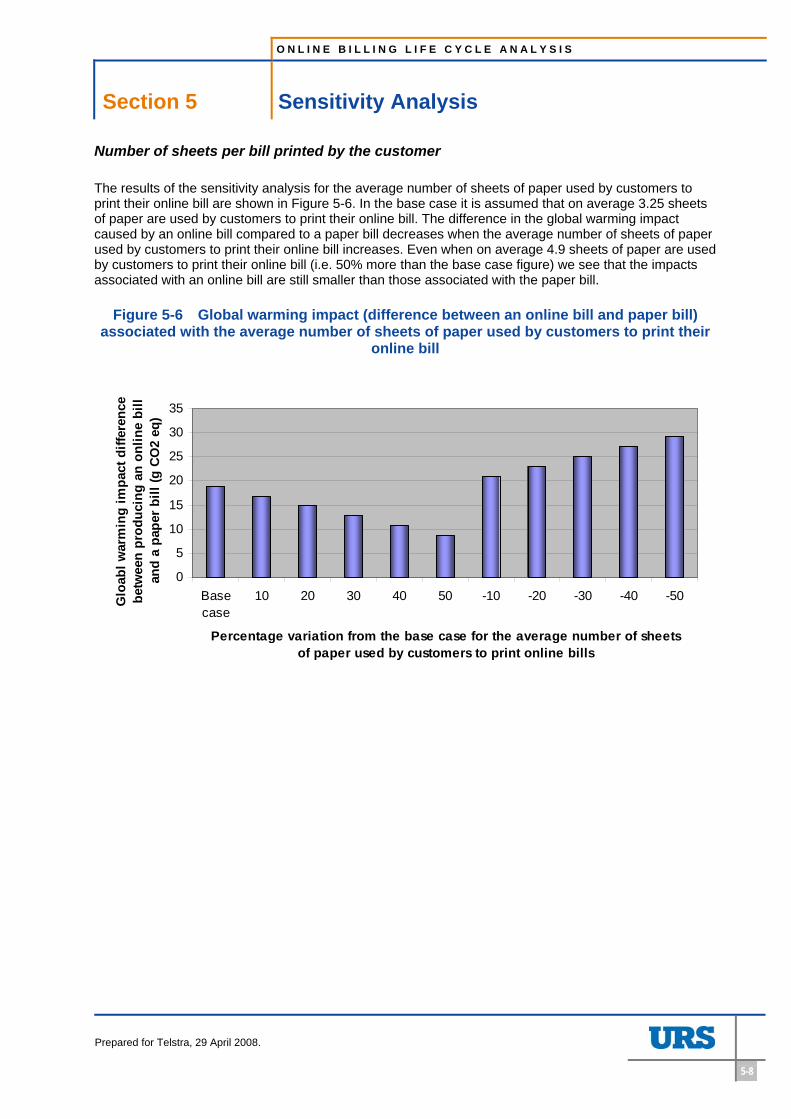
O N L I N E B I L L I N G L I F E C Y C L E A N A L Y S I S
Section 5 Sensitivity Analysis
Prepared for Telstra, 29 April 2008.
5-8
Number of sheets per bill printed by the customer
The results of the sensitivity analysis for the average number of sheets of paper used by customers to print their online bill are shown in Figure 5-6. In the base case it is assumed that on average 3.25 sheets of paper are used by customers to print their online bill. The difference in the global warming impact caused by an online bill compared to a paper bill decreases when the average number of sheets of paper used by customers to print their online bill increases. Even when on average 4.9 sheets of paper are used by customers to print their online bill (i.e. 50% more than the base case figure) we see that the impacts associated with an online bill are still smaller than those associated with the paper bill.
Figure 5-6 Global warming impact (difference between an online bill and paper bill) associated with the average number of sheets of paper used by customers to print their
online bill
0
5
10
15
20
25
30
35
Basecase
10 20 30 40 50 -10 -20 -30 -40 -50
Percentage variation from the base case for the average number of sheets of paper used by customers to print online bills
Glo
abl w
arm
ing
impa
ct d
iffer
ence
be
twee
n pr
oduc
ing
an o
nlin
e bi
ll an
d a
pape
r bill
(g C
O2
eq)
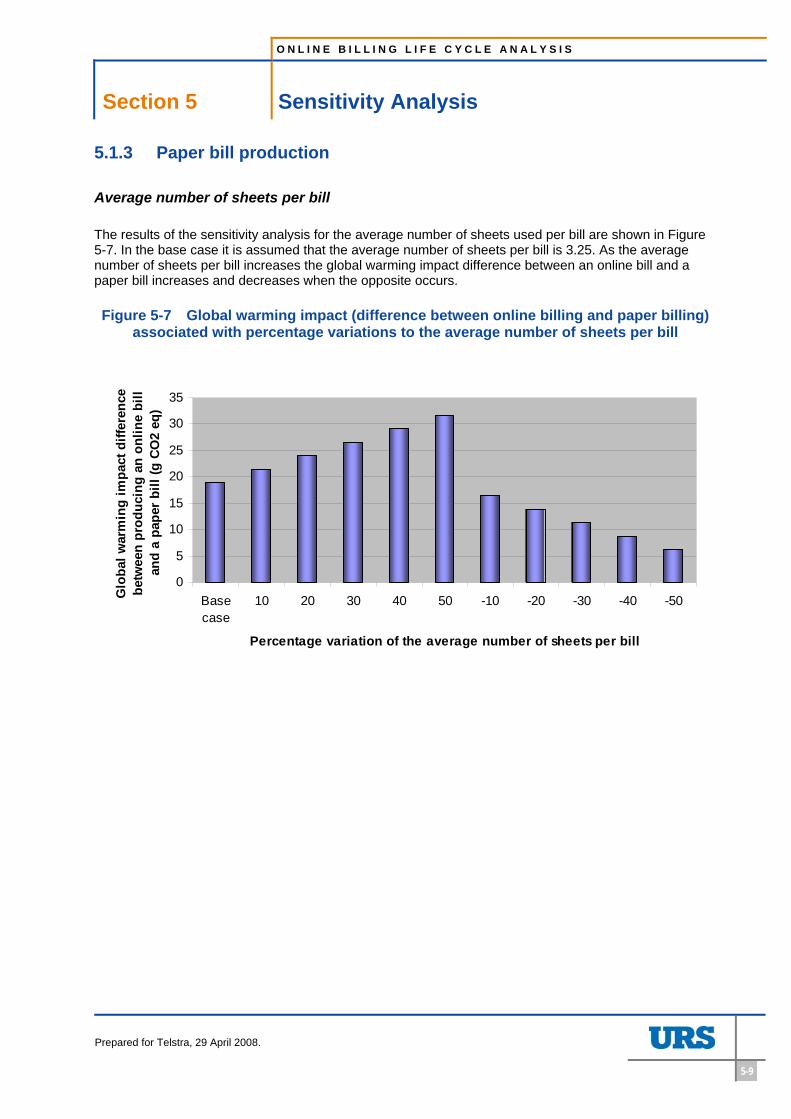
O N L I N E B I L L I N G L I F E C Y C L E A N A L Y S I S
Section 5 Sensitivity Analysis
Prepared for Telstra, 29 April 2008.
5-9
5.1.3 Paper bill production
Average number of sheets per bill
The results of the sensitivity analysis for the average number of sheets used per bill are shown in Figure 5-7. In the base case it is assumed that the average number of sheets per bill is 3.25. As the average number of sheets per bill increases the global warming impact difference between an online bill and a paper bill increases and decreases when the opposite occurs.
Figure 5-7 Global warming impact (difference between online billing and paper billing) associated with percentage variations to the average number of sheets per bill
0
5
10
15
20
25
30
35
Basecase
10 20 30 40 50 -10 -20 -30 -40 -50
Percentage variation of the average number of sheets per bill
Glo
bal w
arm
ing
impa
ct d
iffer
ence
be
twee
n pr
oduc
ing
an o
nlin
e bi
ll an
d a
pape
r bi
ll (g
CO
2 eq
)
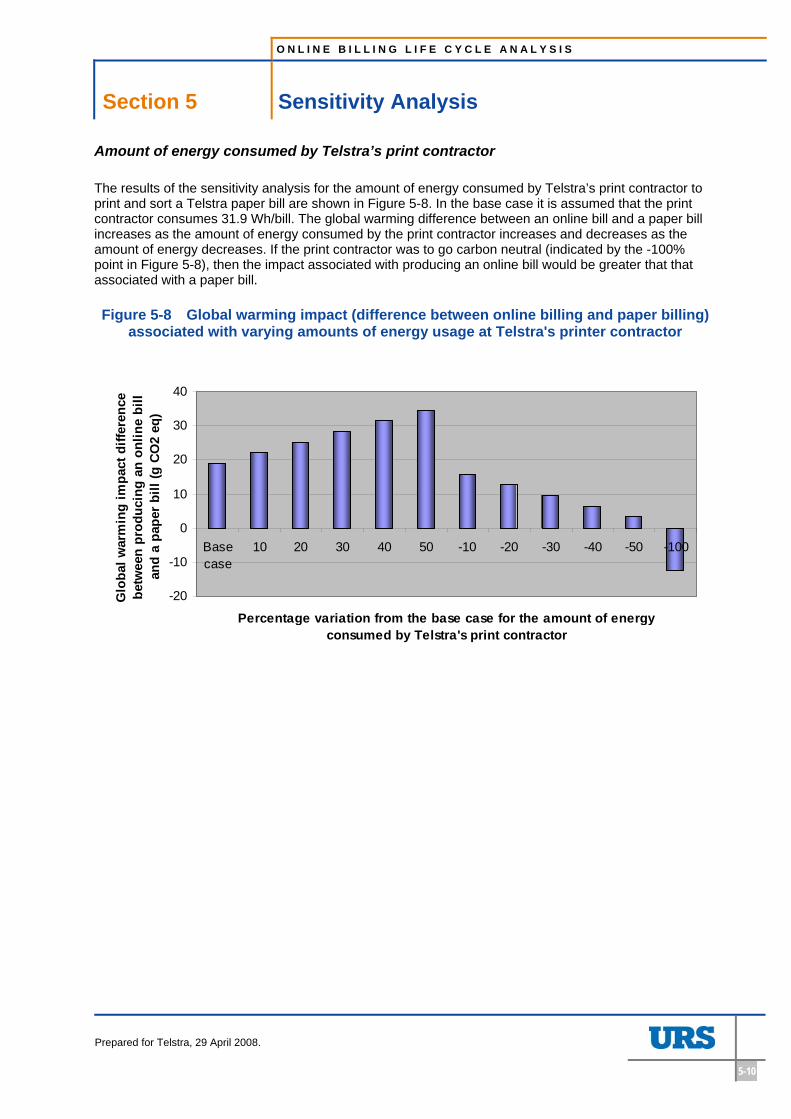
O N L I N E B I L L I N G L I F E C Y C L E A N A L Y S I S
Section 5 Sensitivity Analysis
Prepared for Telstra, 29 April 2008.
5-10
Amount of energy consumed by Telstra’s print contractor
The results of the sensitivity analysis for the amount of energy consumed by Telstra’s print contractor to print and sort a Telstra paper bill are shown in Figure 5-8. In the base case it is assumed that the print contractor consumes 31.9 Wh/bill. The global warming difference between an online bill and a paper bill increases as the amount of energy consumed by the print contractor increases and decreases as the amount of energy decreases. If the print contractor was to go carbon neutral (indicated by the -100% point in Figure 5-8), then the impact associated with producing an online bill would be greater that that associated with a paper bill.
Figure 5-8 Global warming impact (difference between online billing and paper billing) associated with varying amounts of energy usage at Telstra's printer contractor
-20
-10
0
10
20
30
40
Basecase
10 20 30 40 50 -10 -20 -30 -40 -50 -100
Percentage variation from the base case for the amount of energy consumed by Telstra's print contractor
Glo
bal w
arm
ing
impa
ct d
iffer
ence
be
twee
n pr
oduc
ing
an o
nlin
e bi
ll an
d a
pape
r bi
ll (g
CO
2 eq
)
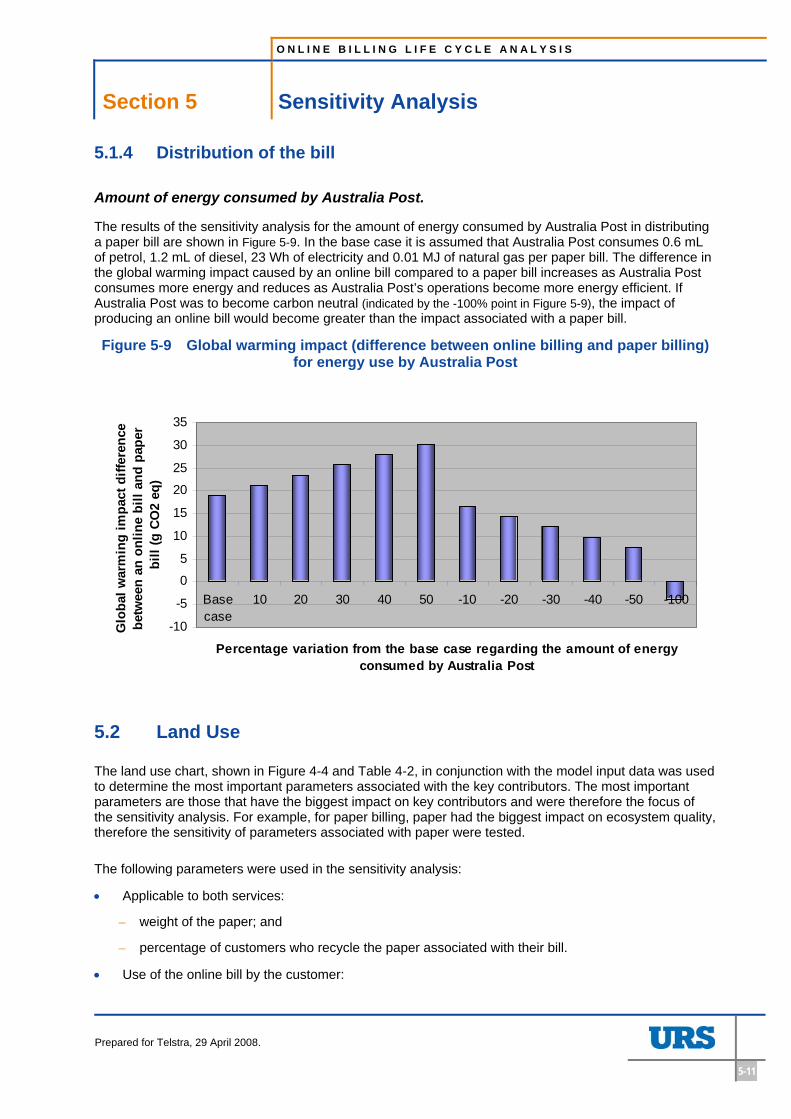
O N L I N E B I L L I N G L I F E C Y C L E A N A L Y S I S
Section 5 Sensitivity Analysis
Prepared for Telstra, 29 April 2008.
5-11
5.1.4 Distribution of the bill
Amount of energy consumed by Australia Post.
The results of the sensitivity analysis for the amount of energy consumed by Australia Post in distributing a paper bill are shown in Figure 5-9. In the base case it is assumed that Australia Post consumes 0.6 mL of petrol, 1.2 mL of diesel, 23 Wh of electricity and 0.01 MJ of natural gas per paper bill. The difference in the global warming impact caused by an online bill compared to a paper bill increases as Australia Post consumes more energy and reduces as Australia Post’s operations become more energy efficient. If Australia Post was to become carbon neutral (indicated by the -100% point in Figure 5-9), the impact of producing an online bill would become greater than the impact associated with a paper bill.
Figure 5-9 Global warming impact (difference between online billing and paper billing) for energy use by Australia Post
-10
-5
0
5
10
15
20
25
30
35
Basecase
10 20 30 40 50 -10 -20 -30 -40 -50 -100
Percentage variation from the base case regarding the amount of energy consumed by Australia Post
Glo
bal w
arm
ing
impa
ct d
iffer
ence
be
twee
n an
onl
ine
bill
and
pape
r bi
ll (g
CO
2 eq
)
5.2 Land Use
The land use chart, shown in Figure 4-4 and Table 4-2, in conjunction with the model input data was used to determine the most important parameters associated with the key contributors. The most important parameters are those that have the biggest impact on key contributors and were therefore the focus of the sensitivity analysis. For example, for paper billing, paper had the biggest impact on ecosystem quality, therefore the sensitivity of parameters associated with paper were tested.
The following parameters were used in the sensitivity analysis:
• Applicable to both services:
– weight of the paper; and
– percentage of customers who recycle the paper associated with their bill.
• Use of the online bill by the customer:
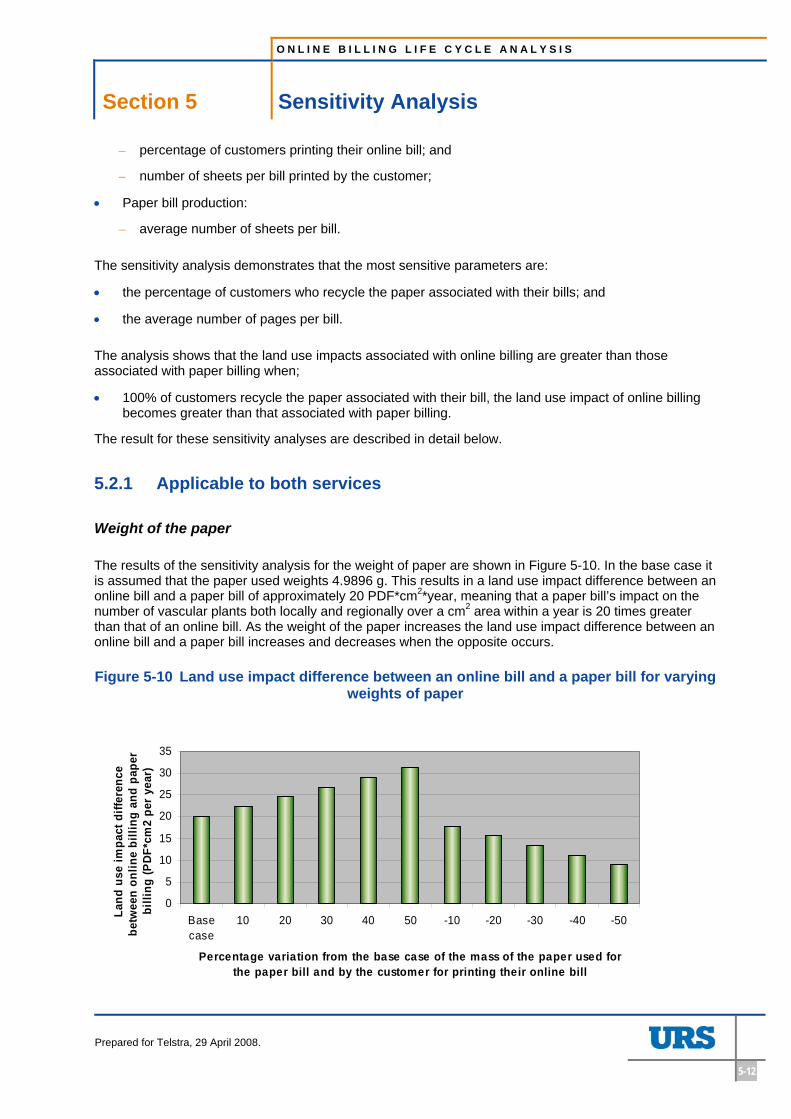
O N L I N E B I L L I N G L I F E C Y C L E A N A L Y S I S
Section 5 Sensitivity Analysis
Prepared for Telstra, 29 April 2008.
5-12
– percentage of customers printing their online bill; and
– number of sheets per bill printed by the customer;
• Paper bill production:
– average number of sheets per bill.
The sensitivity analysis demonstrates that the most sensitive parameters are:
• the percentage of customers who recycle the paper associated with their bills; and
• the average number of pages per bill.
The analysis shows that the land use impacts associated with online billing are greater than those associated with paper billing when;
• 100% of customers recycle the paper associated with their bill, the land use impact of online billing becomes greater than that associated with paper billing.
The result for these sensitivity analyses are described in detail below.
5.2.1 Applicable to both services
Weight of the paper
The results of the sensitivity analysis for the weight of paper are shown in Figure 5-10. In the base case it is assumed that the paper used weights 4.9896 g. This results in a land use impact difference between an online bill and a paper bill of approximately 20 PDF*cm2*year, meaning that a paper bill’s impact on the number of vascular plants both locally and regionally over a cm2 area within a year is 20 times greater than that of an online bill. As the weight of the paper increases the land use impact difference between an online bill and a paper bill increases and decreases when the opposite occurs.
Figure 5-10 Land use impact difference between an online bill and a paper bill for varying weights of paper
0
5
10
15
20
25
30
35
Basecase
10 20 30 40 50 -10 -20 -30 -40 -50
Percentage variation from the base case of the mass of the paper used for the paper bill and by the customer for printing their online bill
Land
use
impa
ct d
iffer
ence
be
twee
n on
line
billi
ng a
nd p
aper
bi
lling
(PD
F*cm
2 pe
r ye
ar)
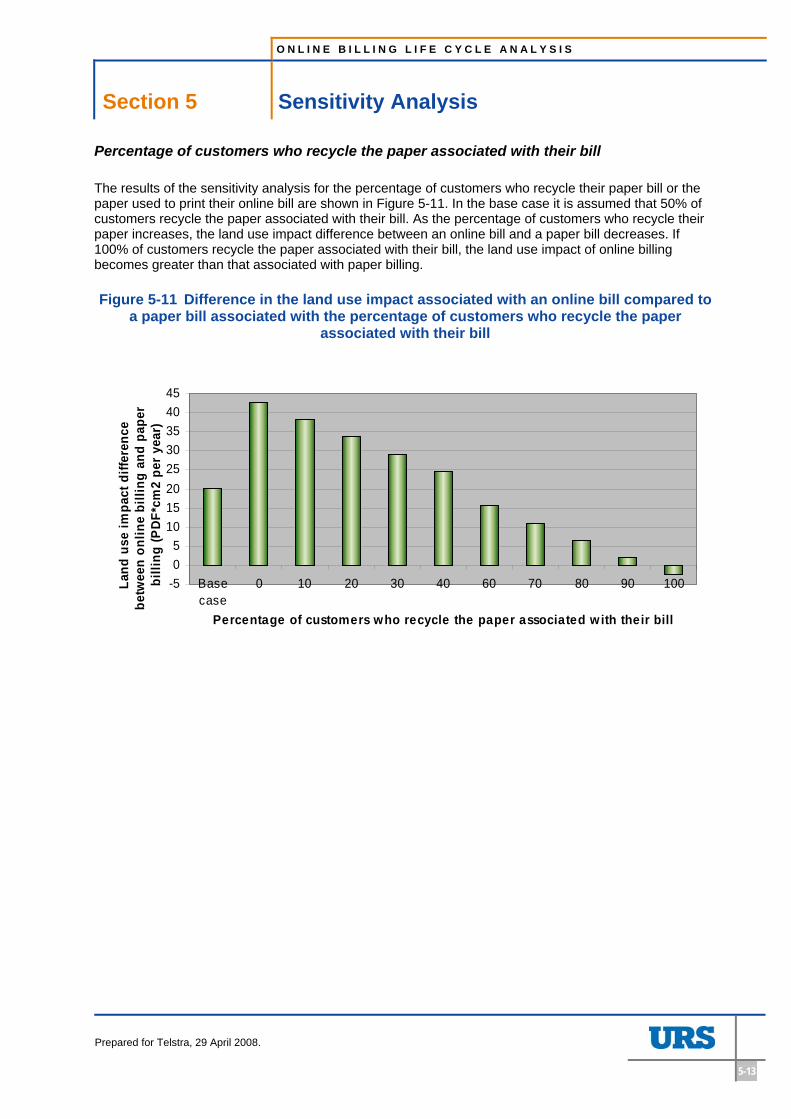
O N L I N E B I L L I N G L I F E C Y C L E A N A L Y S I S
Section 5 Sensitivity Analysis
Prepared for Telstra, 29 April 2008.
5-13
Percentage of customers who recycle the paper associated with their bill
The results of the sensitivity analysis for the percentage of customers who recycle their paper bill or the paper used to print their online bill are shown in Figure 5-11. In the base case it is assumed that 50% of customers recycle the paper associated with their bill. As the percentage of customers who recycle their paper increases, the land use impact difference between an online bill and a paper bill decreases. If 100% of customers recycle the paper associated with their bill, the land use impact of online billing becomes greater than that associated with paper billing.
Figure 5-11 Difference in the land use impact associated with an online bill compared to a paper bill associated with the percentage of customers who recycle the paper
associated with their bill
-505
1015202530354045
Basecase
0 10 20 30 40 60 70 80 90 100
Percentage of customers who recycle the paper associated with their bill
Land
use
impa
ct d
iffer
ence
be
twee
n on
line
billi
ng a
nd p
aper
bi
lling
(PD
F*cm
2 pe
r yea
r)
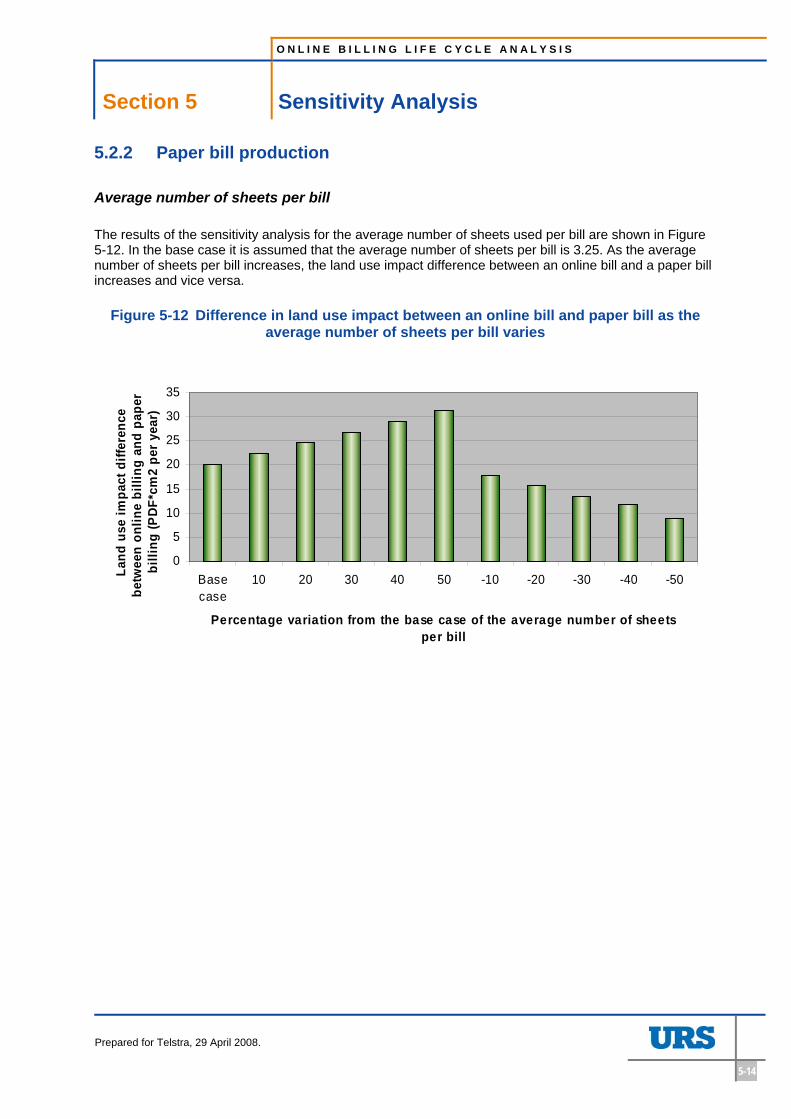
O N L I N E B I L L I N G L I F E C Y C L E A N A L Y S I S
Section 5 Sensitivity Analysis
Prepared for Telstra, 29 April 2008.
5-14
5.2.2 Paper bill production
Average number of sheets per bill
The results of the sensitivity analysis for the average number of sheets used per bill are shown in Figure 5-12. In the base case it is assumed that the average number of sheets per bill is 3.25. As the average number of sheets per bill increases, the land use impact difference between an online bill and a paper bill increases and vice versa.
Figure 5-12 Difference in land use impact between an online bill and paper bill as the average number of sheets per bill varies
0
5
10
15
20
25
30
35
Basecase
10 20 30 40 50 -10 -20 -30 -40 -50
Percentage variation from the base case of the average number of sheets per bill
Land
use
impa
ct d
iffer
ence
be
twee
n on
line
billi
ng a
nd p
aper
bi
lling
(PD
F*cm
2 pe
r yea
r)
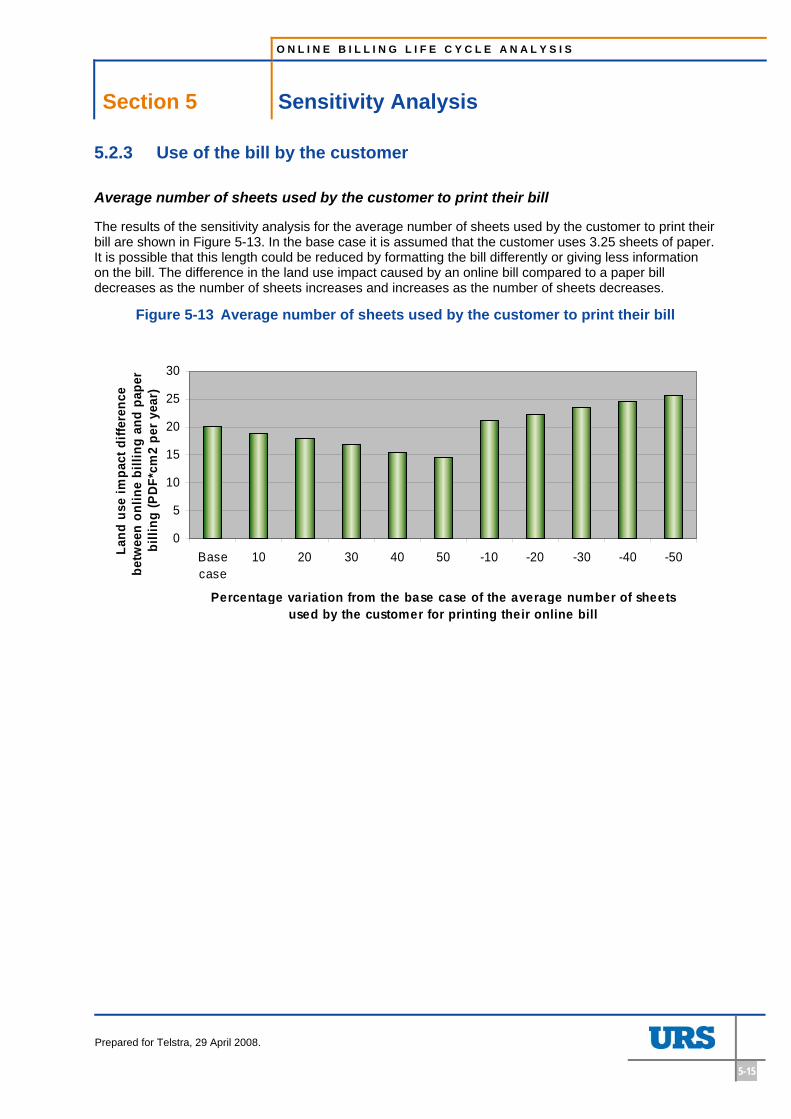
O N L I N E B I L L I N G L I F E C Y C L E A N A L Y S I S
Section 5 Sensitivity Analysis
Prepared for Telstra, 29 April 2008.
5-15
5.2.3 Use of the bill by the customer
Average number of sheets used by the customer to print their bill
The results of the sensitivity analysis for the average number of sheets used by the customer to print their bill are shown in Figure 5-13. In the base case it is assumed that the customer uses 3.25 sheets of paper. It is possible that this length could be reduced by formatting the bill differently or giving less information on the bill. The difference in the land use impact caused by an online bill compared to a paper bill decreases as the number of sheets increases and increases as the number of sheets decreases.
Figure 5-13 Average number of sheets used by the customer to print their bill
0
5
10
15
20
25
30
Basecase
10 20 30 40 50 -10 -20 -30 -40 -50
Percentage variation from the base case of the average number of sheets used by the customer for printing their online bill
Land
use
impa
ct d
iffer
ence
be
twee
n on
line
billi
ng a
nd p
aper
bi
lling
(PD
F*cm
2 pe
r yea
r)
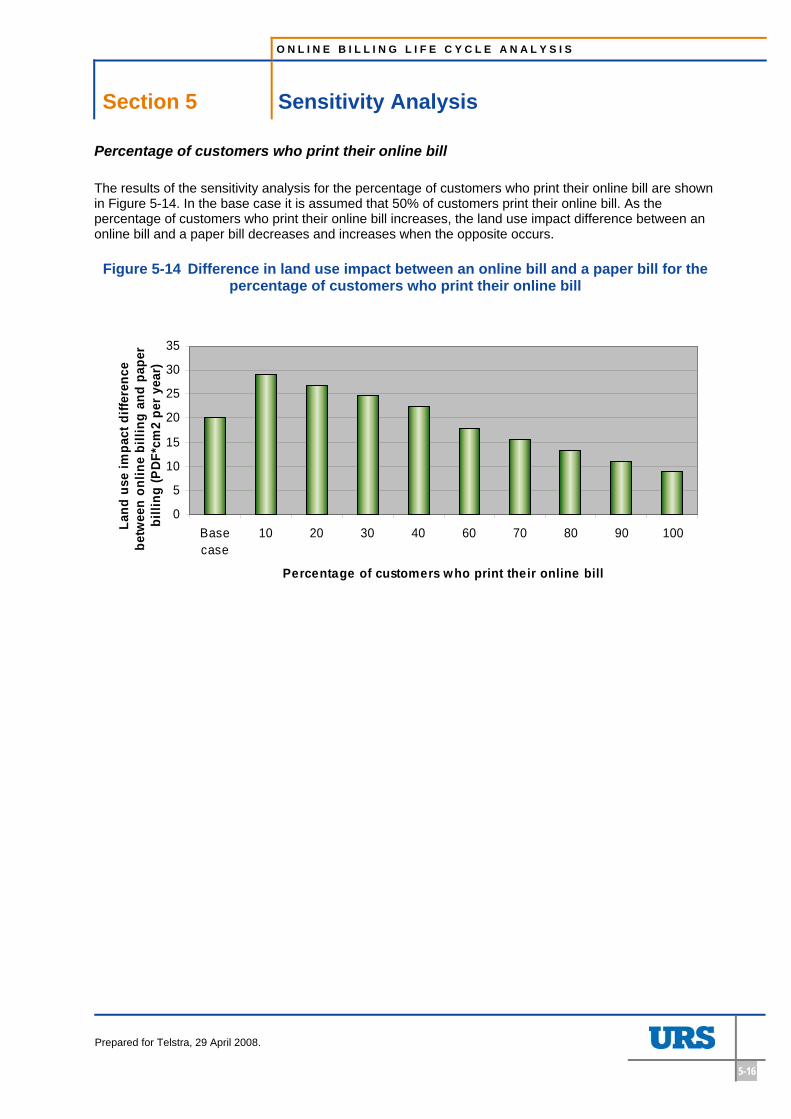
O N L I N E B I L L I N G L I F E C Y C L E A N A L Y S I S
Section 5 Sensitivity Analysis
Prepared for Telstra, 29 April 2008.
5-16
Percentage of customers who print their online bill
The results of the sensitivity analysis for the percentage of customers who print their online bill are shown in Figure 5-14. In the base case it is assumed that 50% of customers print their online bill. As the percentage of customers who print their online bill increases, the land use impact difference between an online bill and a paper bill decreases and increases when the opposite occurs.
Figure 5-14 Difference in land use impact between an online bill and a paper bill for the percentage of customers who print their online bill
0
5
10
15
20
25
30
35
Basecase
10 20 30 40 60 70 80 90 100
Percentage of customers who print their online bill
Land
use
impa
ct d
iffer
ence
be
twee
n on
line
billi
ng a
nd p
aper
bi
lling
(PD
F*cm
2 pe
r yea
r)
O N L I N E B I L L I N G L I F E C Y C L E A N A L Y S I S
Section 6 Data Quality Evaluation
Prepared for Telstra, 29 April 2008.
6-1
6 Data Quality Evaluation
This section analyses the life cycle inventory and impact assessment results against the stated goal and scope definition of the LCA. It deals with issues of data consistency, variability, uncertainty and completeness and discusses how these affect the interpretation of the results.
6.1 Consistency check • The system boundaries and allocation procedures have been uniformly applied throughout the life
cycle analysis process. All reported resource inputs and emissions under the chosen sub-systems have been considered for the inventory analysis and impact assessment in a consistent manner.
• As mentioned in section 1.4.3, we selected relevant paper in the Ecoinvent (European) database and substituted the key inventory elements from an impacts perspective, i.e. the pulp and the electricity input (INFRAS, 1998), to reflect the sourcing of the pulp and the production of electricity in Australia.
• Regarding recycling of paper, it was considered that only the non-recycled paper component of the envelopes (used in the paper billing process) would be recycled post-consumer use. This is to avoid double-counting the benefits of recycling paper (as these are already included in the model at the beginning of the process via the selection of recycled paper)25.
6.2 Completeness and uncertainty check The life cycle impact assessment covered a significant range of impact categories and emission substances. However, due to the project scope, timeframes and resources, the model is based on a number of key assumptions, which if changed may have significant impacts on the results obtained.
• As mentioned in section 1.4.3, energy input associated with air transportation of mail is not included in the model. The project team felt that trying to build up assumptions around this would be a project in itself. Inclusion of this information would only reinforce the conclusion that online billing impacts are less than paper billing’s impacts.
• All toner cartridges are reused and therefore the material impacts of the cartridge cases have not been included in the model. Even though energy would be required to transport and reprocess the cartridge cases, given the small number of actual cartridges used in the process it is likely that this assumption would be found reasonable. Inclusion of this information would reinforce the conclusion that online billing impacts are less than paper billing.
• It is assumed that Telstra’s activities do not influence the size of Australia Post’s vehicle fleet or the need for additional mail centres etc. Consequently the material impacts associated with Australia Post’s infrastructure have not been included in the model. This assumption seems reasonable as Telstra only represent 2.3% of Australia Post’s present deliveries and Telstra’s delivers are not concentrated in one particular geographical area. However, this only reinforces the conclusion that online billing impacts are less than paper billing.
• It has been assumed that the life cycle impacts of the printer and sorter at Telstra’s print contractor were the same. This is questionable but the difference is unlikely to be significant enough to influence the results of the model because the material impacts of the equipment are negligible in the overall LCA results.
• The impact associated with transmitting the bill from Telstra’s servers to the customer’s computer on the telecommunication network is considered negligible and therefore is not included in the model. This assumption seems reasonable given that the activity would represent only a very small proportion of the networks’ total activity.
25 Tim Grant, personal communication
O N L I N E B I L L I N G L I F E C Y C L E A N A L Y S I S
Section 6 Data Quality Evaluation
Prepared for Telstra, 29 April 2008.
6-2
• It is assumed in the model that online billing customers and paper billing customers require the same level of customer support from Telstra and hence Telstra’s building infrastructure and associated energy usage for its customer service staff has not been built into the model. This assumption is not very conservative and as suggested by V Turk et al, 2003, may impact greatly on the results. However inclusion of this information would only reinforce the conclusion that online billing impacts are less than paper billing.
• Although water scarcity is a major issue in Australia, as no indicator is available in the two selected methodologies, this impact is not directly covered in this report. This may present an issue from a completeness perspective but the only significant impact associated with the processes included in the model that involves direct water usage was the pulping of wood for paper. Therefore, inclusion of a water use impact category would enhance the conclusion that online billing impacts are less than paper billing.
O N L I N E B I L L I N G L I F E C Y C L E A N A L Y S I S
Section 7 Conclusions and Recommendations
Prepared for Telstra, 29 April 2008.
7-1
7 Conclusions and Recommendations
The life cycle assessment of an online bill compared to a paper bill shows that, using Telstra as an example, and based on the data and assumptions laid out in this report, online billing can avoid a number of environmental impacts. While the results are robust and the conclusion remains true in most cases covered in the sensitivity analysis, the following key parameters greatly influence the magnitude of the environmental benefits of online billing:
• the number of online bills produced per year – i.e. whether IT infrastructure is used at capacity or not;
• the amount of energy consumed by the production and test and development servers that support online billing (which includes the energy required for air conditioning);
• the percentage of customers who print their online bill; and
• the average number of pages per bill.
This has practical implications for the implementation of online billing services and therefore the following recommendations are made, which would be valid for any organisation considering the implementation of an online billing service.
Recommendations
1) Server capacity should be maximised by moving as many customers as possible to the online billing option and any excess servers turned off or used elsewhere.
2) Consideration should be given to how to best reduce the amount of energy required to cool the online billing servers (such as targeted air-conditioning of servers).
3) Customers should be encouraged not to print their online bill. Consideration could be given to providing a summarised bill fitting on one sheet of paper, regardless of how long the bill is, which could be the only thing customer could print.
4) Review the bill content and structure with the aim of reducing the number of pages, graphics and ink. This would help reduce the environmental impacts of online billing and paper billing.
5) In its communications with clients, Telstra could highlight how they can reduce their environmental impacts, for example, through the use of energy efficient equipment, turning off this equipment when not in use, and by not printing their online bills or recycling any paper associated with the billing processes.
6) Communicate the outcomes to suppliers, in particular the print contractor and server supplier and encourage them to focus on reducing the environmental impact of their product and services, in particular energy usage.
7) Telstra may consider buying green energy to offset the servers’ energy use and further reduce the impact of online billing.
Further Research
It is recommended that the model be reviewed once the online billing server is running at capacity to test a number of the assumptions including customer numbers, the length of bills, the apportionment of capacity / energy use for the various activities performed by the servers, and aspects such as method of payment. As online billing matures and there is increasing trust in the electronic system, it is likely that customers will move increasingly to online methods of payment.
O N L I N E B I L L I N G L I F E C Y C L E A N A L Y S I S
Section 7 Conclusions and Recommendations
Prepared for Telstra, 29 April 2008.
7-2
To enhance the results it is also recommended that energy meters be used to obtain data for the amount of energy consumed by the servers and the server air conditioners.
O N L I N E B I L L I N G L I F E C Y C L E A N A L Y S I S
Section 8 References
Prepared for Telstra, 29 April 2008.
8-1
8 References
Cannon, Life cycle analysis information for a Canon PIXMA MP500, http://www.canon-europe.com/Images/13_399711.pdf (date accessed: 8 August, 2007)
Dell Dimensions 4600 Series Service Model, http://support.dell.com/support/edocs/systems/dim4600/bp/4600i/sm/specs.htm (date accessed:12 October, 2007)
Emmons S, Lindauer K, Lung L, Sepich J, & Stellema J, National Teacher Enhancement Project, October 3, 2001, http://ed.fnal.gov/ntep/f98/projects/nrel_energy_2/measurement.html, (date accessed: 8 August 2007)
Epson, Product Environmental Aspects Declaration – PX 5800, NO.BN-06-007
Gard D & Keoleian G, Digital vs Print – energy performance in the selection and use of scholarly journals, Volume 6, Number 2, Journal of Industrial Ecology, Massachusetts Institute of Technology and Yale University, pg 115-132.
Goedkoep, M (1995) The Eco-indicator 95: Final Report (National Reuse of Waste Research Program; NOH report, 9523; Amersfoort, Netherlands, Pre Consultants)
Goedkoep, M and Spriensma R(2000) The Eco-indicator 99: A Damage Oriented Method for Life Cycle Impact Assessment. Methodology Report, www.pre.nl/ecoindicator 99/ei99-reports.htm (date accessed: 21 November 2007).
Grant T, James K.L, Lundie S, Sonneveld K, Stage 2 report for LCA for paper and packaging waste management scenarios in Australia, Ecorecycle, 2001
Hischier R & Reichart I, Multifunctional Electronic Media – Traditional Media - The Problem of an Adequate Functional Unit: A case study of a printed newspaper, an internet newspaper and a TV broadcast, 2003, Int J LCA 8 (4) 201345–208
IndustryEdge, Pulp & Paper Strategic Review 2007: A comprehensive analysis of the Australian and New Zealand Pulp & Paper industry, 2007
IBM, Energy Efficiency in the Data Center, 2007 (Public presentation)
INFRAS, A Life Cycle Assessment of the production of a daily newspaper and a weekly magazine Short version of the study, 1998, Zurich
Konica, 7085 Production Printing System, 2002, Konica Business Technologies Inc, USA.
Koomey, J, Estimated Total Power Consumption by Servers in the US and the World, 2007, US, http://enterprise.amd.com/Downloads/svrpwrusecompletefinal.pdf (date accessed: 27 August 2007)
Mineheart Infrastructure and Environment Group, Computer and Peripherals Martial Project, prepared for Environment Australia, October 2001
Narayanaswamy V, Altham J, Van Berkel R, McGregor M , Environmental Life Cycle Assessment Case Studies for Western Australian Grains Products, May 2004
National Teacher Enhancement Project, web resource, http://ed.fnal.gov/ntep/f98/projects/nrel_energy_2/measurement.html (date accessed: 27 August 2007)
Nippon Telegraph and Telecommunications Group, NTT Group CSR Report 2006, 2006, http://www.ntt.co.jp/csr_e/2006report/ecology/03_04.html (date accessed: 9 April, 2007)
O N L I N E B I L L I N G L I F E C Y C L E A N A L Y S I S
Section 8 References
Prepared for Telstra, 29 April 2008.
8-2
Standards Australia/ Standards New Zealand, Australian/ New Zealand Standard – Environmental Management – Life Cycle Assessment – Principles and Framework, March 1998
Standards Australia/ Standards New Zealand, Environmental Management – Life Cycle Assessment – Principles and Framework, 1998
Telstra, pers. communication reg. servers, electricity usage, etc. in relation to online billing systems.
Telstra print contraction, pers. communication reg. materials and resources usage in relation to bill printing.
Türk V, Kuhndt M, Alakeson V, Aldrich T & von Geibler J, The environmental and social impacts of ebanking – a case study with Barclays PLC, Final Report, April 2003, Digital Europe
Westpac, Tomorrow – Westpac 2006 Stakeholder Impact Report, 2006, http://www.westpac.com.au/manage/pdf.nsf/21F2EC3D9E013921CA25724200155A85/$File/SIR_2006.pdf?OpenElement (date accessed: 4 December 2007)
Zurkirch M & Reichart I, Environmental impacts of telecommunication services: Internal postal mail versus email, GMI 32, Winter 2000

O N L I N E B I L L I N G L I F E C Y C L E A N A L Y S I S
Section 9 Limitations
Prepared for Telstra, 29 April 2008.
9-1
9 Limitations
URS Australia Pty Ltd (URS) has prepared this report in accordance with the usual care and thoroughness of the consulting profession for the use of Telstra and only those third parties who have been authorised in writing by URS to rely on the report. It is based on generally accepted practices and standards at the time it was prepared. No other warranty, expressed or implied, is made as to the professional advice included in this report. It is prepared in accordance with the scope of work and for the purpose outlined in the Proposal dated 16 February 2007.
The methodology adopted and sources of information used by URS are outlined in this report. URS has made no independent verification of this information beyond the agreed scope of works and URS assumes no responsibility for any inaccuracies or omissions. No indications were found during our investigations that information contained in this report as provided to URS was false.
This report was prepared between 1 August, 2007 and 17 January 2008 and is based on the conditions encountered and information reviewed at the time of preparation. URS disclaims responsibility for any changes that may have occurred after this time.
This report should be read in full. No responsibility is accepted for use of any part of this report in any other context or for any other purpose or by third parties. This report does not purport to give legal advice. Legal advice can only be given by qualified legal practitioners.

O N L I N E B I L L I N G L I F E C Y C L E A N A L Y S I S
Appendix A Life Cycle Impact Data for Equipment
Prepared for Telstra, 29 April 2008.
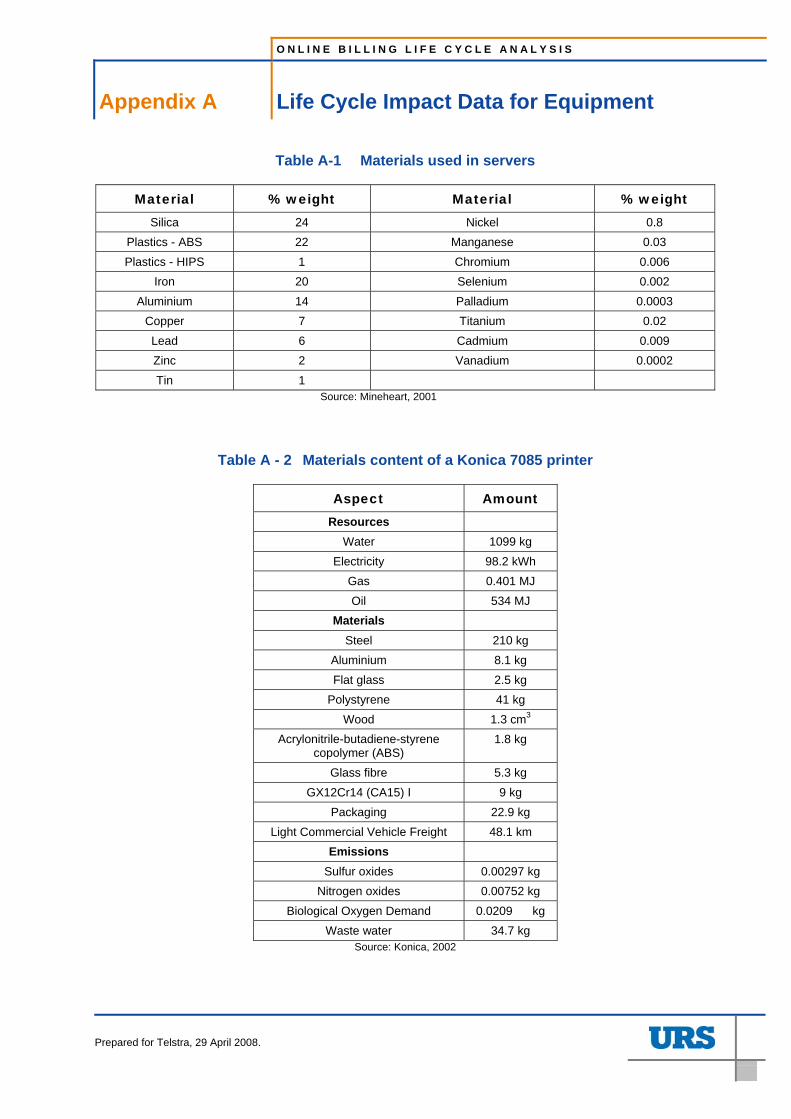
O N L I N E B I L L I N G L I F E C Y C L E A N A L Y S I S
Appendix A Life Cycle Impact Data for Equipment
Prepared for Telstra, 29 April 2008.
A. Life Cycle Impact Data for Equipment
Table A-1 Materials used in servers
Material % weight Material % weight Silica 24 Nickel 0.8
Plastics - ABS 22 Manganese 0.03 Plastics - HIPS 1 Chromium 0.006
Iron 20 Selenium 0.002 Aluminium 14 Palladium 0.0003
Copper 7 Titanium 0.02 Lead 6 Cadmium 0.009 Zinc 2 Vanadium 0.0002 Tin 1
Source: Mineheart, 2001
Table A - 2 Materials content of a Konica 7085 printer
Aspect Amount Resources
Water 1099 kg Electricity 98.2 kWh
Gas 0.401 MJ Oil 534 MJ
Materials Steel 210 kg
Aluminium 8.1 kg Flat glass 2.5 kg
Polystyrene 41 kg Wood 1.3 cm3
Acrylonitrile-butadiene-styrene copolymer (ABS)
1.8 kg
Glass fibre 5.3 kg GX12Cr14 (CA15) I 9 kg
Packaging 22.9 kg Light Commercial Vehicle Freight 48.1 km
Emissions Sulfur oxides 0.00297 kg
Nitrogen oxides 0.00752 kg Biological Oxygen Demand 0.0209 kg
Waste water 34.7 kg Source: Konica, 2002
O N L I N E B I L L I N G L I F E C Y C L E A N A L Y S I S
Appendix B Data Output Tables from SIMAPRO
Prepared for Telstra, 29 April 2008.
B. Data Output Tables from SIMAPRO
B.1 Inventory
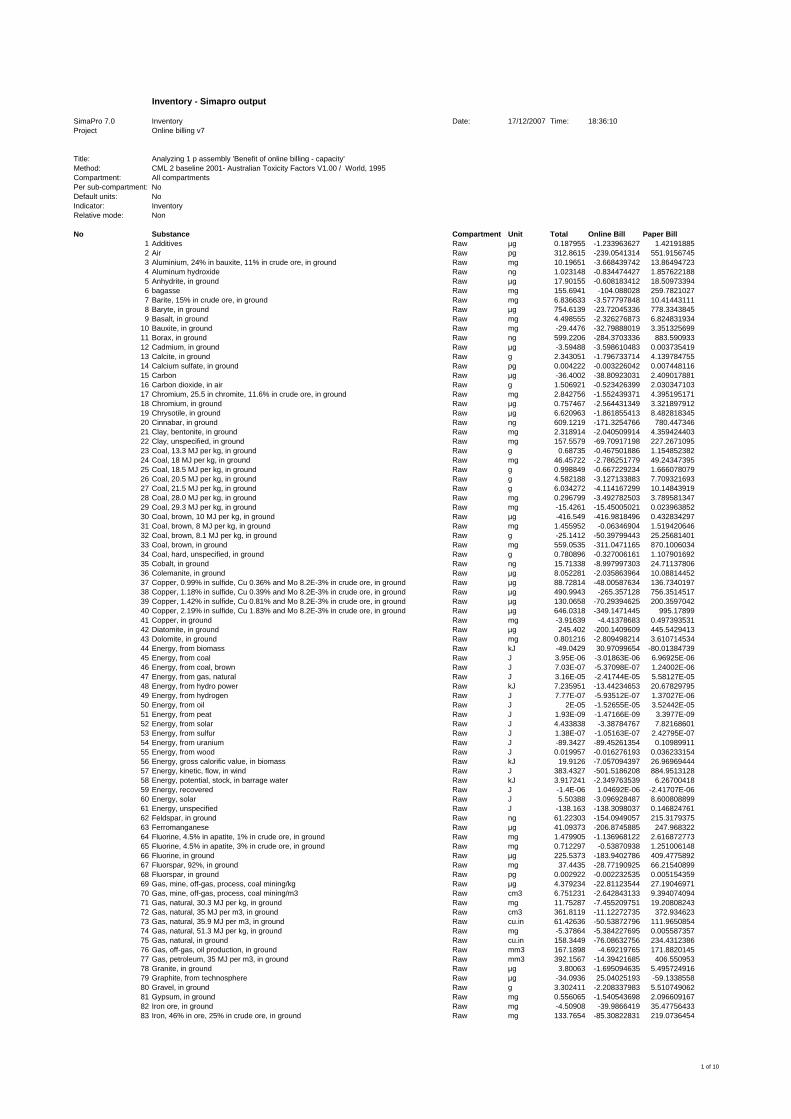
Inventory - Simapro output
SimaPro 7.0 Inventory Date: 17/12/2007 Time: 18:36:10Project Online billing v7
Title: Analyzing 1 p assembly 'Benefit of online billing - capacity'Method: CML 2 baseline 2001- Australian Toxicity Factors V1.00 / World, 1995Compartment: All compartmentsPer sub-compartment: NoDefault units: NoIndicator: InventoryRelative mode: Non
No Substance Compartment Unit Total Online Bill Paper Bill1 Additives Raw µg 0.187955 -1.233963627 1.421918852 Air Raw pg 312.8615 -239.0541314 551.91567453 Aluminium, 24% in bauxite, 11% in crude ore, in ground Raw mg 10.19651 -3.668439742 13.864947234 Aluminum hydroxide Raw ng 1.023148 -0.834474427 1.8576221885 Anhydrite, in ground Raw µg 17.90155 -0.608183412 18.509733946 bagasse Raw mg 155.6941 -104.088028 259.78210277 Barite, 15% in crude ore, in ground Raw mg 6.836633 -3.577797848 10.414431118 Baryte, in ground Raw µg 754.6139 -23.72045336 778.33438459 Basalt, in ground Raw mg 4.498555 -2.326276873 6.824831934
10 Bauxite, in ground Raw mg -29.4476 -32.79888019 3.35132569911 Borax, in ground Raw ng 599.2206 -284.3703336 883.59093312 Cadmium, in ground Raw µg -3.59488 -3.598610483 0.00373541913 Calcite, in ground Raw g 2.343051 -1.796733714 4.13978475514 Calcium sulfate, in ground Raw pg 0.004222 -0.003226042 0.00744811615 Carbon Raw µg -36.4002 -38.80923031 2.40901788116 Carbon dioxide, in air Raw g 1.506921 -0.523426399 2.03034710317 Chromium, 25.5 in chromite, 11.6% in crude ore, in ground Raw mg 2.842756 -1.552439371 4.39519517118 Chromium, in ground Raw µg 0.757467 -2.564431349 3.32189791219 Chrysotile, in ground Raw µg 6.620963 -1.861855413 8.48281834520 Cinnabar, in ground Raw ng 609.1219 -171.3254766 780.44734621 Clay, bentonite, in ground Raw mg 2.318914 -2.040509914 4.35942440322 Clay, unspecified, in ground Raw mg 157.5579 -69.70917198 227.267109523 Coal, 13.3 MJ per kg, in ground Raw g 0.68735 -0.467501886 1.15485238224 Coal, 18 MJ per kg, in ground Raw mg 46.45722 -2.786251779 49.2434739525 Coal, 18.5 MJ per kg, in ground Raw g 0.998849 -0.667229234 1.66607807926 Coal, 20.5 MJ per kg, in ground Raw g 4.582188 -3.127133883 7.70932169327 Coal, 21.5 MJ per kg, in ground Raw g 6.034272 -4.114167299 10.1484391928 Coal, 28.0 MJ per kg, in ground Raw mg 0.296799 -3.492782503 3.78958134729 Coal, 29.3 MJ per kg, in ground Raw mg -15.4261 -15.45005021 0.02396385230 Coal, brown, 10 MJ per kg, in ground Raw µg -416.549 -416.9818496 0.43283429731 Coal, brown, 8 MJ per kg, in ground Raw mg 1.455952 -0.06346904 1.51942064632 Coal, brown, 8.1 MJ per kg, in ground Raw g -25.1412 -50.39799443 25.2568140133 Coal, brown, in ground Raw mg 559.0535 -311.0471165 870.100603434 Coal, hard, unspecified, in ground Raw g 0.780896 -0.327006161 1.10790169235 Cobalt, in ground Raw ng 15.71338 -8.997997303 24.7113780636 Colemanite, in ground Raw µg 8.052281 -2.035863964 10.0881445237 Copper, 0.99% in sulfide, Cu 0.36% and Mo 8.2E-3% in crude ore, in ground Raw µg 88.72814 -48.00587634 136.734019738 Copper, 1.18% in sulfide, Cu 0.39% and Mo 8.2E-3% in crude ore, in ground Raw µg 490.9943 -265.357128 756.351451739 Copper, 1.42% in sulfide, Cu 0.81% and Mo 8.2E-3% in crude ore, in ground Raw µg 130.0658 -70.29394625 200.359704240 Copper, 2.19% in sulfide, Cu 1.83% and Mo 8.2E-3% in crude ore, in ground Raw µg 646.0318 -349.1471445 995.1789941 Copper, in ground Raw mg -3.91639 -4.41378683 0.49739353142 Diatomite, in ground Raw µg 245.402 -200.1409609 445.542941343 Dolomite, in ground Raw mg 0.801216 -2.809498214 3.61071453444 Energy, from biomass Raw kJ -49.0429 30.97099654 -80.0138473945 Energy, from coal Raw J 3.95E-06 -3.01863E-06 6.96925E-0646 Energy, from coal, brown Raw J 7.03E-07 -5.37098E-07 1.24002E-0647 Energy, from gas, natural Raw J 3.16E-05 -2.41744E-05 5.58127E-0548 Energy, from hydro power Raw kJ 7.235951 -13.44234653 20.6782979549 Energy, from hydrogen Raw J 7.77E-07 -5.93512E-07 1.37027E-0650 Energy, from oil Raw J 2E-05 -1.52655E-05 3.52442E-0551 Energy, from peat Raw J 1.93E-09 -1.47166E-09 3.3977E-0952 Energy, from solar Raw J 4.433838 -3.38784767 7.8216860153 Energy, from sulfur Raw J 1.38E-07 -1.05163E-07 2.42795E-0754 Energy, from uranium Raw J -89.3427 -89.45261354 0.1098991155 Energy, from wood Raw J 0.019957 -0.016276193 0.03623315456 Energy, gross calorific value, in biomass Raw kJ 19.9126 -7.057094397 26.9696944457 Energy, kinetic, flow, in wind Raw J 383.4327 -501.5186208 884.951312858 Energy, potential, stock, in barrage water Raw kJ 3.917241 -2.349763539 6.2670041859 Energy, recovered Raw J -1.4E-06 1.04692E-06 -2.41707E-0660 Energy, solar Raw J 5.50388 -3.096928487 8.60080889961 Energy, unspecified Raw J -138.163 -138.3098037 0.14682476162 Feldspar, in ground Raw ng 61.22303 -154.0949057 215.317937563 Ferromanganese Raw µg 41.09373 -206.8745885 247.96832264 Fluorine, 4.5% in apatite, 1% in crude ore, in ground Raw mg 1.479905 -1.136968122 2.61687277365 Fluorine, 4.5% in apatite, 3% in crude ore, in ground Raw mg 0.712297 -0.53870938 1.25100614866 Fluorine, in ground Raw µg 225.5373 -183.9402786 409.477589267 Fluorspar, 92%, in ground Raw mg 37.4435 -28.77190925 66.2154089968 Fluorspar, in ground Raw pg 0.002922 -0.002232535 0.00515435969 Gas, mine, off-gas, process, coal mining/kg Raw µg 4.379234 -22.81123544 27.1904697170 Gas, mine, off-gas, process, coal mining/m3 Raw cm3 6.751231 -2.642843133 9.39407409471 Gas, natural, 30.3 MJ per kg, in ground Raw mg 11.75287 -7.455209751 19.2080824372 Gas, natural, 35 MJ per m3, in ground Raw cm3 361.8119 -11.12272735 372.93462373 Gas, natural, 35.9 MJ per m3, in ground Raw cu.in 61.42636 -50.53872796 111.965085474 Gas, natural, 51.3 MJ per kg, in ground Raw mg -5.37864 -5.384227695 0.00558735775 Gas, natural, in ground Raw cu.in 158.3449 -76.08632756 234.431238676 Gas, off-gas, oil production, in ground Raw mm3 167.1898 -4.69219765 171.882014577 Gas, petroleum, 35 MJ per m3, in ground Raw mm3 392.1567 -14.39421685 406.55095378 Granite, in ground Raw µg 3.80063 -1.695094635 5.49572491679 Graphite, from technosphere Raw µg -34.0936 25.04025193 -59.133855880 Gravel, in ground Raw g 3.302411 -2.208337983 5.51074906281 Gypsum, in ground Raw mg 0.556065 -1.540543698 2.09660916782 Iron ore, in ground Raw mg -4.50908 -39.9866419 35.4775643383 Iron, 46% in ore, 25% in crude ore, in ground Raw mg 133.7654 -85.30822831 219.0736454
1 of 10
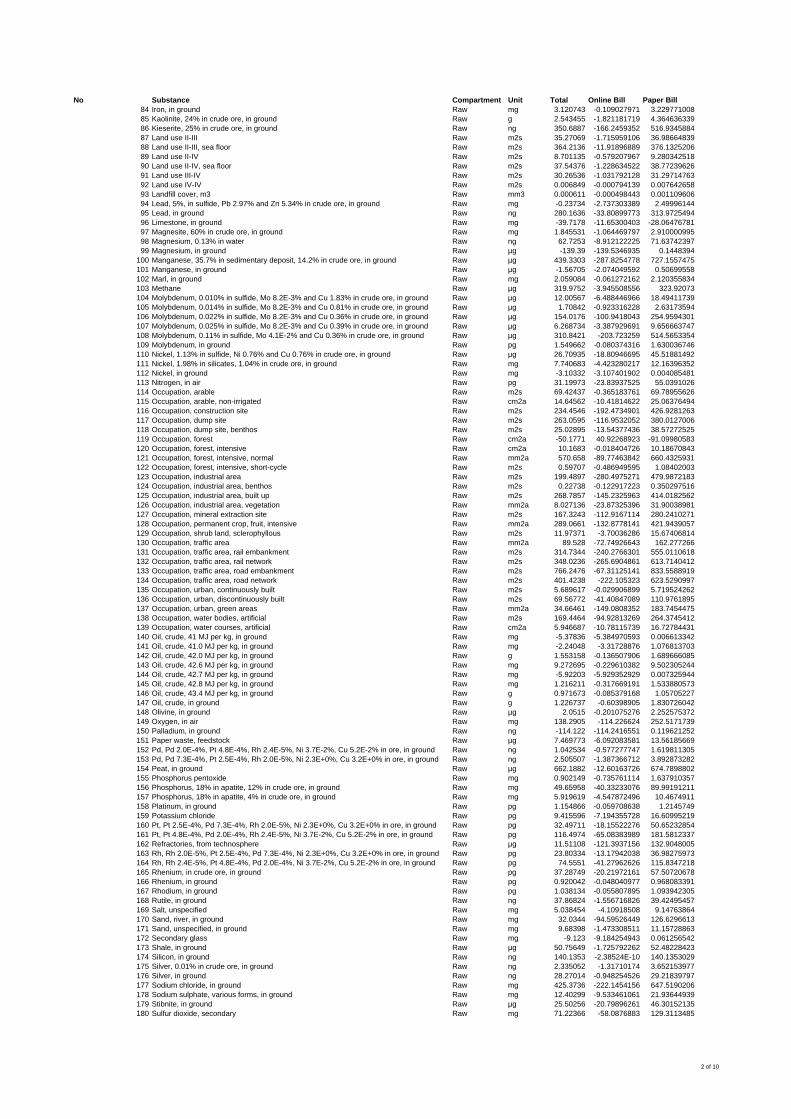
No Substance Compartment Unit Total Online Bill Paper Bill84 Iron, in ground Raw mg 3.120743 -0.109027971 3.22977100885 Kaolinite, 24% in crude ore, in ground Raw g 2.543455 -1.821181719 4.36463633986 Kieserite, 25% in crude ore, in ground Raw ng 350.6887 -166.2459352 516.934588487 Land use II-III Raw m2s 35.27069 -1.715959106 36.9866483988 Land use II-III, sea floor Raw m2s 364.2136 -11.91896889 376.132520689 Land use II-IV Raw m2s 8.701135 -0.579207967 9.28034251890 Land use II-IV, sea floor Raw m2s 37.54376 -1.228634522 38.7723962691 Land use III-IV Raw m2s 30.26536 -1.031792128 31.2971476392 Land use IV-IV Raw m2s 0.006849 -0.000794139 0.00764265893 Landfill cover, m3 Raw mm3 0.000611 -0.000498443 0.00110960694 Lead, 5%, in sulfide, Pb 2.97% and Zn 5.34% in crude ore, in ground Raw mg -0.23734 -2.737303389 2.4999614495 Lead, in ground Raw ng 280.1636 -33.80899773 313.972549496 Limestone, in ground Raw mg -39.7178 -11.65300403 -28.0647678197 Magnesite, 60% in crude ore, in ground Raw mg 1.845531 -1.064469797 2.91000099598 Magnesium, 0.13% in water Raw ng 62.7253 -8.912122225 71.6374239799 Magnesium, in ground Raw µg -139.39 -139.5346935 0.1448394
100 Manganese, 35.7% in sedimentary deposit, 14.2% in crude ore, in ground Raw µg 439.3303 -287.8254778 727.1557475101 Manganese, in ground Raw µg -1.56705 -2.074049592 0.50699558102 Marl, in ground Raw mg 2.059084 -0.061272162 2.120355834103 Methane Raw µg 319.9752 -3.945508556 323.92073104 Molybdenum, 0.010% in sulfide, Mo 8.2E-3% and Cu 1.83% in crude ore, in ground Raw µg 12.00567 -6.488446966 18.49411739105 Molybdenum, 0.014% in sulfide, Mo 8.2E-3% and Cu 0.81% in crude ore, in ground Raw µg 1.70842 -0.923316228 2.63173594106 Molybdenum, 0.022% in sulfide, Mo 8.2E-3% and Cu 0.36% in crude ore, in ground Raw µg 154.0176 -100.9418043 254.9594301107 Molybdenum, 0.025% in sulfide, Mo 8.2E-3% and Cu 0.39% in crude ore, in ground Raw µg 6.268734 -3.387929691 9.656663747108 Molybdenum, 0.11% in sulfide, Mo 4.1E-2% and Cu 0.36% in crude ore, in ground Raw µg 310.8421 -203.723259 514.5653354109 Molybdenum, in ground Raw pg 1.549662 -0.080374316 1.630036746110 Nickel, 1.13% in sulfide, Ni 0.76% and Cu 0.76% in crude ore, in ground Raw µg 26.70935 -18.80946695 45.51881492111 Nickel, 1.98% in silicates, 1.04% in crude ore, in ground Raw mg 7.740683 -4.423280217 12.16396352112 Nickel, in ground Raw mg -3.10332 -3.107401902 0.004085481113 Nitrogen, in air Raw pg 31.19973 -23.83937525 55.0391026114 Occupation, arable Raw m2s 69.42437 -0.365183761 69.78955626115 Occupation, arable, non-irrigated Raw cm2a 14.64562 -10.41814622 25.06376494116 Occupation, construction site Raw m2s 234.4546 -192.4734901 426.9281263117 Occupation, dump site Raw m2s 263.0595 -116.9532052 380.0127006118 Occupation, dump site, benthos Raw m2s 25.02895 -13.54377436 38.57272525119 Occupation, forest Raw cm2a -50.1771 40.92268923 -91.09980583120 Occupation, forest, intensive Raw cm2a 10.1683 -0.018404726 10.18670843121 Occupation, forest, intensive, normal Raw mm2a 570.658 -89.77463842 660.4325931122 Occupation, forest, intensive, short-cycle Raw m2s 0.59707 -0.486949595 1.08402003123 Occupation, industrial area Raw m2s 199.4897 -280.4975271 479.9872183124 Occupation, industrial area, benthos Raw m2s 0.22738 -0.122917223 0.350297516125 Occupation, industrial area, built up Raw m2s 268.7857 -145.2325963 414.0182562126 Occupation, industrial area, vegetation Raw mm2a 8.027136 -23.87325396 31.90038981127 Occupation, mineral extraction site Raw m2s 167.3243 -112.9167114 280.2410271128 Occupation, permanent crop, fruit, intensive Raw mm2a 289.0661 -132.8778141 421.9439057129 Occupation, shrub land, sclerophyllous Raw m2s 11.97371 -3.70036286 15.67406814130 Occupation, traffic area Raw mm2a 89.528 -72.74926643 162.277266131 Occupation, traffic area, rail embankment Raw m2s 314.7344 -240.2766301 555.0110618132 Occupation, traffic area, rail network Raw m2s 348.0236 -265.6904861 613.7140412133 Occupation, traffic area, road embankment Raw m2s 766.2476 -67.31125141 833.5588919134 Occupation, traffic area, road network Raw m2s 401.4238 -222.105323 623.5290997135 Occupation, urban, continuously built Raw m2s 5.689617 -0.029906899 5.719524262136 Occupation, urban, discontinuously built Raw m2s 69.56772 -41.40847089 110.9761895137 Occupation, urban, green areas Raw mm2a 34.66461 -149.0808352 183.7454475138 Occupation, water bodies, artificial Raw m2s 169.4464 -94.92813269 264.3745412139 Occupation, water courses, artificial Raw cm2a 5.946687 -10.78115739 16.72784431140 Oil, crude, 41 MJ per kg, in ground Raw mg -5.37836 -5.384970593 0.006613342141 Oil, crude, 41.0 MJ per kg, in ground Raw mg -2.24048 -3.31728876 1.076813703142 Oil, crude, 42.0 MJ per kg, in ground Raw g 1.553158 -0.136507906 1.689666085143 Oil, crude, 42.6 MJ per kg, in ground Raw mg 9.272695 -0.229610382 9.502305244144 Oil, crude, 42.7 MJ per kg, in ground Raw mg -5.92203 -5.929352929 0.007325944145 Oil, crude, 42.8 MJ per kg, in ground Raw mg 1.216211 -0.317669191 1.533880573146 Oil, crude, 43.4 MJ per kg, in ground Raw g 0.971673 -0.085379168 1.05705227147 Oil, crude, in ground Raw g 1.226737 -0.60398905 1.830726042148 Olivine, in ground Raw µg 2.0515 -0.201075276 2.252575372149 Oxygen, in air Raw mg 138.2905 -114.226624 252.5171739150 Palladium, in ground Raw ng -114.122 -114.2416551 0.119621252151 Paper waste, feedstock Raw µg 7.469773 -6.092083581 13.56185669152 Pd, Pd 2.0E-4%, Pt 4.8E-4%, Rh 2.4E-5%, Ni 3.7E-2%, Cu 5.2E-2% in ore, in ground Raw ng 1.042534 -0.577277747 1.619811305153 Pd, Pd 7.3E-4%, Pt 2.5E-4%, Rh 2.0E-5%, Ni 2.3E+0%, Cu 3.2E+0% in ore, in ground Raw ng 2.505507 -1.387366712 3.892873282154 Peat, in ground Raw µg 662.1882 -12.60163726 674.7898802155 Phosphorus pentoxide Raw mg 0.902149 -0.735761114 1.637910357156 Phosphorus, 18% in apatite, 12% in crude ore, in ground Raw mg 49.65958 -40.33233076 89.99191211157 Phosphorus, 18% in apatite, 4% in crude ore, in ground Raw mg 5.919619 -4.547872496 10.4674911158 Platinum, in ground Raw pg 1.154866 -0.059708638 1.2145749159 Potassium chloride Raw pg 9.415596 -7.194355728 16.60995219160 Pt, Pt 2.5E-4%, Pd 7.3E-4%, Rh 2.0E-5%, Ni 2.3E+0%, Cu 3.2E+0% in ore, in ground Raw pg 32.49711 -18.15522276 50.65232854161 Pt, Pt 4.8E-4%, Pd 2.0E-4%, Rh 2.4E-5%, Ni 3.7E-2%, Cu 5.2E-2% in ore, in ground Raw pg 116.4974 -65.08383989 181.5812337162 Refractories, from technosphere Raw µg 11.51108 -121.3937156 132.9048005163 Rh, Rh 2.0E-5%, Pt 2.5E-4%, Pd 7.3E-4%, Ni 2.3E+0%, Cu 3.2E+0% in ore, in ground Raw pg 23.80334 -13.17942038 36.98275973164 Rh, Rh 2.4E-5%, Pt 4.8E-4%, Pd 2.0E-4%, Ni 3.7E-2%, Cu 5.2E-2% in ore, in ground Raw pg 74.5551 -41.27962626 115.8347218165 Rhenium, in crude ore, in ground Raw pg 37.28749 -20.21972161 57.50720678166 Rhenium, in ground Raw pg 0.920042 -0.048040977 0.968083391167 Rhodium, in ground Raw pg 1.038134 -0.055807895 1.093942305168 Rutile, in ground Raw ng 37.86824 -1.556716826 39.42495457169 Salt, unspecified Raw mg 5.038454 -4.10918508 9.14763864170 Sand, river, in ground Raw mg 32.0344 -94.59526449 126.6296613171 Sand, unspecified, in ground Raw mg 9.68398 -1.473308511 11.15728863172 Secondary glass Raw mg -9.123 -9.184254943 0.061256542173 Shale, in ground Raw µg 50.75649 -1.725792262 52.48228423174 Silicon, in ground Raw ng 140.1353 -2.38524E-10 140.1353029175 Silver, 0.01% in crude ore, in ground Raw ng 2.335052 -1.31710174 3.652153977176 Silver, in ground Raw ng 28.27014 -0.948254526 29.21839797177 Sodium chloride, in ground Raw mg 425.3736 -222.1454156 647.5190206178 Sodium sulphate, various forms, in ground Raw mg 12.40299 -9.533461061 21.93644939179 Stibnite, in ground Raw µg 25.50256 -20.79896261 46.30152135180 Sulfur dioxide, secondary Raw mg 71.22366 -58.0876883 129.3113485
2 of 10
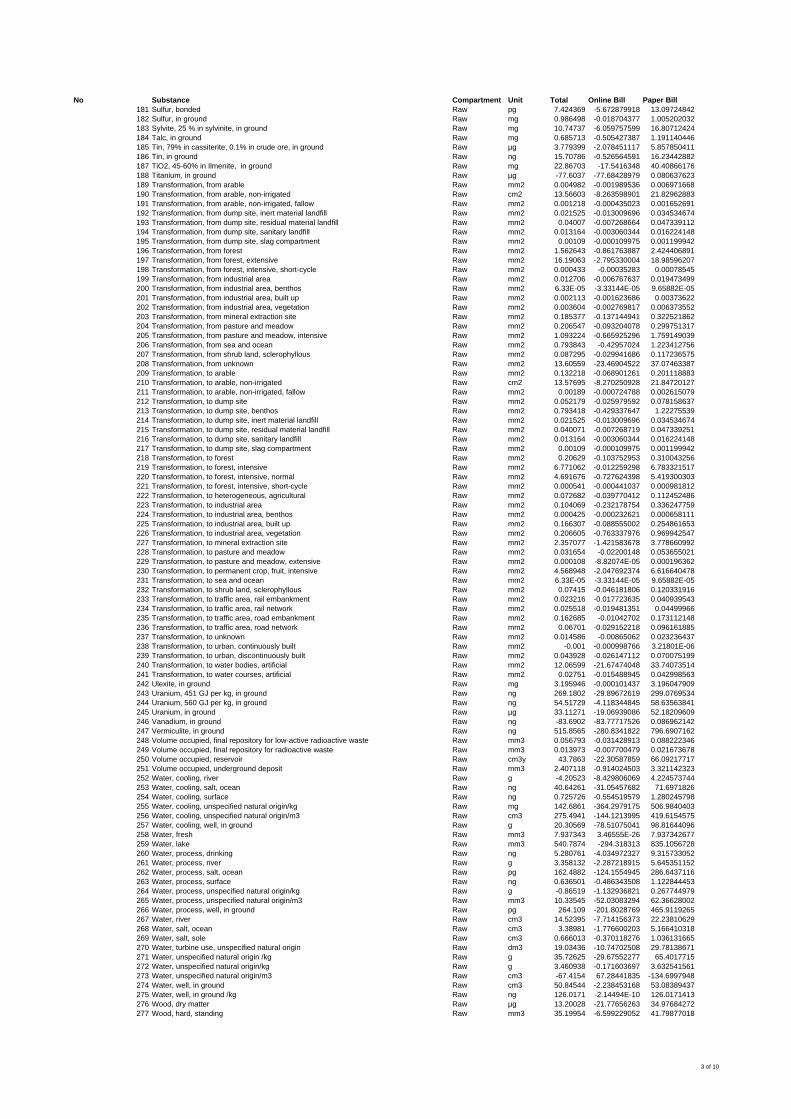
No Substance Compartment Unit Total Online Bill Paper Bill181 Sulfur, bonded Raw pg 7.424369 -5.672879918 13.09724842182 Sulfur, in ground Raw mg 0.986498 -0.018704377 1.005202032183 Sylvite, 25 % in sylvinite, in ground Raw mg 10.74737 -6.059757599 16.80712424184 Talc, in ground Raw mg 0.685713 -0.505427387 1.191140446185 Tin, 79% in cassiterite, 0.1% in crude ore, in ground Raw µg 3.779399 -2.078451117 5.857850411186 Tin, in ground Raw ng 15.70786 -0.526564591 16.23442882187 TiO2, 45-60% in Ilmenite, in ground Raw mg 22.86703 -17.5416348 40.40866176188 Titanium, in ground Raw µg -77.6037 -77.68428979 0.080637623189 Transformation, from arable Raw mm2 0.004982 -0.001989536 0.006971668190 Transformation, from arable, non-irrigated Raw cm2 13.56603 -8.263598901 21.82962883191 Transformation, from arable, non-irrigated, fallow Raw mm2 0.001218 -0.000435023 0.001652691192 Transformation, from dump site, inert material landfill Raw mm2 0.021525 -0.013009696 0.034534674193 Transformation, from dump site, residual material landfill Raw mm2 0.04007 -0.007268664 0.047339112194 Transformation, from dump site, sanitary landfill Raw mm2 0.013164 -0.003060344 0.016224148195 Transformation, from dump site, slag compartment Raw mm2 0.00109 -0.000109975 0.001199942196 Transformation, from forest Raw mm2 1.562643 -0.861763887 2.424406891197 Transformation, from forest, extensive Raw mm2 16.19063 -2.795330004 18.98596207198 Transformation, from forest, intensive, short-cycle Raw mm2 0.000433 -0.00035283 0.00078545199 Transformation, from industrial area Raw mm2 0.012706 -0.006767637 0.019473499200 Transformation, from industrial area, benthos Raw mm2 6.33E-05 -3.33144E-05 9.65882E-05201 Transformation, from industrial area, built up Raw mm2 0.002113 -0.001623686 0.00373622202 Transformation, from industrial area, vegetation Raw mm2 0.003604 -0.002769817 0.006373552203 Transformation, from mineral extraction site Raw mm2 0.185377 -0.137144941 0.322521862204 Transformation, from pasture and meadow Raw mm2 0.206547 -0.093204078 0.299751317205 Transformation, from pasture and meadow, intensive Raw mm2 1.093224 -0.665925296 1.759149039206 Transformation, from sea and ocean Raw mm2 0.793843 -0.42957024 1.223412756207 Transformation, from shrub land, sclerophyllous Raw mm2 0.087295 -0.029941686 0.117236575208 Transformation, from unknown Raw mm2 13.60559 -23.46904522 37.07463387209 Transformation, to arable Raw mm2 0.132218 -0.068901261 0.201118883210 Transformation, to arable, non-irrigated Raw cm2 13.57695 -8.270250928 21.84720127211 Transformation, to arable, non-irrigated, fallow Raw mm2 0.00189 -0.000724788 0.002615079212 Transformation, to dump site Raw mm2 0.052179 -0.025979592 0.078158637213 Transformation, to dump site, benthos Raw mm2 0.793418 -0.429337647 1.22275539214 Transformation, to dump site, inert material landfill Raw mm2 0.021525 -0.013009696 0.034534674215 Transformation, to dump site, residual material landfill Raw mm2 0.040071 -0.007268719 0.047339251216 Transformation, to dump site, sanitary landfill Raw mm2 0.013164 -0.003060344 0.016224148217 Transformation, to dump site, slag compartment Raw mm2 0.00109 -0.000109975 0.001199942218 Transformation, to forest Raw mm2 0.20629 -0.103752953 0.310043256219 Transformation, to forest, intensive Raw mm2 6.771062 -0.012259298 6.783321517220 Transformation, to forest, intensive, normal Raw mm2 4.691676 -0.727624398 5.419300303221 Transformation, to forest, intensive, short-cycle Raw mm2 0.000541 -0.000441037 0.000981812222 Transformation, to heterogeneous, agricultural Raw mm2 0.072682 -0.039770412 0.112452486223 Transformation, to industrial area Raw mm2 0.104069 -0.232178754 0.336247759224 Transformation, to industrial area, benthos Raw mm2 0.000425 -0.000232621 0.000658111225 Transformation, to industrial area, built up Raw mm2 0.166307 -0.088555002 0.254861653226 Transformation, to industrial area, vegetation Raw mm2 0.206605 -0.763337976 0.969942547227 Transformation, to mineral extraction site Raw mm2 2.357077 -1.421583678 3.778660992228 Transformation, to pasture and meadow Raw mm2 0.031654 -0.02200148 0.053655021229 Transformation, to pasture and meadow, extensive Raw mm2 0.000108 -8.82074E-05 0.000196362230 Transformation, to permanent crop, fruit, intensive Raw mm2 4.568948 -2.047692374 6.616640478231 Transformation, to sea and ocean Raw mm2 6.33E-05 -3.33144E-05 9.65882E-05232 Transformation, to shrub land, sclerophyllous Raw mm2 0.07415 -0.046181806 0.120331916233 Transformation, to traffic area, rail embankment Raw mm2 0.023216 -0.017723635 0.040939543234 Transformation, to traffic area, rail network Raw mm2 0.025518 -0.019481351 0.04499966235 Transformation, to traffic area, road embankment Raw mm2 0.162685 -0.01042702 0.173112148236 Transformation, to traffic area, road network Raw mm2 0.06701 -0.029152218 0.096161885237 Transformation, to unknown Raw mm2 0.014586 -0.00865062 0.023236437238 Transformation, to urban, continuously built Raw mm2 -0.001 -0.000998766 3.21801E-06239 Transformation, to urban, discontinuously built Raw mm2 0.043928 -0.026147112 0.070075199240 Transformation, to water bodies, artificial Raw mm2 12.06599 -21.67474048 33.74073514241 Transformation, to water courses, artificial Raw mm2 0.02751 -0.015488945 0.042998563242 Ulexite, in ground Raw mg 3.195946 -0.000101437 3.196047909243 Uranium, 451 GJ per kg, in ground Raw ng 269.1802 -29.89672619 299.0769534244 Uranium, 560 GJ per kg, in ground Raw ng 54.51729 -4.118344845 58.63563841245 Uranium, in ground Raw µg 33.11271 -19.06939086 52.18209609246 Vanadium, in ground Raw ng -83.6902 -83.77717526 0.086962142247 Vermiculite, in ground Raw ng 515.8565 -280.8341822 796.6907162248 Volume occupied, final repository for low-active radioactive waste Raw mm3 0.056793 -0.031428913 0.088222346249 Volume occupied, final repository for radioactive waste Raw mm3 0.013973 -0.007700479 0.021673678250 Volume occupied, reservoir Raw cm3y 43.7863 -22.30587859 66.09217717251 Volume occupied, underground deposit Raw mm3 2.407118 -0.914024503 3.321142323252 Water, cooling, river Raw g -4.20523 -8.429806069 4.224573744253 Water, cooling, salt, ocean Raw ng 40.64261 -31.05457682 71.6971826254 Water, cooling, surface Raw ng 0.725726 -0.554519579 1.280245798255 Water, cooling, unspecified natural origin/kg Raw mg 142.6861 -364.2979175 506.9840403256 Water, cooling, unspecified natural origin/m3 Raw cm3 275.4941 -144.1213995 419.6154575257 Water, cooling, well, in ground Raw g 20.30569 -78.51075041 98.81644096258 Water, fresh Raw mm3 7.937343 3.46555E-26 7.937342677259 Water, lake Raw mm3 540.7874 -294.318313 835.1056728260 Water, process, drinking Raw ng 5.280761 -4.034972327 9.315733052261 Water, process, river Raw g 3.358132 -2.287218915 5.645351152262 Water, process, salt, ocean Raw pg 162.4882 -124.1554945 286.6437116263 Water, process, surface Raw ng 0.636501 -0.486343508 1.122844453264 Water, process, unspecified natural origin/kg Raw g -0.86519 -1.132936821 0.267744979265 Water, process, unspecified natural origin/m3 Raw mm3 10.33545 -52.03083294 62.36628002266 Water, process, well, in ground Raw pg 264.109 -201.8028769 465.9119265267 Water, river Raw cm3 14.52395 -7.714156373 22.23810629268 Water, salt, ocean Raw cm3 3.38981 -1.776600203 5.166410318269 Water, salt, sole Raw cm3 0.666013 -0.370118276 1.036131665270 Water, turbine use, unspecified natural origin Raw dm3 19.03436 -10.74702508 29.78138671271 Water, unspecified natural origin /kg Raw g 35.72625 -29.67552277 65.4017715272 Water, unspecified natural origin/kg Raw g 3.460938 -0.171603697 3.632541561273 Water, unspecified natural origin/m3 Raw cm3 -67.4154 67.28441835 -134.6997948274 Water, well, in ground Raw cm3 50.84544 -2.238453168 53.08389437275 Water, well, in ground /kg Raw ng 126.0171 -2.14494E-10 126.0171413276 Wood, dry matter Raw µg 13.20028 -21.77656263 34.97684272277 Wood, hard, standing Raw mm3 35.19954 -6.599229052 41.79877018
3 of 10
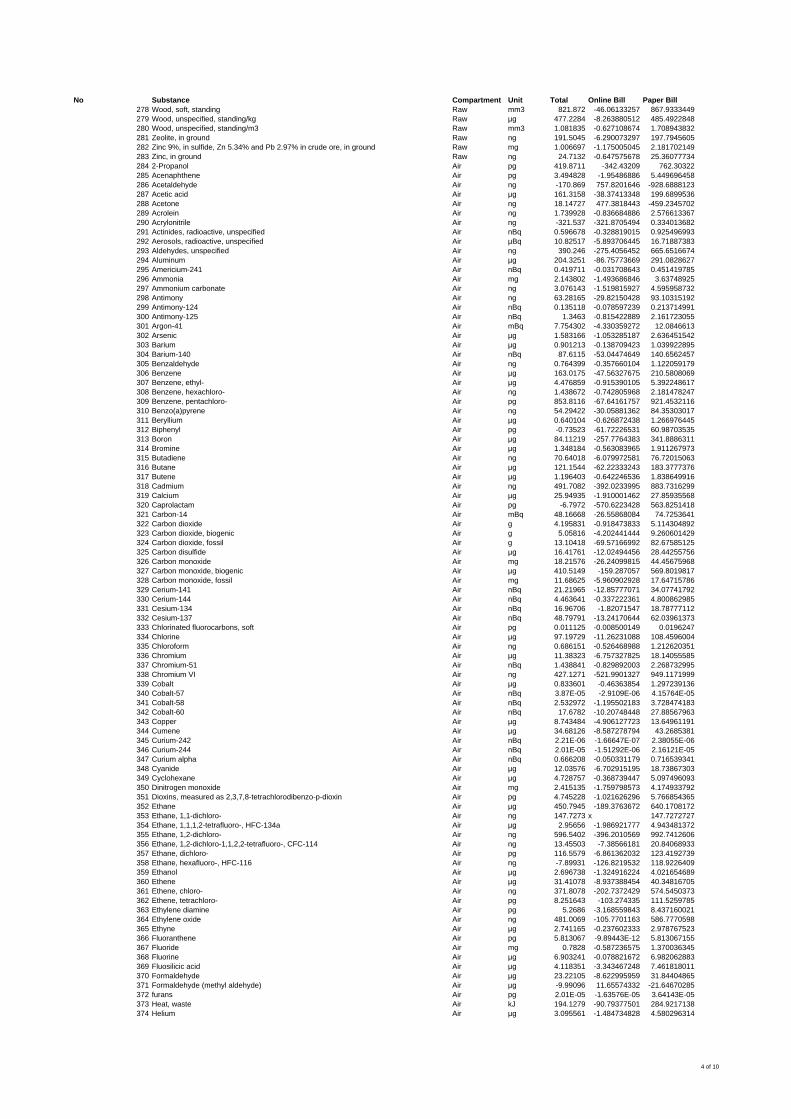
No Substance Compartment Unit Total Online Bill Paper Bill278 Wood, soft, standing Raw mm3 821.872 -46.06133257 867.9333449279 Wood, unspecified, standing/kg Raw µg 477.2284 -8.263880512 485.4922848280 Wood, unspecified, standing/m3 Raw mm3 1.081835 -0.627108674 1.708943832281 Zeolite, in ground Raw ng 191.5045 -6.290073297 197.7945605282 Zinc 9%, in sulfide, Zn 5.34% and Pb 2.97% in crude ore, in ground Raw mg 1.006697 -1.175005045 2.181702149283 Zinc, in ground Raw ng 24.7132 -0.647575678 25.36077734284 2-Propanol Air pg 419.8711 -342.43209 762.30322285 Acenaphthene Air pg 3.494828 -1.95486886 5.449696458286 Acetaldehyde Air ng -170.869 757.8201646 -928.6888123287 Acetic acid Air µg 161.3158 -38.37413348 199.6899536288 Acetone Air ng 18.14727 477.3818443 -459.2345702289 Acrolein Air ng 1.739928 -0.836684886 2.576613367290 Acrylonitrile Air ng -321.537 -321.8705494 0.334013682291 Actinides, radioactive, unspecified Air nBq 0.596678 -0.328819015 0.925496993292 Aerosols, radioactive, unspecified Air µBq 10.82517 -5.893706445 16.71887383293 Aldehydes, unspecified Air ng 390.246 -275.4056452 665.6516674294 Aluminum Air µg 204.3251 -86.75773669 291.0828627295 Americium-241 Air nBq 0.419711 -0.031708643 0.451419785296 Ammonia Air mg 2.143802 -1.493686846 3.63748925297 Ammonium carbonate Air ng 3.076143 -1.519815927 4.595958732298 Antimony Air ng 63.28165 -29.82150428 93.10315192299 Antimony-124 Air nBq 0.135118 -0.078597239 0.213714991300 Antimony-125 Air nBq 1.3463 -0.815422889 2.161723055301 Argon-41 Air mBq 7.754302 -4.330359272 12.0846613302 Arsenic Air µg 1.583166 -1.053285187 2.636451542303 Barium Air µg 0.901213 -0.138709423 1.039922895304 Barium-140 Air nBq 87.6115 -53.04474649 140.6562457305 Benzaldehyde Air ng 0.764399 -0.357660104 1.122059179306 Benzene Air µg 163.0175 -47.56327675 210.5808069307 Benzene, ethyl- Air µg 4.476859 -0.915390105 5.392248617308 Benzene, hexachloro- Air ng 1.438672 -0.742805968 2.181478247309 Benzene, pentachloro- Air pg 853.8116 -67.64161757 921.4532116310 Benzo(a)pyrene Air ng 54.29422 -30.05881362 84.35303017311 Beryllium Air µg 0.640104 -0.626872438 1.266976445312 Biphenyl Air pg -0.73523 -61.72226531 60.98703535313 Boron Air µg 84.11219 -257.7764383 341.8886311314 Bromine Air µg 1.348184 -0.563083965 1.911267973315 Butadiene Air ng 70.64018 -6.079972581 76.72015063316 Butane Air µg 121.1544 -62.22333243 183.3777376317 Butene Air µg 1.196403 -0.642246536 1.838649916318 Cadmium Air ng 491.7082 -392.0233995 883.7316299319 Calcium Air µg 25.94935 -1.910001462 27.85935568320 Caprolactam Air pg -6.7972 -570.6223428 563.8251418321 Carbon-14 Air mBq 48.16668 -26.55868084 74.7253641322 Carbon dioxide Air g 4.195831 -0.918473833 5.114304892323 Carbon dioxide, biogenic Air g 5.05816 -4.202441444 9.260601429324 Carbon dioxide, fossil Air g 13.10418 -69.57166992 82.67585125325 Carbon disulfide Air µg 16.41761 -12.02494456 28.44255756326 Carbon monoxide Air mg 18.21576 -26.24099815 44.45675968327 Carbon monoxide, biogenic Air µg 410.5149 -159.287057 569.8019817328 Carbon monoxide, fossil Air mg 11.68625 -5.960902928 17.64715786329 Cerium-141 Air nBq 21.21965 -12.85777071 34.07741792330 Cerium-144 Air nBq 4.463641 -0.337222361 4.800862985331 Cesium-134 Air nBq 16.96706 -1.82071547 18.78777112332 Cesium-137 Air nBq 48.79791 -13.24170644 62.03961373333 Chlorinated fluorocarbons, soft Air pg 0.011125 -0.008500149 0.0196247334 Chlorine Air µg 97.19729 -11.26231088 108.4596004335 Chloroform Air ng 0.686151 -0.526468988 1.212620351336 Chromium Air µg 11.38323 -6.757327825 18.14055585337 Chromium-51 Air nBq 1.438841 -0.829892003 2.268732995338 Chromium VI Air ng 427.1271 -521.9901327 949.1171999339 Cobalt Air µg 0.833601 -0.46363854 1.297239136340 Cobalt-57 Air nBq 3.87E-05 -2.9109E-06 4.15764E-05341 Cobalt-58 Air nBq 2.532972 -1.195502183 3.728474183342 Cobalt-60 Air nBq 17.6782 -10.20748448 27.88567963343 Copper Air µg 8.743484 -4.906127723 13.64961191344 Cumene Air µg 34.68126 -8.587278794 43.2685381345 Curium-242 Air nBq 2.21E-06 -1.66647E-07 2.38055E-06346 Curium-244 Air nBq 2.01E-05 -1.51292E-06 2.16121E-05347 Curium alpha Air nBq 0.666208 -0.050331179 0.716539341348 Cyanide Air µg 12.03576 -6.702915195 18.73867303349 Cyclohexane Air µg 4.728757 -0.368739447 5.097496093350 Dinitrogen monoxide Air mg 2.415135 -1.759798573 4.174933792351 Dioxins, measured as 2,3,7,8-tetrachlorodibenzo-p-dioxin Air pg 4.745228 -1.021626296 5.766854365352 Ethane Air µg 450.7945 -189.3763672 640.1708172353 Ethane, 1,1-dichloro- Air ng 147.7273 x 147.7272727354 Ethane, 1,1,1,2-tetrafluoro-, HFC-134a Air µg 2.95656 -1.986921777 4.943481372355 Ethane, 1,2-dichloro- Air ng 596.5402 -396.2010569 992.7412606356 Ethane, 1,2-dichloro-1,1,2,2-tetrafluoro-, CFC-114 Air ng 13.45503 -7.38566181 20.84068933357 Ethane, dichloro- Air pg 116.5579 -6.861362032 123.4192739358 Ethane, hexafluoro-, HFC-116 Air ng -7.89931 -126.8219532 118.9226409359 Ethanol Air µg 2.696738 -1.324916224 4.021654689360 Ethene Air µg 31.41078 -8.937388454 40.34816705361 Ethene, chloro- Air ng 371.8078 -202.7372429 574.5450373362 Ethene, tetrachloro- Air pg 8.251643 -103.274335 111.5259785363 Ethylene diamine Air pg 5.2686 -3.168559843 8.437160021364 Ethylene oxide Air ng 481.0069 -105.7701163 586.7770598365 Ethyne Air µg 2.741165 -0.237602333 2.978767523366 Fluoranthene Air pg 5.813067 -9.89443E-12 5.813067155367 Fluoride Air mg 0.7828 -0.587236575 1.370036345368 Fluorine Air µg 6.903241 -0.078821672 6.982062883369 Fluosilicic acid Air µg 4.118351 -3.343467248 7.461818011370 Formaldehyde Air µg 23.22105 -8.622995959 31.84404865371 Formaldehyde (methyl aldehyde) Air µg -9.99096 11.65574332 -21.64670285372 furans Air pg 2.01E-05 -1.63576E-05 3.64143E-05373 Heat, waste Air kJ 194.1279 -90.79377501 284.9217138374 Helium Air µg 3.095561 -1.484734828 4.580296314
4 of 10
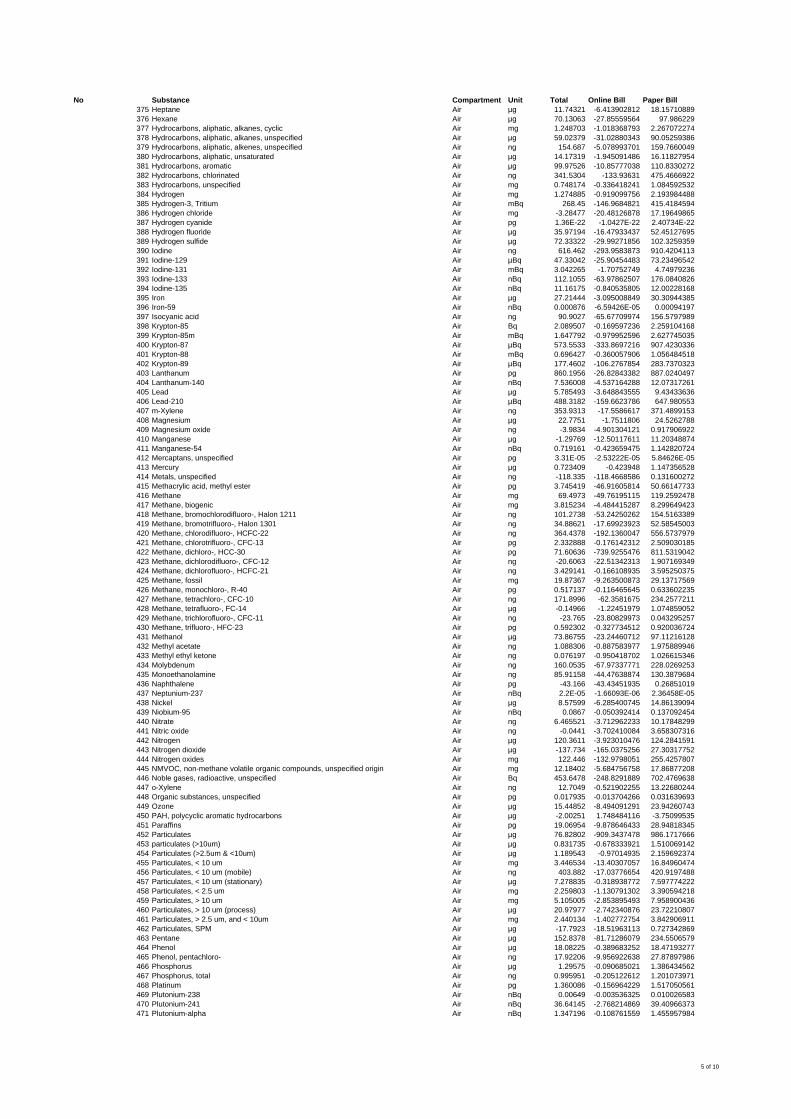
No Substance Compartment Unit Total Online Bill Paper Bill375 Heptane Air µg 11.74321 -6.413902812 18.15710889376 Hexane Air µg 70.13063 -27.85559564 97.986229377 Hydrocarbons, aliphatic, alkanes, cyclic Air mg 1.248703 -1.018368793 2.267072274378 Hydrocarbons, aliphatic, alkanes, unspecified Air µg 59.02379 -31.02880343 90.05259386379 Hydrocarbons, aliphatic, alkenes, unspecified Air ng 154.687 -5.078993701 159.7660049380 Hydrocarbons, aliphatic, unsaturated Air µg 14.17319 -1.945091486 16.11827954381 Hydrocarbons, aromatic Air µg 99.97526 -10.85777038 110.8330272382 Hydrocarbons, chlorinated Air ng 341.5304 -133.93631 475.4666922383 Hydrocarbons, unspecified Air mg 0.748174 -0.336418241 1.084592532384 Hydrogen Air mg 1.274885 -0.919099756 2.193984488385 Hydrogen-3, Tritium Air mBq 268.45 -146.9684821 415.4184594386 Hydrogen chloride Air mg -3.28477 -20.48126878 17.19649865387 Hydrogen cyanide Air pg 1.36E-22 -1.0427E-22 2.40734E-22388 Hydrogen fluoride Air µg 35.97194 -16.47933437 52.45127695389 Hydrogen sulfide Air µg 72.33322 -29.99271856 102.3259359390 Iodine Air ng 616.462 -293.9583873 910.4204113391 Iodine-129 Air µBq 47.33042 -25.90454483 73.23496542392 Iodine-131 Air mBq 3.042265 -1.70752749 4.74979236393 Iodine-133 Air nBq 112.1055 -63.97862507 176.0840826394 Iodine-135 Air nBq 11.16175 -0.840535805 12.00228168395 Iron Air µg 27.21444 -3.095008849 30.30944385396 Iron-59 Air nBq 0.000876 -6.59426E-05 0.00094197397 Isocyanic acid Air ng 90.9027 -65.67709974 156.5797989398 Krypton-85 Air Bq 2.089507 -0.169597236 2.259104168399 Krypton-85m Air mBq 1.647792 -0.979952596 2.627745035400 Krypton-87 Air µBq 573.5533 -333.8697216 907.4230336401 Krypton-88 Air mBq 0.696427 -0.360057906 1.056484518402 Krypton-89 Air µBq 177.4602 -106.2767854 283.7370323403 Lanthanum Air pg 860.1956 -26.82843382 887.0240497404 Lanthanum-140 Air nBq 7.536008 -4.537164288 12.07317261405 Lead Air µg 5.785493 -3.648843555 9.43433636406 Lead-210 Air µBq 488.3182 -159.6623786 647.980553407 m-Xylene Air ng 353.9313 -17.5586617 371.4899153408 Magnesium Air µg 22.7751 -1.7511806 24.5262788409 Magnesium oxide Air ng -3.9834 -4.901304121 0.917906922410 Manganese Air µg -1.29769 -12.50117611 11.20348874411 Manganese-54 Air nBq 0.719161 -0.423659475 1.142820724412 Mercaptans, unspecified Air pg 3.31E-05 -2.53222E-05 5.84626E-05413 Mercury Air µg 0.723409 -0.423948 1.147356528414 Metals, unspecified Air ng -118.335 -118.4668586 0.131600272415 Methacrylic acid, methyl ester Air pg 3.745419 -46.91605814 50.66147733416 Methane Air mg 69.4973 -49.76195115 119.2592478417 Methane, biogenic Air mg 3.815234 -4.484415287 8.299649423418 Methane, bromochlorodifluoro-, Halon 1211 Air ng 101.2738 -53.24250262 154.5163389419 Methane, bromotrifluoro-, Halon 1301 Air ng 34.88621 -17.69923923 52.58545003420 Methane, chlorodifluoro-, HCFC-22 Air ng 364.4378 -192.1360047 556.5737979421 Methane, chlorotrifluoro-, CFC-13 Air pg 2.332888 -0.176142312 2.509030185422 Methane, dichloro-, HCC-30 Air pg 71.60636 -739.9255476 811.5319042423 Methane, dichlorodifluoro-, CFC-12 Air ng -20.6063 -22.51342313 1.907169349424 Methane, dichlorofluoro-, HCFC-21 Air ng 3.429141 -0.166108935 3.595250375425 Methane, fossil Air mg 19.87367 -9.263500873 29.13717569426 Methane, monochloro-, R-40 Air pg 0.517137 -0.116465645 0.633602235427 Methane, tetrachloro-, CFC-10 Air ng 171.8996 -62.3581675 234.2577211428 Methane, tetrafluoro-, FC-14 Air µg -0.14966 -1.22451979 1.074859052429 Methane, trichlorofluoro-, CFC-11 Air ng -23.765 -23.80829973 0.043295257430 Methane, trifluoro-, HFC-23 Air pg 0.592302 -0.327734512 0.920036724431 Methanol Air µg 73.86755 -23.24460712 97.11216128432 Methyl acetate Air ng 1.088306 -0.887583977 1.975889946433 Methyl ethyl ketone Air ng 0.076197 -0.950418702 1.026615346434 Molybdenum Air ng 160.0535 -67.97337771 228.0269253435 Monoethanolamine Air ng 85.91158 -44.47638874 130.3879684436 Naphthalene Air pg -43.166 -43.43451935 0.26851019437 Neptunium-237 Air nBq 2.2E-05 -1.66093E-06 2.36458E-05438 Nickel Air µg 8.57599 -6.285400745 14.86139094439 Niobium-95 Air nBq 0.0867 -0.050392414 0.137092454440 Nitrate Air ng 6.465521 -3.712962233 10.17848299441 Nitric oxide Air ng -0.0441 -3.702410084 3.658307316442 Nitrogen Air µg 120.3611 -3.923010476 124.2841591443 Nitrogen dioxide Air µg -137.734 -165.0375256 27.30317752444 Nitrogen oxides Air mg 122.446 -132.9798051 255.4257807445 NMVOC, non-methane volatile organic compounds, unspecified origin Air mg 12.18402 -5.684756758 17.86877208446 Noble gases, radioactive, unspecified Air Bq 453.6478 -248.8291889 702.4769638447 o-Xylene Air ng 12.7049 -0.521902255 13.22680244448 Organic substances, unspecified Air pg 0.017935 -0.013704266 0.031639693449 Ozone Air µg 15.44852 -8.494091291 23.94260743450 PAH, polycyclic aromatic hydrocarbons Air µg -2.00251 1.748484116 -3.75099535451 Paraffins Air pg 19.06954 -9.878646433 28.94818345452 Particulates Air µg 76.82802 -909.3437478 986.1717666453 particulates (>10um) Air µg 0.831735 -0.678333921 1.510069142454 Particulates (>2.5um & <10um) Air µg 1.189543 -0.97014935 2.159692374455 Particulates, < 10 um Air mg 3.446534 -13.40307057 16.84960474456 Particulates, < 10 um (mobile) Air ng 403.882 -17.03776654 420.9197488457 Particulates, < 10 um (stationary) Air µg 7.278835 -0.318938772 7.597774222458 Particulates, < 2.5 um Air mg 2.259803 -1.130791302 3.390594218459 Particulates, > 10 um Air mg 5.105005 -2.853895493 7.958900436460 Particulates, > 10 um (process) Air µg 20.97977 -2.742340876 23.72210807461 Particulates, > 2.5 um, and < 10um Air mg 2.440134 -1.402772754 3.842906911462 Particulates, SPM Air µg -17.7923 -18.51963113 0.727342869463 Pentane Air µg 152.8378 -81.71286079 234.5506579464 Phenol Air µg 18.08225 -0.389683252 18.47193277465 Phenol, pentachloro- Air ng 17.92206 -9.956922638 27.87897986466 Phosphorus Air µg 1.29575 -0.090685021 1.386434562467 Phosphorus, total Air ng 0.995951 -0.205122612 1.201073971468 Platinum Air pg 1.360086 -0.156964229 1.517050561469 Plutonium-238 Air nBq 0.00649 -0.003536325 0.010026583470 Plutonium-241 Air nBq 36.64145 -2.768214869 39.40966373471 Plutonium-alpha Air nBq 1.347196 -0.108761559 1.455957984
5 of 10
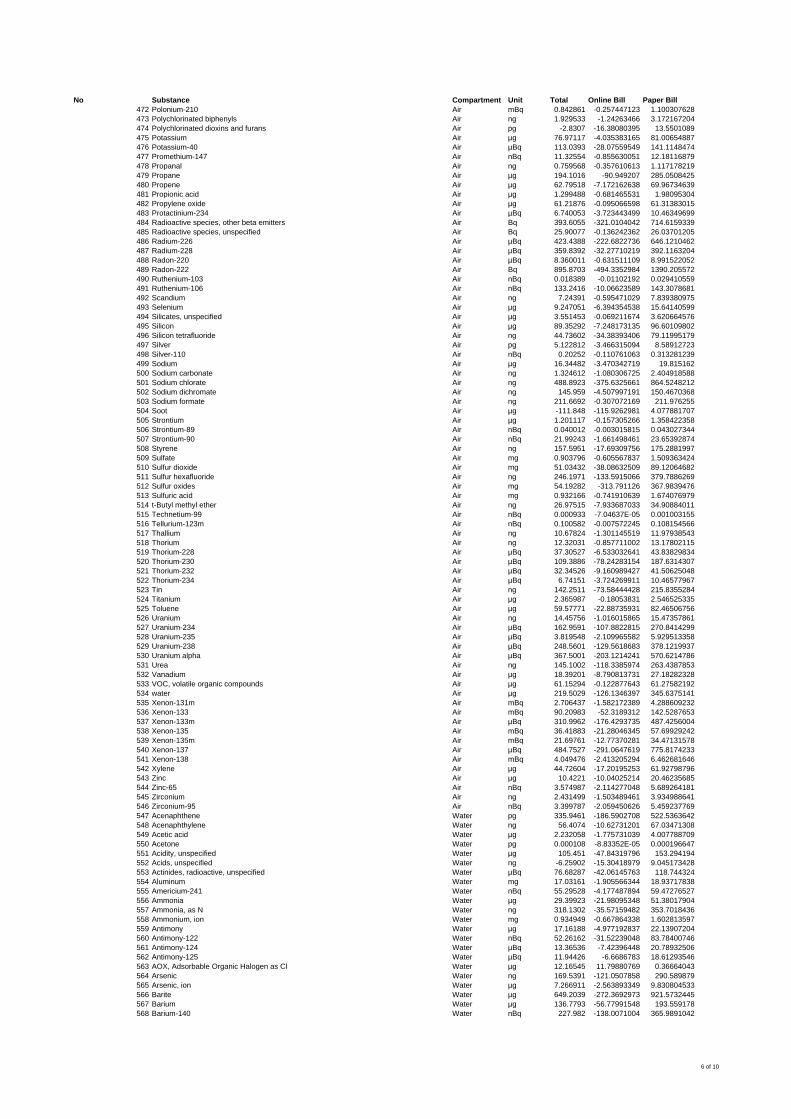
No Substance Compartment Unit Total Online Bill Paper Bill472 Polonium-210 Air mBq 0.842861 -0.257447123 1.100307628473 Polychlorinated biphenyls Air ng 1.929533 -1.24263466 3.172167204474 Polychlorinated dioxins and furans Air pg -2.8307 -16.38080395 13.5501089475 Potassium Air µg 76.97117 -4.035383165 81.00654887476 Potassium-40 Air µBq 113.0393 -28.07559549 141.1148474477 Promethium-147 Air nBq 11.32554 -0.855630051 12.18116879478 Propanal Air ng 0.759568 -0.357610613 1.117178219479 Propane Air µg 194.1016 -90.949207 285.0508425480 Propene Air µg 62.79518 -7.172162638 69.96734639481 Propionic acid Air µg 1.299488 -0.681465531 1.98095304482 Propylene oxide Air µg 61.21876 -0.095066598 61.31383015483 Protactinium-234 Air µBq 6.740053 -3.723443499 10.46349699484 Radioactive species, other beta emitters Air Bq 393.6055 -321.0104042 714.6159339485 Radioactive species, unspecified Air Bq 25.90077 -0.136242362 26.03701205486 Radium-226 Air µBq 423.4388 -222.6822736 646.1210462487 Radium-228 Air µBq 359.8392 -32.27710219 392.1163204488 Radon-220 Air µBq 8.360011 -0.631511109 8.991522052489 Radon-222 Air Bq 895.8703 -494.3352984 1390.205572490 Ruthenium-103 Air nBq 0.018389 -0.01102192 0.029410559491 Ruthenium-106 Air nBq 133.2416 -10.06623589 143.3078681492 Scandium Air ng 7.24391 -0.595471029 7.839380975493 Selenium Air µg 9.247051 -6.394354538 15.64140599494 Silicates, unspecified Air µg 3.551453 -0.069211674 3.620664576495 Silicon Air µg 89.35292 -7.248173135 96.60109802496 Silicon tetrafluoride Air ng 44.73602 -34.38393406 79.11995179497 Silver Air pg 5.122812 -3.466315094 8.58912723498 Silver-110 Air nBq 0.20252 -0.110761063 0.313281239499 Sodium Air µg 16.34482 -3.470342719 19.815162500 Sodium carbonate Air ng 1.324612 -1.080306725 2.404918588501 Sodium chlorate Air ng 488.8923 -375.6325661 864.5248212502 Sodium dichromate Air ng 145.959 -4.507997191 150.4670368503 Sodium formate Air ng 211.6692 -0.307072169 211.976255504 Soot Air µg -111.848 -115.9262981 4.077881707505 Strontium Air µg 1.201117 -0.157305266 1.358422358506 Strontium-89 Air nBq 0.040012 -0.003015815 0.043027344507 Strontium-90 Air nBq 21.99243 -1.661498461 23.65392874508 Styrene Air ng 157.5951 -17.69309756 175.2881997509 Sulfate Air mg 0.903796 -0.605567837 1.509363424510 Sulfur dioxide Air mg 51.03432 -38.08632509 89.12064682511 Sulfur hexafluoride Air ng 246.1971 -133.5915066 379.7886269512 Sulfur oxides Air mg 54.19282 -313.791126 367.9839476513 Sulfuric acid Air mg 0.932166 -0.741910639 1.674076979514 t-Butyl methyl ether Air ng 26.97515 -7.933687033 34.90884011515 Technetium-99 Air nBq 0.000933 -7.04637E-05 0.001003155516 Tellurium-123m Air nBq 0.100582 -0.007572245 0.108154566517 Thallium Air ng 10.67824 -1.301145519 11.97938543518 Thorium Air ng 12.32031 -0.857711002 13.17802115519 Thorium-228 Air µBq 37.30527 -6.533032641 43.83829834520 Thorium-230 Air µBq 109.3886 -78.24283154 187.6314307521 Thorium-232 Air µBq 32.34526 -9.160989427 41.50625048522 Thorium-234 Air µBq 6.74151 -3.724269911 10.46577967523 Tin Air ng 142.2511 -73.58444428 215.8355284524 Titanium Air µg 2.365987 -0.18053831 2.546525335525 Toluene Air µg 59.57771 -22.88735931 82.46506756526 Uranium Air ng 14.45756 -1.016015865 15.47357861527 Uranium-234 Air µBq 162.9591 -107.8822815 270.8414299528 Uranium-235 Air µBq 3.819548 -2.109965582 5.929513358529 Uranium-238 Air µBq 248.5601 -129.5618683 378.1219937530 Uranium alpha Air µBq 367.5001 -203.1214241 570.6214786531 Urea Air ng 145.1002 -118.3385974 263.4387853532 Vanadium Air µg 18.39201 -8.790813731 27.18282328533 VOC, volatile organic compounds Air µg 61.15294 -0.122877643 61.27582192534 water Air µg 219.5029 -126.1346397 345.6375141535 Xenon-131m Air mBq 2.706437 -1.582172389 4.288609232536 Xenon-133 Air mBq 90.20983 -52.3189312 142.5287653537 Xenon-133m Air µBq 310.9962 -176.4293735 487.4256004538 Xenon-135 Air mBq 36.41883 -21.28046345 57.69929242539 Xenon-135m Air mBq 21.69761 -12.77370281 34.47131578540 Xenon-137 Air µBq 484.7527 -291.0647619 775.8174233541 Xenon-138 Air mBq 4.049476 -2.413205294 6.462681646542 Xylene Air µg 44.72604 -17.20195253 61.92798796543 Zinc Air µg 10.4221 -10.04025214 20.46235685544 Zinc-65 Air nBq 3.574987 -2.114277048 5.689264181545 Zirconium Air ng 2.431499 -1.503489461 3.934988641546 Zirconium-95 Air nBq 3.399787 -2.059450626 5.459237769547 Acenaphthene Water pg 335.9461 -186.5902708 522.5363642548 Acenaphthylene Water ng 56.4074 -10.62731201 67.03471308549 Acetic acid Water µg 2.232058 -1.775731039 4.007788709550 Acetone Water pg 0.000108 -8.83352E-05 0.000196647551 Acidity, unspecified Water µg 105.451 -47.84319796 153.294194552 Acids, unspecified Water ng -6.25902 -15.30418979 9.045173428553 Actinides, radioactive, unspecified Water µBq 76.68287 -42.06145763 118.744324554 Aluminum Water mg 17.03161 -1.905566344 18.93717838555 Americium-241 Water nBq 55.29528 -4.177487894 59.47276527556 Ammonia Water µg 29.39923 -21.98095348 51.38017904557 Ammonia, as N Water ng 318.1302 -35.57159482 353.7018436558 Ammonium, ion Water mg 0.934949 -0.667864338 1.602813597559 Antimony Water µg 17.16188 -4.977192837 22.13907204560 Antimony-122 Water nBq 52.26162 -31.52239048 83.78400746561 Antimony-124 Water µBq 13.36536 -7.42396448 20.78932506562 Antimony-125 Water µBq 11.94426 -6.6686783 18.61293546563 AOX, Adsorbable Organic Halogen as Cl Water µg 12.16545 11.79880769 0.36664043564 Arsenic Water ng 169.5391 -121.0507858 290.589879565 Arsenic, ion Water µg 7.266911 -2.563893349 9.830804533566 Barite Water µg 649.2039 -272.3692973 921.5732445567 Barium Water µg 136.7793 -56.77991548 193.559178568 Barium-140 Water nBq 227.982 -138.0071004 365.9891042
6 of 10
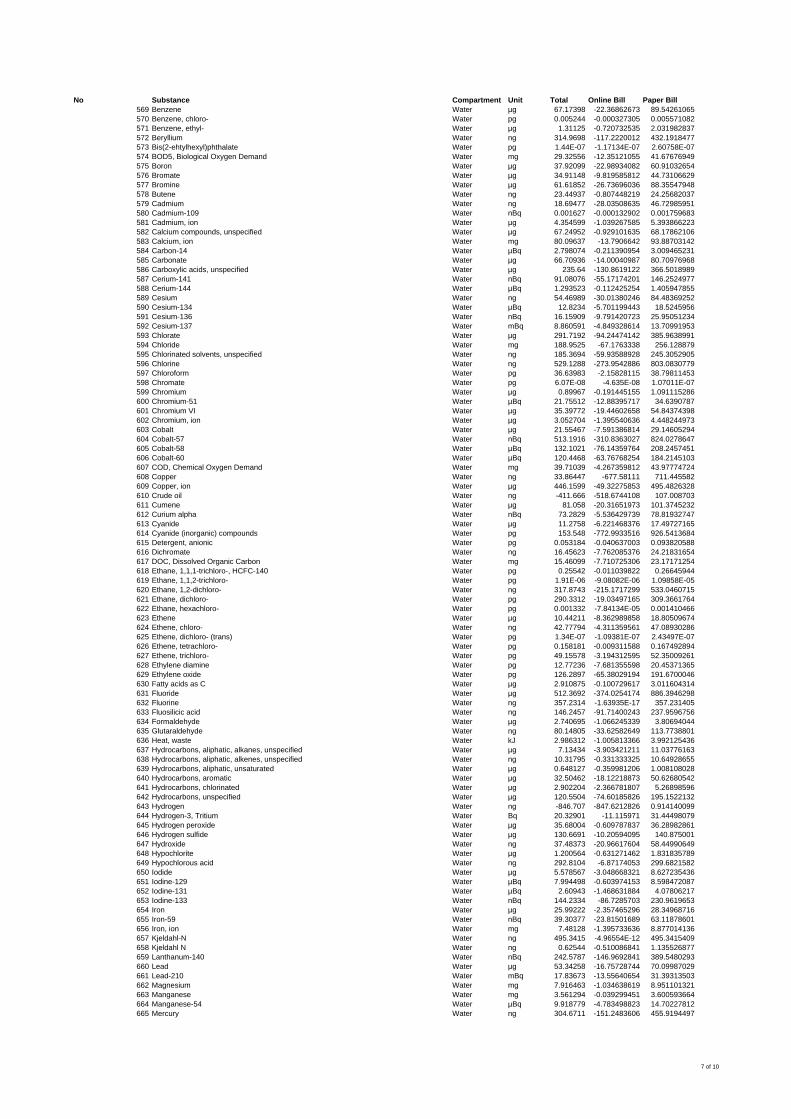
No Substance Compartment Unit Total Online Bill Paper Bill569 Benzene Water µg 67.17398 -22.36862673 89.54261065570 Benzene, chloro- Water pg 0.005244 -0.000327305 0.005571082571 Benzene, ethyl- Water µg 1.31125 -0.720732535 2.031982837572 Beryllium Water ng 314.9698 -117.2220012 432.1918477573 Bis(2-ehtylhexyl)phthalate Water pg 1.44E-07 -1.17134E-07 2.60758E-07574 BOD5, Biological Oxygen Demand Water mg 29.32556 -12.35121055 41.67676949575 Boron Water µg 37.92099 -22.98934082 60.91032654576 Bromate Water µg 34.91148 -9.819585812 44.73106629577 Bromine Water µg 61.61852 -26.73696036 88.35547948578 Butene Water ng 23.44937 -0.807448219 24.25682037579 Cadmium Water ng 18.69477 -28.03508635 46.72985951580 Cadmium-109 Water nBq 0.001627 -0.000132902 0.001759683581 Cadmium, ion Water µg 4.354599 -1.039267585 5.393866223582 Calcium compounds, unspecified Water µg 67.24952 -0.929101635 68.17862106583 Calcium, ion Water mg 80.09637 -13.7906642 93.88703142584 Carbon-14 Water µBq 2.798074 -0.211390954 3.009465231585 Carbonate Water µg 66.70936 -14.00040987 80.70976968586 Carboxylic acids, unspecified Water µg 235.64 -130.8619122 366.5018989587 Cerium-141 Water nBq 91.08076 -55.17174201 146.2524977588 Cerium-144 Water µBq 1.293523 -0.112425254 1.405947855589 Cesium Water ng 54.46989 -30.01380246 84.48369252590 Cesium-134 Water µBq 12.8234 -5.701199443 18.5245956591 Cesium-136 Water nBq 16.15909 -9.791420723 25.95051234592 Cesium-137 Water mBq 8.860591 -4.849328614 13.70991953593 Chlorate Water µg 291.7192 -94.24474142 385.9638991594 Chloride Water mg 188.9525 -67.1763338 256.128879595 Chlorinated solvents, unspecified Water ng 185.3694 -59.93588928 245.3052905596 Chlorine Water ng 529.1288 -273.9542886 803.0830779597 Chloroform Water pg 36.63983 -2.15828115 38.79811453598 Chromate Water pg 6.07E-08 -4.635E-08 1.07011E-07599 Chromium Water µg 0.89967 -0.191445155 1.091115286600 Chromium-51 Water µBq 21.75512 -12.88395717 34.6390787601 Chromium VI Water µg 35.39772 -19.44602658 54.84374398602 Chromium, ion Water µg 3.052704 -1.395540636 4.448244973603 Cobalt Water µg 21.55467 -7.591386814 29.14605294604 Cobalt-57 Water nBq 513.1916 -310.8363027 824.0278647605 Cobalt-58 Water µBq 132.1021 -76.14359764 208.2457451606 Cobalt-60 Water µBq 120.4468 -63.76768254 184.2145103607 COD, Chemical Oxygen Demand Water mg 39.71039 -4.267359812 43.97774724608 Copper Water ng 33.86447 -677.58111 711.445582609 Copper, ion Water µg 446.1599 -49.32275853 495.4826328610 Crude oil Water ng -411.666 -518.6744108 107.008703611 Cumene Water µg 81.058 -20.31651973 101.3745232612 Curium alpha Water nBq 73.2829 -5.536429739 78.81932747613 Cyanide Water µg 11.2758 -6.221468376 17.49727165614 Cyanide (inorganic) compounds Water pg 153.548 -772.9933516 926.5413684615 Detergent, anionic Water pg 0.053184 -0.040637003 0.093820588616 Dichromate Water ng 16.45623 -7.762085376 24.21831654617 DOC, Dissolved Organic Carbon Water mg 15.46099 -7.710725306 23.17171254618 Ethane, 1,1,1-trichloro-, HCFC-140 Water pg 0.25542 -0.011039822 0.26645944619 Ethane, 1,1,2-trichloro- Water pg 1.91E-06 -9.08082E-06 1.09858E-05620 Ethane, 1,2-dichloro- Water ng 317.8743 -215.1717299 533.0460715621 Ethane, dichloro- Water pg 290.3312 -19.03497165 309.3661764622 Ethane, hexachloro- Water pg 0.001332 -7.84134E-05 0.001410466623 Ethene Water µg 10.44211 -8.362989858 18.80509674624 Ethene, chloro- Water ng 42.77794 -4.311359561 47.08930286625 Ethene, dichloro- (trans) Water pg 1.34E-07 -1.09381E-07 2.43497E-07626 Ethene, tetrachloro- Water pg 0.158181 -0.009311588 0.167492894627 Ethene, trichloro- Water pg 49.15578 -3.194312595 52.35009261628 Ethylene diamine Water pg 12.77236 -7.681355598 20.45371365629 Ethylene oxide Water pg 126.2897 -65.38029194 191.6700046630 Fatty acids as C Water µg 2.910875 -0.100729617 3.011604314631 Fluoride Water µg 512.3692 -374.0254174 886.3946298632 Fluorine Water ng 357.2314 -1.63935E-17 357.231405633 Fluosilicic acid Water ng 146.2457 -91.71400243 237.9596756634 Formaldehyde Water µg 2.740695 -1.066245339 3.80694044635 Glutaraldehyde Water ng 80.14805 -33.62582649 113.7738801636 Heat, waste Water kJ 2.986312 -1.005813366 3.992125436637 Hydrocarbons, aliphatic, alkanes, unspecified Water µg 7.13434 -3.903421211 11.03776163638 Hydrocarbons, aliphatic, alkenes, unspecified Water ng 10.31795 -0.331333325 10.64928655639 Hydrocarbons, aliphatic, unsaturated Water µg 0.648127 -0.359981206 1.008108028640 Hydrocarbons, aromatic Water µg 32.50462 -18.12218873 50.62680542641 Hydrocarbons, chlorinated Water µg 2.902204 -2.366781807 5.26898596642 Hydrocarbons, unspecified Water µg 120.5504 -74.60185826 195.1522132643 Hydrogen Water ng -846.707 -847.6212826 0.914140099644 Hydrogen-3, Tritium Water Bq 20.32901 -11.115971 31.44498079645 Hydrogen peroxide Water µg 35.68004 -0.609787837 36.28982861646 Hydrogen sulfide Water µg 130.6691 -10.20594095 140.875001647 Hydroxide Water ng 37.48373 -20.96617604 58.44990649648 Hypochlorite Water µg 1.200564 -0.631271462 1.831835789649 Hypochlorous acid Water ng 292.8104 -6.87174053 299.6821582650 Iodide Water µg 5.578567 -3.048668321 8.627235436651 Iodine-129 Water µBq 7.994498 -0.603974153 8.598472087652 Iodine-131 Water µBq 2.60943 -1.468631884 4.07806217653 Iodine-133 Water nBq 144.2334 -86.7285703 230.9619653654 Iron Water µg 25.99222 -2.357465296 28.34968716655 Iron-59 Water nBq 39.30377 -23.81501689 63.11878601656 Iron, ion Water mg 7.48128 -1.395733636 8.877014136657 Kjeldahl-N Water ng 495.3415 -4.96554E-12 495.3415409658 Kjeldahl N Water ng 0.62544 -0.510086841 1.135526877659 Lanthanum-140 Water nBq 242.5787 -146.9692841 389.5480293660 Lead Water µg 53.34258 -16.75728744 70.09987029661 Lead-210 Water mBq 17.83673 -13.55640654 31.39313503662 Magnesium Water mg 7.916463 -1.034638619 8.951101321663 Manganese Water mg 3.561294 -0.039299451 3.600593664664 Manganese-54 Water µBq 9.918779 -4.783498823 14.70227812665 Mercury Water ng 304.6711 -151.2483606 455.9194497
7 of 10
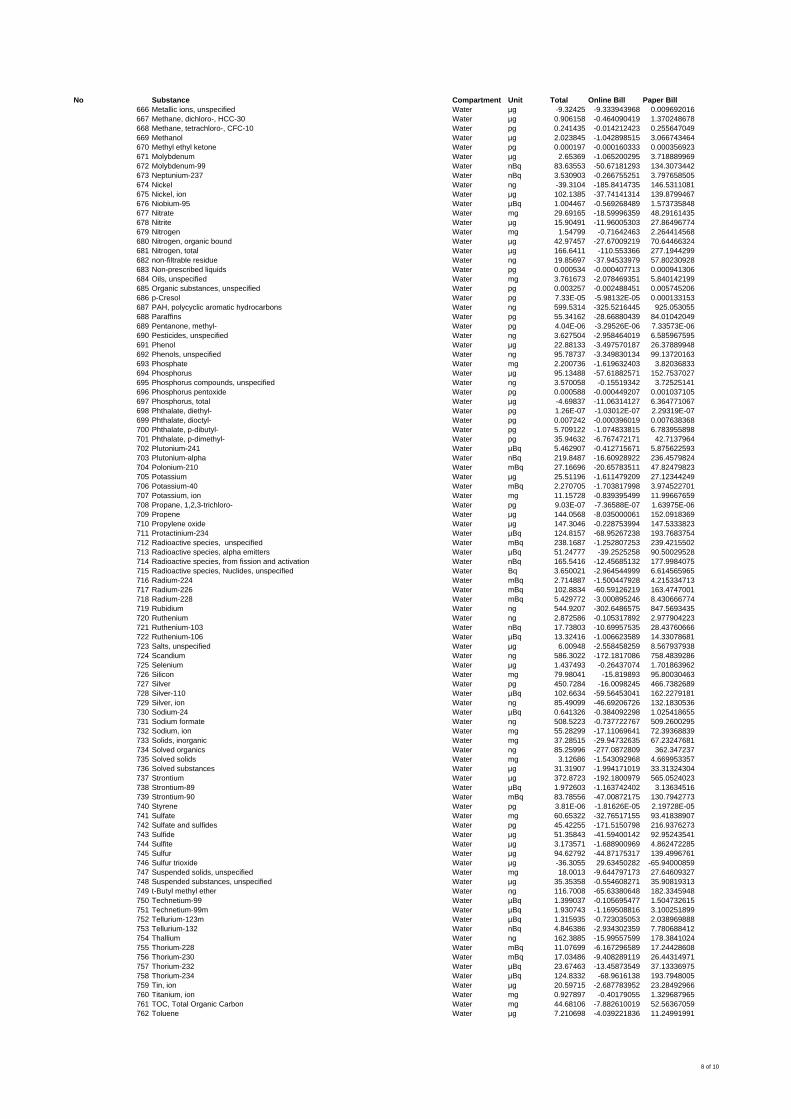
No Substance Compartment Unit Total Online Bill Paper Bill666 Metallic ions, unspecified Water µg -9.32425 -9.333943968 0.009692016667 Methane, dichloro-, HCC-30 Water µg 0.906158 -0.464090419 1.370248678668 Methane, tetrachloro-, CFC-10 Water pg 0.241435 -0.014212423 0.255647049669 Methanol Water µg 2.023845 -1.042898515 3.066743464670 Methyl ethyl ketone Water pg 0.000197 -0.000160333 0.000356923671 Molybdenum Water µg 2.65369 -1.065200295 3.718889969672 Molybdenum-99 Water nBq 83.63553 -50.67181293 134.3073442673 Neptunium-237 Water nBq 3.530903 -0.266755251 3.797658505674 Nickel Water ng -39.3104 -185.8414735 146.5311081675 Nickel, ion Water µg 102.1385 -37.74141314 139.8799467676 Niobium-95 Water µBq 1.004467 -0.569268489 1.573735848677 Nitrate Water mg 29.69165 -18.59996359 48.29161435678 Nitrite Water µg 15.90491 -11.96005303 27.86496774679 Nitrogen Water mg 1.54799 -0.71642463 2.264414568680 Nitrogen, organic bound Water µg 42.97457 -27.67009219 70.64466324681 Nitrogen, total Water µg 166.6411 -110.553366 277.1944299682 non-filtrable residue Water ng 19.85697 -37.94533979 57.80230928683 Non-prescribed liquids Water pg 0.000534 -0.000407713 0.000941306684 Oils, unspecified Water mg 3.761673 -2.078469351 5.840142199685 Organic substances, unspecified Water pg 0.003257 -0.002488451 0.005745206686 p-Cresol Water pg 7.33E-05 -5.98132E-05 0.000133153687 PAH, polycyclic aromatic hydrocarbons Water ng 599.5314 -325.5216445 925.053055688 Paraffins Water pg 55.34162 -28.66880439 84.01042049689 Pentanone, methyl- Water pg 4.04E-06 -3.29526E-06 7.33573E-06690 Pesticides, unspecified Water ng 3.627504 -2.958464019 6.585967595691 Phenol Water µg 22.88133 -3.497570187 26.37889948692 Phenols, unspecified Water ng 95.78737 -3.349830134 99.13720163693 Phosphate Water mg 2.200736 -1.619632403 3.82036833694 Phosphorus Water µg 95.13488 -57.61882571 152.7537027695 Phosphorus compounds, unspecified Water ng 3.570058 -0.15519342 3.72525141696 Phosphorus pentoxide Water pg 0.000588 -0.000449207 0.001037105697 Phosphorus, total Water µg -4.69837 -11.06314127 6.364771067698 Phthalate, diethyl- Water pg 1.26E-07 -1.03012E-07 2.29319E-07699 Phthalate, dioctyl- Water pg 0.007242 -0.000396019 0.007638368700 Phthalate, p-dibutyl- Water pg 5.709122 -1.074833815 6.783955898701 Phthalate, p-dimethyl- Water pg 35.94632 -6.767472171 42.7137964702 Plutonium-241 Water µBq 5.462907 -0.412715671 5.875622593703 Plutonium-alpha Water nBq 219.8487 -16.60928922 236.4579824704 Polonium-210 Water mBq 27.16696 -20.65783511 47.82479823705 Potassium Water µg 25.51196 -1.611479209 27.12344249706 Potassium-40 Water mBq 2.270705 -1.703817998 3.974522701707 Potassium, ion Water mg 11.15728 -0.839395499 11.99667659708 Propane, 1,2,3-trichloro- Water pg 9.03E-07 -7.36588E-07 1.63975E-06709 Propene Water µg 144.0568 -8.035000061 152.0918369710 Propylene oxide Water µg 147.3046 -0.228753994 147.5333823711 Protactinium-234 Water µBq 124.8157 -68.95267238 193.7683754712 Radioactive species, unspecified Water mBq 238.1687 -1.252807253 239.4215502713 Radioactive species, alpha emitters Water µBq 51.24777 -39.2525258 90.50029528714 Radioactive species, from fission and activation Water nBq 165.5416 -12.45685132 177.9984075715 Radioactive species, Nuclides, unspecified Water Bq 3.650021 -2.964544999 6.614565965716 Radium-224 Water mBq 2.714887 -1.500447928 4.215334713717 Radium-226 Water mBq 102.8834 -60.59126219 163.4747001718 Radium-228 Water mBq 5.429772 -3.000895246 8.430666774719 Rubidium Water ng 544.9207 -302.6486575 847.5693435720 Ruthenium Water ng 2.872586 -0.105317892 2.977904223721 Ruthenium-103 Water nBq 17.73803 -10.69957535 28.43760666722 Ruthenium-106 Water µBq 13.32416 -1.006623589 14.33078681723 Salts, unspecified Water µg 6.00948 -2.558458259 8.567937938724 Scandium Water ng 586.3022 -172.1817086 758.4839286725 Selenium Water µg 1.437493 -0.26437074 1.701863962726 Silicon Water mg 79.98041 -15.819893 95.80030463727 Silver Water pg 450.7284 -16.0098245 466.7382689728 Silver-110 Water µBq 102.6634 -59.56453041 162.2279181729 Silver, ion Water ng 85.49099 -46.69206726 132.1830536730 Sodium-24 Water µBq 0.641326 -0.384092298 1.025418655731 Sodium formate Water ng 508.5223 -0.737722767 509.2600295732 Sodium, ion Water mg 55.28299 -17.11069641 72.39368839733 Solids, inorganic Water mg 37.28515 -29.94732635 67.23247681734 Solved organics Water ng 85.25996 -277.0872809 362.347237735 Solved solids Water mg 3.12686 -1.543092968 4.669953357736 Solved substances Water µg 31.31907 -1.994171019 33.31324304737 Strontium Water µg 372.8723 -192.1800979 565.0524023738 Strontium-89 Water µBq 1.972603 -1.163742402 3.13634516739 Strontium-90 Water mBq 83.78556 -47.00872175 130.7942773740 Styrene Water pg 3.81E-06 -1.81626E-05 2.19728E-05741 Sulfate Water mg 60.65322 -32.76517155 93.41838907742 Sulfate and sulfides Water pg 45.42255 -171.5150798 216.9376273743 Sulfide Water µg 51.35843 -41.59400142 92.95243541744 Sulfite Water µg 3.173571 -1.688900969 4.862472285745 Sulfur Water µg 94.62792 -44.87175317 139.4996761746 Sulfur trioxide Water µg -36.3055 29.63450282 -65.94000859747 Suspended solids, unspecified Water mg 18.0013 -9.644797173 27.64609327748 Suspended substances, unspecified Water µg 35.35358 -0.554608271 35.90819313749 t-Butyl methyl ether Water ng 116.7008 -65.63380648 182.3345948750 Technetium-99 Water µBq 1.399037 -0.105695477 1.504732615751 Technetium-99m Water µBq 1.930743 -1.169508816 3.100251899752 Tellurium-123m Water µBq 1.315935 -0.723035053 2.038969888753 Tellurium-132 Water nBq 4.846386 -2.934302359 7.780688412754 Thallium Water ng 162.3885 -15.99557599 178.3841024755 Thorium-228 Water mBq 11.07699 -6.167296589 17.24428608756 Thorium-230 Water mBq 17.03486 -9.408289119 26.44314971757 Thorium-232 Water µBq 23.67463 -13.45873549 37.13336975758 Thorium-234 Water µBq 124.8332 -68.9616138 193.7948005759 Tin, ion Water µg 20.59715 -2.687783952 23.28492966760 Titanium, ion Water mg 0.927897 -0.40179055 1.329687965761 TOC, Total Organic Carbon Water mg 44.68106 -7.882610019 52.56367059762 Toluene Water µg 7.210698 -4.039221836 11.24991991
8 of 10
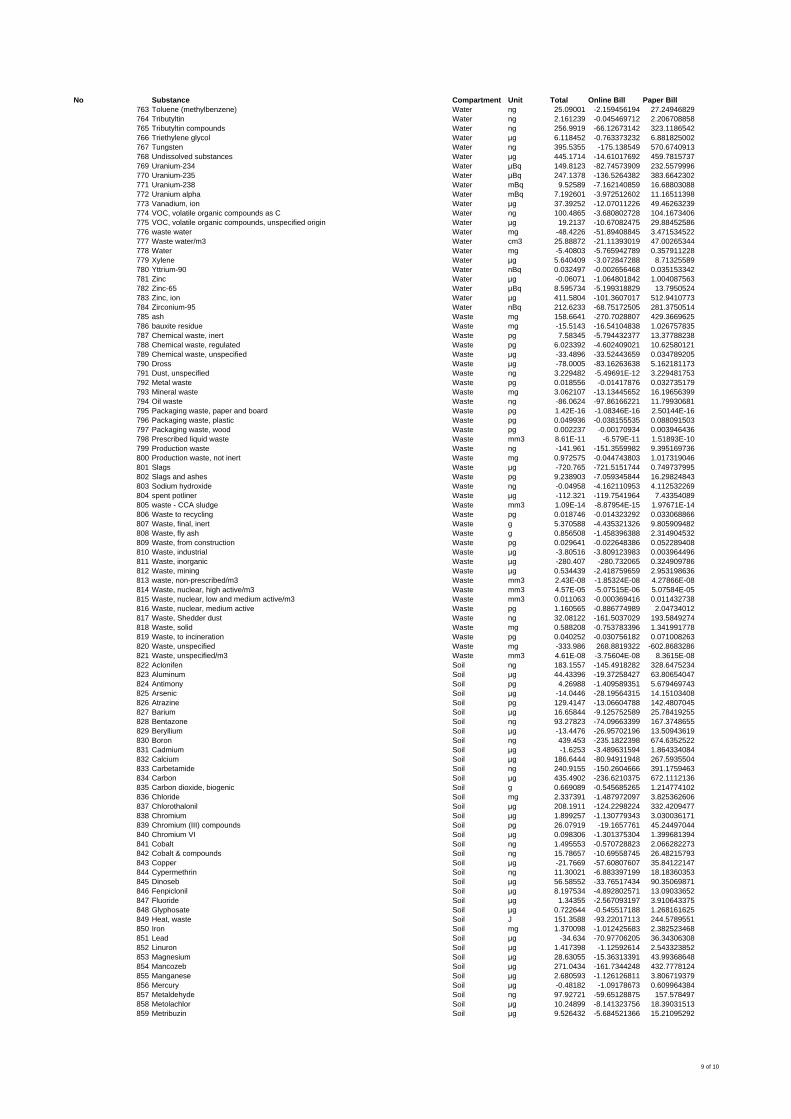
No Substance Compartment Unit Total Online Bill Paper Bill763 Toluene (methylbenzene) Water ng 25.09001 -2.159456194 27.24946829764 Tributyltin Water ng 2.161239 -0.045469712 2.206708858765 Tributyltin compounds Water ng 256.9919 -66.12673142 323.1186542766 Triethylene glycol Water µg 6.118452 -0.763373232 6.881825002767 Tungsten Water ng 395.5355 -175.138549 570.6740913768 Undissolved substances Water µg 445.1714 -14.61017692 459.7815737769 Uranium-234 Water µBq 149.8123 -82.74573909 232.5579996770 Uranium-235 Water µBq 247.1378 -136.5264382 383.6642302771 Uranium-238 Water mBq 9.52589 -7.162140859 16.68803088772 Uranium alpha Water mBq 7.192601 -3.972512602 11.16511398773 Vanadium, ion Water µg 37.39252 -12.07011226 49.46263239774 VOC, volatile organic compounds as C Water ng 100.4865 -3.680802728 104.1673406775 VOC, volatile organic compounds, unspecified origin Water µg 19.2137 -10.67082475 29.88452586776 waste water Water mg -48.4226 -51.89408845 3.471534522777 Waste water/m3 Water cm3 25.88872 -21.11393019 47.00265344778 Water Water mg -5.40803 -5.765942789 0.357911228779 Xylene Water µg 5.640409 -3.072847288 8.71325589780 Yttrium-90 Water nBq 0.032497 -0.002656468 0.035153342781 Zinc Water µg -0.06071 -1.064801842 1.004087563782 Zinc-65 Water µBq 8.595734 -5.199318829 13.7950524783 Zinc, ion Water µg 411.5804 -101.3607017 512.9410773784 Zirconium-95 Water nBq 212.6233 -68.75172505 281.3750514785 ash Waste mg 158.6641 -270.7028807 429.3669625786 bauxite residue Waste mg -15.5143 -16.54104838 1.026757835787 Chemical waste, inert Waste pg 7.58345 -5.794432377 13.37788238788 Chemical waste, regulated Waste pg 6.023392 -4.602409021 10.62580121789 Chemical waste, unspecified Waste µg -33.4896 -33.52443659 0.034789205790 Dross Waste µg -78.0005 -83.16263638 5.162181173791 Dust, unspecified Waste ng 3.229482 -5.49691E-12 3.229481753792 Metal waste Waste pg 0.018556 -0.01417876 0.032735179793 Mineral waste Waste mg 3.062107 -13.13445652 16.19656399794 Oil waste Waste ng -86.0624 -97.86166221 11.79930681795 Packaging waste, paper and board Waste pg 1.42E-16 -1.08346E-16 2.50144E-16796 Packaging waste, plastic Waste pg 0.049936 -0.038155535 0.088091503797 Packaging waste, wood Waste pg 0.002237 -0.00170934 0.003946436798 Prescribed liquid waste Waste mm3 8.61E-11 -6.579E-11 1.51893E-10799 Production waste Waste ng -141.961 -151.3559982 9.395169736800 Production waste, not inert Waste mg 0.972575 -0.044743803 1.017319046801 Slags Waste µg -720.765 -721.5151744 0.749737995802 Slags and ashes Waste pg 9.238903 -7.059345844 16.29824843803 Sodium hydroxide Waste ng -0.04958 -4.162110953 4.112532269804 spent potliner Waste µg -112.321 -119.7541964 7.43354089805 waste - CCA sludge Waste mm3 1.09E-14 -8.87954E-15 1.97671E-14806 Waste to recycling Waste pg 0.018746 -0.014323292 0.033068866807 Waste, final, inert Waste g 5.370588 -4.435321326 9.805909482808 Waste, fly ash Waste g 0.856508 -1.458396388 2.314904532809 Waste, from construction Waste pg 0.029641 -0.022648386 0.052289408810 Waste, industrial Waste µg -3.80516 -3.809123983 0.003964496811 Waste, inorganic Waste µg -280.407 -280.732065 0.324909786812 Waste, mining Waste µg 0.534439 -2.418759659 2.953198636813 waste, non-prescribed/m3 Waste mm3 2.43E-08 -1.85324E-08 4.27866E-08814 Waste, nuclear, high active/m3 Waste mm3 4.57E-05 -5.07515E-06 5.07584E-05815 Waste, nuclear, low and medium active/m3 Waste mm3 0.011063 -0.000369416 0.011432738816 Waste, nuclear, medium active Waste pg 1.160565 -0.886774989 2.04734012817 Waste, Shedder dust Waste ng 32.08122 -161.5037029 193.5849274818 Waste, solid Waste mg 0.588208 -0.753783396 1.341991778819 Waste, to incineration Waste pg 0.040252 -0.030756182 0.071008263820 Waste, unspecified Waste mg -333.986 268.8819322 -602.8683286821 Waste, unspecified/m3 Waste mm3 4.61E-08 -3.75604E-08 8.3615E-08822 Aclonifen Soil ng 183.1557 -145.4918282 328.6475234823 Aluminum Soil µg 44.43396 -19.37258427 63.80654047824 Antimony Soil pg 4.26988 -1.409589351 5.679469743825 Arsenic Soil µg -14.0446 -28.19564315 14.15103408826 Atrazine Soil pg 129.4147 -13.06604788 142.4807045827 Barium Soil µg 16.65844 -9.125752589 25.78419255828 Bentazone Soil ng 93.27823 -74.09663399 167.3748655829 Beryllium Soil µg -13.4476 -26.95702196 13.50943619830 Boron Soil ng 439.453 -235.1822398 674.6352522831 Cadmium Soil µg -1.6253 -3.489631594 1.864334084832 Calcium Soil µg 186.6444 -80.94911948 267.5935504833 Carbetamide Soil ng 240.9155 -150.2604666 391.1759463834 Carbon Soil µg 435.4902 -236.6210375 672.1112136835 Carbon dioxide, biogenic Soil g 0.669089 -0.545685265 1.214774102836 Chloride Soil mg 2.337391 -1.487972097 3.825362606837 Chlorothalonil Soil µg 208.1911 -124.2298224 332.4209477838 Chromium Soil µg 1.899257 -1.130779343 3.030036171839 Chromium (III) compounds Soil pg 26.07919 -19.1657761 45.24497044840 Chromium VI Soil µg 0.098306 -1.301375304 1.399681394841 Cobalt Soil ng 1.495553 -0.570728823 2.066282273842 Cobalt & compounds Soil ng 15.78657 -10.69558745 26.48215793843 Copper Soil µg -21.7669 -57.60807607 35.84122147844 Cypermethrin Soil ng 11.30021 -6.883397199 18.18360353845 Dinoseb Soil µg 56.58552 -33.76517434 90.35069871846 Fenpiclonil Soil µg 8.197534 -4.892802571 13.09033652847 Fluoride Soil µg 1.34355 -2.567093197 3.910643375848 Glyphosate Soil µg 0.722644 -0.545517188 1.268161625849 Heat, waste Soil J 151.3588 -93.22017113 244.5789551850 Iron Soil mg 1.370098 -1.012425683 2.382523468851 Lead Soil µg -34.634 -70.97706205 36.34306308852 Linuron Soil µg 1.417398 -1.12592614 2.543323852853 Magnesium Soil µg 28.63055 -15.36313391 43.99368648854 Mancozeb Soil µg 271.0434 -161.7344248 432.7778124855 Manganese Soil µg 2.680593 -1.126126811 3.806719379856 Mercury Soil µg -0.48182 -1.09178673 0.609964384857 Metaldehyde Soil ng 97.92721 -59.65128875 157.578497858 Metolachlor Soil µg 10.24899 -8.141323756 18.39031513859 Metribuzin Soil µg 9.526432 -5.684521366 15.21095292
9 of 10
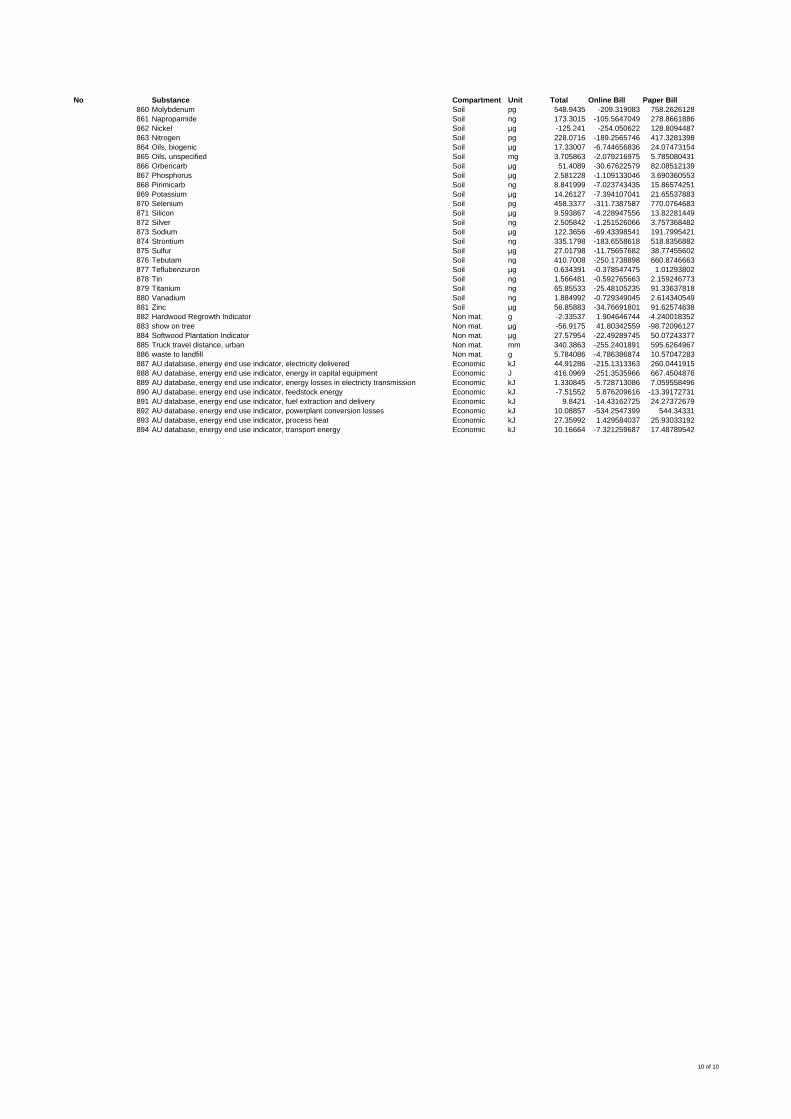
No Substance Compartment Unit Total Online Bill Paper Bill860 Molybdenum Soil pg 548.9435 -209.319083 758.2626128861 Napropamide Soil ng 173.3015 -105.5647049 278.8661886862 Nickel Soil µg -125.241 -254.050622 128.8094487863 Nitrogen Soil pg 228.0716 -189.2565746 417.3281398864 Oils, biogenic Soil µg 17.33007 -6.744656836 24.07473154865 Oils, unspecified Soil mg 3.705863 -2.079216975 5.785080431866 Orbencarb Soil µg 51.4089 -30.67622579 82.08512139867 Phosphorus Soil µg 2.581228 -1.109133046 3.690360553868 Pirimicarb Soil ng 8.841999 -7.023743435 15.86574251869 Potassium Soil µg 14.26127 -7.394107041 21.65537883870 Selenium Soil pg 458.3377 -311.7387587 770.0764683871 Silicon Soil µg 9.593867 -4.228947556 13.82281449872 Silver Soil ng 2.505842 -1.251526066 3.757368482873 Sodium Soil µg 122.3656 -69.43398541 191.7995421874 Strontium Soil ng 335.1798 -183.6558618 518.8356882875 Sulfur Soil µg 27.01798 -11.75657682 38.77455602876 Tebutam Soil ng 410.7008 -250.1738898 660.8746663877 Teflubenzuron Soil µg 0.634391 -0.378547475 1.01293802878 Tin Soil ng 1.566481 -0.592765663 2.159246773879 Titanium Soil ng 65.85533 -25.48105235 91.33637818880 Vanadium Soil ng 1.884992 -0.729349045 2.614340549881 Zinc Soil µg 56.85883 -34.76691801 91.62574638882 Hardwood Regrowth Indicator Non mat. g -2.33537 1.904646744 -4.240018352883 show on tree Non mat. µg -56.9175 41.80342559 -98.72096127884 Softwood Plantation Indicator Non mat. µg 27.57954 -22.49289745 50.07243377885 Truck travel distance, urban Non mat. mm 340.3863 -255.2401891 595.6264967886 waste to landfill Non mat. g 5.784086 -4.786386874 10.57047283887 AU database, energy end use indicator, electricity delivered Economic kJ 44.91286 -215.1313363 260.0441915888 AU database, energy end use indicator, energy in capital equipment Economic J 416.0969 -251.3535966 667.4504876889 AU database, energy end use indicator, energy losses in electricty transmission Economic kJ 1.330845 -5.728713086 7.059558496890 AU database, energy end use indicator, feedstock energy Economic kJ -7.51552 5.876209616 -13.39172731891 AU database, energy end use indicator, fuel extraction and delivery Economic kJ 9.8421 -14.43162725 24.27372679892 AU database, energy end use indicator, powerplant conversion losses Economic kJ 10.08857 -534.2547399 544.34331893 AU database, energy end use indicator, process heat Economic kJ 27.35992 1.429584037 25.93033192894 AU database, energy end use indicator, transport energy Economic kJ 10.16664 -7.321259687 17.48789542
10 of 10
O N L I N E B I L L I N G L I F E C Y C L E A N A L Y S I S
Appendix B Data Output Tables from SIMAPRO
Prepared for Telstra, 29 April 2008.
B.2 Process Contribution
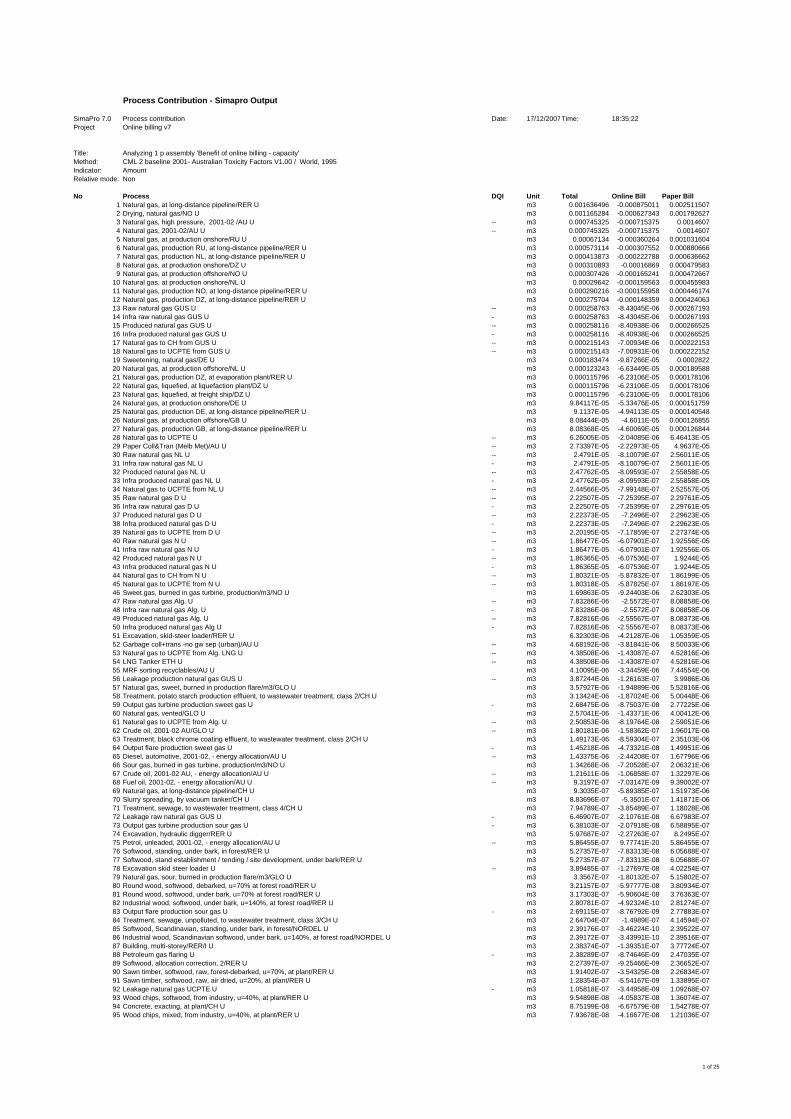
Process Contribution - Simapro Output
SimaPro 7.0 Process contribution Date: 17/12/2007Time: 18:35:22Project Online billing v7
Title: Analyzing 1 p assembly 'Benefit of online billing - capacity'Method: CML 2 baseline 2001- Australian Toxicity Factors V1.00 / World, 1995Indicator: AmountRelative mode: Non
No Process DQI Unit Total Online Bill Paper Bill1 Natural gas, at long-distance pipeline/RER U m3 0.001636496 -0.000875011 0.0025115072 Drying, natural gas/NO U m3 0.001165284 -0.000627343 0.0017926273 Natural gas, high pressure, 2001-02 /AU U -- m3 0.000745325 -0.000715375 0.00146074 Natural gas, 2001-02/AU U -- m3 0.000745325 -0.000715375 0.00146075 Natural gas, at production onshore/RU U m3 0.00067134 -0.000360264 0.0010316046 Natural gas, production RU, at long-distance pipeline/RER U m3 0.000573114 -0.000307552 0.0008806667 Natural gas, production NL, at long-distance pipeline/RER U m3 0.000413873 -0.000222788 0.0006366628 Natural gas, at production onshore/DZ U m3 0.000310893 -0.00016869 0.0004795839 Natural gas, at production offshore/NO U m3 0.000307426 -0.000165241 0.000472667
10 Natural gas, at production onshore/NL U m3 0.00029642 -0.000159563 0.00045598311 Natural gas, production NO, at long-distance pipeline/RER U m3 0.000290216 -0.000155958 0.00044617412 Natural gas, production DZ, at long-distance pipeline/RER U m3 0.000275704 -0.000148359 0.00042406313 Raw natural gas GUS U -- m3 0.000258763 -8.43045E-06 0.00026719314 Infra raw natural gas GUS U - m3 0.000258763 -8.43045E-06 0.00026719315 Produced natural gas GUS U -- m3 0.000258116 -8.40938E-06 0.00026652516 Infra produced natural gas GUS U - m3 0.000258116 -8.40938E-06 0.00026652517 Natural gas to CH from GUS U -- m3 0.000215143 -7.00934E-06 0.00022215318 Natural gas to UCPTE from GUS U -- m3 0.000215143 -7.00931E-06 0.00022215219 Sweetening, natural gas/DE U m3 0.000183474 -9.87266E-05 0.000282220 Natural gas, at production offshore/NL U m3 0.000123243 -6.63449E-05 0.00018958821 Natural gas, production DZ, at evaporation plant/RER U m3 0.000115796 -6.23106E-05 0.00017810622 Natural gas, liquefied, at liquefaction plant/DZ U m3 0.000115796 -6.23106E-05 0.00017810623 Natural gas, liquefied, at freight ship/DZ U m3 0.000115796 -6.23106E-05 0.00017810624 Natural gas, at production onshore/DE U m3 9.84117E-05 -5.33476E-05 0.00015175925 Natural gas, production DE, at long-distance pipeline/RER U m3 9.1137E-05 -4.94113E-05 0.00014054826 Natural gas, at production offshore/GB U m3 8.08444E-05 -4.6011E-05 0.00012685527 Natural gas, production GB, at long-distance pipeline/RER U m3 8.08368E-05 -4.60069E-05 0.00012684428 Natural gas to UCPTE U -- m3 6.26005E-05 -2.04085E-06 6.46413E-0529 Paper Coll&Tran (Melb Met)/AU U -- m3 2.73397E-05 -2.22973E-05 4.9637E-0530 Raw natural gas NL U -- m3 2.4791E-05 -8.10079E-07 2.56011E-0531 Infra raw natural gas NL U - m3 2.4791E-05 -8.10079E-07 2.56011E-0532 Produced natural gas NL U -- m3 2.47762E-05 -8.09593E-07 2.55858E-0533 Infra produced natural gas NL U - m3 2.47762E-05 -8.09593E-07 2.55858E-0534 Natural gas to UCPTE from NL U -- m3 2.44566E-05 -7.99148E-07 2.52557E-0535 Raw natural gas D U -- m3 2.22507E-05 -7.25395E-07 2.29761E-0536 Infra raw natural gas D U - m3 2.22507E-05 -7.25395E-07 2.29761E-0537 Produced natural gas D U -- m3 2.22373E-05 -7.2496E-07 2.29623E-0538 Infra produced natural gas D U - m3 2.22373E-05 -7.2496E-07 2.29623E-0539 Natural gas to UCPTE from D U -- m3 2.20195E-05 -7.17859E-07 2.27374E-0540 Raw natural gas N U -- m3 1.86477E-05 -6.07901E-07 1.92556E-0541 Infra raw natural gas N U - m3 1.86477E-05 -6.07901E-07 1.92556E-0542 Produced natural gas N U -- m3 1.86365E-05 -6.07536E-07 1.9244E-0543 Infra produced natural gas N U - m3 1.86365E-05 -6.07536E-07 1.9244E-0544 Natural gas to CH from N U -- m3 1.80321E-05 -5.87832E-07 1.86199E-0545 Natural gas to UCPTE from N U -- m3 1.80318E-05 -5.87825E-07 1.86197E-0546 Sweet gas, burned in gas turbine, production/m3/NO U m3 1.69863E-05 -9.24403E-06 2.62303E-0547 Raw natural gas Alg. U -- m3 7.83286E-06 -2.5572E-07 8.08858E-0648 Infra raw natural gas Alg. U - m3 7.83286E-06 -2.5572E-07 8.08858E-0649 Produced natural gas Alg. U -- m3 7.82816E-06 -2.55567E-07 8.08373E-0650 Infra produced natural gas Alg U - m3 7.82816E-06 -2.55567E-07 8.08373E-0651 Excavation, skid-steer loader/RER U m3 6.32303E-06 -4.21287E-06 1.05359E-0552 Garbage coll+trans -no gw sep (urban)/AU U -- m3 4.68192E-06 -3.81841E-06 8.50033E-0653 Natural gas to UCPTE from Alg. LNG U -- m3 4.38508E-06 -1.43087E-07 4.52816E-0654 LNG Tanker ETH U -- m3 4.38508E-06 -1.43087E-07 4.52816E-0655 MRF sorting recyclables/AU U m3 4.10095E-06 -3.34459E-06 7.44554E-0656 Leakage production natural gas GUS U -- m3 3.87244E-06 -1.26163E-07 3.9986E-0657 Natural gas, sweet, burned in production flare/m3/GLO U m3 3.57927E-06 -1.94889E-06 5.52816E-0658 Treatment, potato starch production effluent, to wastewater treatment, class 2/CH U m3 3.13424E-06 -1.87024E-06 5.00448E-0659 Output gas turbine production sweet gas U - m3 2.68475E-06 -8.75037E-08 2.77225E-0660 Natural gas, vented/GLO U m3 2.57041E-06 -1.43371E-06 4.00412E-0661 Natural gas to UCPTE from Alg. U -- m3 2.50853E-06 -8.19764E-08 2.59051E-0662 Crude oil, 2001-02 AU/GLO U -- m3 1.80181E-06 -1.58362E-07 1.96017E-0663 Treatment, black chrome coating effluent, to wastewater treatment, class 2/CH U m3 1.49173E-06 -8.59304E-07 2.35103E-0664 Output flare production sweet gas U - m3 1.45218E-06 -4.73321E-08 1.49951E-0665 Diesel, automotive, 2001-02, - energy allocation/AU U -- m3 1.43375E-06 -2.44208E-07 1.67796E-0666 Sour gas, burned in gas turbine, production/m3/NO U m3 1.34268E-06 -7.20528E-07 2.06321E-0667 Crude oil, 2001-02 AU, - energy allocation/AU U -- m3 1.21611E-06 -1.06858E-07 1.32297E-0668 Fuel oil, 2001-02, - energy allocation/AU U -- m3 9.3197E-07 -7.03147E-09 9.39002E-0769 Natural gas, at long-distance pipeline/CH U m3 9.3035E-07 -5.89385E-07 1.51973E-0670 Slurry spreading, by vacuum tanker/CH U m3 8.83696E-07 -5.3501E-07 1.41871E-0671 Treatment, sewage, to wastewater treatment, class 4/CH U m3 7.94789E-07 -3.85489E-07 1.18028E-0672 Leakage raw natural gas GUS U - m3 6.46907E-07 -2.10761E-08 6.67983E-0773 Output gas turbine production sour gas U - m3 6.38103E-07 -2.07918E-08 6.58895E-0774 Excavation, hydraulic digger/RER U m3 5.97687E-07 -2.27263E-07 8.2495E-0775 Petrol, unleaded, 2001-02, - energy allocation/AU U -- m3 5.86455E-07 9.77741E-20 5.86455E-0776 Softwood, standing, under bark, in forest/RER U m3 5.27357E-07 -7.83313E-08 6.05688E-0777 Softwood, stand establishment / tending / site development, under bark/RER U m3 5.27357E-07 -7.83313E-08 6.05688E-0778 Excavation skid steer loader U -- m3 3.89485E-07 -1.27697E-08 4.02254E-0779 Natural gas, sour, burned in production flare/m3/GLO U m3 3.3567E-07 -1.80132E-07 5.15802E-0780 Round wood, softwood, debarked, u=70% at forest road/RER U m3 3.21157E-07 -5.97777E-08 3.80934E-0781 Round wood, softwood, under bark, u=70% at forest road/RER U m3 3.17303E-07 -5.90604E-08 3.76363E-0782 Industrial wood, softwood, under bark, u=140%, at forest road/RER U m3 2.80781E-07 -4.92324E-10 2.81274E-0783 Output flare production sour gas U - m3 2.69115E-07 -8.76792E-09 2.77883E-0784 Treatment, sewage, unpolluted, to wastewater treatment, class 3/CH U m3 2.64704E-07 -1.4989E-07 4.14594E-0785 Softwood, Scandinavian, standing, under bark, in forest/NORDEL U m3 2.39176E-07 -3.46224E-10 2.39522E-0786 Industrial wood, Scandinavian softwood, under bark, u=140%, at forest road/NORDEL U m3 2.39172E-07 -3.43991E-10 2.39516E-0787 Building, multi-storey/RER/I U m3 2.38374E-07 -1.39351E-07 3.77724E-0788 Petroleum gas flaring U - m3 2.38289E-07 -8.74646E-09 2.47035E-0789 Softwood, allocation correction, 2/RER U m3 2.27397E-07 -9.25466E-09 2.36652E-0790 Sawn timber, softwood, raw, forest-debarked, u=70%, at plant/RER U m3 1.91402E-07 -3.54325E-08 2.26834E-0791 Sawn timber, softwood, raw, air dried, u=20%, at plant/RER U m3 1.28354E-07 -5.54167E-09 1.33895E-0792 Leakage natural gas UCPTE U - m3 1.05818E-07 -3.44958E-09 1.09268E-0793 Wood chips, softwood, from industry, u=40%, at plant/RER U m3 9.54898E-08 -4.05837E-08 1.36074E-0794 Concrete, exacting, at plant/CH U m3 8.75199E-08 -6.67579E-08 1.54278E-0795 Wood chips, mixed, from industry, u=40%, at plant/RER U m3 7.93678E-08 -4.16677E-08 1.21036E-07
1 of 25
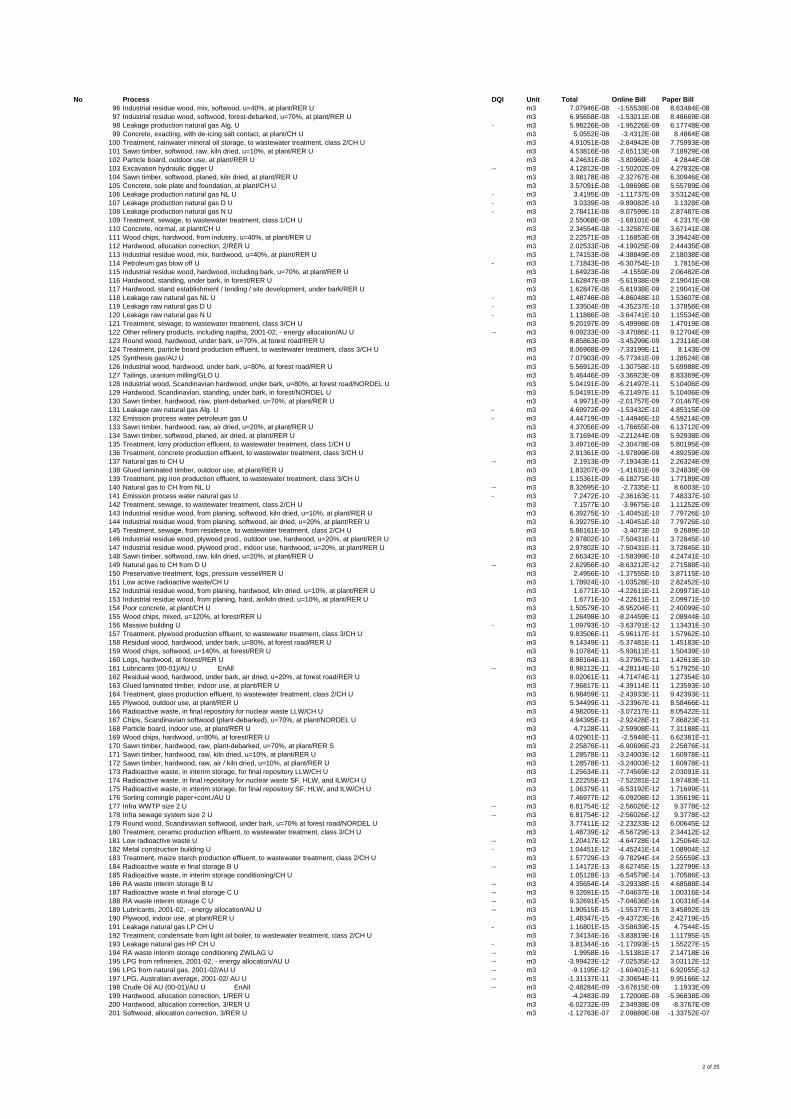
No Process DQI Unit Total Online Bill Paper Bill96 Industrial residue wood, mix, softwood, u=40%, at plant/RER U m3 7.07946E-08 -1.55538E-08 8.63484E-0897 Industrial residue wood, softwood, forest-debarked, u=70%, at plant/RER U m3 6.95658E-08 -1.53011E-08 8.48669E-0898 Leakage production natural gas Alg. U - m3 5.98226E-08 -1.95226E-09 6.17748E-0899 Concrete, exacting, with de-icing salt contact, at plant/CH U m3 5.0552E-08 -3.4312E-08 8.4864E-08
100 Treatment, rainwater mineral oil storage, to wastewater treatment, class 2/CH U m3 4.91051E-08 -2.84942E-08 7.75993E-08101 Sawn timber, softwood, raw, kiln dried, u=10%, at plant/RER U m3 4.53816E-08 -2.65113E-08 7.18929E-08102 Particle board, outdoor use, at plant/RER U m3 4.24631E-08 -3.80969E-10 4.2844E-08103 Excavation hydraulic digger U -- m3 4.12812E-08 -1.50202E-09 4.27832E-08104 Sawn timber, softwood, planed, kiln dried, at plant/RER U m3 3.98178E-08 -2.32767E-08 6.30946E-08105 Concrete, sole plate and foundation, at plant/CH U m3 3.57091E-08 -1.98698E-08 5.55789E-08106 Leakage production natural gas NL U - m3 3.4195E-08 -1.11737E-09 3.53124E-08107 Leakage production natural gas D U - m3 3.0339E-08 -9.89082E-10 3.1328E-08108 Leakage production natural gas N U - m3 2.78411E-08 -9.07599E-10 2.87487E-08109 Treatment, sewage, to wastewater treatment, class 1/CH U m3 2.55068E-08 -1.68101E-08 4.2317E-08110 Concrete, normal, at plant/CH U m3 2.34554E-08 -1.32587E-08 3.67141E-08111 Wood chips, hardwood, from industry, u=40%, at plant/RER U m3 2.22571E-08 -1.16853E-08 3.39424E-08112 Hardwood, allocation correction, 2/RER U m3 2.02533E-08 -4.19025E-09 2.44435E-08113 Industrial residue wood, mix, hardwood, u=40%, at plant/RER U m3 1.74153E-08 -4.38849E-09 2.18038E-08114 Petroleum gas blow off U - m3 1.71843E-08 -6.30754E-10 1.7815E-08115 Industrial residue wood, hardwood, including bark, u=70%, at plant/RER U m3 1.64923E-08 -4.1559E-09 2.06482E-08116 Hardwood, standing, under bark, in forest/RER U m3 1.62847E-08 -5.61938E-09 2.19041E-08117 Hardwood, stand establishment / tending / site development, under bark/RER U m3 1.62847E-08 -5.61938E-09 2.19041E-08118 Leakage raw natural gas NL U - m3 1.48746E-08 -4.86048E-10 1.53607E-08119 Leakage raw natural gas D U - m3 1.33504E-08 -4.35237E-10 1.37856E-08120 Leakage raw natural gas N U - m3 1.11886E-08 -3.64741E-10 1.15534E-08121 Treatment, sewage, to wastewater treatment, class 3/CH U m3 9.20197E-09 -5.49998E-09 1.47019E-08122 Other refinery products, including naptha, 2001-02, - energy allocation/AU U -- m3 9.09233E-09 -3.47086E-11 9.12704E-09123 Round wood, hardwood, under bark, u=70%, at forest road/RER U m3 8.85863E-09 -3.45299E-09 1.23116E-08124 Treatment, particle board production effluent, to wastewater treatment, class 3/CH U m3 8.06968E-09 -7.33199E-11 8.143E-09125 Synthesis gas/AU U m3 7.07903E-09 -5.77341E-09 1.28524E-08126 Industrial wood, hardwood, under bark, u=80%, at forest road/RER U m3 5.56912E-09 -1.30758E-10 5.69988E-09127 Tailings, uranium milling/GLO U m3 5.46446E-09 -3.36923E-09 8.83369E-09128 Industrial wood, Scandinavian hardwood, under bark, u=80%, at forest road/NORDEL U m3 5.04191E-09 -6.21497E-11 5.10406E-09129 Hardwood, Scandinavian, standing, under bark, in forest/NORDEL U m3 5.04191E-09 -6.21497E-11 5.10406E-09130 Sawn timber, hardwood, raw, plant-debarked, u=70%, at plant/RER U m3 4.9971E-09 -2.01757E-09 7.01467E-09131 Leakage raw natural gas Alg. U - m3 4.69972E-09 -1.53432E-10 4.85315E-09132 Emission process water petroleum gas U - m3 4.44719E-09 -1.44946E-10 4.59214E-09133 Sawn timber, hardwood, raw, air dried, u=20%, at plant/RER U m3 4.37056E-09 -1.76655E-09 6.13712E-09134 Sawn timber, softwood, planed, air dried, at plant/RER U m3 3.71694E-09 -2.21244E-09 5.92938E-09135 Treatment, lorry production effluent, to wastewater treatment, class 1/CH U m3 3.49716E-09 -2.30478E-09 5.80195E-09136 Treatment, concrete production effluent, to wastewater treatment, class 3/CH U m3 2.91361E-09 -1.97899E-09 4.89259E-09137 Natural gas to CH U -- m3 2.1913E-09 -7.19343E-11 2.26324E-09138 Glued laminated timber, outdoor use, at plant/RER U m3 1.83207E-09 -1.41631E-09 3.24838E-09139 Treatment, pig iron production effluent, to wastewater treatment, class 3/CH U m3 1.15361E-09 -6.18275E-10 1.77189E-09140 Natural gas to CH from NL U -- m3 8.32695E-10 -2.7335E-11 8.6003E-10141 Emission process water natural gas U - m3 7.2472E-10 -2.36163E-11 7.48337E-10142 Treatment, sewage, to wastewater treatment, class 2/CH U m3 7.1577E-10 -3.9675E-10 1.11252E-09143 Industrial residue wood, from planing, softwood, kiln dried, u=10%, at plant/RER U m3 6.39275E-10 -1.40451E-10 7.79726E-10144 Industrial residue wood, from planing, softwood, air dried, u=20%, at plant/RER U m3 6.39275E-10 -1.40451E-10 7.79726E-10145 Treatment, sewage, from residence, to wastewater treatment, class 2/CH U m3 5.86161E-10 -3.4073E-10 9.2689E-10146 Industrial residue wood, plywood prod., outdoor use, hardwood, u=20%, at plant/RER U m3 2.97802E-10 -7.50431E-11 3.72845E-10147 Industrial residue wood, plywood prod., indoor use, hardwood, u=20%, at plant/RER U m3 2.97802E-10 -7.50431E-11 3.72845E-10148 Sawn timber, softwood, raw, kiln dried, u=20%, at plant/RER U m3 2.66342E-10 -1.58399E-10 4.24741E-10149 Natural gas to CH from D U -- m3 2.62956E-10 -8.63212E-12 2.71588E-10150 Preservative treatment, logs, pressure vessel/RER U m3 2.4956E-10 -1.37555E-10 3.87115E-10151 Low active radioactive waste/CH U m3 1.78924E-10 -1.03528E-10 2.82452E-10152 Industrial residue wood, from planing, hardwood, kiln dried, u=10%, at plant/RER U m3 1.6771E-10 -4.22611E-11 2.09971E-10153 Industrial residue wood, from planing, hard, air/kiln dried, u=10%, at plant/RER U m3 1.6771E-10 -4.22611E-11 2.09971E-10154 Poor concrete, at plant/CH U m3 1.50579E-10 -8.95204E-11 2.40099E-10155 Wood chips, mixed, u=120%, at forest/RER U m3 1.26498E-10 -8.24459E-11 2.08944E-10156 Massive building U - m3 1.09793E-10 -3.63791E-12 1.13431E-10157 Treatment, plywood production effluent, to wastewater treatment, class 3/CH U m3 9.83506E-11 -5.96117E-11 1.57962E-10158 Residual wood, hardwood, under bark, u=80%, at forest road/RER U m3 9.14349E-11 -5.37481E-11 1.45183E-10159 Wood chips, softwood, u=140%, at forest/RER U m3 9.10784E-11 -5.93611E-11 1.50439E-10160 Logs, hardwood, at forest/RER U m3 8.98164E-11 -5.27967E-11 1.42613E-10161 Lubricants (00-01)/AU U EnAll -- m3 8.98112E-11 -4.28114E-10 5.17925E-10162 Residual wood, hardwood, under bark, air dried, u=20%, at forest road/RER U m3 8.02061E-11 -4.71474E-11 1.27354E-10163 Glued laminated timber, indoor use, at plant/RER U m3 7.96817E-11 -4.39114E-11 1.23593E-10164 Treatment, glass production effluent, to wastewater treatment, class 2/CH U m3 6.98459E-11 -2.43933E-11 9.42393E-11165 Plywood, outdoor use, at plant/RER U m3 5.34499E-11 -3.23967E-11 8.58466E-11166 Radioactive waste, in final repository for nuclear waste LLW/CH U m3 4.98205E-11 -3.07217E-11 8.05422E-11167 Chips, Scandinavian softwood (plant-debarked), u=70%, at plant/NORDEL U m3 4.94395E-11 -2.92428E-11 7.86823E-11168 Particle board, indoor use, at plant/RER U m3 4.7128E-11 -2.59908E-11 7.31188E-11169 Wood chips, hardwood, u=80%, at forest/RER U m3 4.02901E-11 -2.5948E-11 6.62381E-11170 Sawn timber, hardwood, raw, plant-debarked, u=70%, at plant/RER S m3 2.25876E-11 -6.90696E-23 2.25876E-11171 Sawn timber, hardwood, raw, kiln dried, u=10%, at plant/RER U m3 1.28578E-11 -3.24003E-12 1.60978E-11172 Sawn timber, hardwood, raw, air / kiln dried, u=10%, at plant/RER U m3 1.28578E-11 -3.24003E-12 1.60978E-11173 Radioactive waste, in interim storage, for final repository LLW/CH U m3 1.25634E-11 -7.74569E-12 2.03091E-11174 Radioactive waste, in final repository for nuclear waste SF, HLW, and ILW/CH U m3 1.22255E-11 -7.52281E-12 1.97483E-11175 Radioactive waste, in interim storage, for final repository SF, HLW, and ILW/CH U m3 1.06379E-11 -6.53192E-12 1.71699E-11176 Sorting comingle paper+cont./AU U m3 7.46977E-12 -6.09208E-12 1.35619E-11177 Infra WWTP size 2 U -- m3 6.81754E-12 -2.56026E-12 9.3778E-12178 Infra sewage system size 2 U -- m3 6.81754E-12 -2.56026E-12 9.3778E-12179 Round wood, Scandinavian softwood, under bark, u=70% at forest road/NORDEL U m3 3.77411E-12 -2.23233E-12 6.00645E-12180 Treatment, ceramic production effluent, to wastewater treatment, class 3/CH U m3 1.48739E-12 -8.56729E-13 2.34412E-12181 Low radioactive waste U -- m3 1.20417E-12 -4.64728E-14 1.25064E-12182 Metal construction building U - m3 1.04451E-12 -4.45241E-14 1.08904E-12183 Treatment, maize starch production effluent, to wastewater treatment, class 2/CH U m3 1.57729E-13 -9.78294E-14 2.55559E-13184 Radioactive waste in final storage B U -- m3 1.14172E-13 -8.62745E-15 1.22799E-13185 Radioactive waste, in interim storage conditioning/CH U m3 1.05128E-13 -6.54579E-14 1.70586E-13186 RA waste interim storage B U -- m3 4.35654E-14 -3.29338E-15 4.68588E-14187 Radioactive waste in final storage C U -- m3 9.32691E-15 -7.04637E-16 1.00316E-14188 RA waste interim storage C U -- m3 9.32691E-15 -7.04636E-16 1.00316E-14189 Lubricants, 2001-02, - energy allocation/AU U -- m3 1.90515E-15 -1.55377E-15 3.45892E-15190 Plywood, indoor use, at plant/RER U m3 1.48347E-15 -9.43723E-16 2.42719E-15191 Leakage natural gas LP CH U - m3 1.16801E-15 -3.58639E-15 4.7544E-15192 Treatment, condensate from light oil boiler, to wastewater treatment, class 2/CH U m3 7.34134E-16 -3.83819E-16 1.11795E-15193 Leakage natural gas HP CH U - m3 3.81344E-16 -1.17093E-15 1.55227E-15194 RA waste interim storage conditioning ZWILAG U -- m3 1.9958E-16 -1.51381E-17 2.14718E-16195 LPG from refineries, 2001-02, - energy allocation/AU U -- m3 -3.99423E-12 -7.02535E-12 3.03112E-12196 LPG from natural gas, 2001-02/AU U -- m3 -9.1195E-12 -1.60401E-11 6.92055E-12197 LPG, Australian average, 2001-02/ AU U -- m3 -1.31137E-11 -2.30654E-11 9.95166E-12198 Crude Oil AU (00-01)/AU U EnAll -- m3 -2.48284E-09 -3.67615E-09 1.1933E-09199 Hardwood, allocation correction, 1/RER U m3 -4.2483E-09 1.72008E-09 -5.96838E-09200 Hardwood, allocation correction, 3/RER U m3 -6.02732E-09 2.34938E-09 -8.3767E-09201 Softwood, allocation correction, 3/RER U m3 -1.12763E-07 2.09889E-08 -1.33752E-07
2 of 25
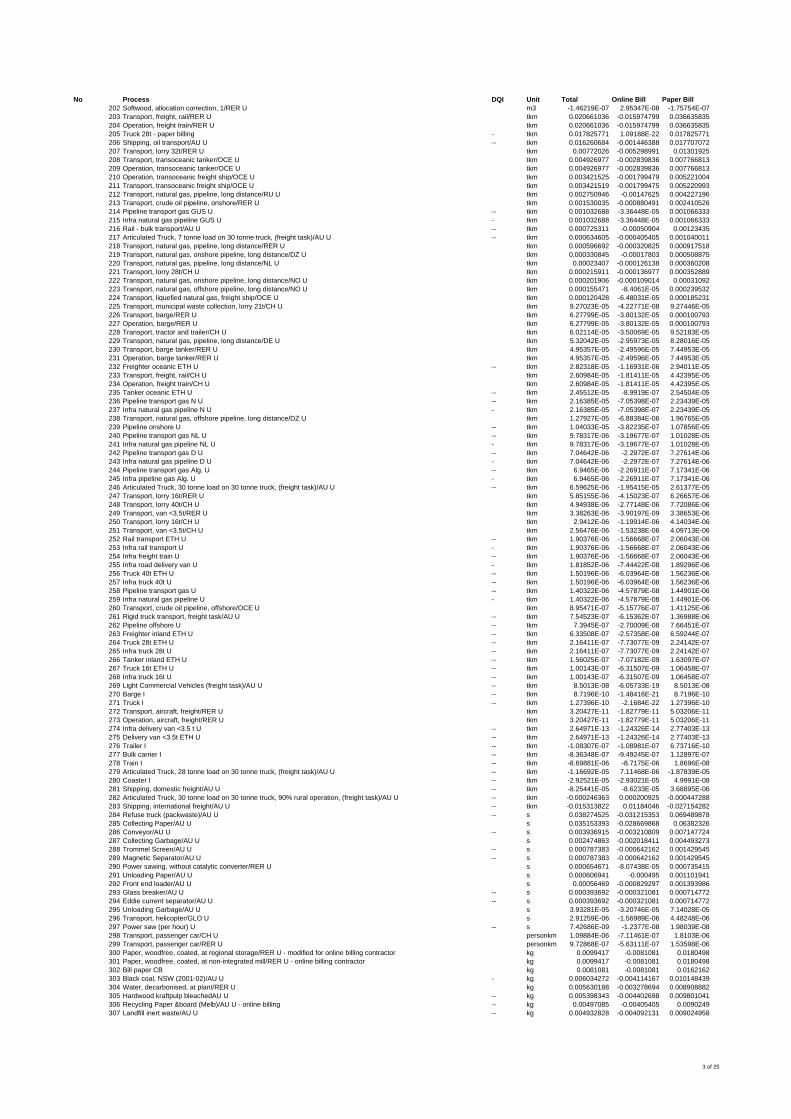
No Process DQI Unit Total Online Bill Paper Bill202 Softwood, allocation correction, 1/RER U m3 -1.46219E-07 2.95347E-08 -1.75754E-07203 Transport, freight, rail/RER U tkm 0.020661036 -0.015974799 0.036635835204 Operation, freight train/RER U tkm 0.020661036 -0.015974799 0.036635835205 Truck 28t - paper billing - tkm 0.017825771 1.09188E-22 0.017825771206 Shipping, oil transport/AU U -- tkm 0.016260684 -0.001446388 0.017707072207 Transport, lorry 32t/RER U tkm 0.00772026 -0.005298991 0.01301925208 Transport, transoceanic tanker/OCE U tkm 0.004926977 -0.002839836 0.007766813209 Operation, transoceanic tanker/OCE U tkm 0.004926977 -0.002839836 0.007766813210 Operation, transoceanic freight ship/OCE U tkm 0.003421525 -0.001799479 0.005221004211 Transport, transoceanic freight ship/OCE U tkm 0.003421519 -0.001799475 0.005220993212 Transport, natural gas, pipeline, long distance/RU U tkm 0.002750946 -0.00147625 0.004227196213 Transport, crude oil pipeline, onshore/RER U tkm 0.001530035 -0.000880491 0.002410526214 Pipeline transport gas GUS U -- tkm 0.001032688 -3.36448E-05 0.001066333215 Infra natural gas pipeline GUS U - tkm 0.001032688 -3.36448E-05 0.001066333216 Rail - bulk transport/AU U -- tkm 0.000725311 -0.00050904 0.00123435217 Articulated Truck, 7 tonne load on 30 tonne truck, (freight task)/AU U -- tkm 0.000634605 -0.000405405 0.001040011218 Transport, natural gas, pipeline, long distance/RER U tkm 0.000596692 -0.000320825 0.000917518219 Transport, natural gas, onshore pipeline, long distance/DZ U tkm 0.000330845 -0.00017803 0.000508875220 Transport, natural gas, pipeline, long distance/NL U tkm 0.00023407 -0.000126138 0.000360208221 Transport, lorry 28t/CH U tkm 0.000215911 -0.000136977 0.000352889222 Transport, natural gas, onshore pipeline, long distance/NO U tkm 0.000201906 -0.000109014 0.00031092223 Transport, natural gas, offshore pipeline, long distance/NO U tkm 0.000155471 -8.4061E-05 0.000239532224 Transport, liquefied natural gas, freight ship/OCE U tkm 0.000120428 -6.48031E-05 0.000185231225 Transport, municipal waste collection, lorry 21t/CH U tkm 9.27023E-05 -4.22771E-08 9.27446E-05226 Transport, barge/RER U tkm 6.27799E-05 -3.80132E-05 0.000100793227 Operation, barge/RER U tkm 6.27799E-05 -3.80132E-05 0.000100793228 Transport, tractor and trailer/CH U tkm 6.02114E-05 -3.50069E-05 9.52183E-05229 Transport, natural gas, pipeline, long distance/DE U tkm 5.32042E-05 -2.95973E-05 8.28016E-05230 Transport, barge tanker/RER U tkm 4.95357E-05 -2.49596E-05 7.44953E-05231 Operation, barge tanker/RER U tkm 4.95357E-05 -2.49596E-05 7.44953E-05232 Freighter oceanic ETH U -- tkm 2.82318E-05 -1.16931E-06 2.94011E-05233 Transport, freight, rail/CH U tkm 2.60984E-05 -1.81411E-05 4.42395E-05234 Operation, freight train/CH U tkm 2.60984E-05 -1.81411E-05 4.42395E-05235 Tanker oceanic ETH U -- tkm 2.45512E-05 -8.9919E-07 2.54504E-05236 Pipeline transport gas N U -- tkm 2.16385E-05 -7.05398E-07 2.23439E-05237 Infra natural gas pipeline N U - tkm 2.16385E-05 -7.05398E-07 2.23439E-05238 Transport, natural gas, offshore pipeline, long distance/DZ U tkm 1.27927E-05 -6.88384E-06 1.96765E-05239 Pipeline onshore U -- tkm 1.04033E-05 -3.82235E-07 1.07856E-05240 Pipeline transport gas NL U -- tkm 9.78317E-06 -3.19677E-07 1.01028E-05241 Infra natural gas pipeline NL U - tkm 9.78317E-06 -3.19677E-07 1.01028E-05242 Pipeline transport gas D U -- tkm 7.04642E-06 -2.2972E-07 7.27614E-06243 Infra natural gas pipeline D U - tkm 7.04642E-06 -2.2972E-07 7.27614E-06244 Pipeline transport gas Alg. U -- tkm 6.9465E-06 -2.26911E-07 7.17341E-06245 Infra pipeline gas Alg. U - tkm 6.9465E-06 -2.26911E-07 7.17341E-06246 Articulated Truck, 30 tonne load on 30 tonne truck, (freight task)/AU U -- tkm 6.59625E-06 -1.95415E-05 2.61377E-05247 Transport, lorry 16t/RER U tkm 5.85155E-06 -4.15023E-07 6.26657E-06248 Transport, lorry 40t/CH U tkm 4.94938E-06 -2.77148E-06 7.72086E-06249 Transport, van <3.5t/RER U tkm 3.38263E-06 -3.90197E-09 3.38653E-06250 Transport, lorry 16t/CH U tkm 2.9412E-06 -1.19914E-06 4.14034E-06251 Transport, van <3.5t/CH U tkm 2.56476E-06 -1.53238E-06 4.09713E-06252 Rail transport ETH U -- tkm 1.90376E-06 -1.56668E-07 2.06043E-06253 Infra rail transport U - tkm 1.90376E-06 -1.56668E-07 2.06043E-06254 Infra freight train U -- tkm 1.90376E-06 -1.56668E-07 2.06043E-06255 Infra road delivery van U - tkm 1.81852E-06 -7.44422E-08 1.89296E-06256 Truck 40t ETH U -- tkm 1.50196E-06 -6.03964E-08 1.56236E-06257 Infra truck 40t U -- tkm 1.50196E-06 -6.03964E-08 1.56236E-06258 Pipeline transport gas U -- tkm 1.40322E-06 -4.57879E-08 1.44901E-06259 Infra natural gas pipeline U - tkm 1.40322E-06 -4.57879E-08 1.44901E-06260 Transport, crude oil pipeline, offshore/OCE U tkm 8.95471E-07 -5.15776E-07 1.41125E-06261 Rigid truck transport, freight task/AU U -- tkm 7.54523E-07 -6.15362E-07 1.36988E-06262 Pipeline offshore U -- tkm 7.3945E-07 -2.70009E-08 7.66451E-07263 Freighter inland ETH U -- tkm 6.33508E-07 -2.57358E-08 6.59244E-07264 Truck 28t ETH U -- tkm 2.16411E-07 -7.73077E-09 2.24142E-07265 Infra truck 28t U -- tkm 2.16411E-07 -7.73077E-09 2.24142E-07266 Tanker inland ETH U -- tkm 1.56025E-07 -7.07182E-09 1.63097E-07267 Truck 16t ETH U -- tkm 1.00143E-07 -6.31507E-09 1.06458E-07268 Infra truck 16t U -- tkm 1.00143E-07 -6.31507E-09 1.06458E-07269 Light Commercial Vehicles (freight task)/AU U -- tkm 8.5013E-08 -6.05733E-19 8.5013E-08270 Barge I -- tkm 8.7196E-10 -1.48416E-21 8.7196E-10271 Truck I -- tkm 1.27396E-10 -2.1684E-22 1.27396E-10272 Transport, aircraft, freight/RER U tkm 3.20427E-11 -1.82779E-11 5.03206E-11273 Operation, aircraft, freight/RER U tkm 3.20427E-11 -1.82779E-11 5.03206E-11274 Infra delivery van <3.5 t U -- tkm 2.64971E-13 -1.24326E-14 2.77403E-13275 Delivery van <3.5t ETH U -- tkm 2.64971E-13 -1.24326E-14 2.77403E-13276 Trailer I -- tkm -1.08307E-07 -1.08981E-07 6.73716E-10277 Bulk carrier I -- tkm -8.36348E-07 -9.49245E-07 1.12897E-07278 Train I -- tkm -8.69881E-06 -8.7175E-06 1.8696E-08279 Articulated Truck, 28 tonne load on 30 tonne truck, (freight task)/AU U -- tkm -1.16692E-05 7.11468E-06 -1.87839E-05280 Coaster I -- tkm -2.92521E-05 -2.93021E-05 4.9991E-08281 Shipping, domestic freight/AU U -- tkm -8.25441E-05 -8.6233E-05 3.68895E-06282 Articulated Truck, 30 tonne load on 30 tonne truck, 90% rural operation, (freight task)/AU U -- tkm -0.000246363 0.000200925 -0.000447288283 Shipping, international freight/AU U -- tkm -0.015313822 0.01184046 -0.027154282284 Refuse truck (packwaste)/AU U -- s 0.038274525 -0.031215353 0.069489878285 Collecting Paper/AU U s 0.035153393 -0.028669868 0.06382326286 Conveyor/AU U -- s 0.003936915 -0.003210809 0.007147724287 Collecting Garbage/AU U s 0.002474863 -0.002018411 0.004493273288 Trommel Screen/AU U -- s 0.000787383 -0.000642162 0.001429545289 Magnetic Separator/AU U -- s 0.000787383 -0.000642162 0.001429545290 Power sawing, without catalytic converter/RER U s 0.000654671 -8.07438E-05 0.000735415291 Unloading Paper/AU U s 0.000606941 -0.000495 0.001101941292 Front end loader/AU U s 0.00056469 -0.000829297 0.001393986293 Glass breaker/AU U -- s 0.000393692 -0.000321081 0.000714772294 Eddie current separator/AU U -- s 0.000393692 -0.000321081 0.000714772295 Unloading Garbage/AU U s 3.93281E-05 -3.20746E-05 7.14028E-05296 Transport, helicopter/GLO U s 2.91259E-06 -1.56989E-06 4.48248E-06297 Power saw (per hour) U -- s 7.42686E-09 -1.2377E-08 1.98039E-08298 Transport, passenger car/CH U personkm 1.09884E-06 -7.11461E-07 1.8103E-06299 Transport, passenger car/RER U personkm 9.72868E-07 -5.63111E-07 1.53598E-06300 Paper, woodfree, coated, at regional storage/RER U - modified for online billing contractor kg 0.0099417 -0.0081081 0.0180498301 Paper, woodfree, coated, at non-integrated mill/RER U - online billing contractor kg 0.0099417 -0.0081081 0.0180498302 Bill paper CB kg 0.0081081 -0.0081081 0.0162162303 Black coal, NSW (2001-02)/AU U - kg 0.006034272 -0.004114167 0.010148439304 Water, decarbonised, at plant/RER U kg 0.005630188 -0.003278694 0.008908882305 Hardwood kraftpulp bleachedAU U -- kg 0.005398343 -0.004402698 0.009801041306 Recycling Paper &board (Melb)/AU U - online billing -- kg 0.00497085 -0.00405405 0.0090249307 Landfill inert waste/AU U -- kg 0.004932828 -0.004092131 0.009024958
3 of 25
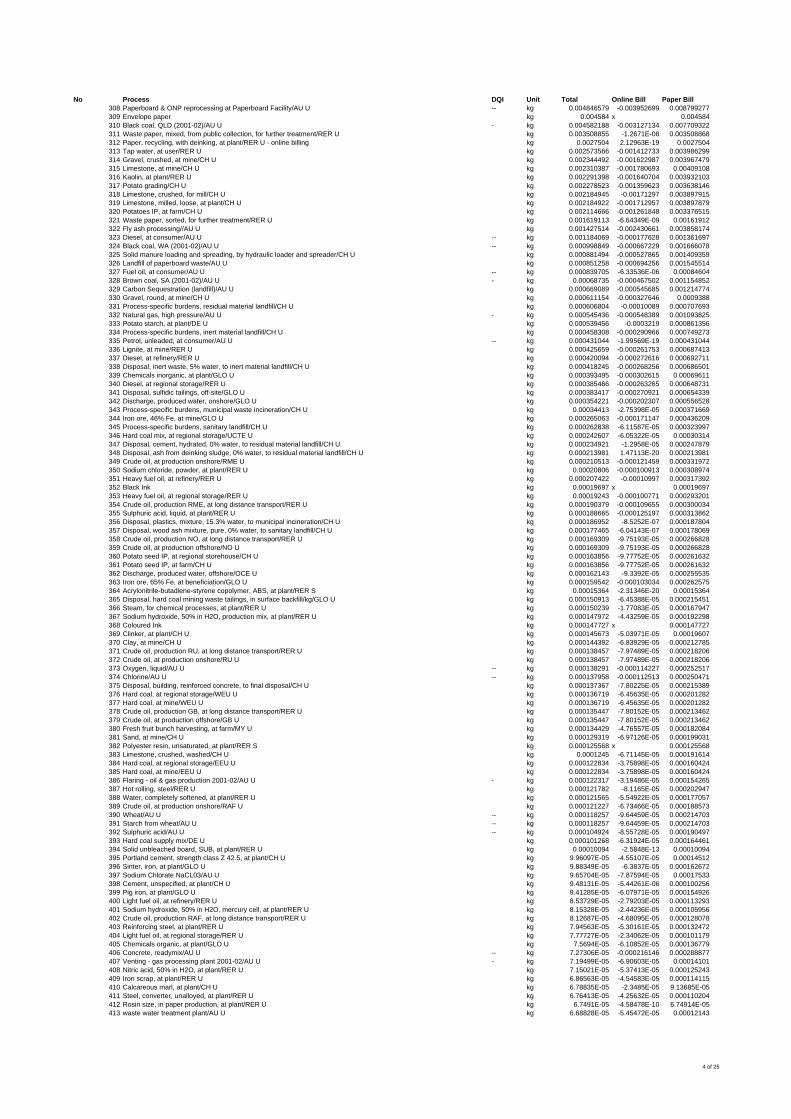
No Process DQI Unit Total Online Bill Paper Bill308 Paperboard & ONP reprocessing at Paperboard Facility/AU U -- kg 0.004846579 -0.003952699 0.008799277309 Envelope paper kg 0.004584 x 0.004584310 Black coal, QLD (2001-02)/AU U - kg 0.004582188 -0.003127134 0.007709322311 Waste paper, mixed, from public collection, for further treatment/RER U kg 0.003508855 -1.2671E-08 0.003508868312 Paper, recycling, with deinking, at plant/RER U - online billing kg 0.0027504 2.12963E-19 0.0027504313 Tap water, at user/RER U kg 0.002573566 -0.001412733 0.003986299314 Gravel, crushed, at mine/CH U kg 0.002344492 -0.001622987 0.003967479315 Limestone, at mine/CH U kg 0.002310387 -0.001780693 0.00409108316 Kaolin, at plant/RER U kg 0.002291398 -0.001640704 0.003932103317 Potato grading/CH U kg 0.002278523 -0.001359623 0.003638146318 Limestone, crushed, for mill/CH U kg 0.002184945 -0.00171297 0.003897915319 Limestone, milled, loose, at plant/CH U kg 0.002184922 -0.001712957 0.003897879320 Potatoes IP, at farm/CH U kg 0.002114666 -0.001261848 0.003376515321 Waste paper, sorted, for further treatment/RER U kg 0.001619113 -6.64349E-09 0.00161912322 Fly ash processing//AU U kg 0.001427514 -0.002430661 0.003858174323 Diesel, at consumer/AU U -- kg 0.001184069 -0.000177628 0.001361697324 Black coal, WA (2001-02)/AU U -- kg 0.000998849 -0.000667229 0.001666078325 Solid manure loading and spreading, by hydraulic loader and spreader/CH U kg 0.000881494 -0.000527865 0.001409359326 Landfill of paperboard waste/AU U kg 0.000851258 -0.000694256 0.001545514327 Fuel oil, at consumer/AU U -- kg 0.000839705 -6.33536E-06 0.00084604328 Brown coal, SA (2001-02)/AU U - kg 0.00068735 -0.000467502 0.001154852329 Carbon Sequestration (landfill)/AU U kg 0.000669089 -0.000545685 0.001214774330 Gravel, round, at mine/CH U kg 0.000611154 -0.000327646 0.0009388331 Process-specific burdens, residual material landfill/CH U kg 0.000606804 -0.00010089 0.000707693332 Natural gas, high pressure/AU U - kg 0.000545436 -0.000548389 0.001093825333 Potato starch, at plant/DE U kg 0.000539456 -0.0003219 0.000861356334 Process-specific burdens, inert material landfill/CH U kg 0.000458308 -0.000290966 0.000749273335 Petrol, unleaded, at consumer/AU U -- kg 0.000431044 -1.99569E-19 0.000431044336 Lignite, at mine/RER U kg 0.000425659 -0.000261753 0.000687413337 Diesel, at refinery/RER U kg 0.000420094 -0.000272616 0.000692711338 Disposal, inert waste, 5% water, to inert material landfill/CH U kg 0.000418245 -0.000268256 0.000686501339 Chemicals inorganic, at plant/GLO U kg 0.000393495 -0.000302615 0.00069611340 Diesel, at regional storage/RER U kg 0.000385466 -0.000263265 0.000648731341 Disposal, sulfidic tailings, off-site/GLO U kg 0.000383417 -0.000270921 0.000654339342 Discharge, produced water, onshore/GLO U kg 0.000354221 -0.000202307 0.000556528343 Process-specific burdens, municipal waste incineration/CH U kg 0.00034413 -2.75398E-05 0.000371669344 Iron ore, 46% Fe, at mine/GLO U kg 0.000265063 -0.000171147 0.000436209345 Process-specific burdens, sanitary landfill/CH U kg 0.000262838 -6.11587E-05 0.000323997346 Hard coal mix, at regional storage/UCTE U kg 0.000242607 -6.05322E-05 0.00030314347 Disposal, cement, hydrated, 0% water, to residual material landfill/CH U kg 0.000234921 -1.2958E-05 0.000247879348 Disposal, ash from deinking sludge, 0% water, to residual material landfill/CH U kg 0.000213981 1.47113E-20 0.000213981349 Crude oil, at production onshore/RME U kg 0.000210513 -0.000121459 0.000331972350 Sodium chloride, powder, at plant/RER U kg 0.00020806 -0.000100913 0.000308974351 Heavy fuel oil, at refinery/RER U kg 0.000207422 -0.00010997 0.000317392352 Black Ink kg 0.00019697 x 0.00019697353 Heavy fuel oil, at regional storage/RER U kg 0.00019243 -0.000100771 0.000293201354 Crude oil, production RME, at long distance transport/RER U kg 0.000190379 -0.000109655 0.000300034355 Sulphuric acid, liquid, at plant/RER U kg 0.000188665 -0.000125197 0.000313862356 Disposal, plastics, mixture, 15.3% water, to municipal incineration/CH U kg 0.000186952 -8.5252E-07 0.000187804357 Disposal, wood ash mixture, pure, 0% water, to sanitary landfill/CH U kg 0.000177465 -6.04143E-07 0.000178069358 Crude oil, production NO, at long distance transport/RER U kg 0.000169309 -9.75193E-05 0.000266828359 Crude oil, at production offshore/NO U kg 0.000169309 -9.75193E-05 0.000266828360 Potato seed IP, at regional storehouse/CH U kg 0.000163856 -9.77752E-05 0.000261632361 Potato seed IP, at farm/CH U kg 0.000163856 -9.77752E-05 0.000261632362 Discharge, produced water, offshore/OCE U kg 0.000162143 -9.3392E-05 0.000255535363 Iron ore, 65% Fe, at beneficiation/GLO U kg 0.000159542 -0.000103034 0.000262575364 Acrylonitrile-butadiene-styrene copolymer, ABS, at plant/RER S kg 0.00015364 -2.31346E-20 0.00015364365 Disposal, hard coal mining waste tailings, in surface backfill/kg/GLO U kg 0.000150913 -6.45388E-05 0.000215451366 Steam, for chemical processes, at plant/RER U kg 0.000150239 -1.77083E-05 0.000167947367 Sodium hydroxide, 50% in H2O, production mix, at plant/RER U kg 0.000147972 -4.43259E-05 0.000192298368 Coloured Ink kg 0.000147727 x 0.000147727369 Clinker, at plant/CH U kg 0.000145673 -5.03971E-05 0.00019607370 Clay, at mine/CH U kg 0.000144392 -6.83929E-05 0.000212785371 Crude oil, production RU, at long distance transport/RER U kg 0.000138457 -7.97489E-05 0.000218206372 Crude oil, at production onshore/RU U kg 0.000138457 -7.97489E-05 0.000218206373 Oxygen, liquid/AU U -- kg 0.000138291 -0.000114227 0.000252517374 Chlorine/AU U -- kg 0.000137958 -0.000112513 0.000250471375 Disposal, building, reinforced concrete, to final disposal/CH U kg 0.000137367 -7.80225E-05 0.000215389376 Hard coal, at regional storage/WEU U kg 0.000136719 -6.45635E-05 0.000201282377 Hard coal, at mine/WEU U kg 0.000136719 -6.45635E-05 0.000201282378 Crude oil, production GB, at long distance transport/RER U kg 0.000135447 -7.80152E-05 0.000213462379 Crude oil, at production offshore/GB U kg 0.000135447 -7.80152E-05 0.000213462380 Fresh fruit bunch harvesting, at farm/MY U kg 0.000134429 -4.76557E-05 0.000182084381 Sand, at mine/CH U kg 0.000129319 -6.97126E-05 0.000199031382 Polyester resin, unsaturated, at plant/RER S kg 0.000125568 x 0.000125568383 Limestone, crushed, washed/CH U kg 0.0001245 -6.71145E-05 0.000191614384 Hard coal, at regional storage/EEU U kg 0.000122834 -3.75898E-05 0.000160424385 Hard coal, at mine/EEU U kg 0.000122834 -3.75898E-05 0.000160424386 Flaring - oil & gas production 2001-02/AU U - kg 0.000122317 -3.19486E-05 0.000154265387 Hot rolling, steel/RER U kg 0.000121782 -8.1165E-05 0.000202947388 Water, completely softened, at plant/RER U kg 0.000121565 -5.54922E-05 0.000177057389 Crude oil, at production onshore/RAF U kg 0.000121227 -6.73466E-05 0.000188573390 Wheat/AU U -- kg 0.000118257 -9.64459E-05 0.000214703391 Starch from wheat/AU U -- kg 0.000118257 -9.64459E-05 0.000214703392 Sulphuric acid/AU U -- kg 0.000104924 -8.55728E-05 0.000190497393 Hard coal supply mix/DE U kg 0.000101268 -6.31924E-05 0.000164461394 Solid unbleached board, SUB, at plant/RER U kg 0.00010094 -2.5848E-13 0.00010094395 Portland cement, strength class Z 42.5, at plant/CH U kg 9.96097E-05 -4.55107E-05 0.00014512396 Sinter, iron, at plant/GLO U kg 9.88349E-05 -6.3837E-05 0.000162672397 Sodium Chlorate NaCL03/AU U kg 9.65704E-05 -7.87594E-05 0.00017533398 Cement, unspecified, at plant/CH U kg 9.48131E-05 -5.44261E-06 0.000100256399 Pig iron, at plant/GLO U kg 9.41285E-05 -6.07971E-05 0.000154926400 Light fuel oil, at refinery/RER U kg 8.53729E-05 -2.79203E-05 0.000113293401 Sodium hydroxide, 50% in H2O, mercury cell, at plant/RER U kg 8.15328E-05 -2.44236E-05 0.000105956402 Crude oil, production RAF, at long distance transport/RER U kg 8.12687E-05 -4.68095E-05 0.000128078403 Reinforcing steel, at plant/RER U kg 7.94563E-05 -5.30161E-05 0.000132472404 Light fuel oil, at regional storage/RER U kg 7.77727E-05 -2.34062E-05 0.000101179405 Chemicals organic, at plant/GLO U kg 7.5694E-05 -6.10852E-05 0.000136779406 Concrete, readymix/AU U -- kg 7.27306E-05 -0.000216146 0.000288877407 Venting - gas processing plant 2001-02/AU U - kg 7.19499E-05 -6.90603E-05 0.00014101408 Nitric acid, 50% in H2O, at plant/RER U kg 7.15021E-05 -5.37413E-05 0.000125243409 Iron scrap, at plant/RER U kg 6.86563E-05 -4.54583E-05 0.000114115410 Calcareous marl, at plant/CH U kg 6.78835E-05 -2.3485E-05 9.13685E-05411 Steel, converter, unalloyed, at plant/RER U kg 6.76413E-05 -4.25632E-05 0.000110204412 Rosin size, in paper production, at plant/RER U kg 6.7491E-05 -4.58478E-10 6.74914E-05413 waste water treatment plant/AU U kg 6.68828E-05 -5.45472E-05 0.00012143
4 of 25
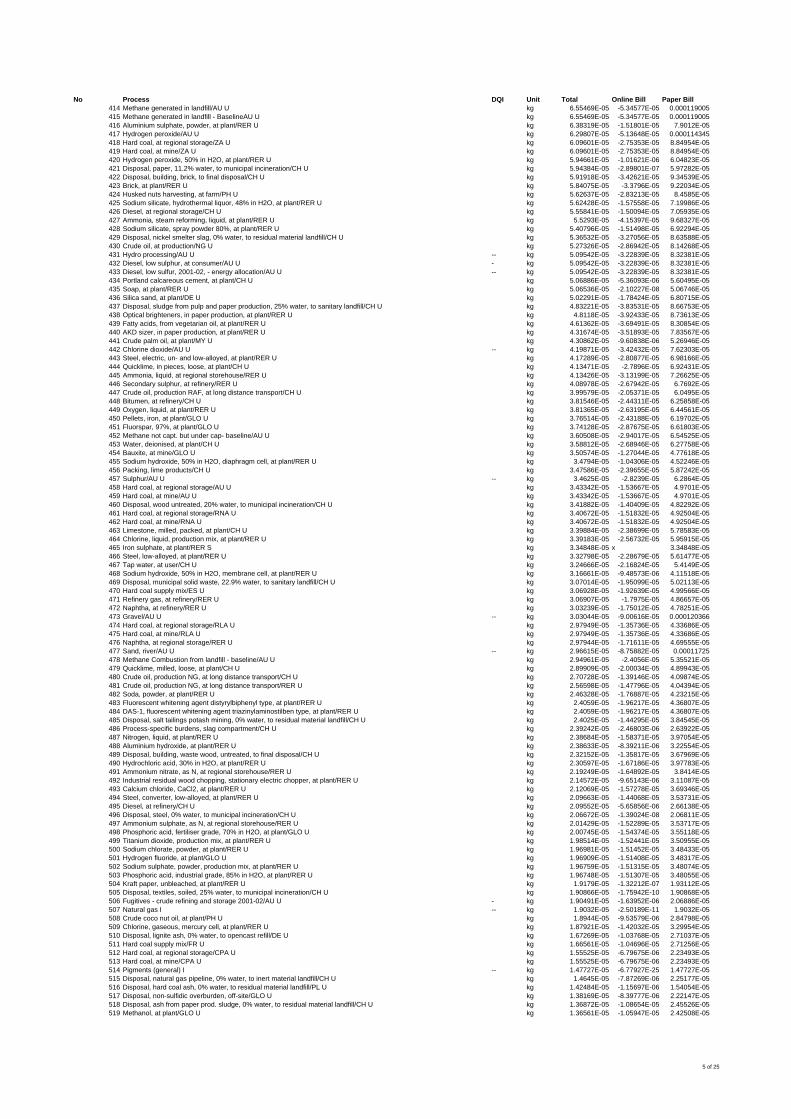
No Process DQI Unit Total Online Bill Paper Bill414 Methane generated in landfill/AU U kg 6.55469E-05 -5.34577E-05 0.000119005415 Methane generated in landfill - BaselineAU U kg 6.55469E-05 -5.34577E-05 0.000119005416 Aluminium sulphate, powder, at plant/RER U kg 6.38319E-05 -1.51801E-05 7.9012E-05417 Hydrogen peroxide/AU U kg 6.29807E-05 -5.13648E-05 0.000114345418 Hard coal, at regional storage/ZA U kg 6.09601E-05 -2.75353E-05 8.84954E-05419 Hard coal, at mine/ZA U kg 6.09601E-05 -2.75353E-05 8.84954E-05420 Hydrogen peroxide, 50% in H2O, at plant/RER U kg 5.94661E-05 -1.01621E-06 6.04823E-05421 Disposal, paper, 11.2% water, to municipal incineration/CH U kg 5.94384E-05 -2.89801E-07 5.97282E-05422 Disposal, building, brick, to final disposal/CH U kg 5.91918E-05 -3.42621E-05 9.34539E-05423 Brick, at plant/RER U kg 5.84075E-05 -3.3796E-05 9.22034E-05424 Husked nuts harvesting, at farm/PH U kg 5.62637E-05 -2.83213E-05 8.4585E-05425 Sodium silicate, hydrothermal liquor, 48% in H2O, at plant/RER U kg 5.62428E-05 -1.57558E-05 7.19986E-05426 Diesel, at regional storage/CH U kg 5.55841E-05 -1.50094E-05 7.05935E-05427 Ammonia, steam reforming, liquid, at plant/RER U kg 5.5293E-05 -4.15397E-05 9.68327E-05428 Sodium silicate, spray powder 80%, at plant/RER U kg 5.40796E-05 -1.51498E-05 6.92294E-05429 Disposal, nickel smelter slag, 0% water, to residual material landfill/CH U kg 5.36532E-05 -3.27056E-05 8.63588E-05430 Crude oil, at production/NG U kg 5.27326E-05 -2.86942E-05 8.14268E-05431 Hydro processing/AU U -- kg 5.09542E-05 -3.22839E-05 8.32381E-05432 Diesel, low sulphur, at consumer/AU U - kg 5.09542E-05 -3.22839E-05 8.32381E-05433 Diesel, low sulfur, 2001-02, - energy allocation/AU U -- kg 5.09542E-05 -3.22839E-05 8.32381E-05434 Portland calcareous cement, at plant/CH U kg 5.06886E-05 -5.36093E-06 5.60495E-05435 Soap, at plant/RER U kg 5.06536E-05 -2.10227E-08 5.06746E-05436 Silica sand, at plant/DE U kg 5.02291E-05 -1.78424E-05 6.80715E-05437 Disposal, sludge from pulp and paper production, 25% water, to sanitary landfill/CH U kg 4.83221E-05 -3.83531E-05 8.66753E-05438 Optical brighteners, in paper production, at plant/RER U kg 4.8118E-05 -3.92433E-05 8.73613E-05439 Fatty acids, from vegetarian oil, at plant/RER U kg 4.61362E-05 -3.69491E-05 8.30854E-05440 AKD sizer, in paper production, at plant/RER U kg 4.31674E-05 -3.51893E-05 7.83567E-05441 Crude palm oil, at plant/MY U kg 4.30862E-05 -9.60838E-06 5.26946E-05442 Chlorine dioxide/AU U -- kg 4.19871E-05 -3.42432E-05 7.62303E-05443 Steel, electric, un- and low-alloyed, at plant/RER U kg 4.17289E-05 -2.80877E-05 6.98166E-05444 Quicklime, in pieces, loose, at plant/CH U kg 4.13471E-05 -2.7896E-05 6.92431E-05445 Ammonia, liquid, at regional storehouse/RER U kg 4.13426E-05 -3.13199E-05 7.26625E-05446 Secondary sulphur, at refinery/RER U kg 4.08978E-05 -2.67942E-05 6.7692E-05447 Crude oil, production RAF, at long distance transport/CH U kg 3.99579E-05 -2.05371E-05 6.0495E-05448 Bitumen, at refinery/CH U kg 3.81546E-05 -2.44311E-05 6.25858E-05449 Oxygen, liquid, at plant/RER U kg 3.81365E-05 -2.63195E-05 6.44561E-05450 Pellets, iron, at plant/GLO U kg 3.76514E-05 -2.43188E-05 6.19702E-05451 Fluorspar, 97%, at plant/GLO U kg 3.74128E-05 -2.87675E-05 6.61803E-05452 Methane not capt. but under cap- baseline/AU U kg 3.60508E-05 -2.94017E-05 6.54525E-05453 Water, deionised, at plant/CH U kg 3.58812E-05 -2.68946E-05 6.27758E-05454 Bauxite, at mine/GLO U kg 3.50574E-05 -1.27044E-05 4.77618E-05455 Sodium hydroxide, 50% in H2O, diaphragm cell, at plant/RER U kg 3.4794E-05 -1.04306E-05 4.52246E-05456 Packing, lime products/CH U kg 3.47586E-05 -2.39655E-05 5.87242E-05457 Sulphur/AU U -- kg 3.4625E-05 -2.8239E-05 6.2864E-05458 Hard coal, at regional storage/AU U kg 3.43342E-05 -1.53667E-05 4.9701E-05459 Hard coal, at mine/AU U kg 3.43342E-05 -1.53667E-05 4.9701E-05460 Disposal, wood untreated, 20% water, to municipal incineration/CH U kg 3.41882E-05 -1.40409E-05 4.82292E-05461 Hard coal, at regional storage/RNA U kg 3.40672E-05 -1.51832E-05 4.92504E-05462 Hard coal, at mine/RNA U kg 3.40672E-05 -1.51832E-05 4.92504E-05463 Limestone, milled, packed, at plant/CH U kg 3.39884E-05 -2.38699E-05 5.78583E-05464 Chlorine, liquid, production mix, at plant/RER U kg 3.39183E-05 -2.56732E-05 5.95915E-05465 Iron sulphate, at plant/RER S kg 3.34848E-05 x 3.34848E-05466 Steel, low-alloyed, at plant/RER U kg 3.32798E-05 -2.28679E-05 5.61477E-05467 Tap water, at user/CH U kg 3.24666E-05 -2.16824E-05 5.4149E-05468 Sodium hydroxide, 50% in H2O, membrane cell, at plant/RER U kg 3.16661E-05 -9.48573E-06 4.11518E-05469 Disposal, municipal solid waste, 22.9% water, to sanitary landfill/CH U kg 3.07014E-05 -1.95099E-05 5.02113E-05470 Hard coal supply mix/ES U kg 3.06928E-05 -1.92639E-05 4.99566E-05471 Refinery gas, at refinery/RER U kg 3.06907E-05 -1.7975E-05 4.86657E-05472 Naphtha, at refinery/RER U kg 3.03239E-05 -1.75012E-05 4.78251E-05473 Gravel/AU U -- kg 3.03044E-05 -9.00616E-05 0.000120366474 Hard coal, at regional storage/RLA U kg 2.97949E-05 -1.35736E-05 4.33686E-05475 Hard coal, at mine/RLA U kg 2.97949E-05 -1.35736E-05 4.33686E-05476 Naphtha, at regional storage/RER U kg 2.97944E-05 -1.71611E-05 4.69555E-05477 Sand, river/AU U -- kg 2.96615E-05 -8.75882E-05 0.00011725478 Methane Combustion from landfill - baseline/AU U kg 2.94961E-05 -2.4056E-05 5.35521E-05479 Quicklime, milled, loose, at plant/CH U kg 2.89909E-05 -2.00034E-05 4.89943E-05480 Crude oil, production NG, at long distance transport/CH U kg 2.70728E-05 -1.39146E-05 4.09874E-05481 Crude oil, production NG, at long distance transport/RER U kg 2.56598E-05 -1.47796E-05 4.04394E-05482 Soda, powder, at plant/RER U kg 2.46328E-05 -1.76887E-05 4.23215E-05483 Fluorescent whitening agent distyrylbiphenyl type, at plant/RER U kg 2.4059E-05 -1.96217E-05 4.36807E-05484 DAS-1, fluorescent whitening agent triazinylaminostilben type, at plant/RER U kg 2.4059E-05 -1.96217E-05 4.36807E-05485 Disposal, salt tailings potash mining, 0% water, to residual material landfill/CH U kg 2.4025E-05 -1.44295E-05 3.84545E-05486 Process-specific burdens, slag compartment/CH U kg 2.39242E-05 -2.46803E-06 2.63922E-05487 Nitrogen, liquid, at plant/RER U kg 2.38684E-05 -1.58371E-05 3.97054E-05488 Aluminium hydroxide, at plant/RER U kg 2.38633E-05 -8.39211E-06 3.22554E-05489 Disposal, building, waste wood, untreated, to final disposal/CH U kg 2.32152E-05 -1.35817E-05 3.67969E-05490 Hydrochloric acid, 30% in H2O, at plant/RER U kg 2.30597E-05 -1.67186E-05 3.97783E-05491 Ammonium nitrate, as N, at regional storehouse/RER U kg 2.19249E-05 -1.64892E-05 3.8414E-05492 Industrial residual wood chopping, stationary electric chopper, at plant/RER U kg 2.14572E-05 -9.65143E-06 3.11087E-05493 Calcium chloride, CaCl2, at plant/RER U kg 2.12069E-05 -1.57278E-05 3.69346E-05494 Steel, converter, low-alloyed, at plant/RER U kg 2.09663E-05 -1.44068E-05 3.53731E-05495 Diesel, at refinery/CH U kg 2.09552E-05 -5.65856E-06 2.66138E-05496 Disposal, steel, 0% water, to municipal incineration/CH U kg 2.06672E-05 -1.39024E-08 2.06811E-05497 Ammonium sulphate, as N, at regional storehouse/RER U kg 2.01429E-05 -1.52289E-05 3.53717E-05498 Phosphoric acid, fertiliser grade, 70% in H2O, at plant/GLO U kg 2.00745E-05 -1.54374E-05 3.55118E-05499 Titanium dioxide, production mix, at plant/RER U kg 1.98514E-05 -1.52441E-05 3.50955E-05500 Sodium chlorate, powder, at plant/RER U kg 1.96981E-05 -1.51452E-05 3.48433E-05501 Hydrogen fluoride, at plant/GLO U kg 1.96909E-05 -1.51408E-05 3.48317E-05502 Sodium sulphate, powder, production mix, at plant/RER U kg 1.96759E-05 -1.51315E-05 3.48074E-05503 Phosphoric acid, industrial grade, 85% in H2O, at plant/RER U kg 1.96748E-05 -1.51307E-05 3.48055E-05504 Kraft paper, unbleached, at plant/RER U kg 1.9179E-05 -1.32212E-07 1.93112E-05505 Disposal, textiles, soiled, 25% water, to municipal incineration/CH U kg 1.90866E-05 -1.75942E-10 1.90868E-05506 Fugitives - crude refining and storage 2001-02/AU U - kg 1.90491E-05 -1.63952E-06 2.06886E-05507 Natural gas I -- kg 1.9032E-05 -2.50189E-11 1.9032E-05508 Crude coco nut oil, at plant/PH U kg 1.8944E-05 -9.53579E-06 2.84798E-05509 Chlorine, gaseous, mercury cell, at plant/RER U kg 1.87921E-05 -1.42032E-05 3.29954E-05510 Disposal, lignite ash, 0% water, to opencast refill/DE U kg 1.67269E-05 -1.03768E-05 2.71037E-05511 Hard coal supply mix/FR U kg 1.66561E-05 -1.04696E-05 2.71256E-05512 Hard coal, at regional storage/CPA U kg 1.55525E-05 -6.79675E-06 2.23493E-05513 Hard coal, at mine/CPA U kg 1.55525E-05 -6.79675E-06 2.23493E-05514 Pigments (general) I -- kg 1.47727E-05 -6.77927E-25 1.47727E-05515 Disposal, natural gas pipeline, 0% water, to inert material landfill/CH U kg 1.4645E-05 -7.87269E-06 2.25177E-05516 Disposal, hard coal ash, 0% water, to residual material landfill/PL U kg 1.42484E-05 -1.15697E-06 1.54054E-05517 Disposal, non-sulfidic overburden, off-site/GLO U kg 1.38169E-05 -8.39777E-06 2.22147E-05518 Disposal, ash from paper prod. sludge, 0% water, to residual material landfill/CH U kg 1.36872E-05 -1.08654E-05 2.45526E-05519 Methanol, at plant/GLO U kg 1.36561E-05 -1.05947E-05 2.42508E-05
5 of 25
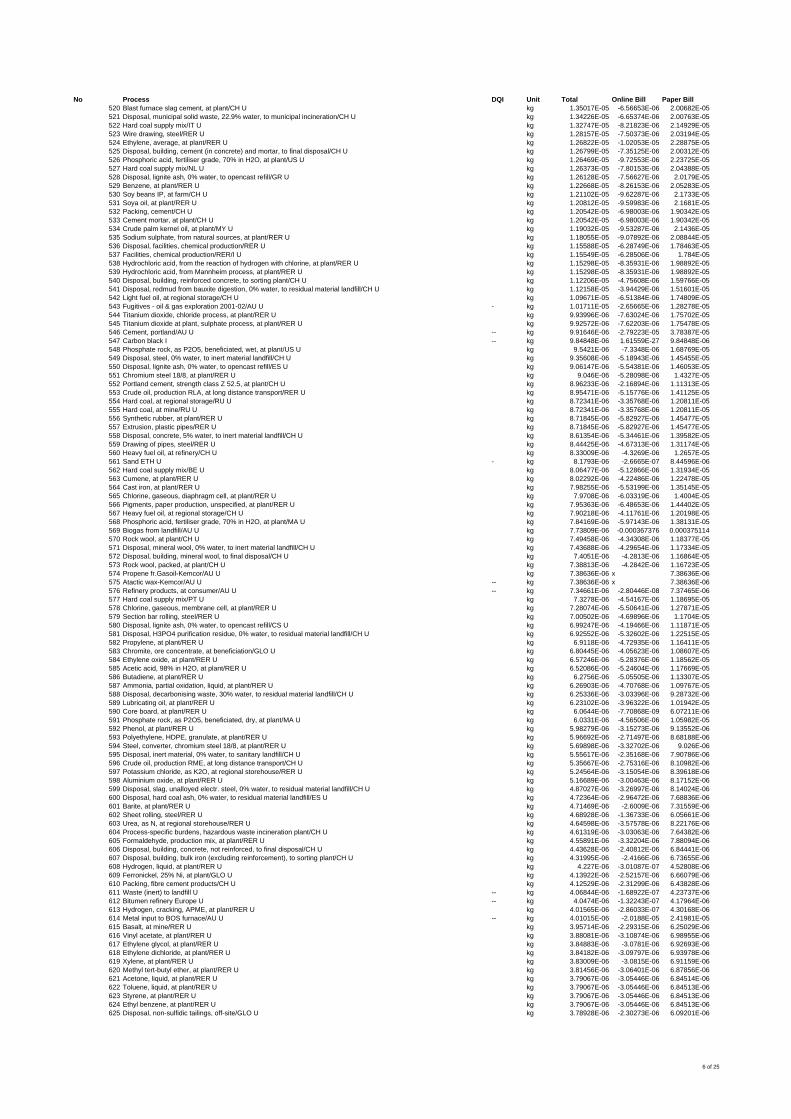
No Process DQI Unit Total Online Bill Paper Bill520 Blast furnace slag cement, at plant/CH U kg 1.35017E-05 -6.56653E-06 2.00682E-05521 Disposal, municipal solid waste, 22.9% water, to municipal incineration/CH U kg 1.34226E-05 -6.65374E-06 2.00763E-05522 Hard coal supply mix/IT U kg 1.32747E-05 -8.21823E-06 2.14929E-05523 Wire drawing, steel/RER U kg 1.28157E-05 -7.50373E-06 2.03194E-05524 Ethylene, average, at plant/RER U kg 1.26822E-05 -1.02053E-05 2.28875E-05525 Disposal, building, cement (in concrete) and mortar, to final disposal/CH U kg 1.26799E-05 -7.35125E-06 2.00312E-05526 Phosphoric acid, fertiliser grade, 70% in H2O, at plant/US U kg 1.26469E-05 -9.72553E-06 2.23725E-05527 Hard coal supply mix/NL U kg 1.26373E-05 -7.80153E-06 2.04388E-05528 Disposal, lignite ash, 0% water, to opencast refill/GR U kg 1.26128E-05 -7.56627E-06 2.0179E-05529 Benzene, at plant/RER U kg 1.22668E-05 -8.26153E-06 2.05283E-05530 Soy beans IP, at farm/CH U kg 1.21102E-05 -9.62287E-06 2.1733E-05531 Soya oil, at plant/RER U kg 1.20812E-05 -9.59983E-06 2.1681E-05532 Packing, cement/CH U kg 1.20542E-05 -6.98003E-06 1.90342E-05533 Cement mortar, at plant/CH U kg 1.20542E-05 -6.98003E-06 1.90342E-05534 Crude palm kernel oil, at plant/MY U kg 1.19032E-05 -9.53287E-06 2.1436E-05535 Sodium sulphate, from natural sources, at plant/RER U kg 1.18055E-05 -9.07892E-06 2.08844E-05536 Disposal, facilities, chemical production/RER U kg 1.15588E-05 -6.28749E-06 1.78463E-05537 Facilities, chemical production/RER/I U kg 1.15549E-05 -6.28506E-06 1.784E-05538 Hydrochloric acid, from the reaction of hydrogen with chlorine, at plant/RER U kg 1.15298E-05 -8.35931E-06 1.98892E-05539 Hydrochloric acid, from Mannheim process, at plant/RER U kg 1.15298E-05 -8.35931E-06 1.98892E-05540 Disposal, building, reinforced concrete, to sorting plant/CH U kg 1.12206E-05 -4.75608E-06 1.59766E-05541 Disposal, redmud from bauxite digestion, 0% water, to residual material landfill/CH U kg 1.12158E-05 -3.94429E-06 1.51601E-05542 Light fuel oil, at regional storage/CH U kg 1.09671E-05 -6.51384E-06 1.74809E-05543 Fugitives - oil & gas exploration 2001-02/AU U - kg 1.01711E-05 -2.65665E-06 1.28278E-05544 Titanium dioxide, chloride process, at plant/RER U kg 9.93996E-06 -7.63024E-06 1.75702E-05545 Titanium dioxide at plant, sulphate process, at plant/RER U kg 9.92572E-06 -7.62203E-06 1.75478E-05546 Cement, portland/AU U -- kg 9.91646E-06 -2.79223E-05 3.78387E-05547 Carbon black I -- kg 9.84848E-06 1.61559E-27 9.84848E-06548 Phosphate rock, as P2O5, beneficiated, wet, at plant/US U kg 9.5421E-06 -7.3348E-06 1.68769E-05549 Disposal, steel, 0% water, to inert material landfill/CH U kg 9.35608E-06 -5.18943E-06 1.45455E-05550 Disposal, lignite ash, 0% water, to opencast refill/ES U kg 9.06147E-06 -5.54381E-06 1.46053E-05551 Chromium steel 18/8, at plant/RER U kg 9.046E-06 -5.28098E-06 1.4327E-05552 Portland cement, strength class Z 52.5, at plant/CH U kg 8.96233E-06 -2.16894E-06 1.11313E-05553 Crude oil, production RLA, at long distance transport/RER U kg 8.95471E-06 -5.15776E-06 1.41125E-05554 Hard coal, at regional storage/RU U kg 8.72341E-06 -3.35768E-06 1.20811E-05555 Hard coal, at mine/RU U kg 8.72341E-06 -3.35768E-06 1.20811E-05556 Synthetic rubber, at plant/RER U kg 8.71845E-06 -5.82927E-06 1.45477E-05557 Extrusion, plastic pipes/RER U kg 8.71845E-06 -5.82927E-06 1.45477E-05558 Disposal, concrete, 5% water, to inert material landfill/CH U kg 8.61354E-06 -5.34461E-06 1.39582E-05559 Drawing of pipes, steel/RER U kg 8.44425E-06 -4.67313E-06 1.31174E-05560 Heavy fuel oil, at refinery/CH U kg 8.33009E-06 -4.3269E-06 1.2657E-05561 Sand ETH U - kg 8.1793E-06 -2.6665E-07 8.44596E-06562 Hard coal supply mix/BE U kg 8.06477E-06 -5.12866E-06 1.31934E-05563 Cumene, at plant/RER U kg 8.02292E-06 -4.22486E-06 1.22478E-05564 Cast iron, at plant/RER U kg 7.98255E-06 -5.53199E-06 1.35145E-05565 Chlorine, gaseous, diaphragm cell, at plant/RER U kg 7.9708E-06 -6.03319E-06 1.4004E-05566 Pigments, paper production, unspecified, at plant/RER U kg 7.95363E-06 -6.48653E-06 1.44402E-05567 Heavy fuel oil, at regional storage/CH U kg 7.90218E-06 -4.11761E-06 1.20198E-05568 Phosphoric acid, fertiliser grade, 70% in H2O, at plant/MA U kg 7.84169E-06 -5.97143E-06 1.38131E-05569 Biogas from landfill/AU U kg 7.73809E-06 -0.000367376 0.000375114570 Rock wool, at plant/CH U kg 7.49458E-06 -4.34308E-06 1.18377E-05571 Disposal, mineral wool, 0% water, to inert material landfill/CH U kg 7.43688E-06 -4.29654E-06 1.17334E-05572 Disposal, building, mineral wool, to final disposal/CH U kg 7.4051E-06 -4.2813E-06 1.16864E-05573 Rock wool, packed, at plant/CH U kg 7.38813E-06 -4.2842E-06 1.16723E-05574 Propene fr.Gasoil-Kemcor/AU U kg 7.38636E-06 x 7.38636E-06575 Atactic wax-Kemcor/AU U -- kg 7.38636E-06 x 7.38636E-06576 Refinery products, at consumer/AU U -- kg 7.34661E-06 -2.80446E-08 7.37465E-06577 Hard coal supply mix/PT U kg 7.3278E-06 -4.54167E-06 1.18695E-05578 Chlorine, gaseous, membrane cell, at plant/RER U kg 7.28074E-06 -5.50641E-06 1.27871E-05579 Section bar rolling, steel/RER U kg 7.00502E-06 -4.69896E-06 1.1704E-05580 Disposal, lignite ash, 0% water, to opencast refill/CS U kg 6.99247E-06 -4.19466E-06 1.11871E-05581 Disposal, H3PO4 purification residue, 0% water, to residual material landfill/CH U kg 6.92552E-06 -5.32602E-06 1.22515E-05582 Propylene, at plant/RER U kg 6.9118E-06 -4.72935E-06 1.16411E-05583 Chromite, ore concentrate, at beneficiation/GLO U kg 6.80445E-06 -4.05623E-06 1.08607E-05584 Ethylene oxide, at plant/RER U kg 6.57246E-06 -5.28376E-06 1.18562E-05585 Acetic acid, 98% in H2O, at plant/RER U kg 6.52086E-06 -5.24604E-06 1.17669E-05586 Butadiene, at plant/RER U kg 6.2756E-06 -5.05505E-06 1.13307E-05587 Ammonia, partial oxidation, liquid, at plant/RER U kg 6.26903E-06 -4.70768E-06 1.09767E-05588 Disposal, decarbonising waste, 30% water, to residual material landfill/CH U kg 6.25336E-06 -3.03396E-06 9.28732E-06589 Lubricating oil, at plant/RER U kg 6.23102E-06 -3.96322E-06 1.01942E-05590 Core board, at plant/RER U kg 6.0644E-06 -7.70868E-09 6.07211E-06591 Phosphate rock, as P2O5, beneficiated, dry, at plant/MA U kg 6.0331E-06 -4.56506E-06 1.05982E-05592 Phenol, at plant/RER U kg 5.98279E-06 -3.15273E-06 9.13552E-06593 Polyethylene, HDPE, granulate, at plant/RER U kg 5.96692E-06 -2.71497E-06 8.68188E-06594 Steel, converter, chromium steel 18/8, at plant/RER U kg 5.69898E-06 -3.32702E-06 9.026E-06595 Disposal, inert material, 0% water, to sanitary landfill/CH U kg 5.55617E-06 -2.35168E-06 7.90786E-06596 Crude oil, production RME, at long distance transport/CH U kg 5.35667E-06 -2.75316E-06 8.10982E-06597 Potassium chloride, as K2O, at regional storehouse/RER U kg 5.24564E-06 -3.15054E-06 8.39618E-06598 Aluminium oxide, at plant/RER U kg 5.16689E-06 -3.00463E-06 8.17152E-06599 Disposal, slag, unalloyed electr. steel, 0% water, to residual material landfill/CH U kg 4.87027E-06 -3.26997E-06 8.14024E-06600 Disposal, hard coal ash, 0% water, to residual material landfill/ES U kg 4.72364E-06 -2.96472E-06 7.68836E-06601 Barite, at plant/RER U kg 4.71469E-06 -2.6009E-06 7.31559E-06602 Sheet rolling, steel/RER U kg 4.68928E-06 -1.36733E-06 6.05661E-06603 Urea, as N, at regional storehouse/RER U kg 4.64598E-06 -3.57578E-06 8.22176E-06604 Process-specific burdens, hazardous waste incineration plant/CH U kg 4.61319E-06 -3.03063E-06 7.64382E-06605 Formaldehyde, production mix, at plant/RER U kg 4.55891E-06 -3.32204E-06 7.88094E-06606 Disposal, building, concrete, not reinforced, to final disposal/CH U kg 4.43628E-06 -2.40812E-06 6.84441E-06607 Disposal, building, bulk iron (excluding reinforcement), to sorting plant/CH U kg 4.31995E-06 -2.4166E-06 6.73655E-06608 Hydrogen, liquid, at plant/RER U kg 4.227E-06 -3.01087E-07 4.52808E-06609 Ferronickel, 25% Ni, at plant/GLO U kg 4.13922E-06 -2.52157E-06 6.66079E-06610 Packing, fibre cement products/CH U kg 4.12529E-06 -2.31299E-06 6.43828E-06611 Waste (inert) to landfill U -- kg 4.06844E-06 -1.68922E-07 4.23737E-06612 Bitumen refinery Europe U -- kg 4.0474E-06 -1.32243E-07 4.17964E-06613 Hydrogen, cracking, APME, at plant/RER U kg 4.01565E-06 -2.86033E-07 4.30168E-06614 Metal input to BOS furnace/AU U -- kg 4.01015E-06 -2.0188E-05 2.41981E-05615 Basalt, at mine/RER U kg 3.95714E-06 -2.29315E-06 6.25029E-06616 Vinyl acetate, at plant/RER U kg 3.88081E-06 -3.10874E-06 6.98955E-06617 Ethylene glycol, at plant/RER U kg 3.84883E-06 -3.0781E-06 6.92693E-06618 Ethylene dichloride, at plant/RER U kg 3.84182E-06 -3.09797E-06 6.93978E-06619 Xylene, at plant/RER U kg 3.83009E-06 -3.0815E-06 6.91159E-06620 Methyl tert-butyl ether, at plant/RER U kg 3.81456E-06 -3.06401E-06 6.87856E-06621 Acetone, liquid, at plant/RER U kg 3.79067E-06 -3.05446E-06 6.84514E-06622 Toluene, liquid, at plant/RER U kg 3.79067E-06 -3.05446E-06 6.84513E-06623 Styrene, at plant/RER U kg 3.79067E-06 -3.05446E-06 6.84513E-06624 Ethyl benzene, at plant/RER U kg 3.79067E-06 -3.05446E-06 6.84513E-06625 Disposal, non-sulfidic tailings, off-site/GLO U kg 3.78928E-06 -2.30273E-06 6.09201E-06
6 of 25
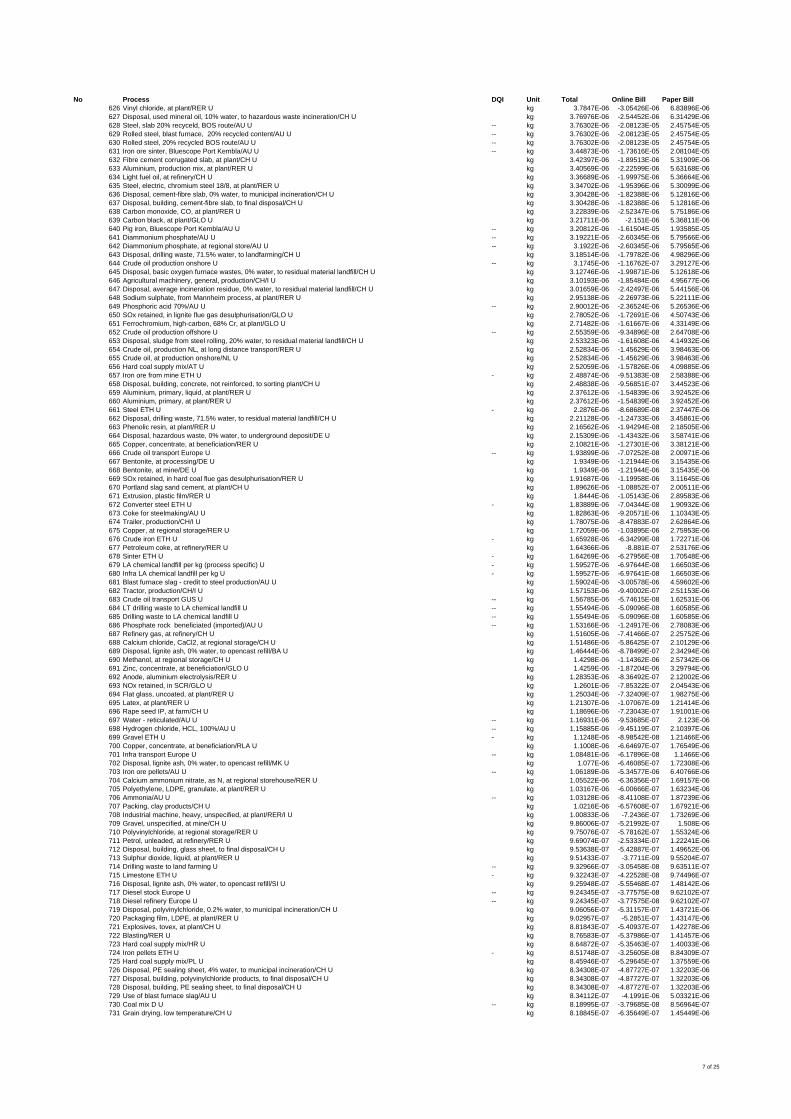
No Process DQI Unit Total Online Bill Paper Bill626 Vinyl chloride, at plant/RER U kg 3.7847E-06 -3.05426E-06 6.83896E-06627 Disposal, used mineral oil, 10% water, to hazardous waste incineration/CH U kg 3.76976E-06 -2.54452E-06 6.31429E-06628 Steel, slab 20% recyceld, BOS route/AU U -- kg 3.76302E-06 -2.08123E-05 2.45754E-05629 Rolled steel, blast furnace, 20% recycled content/AU U -- kg 3.76302E-06 -2.08123E-05 2.45754E-05630 Rolled steel, 20% recycled BOS route/AU U -- kg 3.76302E-06 -2.08123E-05 2.45754E-05631 Iron ore sinter, Bluescope Port Kembla/AU U -- kg 3.44873E-06 -1.73616E-05 2.08104E-05632 Fibre cement corrugated slab, at plant/CH U kg 3.42397E-06 -1.89513E-06 5.31909E-06633 Aluminium, production mix, at plant/RER U kg 3.40569E-06 -2.22599E-06 5.63168E-06634 Light fuel oil, at refinery/CH U kg 3.36689E-06 -1.99975E-06 5.36664E-06635 Steel, electric, chromium steel 18/8, at plant/RER U kg 3.34702E-06 -1.95396E-06 5.30099E-06636 Disposal, cement-fibre slab, 0% water, to municipal incineration/CH U kg 3.30428E-06 -1.82388E-06 5.12816E-06637 Disposal, building, cement-fibre slab, to final disposal/CH U kg 3.30428E-06 -1.82388E-06 5.12816E-06638 Carbon monoxide, CO, at plant/RER U kg 3.22839E-06 -2.52347E-06 5.75186E-06639 Carbon black, at plant/GLO U kg 3.21711E-06 -2.151E-06 5.36811E-06640 Pig iron, Bluescope Port Kembla/AU U -- kg 3.20812E-06 -1.61504E-05 1.93585E-05641 Diammonium phosphate/AU U -- kg 3.19221E-06 -2.60345E-06 5.79566E-06642 Diammonium phosphate, at regional store/AU U -- kg 3.1922E-06 -2.60345E-06 5.79565E-06643 Disposal, drilling waste, 71.5% water, to landfarming/CH U kg 3.18514E-06 -1.79782E-06 4.98296E-06644 Crude oil production onshore U -- kg 3.1745E-06 -1.16762E-07 3.29127E-06645 Disposal, basic oxygen furnace wastes, 0% water, to residual material landfill/CH U kg 3.12746E-06 -1.99871E-06 5.12618E-06646 Agricultural machinery, general, production/CH/I U kg 3.10193E-06 -1.85484E-06 4.95677E-06647 Disposal, average incineration residue, 0% water, to residual material landfill/CH U kg 3.01659E-06 -2.42497E-06 5.44156E-06648 Sodium sulphate, from Mannheim process, at plant/RER U kg 2.95138E-06 -2.26973E-06 5.22111E-06649 Phosphoric acid 70%/AU U -- kg 2.90012E-06 -2.36524E-06 5.26536E-06650 SOx retained, in lignite flue gas desulphurisation/GLO U kg 2.78052E-06 -1.72691E-06 4.50743E-06651 Ferrochromium, high-carbon, 68% Cr, at plant/GLO U kg 2.71482E-06 -1.61667E-06 4.33149E-06652 Crude oil production offshore U -- kg 2.55359E-06 -9.34896E-08 2.64708E-06653 Disposal, sludge from steel rolling, 20% water, to residual material landfill/CH U kg 2.53323E-06 -1.61608E-06 4.14932E-06654 Crude oil, production NL, at long distance transport/RER U kg 2.52834E-06 -1.45629E-06 3.98463E-06655 Crude oil, at production onshore/NL U kg 2.52834E-06 -1.45629E-06 3.98463E-06656 Hard coal supply mix/AT U kg 2.52059E-06 -1.57826E-06 4.09885E-06657 Iron ore from mine ETH U - kg 2.48874E-06 -9.51383E-08 2.58388E-06658 Disposal, building, concrete, not reinforced, to sorting plant/CH U kg 2.48838E-06 -9.56851E-07 3.44523E-06659 Aluminium, primary, liquid, at plant/RER U kg 2.37612E-06 -1.54839E-06 3.92452E-06660 Aluminium, primary, at plant/RER U kg 2.37612E-06 -1.54839E-06 3.92452E-06661 Steel ETH U - kg 2.2876E-06 -8.68689E-08 2.37447E-06662 Disposal, drilling waste, 71.5% water, to residual material landfill/CH U kg 2.21128E-06 -1.24733E-06 3.45861E-06663 Phenolic resin, at plant/RER U kg 2.16562E-06 -1.94294E-08 2.18505E-06664 Disposal, hazardous waste, 0% water, to underground deposit/DE U kg 2.15309E-06 -1.43432E-06 3.58741E-06665 Copper, concentrate, at beneficiation/RER U kg 2.10821E-06 -1.27301E-06 3.38121E-06666 Crude oil transport Europe U -- kg 1.93899E-06 -7.07252E-08 2.00971E-06667 Bentonite, at processing/DE U kg 1.9349E-06 -1.21944E-06 3.15435E-06668 Bentonite, at mine/DE U kg 1.9349E-06 -1.21944E-06 3.15435E-06669 SOx retained, in hard coal flue gas desulphurisation/RER U kg 1.91687E-06 -1.19958E-06 3.11645E-06670 Portland slag sand cement, at plant/CH U kg 1.89626E-06 -1.08852E-07 2.00511E-06671 Extrusion, plastic film/RER U kg 1.8444E-06 -1.05143E-06 2.89583E-06672 Converter steel ETH U - kg 1.83889E-06 -7.04344E-08 1.90932E-06673 Coke for steelmaking/AU U kg 1.82863E-06 -9.20571E-06 1.10343E-05674 Trailer, production/CH/I U kg 1.78075E-06 -8.47883E-07 2.62864E-06675 Copper, at regional storage/RER U kg 1.72059E-06 -1.03895E-06 2.75953E-06676 Crude iron ETH U - kg 1.65928E-06 -6.34299E-08 1.72271E-06677 Petroleum coke, at refinery/RER U kg 1.64366E-06 -8.881E-07 2.53176E-06678 Sinter ETH U - kg 1.64269E-06 -6.27956E-08 1.70548E-06679 LA chemical landfill per kg (process specific) U - kg 1.59527E-06 -6.97644E-08 1.66503E-06680 Infra LA chemical landfill per kg U - kg 1.59527E-06 -6.97641E-08 1.66503E-06681 Blast furnace slag - credit to steel production/AU U kg 1.59024E-06 -3.00578E-06 4.59602E-06682 Tractor, production/CH/I U kg 1.57153E-06 -9.40002E-07 2.51153E-06683 Crude oil transport GUS U -- kg 1.56785E-06 -5.74615E-08 1.62531E-06684 LT drilling waste to LA chemical landfill U -- kg 1.55494E-06 -5.09096E-08 1.60585E-06685 Drilling waste to LA chemical landfill U -- kg 1.55494E-06 -5.09096E-08 1.60585E-06686 Phosphate rock beneficiated (imported)/AU U -- kg 1.53166E-06 -1.24917E-06 2.78083E-06687 Refinery gas, at refinery/CH U kg 1.51605E-06 -7.41466E-07 2.25752E-06688 Calcium chloride, CaCl2, at regional storage/CH U kg 1.51486E-06 -5.86425E-07 2.10129E-06689 Disposal, lignite ash, 0% water, to opencast refill/BA U kg 1.46444E-06 -8.78499E-07 2.34294E-06690 Methanol, at regional storage/CH U kg 1.4298E-06 -1.14362E-06 2.57342E-06691 Zinc, concentrate, at beneficiation/GLO U kg 1.4259E-06 -1.87204E-06 3.29794E-06692 Anode, aluminium electrolysis/RER U kg 1.28353E-06 -8.36492E-07 2.12002E-06693 NOx retained, in SCR/GLO U kg 1.2601E-06 -7.85322E-07 2.04543E-06694 Flat glass, uncoated, at plant/RER U kg 1.25034E-06 -7.32409E-07 1.98275E-06695 Latex, at plant/RER U kg 1.21307E-06 -1.07067E-09 1.21414E-06696 Rape seed IP, at farm/CH U kg 1.18696E-06 -7.23043E-07 1.91001E-06697 Water - reticulated/AU U -- kg 1.16931E-06 -9.53685E-07 2.123E-06698 Hydrogen chloride, HCL, 100%/AU U -- kg 1.15885E-06 -9.45119E-07 2.10397E-06699 Gravel ETH U - kg 1.1248E-06 -8.98542E-08 1.21466E-06700 Copper, concentrate, at beneficiation/RLA U kg 1.1008E-06 -6.64697E-07 1.76549E-06701 Infra transport Europe U -- kg 1.08481E-06 -6.17896E-08 1.1466E-06702 Disposal, lignite ash, 0% water, to opencast refill/MK U kg 1.077E-06 -6.46085E-07 1.72308E-06703 Iron ore pellets/AU U -- kg 1.06189E-06 -5.34577E-06 6.40766E-06704 Calcium ammonium nitrate, as N, at regional storehouse/RER U kg 1.05522E-06 -6.36356E-07 1.69157E-06705 Polyethylene, LDPE, granulate, at plant/RER U kg 1.03167E-06 -6.00666E-07 1.63234E-06706 Ammonia/AU U -- kg 1.03128E-06 -8.41108E-07 1.87239E-06707 Packing, clay products/CH U kg 1.0216E-06 -6.57608E-07 1.67921E-06708 Industrial machine, heavy, unspecified, at plant/RER/I U kg 1.00833E-06 -7.2436E-07 1.73269E-06709 Gravel, unspecified, at mine/CH U kg 9.86006E-07 -5.21992E-07 1.508E-06710 Polyvinylchloride, at regional storage/RER U kg 9.75076E-07 -5.78162E-07 1.55324E-06711 Petrol, unleaded, at refinery/RER U kg 9.69074E-07 -2.53334E-07 1.22241E-06712 Disposal, building, glass sheet, to final disposal/CH U kg 9.53638E-07 -5.42887E-07 1.49652E-06713 Sulphur dioxide, liquid, at plant/RER U kg 9.51433E-07 -3.7711E-09 9.55204E-07714 Drilling waste to land farming U -- kg 9.32966E-07 -3.05458E-08 9.63511E-07715 Limestone ETH U - kg 9.32243E-07 -4.22528E-08 9.74496E-07716 Disposal, lignite ash, 0% water, to opencast refill/SI U kg 9.25948E-07 -5.55468E-07 1.48142E-06717 Diesel stock Europe U -- kg 9.24345E-07 -3.77575E-08 9.62102E-07718 Diesel refinery Europe U -- kg 9.24345E-07 -3.77575E-08 9.62102E-07719 Disposal, polyvinylchloride, 0.2% water, to municipal incineration/CH U kg 9.06056E-07 -5.31157E-07 1.43721E-06720 Packaging film, LDPE, at plant/RER U kg 9.02957E-07 -5.2851E-07 1.43147E-06721 Explosives, tovex, at plant/CH U kg 8.81843E-07 -5.40937E-07 1.42278E-06722 Blasting/RER U kg 8.76583E-07 -5.37986E-07 1.41457E-06723 Hard coal supply mix/HR U kg 8.64872E-07 -5.35463E-07 1.40033E-06724 Iron pellets ETH U - kg 8.51748E-07 -3.25605E-08 8.84309E-07725 Hard coal supply mix/PL U kg 8.45946E-07 -5.29645E-07 1.37559E-06726 Disposal, PE sealing sheet, 4% water, to municipal incineration/CH U kg 8.34308E-07 -4.87727E-07 1.32203E-06727 Disposal, building, polyvinylchloride products, to final disposal/CH U kg 8.34308E-07 -4.87727E-07 1.32203E-06728 Disposal, building, PE sealing sheet, to final disposal/CH U kg 8.34308E-07 -4.87727E-07 1.32203E-06729 Use of blast furnace slag/AU U kg 8.34112E-07 -4.1991E-06 5.03321E-06730 Coal mix D U -- kg 8.18995E-07 -3.79685E-08 8.56964E-07731 Grain drying, low temperature/CH U kg 8.18845E-07 -6.35649E-07 1.45449E-06
7 of 25
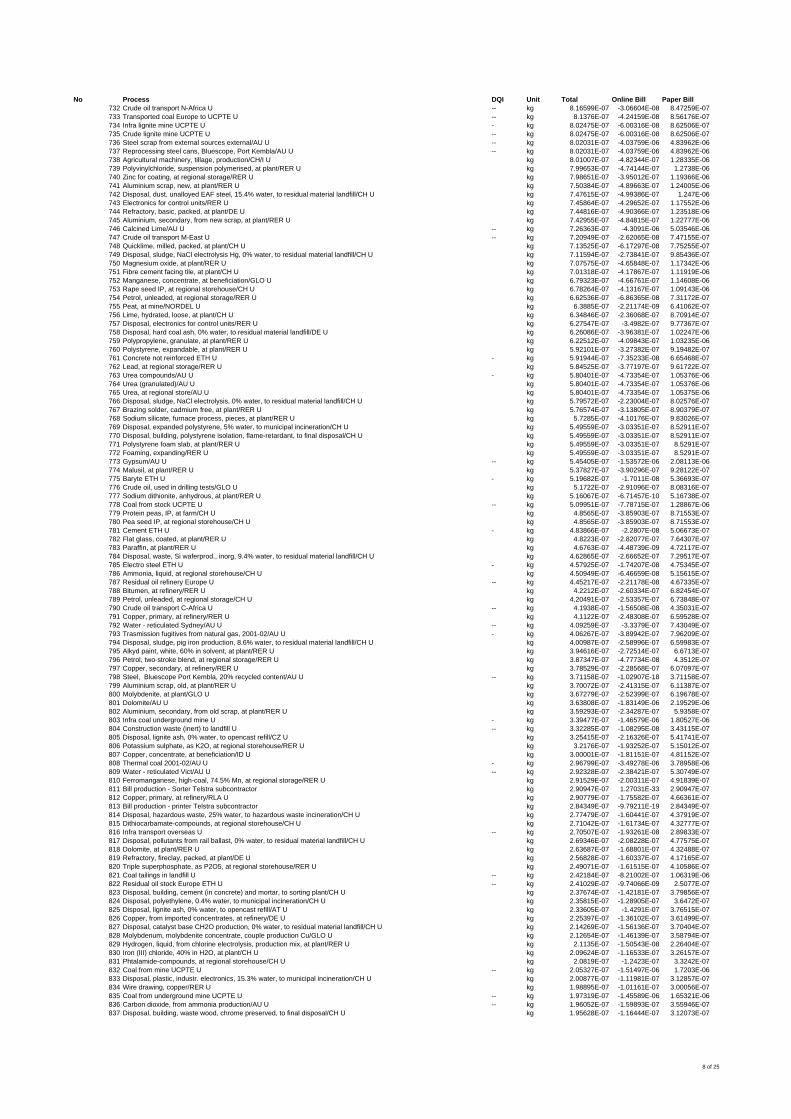
No Process DQI Unit Total Online Bill Paper Bill732 Crude oil transport N-Africa U -- kg 8.16599E-07 -3.06604E-08 8.47259E-07733 Transported coal Europe to UCPTE U -- kg 8.1376E-07 -4.24159E-08 8.56176E-07734 Infra lignite mine UCPTE U - kg 8.02475E-07 -6.00316E-08 8.62506E-07735 Crude lignite mine UCPTE U -- kg 8.02475E-07 -6.00316E-08 8.62506E-07736 Steel scrap from external sources external/AU U -- kg 8.02031E-07 -4.03759E-06 4.83962E-06737 Reprocessing steel cans, Bluescope, Port Kembla/AU U -- kg 8.02031E-07 -4.03759E-06 4.83962E-06738 Agricultural machinery, tillage, production/CH/I U kg 8.01007E-07 -4.82344E-07 1.28335E-06739 Polyvinylchloride, suspension polymerised, at plant/RER U kg 7.99653E-07 -4.74144E-07 1.2738E-06740 Zinc for coating, at regional storage/RER U kg 7.98651E-07 -3.95012E-07 1.19366E-06741 Aluminium scrap, new, at plant/RER U kg 7.50384E-07 -4.89663E-07 1.24005E-06742 Disposal, dust, unalloyed EAF steel, 15.4% water, to residual material landfill/CH U kg 7.47615E-07 -4.99386E-07 1.247E-06743 Electronics for control units/RER U kg 7.45864E-07 -4.29652E-07 1.17552E-06744 Refractory, basic, packed, at plant/DE U kg 7.44816E-07 -4.90366E-07 1.23518E-06745 Aluminium, secondary, from new scrap, at plant/RER U kg 7.42955E-07 -4.84815E-07 1.22777E-06746 Calcined Lime/AU U -- kg 7.26363E-07 -4.3091E-06 5.03546E-06747 Crude oil transport M-East U -- kg 7.20949E-07 -2.62065E-08 7.47155E-07748 Quicklime, milled, packed, at plant/CH U kg 7.13525E-07 -6.17297E-08 7.75255E-07749 Disposal, sludge, NaCl electrolysis Hg, 0% water, to residual material landfill/CH U kg 7.11594E-07 -2.73841E-07 9.85436E-07750 Magnesium oxide, at plant/RER U kg 7.07575E-07 -4.65848E-07 1.17342E-06751 Fibre cement facing tile, at plant/CH U kg 7.01318E-07 -4.17867E-07 1.11919E-06752 Manganese, concentrate, at beneficiation/GLO U kg 6.79323E-07 -4.66761E-07 1.14608E-06753 Rape seed IP, at regional storehouse/CH U kg 6.78264E-07 -4.13167E-07 1.09143E-06754 Petrol, unleaded, at regional storage/RER U kg 6.62536E-07 -6.86365E-08 7.31172E-07755 Peat, at mine/NORDEL U kg 6.3885E-07 -2.21174E-09 6.41062E-07756 Lime, hydrated, loose, at plant/CH U kg 6.34846E-07 -2.36068E-07 8.70914E-07757 Disposal, electronics for control units/RER U kg 6.27547E-07 -3.4982E-07 9.77367E-07758 Disposal, hard coal ash, 0% water, to residual material landfill/DE U kg 6.26086E-07 -3.96381E-07 1.02247E-06759 Polypropylene, granulate, at plant/RER U kg 6.22512E-07 -4.09843E-07 1.03235E-06760 Polystyrene, expandable, at plant/RER U kg 5.92101E-07 -3.27382E-07 9.19482E-07761 Concrete not reinforced ETH U - kg 5.91944E-07 -7.35233E-08 6.65468E-07762 Lead, at regional storage/RER U kg 5.84525E-07 -3.77197E-07 9.61722E-07763 Urea compounds/AU U - kg 5.80401E-07 -4.73354E-07 1.05376E-06764 Urea (granulated)/AU U kg 5.80401E-07 -4.73354E-07 1.05376E-06765 Urea, at regional store/AU U kg 5.80401E-07 -4.73354E-07 1.05375E-06766 Disposal, sludge, NaCl electrolysis, 0% water, to residual material landfill/CH U kg 5.79572E-07 -2.23004E-07 8.02576E-07767 Brazing solder, cadmium free, at plant/RER U kg 5.76574E-07 -3.13805E-07 8.90379E-07768 Sodium silicate, furnace process, pieces, at plant/RER U kg 5.7285E-07 -4.10176E-07 9.83026E-07769 Disposal, expanded polystyrene, 5% water, to municipal incineration/CH U kg 5.49559E-07 -3.03351E-07 8.52911E-07770 Disposal, building, polystyrene isolation, flame-retardant, to final disposal/CH U kg 5.49559E-07 -3.03351E-07 8.52911E-07771 Polystyrene foam slab, at plant/RER U kg 5.49559E-07 -3.03351E-07 8.5291E-07772 Foaming, expanding/RER U kg 5.49559E-07 -3.03351E-07 8.5291E-07773 Gypsum/AU U -- kg 5.45405E-07 -1.53572E-06 2.08113E-06774 Malusil, at plant/RER U kg 5.37827E-07 -3.90296E-07 9.28122E-07775 Baryte ETH U - kg 5.19682E-07 -1.7011E-08 5.36693E-07776 Crude oil, used in drilling tests/GLO U kg 5.1722E-07 -2.91096E-07 8.08316E-07777 Sodium dithionite, anhydrous, at plant/RER U kg 5.16067E-07 -6.71457E-10 5.16738E-07778 Coal from stock UCPTE U -- kg 5.09951E-07 -7.78715E-07 1.28867E-06779 Protein peas, IP, at farm/CH U kg 4.8565E-07 -3.85903E-07 8.71553E-07780 Pea seed IP, at regional storehouse/CH U kg 4.8565E-07 -3.85903E-07 8.71553E-07781 Cement ETH U - kg 4.83866E-07 -2.2807E-08 5.06673E-07782 Flat glass, coated, at plant/RER U kg 4.8223E-07 -2.82077E-07 7.64307E-07783 Paraffin, at plant/RER U kg 4.6763E-07 -4.48739E-09 4.72117E-07784 Disposal, waste, Si waferprod., inorg, 9.4% water, to residual material landfill/CH U kg 4.62865E-07 -2.66652E-07 7.29517E-07785 Electro steel ETH U - kg 4.57925E-07 -1.74207E-08 4.75345E-07786 Ammonia, liquid, at regional storehouse/CH U kg 4.50949E-07 -6.46659E-08 5.15615E-07787 Residual oil refinery Europe U -- kg 4.45217E-07 -2.21178E-08 4.67335E-07788 Bitumen, at refinery/RER U kg 4.2212E-07 -2.60334E-07 6.82454E-07789 Petrol, unleaded, at regional storage/CH U kg 4.20491E-07 -2.53357E-07 6.73848E-07790 Crude oil transport C-Africa U -- kg 4.1938E-07 -1.56508E-08 4.35031E-07791 Copper, primary, at refinery/RER U kg 4.1122E-07 -2.48308E-07 6.59528E-07792 Water - reticulated Sydney/AU U -- kg 4.09259E-07 -3.3379E-07 7.43049E-07793 Trasmission fugitives from natural gas, 2001-02/AU U - kg 4.06267E-07 -3.89942E-07 7.96209E-07794 Disposal, sludge, pig iron production, 8.6% water, to residual material landfill/CH U kg 4.00987E-07 -2.58996E-07 6.59983E-07795 Alkyd paint, white, 60% in solvent, at plant/RER U kg 3.94616E-07 -2.72514E-07 6.6713E-07796 Petrol, two-stroke blend, at regional storage/RER U kg 3.87347E-07 -4.77734E-08 4.3512E-07797 Copper, secondary, at refinery/RER U kg 3.78529E-07 -2.28568E-07 6.07097E-07798 Steel, Bluescope Port Kembla, 20% recycled content/AU U -- kg 3.71158E-07 -1.02907E-18 3.71158E-07799 Aluminium scrap, old, at plant/RER U kg 3.70072E-07 -2.41315E-07 6.11387E-07800 Molybdenite, at plant/GLO U kg 3.67279E-07 -2.52399E-07 6.19678E-07801 Dolomite/AU U kg 3.63808E-07 -1.83149E-06 2.19529E-06802 Aluminium, secondary, from old scrap, at plant/RER U kg 3.59293E-07 -2.34287E-07 5.9358E-07803 Infra coal underground mine U - kg 3.39477E-07 -1.46579E-06 1.80527E-06804 Construction waste (inert) to landfill U -- kg 3.32285E-07 -1.08295E-08 3.43115E-07805 Disposal, lignite ash, 0% water, to opencast refill/CZ U kg 3.25415E-07 -2.16326E-07 5.41741E-07806 Potassium sulphate, as K2O, at regional storehouse/RER U kg 3.2176E-07 -1.93252E-07 5.15012E-07807 Copper, concentrate, at beneficiation/ID U kg 3.00001E-07 -1.81151E-07 4.81152E-07808 Thermal coal 2001-02/AU U - kg 2.96799E-07 -3.49278E-06 3.78958E-06809 Water - reticulated Vict/AU U -- kg 2.92328E-07 -2.38421E-07 5.30749E-07810 Ferromanganese, high-coal, 74.5% Mn, at regional storage/RER U kg 2.91529E-07 -2.00311E-07 4.91839E-07811 Bill production - Sorter Telstra subcontractor kg 2.90947E-07 1.27031E-33 2.90947E-07812 Copper, primary, at refinery/RLA U kg 2.90779E-07 -1.75582E-07 4.66361E-07813 Bill production - printer Telstra subcontractor kg 2.84349E-07 -9.79211E-19 2.84349E-07814 Disposal, hazardous waste, 25% water, to hazardous waste incineration/CH U kg 2.77479E-07 -1.60441E-07 4.37919E-07815 Dithiocarbamate-compounds, at regional storehouse/CH U kg 2.71042E-07 -1.61734E-07 4.32777E-07816 Infra transport overseas U -- kg 2.70507E-07 -1.93261E-08 2.89833E-07817 Disposal, pollutants from rail ballast, 0% water, to residual material landfill/CH U kg 2.69346E-07 -2.08228E-07 4.77575E-07818 Dolomite, at plant/RER U kg 2.63687E-07 -1.68801E-07 4.32488E-07819 Refractory, fireclay, packed, at plant/DE U kg 2.56828E-07 -1.60337E-07 4.17165E-07820 Triple superphosphate, as P2O5, at regional storehouse/RER U kg 2.49071E-07 -1.61515E-07 4.10586E-07821 Coal tailings in landfill U -- kg 2.42184E-07 -8.21002E-07 1.06319E-06822 Residual oil stock Europe ETH U -- kg 2.41029E-07 -9.74066E-09 2.5077E-07823 Disposal, building, cement (in concrete) and mortar, to sorting plant/CH U kg 2.37674E-07 -1.42181E-07 3.79856E-07824 Disposal, polyethylene, 0.4% water, to municipal incineration/CH U kg 2.35815E-07 -1.28905E-07 3.6472E-07825 Disposal, lignite ash, 0% water, to opencast refill/AT U kg 2.33605E-07 -1.4291E-07 3.76515E-07826 Copper, from imported concentrates, at refinery/DE U kg 2.25397E-07 -1.36102E-07 3.61499E-07827 Disposal, catalyst base CH2O production, 0% water, to residual material landfill/CH U kg 2.14269E-07 -1.56136E-07 3.70404E-07828 Molybdenum, molybdenite concentrate, couple production Cu/GLO U kg 2.12654E-07 -1.46139E-07 3.58794E-07829 Hydrogen, liquid, from chlorine electrolysis, production mix, at plant/RER U kg 2.1135E-07 -1.50543E-08 2.26404E-07830 Iron (III) chloride, 40% in H2O, at plant/CH U kg 2.09624E-07 -1.16533E-07 3.26157E-07831 Phtalamide-compounds, at regional storehouse/CH U kg 2.0819E-07 -1.2423E-07 3.3242E-07832 Coal from mine UCPTE U -- kg 2.05327E-07 -1.51497E-06 1.7203E-06833 Disposal, plastic, industr. electronics, 15.3% water, to municipal incineration/CH U kg 2.00877E-07 -1.11981E-07 3.12857E-07834 Wire drawing, copper/RER U kg 1.98895E-07 -1.01161E-07 3.00056E-07835 Coal from underground mine UCPTE U -- kg 1.97319E-07 -1.45589E-06 1.65321E-06836 Carbon dioxide, from ammonia production/AU U -- kg 1.96052E-07 -1.59893E-07 3.55946E-07837 Disposal, building, waste wood, chrome preserved, to final disposal/CH U kg 1.95628E-07 -1.16444E-07 3.12073E-07
8 of 25
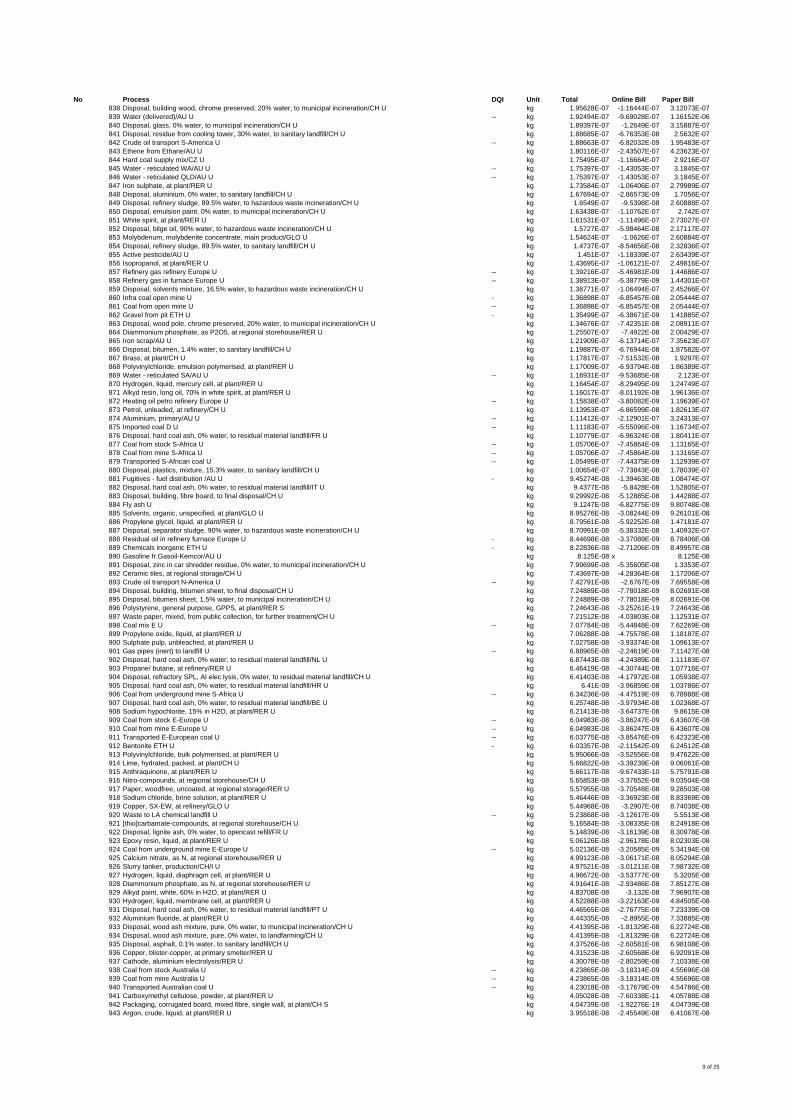
No Process DQI Unit Total Online Bill Paper Bill838 Disposal, building wood, chrome preserved, 20% water, to municipal incineration/CH U kg 1.95628E-07 -1.16444E-07 3.12073E-07839 Water (delivered)/AU U -- kg 1.92494E-07 -9.69028E-07 1.16152E-06840 Disposal, glass, 0% water, to municipal incineration/CH U kg 1.89397E-07 -1.2649E-07 3.15887E-07841 Disposal, residue from cooling tower, 30% water, to sanitary landfill/CH U kg 1.88685E-07 -6.76353E-08 2.5632E-07842 Crude oil transport S-America U -- kg 1.88663E-07 -6.82032E-09 1.95483E-07843 Ethene from Ethane/AU U kg 1.80116E-07 -2.43507E-07 4.23623E-07844 Hard coal supply mix/CZ U kg 1.75495E-07 -1.16664E-07 2.9216E-07845 Water - reticulated WA/AU U -- kg 1.75397E-07 -1.43053E-07 3.1845E-07846 Water - reticulated QLD/AU U -- kg 1.75397E-07 -1.43053E-07 3.1845E-07847 Iron sulphate, at plant/RER U kg 1.73584E-07 -1.06406E-07 2.79989E-07848 Disposal, aluminium, 0% water, to sanitary landfill/CH U kg 1.67694E-07 -2.86573E-09 1.7056E-07849 Disposal, refinery sludge, 89.5% water, to hazardous waste incineration/CH U kg 1.6549E-07 -9.5398E-08 2.60888E-07850 Disposal, emulsion paint, 0% water, to municipal incineration/CH U kg 1.63438E-07 -1.10762E-07 2.742E-07851 White spirit, at plant/RER U kg 1.61531E-07 -1.11496E-07 2.73027E-07852 Disposal, bilge oil, 90% water, to hazardous waste incineration/CH U kg 1.5727E-07 -5.98464E-08 2.17117E-07853 Molybdenum, molybdenite concentrate, main product/GLO U kg 1.54624E-07 -1.0626E-07 2.60884E-07854 Disposal, refinery sludge, 89.5% water, to sanitary landfill/CH U kg 1.4737E-07 -8.54656E-08 2.32836E-07855 Active pesticide/AU U kg 1.451E-07 -1.18339E-07 2.63439E-07856 Isopropanol, at plant/RER U kg 1.43695E-07 -1.06121E-07 2.49816E-07857 Refinery gas refinery Europe U -- kg 1.39216E-07 -5.46981E-09 1.44686E-07858 Refinery gas in furnace Europe U -- kg 1.38913E-07 -5.38779E-09 1.44301E-07859 Disposal, solvents mixture, 16.5% water, to hazardous waste incineration/CH U kg 1.38771E-07 -1.06494E-07 2.45266E-07860 Infra coal open mine U - kg 1.36898E-07 -6.85457E-08 2.05444E-07861 Coal from open mine U -- kg 1.36898E-07 -6.85457E-08 2.05444E-07862 Gravel from pit ETH U - kg 1.35499E-07 -6.38671E-09 1.41885E-07863 Disposal, wood pole, chrome preserved, 20% water, to municipal incineration/CH U kg 1.34676E-07 -7.42351E-08 2.08911E-07864 Diammonium phosphate, as P2O5, at regional storehouse/RER U kg 1.25507E-07 -7.4922E-08 2.00429E-07865 Iron scrap/AU U kg 1.21909E-07 -6.13714E-07 7.35623E-07866 Disposal, bitumen, 1.4% water, to sanitary landfill/CH U kg 1.19887E-07 -6.76944E-08 1.87582E-07867 Brass, at plant/CH U kg 1.17817E-07 -7.51532E-08 1.9297E-07868 Polyvinylchloride, emulsion polymerised, at plant/RER U kg 1.17009E-07 -6.93794E-08 1.86389E-07869 Water - reticulated SA/AU U -- kg 1.16931E-07 -9.53685E-08 2.123E-07870 Hydrogen, liquid, mercury cell, at plant/RER U kg 1.16454E-07 -8.29495E-09 1.24749E-07871 Alkyd resin, long oil, 70% in white spirit, at plant/RER U kg 1.16017E-07 -8.01192E-08 1.96136E-07872 Heating oil petro refinery Europe U -- kg 1.15838E-07 -3.80082E-09 1.19639E-07873 Petrol, unleaded, at refinery/CH U kg 1.13953E-07 -6.86599E-08 1.82613E-07874 Aluminium, primary/AU U -- kg 1.11412E-07 -2.12901E-07 3.24313E-07875 Imported coal D U -- kg 1.11183E-07 -5.55096E-09 1.16734E-07876 Disposal, hard coal ash, 0% water, to residual material landfill/FR U kg 1.10779E-07 -6.96324E-08 1.80411E-07877 Coal from stock S-Africa U -- kg 1.05706E-07 -7.45864E-09 1.13165E-07878 Coal from mine S-Africa U -- kg 1.05706E-07 -7.45864E-09 1.13165E-07879 Transported S-African coal U -- kg 1.05495E-07 -7.44375E-09 1.12939E-07880 Disposal, plastics, mixture, 15.3% water, to sanitary landfill/CH U kg 1.00654E-07 -7.73843E-08 1.78039E-07881 Fugitives - fuel distribution /AU U - kg 9.45274E-08 -1.39463E-08 1.08474E-07882 Disposal, hard coal ash, 0% water, to residual material landfill/IT U kg 9.4377E-08 -5.8428E-08 1.52805E-07883 Disposal, building, fibre board, to final disposal/CH U kg 9.29992E-08 -5.12885E-08 1.44288E-07884 Fly ash U kg 9.1247E-08 -6.82775E-09 9.80748E-08885 Solvents, organic, unspecified, at plant/GLO U kg 8.95276E-08 -3.08244E-09 9.26101E-08886 Propylene glycol, liquid, at plant/RER U kg 8.79561E-08 -5.92252E-08 1.47181E-07887 Disposal, separator sludge, 90% water, to hazardous waste incineration/CH U kg 8.70991E-08 -5.38332E-08 1.40932E-07888 Residual oil in refinery furnace Europe U - kg 8.44698E-08 -3.37089E-09 8.78406E-08889 Chemicals inorganic ETH U - kg 8.22836E-08 -2.71206E-09 8.49957E-08890 Gasoline fr.Gasoil-Kemcor/AU U kg 8.125E-08 x 8.125E-08891 Disposal, zinc in car shredder residue, 0% water, to municipal incineration/CH U kg 7.99699E-08 -5.35605E-08 1.3353E-07892 Ceramic tiles, at regional storage/CH U kg 7.43697E-08 -4.28364E-08 1.17206E-07893 Crude oil transport N-America U -- kg 7.42791E-08 -2.6767E-09 7.69558E-08894 Disposal, building, bitumen sheet, to final disposal/CH U kg 7.24889E-08 -7.78018E-09 8.02691E-08895 Disposal, bitumen sheet, 1.5% water, to municipal incineration/CH U kg 7.24889E-08 -7.78018E-09 8.02691E-08896 Polystyrene, general purpose, GPPS, at plant/RER S kg 7.24643E-08 -3.25261E-19 7.24643E-08897 Waste paper, mixed, from public collection, for further treatment/CH U kg 7.21512E-08 -4.03803E-08 1.12531E-07898 Coal mix E U -- kg 7.07784E-08 -5.44848E-09 7.62269E-08899 Propylene oxide, liquid, at plant/RER U kg 7.06288E-08 -4.75578E-08 1.18187E-07900 Sulphate pulp, unbleached, at plant/RER U kg 7.02758E-08 -3.93374E-08 1.09613E-07901 Gas pipes (inert) to landfill U -- kg 6.88965E-08 -2.24619E-09 7.11427E-08902 Disposal, hard coal ash, 0% water, to residual material landfill/NL U kg 6.87443E-08 -4.24389E-08 1.11183E-07903 Propane/ butane, at refinery/RER U kg 6.46419E-08 -4.30744E-08 1.07716E-07904 Disposal, refractory SPL, Al elec.lysis, 0% water, to residual material landfill/CH U kg 6.41403E-08 -4.17972E-08 1.05938E-07905 Disposal, hard coal ash, 0% water, to residual material landfill/HR U kg 6.41E-08 -3.96859E-08 1.03786E-07906 Coal from underground mine S-Africa U -- kg 6.34236E-08 -4.47519E-09 6.78988E-08907 Disposal, hard coal ash, 0% water, to residual material landfill/BE U kg 6.25748E-08 -3.97934E-08 1.02368E-07908 Sodium hypochlorite, 15% in H2O, at plant/RER U kg 6.21413E-08 -3.64737E-08 9.8615E-08909 Coal from stock E-Europe U -- kg 6.04983E-08 -3.86247E-09 6.43607E-08910 Coal from mine E-Europe U -- kg 6.04983E-08 -3.86247E-09 6.43607E-08911 Transported E-European coal U -- kg 6.03775E-08 -3.85476E-09 6.42323E-08912 Bentonite ETH U - kg 6.03357E-08 -2.11542E-09 6.24512E-08913 Polyvinylchloride, bulk polymerised, at plant/RER U kg 5.95066E-08 -3.52556E-08 9.47622E-08914 Lime, hydrated, packed, at plant/CH U kg 5.66822E-08 -3.39239E-08 9.06061E-08915 Anthraquinone, at plant/RER U kg 5.66117E-08 -9.67433E-10 5.75791E-08916 Nitro-compounds, at regional storehouse/CH U kg 5.65853E-08 -3.37652E-08 9.03504E-08917 Paper, woodfree, uncoated, at regional storage/RER U kg 5.57955E-08 -3.70548E-08 9.28503E-08918 Sodium chloride, brine solution, at plant/RER U kg 5.46446E-08 -3.36923E-08 8.83369E-08919 Copper, SX-EW, at refinery/GLO U kg 5.44968E-08 -3.2907E-08 8.74038E-08920 Waste to LA chemical landfill U -- kg 5.23868E-08 -3.12617E-09 5.5513E-08921 [thio]carbamate-compounds, at regional storehouse/CH U kg 5.16584E-08 -3.08335E-08 8.24918E-08922 Disposal, lignite ash, 0% water, to opencast refill/FR U kg 5.14839E-08 -3.16139E-08 8.30978E-08923 Epoxy resin, liquid, at plant/RER U kg 5.06126E-08 -2.96178E-08 8.02303E-08924 Coal from underground mine E-Europe U -- kg 5.02136E-08 -3.20585E-09 5.34194E-08925 Calcium nitrate, as N, at regional storehouse/RER U kg 4.99123E-08 -3.06171E-08 8.05294E-08926 Slurry tanker, production/CH/I U kg 4.97521E-08 -3.01211E-08 7.98732E-08927 Hydrogen, liquid, diaphragm cell, at plant/RER U kg 4.96672E-08 -3.53777E-09 5.3205E-08928 Diammonium phosphate, as N, at regional storehouse/RER U kg 4.91641E-08 -2.93486E-08 7.85127E-08929 Alkyd paint, white, 60% in H2O, at plant/RER U kg 4.83708E-08 -3.132E-08 7.96907E-08930 Hydrogen, liquid, membrane cell, at plant/RER U kg 4.52288E-08 -3.22163E-09 4.84505E-08931 Disposal, hard coal ash, 0% water, to residual material landfill/PT U kg 4.46565E-08 -2.76775E-08 7.23339E-08932 Aluminium fluoride, at plant/RER U kg 4.44335E-08 -2.8955E-08 7.33885E-08933 Disposal, wood ash mixture, pure, 0% water, to municipal incineration/CH U kg 4.41395E-08 -1.81329E-08 6.22724E-08934 Disposal, wood ash mixture, pure, 0% water, to landfarming/CH U kg 4.41395E-08 -1.81329E-08 6.22724E-08935 Disposal, asphalt, 0.1% water, to sanitary landfill/CH U kg 4.37526E-08 -2.60581E-08 6.98108E-08936 Copper, blister-copper, at primary smelter/RER U kg 4.31523E-08 -2.60568E-08 6.92091E-08937 Cathode, aluminium electrolysis/RER U kg 4.30078E-08 -2.80259E-08 7.10338E-08938 Coal from stock Australia U -- kg 4.23865E-08 -3.18314E-09 4.55696E-08939 Coal from mine Australia U -- kg 4.23865E-08 -3.18314E-09 4.55696E-08940 Transported Australian coal U -- kg 4.23018E-08 -3.17679E-09 4.54786E-08941 Carboxymethyl cellulose, powder, at plant/RER U kg 4.05028E-08 -7.60338E-11 4.05788E-08942 Packaging, corrugated board, mixed fibre, single wall, at plant/CH S kg 4.04739E-08 -1.92276E-19 4.04739E-08943 Argon, crude, liquid, at plant/RER U kg 3.95518E-08 -2.45549E-08 6.41067E-08
9 of 25
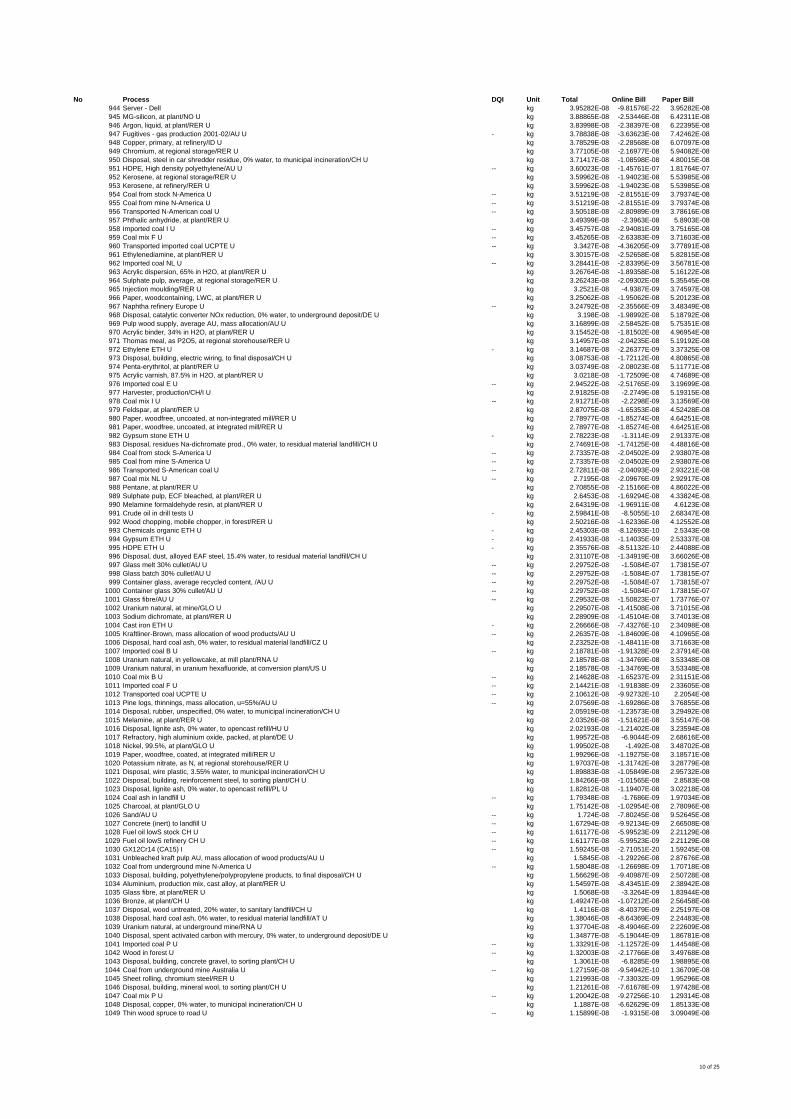
No Process DQI Unit Total Online Bill Paper Bill944 Server - Dell kg 3.95282E-08 -9.81576E-22 3.95282E-08945 MG-silicon, at plant/NO U kg 3.88865E-08 -2.53446E-08 6.42311E-08946 Argon, liquid, at plant/RER U kg 3.83998E-08 -2.38397E-08 6.22395E-08947 Fugitives - gas production 2001-02/AU U - kg 3.78838E-08 -3.63623E-08 7.42462E-08948 Copper, primary, at refinery/ID U kg 3.78529E-08 -2.28568E-08 6.07097E-08949 Chromium, at regional storage/RER U kg 3.77105E-08 -2.16977E-08 5.94082E-08950 Disposal, steel in car shredder residue, 0% water, to municipal incineration/CH U kg 3.71417E-08 -1.08598E-08 4.80015E-08951 HDPE, High density polyethylene/AU U -- kg 3.60023E-08 -1.45761E-07 1.81764E-07952 Kerosene, at regional storage/RER U kg 3.59962E-08 -1.94023E-08 5.53985E-08953 Kerosene, at refinery/RER U kg 3.59962E-08 -1.94023E-08 5.53985E-08954 Coal from stock N-America U -- kg 3.51219E-08 -2.81551E-09 3.79374E-08955 Coal from mine N-America U -- kg 3.51219E-08 -2.81551E-09 3.79374E-08956 Transported N-American coal U -- kg 3.50518E-08 -2.80989E-09 3.78616E-08957 Phthalic anhydride, at plant/RER U kg 3.49399E-08 -2.3963E-08 5.8903E-08958 Imported coal I U -- kg 3.45757E-08 -2.94081E-09 3.75165E-08959 Coal mix F U -- kg 3.45265E-08 -2.63383E-09 3.71603E-08960 Transported imported coal UCPTE U -- kg 3.3427E-08 -4.36205E-09 3.77891E-08961 Ethylenediamine, at plant/RER U kg 3.30157E-08 -2.52658E-08 5.82815E-08962 Imported coal NL U -- kg 3.28441E-08 -2.83395E-09 3.56781E-08963 Acrylic dispersion, 65% in H2O, at plant/RER U kg 3.26764E-08 -1.89358E-08 5.16122E-08964 Sulphate pulp, average, at regional storage/RER U kg 3.26243E-08 -2.09302E-08 5.35545E-08965 Injection moulding/RER U kg 3.2521E-08 -4.9387E-09 3.74597E-08966 Paper, woodcontaining, LWC, at plant/RER U kg 3.25062E-08 -1.95062E-08 5.20123E-08967 Naphtha refinery Europe U -- kg 3.24792E-08 -2.35566E-09 3.48349E-08968 Disposal, catalytic converter NOx reduction, 0% water, to underground deposit/DE U kg 3.198E-08 -1.98992E-08 5.18792E-08969 Pulp wood supply, average AU, mass allocation/AU U kg 3.16899E-08 -2.58452E-08 5.75351E-08970 Acrylic binder, 34% in H2O, at plant/RER U kg 3.15452E-08 -1.81502E-08 4.96954E-08971 Thomas meal, as P2O5, at regional storehouse/RER U kg 3.14957E-08 -2.04235E-08 5.19192E-08972 Ethylene ETH U - kg 3.14687E-08 -2.26377E-09 3.37325E-08973 Disposal, building, electric wiring, to final disposal/CH U kg 3.08753E-08 -1.72112E-08 4.80865E-08974 Penta-erythritol, at plant/RER U kg 3.03749E-08 -2.08023E-08 5.11771E-08975 Acrylic varnish, 87.5% in H2O, at plant/RER U kg 3.0218E-08 -1.72509E-08 4.74689E-08976 Imported coal E U -- kg 2.94522E-08 -2.51765E-09 3.19699E-08977 Harvester, production/CH/I U kg 2.91825E-08 -2.2749E-08 5.19315E-08978 Coal mix I U -- kg 2.91271E-08 -2.2298E-09 3.13569E-08979 Feldspar, at plant/RER U kg 2.87075E-08 -1.65353E-08 4.52428E-08980 Paper, woodfree, uncoated, at non-integrated mill/RER U kg 2.78977E-08 -1.85274E-08 4.64251E-08981 Paper, woodfree, uncoated, at integrated mill/RER U kg 2.78977E-08 -1.85274E-08 4.64251E-08982 Gypsum stone ETH U - kg 2.78223E-08 -1.3114E-09 2.91337E-08983 Disposal, residues Na-dichromate prod., 0% water, to residual material landfill/CH U kg 2.74691E-08 -1.74125E-08 4.48816E-08984 Coal from stock S-America U -- kg 2.73357E-08 -2.04502E-09 2.93807E-08985 Coal from mine S-America U -- kg 2.73357E-08 -2.04502E-09 2.93807E-08986 Transported S-American coal U -- kg 2.72811E-08 -2.04093E-09 2.93221E-08987 Coal mix NL U -- kg 2.7195E-08 -2.09676E-09 2.92917E-08988 Pentane, at plant/RER U kg 2.70855E-08 -2.15166E-08 4.86022E-08989 Sulphate pulp, ECF bleached, at plant/RER U kg 2.6453E-08 -1.69294E-08 4.33824E-08990 Melamine formaldehyde resin, at plant/RER U kg 2.64319E-08 -1.96911E-08 4.6123E-08991 Crude oil in drill tests U - kg 2.59841E-08 -8.5055E-10 2.68347E-08992 Wood chopping, mobile chopper, in forest/RER U kg 2.50216E-08 -1.62336E-08 4.12552E-08993 Chemicals organic ETH U - kg 2.45303E-08 -8.12693E-10 2.5343E-08994 Gypsum ETH U - kg 2.41933E-08 -1.14035E-09 2.53337E-08995 HDPE ETH U - kg 2.35576E-08 -8.51132E-10 2.44088E-08996 Disposal, dust, alloyed EAF steel, 15.4% water, to residual material landfill/CH U kg 2.31107E-08 -1.34919E-08 3.66026E-08997 Glass melt 30% cullet/AU U -- kg 2.29752E-08 -1.5084E-07 1.73815E-07998 Glass batch 30% cullet/AU U -- kg 2.29752E-08 -1.5084E-07 1.73815E-07999 Container glass, average recycled content, /AU U -- kg 2.29752E-08 -1.5084E-07 1.73815E-07
1000 Container glass 30% cullet/AU U -- kg 2.29752E-08 -1.5084E-07 1.73815E-071001 Glass fibre/AU U -- kg 2.29532E-08 -1.50823E-07 1.73776E-071002 Uranium natural, at mine/GLO U kg 2.29507E-08 -1.41508E-08 3.71015E-081003 Sodium dichromate, at plant/RER U kg 2.28909E-08 -1.45104E-08 3.74013E-081004 Cast iron ETH U - kg 2.26666E-08 -7.43276E-10 2.34098E-081005 Kraftliner-Brown, mass allocation of wood products/AU U -- kg 2.26357E-08 -1.84609E-08 4.10965E-081006 Disposal, hard coal ash, 0% water, to residual material landfill/CZ U kg 2.23252E-08 -1.48411E-08 3.71663E-081007 Imported coal B U -- kg 2.18781E-08 -1.91328E-09 2.37914E-081008 Uranium natural, in yellowcake, at mill plant/RNA U kg 2.18578E-08 -1.34769E-08 3.53348E-081009 Uranium natural, in uranium hexafluoride, at conversion plant/US U kg 2.18578E-08 -1.34769E-08 3.53348E-081010 Coal mix B U -- kg 2.14628E-08 -1.65237E-09 2.31151E-081011 Imported coal F U -- kg 2.14421E-08 -1.91838E-09 2.33605E-081012 Transported coal UCPTE U -- kg 2.10612E-08 -9.92732E-10 2.2054E-081013 Pine logs, thinnings, mass allocation, u=55%/AU U -- kg 2.07569E-08 -1.69286E-08 3.76855E-081014 Disposal, rubber, unspecified, 0% water, to municipal incineration/CH U kg 2.05919E-08 -1.23573E-08 3.29492E-081015 Melamine, at plant/RER U kg 2.03526E-08 -1.51621E-08 3.55147E-081016 Disposal, lignite ash, 0% water, to opencast refill/HU U kg 2.02193E-08 -1.21402E-08 3.23594E-081017 Refractory, high aluminium oxide, packed, at plant/DE U kg 1.99572E-08 -6.9044E-09 2.68616E-081018 Nickel, 99.5%, at plant/GLO U kg 1.99502E-08 -1.492E-08 3.48702E-081019 Paper, woodfree, coated, at integrated mill/RER U kg 1.99296E-08 -1.19275E-08 3.18571E-081020 Potassium nitrate, as N, at regional storehouse/RER U kg 1.97037E-08 -1.31742E-08 3.28779E-081021 Disposal, wire plastic, 3.55% water, to municipal incineration/CH U kg 1.89883E-08 -1.05849E-08 2.95732E-081022 Disposal, building, reinforcement steel, to sorting plant/CH U kg 1.84266E-08 -1.01565E-08 2.8583E-081023 Disposal, lignite ash, 0% water, to opencast refill/PL U kg 1.82812E-08 -1.19407E-08 3.02218E-081024 Coal ash in landfill U -- kg 1.79348E-08 -1.7686E-09 1.97034E-081025 Charcoal, at plant/GLO U kg 1.75142E-08 -1.02954E-08 2.78096E-081026 Sand/AU U -- kg 1.724E-08 -7.80245E-08 9.52645E-081027 Concrete (inert) to landfill U -- kg 1.67294E-08 -9.92134E-09 2.66508E-081028 Fuel oil lowS stock CH U -- kg 1.61177E-08 -5.99523E-09 2.21129E-081029 Fuel oil lowS refinery CH U -- kg 1.61177E-08 -5.99523E-09 2.21129E-081030 GX12Cr14 (CA15) I -- kg 1.59245E-08 -2.71051E-20 1.59245E-081031 Unbleached kraft pulp AU, mass allocation of wood products/AU U kg 1.5845E-08 -1.29226E-08 2.87676E-081032 Coal from underground mine N-America U -- kg 1.58048E-08 -1.26698E-09 1.70718E-081033 Disposal, building, polyethylene/polypropylene products, to final disposal/CH U kg 1.56629E-08 -9.40987E-09 2.50728E-081034 Aluminium, production mix, cast alloy, at plant/RER U kg 1.54597E-08 -8.43451E-09 2.38942E-081035 Glass fibre, at plant/RER U kg 1.5068E-08 -3.3264E-09 1.83944E-081036 Bronze, at plant/CH U kg 1.49247E-08 -1.07212E-08 2.56458E-081037 Disposal, wood untreated, 20% water, to sanitary landfill/CH U kg 1.4116E-08 -8.40379E-09 2.25197E-081038 Disposal, hard coal ash, 0% water, to residual material landfill/AT U kg 1.38046E-08 -8.64369E-09 2.24483E-081039 Uranium natural, at underground mine/RNA U kg 1.37704E-08 -8.49046E-09 2.22609E-081040 Disposal, spent activated carbon with mercury, 0% water, to underground deposit/DE U kg 1.34877E-08 -5.19044E-09 1.86781E-081041 Imported coal P U -- kg 1.33291E-08 -1.12572E-09 1.44548E-081042 Wood in forest U -- kg 1.32003E-08 -2.17766E-08 3.49768E-081043 Disposal, building, concrete gravel, to sorting plant/CH U kg 1.3061E-08 -6.8285E-09 1.98895E-081044 Coal from underground mine Australia U -- kg 1.27159E-08 -9.54942E-10 1.36709E-081045 Sheet rolling, chromium steel/RER U kg 1.21993E-08 -7.33032E-09 1.95296E-081046 Disposal, building, mineral wool, to sorting plant/CH U kg 1.21261E-08 -7.61678E-09 1.97428E-081047 Coal mix P U -- kg 1.20042E-08 -9.27256E-10 1.29314E-081048 Disposal, copper, 0% water, to municipal incineration/CH U kg 1.1887E-08 -6.62629E-09 1.85133E-081049 Thin wood spruce to road U -- kg 1.15899E-08 -1.9315E-08 3.09049E-08
10 of 25
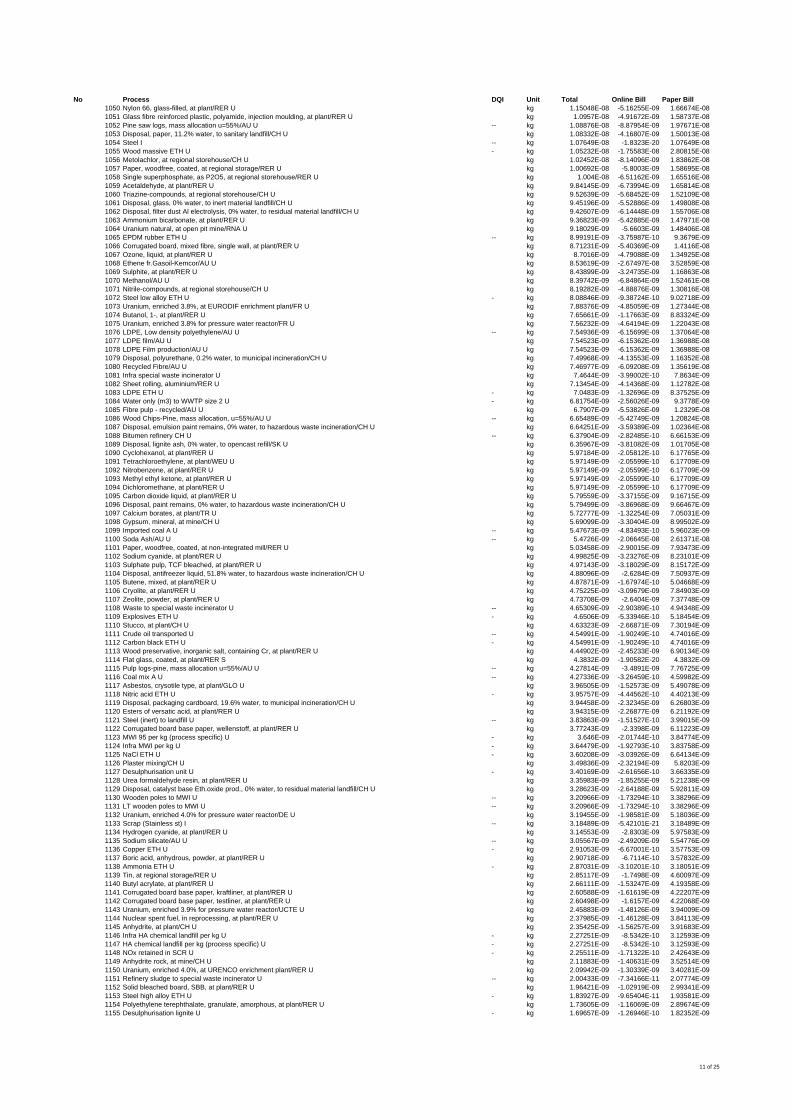
No Process DQI Unit Total Online Bill Paper Bill1050 Nylon 66, glass-filled, at plant/RER U kg 1.15048E-08 -5.16255E-09 1.66674E-081051 Glass fibre reinforced plastic, polyamide, injection moulding, at plant/RER U kg 1.0957E-08 -4.91672E-09 1.58737E-081052 Pine saw logs, mass allocation u=55%/AU U -- kg 1.08876E-08 -8.87954E-09 1.97671E-081053 Disposal, paper, 11.2% water, to sanitary landfill/CH U kg 1.08332E-08 -4.16807E-09 1.50013E-081054 Steel I -- kg 1.07649E-08 -1.8323E-20 1.07649E-081055 Wood massive ETH U - kg 1.05232E-08 -1.75583E-08 2.80815E-081056 Metolachlor, at regional storehouse/CH U kg 1.02452E-08 -8.14096E-09 1.83862E-081057 Paper, woodfree, coated, at regional storage/RER U kg 1.00692E-08 -5.8003E-09 1.58695E-081058 Single superphosphate, as P2O5, at regional storehouse/RER U kg 1.004E-08 -6.51162E-09 1.65516E-081059 Acetaldehyde, at plant/RER U kg 9.84145E-09 -6.73994E-09 1.65814E-081060 Triazine-compounds, at regional storehouse/CH U kg 9.52639E-09 -5.68452E-09 1.52109E-081061 Disposal, glass, 0% water, to inert material landfill/CH U kg 9.45196E-09 -5.52886E-09 1.49808E-081062 Disposal, filter dust Al electrolysis, 0% water, to residual material landfill/CH U kg 9.42607E-09 -6.14448E-09 1.55706E-081063 Ammonium bicarbonate, at plant/RER U kg 9.36823E-09 -5.42885E-09 1.47971E-081064 Uranium natural, at open pit mine/RNA U kg 9.18029E-09 -5.6603E-09 1.48406E-081065 EPDM rubber ETH U -- kg 8.99191E-09 -3.75987E-10 9.3679E-091066 Corrugated board, mixed fibre, single wall, at plant/RER U kg 8.71231E-09 -5.40369E-09 1.4116E-081067 Ozone, liquid, at plant/RER U kg 8.7016E-09 -4.79088E-09 1.34925E-081068 Ethene fr.Gasoil-Kemcor/AU U kg 8.53619E-09 -2.67497E-08 3.52859E-081069 Sulphite, at plant/RER U kg 8.43899E-09 -3.24735E-09 1.16863E-081070 Methanol/AU U kg 8.39742E-09 -6.84864E-09 1.52461E-081071 Nitrile-compounds, at regional storehouse/CH U kg 8.19282E-09 -4.88876E-09 1.30816E-081072 Steel low alloy ETH U - kg 8.08846E-09 -9.38724E-10 9.02718E-091073 Uranium, enriched 3.8%, at EURODIF enrichment plant/FR U kg 7.88376E-09 -4.85059E-09 1.27344E-081074 Butanol, 1-, at plant/RER U kg 7.65661E-09 -1.17663E-09 8.83324E-091075 Uranium, enriched 3.8% for pressure water reactor/FR U kg 7.56232E-09 -4.64194E-09 1.22043E-081076 LDPE, Low density polyethylene/AU U -- kg 7.54936E-09 -6.15699E-09 1.37064E-081077 LDPE film/AU U kg 7.54523E-09 -6.15362E-09 1.36988E-081078 LDPE Film production/AU U kg 7.54523E-09 -6.15362E-09 1.36988E-081079 Disposal, polyurethane, 0.2% water, to municipal incineration/CH U kg 7.49968E-09 -4.13553E-09 1.16352E-081080 Recycled Fibre/AU U kg 7.46977E-09 -6.09208E-09 1.35619E-081081 Infra special waste incinerator U kg 7.4644E-09 -3.99002E-10 7.8634E-091082 Sheet rolling, aluminium/RER U kg 7.13454E-09 -4.14368E-09 1.12782E-081083 LDPE ETH U - kg 7.0483E-09 -1.32696E-09 8.37525E-091084 Water only (m3) to WWTP size 2 U - kg 6.81754E-09 -2.56026E-09 9.3778E-091085 Fibre pulp - recycled/AU U kg 6.7907E-09 -5.53826E-09 1.2329E-081086 Wood Chips-Pine, mass allocation, u=55%/AU U -- kg 6.65489E-09 -5.42749E-09 1.20824E-081087 Disposal, emulsion paint remains, 0% water, to hazardous waste incineration/CH U kg 6.64251E-09 -3.59389E-09 1.02364E-081088 Bitumen refinery CH U -- kg 6.37904E-09 -2.82485E-10 6.66153E-091089 Disposal, lignite ash, 0% water, to opencast refill/SK U kg 6.35967E-09 -3.81082E-09 1.01705E-081090 Cyclohexanol, at plant/RER U kg 5.97184E-09 -2.05812E-10 6.17765E-091091 Tetrachloroethylene, at plant/WEU U kg 5.97149E-09 -2.05599E-10 6.17709E-091092 Nitrobenzene, at plant/RER U kg 5.97149E-09 -2.05599E-10 6.17709E-091093 Methyl ethyl ketone, at plant/RER U kg 5.97149E-09 -2.05599E-10 6.17709E-091094 Dichloromethane, at plant/RER U kg 5.97149E-09 -2.05599E-10 6.17709E-091095 Carbon dioxide liquid, at plant/RER U kg 5.79559E-09 -3.37155E-09 9.16715E-091096 Disposal, paint remains, 0% water, to hazardous waste incineration/CH U kg 5.79499E-09 -3.86968E-09 9.66467E-091097 Calcium borates, at plant/TR U kg 5.72777E-09 -1.32254E-09 7.05031E-091098 Gypsum, mineral, at mine/CH U kg 5.69099E-09 -3.30404E-09 8.99502E-091099 Imported coal A U -- kg 5.47673E-09 -4.83493E-10 5.96023E-091100 Soda Ash/AU U -- kg 5.4726E-09 -2.06645E-08 2.61371E-081101 Paper, woodfree, coated, at non-integrated mill/RER U kg 5.03458E-09 -2.90015E-09 7.93473E-091102 Sodium cyanide, at plant/RER U kg 4.99825E-09 -3.23276E-09 8.23101E-091103 Sulphate pulp, TCF bleached, at plant/RER U kg 4.97143E-09 -3.18029E-09 8.15172E-091104 Disposal, antifreezer liquid, 51.8% water, to hazardous waste incineration/CH U kg 4.88096E-09 -2.6284E-09 7.50937E-091105 Butene, mixed, at plant/RER U kg 4.87871E-09 -1.67974E-10 5.04668E-091106 Cryolite, at plant/RER U kg 4.75225E-09 -3.09679E-09 7.84903E-091107 Zeolite, powder, at plant/RER U kg 4.73708E-09 -2.6404E-09 7.37748E-091108 Waste to special waste incinerator U -- kg 4.65309E-09 -2.90389E-10 4.94348E-091109 Explosives ETH U - kg 4.6506E-09 -5.33946E-10 5.18454E-091110 Stucco, at plant/CH U kg 4.63323E-09 -2.66871E-09 7.30194E-091111 Crude oil transported U -- kg 4.54991E-09 -1.90249E-10 4.74016E-091112 Carbon black ETH U - kg 4.54991E-09 -1.90249E-10 4.74016E-091113 Wood preservative, inorganic salt, containing Cr, at plant/RER U kg 4.44902E-09 -2.45233E-09 6.90134E-091114 Flat glass, coated, at plant/RER S kg 4.3832E-09 -1.90582E-20 4.3832E-091115 Pulp logs-pine, mass allocation u=55%/AU U -- kg 4.27814E-09 -3.4891E-09 7.76725E-091116 Coal mix A U -- kg 4.27336E-09 -3.26459E-10 4.59982E-091117 Asbestos, crysotile type, at plant/GLO U kg 3.96505E-09 -1.52573E-09 5.49078E-091118 Nitric acid ETH U - kg 3.95757E-09 -4.44562E-10 4.40213E-091119 Disposal, packaging cardboard, 19.6% water, to municipal incineration/CH U kg 3.94458E-09 -2.32345E-09 6.26803E-091120 Esters of versatic acid, at plant/RER U kg 3.94315E-09 -2.26877E-09 6.21192E-091121 Steel (inert) to landfill U -- kg 3.83863E-09 -1.51527E-10 3.99015E-091122 Corrugated board base paper, wellenstoff, at plant/RER U kg 3.77243E-09 -2.3398E-09 6.11223E-091123 MWI 95 per kg (process specific) U - kg 3.646E-09 -2.01744E-10 3.84774E-091124 Infra MWI per kg U - kg 3.64479E-09 -1.92793E-10 3.83758E-091125 NaCl ETH U - kg 3.60208E-09 -3.03926E-09 6.64134E-091126 Plaster mixing/CH U kg 3.49836E-09 -2.32194E-09 5.8203E-091127 Desulphurisation unit U - kg 3.40169E-09 -2.61656E-10 3.66335E-091128 Urea formaldehyde resin, at plant/RER U kg 3.35983E-09 -1.85255E-09 5.21238E-091129 Disposal, catalyst base Eth.oxide prod., 0% water, to residual material landfill/CH U kg 3.28623E-09 -2.64188E-09 5.92811E-091130 Wooden poles to MWI U -- kg 3.20966E-09 -1.73294E-10 3.38296E-091131 LT wooden poles to MWI U -- kg 3.20966E-09 -1.73294E-10 3.38296E-091132 Uranium, enriched 4.0% for pressure water reactor/DE U kg 3.19455E-09 -1.98581E-09 5.18036E-091133 Scrap (Stainless st) I -- kg 3.18489E-09 -5.42101E-21 3.18489E-091134 Hydrogen cyanide, at plant/RER U kg 3.14553E-09 -2.8303E-09 5.97583E-091135 Sodium silicate/AU U -- kg 3.05567E-09 -2.49209E-09 5.54776E-091136 Copper ETH U - kg 2.91053E-09 -6.67001E-10 3.57753E-091137 Boric acid, anhydrous, powder, at plant/RER U kg 2.90718E-09 -6.7114E-10 3.57832E-091138 Ammonia ETH U - kg 2.87031E-09 -3.10201E-10 3.18051E-091139 Tin, at regional storage/RER U kg 2.85117E-09 -1.7498E-09 4.60097E-091140 Butyl acrylate, at plant/RER U kg 2.66111E-09 -1.53247E-09 4.19358E-091141 Corrugated board base paper, kraftliner, at plant/RER U kg 2.60588E-09 -1.61619E-09 4.22207E-091142 Corrugated board base paper, testliner, at plant/RER U kg 2.60498E-09 -1.6157E-09 4.22068E-091143 Uranium, enriched 3.9% for pressure water reactor/UCTE U kg 2.45883E-09 -1.48126E-09 3.94009E-091144 Nuclear spent fuel, in reprocessing, at plant/RER U kg 2.37985E-09 -1.46128E-09 3.84113E-091145 Anhydrite, at plant/CH U kg 2.35425E-09 -1.56257E-09 3.91683E-091146 Infra HA chemical landfill per kg U - kg 2.27251E-09 -8.5342E-10 3.12593E-091147 HA chemical landfill per kg (process specific) U - kg 2.27251E-09 -8.5342E-10 3.12593E-091148 NOx retained in SCR U - kg 2.25511E-09 -1.71322E-10 2.42643E-091149 Anhydrite rock, at mine/CH U kg 2.11883E-09 -1.40631E-09 3.52514E-091150 Uranium, enriched 4.0%, at URENCO enrichment plant/RER U kg 2.09942E-09 -1.30339E-09 3.40281E-091151 Refinery sludge to special waste incinerator U -- kg 2.00433E-09 -7.34166E-11 2.07774E-091152 Solid bleached board, SBB, at plant/RER U kg 1.96421E-09 -1.02919E-09 2.99341E-091153 Steel high alloy ETH U - kg 1.83927E-09 -9.65404E-11 1.93581E-091154 Polyethylene terephthalate, granulate, amorphous, at plant/RER U kg 1.73605E-09 -1.16069E-09 2.89674E-091155 Desulphurisation lignite U - kg 1.69657E-09 -1.26946E-10 1.82352E-09
11 of 25
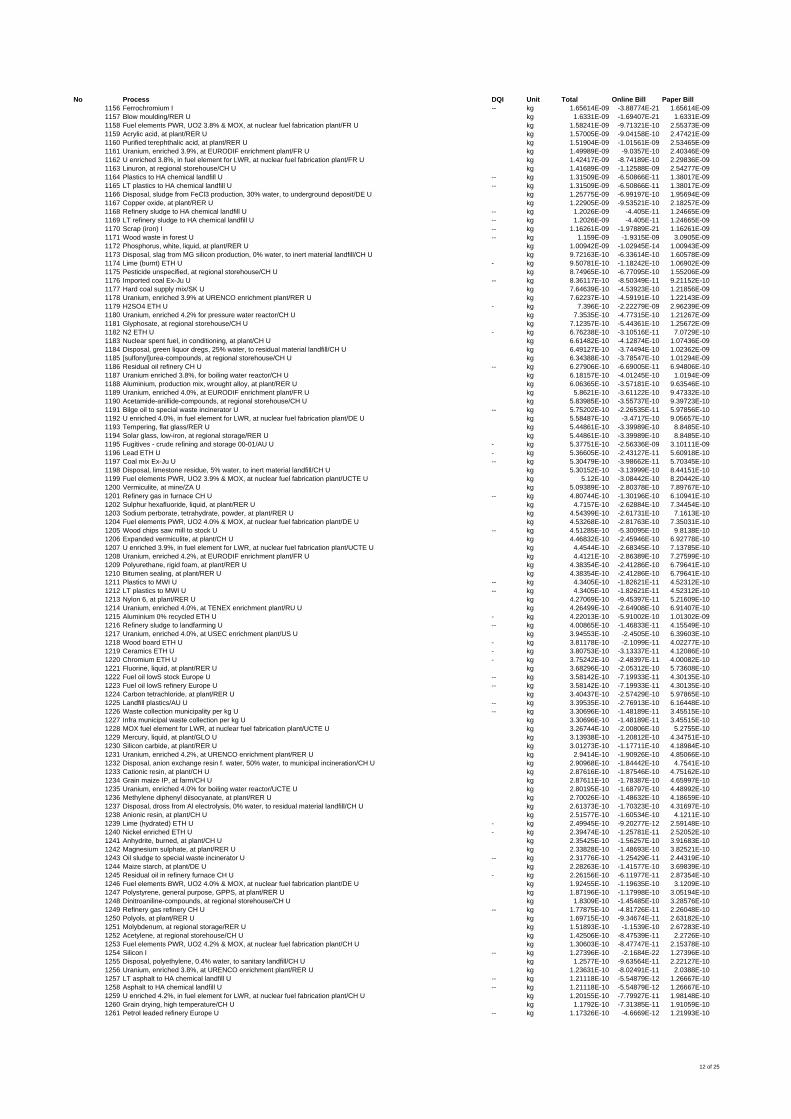
No Process DQI Unit Total Online Bill Paper Bill1156 Ferrochromium I -- kg 1.65614E-09 -3.88774E-21 1.65614E-091157 Blow moulding/RER U kg 1.6331E-09 -1.69407E-21 1.6331E-091158 Fuel elements PWR, UO2 3.8% & MOX, at nuclear fuel fabrication plant/FR U kg 1.58241E-09 -9.71321E-10 2.55373E-091159 Acrylic acid, at plant/RER U kg 1.57005E-09 -9.04158E-10 2.47421E-091160 Purified terephthalic acid, at plant/RER U kg 1.51904E-09 -1.01561E-09 2.53465E-091161 Uranium, enriched 3.9%, at EURODIF enrichment plant/FR U kg 1.49989E-09 -9.0357E-10 2.40346E-091162 U enriched 3.8%, in fuel element for LWR, at nuclear fuel fabrication plant/FR U kg 1.42417E-09 -8.74189E-10 2.29836E-091163 Linuron, at regional storehouse/CH U kg 1.41689E-09 -1.12588E-09 2.54277E-091164 Plastics to HA chemical landfill U -- kg 1.31509E-09 -6.50866E-11 1.38017E-091165 LT plastics to HA chemical landfill U -- kg 1.31509E-09 -6.50866E-11 1.38017E-091166 Disposal, sludge from FeCl3 production, 30% water, to underground deposit/DE U kg 1.25775E-09 -6.99197E-10 1.95694E-091167 Copper oxide, at plant/RER U kg 1.22905E-09 -9.53521E-10 2.18257E-091168 Refinery sludge to HA chemical landfill U -- kg 1.2026E-09 -4.405E-11 1.24665E-091169 LT refinery sludge to HA chemical landfill U -- kg 1.2026E-09 -4.405E-11 1.24665E-091170 Scrap (iron) I -- kg 1.16261E-09 -1.97889E-21 1.16261E-091171 Wood waste in forest U -- kg 1.159E-09 -1.9315E-09 3.0905E-091172 Phosphorus, white, liquid, at plant/RER U kg 1.00942E-09 -1.02945E-14 1.00943E-091173 Disposal, slag from MG silicon production, 0% water, to inert material landfill/CH U kg 9.72163E-10 -6.33614E-10 1.60578E-091174 Lime (burnt) ETH U - kg 9.50781E-10 -1.18242E-10 1.06902E-091175 Pesticide unspecified, at regional storehouse/CH U kg 8.74965E-10 -6.77095E-10 1.55206E-091176 Imported coal Ex-Ju U -- kg 8.36117E-10 -8.50349E-11 9.21152E-101177 Hard coal supply mix/SK U kg 7.64639E-10 -4.53923E-10 1.21856E-091178 Uranium, enriched 3.9% at URENCO enrichment plant/RER U kg 7.62237E-10 -4.59191E-10 1.22143E-091179 H2SO4 ETH U - kg 7.396E-10 -2.22279E-09 2.96239E-091180 Uranium, enriched 4.2% for pressure water reactor/CH U kg 7.3535E-10 -4.77315E-10 1.21267E-091181 Glyphosate, at regional storehouse/CH U kg 7.12357E-10 -5.44361E-10 1.25672E-091182 N2 ETH U - kg 6.76238E-10 -3.10516E-11 7.0729E-101183 Nuclear spent fuel, in conditioning, at plant/CH U kg 6.61482E-10 -4.12874E-10 1.07436E-091184 Disposal, green liquor dregs, 25% water, to residual material landfill/CH U kg 6.49127E-10 -3.74494E-10 1.02362E-091185 [sulfonyl]urea-compounds, at regional storehouse/CH U kg 6.34388E-10 -3.78547E-10 1.01294E-091186 Residual oil refinery CH U -- kg 6.27906E-10 -6.69005E-11 6.94806E-101187 Uranium enriched 3.8%, for boiling water reactor/CH U kg 6.18157E-10 -4.01245E-10 1.0194E-091188 Aluminium, production mix, wrought alloy, at plant/RER U kg 6.06365E-10 -3.57181E-10 9.63546E-101189 Uranium, enriched 4.0%, at EURODIF enrichment plant/FR U kg 5.8621E-10 -3.61122E-10 9.47332E-101190 Acetamide-anillide-compounds, at regional storehouse/CH U kg 5.83985E-10 -3.55737E-10 9.39723E-101191 Bilge oil to special waste incinerator U -- kg 5.75202E-10 -2.26535E-11 5.97856E-101192 U enriched 4.0%, in fuel element for LWR, at nuclear fuel fabrication plant/DE U kg 5.58487E-10 -3.4717E-10 9.05657E-101193 Tempering, flat glass/RER U kg 5.44861E-10 -3.39989E-10 8.8485E-101194 Solar glass, low-iron, at regional storage/RER U kg 5.44861E-10 -3.39989E-10 8.8485E-101195 Fugitives - crude refining and storage 00-01/AU U - kg 5.37751E-10 -2.56336E-09 3.10111E-091196 Lead ETH U - kg 5.36605E-10 -2.43127E-11 5.60918E-101197 Coal mix Ex-Ju U -- kg 5.30479E-10 -3.98662E-11 5.70345E-101198 Disposal, limestone residue, 5% water, to inert material landfill/CH U kg 5.30152E-10 -3.13999E-10 8.44151E-101199 Fuel elements PWR, UO2 3.9% & MOX, at nuclear fuel fabrication plant/UCTE U kg 5.12E-10 -3.08442E-10 8.20442E-101200 Vermiculite, at mine/ZA U kg 5.09389E-10 -2.80378E-10 7.89767E-101201 Refinery gas in furnace CH U -- kg 4.80744E-10 -1.30196E-10 6.10941E-101202 Sulphur hexafluoride, liquid, at plant/RER U kg 4.7157E-10 -2.62884E-10 7.34454E-101203 Sodium perborate, tetrahydrate, powder, at plant/RER U kg 4.54399E-10 -2.61731E-10 7.1613E-101204 Fuel elements PWR, UO2 4.0% & MOX, at nuclear fuel fabrication plant/DE U kg 4.53268E-10 -2.81763E-10 7.35031E-101205 Wood chips saw mill to stock U -- kg 4.51285E-10 -5.30095E-10 9.8138E-101206 Expanded vermiculite, at plant/CH U kg 4.46832E-10 -2.45946E-10 6.92778E-101207 U enriched 3.9%, in fuel element for LWR, at nuclear fuel fabrication plant/UCTE U kg 4.4544E-10 -2.68345E-10 7.13785E-101208 Uranium, enriched 4.2%, at EURODIF enrichment plant/FR U kg 4.4121E-10 -2.86389E-10 7.27599E-101209 Polyurethane, rigid foam, at plant/RER U kg 4.38354E-10 -2.41286E-10 6.79641E-101210 Bitumen sealing, at plant/RER U kg 4.38354E-10 -2.41286E-10 6.79641E-101211 Plastics to MWI U -- kg 4.3405E-10 -1.82621E-11 4.52312E-101212 LT plastics to MWI U -- kg 4.3405E-10 -1.82621E-11 4.52312E-101213 Nylon 6, at plant/RER U kg 4.27069E-10 -9.45397E-11 5.21609E-101214 Uranium, enriched 4.0%, at TENEX enrichment plant/RU U kg 4.26499E-10 -2.64908E-10 6.91407E-101215 Aluminium 0% recycled ETH U - kg 4.22013E-10 -5.91002E-10 1.01302E-091216 Refinery sludge to landfarming U -- kg 4.00865E-10 -1.46833E-11 4.15549E-101217 Uranium, enriched 4.0%, at USEC enrichment plant/US U kg 3.94553E-10 -2.4505E-10 6.39603E-101218 Wood board ETH U - kg 3.81178E-10 -2.1099E-11 4.02277E-101219 Ceramics ETH U - kg 3.80753E-10 -3.13337E-11 4.12086E-101220 Chromium ETH U - kg 3.75242E-10 -2.48397E-11 4.00082E-101221 Fluorine, liquid, at plant/RER U kg 3.68296E-10 -2.05312E-10 5.73608E-101222 Fuel oil lowS stock Europe U -- kg 3.58142E-10 -7.19933E-11 4.30135E-101223 Fuel oil lowS refinery Europe U -- kg 3.58142E-10 -7.19933E-11 4.30135E-101224 Carbon tetrachloride, at plant/RER U kg 3.40437E-10 -2.57429E-10 5.97865E-101225 Landfill plastics/AU U -- kg 3.39535E-10 -2.76913E-10 6.16448E-101226 Waste collection municipality per kg U -- kg 3.30696E-10 -1.48189E-11 3.45515E-101227 Infra municipal waste collection per kg U kg 3.30696E-10 -1.48189E-11 3.45515E-101228 MOX fuel element for LWR, at nuclear fuel fabrication plant/UCTE U kg 3.26744E-10 -2.00806E-10 5.2755E-101229 Mercury, liquid, at plant/GLO U kg 3.13938E-10 -1.20812E-10 4.34751E-101230 Silicon carbide, at plant/RER U kg 3.01273E-10 -1.17711E-10 4.18984E-101231 Uranium, enriched 4.2%, at URENCO enrichment plant/RER U kg 2.9414E-10 -1.90926E-10 4.85066E-101232 Disposal, anion exchange resin f. water, 50% water, to municipal incineration/CH U kg 2.90968E-10 -1.84442E-10 4.7541E-101233 Cationic resin, at plant/CH U kg 2.87616E-10 -1.87546E-10 4.75162E-101234 Grain maize IP, at farm/CH U kg 2.87611E-10 -1.78387E-10 4.65997E-101235 Uranium, enriched 4.0% for boiling water reactor/UCTE U kg 2.80195E-10 -1.68797E-10 4.48992E-101236 Methylene diphenyl diisocyanate, at plant/RER U kg 2.70026E-10 -1.48632E-10 4.18659E-101237 Disposal, dross from Al electrolysis, 0% water, to residual material landfill/CH U kg 2.61373E-10 -1.70323E-10 4.31697E-101238 Anionic resin, at plant/CH U kg 2.51577E-10 -1.60534E-10 4.1211E-101239 Lime (hydrated) ETH U - kg 2.49945E-10 -9.20277E-12 2.59148E-101240 Nickel enriched ETH U - kg 2.39474E-10 -1.25781E-11 2.52052E-101241 Anhydrite, burned, at plant/CH U kg 2.35425E-10 -1.56257E-10 3.91683E-101242 Magnesium sulphate, at plant/RER U kg 2.33828E-10 -1.48693E-10 3.82521E-101243 Oil sludge to special waste incinerator U -- kg 2.31776E-10 -1.25429E-11 2.44319E-101244 Maize starch, at plant/DE U kg 2.28263E-10 -1.41577E-10 3.69839E-101245 Residual oil in refinery furnace CH U - kg 2.26156E-10 -6.11977E-11 2.87354E-101246 Fuel elements BWR, UO2 4.0% & MOX, at nuclear fuel fabrication plant/DE U kg 1.92455E-10 -1.19635E-10 3.1209E-101247 Polystyrene, general purpose, GPPS, at plant/RER U kg 1.87196E-10 -1.17998E-10 3.05194E-101248 Dinitroaniline-compounds, at regional storehouse/CH U kg 1.8309E-10 -1.45485E-10 3.28576E-101249 Refinery gas refinery CH U -- kg 1.77875E-10 -4.81726E-11 2.26048E-101250 Polyols, at plant/RER U kg 1.69715E-10 -9.34674E-11 2.63182E-101251 Molybdenum, at regional storage/RER U kg 1.51893E-10 -1.1539E-10 2.67283E-101252 Acetylene, at regional storehouse/CH U kg 1.42506E-10 -8.47539E-11 2.2726E-101253 Fuel elements PWR, UO2 4.2% & MOX, at nuclear fuel fabrication plant/CH U kg 1.30603E-10 -8.47747E-11 2.15378E-101254 Silicon I -- kg 1.27396E-10 -2.1684E-22 1.27396E-101255 Disposal, polyethylene, 0.4% water, to sanitary landfill/CH U kg 1.2577E-10 -9.63564E-11 2.22127E-101256 Uranium, enriched 3.8%, at URENCO enrichment plant/RER U kg 1.23631E-10 -8.02491E-11 2.0388E-101257 LT asphalt to HA chemical landfill U -- kg 1.21118E-10 -5.54879E-12 1.26667E-101258 Asphalt to HA chemical landfill U -- kg 1.21118E-10 -5.54879E-12 1.26667E-101259 U enriched 4.2%, in fuel element for LWR, at nuclear fuel fabrication plant/CH U kg 1.20155E-10 -7.79927E-11 1.98148E-101260 Grain drying, high temperature/CH U kg 1.1792E-10 -7.31385E-11 1.91059E-101261 Petrol leaded refinery Europe U -- kg 1.17326E-10 -4.6669E-12 1.21993E-10
12 of 25
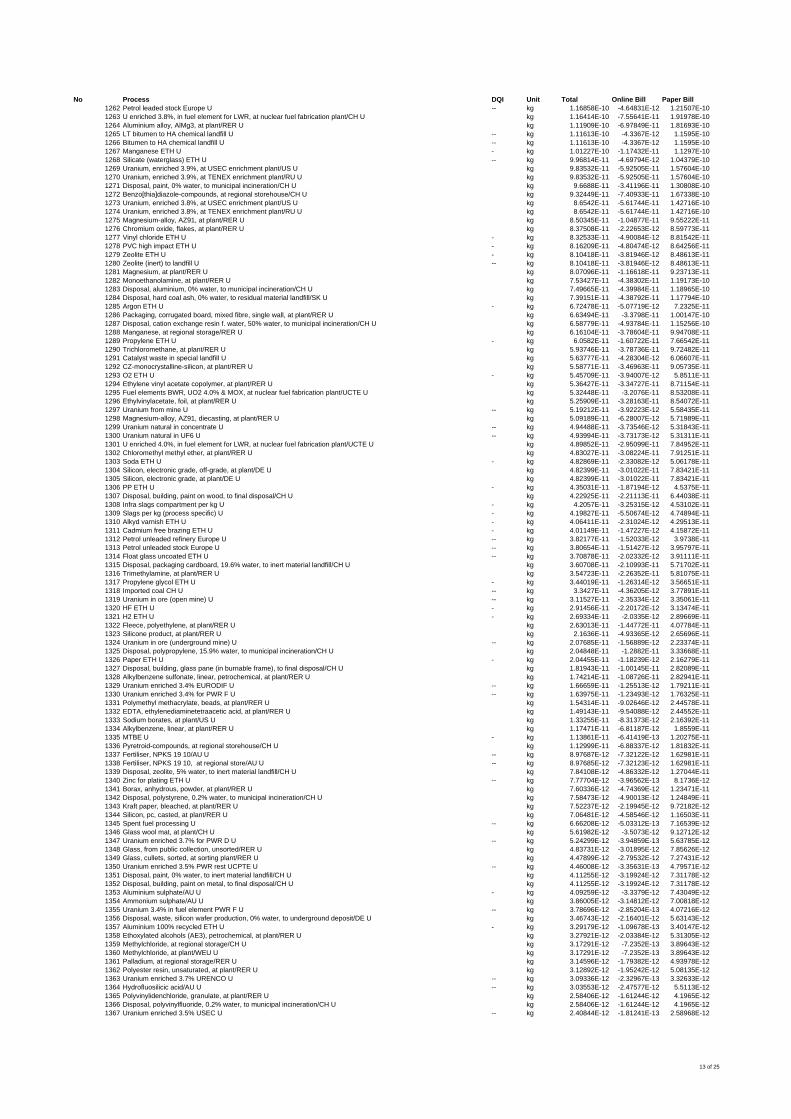
No Process DQI Unit Total Online Bill Paper Bill1262 Petrol leaded stock Europe U -- kg 1.16858E-10 -4.64831E-12 1.21507E-101263 U enriched 3.8%, in fuel element for LWR, at nuclear fuel fabrication plant/CH U kg 1.16414E-10 -7.55641E-11 1.91978E-101264 Aluminium alloy, AlMg3, at plant/RER U kg 1.11909E-10 -6.97849E-11 1.81693E-101265 LT bitumen to HA chemical landfill U -- kg 1.11613E-10 -4.3367E-12 1.1595E-101266 Bitumen to HA chemical landfill U -- kg 1.11613E-10 -4.3367E-12 1.1595E-101267 Manganese ETH U - kg 1.01227E-10 -1.17432E-11 1.1297E-101268 Silicate (waterglass) ETH U -- kg 9.96814E-11 -4.69794E-12 1.04379E-101269 Uranium, enriched 3.9%, at USEC enrichment plant/US U kg 9.83532E-11 -5.92505E-11 1.57604E-101270 Uranium, enriched 3.9%, at TENEX enrichment plant/RU U kg 9.83532E-11 -5.92505E-11 1.57604E-101271 Disposal, paint, 0% water, to municipal incineration/CH U kg 9.6688E-11 -3.41196E-11 1.30808E-101272 Benzo[thia]diazole-compounds, at regional storehouse/CH U kg 9.32449E-11 -7.40933E-11 1.67338E-101273 Uranium, enriched 3.8%, at USEC enrichment plant/US U kg 8.6542E-11 -5.61744E-11 1.42716E-101274 Uranium, enriched 3.8%, at TENEX enrichment plant/RU U kg 8.6542E-11 -5.61744E-11 1.42716E-101275 Magnesium-alloy, AZ91, at plant/RER U kg 8.50345E-11 -1.04877E-11 9.55222E-111276 Chromium oxide, flakes, at plant/RER U kg 8.37508E-11 -2.22653E-12 8.59773E-111277 Vinyl chloride ETH U - kg 8.32533E-11 -4.90084E-12 8.81542E-111278 PVC high impact ETH U - kg 8.16209E-11 -4.80474E-12 8.64256E-111279 Zeolite ETH U - kg 8.10418E-11 -3.81946E-12 8.48613E-111280 Zeolite (inert) to landfill U -- kg 8.10418E-11 -3.81946E-12 8.48613E-111281 Magnesium, at plant/RER U kg 8.07096E-11 -1.16618E-11 9.23713E-111282 Monoethanolamine, at plant/RER U kg 7.53427E-11 -4.38302E-11 1.19173E-101283 Disposal, aluminium, 0% water, to municipal incineration/CH U kg 7.49665E-11 -4.39984E-11 1.18965E-101284 Disposal, hard coal ash, 0% water, to residual material landfill/SK U kg 7.39151E-11 -4.38792E-11 1.17794E-101285 Argon ETH U - kg 6.72478E-11 -5.07719E-12 7.2325E-111286 Packaging, corrugated board, mixed fibre, single wall, at plant/RER U kg 6.63494E-11 -3.3798E-11 1.00147E-101287 Disposal, cation exchange resin f. water, 50% water, to municipal incineration/CH U kg 6.58779E-11 -4.93784E-11 1.15256E-101288 Manganese, at regional storage/RER U kg 6.16104E-11 -3.78604E-11 9.94708E-111289 Propylene ETH U - kg 6.0582E-11 -1.60722E-11 7.66542E-111290 Trichloromethane, at plant/RER U kg 5.93746E-11 -3.78736E-11 9.72482E-111291 Catalyst waste in special landfill U kg 5.63777E-11 -4.28304E-12 6.06607E-111292 CZ-monocrystalline-silicon, at plant/RER U kg 5.58771E-11 -3.46963E-11 9.05735E-111293 O2 ETH U - kg 5.45709E-11 -3.94007E-12 5.8511E-111294 Ethylene vinyl acetate copolymer, at plant/RER U kg 5.36427E-11 -3.34727E-11 8.71154E-111295 Fuel elements BWR, UO2 4.0% & MOX, at nuclear fuel fabrication plant/UCTE U kg 5.32448E-11 -3.2076E-11 8.53208E-111296 Ethylvinylacetate, foil, at plant/RER U kg 5.25909E-11 -3.28163E-11 8.54072E-111297 Uranium from mine U -- kg 5.19212E-11 -3.92223E-12 5.58435E-111298 Magnesium-alloy, AZ91, diecasting, at plant/RER U kg 5.09189E-11 -6.28007E-12 5.71989E-111299 Uranium natural in concentrate U -- kg 4.94488E-11 -3.73546E-12 5.31843E-111300 Uranium natural in UF6 U -- kg 4.93994E-11 -3.73173E-12 5.31311E-111301 U enriched 4.0%, in fuel element for LWR, at nuclear fuel fabrication plant/UCTE U kg 4.89852E-11 -2.95099E-11 7.84952E-111302 Chloromethyl methyl ether, at plant/RER U kg 4.83027E-11 -3.08224E-11 7.91251E-111303 Soda ETH U - kg 4.82869E-11 -2.33082E-12 5.06178E-111304 Silicon, electronic grade, off-grade, at plant/DE U kg 4.82399E-11 -3.01022E-11 7.83421E-111305 Silicon, electronic grade, at plant/DE U kg 4.82399E-11 -3.01022E-11 7.83421E-111306 PP ETH U - kg 4.35031E-11 -1.87194E-12 4.5375E-111307 Disposal, building, paint on wood, to final disposal/CH U kg 4.22925E-11 -2.21113E-11 6.44038E-111308 Infra slags compartment per kg U - kg 4.2057E-11 -3.25315E-12 4.53102E-111309 Slags per kg (process specific) U - kg 4.19827E-11 -5.50674E-12 4.74894E-111310 Alkyd varnish ETH U - kg 4.06411E-11 -2.31024E-12 4.29513E-111311 Cadmium free brazing ETH U - kg 4.01149E-11 -1.47227E-12 4.15872E-111312 Petrol unleaded refinery Europe U -- kg 3.82177E-11 -1.52033E-12 3.9738E-111313 Petrol unleaded stock Europe U -- kg 3.80654E-11 -1.51427E-12 3.95797E-111314 Float glass uncoated ETH U -- kg 3.70878E-11 -2.02332E-12 3.91111E-111315 Disposal, packaging cardboard, 19.6% water, to inert material landfill/CH U kg 3.60708E-11 -2.10993E-11 5.71702E-111316 Trimethylamine, at plant/RER U kg 3.54723E-11 -2.26352E-11 5.81075E-111317 Propylene glycol ETH U - kg 3.44019E-11 -1.26314E-12 3.56651E-111318 Imported coal CH U -- kg 3.3427E-11 -4.36205E-12 3.77891E-111319 Uranium in ore (open mine) U -- kg 3.11527E-11 -2.35334E-12 3.35061E-111320 HF ETH U - kg 2.91456E-11 -2.20172E-12 3.13474E-111321 H2 ETH U - kg 2.69334E-11 -2.0335E-12 2.89669E-111322 Fleece, polyethylene, at plant/RER U kg 2.63013E-11 -1.44772E-11 4.07784E-111323 Silicone product, at plant/RER U kg 2.1636E-11 -4.93365E-12 2.65696E-111324 Uranium in ore (underground mine) U -- kg 2.07685E-11 -1.56889E-12 2.23374E-111325 Disposal, polypropylene, 15.9% water, to municipal incineration/CH U kg 2.04848E-11 -1.2882E-11 3.33668E-111326 Paper ETH U - kg 2.04455E-11 -1.18239E-12 2.16279E-111327 Disposal, building, glass pane (in burnable frame), to final disposal/CH U kg 1.81943E-11 -1.00145E-11 2.82089E-111328 Alkylbenzene sulfonate, linear, petrochemical, at plant/RER U kg 1.74214E-11 -1.08726E-11 2.82941E-111329 Uranium enriched 3.4% EURODIF U -- kg 1.66659E-11 -1.25513E-12 1.79211E-111330 Uranium enriched 3.4% for PWR F U -- kg 1.63975E-11 -1.23493E-12 1.76325E-111331 Polymethyl methacrylate, beads, at plant/RER U kg 1.54314E-11 -9.02646E-12 2.44578E-111332 EDTA, ethylenediaminetetraacetic acid, at plant/RER U kg 1.49143E-11 -9.54088E-12 2.44552E-111333 Sodium borates, at plant/US U kg 1.33255E-11 -8.31373E-12 2.16392E-111334 Alkylbenzene, linear, at plant/RER U kg 1.17471E-11 -6.81187E-12 1.8559E-111335 MTBE U - kg 1.13861E-11 -6.41419E-13 1.20275E-111336 Pyretroid-compounds, at regional storehouse/CH U kg 1.12999E-11 -6.88337E-12 1.81832E-111337 Fertiliser, NPKS 19 10/AU U -- kg 8.97687E-12 -7.32122E-12 1.62981E-111338 Fertiliser, NPKS 19 10, at regional store/AU U -- kg 8.97685E-12 -7.32123E-12 1.62981E-111339 Disposal, zeolite, 5% water, to inert material landfill/CH U kg 7.84108E-12 -4.86332E-12 1.27044E-111340 Zinc for plating ETH U -- kg 7.77704E-12 -3.96562E-13 8.1736E-121341 Borax, anhydrous, powder, at plant/RER U kg 7.60336E-12 -4.74369E-12 1.23471E-111342 Disposal, polystyrene, 0.2% water, to municipal incineration/CH U kg 7.58473E-12 -4.90013E-12 1.24849E-111343 Kraft paper, bleached, at plant/RER U kg 7.52237E-12 -2.19945E-12 9.72182E-121344 Silicon, pc, casted, at plant/RER U kg 7.06481E-12 -4.58546E-12 1.16503E-111345 Spent fuel processing U -- kg 6.66208E-12 -5.03312E-13 7.16539E-121346 Glass wool mat, at plant/CH U kg 5.61982E-12 -3.5073E-12 9.12712E-121347 Uranium enriched 3.7% for PWR D U -- kg 5.24299E-12 -3.94859E-13 5.63785E-121348 Glass, from public collection, unsorted/RER U kg 4.83731E-12 -3.01895E-12 7.85626E-121349 Glass, cullets, sorted, at sorting plant/RER U kg 4.47899E-12 -2.79532E-12 7.27431E-121350 Uranium enriched 3.5% PWR rest UCPTE U -- kg 4.46008E-12 -3.35631E-13 4.79571E-121351 Disposal, paint, 0% water, to inert material landfill/CH U kg 4.11255E-12 -3.19924E-12 7.31178E-121352 Disposal, building, paint on metal, to final disposal/CH U kg 4.11255E-12 -3.19924E-12 7.31178E-121353 Aluminium sulphate/AU U - kg 4.09259E-12 -3.3379E-12 7.43049E-121354 Ammonium sulphate/AU U kg 3.86005E-12 -3.14812E-12 7.00818E-121355 Uranium 3.4% in fuel element PWR F U -- kg 3.78696E-12 -2.85204E-13 4.07216E-121356 Disposal, waste, silicon wafer production, 0% water, to underground deposit/DE U kg 3.46743E-12 -2.16401E-12 5.63143E-121357 Aluminium 100% recycled ETH U - kg 3.29179E-12 -1.09678E-13 3.40147E-121358 Ethoxylated alcohols (AE3), petrochemical, at plant/RER U kg 3.27921E-12 -2.03384E-12 5.31305E-121359 Methylchloride, at regional storage/CH U kg 3.17291E-12 -7.2352E-13 3.89643E-121360 Methylchloride, at plant/WEU U kg 3.17291E-12 -7.2352E-13 3.89643E-121361 Palladium, at regional storage/RER U kg 3.14596E-12 -1.79382E-12 4.93978E-121362 Polyester resin, unsaturated, at plant/RER U kg 3.12892E-12 -1.95242E-12 5.08135E-121363 Uranium enriched 3.7% URENCO U -- kg 3.09336E-12 -2.32967E-13 3.32633E-121364 Hydrofluosilicic acid/AU U -- kg 3.03553E-12 -2.47577E-12 5.5113E-121365 Polyvinylidenchloride, granulate, at plant/RER U kg 2.58406E-12 -1.61244E-12 4.1965E-121366 Disposal, polyvinylfluoride, 0.2% water, to municipal incineration/CH U kg 2.58406E-12 -1.61244E-12 4.1965E-121367 Uranium enriched 3.5% USEC U -- kg 2.40844E-12 -1.81241E-13 2.58968E-12
13 of 25
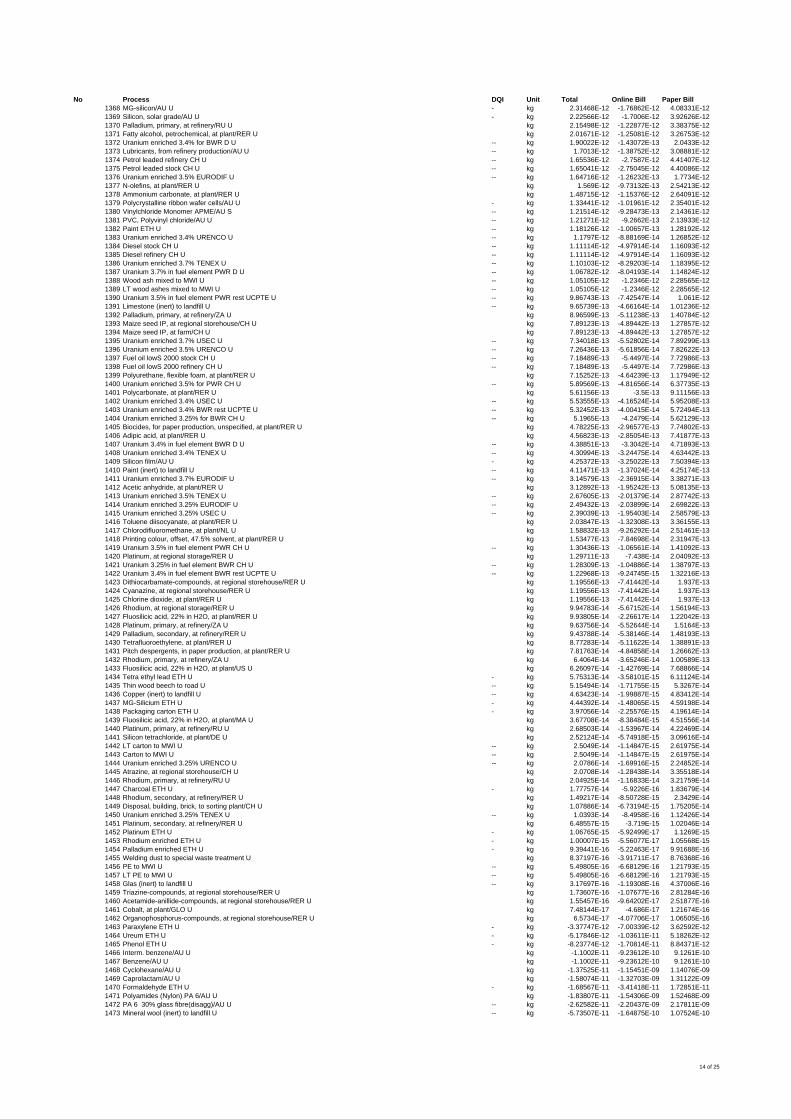
No Process DQI Unit Total Online Bill Paper Bill1368 MG-silicon/AU U - kg 2.31468E-12 -1.76862E-12 4.08331E-121369 Silicon, solar grade/AU U - kg 2.22566E-12 -1.7006E-12 3.92626E-121370 Palladium, primary, at refinery/RU U kg 2.15498E-12 -1.22877E-12 3.38375E-121371 Fatty alcohol, petrochemical, at plant/RER U kg 2.01671E-12 -1.25081E-12 3.26753E-121372 Uranium enriched 3.4% for BWR D U -- kg 1.90022E-12 -1.43072E-13 2.0433E-121373 Lubricants, from refinery production/AU U -- kg 1.7013E-12 -1.38752E-12 3.08881E-121374 Petrol leaded refinery CH U -- kg 1.65536E-12 -2.7587E-12 4.41407E-121375 Petrol leaded stock CH U -- kg 1.65041E-12 -2.75045E-12 4.40086E-121376 Uranium enriched 3.5% EURODIF U -- kg 1.64716E-12 -1.26232E-13 1.7734E-121377 N-olefins, at plant/RER U kg 1.569E-12 -9.73132E-13 2.54213E-121378 Ammonium carbonate, at plant/RER U kg 1.48715E-12 -1.15376E-12 2.64091E-121379 Polycrystalline ribbon wafer cells/AU U - kg 1.33441E-12 -1.01961E-12 2.35401E-121380 Vinylchloride Monomer APME/AU S -- kg 1.21514E-12 -9.28473E-13 2.14361E-121381 PVC, Polyvinyl chloride/AU U -- kg 1.21271E-12 -9.2662E-13 2.13933E-121382 Paint ETH U -- kg 1.18126E-12 -1.00657E-13 1.28192E-121383 Uranium enriched 3.4% URENCO U -- kg 1.1797E-12 -8.88169E-14 1.26852E-121384 Diesel stock CH U -- kg 1.11114E-12 -4.97914E-14 1.16093E-121385 Diesel refinery CH U -- kg 1.11114E-12 -4.97914E-14 1.16093E-121386 Uranium enriched 3.7% TENEX U -- kg 1.10103E-12 -8.29203E-14 1.18395E-121387 Uranium 3.7% in fuel element PWR D U -- kg 1.06782E-12 -8.04193E-14 1.14824E-121388 Wood ash mixed to MWI U -- kg 1.05105E-12 -1.2346E-12 2.28565E-121389 LT wood ashes mixed to MWI U -- kg 1.05105E-12 -1.2346E-12 2.28565E-121390 Uranium 3.5% in fuel element PWR rest UCPTE U -- kg 9.86743E-13 -7.42547E-14 1.061E-121391 Limestone (inert) to landfill U -- kg 9.65739E-13 -4.66164E-14 1.01236E-121392 Palladium, primary, at refinery/ZA U kg 8.96599E-13 -5.11238E-13 1.40784E-121393 Maize seed IP, at regional storehouse/CH U kg 7.89123E-13 -4.89442E-13 1.27857E-121394 Maize seed IP, at farm/CH U kg 7.89123E-13 -4.89442E-13 1.27857E-121395 Uranium enriched 3.7% USEC U -- kg 7.34018E-13 -5.52802E-14 7.89299E-131396 Uranium enriched 3.5% URENCO U -- kg 7.26436E-13 -5.61856E-14 7.82622E-131397 Fuel oil lowS 2000 stock CH U -- kg 7.18489E-13 -5.4497E-14 7.72986E-131398 Fuel oil lowS 2000 refinery CH U -- kg 7.18489E-13 -5.4497E-14 7.72986E-131399 Polyurethane, flexible foam, at plant/RER U kg 7.15252E-13 -4.64239E-13 1.17949E-121400 Uranium enriched 3.5% for PWR CH U -- kg 5.89569E-13 -4.81656E-14 6.37735E-131401 Polycarbonate, at plant/RER U kg 5.61156E-13 -3.5E-13 9.11156E-131402 Uranium enriched 3.4% USEC U -- kg 5.53555E-13 -4.16524E-14 5.95208E-131403 Uranium enriched 3.4% BWR rest UCPTE U -- kg 5.32452E-13 -4.00415E-14 5.72494E-131404 Uranium enriched 3.25% for BWR CH U -- kg 5.1965E-13 -4.2479E-14 5.62129E-131405 Biocides, for paper production, unspecified, at plant/RER U kg 4.78225E-13 -2.96577E-13 7.74802E-131406 Adipic acid, at plant/RER U kg 4.56823E-13 -2.85054E-13 7.41877E-131407 Uranium 3.4% in fuel element BWR D U -- kg 4.38851E-13 -3.3042E-14 4.71893E-131408 Uranium enriched 3.4% TENEX U -- kg 4.30994E-13 -3.24475E-14 4.63442E-131409 Silicon film/AU U - kg 4.25372E-13 -3.25022E-13 7.50394E-131410 Paint (inert) to landfill U -- kg 4.11471E-13 -1.37024E-14 4.25174E-131411 Uranium enriched 3.7% EURODIF U -- kg 3.14579E-13 -2.36915E-14 3.38271E-131412 Acetic anhydride, at plant/RER U kg 3.12892E-13 -1.95242E-13 5.08135E-131413 Uranium enriched 3.5% TENEX U -- kg 2.67605E-13 -2.01379E-14 2.87742E-131414 Uranium enriched 3.25% EURODIF U -- kg 2.49432E-13 -2.03899E-14 2.69822E-131415 Uranium enriched 3.25% USEC U -- kg 2.39039E-13 -1.95403E-14 2.58579E-131416 Toluene diisocyanate, at plant/RER U kg 2.03847E-13 -1.32308E-13 3.36155E-131417 Chlorodifluoromethane, at plant/NL U kg 1.58832E-13 -9.26292E-14 2.51461E-131418 Printing colour, offset, 47.5% solvent, at plant/RER U kg 1.53477E-13 -7.84698E-14 2.31947E-131419 Uranium 3.5% in fuel element PWR CH U -- kg 1.30436E-13 -1.06561E-14 1.41092E-131420 Platinum, at regional storage/RER U kg 1.29711E-13 -7.438E-14 2.04092E-131421 Uranium 3.25% in fuel element BWR CH U -- kg 1.28309E-13 -1.04886E-14 1.38797E-131422 Uranium 3.4% in fuel element BWR rest UCPTE U -- kg 1.22968E-13 -9.24745E-15 1.32216E-131423 Dithiocarbamate-compounds, at regional storehouse/RER U kg 1.19556E-13 -7.41442E-14 1.937E-131424 Cyanazine, at regional storehouse/RER U kg 1.19556E-13 -7.41442E-14 1.937E-131425 Chlorine dioxide, at plant/RER U kg 1.19556E-13 -7.41442E-14 1.937E-131426 Rhodium, at regional storage/RER U kg 9.94783E-14 -5.67152E-14 1.56194E-131427 Fluosilicic acid, 22% in H2O, at plant/RER U kg 9.93805E-14 -2.26617E-14 1.22042E-131428 Platinum, primary, at refinery/ZA U kg 9.63756E-14 -5.52644E-14 1.5164E-131429 Palladium, secondary, at refinery/RER U kg 9.43788E-14 -5.38146E-14 1.48193E-131430 Tetrafluoroethylene, at plant/RER U kg 8.77283E-14 -5.11622E-14 1.38891E-131431 Pitch despergents, in paper production, at plant/RER U kg 7.81763E-14 -4.84858E-14 1.26662E-131432 Rhodium, primary, at refinery/ZA U kg 6.4064E-14 -3.65246E-14 1.00589E-131433 Fluosilicic acid, 22% in H2O, at plant/US U kg 6.26097E-14 -1.42769E-14 7.68866E-141434 Tetra ethyl lead ETH U - kg 5.75313E-14 -3.58101E-15 6.11124E-141435 Thin wood beech to road U -- kg 5.15494E-14 -1.71755E-15 5.3267E-141436 Copper (inert) to landfill U -- kg 4.63423E-14 -1.99887E-15 4.83412E-141437 MG-Silicium ETH U - kg 4.44392E-14 -1.48065E-15 4.59198E-141438 Packaging carton ETH U - kg 3.97056E-14 -2.25576E-15 4.19614E-141439 Fluosilicic acid, 22% in H2O, at plant/MA U kg 3.67708E-14 -8.38484E-15 4.51556E-141440 Platinum, primary, at refinery/RU U kg 2.68503E-14 -1.53967E-14 4.22469E-141441 Silicon tetrachloride, at plant/DE U kg 2.52124E-14 -5.74918E-15 3.09616E-141442 LT carton to MWI U -- kg 2.5049E-14 -1.14847E-15 2.61975E-141443 Carton to MWI U -- kg 2.5049E-14 -1.14847E-15 2.61975E-141444 Uranium enriched 3.25% URENCO U -- kg 2.0786E-14 -1.69916E-15 2.24852E-141445 Atrazine, at regional storehouse/CH U kg 2.0708E-14 -1.28438E-14 3.35518E-141446 Rhodium, primary, at refinery/RU U kg 2.04925E-14 -1.16833E-14 3.21759E-141447 Charcoal ETH U - kg 1.77757E-14 -5.9226E-16 1.83679E-141448 Rhodium, secondary, at refinery/RER U kg 1.49217E-14 -8.50728E-15 2.3429E-141449 Disposal, building, brick, to sorting plant/CH U kg 1.07886E-14 -6.73194E-15 1.75205E-141450 Uranium enriched 3.25% TENEX U -- kg 1.0393E-14 -8.4958E-16 1.12426E-141451 Platinum, secondary, at refinery/RER U kg 6.48557E-15 -3.719E-15 1.02046E-141452 Platinum ETH U - kg 1.06765E-15 -5.92499E-17 1.1269E-151453 Rhodium enriched ETH U - kg 1.00007E-15 -5.56077E-17 1.05568E-151454 Palladium enriched ETH U - kg 9.39441E-16 -5.22463E-17 9.91688E-161455 Welding dust to special waste treatment U kg 8.37197E-16 -3.91711E-17 8.76368E-161456 PE to MWI U -- kg 5.49805E-16 -6.68129E-16 1.21793E-151457 LT PE to MWI U -- kg 5.49805E-16 -6.68129E-16 1.21793E-151458 Glas (inert) to landfill U -- kg 3.17697E-16 -1.19308E-16 4.37006E-161459 Triazine-compounds, at regional storehouse/RER U kg 1.73607E-16 -1.07677E-16 2.81284E-161460 Acetamide-anillide-compounds, at regional storehouse/RER U kg 1.55457E-16 -9.64202E-17 2.51877E-161461 Cobalt, at plant/GLO U kg 7.48144E-17 -4.686E-17 1.21674E-161462 Organophosphorus-compounds, at regional storehouse/RER U kg 6.5734E-17 -4.07706E-17 1.06505E-161463 Paraxylene ETH U - kg -3.37747E-12 -7.00339E-12 3.62592E-121464 Ureum ETH U - kg -5.17846E-12 -1.03611E-11 5.18262E-121465 Phenol ETH U - kg -8.23774E-12 -1.70814E-11 8.84371E-121466 Interm. benzene/AU U kg -1.1002E-11 -9.23612E-10 9.1261E-101467 Benzene/AU U kg -1.1002E-11 -9.23612E-10 9.1261E-101468 Cyclohexane/AU U kg -1.37525E-11 -1.15451E-09 1.14076E-091469 Caprolactam/AU U kg -1.58074E-11 -1.32703E-09 1.31122E-091470 Formaldehyde ETH U - kg -1.68567E-11 -3.41418E-11 1.72851E-111471 Polyamides (Nylon) PA 6/AU U kg -1.83807E-11 -1.54306E-09 1.52468E-091472 PA 6 30% glass fibre(disagg)/AU U -- kg -2.62582E-11 -2.20437E-09 2.17811E-091473 Mineral wool (inert) to landfill U -- kg -5.73507E-11 -1.64875E-10 1.07524E-10
14 of 25
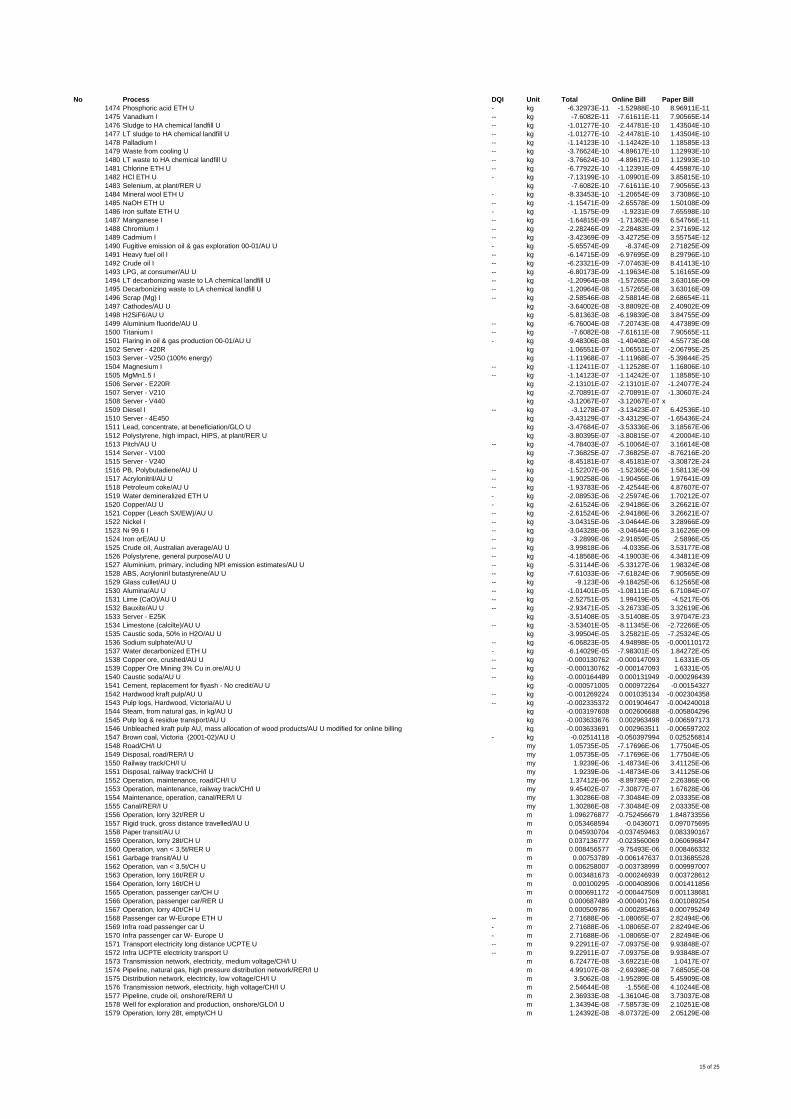
No Process DQI Unit Total Online Bill Paper Bill1474 Phosphoric acid ETH U - kg -6.32973E-11 -1.52988E-10 8.96911E-111475 Vanadium I -- kg -7.6082E-11 -7.61611E-11 7.90565E-141476 Sludge to HA chemical landfill U -- kg -1.01277E-10 -2.44781E-10 1.43504E-101477 LT sludge to HA chemical landfill U -- kg -1.01277E-10 -2.44781E-10 1.43504E-101478 Palladium I -- kg -1.14123E-10 -1.14242E-10 1.18585E-131479 Waste from cooling U -- kg -3.76624E-10 -4.89617E-10 1.12993E-101480 LT waste to HA chemical landfill U -- kg -3.76624E-10 -4.89617E-10 1.12993E-101481 Chlorine ETH U -- kg -6.77922E-10 -1.12391E-09 4.45987E-101482 HCl ETH U - kg -7.13199E-10 -1.09901E-09 3.85815E-101483 Selenium, at plant/RER U kg -7.6082E-10 -7.61611E-10 7.90565E-131484 Mineral wool ETH U - kg -8.33453E-10 -1.20654E-09 3.73086E-101485 NaOH ETH U -- kg -1.15471E-09 -2.65578E-09 1.50108E-091486 Iron sulfate ETH U - kg -1.1575E-09 -1.9231E-09 7.65598E-101487 Manganese I -- kg -1.64815E-09 -1.71362E-09 6.54766E-111488 Chromium I -- kg -2.28246E-09 -2.28483E-09 2.37169E-121489 Cadmium I -- kg -3.42369E-09 -3.42725E-09 3.55754E-121490 Fugitive emission oil & gas exploration 00-01/AU U - kg -5.65574E-09 -8.374E-09 2.71825E-091491 Heavy fuel oil I -- kg -6.14715E-09 -6.97695E-09 8.29796E-101492 Crude oil I -- kg -6.23321E-09 -7.07463E-09 8.41413E-101493 LPG, at consumer/AU U -- kg -6.80173E-09 -1.19634E-08 5.16165E-091494 LT decarbonizing waste to LA chemical landfill U -- kg -1.20964E-08 -1.57265E-08 3.63016E-091495 Decarbonizing waste to LA chemical landfill U -- kg -1.20964E-08 -1.57265E-08 3.63016E-091496 Scrap (Mg) I -- kg -2.58546E-08 -2.58814E-08 2.68654E-111497 Cathodes/AU U kg -3.64002E-08 -3.88092E-08 2.40902E-091498 H2SiF6/AU U kg -5.81363E-08 -6.19839E-08 3.84755E-091499 Aluminium fluoride/AU U -- kg -6.76004E-08 -7.20743E-08 4.47389E-091500 Titanium I -- kg -7.6082E-08 -7.61611E-08 7.90565E-111501 Flaring in oil & gas production 00-01/AU U - kg -9.48306E-08 -1.40408E-07 4.55773E-081502 Server - 420R kg -1.06551E-07 -1.06551E-07 -2.06795E-251503 Server - V250 (100% energy) kg -1.11968E-07 -1.11968E-07 -5.39844E-251504 Magnesium I -- kg -1.12411E-07 -1.12528E-07 1.16806E-101505 MgMn1.5 I -- kg -1.14123E-07 -1.14242E-07 1.18585E-101506 Server - E220R kg -2.13101E-07 -2.13101E-07 -1.24077E-241507 Server - V210 kg -2.70891E-07 -2.70891E-07 -1.30607E-241508 Server - V440 kg -3.12067E-07 -3.12067E-07 x1509 Diesel I -- kg -3.1278E-07 -3.13423E-07 6.42536E-101510 Server - 4E450 kg -3.43129E-07 -3.43129E-07 -1.65436E-241511 Lead, concentrate, at beneficiation/GLO U kg -3.47684E-07 -3.53336E-06 3.18567E-061512 Polystyrene, high impact, HIPS, at plant/RER U kg -3.80395E-07 -3.80815E-07 4.20004E-101513 Pitch/AU U -- kg -4.78403E-07 -5.10064E-07 3.16614E-081514 Server - V100 kg -7.36825E-07 -7.36825E-07 -8.76216E-201515 Server - V240 kg -8.45181E-07 -8.45181E-07 -3.30872E-241516 PB, Polybutadiene/AU U -- kg -1.52207E-06 -1.52365E-06 1.58113E-091517 Acrylonitril/AU U -- kg -1.90258E-06 -1.90456E-06 1.97641E-091518 Petroleum coke/AU U -- kg -1.93783E-06 -2.42544E-06 4.87607E-071519 Water demineralized ETH U - kg -2.08953E-06 -2.25974E-06 1.70212E-071520 Copper/AU U - kg -2.61524E-06 -2.94186E-06 3.26621E-071521 Copper (Leach SX/EW)/AU U -- kg -2.61524E-06 -2.94186E-06 3.26621E-071522 Nickel I -- kg -3.04315E-06 -3.04644E-06 3.28966E-091523 Ni 99.6 I -- kg -3.04328E-06 -3.04644E-06 3.16226E-091524 Iron orE/AU U -- kg -3.2899E-06 -2.91859E-05 2.5896E-051525 Crude oil, Australian average/AU U -- kg -3.99818E-06 -4.0335E-06 3.53177E-081526 Polystyrene, general purpose/AU U -- kg -4.18568E-06 -4.19003E-06 4.34811E-091527 Aluminium, primary, including NPI emission estimates/AU U -- kg -5.31144E-06 -5.33127E-06 1.98324E-081528 ABS, Acryloniril butastyrene/AU U -- kg -7.61033E-06 -7.61824E-06 7.90565E-091529 Glass cullet/AU U -- kg -9.123E-06 -9.18425E-06 6.12565E-081530 Alumina/AU U -- kg -1.01401E-05 -1.08111E-05 6.71084E-071531 Lime (CaO)/AU U -- kg -2.52751E-05 1.99419E-05 -4.5217E-051532 Bauxite/AU U -- kg -2.93471E-05 -3.26733E-05 3.32619E-061533 Server - E25K kg -3.51408E-05 -3.51408E-05 3.97047E-231534 Limestone (calcilte)/AU U -- kg -3.53401E-05 -8.11345E-06 -2.72266E-051535 Caustic soda, 50% in H2O/AU U kg -3.99504E-05 3.25821E-05 -7.25324E-051536 Sodium sulphate/AU U -- kg -6.06823E-05 4.94898E-05 -0.0001101721537 Water decarbonized ETH U - kg -6.14029E-05 -7.98301E-05 1.84272E-051538 Copper ore, crushed/AU U -- kg -0.000130762 -0.000147093 1.6331E-051539 Copper Ore Mining 3% Cu in ore/AU U -- kg -0.000130762 -0.000147093 1.6331E-051540 Caustic soda/AU U -- kg -0.000164489 0.000131949 -0.0002964391541 Cement, replacement for flyash - No credit/AU U kg -0.000571005 0.000972264 -0.001543271542 Hardwood kraft pulp/AU U -- kg -0.001269224 0.001035134 -0.0023043581543 Pulp logs, Hardwood, Victoria/AU U -- kg -0.002335372 0.001904647 -0.0042400181544 Steam, from natural gas, in kg/AU U kg -0.003197608 0.002606688 -0.0058042961545 Pulp log & residue transport/AU U kg -0.003633676 0.002963498 -0.0065971731546 Unbleached kraft pulp AU, mass allocation of wood products/AU U modified for online billing kg -0.003633691 0.002963511 -0.0065972021547 Brown coal, Victoria (2001-02)/AU U - kg -0.02514118 -0.050397994 0.0252568141548 Road/CH/I U my 1.05735E-05 -7.17696E-06 1.77504E-051549 Disposal, road/RER/I U my 1.05735E-05 -7.17696E-06 1.77504E-051550 Railway track/CH/I U my 1.9239E-06 -1.48734E-06 3.41125E-061551 Disposal, railway track/CH/I U my 1.9239E-06 -1.48734E-06 3.41125E-061552 Operation, maintenance, road/CH/I U my 1.37412E-06 -8.89739E-07 2.26386E-061553 Operation, maintenance, railway track/CH/I U my 9.45402E-07 -7.30877E-07 1.67628E-061554 Maintenance, operation, canal/RER/I U my 1.30286E-08 -7.30484E-09 2.03335E-081555 Canal/RER/I U my 1.30286E-08 -7.30484E-09 2.03335E-081556 Operation, lorry 32t/RER U m 1.096276877 -0.752456679 1.8487335561557 Rigid truck, gross distance travelled/AU U m 0.053468594 -0.0436071 0.0970756951558 Paper transit/AU U m 0.045930704 -0.037459463 0.0833901671559 Operation, lorry 28t/CH U m 0.037136777 -0.023560069 0.0606968471560 Operation, van < 3,5t/RER U m 0.008456577 -9.75493E-06 0.0084663321561 Garbage transit/AU U m 0.00753789 -0.006147637 0.0136855281562 Operation, van < 3,5t/CH U m 0.006258007 -0.003738999 0.0099970071563 Operation, lorry 16t/RER U m 0.003481673 -0.000246939 0.0037286121564 Operation, lorry 16t/CH U m 0.00100295 -0.000408906 0.0014118561565 Operation, passenger car/CH U m 0.000691172 -0.000447509 0.0011386811566 Operation, passenger car/RER U m 0.000687489 -0.000401766 0.0010892541567 Operation, lorry 40t/CH U m 0.000509786 -0.000285463 0.0007952491568 Passenger car W-Europe ETH U -- m 2.71688E-06 -1.08065E-07 2.82494E-061569 Infra road passenger car U - m 2.71688E-06 -1.08065E-07 2.82494E-061570 Infra passenger car W- Europe U - m 2.71688E-06 -1.08065E-07 2.82494E-061571 Transport electricity long distance UCPTE U -- m 9.22911E-07 -7.09375E-08 9.93848E-071572 Infra UCPTE electricity transport U -- m 9.22911E-07 -7.09375E-08 9.93848E-071573 Transmission network, electricity, medium voltage/CH/I U m 6.72477E-08 -3.69221E-08 1.0417E-071574 Pipeline, natural gas, high pressure distribution network/RER/I U m 4.99107E-08 -2.69398E-08 7.68505E-081575 Distribution network, electricity, low voltage/CH/I U m 3.5062E-08 -1.95289E-08 5.45909E-081576 Transmission network, electricity, high voltage/CH/I U m 2.54644E-08 -1.556E-08 4.10244E-081577 Pipeline, crude oil, onshore/RER/I U m 2.36933E-08 -1.36104E-08 3.73037E-081578 Well for exploration and production, onshore/GLO/I U m 1.34394E-08 -7.58573E-09 2.10251E-081579 Operation, lorry 28t, empty/CH U m 1.24392E-08 -8.07372E-09 2.05129E-08
15 of 25
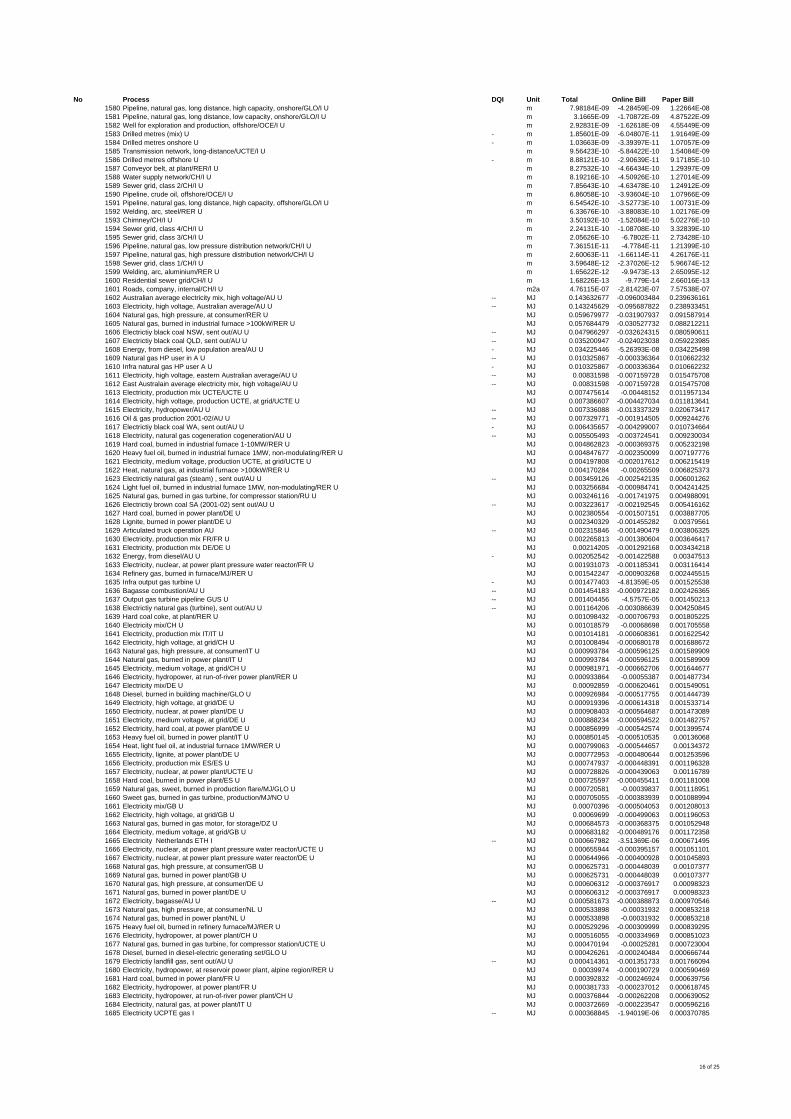
No Process DQI Unit Total Online Bill Paper Bill1580 Pipeline, natural gas, long distance, high capacity, onshore/GLO/I U m 7.98184E-09 -4.28459E-09 1.22664E-081581 Pipeline, natural gas, long distance, low capacity, onshore/GLO/I U m 3.1665E-09 -1.70872E-09 4.87522E-091582 Well for exploration and production, offshore/OCE/I U m 2.92831E-09 -1.62618E-09 4.55449E-091583 Drilled metres (mix) U - m 1.85601E-09 -6.04807E-11 1.91649E-091584 Drilled metres onshore U - m 1.03663E-09 -3.39397E-11 1.07057E-091585 Transmission network, long-distance/UCTE/I U m 9.56423E-10 -5.84422E-10 1.54084E-091586 Drilled metres offshore U - m 8.88121E-10 -2.90639E-11 9.17185E-101587 Conveyor belt, at plant/RER/I U m 8.27532E-10 -4.66434E-10 1.29397E-091588 Water supply network/CH/I U m 8.19216E-10 -4.50926E-10 1.27014E-091589 Sewer grid, class 2/CH/I U m 7.85643E-10 -4.63478E-10 1.24912E-091590 Pipeline, crude oil, offshore/OCE/I U m 6.86058E-10 -3.93604E-10 1.07966E-091591 Pipeline, natural gas, long distance, high capacity, offshore/GLO/I U m 6.54542E-10 -3.52773E-10 1.00731E-091592 Welding, arc, steel/RER U m 6.33676E-10 -3.88083E-10 1.02176E-091593 Chimney/CH/I U m 3.50192E-10 -1.52084E-10 5.02276E-101594 Sewer grid, class 4/CH/I U m 2.24131E-10 -1.08708E-10 3.32839E-101595 Sewer grid, class 3/CH/I U m 2.05626E-10 -6.7802E-11 2.73428E-101596 Pipeline, natural gas, low pressure distribution network/CH/I U m 7.36151E-11 -4.7784E-11 1.21399E-101597 Pipeline, natural gas, high pressure distribution network/CH/I U m 2.60063E-11 -1.66114E-11 4.26176E-111598 Sewer grid, class 1/CH/I U m 3.59648E-12 -2.37026E-12 5.96674E-121599 Welding, arc, aluminium/RER U m 1.65622E-12 -9.9473E-13 2.65095E-121600 Residential sewer grid/CH/I U m 1.68226E-13 -9.779E-14 2.66016E-131601 Roads, company, internal/CH/I U m2a 4.76115E-07 -2.81423E-07 7.57538E-071602 Australian average electricity mix, high voltage/AU U -- MJ 0.143632677 -0.096003484 0.2396361611603 Electricity, high voltage, Australian average/AU U -- MJ 0.143245629 -0.095687822 0.2389334511604 Natural gas, high pressure, at consumer/RER U MJ 0.059679977 -0.031907937 0.0915879141605 Natural gas, burned in industrial furnace >100kW/RER U MJ 0.057684479 -0.030527732 0.0882122111606 Electrictiy black coal NSW, sent out/AU U -- MJ 0.047966297 -0.032624315 0.0805906111607 Electrictiy black coal QLD, sent out/AU U -- MJ 0.035200947 -0.024023038 0.0592239851608 Energy, from diesel, low population area/AU U - MJ 0.034225446 -5.26393E-08 0.0342254981609 Natural gas HP user in A U -- MJ 0.010325867 -0.000336364 0.0106622321610 Infra natural gas HP user A U - MJ 0.010325867 -0.000336364 0.0106622321611 Electricity, high voltage, eastern Australian average/AU U -- MJ 0.00831598 -0.007159728 0.0154757081612 East Australain average electricity mix, high voltage/AU U -- MJ 0.00831598 -0.007159728 0.0154757081613 Electricity, production mix UCTE/UCTE U MJ 0.007475614 -0.00448152 0.0119571341614 Electricity, high voltage, production UCTE, at grid/UCTE U MJ 0.007386607 -0.004427034 0.0118136411615 Electricity, hydropower/AU U -- MJ 0.007336088 -0.013337329 0.0206734171616 Oil & gas production 2001-02/AU U -- MJ 0.007329771 -0.001914505 0.0092442761617 Electrictiy black coal WA, sent out/AU U - MJ 0.006435657 -0.004299007 0.0107346641618 Electricity, natural gas cogeneration cogeneration/AU U -- MJ 0.005505493 -0.003724541 0.0092300341619 Hard coal, burned in industrial furnace 1-10MW/RER U MJ 0.004862823 -0.000369375 0.0052321981620 Heavy fuel oil, burned in industrial furnace 1MW, non-modulating/RER U MJ 0.004847677 -0.002350099 0.0071977761621 Electricity, medium voltage, production UCTE, at grid/UCTE U MJ 0.004197808 -0.002017612 0.0062154191622 Heat, natural gas, at industrial furnace >100kW/RER U MJ 0.004170284 -0.00265509 0.0068253731623 Electrictiy natural gas (steam) , sent out/AU U -- MJ 0.003459126 -0.002542135 0.0060012621624 Light fuel oil, burned in industrial furnace 1MW, non-modulating/RER U MJ 0.003256684 -0.000984741 0.0042414251625 Natural gas, burned in gas turbine, for compressor station/RU U MJ 0.003246116 -0.001741975 0.0049880911626 Electrictiy brown coal SA (2001-02) sent out/AU U -- MJ 0.003223617 -0.002192545 0.0054161621627 Hard coal, burned in power plant/DE U MJ 0.002380554 -0.001507151 0.0038877051628 Lignite, burned in power plant/DE U MJ 0.002340329 -0.001455282 0.003795611629 Articulated truck operation AU -- MJ 0.002315846 -0.001490479 0.0038063251630 Electricity, production mix FR/FR U MJ 0.002265813 -0.001380604 0.0036464171631 Electricity, production mix DE/DE U MJ 0.00214205 -0.001292168 0.0034342181632 Energy, from diesel/AU U - MJ 0.002052542 -0.001422588 0.003475131633 Electricity, nuclear, at power plant pressure water reactor/FR U MJ 0.001931073 -0.001185341 0.0031164141634 Refinery gas, burned in furnace/MJ/RER U MJ 0.001542247 -0.000903268 0.0024455151635 Infra output gas turbine U - MJ 0.001477403 -4.81359E-05 0.0015255381636 Bagasse combustion/AU U -- MJ 0.001454183 -0.000972182 0.0024263651637 Output gas turbine pipeline GUS U -- MJ 0.001404456 -4.5757E-05 0.0014502131638 Electrictiy natural gas (turbine), sent out/AU U -- MJ 0.001164206 -0.003086639 0.0042508451639 Hard coal coke, at plant/RER U MJ 0.001098432 -0.000706793 0.0018052251640 Electricity mix/CH U MJ 0.001018579 -0.00068698 0.0017055581641 Electricity, production mix IT/IT U MJ 0.001014181 -0.000608361 0.0016225421642 Electricity, high voltage, at grid/CH U MJ 0.001008494 -0.000680178 0.0016886721643 Natural gas, high pressure, at consumer/IT U MJ 0.000993784 -0.000596125 0.0015899091644 Natural gas, burned in power plant/IT U MJ 0.000993784 -0.000596125 0.0015899091645 Electricity, medium voltage, at grid/CH U MJ 0.000981971 -0.000662706 0.0016446771646 Electricity, hydropower, at run-of-river power plant/RER U MJ 0.000933864 -0.00055387 0.0014877341647 Electricity mix/DE U MJ 0.00092859 -0.000620461 0.0015490511648 Diesel, burned in building machine/GLO U MJ 0.000926984 -0.000517755 0.0014447391649 Electricity, high voltage, at grid/DE U MJ 0.000919396 -0.000614318 0.0015337141650 Electricity, nuclear, at power plant/DE U MJ 0.000908403 -0.000564687 0.0014730891651 Electricity, medium voltage, at grid/DE U MJ 0.000888234 -0.000594522 0.0014827571652 Electricity, hard coal, at power plant/DE U MJ 0.000856999 -0.000542574 0.0013995741653 Heavy fuel oil, burned in power plant/IT U MJ 0.000850145 -0.000510535 0.001360681654 Heat, light fuel oil, at industrial furnace 1MW/RER U MJ 0.000799063 -0.000544657 0.001343721655 Electricity, lignite, at power plant/DE U MJ 0.000772953 -0.000480644 0.0012535961656 Electricity, production mix ES/ES U MJ 0.000747937 -0.000448391 0.0011963281657 Electricity, nuclear, at power plant/UCTE U MJ 0.000728826 -0.000439063 0.001167891658 Hard coal, burned in power plant/ES U MJ 0.000725597 -0.000455411 0.0011810081659 Natural gas, sweet, burned in production flare/MJ/GLO U MJ 0.000720581 -0.00039837 0.0011189511660 Sweet gas, burned in gas turbine, production/MJ/NO U MJ 0.000705055 -0.000383939 0.0010889941661 Electricity mix/GB U MJ 0.00070396 -0.000504053 0.0012080131662 Electricity, high voltage, at grid/GB U MJ 0.00069699 -0.000499063 0.0011960531663 Natural gas, burned in gas motor, for storage/DZ U MJ 0.000684573 -0.000368375 0.0010529481664 Electricity, medium voltage, at grid/GB U MJ 0.000683182 -0.000489176 0.0011723581665 Electricity Netherlands ETH I -- MJ 0.000667982 -3.51369E-06 0.0006714951666 Electricity, nuclear, at power plant pressure water reactor/UCTE U MJ 0.000655944 -0.000395157 0.0010511011667 Electricity, nuclear, at power plant pressure water reactor/DE U MJ 0.000644966 -0.000400928 0.0010458931668 Natural gas, high pressure, at consumer/GB U MJ 0.000625731 -0.000448039 0.001073771669 Natural gas, burned in power plant/GB U MJ 0.000625731 -0.000448039 0.001073771670 Natural gas, high pressure, at consumer/DE U MJ 0.000606312 -0.000376917 0.000983231671 Natural gas, burned in power plant/DE U MJ 0.000606312 -0.000376917 0.000983231672 Electricity, bagasse/AU U -- MJ 0.000581673 -0.000388873 0.0009705461673 Natural gas, high pressure, at consumer/NL U MJ 0.000533898 -0.00031932 0.0008532181674 Natural gas, burned in power plant/NL U MJ 0.000533898 -0.00031932 0.0008532181675 Heavy fuel oil, burned in refinery furnace/MJ/RER U MJ 0.000529296 -0.000309999 0.0008392951676 Electricity, hydropower, at power plant/CH U MJ 0.000516055 -0.000334969 0.0008510231677 Natural gas, burned in gas turbine, for compressor station/UCTE U MJ 0.000470194 -0.00025281 0.0007230041678 Diesel, burned in diesel-electric generating set/GLO U MJ 0.000426261 -0.000240484 0.0006667441679 Electrictiy landfill gas, sent out/AU U -- MJ 0.000414361 -0.001351733 0.0017660941680 Electricity, hydropower, at reservoir power plant, alpine region/RER U MJ 0.00039974 -0.000190729 0.0005904691681 Hard coal, burned in power plant/FR U MJ 0.000392832 -0.000246924 0.0006397561682 Electricity, hydropower, at power plant/FR U MJ 0.000381733 -0.000237012 0.0006187451683 Electricity, hydropower, at run-of-river power plant/CH U MJ 0.000376844 -0.000262208 0.0006390521684 Electricity, natural gas, at power plant/IT U MJ 0.000372669 -0.000223547 0.0005962161685 Electricity UCPTE gas I -- MJ 0.000368845 -1.94019E-06 0.000370785
16 of 25
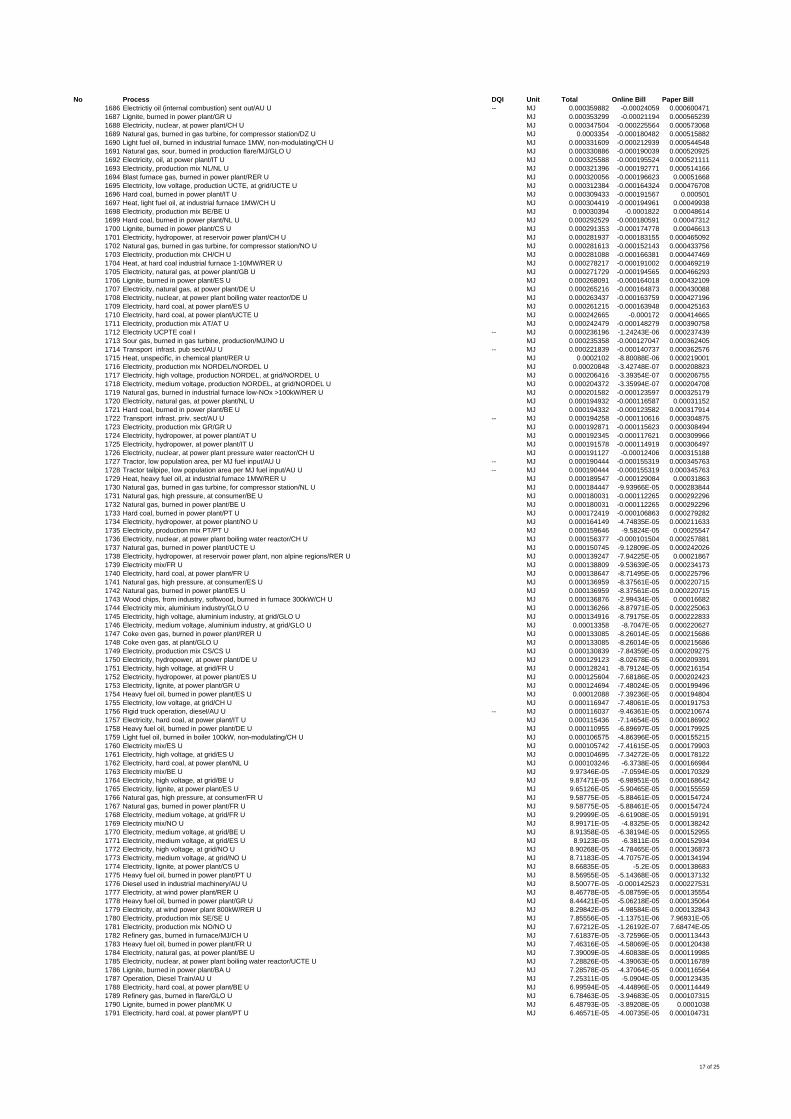
No Process DQI Unit Total Online Bill Paper Bill1686 Electrictiy oil (internal combustion) sent out/AU U -- MJ 0.000359882 -0.00024059 0.0006004711687 Lignite, burned in power plant/GR U MJ 0.000353299 -0.00021194 0.0005652391688 Electricity, nuclear, at power plant/CH U MJ 0.000347504 -0.000225564 0.0005730681689 Natural gas, burned in gas turbine, for compressor station/DZ U MJ 0.0003354 -0.000180482 0.0005158821690 Light fuel oil, burned in industrial furnace 1MW, non-modulating/CH U MJ 0.000331609 -0.000212939 0.0005445481691 Natural gas, sour, burned in production flare/MJ/GLO U MJ 0.000330886 -0.000190039 0.0005209251692 Electricity, oil, at power plant/IT U MJ 0.000325588 -0.000195524 0.0005211111693 Electricity, production mix NL/NL U MJ 0.000321396 -0.000192771 0.0005141661694 Blast furnace gas, burned in power plant/RER U MJ 0.000320056 -0.000196623 0.000516681695 Electricity, low voltage, production UCTE, at grid/UCTE U MJ 0.000312384 -0.000164324 0.0004767081696 Hard coal, burned in power plant/IT U MJ 0.000309433 -0.000191567 0.0005011697 Heat, light fuel oil, at industrial furnace 1MW/CH U MJ 0.000304419 -0.000194961 0.000499381698 Electricity, production mix BE/BE U MJ 0.00030394 -0.0001822 0.000486141699 Hard coal, burned in power plant/NL U MJ 0.000292529 -0.000180591 0.000473121700 Lignite, burned in power plant/CS U MJ 0.000291353 -0.000174778 0.000466131701 Electricity, hydropower, at reservoir power plant/CH U MJ 0.000281937 -0.000183155 0.0004650921702 Natural gas, burned in gas turbine, for compressor station/NO U MJ 0.000281613 -0.000152143 0.0004337561703 Electricity, production mix CH/CH U MJ 0.000281088 -0.000166381 0.0004474691704 Heat, at hard coal industrial furnace 1-10MW/RER U MJ 0.000278217 -0.000191002 0.0004692191705 Electricity, natural gas, at power plant/GB U MJ 0.000271729 -0.000194565 0.0004662931706 Lignite, burned in power plant/ES U MJ 0.000268091 -0.000164018 0.0004321091707 Electricity, natural gas, at power plant/DE U MJ 0.000265216 -0.000164873 0.0004300881708 Electricity, nuclear, at power plant boiling water reactor/DE U MJ 0.000263437 -0.000163759 0.0004271961709 Electricity, hard coal, at power plant/ES U MJ 0.000261215 -0.000163948 0.0004251631710 Electricity, hard coal, at power plant/UCTE U MJ 0.000242665 -0.000172 0.0004146651711 Electricity, production mix AT/AT U MJ 0.000242479 -0.000148279 0.0003907581712 Electricity UCPTE coal I -- MJ 0.000236196 -1.24243E-06 0.0002374391713 Sour gas, burned in gas turbine, production/MJ/NO U MJ 0.000235358 -0.000127047 0.0003624051714 Transport infrast. pub sect/AU U -- MJ 0.000221839 -0.000140737 0.0003625761715 Heat, unspecific, in chemical plant/RER U MJ 0.0002102 -8.80088E-06 0.0002190011716 Electricity, production mix NORDEL/NORDEL U MJ 0.00020848 -3.42748E-07 0.0002088231717 Electricity, high voltage, production NORDEL, at grid/NORDEL U MJ 0.000206416 -3.39354E-07 0.0002067551718 Electricity, medium voltage, production NORDEL, at grid/NORDEL U MJ 0.000204372 -3.35994E-07 0.0002047081719 Natural gas, burned in industrial furnace low-NOx >100kW/RER U MJ 0.000201582 -0.000123597 0.0003251791720 Electricity, natural gas, at power plant/NL U MJ 0.000194932 -0.000116587 0.000311521721 Hard coal, burned in power plant/BE U MJ 0.000194332 -0.000123582 0.0003179141722 Transport infrast. priv. sect/AU U -- MJ 0.000194258 -0.000110616 0.0003048751723 Electricity, production mix GR/GR U MJ 0.000192871 -0.000115623 0.0003084941724 Electricity, hydropower, at power plant/AT U MJ 0.000192345 -0.000117621 0.0003099661725 Electricity, hydropower, at power plant/IT U MJ 0.000191578 -0.000114919 0.0003064971726 Electricity, nuclear, at power plant pressure water reactor/CH U MJ 0.000191127 -0.00012406 0.0003151881727 Tractor, low population area, per MJ fuel input/AU U -- MJ 0.000190444 -0.000155319 0.0003457631728 Tractor tailpipe, low population area per MJ fuel input/AU U -- MJ 0.000190444 -0.000155319 0.0003457631729 Heat, heavy fuel oil, at industrial furnace 1MW/RER U MJ 0.000189547 -0.000129084 0.000318631730 Natural gas, burned in gas turbine, for compressor station/NL U MJ 0.000184447 -9.93966E-05 0.0002838441731 Natural gas, high pressure, at consumer/BE U MJ 0.000180031 -0.000112265 0.0002922961732 Natural gas, burned in power plant/BE U MJ 0.000180031 -0.000112265 0.0002922961733 Hard coal, burned in power plant/PT U MJ 0.000172419 -0.000106863 0.0002792821734 Electricity, hydropower, at power plant/NO U MJ 0.000164149 -4.74835E-05 0.0002116331735 Electricity, production mix PT/PT U MJ 0.000159646 -9.5824E-05 0.000255471736 Electricity, nuclear, at power plant boiling water reactor/CH U MJ 0.000156377 -0.000101504 0.0002578811737 Natural gas, burned in power plant/UCTE U MJ 0.000150745 -9.12809E-05 0.0002420261738 Electricity, hydropower, at reservoir power plant, non alpine regions/RER U MJ 0.000139247 -7.94225E-05 0.000218671739 Electricity mix/FR U MJ 0.000138809 -9.53639E-05 0.0002341731740 Electricity, hard coal, at power plant/FR U MJ 0.000138647 -8.71495E-05 0.0002257961741 Natural gas, high pressure, at consumer/ES U MJ 0.000136959 -8.37561E-05 0.0002207151742 Natural gas, burned in power plant/ES U MJ 0.000136959 -8.37561E-05 0.0002207151743 Wood chips, from industry, softwood, burned in furnace 300kW/CH U MJ 0.000136876 -2.99434E-05 0.000166821744 Electricity mix, aluminium industry/GLO U MJ 0.000136266 -8.87971E-05 0.0002250631745 Electricity, high voltage, aluminium industry, at grid/GLO U MJ 0.000134916 -8.79175E-05 0.0002228331746 Electricity, medium voltage, aluminium industry, at grid/GLO U MJ 0.00013358 -8.7047E-05 0.0002206271747 Coke oven gas, burned in power plant/RER U MJ 0.000133085 -8.26014E-05 0.0002156861748 Coke oven gas, at plant/GLO U MJ 0.000133085 -8.26014E-05 0.0002156861749 Electricity, production mix CS/CS U MJ 0.000130839 -7.84359E-05 0.0002092751750 Electricity, hydropower, at power plant/DE U MJ 0.000129123 -8.02678E-05 0.0002093911751 Electricity, high voltage, at grid/FR U MJ 0.000128241 -8.79124E-05 0.0002161541752 Electricity, hydropower, at power plant/ES U MJ 0.000125604 -7.68186E-05 0.0002024231753 Electricity, lignite, at power plant/GR U MJ 0.000124694 -7.48024E-05 0.0001994961754 Heavy fuel oil, burned in power plant/ES U MJ 0.00012088 -7.39236E-05 0.0001948041755 Electricity, low voltage, at grid/CH U MJ 0.000116947 -7.48061E-05 0.0001917531756 Rigid truck operation, diesel/AU U -- MJ 0.000116037 -9.46361E-05 0.0002106741757 Electricity, hard coal, at power plant/IT U MJ 0.000115436 -7.14654E-05 0.0001869021758 Heavy fuel oil, burned in power plant/DE U MJ 0.000110955 -6.89697E-05 0.0001799251759 Light fuel oil, burned in boiler 100kW, non-modulating/CH U MJ 0.000106575 -4.86396E-05 0.0001552151760 Electricity mix/ES U MJ 0.000105742 -7.41615E-05 0.0001799031761 Electricity, high voltage, at grid/ES U MJ 0.000104695 -7.34272E-05 0.0001781221762 Electricity, hard coal, at power plant/NL U MJ 0.000103246 -6.3738E-05 0.0001669841763 Electricity mix/BE U MJ 9.97346E-05 -7.0594E-05 0.0001703291764 Electricity, high voltage, at grid/BE U MJ 9.87471E-05 -6.98951E-05 0.0001686421765 Electricity, lignite, at power plant/ES U MJ 9.65126E-05 -5.90465E-05 0.0001555591766 Natural gas, high pressure, at consumer/FR U MJ 9.58775E-05 -5.88461E-05 0.0001547241767 Natural gas, burned in power plant/FR U MJ 9.58775E-05 -5.88461E-05 0.0001547241768 Electricity, medium voltage, at grid/FR U MJ 9.29999E-05 -6.61908E-05 0.0001591911769 Electricity mix/NO U MJ 8.99171E-05 -4.8325E-05 0.0001382421770 Electricity, medium voltage, at grid/BE U MJ 8.91358E-05 -6.38194E-05 0.0001529551771 Electricity, medium voltage, at grid/ES U MJ 8.9123E-05 -6.3811E-05 0.0001529341772 Electricity, high voltage, at grid/NO U MJ 8.90268E-05 -4.78465E-05 0.0001368731773 Electricity, medium voltage, at grid/NO U MJ 8.71183E-05 -4.70757E-05 0.0001341941774 Electricity, lignite, at power plant/CS U MJ 8.66835E-05 -5.2E-05 0.0001386831775 Heavy fuel oil, burned in power plant/PT U MJ 8.56955E-05 -5.14368E-05 0.0001371321776 Diesel used in industrial machinery/AU U MJ 8.50077E-05 -0.000142523 0.0002275311777 Electricity, at wind power plant/RER U MJ 8.46778E-05 -5.08759E-05 0.0001355541778 Heavy fuel oil, burned in power plant/GR U MJ 8.44421E-05 -5.06218E-05 0.0001350641779 Electricity, at wind power plant 800kW/RER U MJ 8.29842E-05 -4.98584E-05 0.0001328431780 Electricity, production mix SE/SE U MJ 7.85556E-05 -1.13751E-06 7.96931E-051781 Electricity, production mix NO/NO U MJ 7.67212E-05 -1.26192E-07 7.68474E-051782 Refinery gas, burned in furnace/MJ/CH U MJ 7.61837E-05 -3.72596E-05 0.0001134431783 Heavy fuel oil, burned in power plant/FR U MJ 7.46316E-05 -4.58069E-05 0.0001204381784 Electricity, natural gas, at power plant/BE U MJ 7.39009E-05 -4.60838E-05 0.0001199851785 Electricity, nuclear, at power plant boiling water reactor/UCTE U MJ 7.28826E-05 -4.39063E-05 0.0001167891786 Lignite, burned in power plant/BA U MJ 7.28578E-05 -4.37064E-05 0.0001165641787 Operation, Diesel Train/AU U MJ 7.25311E-05 -5.0904E-05 0.0001234351788 Electricity, hard coal, at power plant/BE U MJ 6.99594E-05 -4.44896E-05 0.0001144491789 Refinery gas, burned in flare/GLO U MJ 6.78463E-05 -3.94683E-05 0.0001073151790 Lignite, burned in power plant/MK U MJ 6.48793E-05 -3.89208E-05 0.00010381791 Electricity, hard coal, at power plant/PT U MJ 6.46571E-05 -4.00735E-05 0.000104731
17 of 25
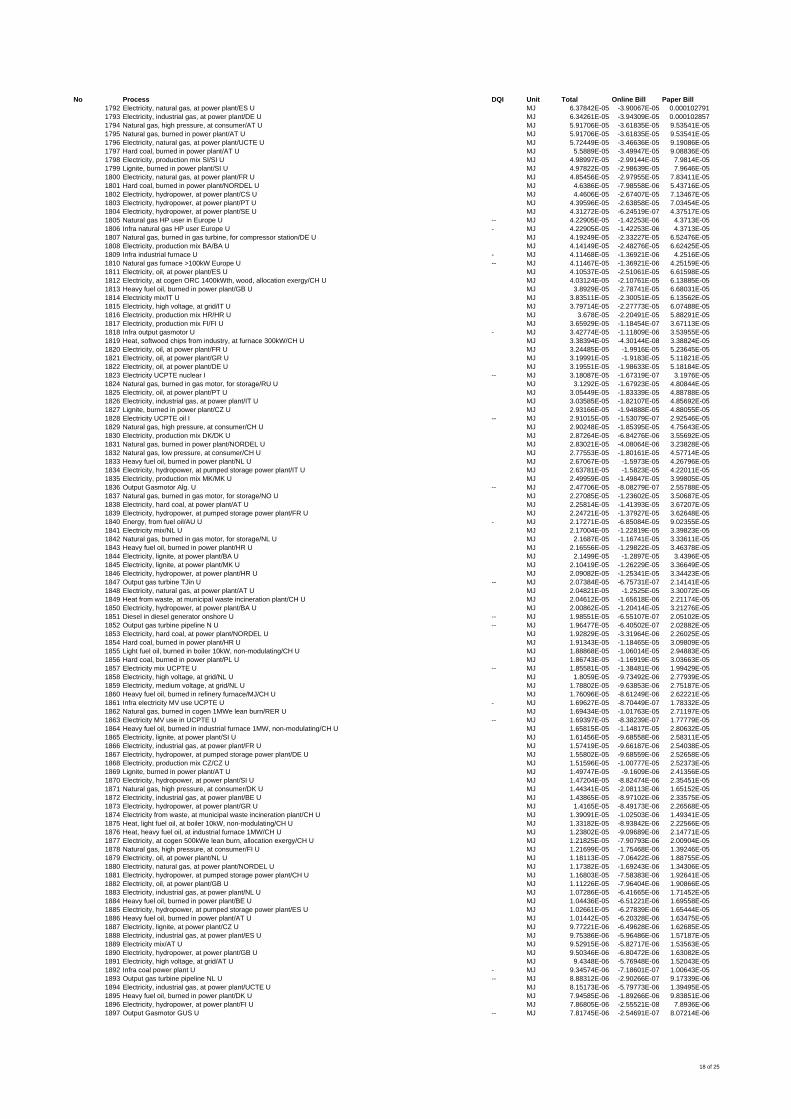
No Process DQI Unit Total Online Bill Paper Bill1792 Electricity, natural gas, at power plant/ES U MJ 6.37842E-05 -3.90067E-05 0.0001027911793 Electricity, industrial gas, at power plant/DE U MJ 6.34261E-05 -3.94309E-05 0.0001028571794 Natural gas, high pressure, at consumer/AT U MJ 5.91706E-05 -3.61835E-05 9.53541E-051795 Natural gas, burned in power plant/AT U MJ 5.91706E-05 -3.61835E-05 9.53541E-051796 Electricity, natural gas, at power plant/UCTE U MJ 5.72449E-05 -3.46636E-05 9.19086E-051797 Hard coal, burned in power plant/AT U MJ 5.5889E-05 -3.49947E-05 9.08836E-051798 Electricity, production mix SI/SI U MJ 4.98997E-05 -2.99144E-05 7.9814E-051799 Lignite, burned in power plant/SI U MJ 4.97822E-05 -2.98639E-05 7.9646E-051800 Electricity, natural gas, at power plant/FR U MJ 4.85456E-05 -2.97955E-05 7.83411E-051801 Hard coal, burned in power plant/NORDEL U MJ 4.6386E-05 -7.98558E-06 5.43716E-051802 Electricity, hydropower, at power plant/CS U MJ 4.4606E-05 -2.67407E-05 7.13467E-051803 Electricity, hydropower, at power plant/PT U MJ 4.39596E-05 -2.63858E-05 7.03454E-051804 Electricity, hydropower, at power plant/SE U MJ 4.31272E-05 -6.24519E-07 4.37517E-051805 Natural gas HP user in Europe U -- MJ 4.22905E-05 -1.42253E-06 4.3713E-051806 Infra natural gas HP user Europe U - MJ 4.22905E-05 -1.42253E-06 4.3713E-051807 Natural gas, burned in gas turbine, for compressor station/DE U MJ 4.19249E-05 -2.33227E-05 6.52476E-051808 Electricity, production mix BA/BA U MJ 4.14149E-05 -2.48276E-05 6.62425E-051809 Infra industrial furnace U - MJ 4.11468E-05 -1.36921E-06 4.2516E-051810 Natural gas furnace >100kW Europe U -- MJ 4.11467E-05 -1.36921E-06 4.25159E-051811 Electricity, oil, at power plant/ES U MJ 4.10537E-05 -2.51061E-05 6.61598E-051812 Electricity, at cogen ORC 1400kWth, wood, allocation exergy/CH U MJ 4.03124E-05 -2.10761E-05 6.13885E-051813 Heavy fuel oil, burned in power plant/GB U MJ 3.8929E-05 -2.78741E-05 6.68031E-051814 Electricity mix/IT U MJ 3.83511E-05 -2.30051E-05 6.13562E-051815 Electricity, high voltage, at grid/IT U MJ 3.79714E-05 -2.27773E-05 6.07488E-051816 Electricity, production mix HR/HR U MJ 3.678E-05 -2.20491E-05 5.88291E-051817 Electricity, production mix FI/FI U MJ 3.65929E-05 -1.18454E-07 3.67113E-051818 Infra output gasmotor U - MJ 3.42774E-05 -1.11809E-06 3.53955E-051819 Heat, softwood chips from industry, at furnace 300kW/CH U MJ 3.38394E-05 -4.30144E-08 3.38824E-051820 Electricity, oil, at power plant/FR U MJ 3.24485E-05 -1.9916E-05 5.23645E-051821 Electricity, oil, at power plant/GR U MJ 3.19991E-05 -1.9183E-05 5.11821E-051822 Electricity, oil, at power plant/DE U MJ 3.19551E-05 -1.98633E-05 5.18184E-051823 Electricity UCPTE nuclear I -- MJ 3.18087E-05 -1.67319E-07 3.1976E-051824 Natural gas, burned in gas motor, for storage/RU U MJ 3.1292E-05 -1.67923E-05 4.80844E-051825 Electricity, oil, at power plant/PT U MJ 3.05449E-05 -1.83339E-05 4.88788E-051826 Electricity, industrial gas, at power plant/IT U MJ 3.03585E-05 -1.82107E-05 4.85692E-051827 Lignite, burned in power plant/CZ U MJ 2.93166E-05 -1.94888E-05 4.88055E-051828 Electricity UCPTE oil I -- MJ 2.91015E-05 -1.53079E-07 2.92546E-051829 Natural gas, high pressure, at consumer/CH U MJ 2.90248E-05 -1.85395E-05 4.75643E-051830 Electricity, production mix DK/DK U MJ 2.87264E-05 -6.84276E-06 3.55692E-051831 Natural gas, burned in power plant/NORDEL U MJ 2.83021E-05 -4.08064E-06 3.23828E-051832 Natural gas, low pressure, at consumer/CH U MJ 2.77553E-05 -1.80161E-05 4.57714E-051833 Heavy fuel oil, burned in power plant/NL U MJ 2.67067E-05 -1.5973E-05 4.26796E-051834 Electricity, hydropower, at pumped storage power plant/IT U MJ 2.63781E-05 -1.5823E-05 4.22011E-051835 Electricity, production mix MK/MK U MJ 2.49959E-05 -1.49847E-05 3.99805E-051836 Output Gasmotor Alg. U -- MJ 2.47706E-05 -8.08279E-07 2.55788E-051837 Natural gas, burned in gas motor, for storage/NO U MJ 2.27085E-05 -1.23602E-05 3.50687E-051838 Electricity, hard coal, at power plant/AT U MJ 2.25814E-05 -1.41393E-05 3.67207E-051839 Electricity, hydropower, at pumped storage power plant/FR U MJ 2.24721E-05 -1.37927E-05 3.62648E-051840 Energy, from fuel oil/AU U - MJ 2.17271E-05 -6.85084E-05 9.02355E-051841 Electricity mix/NL U MJ 2.17004E-05 -1.22819E-05 3.39823E-051842 Natural gas, burned in gas motor, for storage/NL U MJ 2.1687E-05 -1.16741E-05 3.33611E-051843 Heavy fuel oil, burned in power plant/HR U MJ 2.16556E-05 -1.29822E-05 3.46378E-051844 Electricity, lignite, at power plant/BA U MJ 2.1499E-05 -1.2897E-05 3.4396E-051845 Electricity, lignite, at power plant/MK U MJ 2.10419E-05 -1.26229E-05 3.36649E-051846 Electricity, hydropower, at power plant/HR U MJ 2.09082E-05 -1.25341E-05 3.34423E-051847 Output gas turbine TJin U -- MJ 2.07384E-05 -6.75731E-07 2.14141E-051848 Electricity, natural gas, at power plant/AT U MJ 2.04821E-05 -1.2525E-05 3.30072E-051849 Heat from waste, at municipal waste incineration plant/CH U MJ 2.04612E-05 -1.65618E-06 2.21174E-051850 Electricity, hydropower, at power plant/BA U MJ 2.00862E-05 -1.20414E-05 3.21276E-051851 Diesel in diesel generator onshore U -- MJ 1.98551E-05 -6.55107E-07 2.05102E-051852 Output gas turbine pipeline N U -- MJ 1.96477E-05 -6.40502E-07 2.02882E-051853 Electricity, hard coal, at power plant/NORDEL U MJ 1.92829E-05 -3.31964E-06 2.26025E-051854 Hard coal, burned in power plant/HR U MJ 1.91343E-05 -1.18465E-05 3.09809E-051855 Light fuel oil, burned in boiler 10kW, non-modulating/CH U MJ 1.88868E-05 -1.06014E-05 2.94883E-051856 Hard coal, burned in power plant/PL U MJ 1.86743E-05 -1.16919E-05 3.03663E-051857 Electricity mix UCPTE U -- MJ 1.85581E-05 -1.38481E-06 1.99429E-051858 Electricity, high voltage, at grid/NL U MJ 1.8059E-05 -9.73492E-06 2.77939E-051859 Electricity, medium voltage, at grid/NL U MJ 1.78802E-05 -9.63853E-06 2.75187E-051860 Heavy fuel oil, burned in refinery furnace/MJ/CH U MJ 1.76096E-05 -8.61249E-06 2.62221E-051861 Infra electricity MV use UCPTE U - MJ 1.69627E-05 -8.70449E-07 1.78332E-051862 Natural gas, burned in cogen 1MWe lean burn/RER U MJ 1.69434E-05 -1.01763E-05 2.71197E-051863 Electricity MV use in UCPTE U -- MJ 1.69397E-05 -8.38239E-07 1.77779E-051864 Heavy fuel oil, burned in industrial furnace 1MW, non-modulating/CH U MJ 1.65815E-05 -1.14817E-05 2.80632E-051865 Electricity, lignite, at power plant/SI U MJ 1.61456E-05 -9.68558E-06 2.58311E-051866 Electricity, industrial gas, at power plant/FR U MJ 1.57419E-05 -9.66187E-06 2.54038E-051867 Electricity, hydropower, at pumped storage power plant/DE U MJ 1.55802E-05 -9.68559E-06 2.52658E-051868 Electricity, production mix CZ/CZ U MJ 1.51596E-05 -1.00777E-05 2.52373E-051869 Lignite, burned in power plant/AT U MJ 1.49747E-05 -9.1609E-06 2.41356E-051870 Electricity, hydropower, at power plant/SI U MJ 1.47204E-05 -8.82474E-06 2.35451E-051871 Natural gas, high pressure, at consumer/DK U MJ 1.44341E-05 -2.08113E-06 1.65152E-051872 Electricity, industrial gas, at power plant/BE U MJ 1.43865E-05 -8.97102E-06 2.33575E-051873 Electricity, hydropower, at power plant/GR U MJ 1.4165E-05 -8.49173E-06 2.26568E-051874 Electricity from waste, at municipal waste incineration plant/CH U MJ 1.39091E-05 -1.02503E-06 1.49341E-051875 Heat, light fuel oil, at boiler 10kW, non-modulating/CH U MJ 1.33182E-05 -8.93842E-06 2.22566E-051876 Heat, heavy fuel oil, at industrial furnace 1MW/CH U MJ 1.23802E-05 -9.09689E-06 2.14771E-051877 Electricity, at cogen 500kWe lean burn, allocation exergy/CH U MJ 1.21825E-05 -7.90793E-06 2.00904E-051878 Natural gas, high pressure, at consumer/FI U MJ 1.21699E-05 -1.75468E-06 1.39246E-051879 Electricity, oil, at power plant/NL U MJ 1.18113E-05 -7.06422E-06 1.88755E-051880 Electricity, natural gas, at power plant/NORDEL U MJ 1.17382E-05 -1.69243E-06 1.34306E-051881 Electricity, hydropower, at pumped storage power plant/CH U MJ 1.16803E-05 -7.58383E-06 1.92641E-051882 Electricity, oil, at power plant/GB U MJ 1.11226E-05 -7.96404E-06 1.90866E-051883 Electricity, industrial gas, at power plant/NL U MJ 1.07286E-05 -6.41665E-06 1.71452E-051884 Heavy fuel oil, burned in power plant/BE U MJ 1.04436E-05 -6.51221E-06 1.69558E-051885 Electricity, hydropower, at pumped storage power plant/ES U MJ 1.02661E-05 -6.27839E-06 1.65444E-051886 Heavy fuel oil, burned in power plant/AT U MJ 1.01442E-05 -6.20328E-06 1.63475E-051887 Electricity, lignite, at power plant/CZ U MJ 9.77221E-06 -6.49628E-06 1.62685E-051888 Electricity, industrial gas, at power plant/ES U MJ 9.75386E-06 -5.96486E-06 1.57187E-051889 Electricity mix/AT U MJ 9.52915E-06 -5.82717E-06 1.53563E-051890 Electricity, hydropower, at power plant/GB U MJ 9.50346E-06 -6.80472E-06 1.63082E-051891 Electricity, high voltage, at grid/AT U MJ 9.4348E-06 -5.76948E-06 1.52043E-051892 Infra coal power plant U - MJ 9.34574E-06 -7.18601E-07 1.00643E-051893 Output gas turbine pipeline NL U -- MJ 8.88312E-06 -2.90266E-07 9.17339E-061894 Electricity, industrial gas, at power plant/UCTE U MJ 8.15173E-06 -5.79773E-06 1.39495E-051895 Heavy fuel oil, burned in power plant/DK U MJ 7.94585E-06 -1.89266E-06 9.83851E-061896 Electricity, hydropower, at power plant/FI U MJ 7.86805E-06 -2.55521E-08 7.8936E-061897 Output Gasmotor GUS U -- MJ 7.81745E-06 -2.54691E-07 8.07214E-06
18 of 25
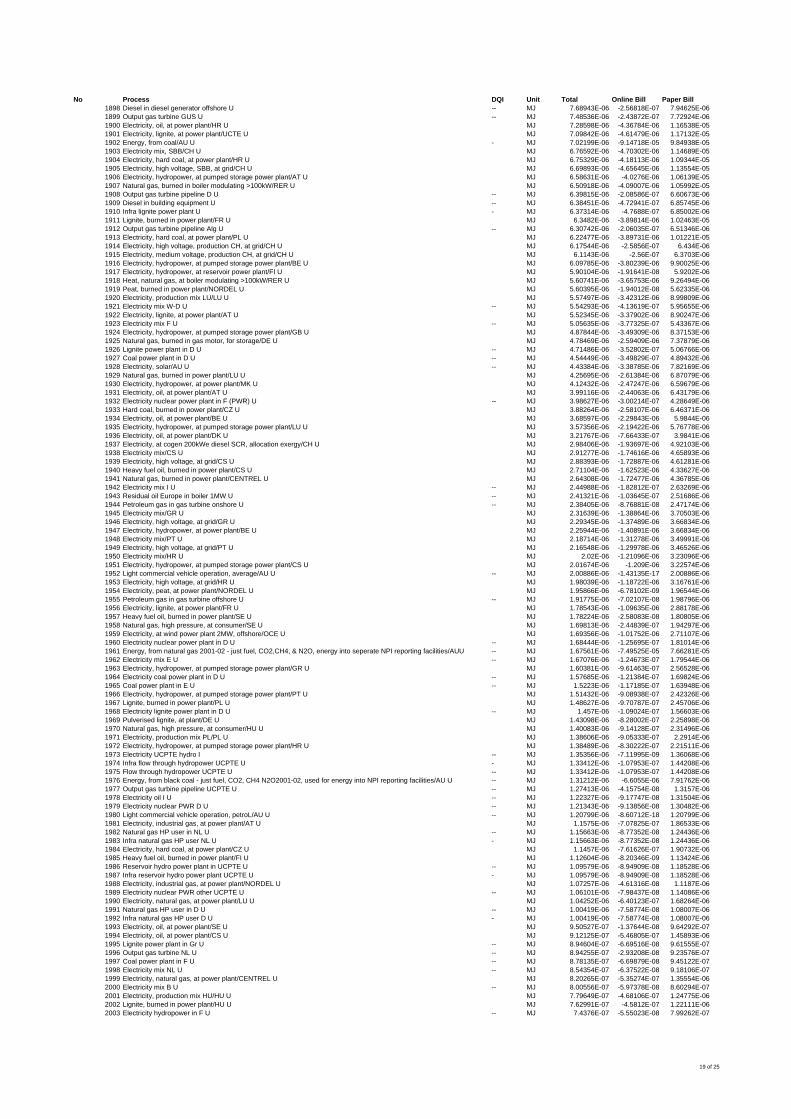
No Process DQI Unit Total Online Bill Paper Bill1898 Diesel in diesel generator offshore U -- MJ 7.68943E-06 -2.56818E-07 7.94625E-061899 Output gas turbine GUS U -- MJ 7.48536E-06 -2.43872E-07 7.72924E-061900 Electricity, oil, at power plant/HR U MJ 7.28598E-06 -4.36784E-06 1.16538E-051901 Electricity, lignite, at power plant/UCTE U MJ 7.09842E-06 -4.61479E-06 1.17132E-051902 Energy, from coal/AU U - MJ 7.02199E-06 -9.14718E-05 9.84938E-051903 Electricity mix, SBB/CH U MJ 6.76592E-06 -4.70302E-06 1.14689E-051904 Electricity, hard coal, at power plant/HR U MJ 6.75329E-06 -4.18113E-06 1.09344E-051905 Electricity, high voltage, SBB, at grid/CH U MJ 6.69893E-06 -4.65645E-06 1.13554E-051906 Electricity, hydropower, at pumped storage power plant/AT U MJ 6.58631E-06 -4.0276E-06 1.06139E-051907 Natural gas, burned in boiler modulating >100kW/RER U MJ 6.50918E-06 -4.09007E-06 1.05992E-051908 Output gas turbine pipeline D U -- MJ 6.39815E-06 -2.08586E-07 6.60673E-061909 Diesel in building equipment U -- MJ 6.38451E-06 -4.72941E-07 6.85745E-061910 Infra lignite power plant U - MJ 6.37314E-06 -4.7688E-07 6.85002E-061911 Lignite, burned in power plant/FR U MJ 6.3482E-06 -3.89814E-06 1.02463E-051912 Output gas turbine pipeline Alg U -- MJ 6.30742E-06 -2.06035E-07 6.51346E-061913 Electricity, hard coal, at power plant/PL U MJ 6.22477E-06 -3.89731E-06 1.01221E-051914 Electricity, high voltage, production CH, at grid/CH U MJ 6.17544E-06 -2.5856E-07 6.434E-061915 Electricity, medium voltage, production CH, at grid/CH U MJ 6.1143E-06 -2.56E-07 6.3703E-061916 Electricity, hydropower, at pumped storage power plant/BE U MJ 6.09785E-06 -3.80239E-06 9.90025E-061917 Electricity, hydropower, at reservoir power plant/FI U MJ 5.90104E-06 -1.91641E-08 5.9202E-061918 Heat, natural gas, at boiler modulating >100kW/RER U MJ 5.60741E-06 -3.65753E-06 9.26494E-061919 Peat, burned in power plant/NORDEL U MJ 5.60395E-06 -1.94012E-08 5.62335E-061920 Electricity, production mix LU/LU U MJ 5.57497E-06 -3.42312E-06 8.99809E-061921 Electricity mix W-D U -- MJ 5.54293E-06 -4.13619E-07 5.95655E-061922 Electricity, lignite, at power plant/AT U MJ 5.52345E-06 -3.37902E-06 8.90247E-061923 Electricity mix F U -- MJ 5.05635E-06 -3.77325E-07 5.43367E-061924 Electricity, hydropower, at pumped storage power plant/GB U MJ 4.87844E-06 -3.49309E-06 8.37153E-061925 Natural gas, burned in gas motor, for storage/DE U MJ 4.78469E-06 -2.59409E-06 7.37879E-061926 Lignite power plant in D U -- MJ 4.71486E-06 -3.52802E-07 5.06766E-061927 Coal power plant in D U -- MJ 4.54449E-06 -3.49829E-07 4.89432E-061928 Electricity, solar/AU U -- MJ 4.43384E-06 -3.38785E-06 7.82169E-061929 Natural gas, burned in power plant/LU U MJ 4.25695E-06 -2.61384E-06 6.87079E-061930 Electricity, hydropower, at power plant/MK U MJ 4.12432E-06 -2.47247E-06 6.59679E-061931 Electricity, oil, at power plant/AT U MJ 3.99116E-06 -2.44063E-06 6.43179E-061932 Electricity nuclear power plant in F (PWR) U -- MJ 3.98627E-06 -3.00214E-07 4.28649E-061933 Hard coal, burned in power plant/CZ U MJ 3.88264E-06 -2.58107E-06 6.46371E-061934 Electricity, oil, at power plant/BE U MJ 3.68597E-06 -2.29843E-06 5.9844E-061935 Electricity, hydropower, at pumped storage power plant/LU U MJ 3.57356E-06 -2.19422E-06 5.76778E-061936 Electricity, oil, at power plant/DK U MJ 3.21767E-06 -7.66433E-07 3.9841E-061937 Electricity, at cogen 200kWe diesel SCR, allocation exergy/CH U MJ 2.98406E-06 -1.93697E-06 4.92103E-061938 Electricity mix/CS U MJ 2.91277E-06 -1.74616E-06 4.65893E-061939 Electricity, high voltage, at grid/CS U MJ 2.88393E-06 -1.72887E-06 4.61281E-061940 Heavy fuel oil, burned in power plant/CS U MJ 2.71104E-06 -1.62523E-06 4.33627E-061941 Natural gas, burned in power plant/CENTREL U MJ 2.64308E-06 -1.72477E-06 4.36785E-061942 Electricity mix I U -- MJ 2.44988E-06 -1.82812E-07 2.63269E-061943 Residual oil Europe in boiler 1MW U -- MJ 2.41321E-06 -1.03645E-07 2.51686E-061944 Petroleum gas in gas turbine onshore U -- MJ 2.38405E-06 -8.76881E-08 2.47174E-061945 Electricity mix/GR U MJ 2.31639E-06 -1.38864E-06 3.70503E-061946 Electricity, high voltage, at grid/GR U MJ 2.29345E-06 -1.37489E-06 3.66834E-061947 Electricity, hydropower, at power plant/BE U MJ 2.25944E-06 -1.40891E-06 3.66834E-061948 Electricity mix/PT U MJ 2.18714E-06 -1.31278E-06 3.49991E-061949 Electricity, high voltage, at grid/PT U MJ 2.16548E-06 -1.29978E-06 3.46526E-061950 Electricity mix/HR U MJ 2.02E-06 -1.21096E-06 3.23096E-061951 Electricity, hydropower, at pumped storage power plant/CS U MJ 2.01674E-06 -1.209E-06 3.22574E-061952 Light commercial vehicle operation, average/AU U -- MJ 2.00886E-06 -1.43135E-17 2.00886E-061953 Electricity, high voltage, at grid/HR U MJ 1.98039E-06 -1.18722E-06 3.16761E-061954 Electricity, peat, at power plant/NORDEL U MJ 1.95866E-06 -6.78102E-09 1.96544E-061955 Petroleum gas in gas turbine offshore U -- MJ 1.91775E-06 -7.02107E-08 1.98796E-061956 Electricity, lignite, at power plant/FR U MJ 1.78543E-06 -1.09635E-06 2.88178E-061957 Heavy fuel oil, burned in power plant/SE U MJ 1.78224E-06 -2.58083E-08 1.80805E-061958 Natural gas, high pressure, at consumer/SE U MJ 1.69813E-06 -2.44839E-07 1.94297E-061959 Electricity, at wind power plant 2MW, offshore/OCE U MJ 1.69356E-06 -1.01752E-06 2.71107E-061960 Electricity nuclear power plant in D U -- MJ 1.68444E-06 -1.25695E-07 1.81014E-061961 Energy, from natural gas 2001-02 - just fuel, CO2,CH4, & N2O, energy into seperate NPI reporting facilities/AUU -- MJ 1.67561E-06 -7.49525E-05 7.66281E-051962 Electricity mix E U -- MJ 1.67076E-06 -1.24673E-07 1.79544E-061963 Electricity, hydropower, at pumped storage power plant/GR U MJ 1.60381E-06 -9.61463E-07 2.56528E-061964 Electricity coal power plant in D U -- MJ 1.57685E-06 -1.21384E-07 1.69824E-061965 Coal power plant in E U -- MJ 1.5223E-06 -1.17185E-07 1.63948E-061966 Electricity, hydropower, at pumped storage power plant/PT U MJ 1.51432E-06 -9.08938E-07 2.42326E-061967 Lignite, burned in power plant/PL U MJ 1.48627E-06 -9.70787E-07 2.45706E-061968 Electricity lignite power plant in D U -- MJ 1.457E-06 -1.09024E-07 1.56603E-061969 Pulverised lignite, at plant/DE U MJ 1.43098E-06 -8.28002E-07 2.25898E-061970 Natural gas, high pressure, at consumer/HU U MJ 1.40083E-06 -9.14128E-07 2.31496E-061971 Electricity, production mix PL/PL U MJ 1.38606E-06 -9.05333E-07 2.2914E-061972 Electricity, hydropower, at pumped storage power plant/HR U MJ 1.38489E-06 -8.30222E-07 2.21511E-061973 Electricity UCPTE hydro I -- MJ 1.35356E-06 -7.11995E-09 1.36068E-061974 Infra flow through hydropower UCPTE U - MJ 1.33412E-06 -1.07953E-07 1.44208E-061975 Flow through hydropower UCPTE U -- MJ 1.33412E-06 -1.07953E-07 1.44208E-061976 Energy, from black coal - just fuel, CO2, CH4 N2O2001-02, used for energy into NPI reporting facilities/AU U -- MJ 1.31212E-06 -6.6055E-06 7.91762E-061977 Output gas turbine pipeline UCPTE U -- MJ 1.27413E-06 -4.15754E-08 1.3157E-061978 Electricity oil I U -- MJ 1.22327E-06 -9.17747E-08 1.31504E-061979 Electricity nuclear PWR D U -- MJ 1.21343E-06 -9.13856E-08 1.30482E-061980 Light commercial vehicle operation, petroL/AU U -- MJ 1.20799E-06 -8.60712E-18 1.20799E-061981 Electricity, industrial gas, at power plant/AT U MJ 1.1575E-06 -7.07825E-07 1.86533E-061982 Natural gas HP user in NL U -- MJ 1.15663E-06 -8.77352E-08 1.24436E-061983 Infra natural gas HP user NL U - MJ 1.15663E-06 -8.77352E-08 1.24436E-061984 Electricity, hard coal, at power plant/CZ U MJ 1.1457E-06 -7.61626E-07 1.90732E-061985 Heavy fuel oil, burned in power plant/FI U MJ 1.12604E-06 -8.20346E-09 1.13424E-061986 Reservoir hydro power plant in UCPTE U -- MJ 1.09579E-06 -8.94909E-08 1.18528E-061987 Infra reservoir hydro power plant UCPTE U - MJ 1.09579E-06 -8.94909E-08 1.18528E-061988 Electricity, industrial gas, at power plant/NORDEL U MJ 1.07257E-06 -4.61316E-08 1.1187E-061989 Electricity nuclear PWR other UCPTE U -- MJ 1.06101E-06 -7.98437E-08 1.14086E-061990 Electricity, natural gas, at power plant/LU U MJ 1.04252E-06 -6.40123E-07 1.68264E-061991 Natural gas HP user in D U -- MJ 1.00419E-06 -7.58774E-08 1.08007E-061992 Infra natural gas HP user D U - MJ 1.00419E-06 -7.58774E-08 1.08007E-061993 Electricity, oil, at power plant/SE U MJ 9.50527E-07 -1.37644E-08 9.64292E-071994 Electricity, oil, at power plant/CS U MJ 9.12125E-07 -5.46805E-07 1.45893E-061995 Lignite power plant in Gr U -- MJ 8.94604E-07 -6.69516E-08 9.61555E-071996 Output gas turbine NL U -- MJ 8.94255E-07 -2.93208E-08 9.23576E-071997 Coal power plant in F U -- MJ 8.78135E-07 -6.69879E-08 9.45122E-071998 Electricity mix NL U -- MJ 8.54354E-07 -6.37522E-08 9.18106E-071999 Electricity, natural gas, at power plant/CENTREL U MJ 8.20265E-07 -5.35274E-07 1.35554E-062000 Electricity mix B U -- MJ 8.00556E-07 -5.97378E-08 8.60294E-072001 Electricity, production mix HU/HU U MJ 7.79649E-07 -4.68106E-07 1.24775E-062002 Lignite, burned in power plant/HU U MJ 7.62991E-07 -4.5812E-07 1.22111E-062003 Electricity hydropower in F U -- MJ 7.4376E-07 -5.55023E-08 7.99262E-07
19 of 25
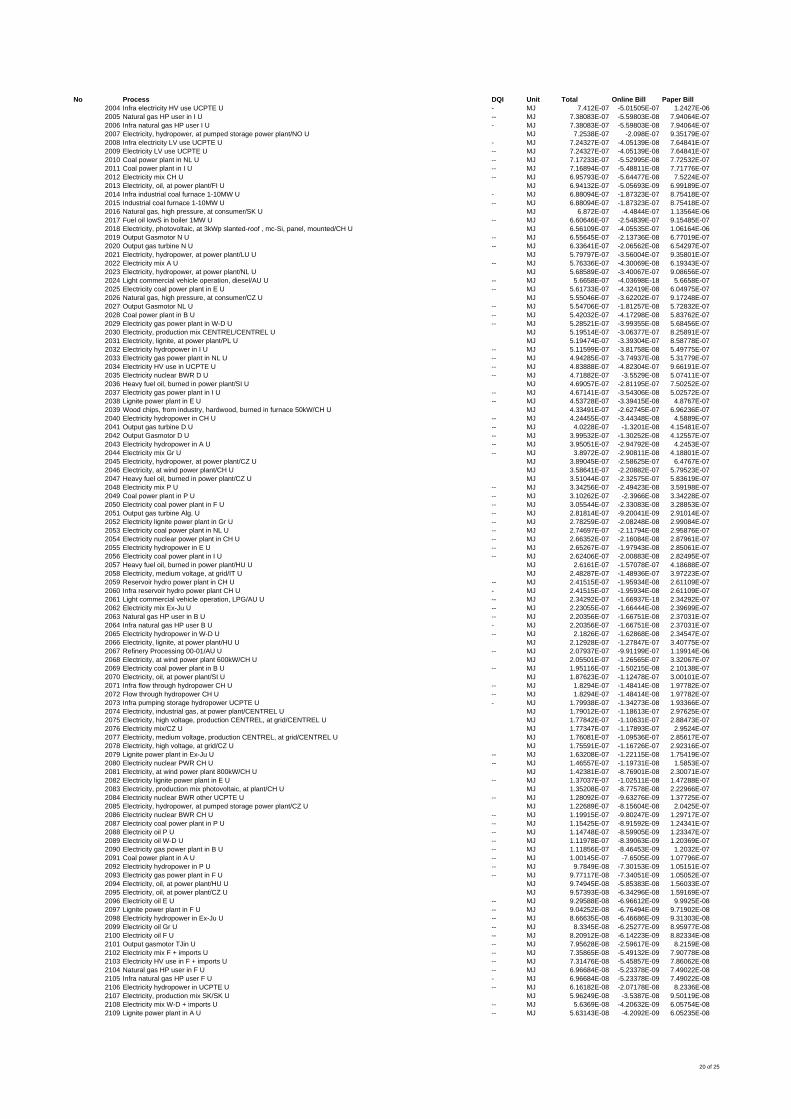
No Process DQI Unit Total Online Bill Paper Bill2004 Infra electricity HV use UCPTE U - MJ 7.412E-07 -5.01505E-07 1.2427E-062005 Natural gas HP user in I U -- MJ 7.38083E-07 -5.59803E-08 7.94064E-072006 Infra natural gas HP user I U - MJ 7.38083E-07 -5.59803E-08 7.94064E-072007 Electricity, hydropower, at pumped storage power plant/NO U MJ 7.2538E-07 -2.098E-07 9.35179E-072008 Infra electricity LV use UCPTE U - MJ 7.24327E-07 -4.05139E-08 7.64841E-072009 Electricity LV use UCPTE U -- MJ 7.24327E-07 -4.05139E-08 7.64841E-072010 Coal power plant in NL U -- MJ 7.17233E-07 -5.52995E-08 7.72532E-072011 Coal power plant in I U -- MJ 7.16894E-07 -5.48811E-08 7.71776E-072012 Electricity mix CH U -- MJ 6.95793E-07 -5.64477E-08 7.5224E-072013 Electricity, oil, at power plant/FI U MJ 6.94132E-07 -5.05693E-09 6.99189E-072014 Infra industrial coal furnace 1-10MW U - MJ 6.88094E-07 -1.87323E-07 8.75418E-072015 Industrial coal furnace 1-10MW U -- MJ 6.88094E-07 -1.87323E-07 8.75418E-072016 Natural gas, high pressure, at consumer/SK U MJ 6.872E-07 -4.4844E-07 1.13564E-062017 Fuel oil lowS in boiler 1MW U -- MJ 6.60646E-07 -2.54839E-07 9.15485E-072018 Electricity, photovoltaic, at 3kWp slanted-roof , mc-Si, panel, mounted/CH U MJ 6.56109E-07 -4.05535E-07 1.06164E-062019 Output Gasmotor N U -- MJ 6.55645E-07 -2.13736E-08 6.77019E-072020 Output gas turbine N U -- MJ 6.33641E-07 -2.06562E-08 6.54297E-072021 Electricity, hydropower, at power plant/LU U MJ 5.79797E-07 -3.56004E-07 9.35801E-072022 Electricity mix A U -- MJ 5.76336E-07 -4.30069E-08 6.19343E-072023 Electricity, hydropower, at power plant/NL U MJ 5.68589E-07 -3.40067E-07 9.08656E-072024 Light commercial vehicle operation, diesel/AU U -- MJ 5.6658E-07 -4.03698E-18 5.6658E-072025 Electricity coal power plant in E U -- MJ 5.61733E-07 -4.32419E-08 6.04975E-072026 Natural gas, high pressure, at consumer/CZ U MJ 5.55046E-07 -3.62202E-07 9.17248E-072027 Output Gasmotor NL U -- MJ 5.54706E-07 -1.81257E-08 5.72832E-072028 Coal power plant in B U -- MJ 5.42032E-07 -4.17298E-08 5.83762E-072029 Electricity gas power plant in W-D U -- MJ 5.28521E-07 -3.99355E-08 5.68456E-072030 Electricity, production mix CENTREL/CENTREL U MJ 5.19514E-07 -3.06377E-07 8.25891E-072031 Electricity, lignite, at power plant/PL U MJ 5.19474E-07 -3.39304E-07 8.58778E-072032 Electricity hydropower in I U -- MJ 5.11599E-07 -3.81758E-08 5.49775E-072033 Electricity gas power plant in NL U -- MJ 4.94285E-07 -3.74937E-08 5.31779E-072034 Electricity HV use in UCPTE U -- MJ 4.83888E-07 -4.82304E-07 9.66191E-072035 Electricity nuclear BWR D U -- MJ 4.71882E-07 -3.5529E-08 5.07411E-072036 Heavy fuel oil, burned in power plant/SI U MJ 4.69057E-07 -2.81195E-07 7.50252E-072037 Electricity gas power plant in I U -- MJ 4.67141E-07 -3.54306E-08 5.02572E-072038 Lignite power plant in E U -- MJ 4.53728E-07 -3.39415E-08 4.8767E-072039 Wood chips, from industry, hardwood, burned in furnace 50kW/CH U MJ 4.33491E-07 -2.62745E-07 6.96236E-072040 Electricity hydropower in CH U -- MJ 4.24455E-07 -3.44348E-08 4.5889E-072041 Output gas turbine D U -- MJ 4.0228E-07 -1.3201E-08 4.15481E-072042 Output Gasmotor D U -- MJ 3.99532E-07 -1.30252E-08 4.12557E-072043 Electricity hydropower in A U -- MJ 3.95051E-07 -2.94792E-08 4.2453E-072044 Electricity mix Gr U -- MJ 3.8972E-07 -2.90811E-08 4.18801E-072045 Electricity, hydropower, at power plant/CZ U MJ 3.89045E-07 -2.58625E-07 6.4767E-072046 Electricity, at wind power plant/CH U MJ 3.58641E-07 -2.20882E-07 5.79523E-072047 Heavy fuel oil, burned in power plant/CZ U MJ 3.51044E-07 -2.32575E-07 5.83619E-072048 Electricity mix P U -- MJ 3.34256E-07 -2.49423E-08 3.59198E-072049 Coal power plant in P U -- MJ 3.10262E-07 -2.3966E-08 3.34228E-072050 Electricity coal power plant in F U -- MJ 3.05544E-07 -2.33083E-08 3.28853E-072051 Output gas turbine Alg. U -- MJ 2.81814E-07 -9.20041E-09 2.91014E-072052 Electricity lignite power plant in Gr U -- MJ 2.78259E-07 -2.08248E-08 2.99084E-072053 Electricity coal power plant in NL U -- MJ 2.74697E-07 -2.11794E-08 2.95876E-072054 Electricity nuclear power plant in CH U -- MJ 2.66352E-07 -2.16084E-08 2.87961E-072055 Electricity hydropower in E U -- MJ 2.65267E-07 -1.97943E-08 2.85061E-072056 Electricity coal power plant in I U -- MJ 2.62406E-07 -2.00883E-08 2.82495E-072057 Heavy fuel oil, burned in power plant/HU U MJ 2.6161E-07 -1.57078E-07 4.18688E-072058 Electricity, medium voltage, at grid/IT U MJ 2.48287E-07 -1.48936E-07 3.97223E-072059 Reservoir hydro power plant in CH U -- MJ 2.41515E-07 -1.95934E-08 2.61109E-072060 Infra reservoir hydro power plant CH U - MJ 2.41515E-07 -1.95934E-08 2.61109E-072061 Light commercial vehicle operation, LPG/AU U -- MJ 2.34292E-07 -1.66937E-18 2.34292E-072062 Electricity mix Ex-Ju U -- MJ 2.23055E-07 -1.66444E-08 2.39699E-072063 Natural gas HP user in B U -- MJ 2.20356E-07 -1.66751E-08 2.37031E-072064 Infra natural gas HP user B U - MJ 2.20356E-07 -1.66751E-08 2.37031E-072065 Electricity hydropower in W-D U -- MJ 2.1826E-07 -1.62868E-08 2.34547E-072066 Electricity, lignite, at power plant/HU U MJ 2.12928E-07 -1.27847E-07 3.40775E-072067 Refinery Processing 00-01/AU U -- MJ 2.07937E-07 -9.91199E-07 1.19914E-062068 Electricity, at wind power plant 600kW/CH U MJ 2.05501E-07 -1.26565E-07 3.32067E-072069 Electricity coal power plant in B U -- MJ 1.95116E-07 -1.50215E-08 2.10138E-072070 Electricity, oil, at power plant/SI U MJ 1.87623E-07 -1.12478E-07 3.00101E-072071 Infra flow through hydropower CH U -- MJ 1.8294E-07 -1.48414E-08 1.97782E-072072 Flow through hydropower CH U -- MJ 1.8294E-07 -1.48414E-08 1.97782E-072073 Infra pumping storage hydropower UCPTE U - MJ 1.79938E-07 -1.34273E-08 1.93366E-072074 Electricity, industrial gas, at power plant/CENTREL U MJ 1.79012E-07 -1.18613E-07 2.97625E-072075 Electricity, high voltage, production CENTREL, at grid/CENTREL U MJ 1.77842E-07 -1.10631E-07 2.88473E-072076 Electricity mix/CZ U MJ 1.77347E-07 -1.17893E-07 2.9524E-072077 Electricity, medium voltage, production CENTREL, at grid/CENTREL U MJ 1.76081E-07 -1.09536E-07 2.85617E-072078 Electricity, high voltage, at grid/CZ U MJ 1.75591E-07 -1.16726E-07 2.92316E-072079 Lignite power plant in Ex-Ju U -- MJ 1.63208E-07 -1.22115E-08 1.75419E-072080 Electricity nuclear PWR CH U -- MJ 1.46557E-07 -1.19731E-08 1.5853E-072081 Electricity, at wind power plant 800kW/CH U MJ 1.42381E-07 -8.76901E-08 2.30071E-072082 Electricity lignite power plant in E U -- MJ 1.37037E-07 -1.02511E-08 1.47288E-072083 Electricity, production mix photovoltaic, at plant/CH U MJ 1.35208E-07 -8.77578E-08 2.22966E-072084 Electricity nuclear BWR other UCPTE U -- MJ 1.28092E-07 -9.63276E-09 1.37725E-072085 Electricity, hydropower, at pumped storage power plant/CZ U MJ 1.22689E-07 -8.15604E-08 2.0425E-072086 Electricity nuclear BWR CH U -- MJ 1.19915E-07 -9.80247E-09 1.29717E-072087 Electricity coal power plant in P U -- MJ 1.15425E-07 -8.91592E-09 1.24341E-072088 Electricity oil P U -- MJ 1.14748E-07 -8.59905E-09 1.23347E-072089 Electricity oil W-D U -- MJ 1.11978E-07 -8.39063E-09 1.20369E-072090 Electricity gas power plant in B U -- MJ 1.11856E-07 -8.46453E-09 1.2032E-072091 Coal power plant in A U -- MJ 1.00145E-07 -7.6505E-09 1.07796E-072092 Electricity hydropower in P U -- MJ 9.7849E-08 -7.30153E-09 1.05151E-072093 Electricity gas power plant in F U -- MJ 9.77117E-08 -7.34051E-09 1.05052E-072094 Electricity, oil, at power plant/HU U MJ 9.74945E-08 -5.85383E-08 1.56033E-072095 Electricity, oil, at power plant/CZ U MJ 9.57393E-08 -6.34296E-08 1.59169E-072096 Electricity oil E U -- MJ 9.29588E-08 -6.96612E-09 9.9925E-082097 Lignite power plant in F U -- MJ 9.04252E-08 -6.76494E-09 9.71902E-082098 Electricity hydropower in Ex-Ju U -- MJ 8.66635E-08 -6.46686E-09 9.31303E-082099 Electricity oil Gr U -- MJ 8.3345E-08 -6.25277E-09 8.95977E-082100 Electricity oil F U -- MJ 8.20912E-08 -6.14223E-09 8.82334E-082101 Output gasmotor TJin U -- MJ 7.95628E-08 -2.59617E-09 8.2159E-082102 Electricity mix F + imports U -- MJ 7.35865E-08 -5.49132E-09 7.90778E-082103 Electricity HV use in F + imports U -- MJ 7.31476E-08 -5.45857E-09 7.86062E-082104 Natural gas HP user in F U -- MJ 6.96684E-08 -5.23378E-09 7.49022E-082105 Infra natural gas HP user F U - MJ 6.96684E-08 -5.23378E-09 7.49022E-082106 Electricity hydropower in UCPTE U -- MJ 6.16182E-08 -2.07178E-08 8.2336E-082107 Electricity, production mix SK/SK U MJ 5.96249E-08 -3.5387E-08 9.50119E-082108 Electricity mix W-D + imports U -- MJ 5.6369E-08 -4.20632E-09 6.05754E-082109 Lignite power plant in A U -- MJ 5.63143E-08 -4.2092E-09 6.05235E-08
20 of 25
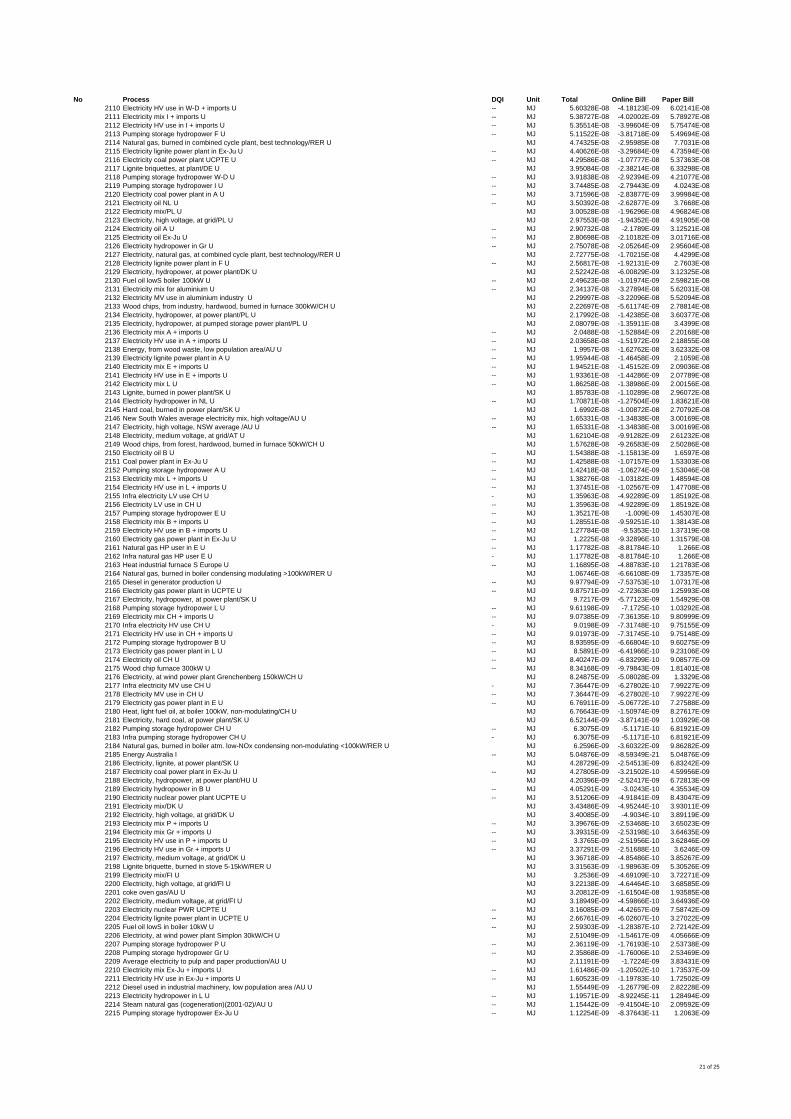
No Process DQI Unit Total Online Bill Paper Bill2110 Electricity HV use in W-D + imports U -- MJ 5.60328E-08 -4.18123E-09 6.02141E-082111 Electricity mix I + imports U -- MJ 5.38727E-08 -4.02002E-09 5.78927E-082112 Electricity HV use in I + imports U -- MJ 5.35514E-08 -3.99604E-09 5.75474E-082113 Pumping storage hydropower F U -- MJ 5.11522E-08 -3.81718E-09 5.49694E-082114 Natural gas, burned in combined cycle plant, best technology/RER U MJ 4.74325E-08 -2.95985E-08 7.7031E-082115 Electricity lignite power plant in Ex-Ju U -- MJ 4.40626E-08 -3.29684E-09 4.73594E-082116 Electricity coal power plant UCPTE U -- MJ 4.29586E-08 -1.07777E-08 5.37363E-082117 Lignite briquettes, at plant/DE U MJ 3.95084E-08 -2.38214E-08 6.33298E-082118 Pumping storage hydropower W-D U -- MJ 3.91838E-08 -2.92394E-09 4.21077E-082119 Pumping storage hydropower I U -- MJ 3.74485E-08 -2.79443E-09 4.0243E-082120 Electricity coal power plant in A U -- MJ 3.71596E-08 -2.83877E-09 3.99984E-082121 Electricity oil NL U -- MJ 3.50392E-08 -2.62877E-09 3.7668E-082122 Electricity mix/PL U MJ 3.00528E-08 -1.96296E-08 4.96824E-082123 Electricity, high voltage, at grid/PL U MJ 2.97553E-08 -1.94352E-08 4.91905E-082124 Electricity oil A U -- MJ 2.90732E-08 -2.1789E-09 3.12521E-082125 Electricity oil Ex-Ju U -- MJ 2.80698E-08 -2.10182E-09 3.01716E-082126 Electricity hydropower in Gr U -- MJ 2.75078E-08 -2.05264E-09 2.95604E-082127 Electricity, natural gas, at combined cycle plant, best technology/RER U MJ 2.72775E-08 -1.70215E-08 4.4299E-082128 Electricity lignite power plant in F U -- MJ 2.56817E-08 -1.92131E-09 2.7603E-082129 Electricity, hydropower, at power plant/DK U MJ 2.52242E-08 -6.00829E-09 3.12325E-082130 Fuel oil lowS boiler 100kW U -- MJ 2.49623E-08 -1.01974E-09 2.59821E-082131 Electricity mix for aluminium U -- MJ 2.34137E-08 -3.27894E-08 5.62031E-082132 Electricity MV use in aluminium industry U MJ 2.29997E-08 -3.22096E-08 5.52094E-082133 Wood chips, from industry, hardwood, burned in furnace 300kW/CH U MJ 2.22697E-08 -5.61174E-09 2.78814E-082134 Electricity, hydropower, at power plant/PL U MJ 2.17992E-08 -1.42385E-08 3.60377E-082135 Electricity, hydropower, at pumped storage power plant/PL U MJ 2.08079E-08 -1.35911E-08 3.4399E-082136 Electricity mix A + imports U -- MJ 2.0488E-08 -1.52884E-09 2.20168E-082137 Electricity HV use in A + imports U -- MJ 2.03658E-08 -1.51972E-09 2.18855E-082138 Energy, from wood waste, low population area/AU U -- MJ 1.9957E-08 -1.62762E-08 3.62332E-082139 Electricity lignite power plant in A U -- MJ 1.95944E-08 -1.46458E-09 2.1059E-082140 Electricity mix E + imports U -- MJ 1.94521E-08 -1.45152E-09 2.09036E-082141 Electricity HV use in E + imports U -- MJ 1.93361E-08 -1.44286E-09 2.07789E-082142 Electricity mix L U -- MJ 1.86258E-08 -1.38986E-09 2.00156E-082143 Lignite, burned in power plant/SK U MJ 1.85783E-08 -1.10289E-08 2.96072E-082144 Electricity hydropower in NL U -- MJ 1.70871E-08 -1.27504E-09 1.83621E-082145 Hard coal, burned in power plant/SK U MJ 1.6992E-08 -1.00872E-08 2.70792E-082146 New South Wales average electricity mix, high voltage/AU U -- MJ 1.65331E-08 -1.34838E-08 3.00169E-082147 Electricity, high voltage, NSW average /AU U -- MJ 1.65331E-08 -1.34838E-08 3.00169E-082148 Electricity, medium voltage, at grid/AT U MJ 1.62104E-08 -9.91282E-09 2.61232E-082149 Wood chips, from forest, hardwood, burned in furnace 50kW/CH U MJ 1.57628E-08 -9.26583E-09 2.50286E-082150 Electricity oil B U -- MJ 1.54388E-08 -1.15813E-09 1.6597E-082151 Coal power plant in Ex-Ju U -- MJ 1.42588E-08 -1.07157E-09 1.53303E-082152 Pumping storage hydropower A U -- MJ 1.42418E-08 -1.06274E-09 1.53046E-082153 Electricity mix L + imports U -- MJ 1.38276E-08 -1.03182E-09 1.48594E-082154 Electricity HV use in L + imports U -- MJ 1.37451E-08 -1.02567E-09 1.47708E-082155 Infra electricity LV use CH U - MJ 1.35963E-08 -4.92289E-09 1.85192E-082156 Electricity LV use in CH U -- MJ 1.35963E-08 -4.92289E-09 1.85192E-082157 Pumping storage hydropower E U -- MJ 1.35217E-08 -1.009E-09 1.45307E-082158 Electricity mix B + imports U -- MJ 1.28551E-08 -9.59251E-10 1.38143E-082159 Electricity HV use in B + imports U -- MJ 1.27784E-08 -9.5353E-10 1.37319E-082160 Electricity gas power plant in Ex-Ju U -- MJ 1.2225E-08 -9.32896E-10 1.31579E-082161 Natural gas HP user in E U -- MJ 1.17782E-08 -8.81784E-10 1.266E-082162 Infra natural gas HP user E U - MJ 1.17782E-08 -8.81784E-10 1.266E-082163 Heat industrial furnace S Europe U -- MJ 1.16895E-08 -4.88783E-10 1.21783E-082164 Natural gas, burned in boiler condensing modulating >100kW/RER U MJ 1.06746E-08 -6.66108E-09 1.73357E-082165 Diesel in generator production U -- MJ 9.97794E-09 -7.53753E-10 1.07317E-082166 Electricity gas power plant in UCPTE U -- MJ 9.87571E-09 -2.72363E-09 1.25993E-082167 Electricity, hydropower, at power plant/SK U MJ 9.7217E-09 -5.77123E-09 1.54929E-082168 Pumping storage hydropower L U -- MJ 9.61198E-09 -7.1725E-10 1.03292E-082169 Electricity mix CH + imports U -- MJ 9.07385E-09 -7.36135E-10 9.80999E-092170 Infra electricity HV use CH U - MJ 9.0198E-09 -7.31748E-10 9.75155E-092171 Electricity HV use in CH + imports U -- MJ 9.01973E-09 -7.31745E-10 9.75148E-092172 Pumping storage hydropower B U -- MJ 8.93595E-09 -6.66804E-10 9.60275E-092173 Electricity gas power plant in L U -- MJ 8.5891E-09 -6.41966E-10 9.23106E-092174 Electricity oil CH U -- MJ 8.40247E-09 -6.83299E-10 9.08577E-092175 Wood chip furnace 300kW U -- MJ 8.34168E-09 -9.79843E-09 1.81401E-082176 Electricity, at wind power plant Grenchenberg 150kW/CH U MJ 8.24875E-09 -5.08028E-09 1.3329E-082177 Infra electricity MV use CH U - MJ 7.36447E-09 -6.27802E-10 7.99227E-092178 Electricity MV use in CH U -- MJ 7.36447E-09 -6.27802E-10 7.99227E-092179 Electricity gas power plant in E U -- MJ 6.76911E-09 -5.06772E-10 7.27588E-092180 Heat, light fuel oil, at boiler 100kW, non-modulating/CH U MJ 6.76643E-09 -1.50974E-09 8.27617E-092181 Electricity, hard coal, at power plant/SK U MJ 6.52144E-09 -3.87141E-09 1.03929E-082182 Pumping storage hydropower CH U -- MJ 6.3075E-09 -5.1171E-10 6.81921E-092183 Infra pumping storage hydropower CH U - MJ 6.3075E-09 -5.1171E-10 6.81921E-092184 Natural gas, burned in boiler atm. low-NOx condensing non-modulating <100kW/RER U MJ 6.2596E-09 -3.60322E-09 9.86282E-092185 Energy Australia I -- MJ 5.04876E-09 -8.59349E-21 5.04876E-092186 Electricity, lignite, at power plant/SK U MJ 4.28729E-09 -2.54513E-09 6.83242E-092187 Electricity coal power plant in Ex-Ju U -- MJ 4.27805E-09 -3.21502E-10 4.59956E-092188 Electricity, hydropower, at power plant/HU U MJ 4.20396E-09 -2.52417E-09 6.72813E-092189 Electricity hydropower in B U -- MJ 4.05291E-09 -3.0243E-10 4.35534E-092190 Electricity nuclear power plant UCPTE U -- MJ 3.51206E-09 -4.91841E-09 8.43047E-092191 Electricity mix/DK U MJ 3.43486E-09 -4.95244E-10 3.93011E-092192 Electricity, high voltage, at grid/DK U MJ 3.40085E-09 -4.9034E-10 3.89119E-092193 Electricity mix P + imports U -- MJ 3.39676E-09 -2.53468E-10 3.65023E-092194 Electricity mix Gr + imports U -- MJ 3.39315E-09 -2.53198E-10 3.64635E-092195 Electricity HV use in P + imports U -- MJ 3.3765E-09 -2.51956E-10 3.62846E-092196 Electricity HV use in Gr + imports U -- MJ 3.37291E-09 -2.51688E-10 3.6246E-092197 Electricity, medium voltage, at grid/DK U MJ 3.36718E-09 -4.85486E-10 3.85267E-092198 Lignite briquette, burned in stove 5-15kW/RER U MJ 3.31563E-09 -1.98963E-09 5.30526E-092199 Electricity mix/FI U MJ 3.2536E-09 -4.69109E-10 3.72271E-092200 Electricity, high voltage, at grid/FI U MJ 3.22138E-09 -4.64464E-10 3.68585E-092201 coke oven gas/AU U MJ 3.20812E-09 -1.61504E-08 1.93585E-082202 Electricity, medium voltage, at grid/FI U MJ 3.18949E-09 -4.59866E-10 3.64936E-092203 Electricity nuclear PWR UCPTE U -- MJ 3.16085E-09 -4.42657E-09 7.58742E-092204 Electricity lignite power plant in UCPTE U -- MJ 2.66761E-09 -6.02607E-10 3.27022E-092205 Fuel oil lowS in boiler 10kW U -- MJ 2.59303E-09 -1.28387E-10 2.72142E-092206 Electricity, at wind power plant Simplon 30kW/CH U MJ 2.51049E-09 -1.54617E-09 4.05666E-092207 Pumping storage hydropower P U -- MJ 2.36119E-09 -1.76193E-10 2.53738E-092208 Pumping storage hydropower Gr U -- MJ 2.35868E-09 -1.76006E-10 2.53469E-092209 Average electricity to pulp and paper production/AU U MJ 2.11191E-09 -1.7224E-09 3.83431E-092210 Electricity mix Ex-Ju + imports U -- MJ 1.61486E-09 -1.20502E-10 1.73537E-092211 Electricity HV use in Ex-Ju + imports U -- MJ 1.60523E-09 -1.19783E-10 1.72502E-092212 Diesel used in industrial machinery, low population area /AU U MJ 1.55449E-09 -1.26779E-09 2.82228E-092213 Electricity hydropower in L U -- MJ 1.19571E-09 -8.92245E-11 1.28494E-092214 Steam natural gas (cogeneration)(2001-02)/AU U -- MJ 1.15442E-09 -9.41504E-10 2.09592E-092215 Pumping storage hydropower Ex-Ju U -- MJ 1.12254E-09 -8.37643E-11 1.2063E-09
21 of 25
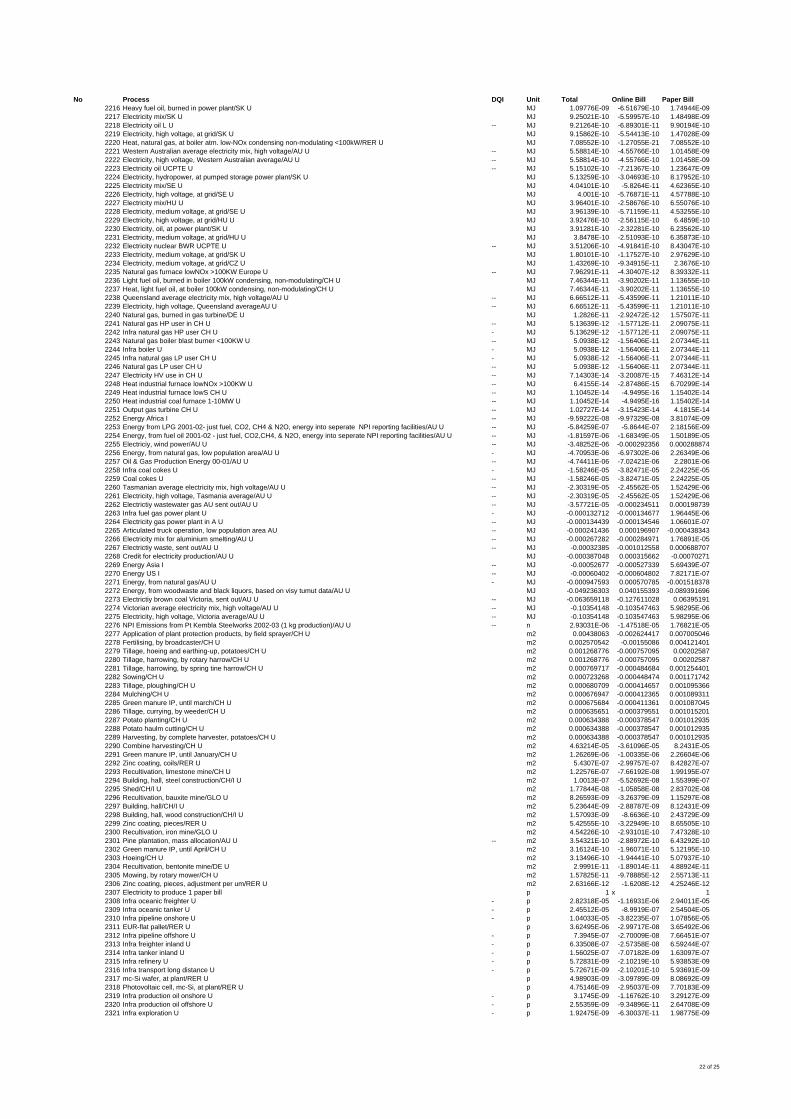
No Process DQI Unit Total Online Bill Paper Bill2216 Heavy fuel oil, burned in power plant/SK U MJ 1.09776E-09 -6.51679E-10 1.74944E-092217 Electricity mix/SK U MJ 9.25021E-10 -5.59957E-10 1.48498E-092218 Electricity oil L U -- MJ 9.21264E-10 -6.89301E-11 9.90194E-102219 Electricity, high voltage, at grid/SK U MJ 9.15862E-10 -5.54413E-10 1.47028E-092220 Heat, natural gas, at boiler atm. low-NOx condensing non-modulating <100kW/RER U MJ 7.08552E-10 -1.27055E-21 7.08552E-102221 Western Australian average electricity mix, high voltage/AU U -- MJ 5.58814E-10 -4.55766E-10 1.01458E-092222 Electricity, high voltage, Western Australian average/AU U -- MJ 5.58814E-10 -4.55766E-10 1.01458E-092223 Electricity oil UCPTE U -- MJ 5.15102E-10 -7.21367E-10 1.23647E-092224 Electricity, hydropower, at pumped storage power plant/SK U MJ 5.13259E-10 -3.04693E-10 8.17952E-102225 Electricity mix/SE U MJ 4.04101E-10 -5.8264E-11 4.62365E-102226 Electricity, high voltage, at grid/SE U MJ 4.001E-10 -5.76871E-11 4.57788E-102227 Electricity mix/HU U MJ 3.96401E-10 -2.58676E-10 6.55076E-102228 Electricity, medium voltage, at grid/SE U MJ 3.96139E-10 -5.71159E-11 4.53255E-102229 Electricity, high voltage, at grid/HU U MJ 3.92476E-10 -2.56115E-10 6.4859E-102230 Electricity, oil, at power plant/SK U MJ 3.91281E-10 -2.32281E-10 6.23562E-102231 Electricity, medium voltage, at grid/HU U MJ 3.8478E-10 -2.51093E-10 6.35873E-102232 Electricity nuclear BWR UCPTE U -- MJ 3.51206E-10 -4.91841E-10 8.43047E-102233 Electricity, medium voltage, at grid/SK U MJ 1.80101E-10 -1.17527E-10 2.97629E-102234 Electricity, medium voltage, at grid/CZ U MJ 1.43269E-10 -9.34915E-11 2.3676E-102235 Natural gas furnace lowNOx >100KW Europe U -- MJ 7.96291E-11 -4.30407E-12 8.39332E-112236 Light fuel oil, burned in boiler 100kW condensing, non-modulating/CH U MJ 7.46344E-11 -3.90202E-11 1.13655E-102237 Heat, light fuel oil, at boiler 100kW condensing, non-modulating/CH U MJ 7.46344E-11 -3.90202E-11 1.13655E-102238 Queensland average electricity mix, high voltage/AU U -- MJ 6.66512E-11 -5.43599E-11 1.21011E-102239 Electricity, high voltage, Queensland averageAU U -- MJ 6.66512E-11 -5.43599E-11 1.21011E-102240 Natural gas, burned in gas turbine/DE U MJ 1.2826E-11 -2.92472E-12 1.57507E-112241 Natural gas HP user in CH U -- MJ 5.13639E-12 -1.57712E-11 2.09075E-112242 Infra natural gas HP user CH U - MJ 5.13629E-12 -1.57712E-11 2.09075E-112243 Natural gas boiler blast burner <100KW U -- MJ 5.0938E-12 -1.56406E-11 2.07344E-112244 Infra boiler U - MJ 5.0938E-12 -1.56406E-11 2.07344E-112245 Infra natural gas LP user CH U - MJ 5.0938E-12 -1.56406E-11 2.07344E-112246 Natural gas LP user CH U -- MJ 5.0938E-12 -1.56406E-11 2.07344E-112247 Electricity HV use in CH U -- MJ 7.14303E-14 -3.20087E-15 7.46312E-142248 Heat industrial furnace lowNOx >100KW U -- MJ 6.4155E-14 -2.87486E-15 6.70299E-142249 Heat industrial furnace lowS CH U -- MJ 1.10452E-14 -4.9495E-16 1.15402E-142250 Heat industrial coal furnace 1-10MW U -- MJ 1.10452E-14 -4.9495E-16 1.15402E-142251 Output gas turbine CH U -- MJ 1.02727E-14 -3.15423E-14 4.1815E-142252 Energy Africa I -- MJ -9.59222E-08 -9.97329E-08 3.81074E-092253 Energy from LPG 2001-02- just fuel, CO2, CH4 & N2O, energy into seperate NPI reporting facilities/AU U -- MJ -5.84259E-07 -5.8644E-07 2.18156E-092254 Energy, from fuel oil 2001-02 - just fuel, CO2,CH4, & N2O, energy into seperate NPI reporting facilities/AU U -- MJ -1.81597E-06 -1.68349E-05 1.50189E-052255 Electriciy, wind power/AU U -- MJ -3.48252E-06 -0.000292356 0.0002888742256 Energy, from natural gas, low population area/AU U - MJ -4.70953E-06 -6.97302E-06 2.26349E-062257 Oil & Gas Production Energy 00-01/AU U -- MJ -4.74411E-06 -7.02421E-06 2.2801E-062258 Infra coal cokes U - MJ -1.58246E-05 -3.82471E-05 2.24225E-052259 Coal cokes U -- MJ -1.58246E-05 -3.82471E-05 2.24225E-052260 Tasmanian average electricity mix, high voltage/AU U -- MJ -2.30319E-05 -2.45562E-05 1.52429E-062261 Electricity, high voltage, Tasmania average/AU U -- MJ -2.30319E-05 -2.45562E-05 1.52429E-062262 Electrictiy wastewater gas AU sent out/AU U -- MJ -3.57721E-05 -0.000234511 0.0001987392263 Infra fuel gas power plant U - MJ -0.000132712 -0.000134677 1.96445E-062264 Electricity gas power plant in A U -- MJ -0.000134439 -0.000134546 1.06601E-072265 Articulated truck operation, low population area AU -- MJ -0.000241436 0.000196907 -0.0004383432266 Electricity mix for aluminium smelting/AU U -- MJ -0.000267282 -0.000284971 1.76891E-052267 Electrictiy waste, sent out/AU U -- MJ -0.00032385 -0.001012558 0.0006887072268 Credit for electricity production/AU U MJ -0.000387048 0.000315662 -0.000702712269 Energy Asia I -- MJ -0.00052677 -0.000527339 5.69439E-072270 Energy US I -- MJ -0.00060402 -0.000604802 7.82171E-072271 Energy, from natural gas/AU U - MJ -0.000947593 0.000570785 -0.0015183782272 Energy, from woodwaste and black liquors, based on visy tumut data/AU U MJ -0.049236303 0.040155393 -0.0893916962273 Electrictiy brown coal Victoria, sent out/AU U -- MJ -0.063659118 -0.127611028 0.063951912274 Victorian average electricity mix, high voltage/AU U -- MJ -0.10354148 -0.103547463 5.98295E-062275 Electricity, high voltage, Victoria average/AU U -- MJ -0.10354148 -0.103547463 5.98295E-062276 NPI Emissions from Pt Kembla Steelworks 2002-03 (1 kg production)/AU U -- n 2.93031E-06 -1.47518E-05 1.76821E-052277 Application of plant protection products, by field sprayer/CH U m2 0.00438063 -0.002624417 0.0070050462278 Fertilising, by broadcaster/CH U m2 0.002570542 -0.00155086 0.0041214012279 Tillage, hoeing and earthing-up, potatoes/CH U m2 0.001268776 -0.000757095 0.002025872280 Tillage, harrowing, by rotary harrow/CH U m2 0.001268776 -0.000757095 0.002025872281 Tillage, harrowing, by spring tine harrow/CH U m2 0.000769717 -0.000484684 0.0012544012282 Sowing/CH U m2 0.000723268 -0.000448474 0.0011717422283 Tillage, ploughing/CH U m2 0.000680709 -0.000414657 0.0010953662284 Mulching/CH U m2 0.000676947 -0.000412365 0.0010893112285 Green manure IP, until march/CH U m2 0.000675684 -0.000411361 0.0010870452286 Tillage, currying, by weeder/CH U m2 0.000635651 -0.000379551 0.0010152012287 Potato planting/CH U m2 0.000634388 -0.000378547 0.0010129352288 Potato haulm cutting/CH U m2 0.000634388 -0.000378547 0.0010129352289 Harvesting, by complete harvester, potatoes/CH U m2 0.000634388 -0.000378547 0.0010129352290 Combine harvesting/CH U m2 4.63214E-05 -3.61096E-05 8.2431E-052291 Green manure IP, until January/CH U m2 1.26269E-06 -1.00335E-06 2.26604E-062292 Zinc coating, coils/RER U m2 5.4307E-07 -2.99757E-07 8.42827E-072293 Recultivation, limestone mine/CH U m2 1.22576E-07 -7.66192E-08 1.99195E-072294 Building, hall, steel construction/CH/I U m2 1.0013E-07 -5.52692E-08 1.55399E-072295 Shed/CH/I U m2 1.77844E-08 -1.05858E-08 2.83702E-082296 Recultivation, bauxite mine/GLO U m2 8.26593E-09 -3.26379E-09 1.15297E-082297 Building, hall/CH/I U m2 5.23644E-09 -2.88787E-09 8.12431E-092298 Building, hall, wood construction/CH/I U m2 1.57093E-09 -8.6636E-10 2.43729E-092299 Zinc coating, pieces/RER U m2 5.42555E-10 -3.22949E-10 8.65505E-102300 Recultivation, iron mine/GLO U m2 4.54226E-10 -2.93101E-10 7.47328E-102301 Pine plantation, mass allocation/AU U -- m2 3.54321E-10 -2.88972E-10 6.43292E-102302 Green manure IP, until April/CH U m2 3.16124E-10 -1.96071E-10 5.12195E-102303 Hoeing/CH U m2 3.13496E-10 -1.94441E-10 5.07937E-102304 Recultivation, bentonite mine/DE U m2 2.9991E-11 -1.89014E-11 4.88924E-112305 Mowing, by rotary mower/CH U m2 1.57825E-11 -9.78885E-12 2.55713E-112306 Zinc coating, pieces, adjustment per um/RER U m2 2.63166E-12 -1.6208E-12 4.25246E-122307 Electricity to produce 1 paper bill p 1 x 12308 Infra oceanic freighter U - p 2.82318E-05 -1.16931E-06 2.94011E-052309 Infra oceanic tanker U - p 2.45512E-05 -8.9919E-07 2.54504E-052310 Infra pipeline onshore U - p 1.04033E-05 -3.82235E-07 1.07856E-052311 EUR-flat pallet/RER U p 3.62495E-06 -2.99717E-08 3.65492E-062312 Infra pipeline offshore U - p 7.3945E-07 -2.70009E-08 7.66451E-072313 Infra freighter inland U - p 6.33508E-07 -2.57358E-08 6.59244E-072314 Infra tanker inland U - p 1.56025E-07 -7.07182E-09 1.63097E-072315 Infra refinery U - p 5.72831E-09 -2.10219E-10 5.93853E-092316 Infra transport long distance U - p 5.72671E-09 -2.10201E-10 5.93691E-092317 mc-Si wafer, at plant/RER U p 4.98903E-09 -3.09789E-09 8.08692E-092318 Photovoltaic cell, mc-Si, at plant/RER U p 4.75146E-09 -2.95037E-09 7.70183E-092319 Infra production oil onshore U - p 3.1745E-09 -1.16762E-10 3.29127E-092320 Infra production oil offshore U - p 2.55359E-09 -9.34896E-11 2.64708E-092321 Infra exploration U - p 1.92475E-09 -6.30037E-11 1.98775E-09
22 of 25
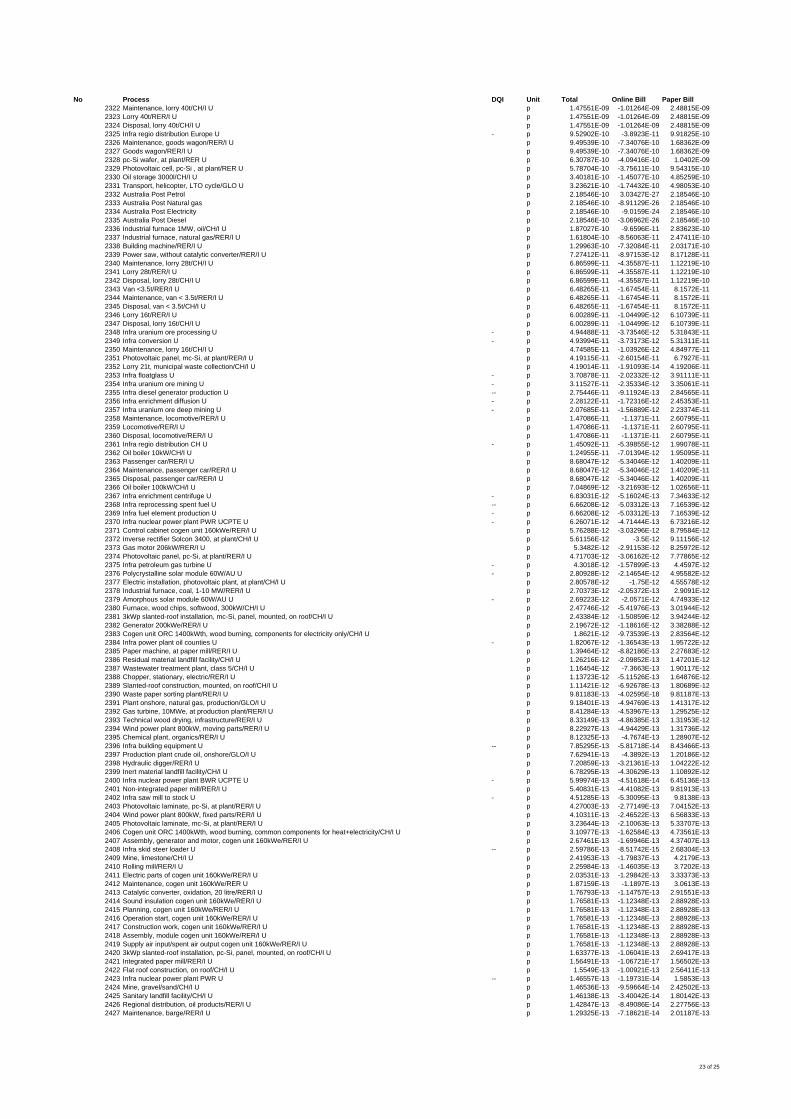
No Process DQI Unit Total Online Bill Paper Bill2322 Maintenance, lorry 40t/CH/I U p 1.47551E-09 -1.01264E-09 2.48815E-092323 Lorry 40t/RER/I U p 1.47551E-09 -1.01264E-09 2.48815E-092324 Disposal, lorry 40t/CH/I U p 1.47551E-09 -1.01264E-09 2.48815E-092325 Infra regio distribution Europe U - p 9.52902E-10 -3.8923E-11 9.91825E-102326 Maintenance, goods wagon/RER/I U p 9.49539E-10 -7.34076E-10 1.68362E-092327 Goods wagon/RER/I U p 9.49539E-10 -7.34076E-10 1.68362E-092328 pc-Si wafer, at plant/RER U p 6.30787E-10 -4.09416E-10 1.0402E-092329 Photovoltaic cell, pc-Si , at plant/RER U p 5.78704E-10 -3.75611E-10 9.54315E-102330 Oil storage 3000l/CH/I U p 3.40181E-10 -1.45077E-10 4.85259E-102331 Transport, helicopter, LTO cycle/GLO U p 3.23621E-10 -1.74432E-10 4.98053E-102332 Australia Post Petrol p 2.18546E-10 3.03427E-27 2.18546E-102333 Australia Post Natural gas p 2.18546E-10 -8.91129E-26 2.18546E-102334 Australia Post Electricity p 2.18546E-10 -9.0159E-24 2.18546E-102335 Australia Post Diesel p 2.18546E-10 -3.06962E-26 2.18546E-102336 Industrial furnace 1MW, oil/CH/I U p 1.87027E-10 -9.6596E-11 2.83623E-102337 Industrial furnace, natural gas/RER/I U p 1.61804E-10 -8.56063E-11 2.47411E-102338 Building machine/RER/I U p 1.29963E-10 -7.32084E-11 2.03171E-102339 Power saw, without catalytic converter/RER/I U p 7.27412E-11 -8.97153E-12 8.17128E-112340 Maintenance, lorry 28t/CH/I U p 6.86599E-11 -4.35587E-11 1.12219E-102341 Lorry 28t/RER/I U p 6.86599E-11 -4.35587E-11 1.12219E-102342 Disposal, lorry 28t/CH/I U p 6.86599E-11 -4.35587E-11 1.12219E-102343 Van <3.5t/RER/I U p 6.48265E-11 -1.67454E-11 8.1572E-112344 Maintenance, van < 3.5t/RER/I U p 6.48265E-11 -1.67454E-11 8.1572E-112345 Disposal, van < 3.5t/CH/I U p 6.48265E-11 -1.67454E-11 8.1572E-112346 Lorry 16t/RER/I U p 6.00289E-11 -1.04499E-12 6.10739E-112347 Disposal, lorry 16t/CH/I U p 6.00289E-11 -1.04499E-12 6.10739E-112348 Infra uranium ore processing U - p 4.94488E-11 -3.73546E-12 5.31843E-112349 Infra conversion U - p 4.93994E-11 -3.73173E-12 5.31311E-112350 Maintenance, lorry 16t/CH/I U p 4.74585E-11 -1.03926E-12 4.84977E-112351 Photovoltaic panel, mc-Si, at plant/RER/I U p 4.19115E-11 -2.60154E-11 6.7927E-112352 Lorry 21t, municipal waste collection/CH/I U p 4.19014E-11 -1.91093E-14 4.19206E-112353 Infra floatglass U - p 3.70878E-11 -2.02332E-12 3.91111E-112354 Infra uranium ore mining U - p 3.11527E-11 -2.35334E-12 3.35061E-112355 Infra diesel generator production U -- p 2.75446E-11 -9.11924E-13 2.84565E-112356 Infra enrichment diffusion U - p 2.28122E-11 -1.72316E-12 2.45353E-112357 Infra uranium ore deep mining U - p 2.07685E-11 -1.56889E-12 2.23374E-112358 Maintenance, locomotive/RER/I U p 1.47086E-11 -1.1371E-11 2.60795E-112359 Locomotive/RER/I U p 1.47086E-11 -1.1371E-11 2.60795E-112360 Disposal, locomotive/RER/I U p 1.47086E-11 -1.1371E-11 2.60795E-112361 Infra regio distribution CH U - p 1.45092E-11 -5.39855E-12 1.99078E-112362 Oil boiler 10kW/CH/I U p 1.24955E-11 -7.01394E-12 1.95095E-112363 Passenger car/RER/I U p 8.68047E-12 -5.34046E-12 1.40209E-112364 Maintenance, passenger car/RER/I U p 8.68047E-12 -5.34046E-12 1.40209E-112365 Disposal, passenger car/RER/I U p 8.68047E-12 -5.34046E-12 1.40209E-112366 Oil boiler 100kW/CH/I U p 7.04869E-12 -3.21693E-12 1.02656E-112367 Infra enrichment centrifuge U - p 6.83031E-12 -5.16024E-13 7.34633E-122368 Infra reprocessing spent fuel U -- p 6.66208E-12 -5.03312E-13 7.16539E-122369 Infra fuel element production U - p 6.66208E-12 -5.03312E-13 7.16539E-122370 Infra nuclear power plant PWR UCPTE U - p 6.26071E-12 -4.71444E-13 6.73216E-122371 Control cabinet cogen unit 160kWe/RER/I U p 5.76288E-12 -3.03296E-12 8.79584E-122372 Inverse rectifier Solcon 3400, at plant/CH/I U p 5.61156E-12 -3.5E-12 9.11156E-122373 Gas motor 206kW/RER/I U p 5.3482E-12 -2.91153E-12 8.25972E-122374 Photovoltaic panel, pc-Si, at plant/RER/I U p 4.71703E-12 -3.06162E-12 7.77865E-122375 Infra petroleum gas turbine U - p 4.3018E-12 -1.57899E-13 4.4597E-122376 Polycrystalline solar module 60W/AU U - p 2.80928E-12 -2.14654E-12 4.95582E-122377 Electric installation, photovoltaic plant, at plant/CH/I U p 2.80578E-12 -1.75E-12 4.55578E-122378 Industrial furnace, coal, 1-10 MW/RER/I U p 2.70373E-12 -2.05372E-13 2.9091E-122379 Amorphous solar module 60W/AU U - p 2.69223E-12 -2.0571E-12 4.74933E-122380 Furnace, wood chips, softwood, 300kW/CH/I U p 2.47746E-12 -5.41976E-13 3.01944E-122381 3kWp slanted-roof installation, mc-Si, panel, mounted, on roof/CH/I U p 2.43384E-12 -1.50859E-12 3.94244E-122382 Generator 200kWe/RER/I U p 2.19672E-12 -1.18616E-12 3.38288E-122383 Cogen unit ORC 1400kWth, wood burning, components for electricity only/CH/I U p 1.8621E-12 -9.73539E-13 2.83564E-122384 Infra power plant oil counties U - p 1.82067E-12 -1.36543E-13 1.95722E-122385 Paper machine, at paper mill/RER/I U p 1.39464E-12 -8.82186E-13 2.27683E-122386 Residual material landfill facility/CH/I U p 1.26216E-12 -2.09852E-13 1.47201E-122387 Wastewater treatment plant, class 5/CH/I U p 1.16454E-12 -7.3663E-13 1.90117E-122388 Chopper, stationary, electric/RER/I U p 1.13723E-12 -5.11526E-13 1.64876E-122389 Slanted-roof construction, mounted, on roof/CH/I U p 1.11421E-12 -6.92678E-13 1.80689E-122390 Waste paper sorting plant/RER/I U p 9.81183E-13 -4.02595E-18 9.81187E-132391 Plant onshore, natural gas, production/GLO/I U p 9.18401E-13 -4.94769E-13 1.41317E-122392 Gas turbine, 10MWe, at production plant/RER/I U p 8.41284E-13 -4.53967E-13 1.29525E-122393 Technical wood drying, infrastructure/RER/I U p 8.33149E-13 -4.86385E-13 1.31953E-122394 Wind power plant 800kW, moving parts/RER/I U p 8.22927E-13 -4.94429E-13 1.31736E-122395 Chemical plant, organics/RER/I U p 8.12325E-13 -4.7674E-13 1.28907E-122396 Infra building equipment U -- p 7.85295E-13 -5.81718E-14 8.43466E-132397 Production plant crude oil, onshore/GLO/I U p 7.62941E-13 -4.3892E-13 1.20186E-122398 Hydraulic digger/RER/I U p 7.20859E-13 -3.21361E-13 1.04222E-122399 Inert material landfill facility/CH/I U p 6.78295E-13 -4.30629E-13 1.10892E-122400 Infra nuclear power plant BWR UCPTE U - p 5.99974E-13 -4.51618E-14 6.45136E-132401 Non-integrated paper mill/RER/I U p 5.40831E-13 -4.41082E-13 9.81913E-132402 Infra saw mill to stock U - p 4.51285E-13 -5.30095E-13 9.8138E-132403 Photovoltaic laminate, pc-Si, at plant/RER/I U p 4.27003E-13 -2.77149E-13 7.04152E-132404 Wind power plant 800kW, fixed parts/RER/I U p 4.10311E-13 -2.46522E-13 6.56833E-132405 Photovoltaic laminate, mc-Si, at plant/RER/I U p 3.23644E-13 -2.10063E-13 5.33707E-132406 Cogen unit ORC 1400kWth, wood burning, common components for heat+electricity/CH/I U p 3.10977E-13 -1.62584E-13 4.73561E-132407 Assembly, generator and motor, cogen unit 160kWe/RER/I U p 2.67461E-13 -1.69946E-13 4.37407E-132408 Infra skid steer loader U -- p 2.59786E-13 -8.51742E-15 2.68304E-132409 Mine, limestone/CH/I U p 2.41953E-13 -1.79837E-13 4.2179E-132410 Rolling mill/RER/I U p 2.25984E-13 -1.46035E-13 3.7202E-132411 Electric parts of cogen unit 160kWe/RER/I U p 2.03531E-13 -1.29842E-13 3.33373E-132412 Maintenance, cogen unit 160kWe/RER U p 1.87159E-13 -1.1897E-13 3.0613E-132413 Catalytic converter, oxidation, 20 litre/RER/I U p 1.76793E-13 -1.14757E-13 2.91551E-132414 Sound insulation cogen unit 160kWe/RER/I U p 1.76581E-13 -1.12348E-13 2.88928E-132415 Planning, cogen unit 160kWe/RER/I U p 1.76581E-13 -1.12348E-13 2.88928E-132416 Operation start, cogen unit 160kWe/RER/I U p 1.76581E-13 -1.12348E-13 2.88928E-132417 Construction work, cogen unit 160kWe/RER/I U p 1.76581E-13 -1.12348E-13 2.88928E-132418 Assembly, module cogen unit 160kWe/RER/I U p 1.76581E-13 -1.12348E-13 2.88928E-132419 Supply air input/spent air output cogen unit 160kWe/RER/I U p 1.76581E-13 -1.12348E-13 2.88928E-132420 3kWp slanted-roof installation, pc-Si, panel, mounted, on roof/CH/I U p 1.63377E-13 -1.06041E-13 2.69417E-132421 Integrated paper mill/RER/I U p 1.56491E-13 -1.06721E-17 1.56502E-132422 Flat roof construction, on roof/CH/I U p 1.5549E-13 -1.00921E-13 2.56411E-132423 Infra nuclear power plant PWR U -- p 1.46557E-13 -1.19731E-14 1.5853E-132424 Mine, gravel/sand/CH/I U p 1.46536E-13 -9.59664E-14 2.42502E-132425 Sanitary landfill facility/CH/I U p 1.46138E-13 -3.40042E-14 1.80142E-132426 Regional distribution, oil products/RER/I U p 1.42847E-13 -8.49086E-14 2.27756E-132427 Maintenance, barge/RER/I U p 1.29325E-13 -7.18621E-14 2.01187E-13
23 of 25
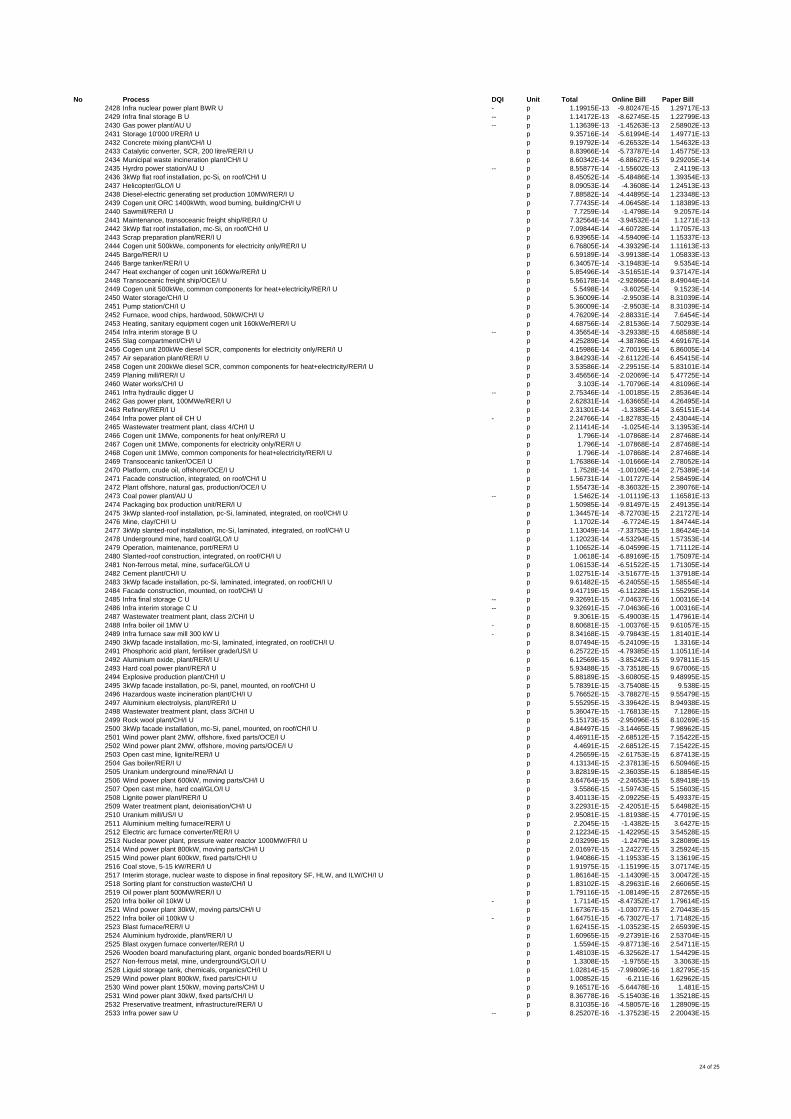
No Process DQI Unit Total Online Bill Paper Bill2428 Infra nuclear power plant BWR U - p 1.19915E-13 -9.80247E-15 1.29717E-132429 Infra final storage B U -- p 1.14172E-13 -8.62745E-15 1.22799E-132430 Gas power plant/AU U -- p 1.13639E-13 -1.45263E-13 2.58902E-132431 Storage 10'000 l/RER/I U p 9.35716E-14 -5.61994E-14 1.49771E-132432 Concrete mixing plant/CH/I U p 9.19792E-14 -6.26532E-14 1.54632E-132433 Catalytic converter, SCR, 200 litre/RER/I U p 8.83966E-14 -5.73787E-14 1.45775E-132434 Municipal waste incineration plant/CH/I U p 8.60342E-14 -6.88627E-15 9.29205E-142435 Hyrdro power station/AU U -- p 8.55877E-14 -1.55602E-13 2.4119E-132436 3kWp flat roof installation, pc-Si, on roof/CH/I U p 8.45052E-14 -5.48486E-14 1.39354E-132437 Helicopter/GLO/I U p 8.09053E-14 -4.3608E-14 1.24513E-132438 Diesel-electric generating set production 10MW/RER/I U p 7.88582E-14 -4.44895E-14 1.23348E-132439 Cogen unit ORC 1400kWth, wood burning, building/CH/I U p 7.77435E-14 -4.06458E-14 1.18389E-132440 Sawmill/RER/I U p 7.7259E-14 -1.4798E-14 9.2057E-142441 Maintenance, transoceanic freight ship/RER/I U p 7.32564E-14 -3.94532E-14 1.1271E-132442 3kWp flat roof installation, mc-Si, on roof/CH/I U p 7.09844E-14 -4.60728E-14 1.17057E-132443 Scrap preparation plant/RER/I U p 6.93965E-14 -4.59409E-14 1.15337E-132444 Cogen unit 500kWe, components for electricity only/RER/I U p 6.76805E-14 -4.39329E-14 1.11613E-132445 Barge/RER/I U p 6.59189E-14 -3.99138E-14 1.05833E-132446 Barge tanker/RER/I U p 6.34057E-14 -3.19483E-14 9.5354E-142447 Heat exchanger of cogen unit 160kWe/RER/I U p 5.85496E-14 -3.51651E-14 9.37147E-142448 Transoceanic freight ship/OCE/I U p 5.56178E-14 -2.92866E-14 8.49044E-142449 Cogen unit 500kWe, common components for heat+electricity/RER/I U p 5.5498E-14 -3.6025E-14 9.1523E-142450 Water storage/CH/I U p 5.36009E-14 -2.9503E-14 8.31039E-142451 Pump station/CH/I U p 5.36009E-14 -2.9503E-14 8.31039E-142452 Furnace, wood chips, hardwood, 50kW/CH/I U p 4.76209E-14 -2.88331E-14 7.6454E-142453 Heating, sanitary equipment cogen unit 160kWe/RER/I U p 4.68756E-14 -2.81536E-14 7.50293E-142454 Infra interim storage B U -- p 4.35654E-14 -3.29338E-15 4.68588E-142455 Slag compartment/CH/I U p 4.25289E-14 -4.38786E-15 4.69167E-142456 Cogen unit 200kWe diesel SCR, components for electricity only/RER/I U p 4.15986E-14 -2.70019E-14 6.86005E-142457 Air separation plant/RER/I U p 3.84293E-14 -2.61122E-14 6.45415E-142458 Cogen unit 200kWe diesel SCR, common components for heat+electricity/RER/I U p 3.53586E-14 -2.29515E-14 5.83101E-142459 Planing mill/RER/I U p 3.45656E-14 -2.02069E-14 5.47725E-142460 Water works/CH/I U p 3.103E-14 -1.70796E-14 4.81096E-142461 Infra hydraulic digger U -- p 2.75346E-14 -1.00185E-15 2.85364E-142462 Gas power plant, 100MWe/RER/I U p 2.62831E-14 -1.63665E-14 4.26495E-142463 Refinery/RER/I U p 2.31301E-14 -1.3385E-14 3.65151E-142464 Infra power plant oil CH U - p 2.24766E-14 -1.82783E-15 2.43044E-142465 Wastewater treatment plant, class 4/CH/I U p 2.11414E-14 -1.0254E-14 3.13953E-142466 Cogen unit 1MWe, components for heat only/RER/I U p 1.796E-14 -1.07868E-14 2.87468E-142467 Cogen unit 1MWe, components for electricity only/RER/I U p 1.796E-14 -1.07868E-14 2.87468E-142468 Cogen unit 1MWe, common components for heat+electricity/RER/I U p 1.796E-14 -1.07868E-14 2.87468E-142469 Transoceanic tanker/OCE/I U p 1.76386E-14 -1.01666E-14 2.78052E-142470 Platform, crude oil, offshore/OCE/I U p 1.7528E-14 -1.00109E-14 2.75389E-142471 Facade construction, integrated, on roof/CH/I U p 1.56731E-14 -1.01727E-14 2.58459E-142472 Plant offshore, natural gas, production/OCE/I U p 1.55473E-14 -8.36032E-15 2.39076E-142473 Coal power plant/AU U -- p 1.5462E-14 -1.01119E-13 1.16581E-132474 Packaging box production unit/RER/I U p 1.50985E-14 -9.81497E-15 2.49135E-142475 3kWp slanted-roof installation, pc-Si, laminated, integrated, on roof/CH/I U p 1.34457E-14 -8.72703E-15 2.21727E-142476 Mine, clay/CH/I U p 1.1702E-14 -6.7724E-15 1.84744E-142477 3kWp slanted-roof installation, mc-Si, laminated, integrated, on roof/CH/I U p 1.13049E-14 -7.33753E-15 1.86424E-142478 Underground mine, hard coal/GLO/I U p 1.12023E-14 -4.53294E-15 1.57353E-142479 Operation, maintenance, port/RER/I U p 1.10652E-14 -6.04599E-15 1.71112E-142480 Slanted-roof construction, integrated, on roof/CH/I U p 1.0618E-14 -6.89169E-15 1.75097E-142481 Non-ferrous metal, mine, surface/GLO/I U p 1.06153E-14 -6.51522E-15 1.71305E-142482 Cement plant/CH/I U p 1.02751E-14 -3.51677E-15 1.37918E-142483 3kWp facade installation, pc-Si, laminated, integrated, on roof/CH/I U p 9.61482E-15 -6.24055E-15 1.58554E-142484 Facade construction, mounted, on roof/CH/I U p 9.41719E-15 -6.11228E-15 1.55295E-142485 Infra final storage C U -- p 9.32691E-15 -7.04637E-16 1.00316E-142486 Infra interim storage C U -- p 9.32691E-15 -7.04636E-16 1.00316E-142487 Wastewater treatment plant, class 2/CH/I U p 9.3061E-15 -5.49003E-15 1.47961E-142488 Infra boiler oil 1MW U - p 8.60681E-15 -1.00376E-15 9.61057E-152489 Infra furnace saw mill 300 kW U - p 8.34168E-15 -9.79843E-15 1.81401E-142490 3kWp facade installation, mc-Si, laminated, integrated, on roof/CH/I U p 8.07494E-15 -5.24109E-15 1.3316E-142491 Phosphoric acid plant, fertiliser grade/US/I U p 6.25722E-15 -4.79385E-15 1.10511E-142492 Aluminium oxide, plant/RER/I U p 6.12569E-15 -3.85242E-15 9.97811E-152493 Hard coal power plant/RER/I U p 5.93488E-15 -3.73518E-15 9.67006E-152494 Explosive production plant/CH/I U p 5.88189E-15 -3.60805E-15 9.48995E-152495 3kWp facade installation, pc-Si, panel, mounted, on roof/CH/I U p 5.78391E-15 -3.75408E-15 9.538E-152496 Hazardous waste incineration plant/CH/I U p 5.76652E-15 -3.78827E-15 9.55479E-152497 Aluminium electrolysis, plant/RER/I U p 5.55295E-15 -3.39642E-15 8.94938E-152498 Wastewater treatment plant, class 3/CH/I U p 5.36047E-15 -1.76813E-15 7.1286E-152499 Rock wool plant/CH/I U p 5.15173E-15 -2.95096E-15 8.10269E-152500 3kWp facade installation, mc-Si, panel, mounted, on roof/CH/I U p 4.84497E-15 -3.14465E-15 7.98962E-152501 Wind power plant 2MW, offshore, fixed parts/OCE/I U p 4.46911E-15 -2.68512E-15 7.15422E-152502 Wind power plant 2MW, offshore, moving parts/OCE/I U p 4.4691E-15 -2.68512E-15 7.15422E-152503 Open cast mine, lignite/RER/I U p 4.25659E-15 -2.61753E-15 6.87413E-152504 Gas boiler/RER/I U p 4.13134E-15 -2.37813E-15 6.50946E-152505 Uranium underground mine/RNA/I U p 3.82819E-15 -2.36035E-15 6.18854E-152506 Wind power plant 600kW, moving parts/CH/I U p 3.64764E-15 -2.24653E-15 5.89418E-152507 Open cast mine, hard coal/GLO/I U p 3.5586E-15 -1.59743E-15 5.15603E-152508 Lignite power plant/RER/I U p 3.40113E-15 -2.09225E-15 5.49337E-152509 Water treatment plant, deionisation/CH/I U p 3.22931E-15 -2.42051E-15 5.64982E-152510 Uranium mill/US/I U p 2.95081E-15 -1.81938E-15 4.77019E-152511 Aluminium melting furnace/RER/I U p 2.2045E-15 -1.4382E-15 3.6427E-152512 Electric arc furnace converter/RER/I U p 2.12234E-15 -1.42295E-15 3.54528E-152513 Nuclear power plant, pressure water reactor 1000MW/FR/I U p 2.03299E-15 -1.2479E-15 3.28089E-152514 Wind power plant 800kW, moving parts/CH/I U p 2.01697E-15 -1.24227E-15 3.25924E-152515 Wind power plant 600kW, fixed parts/CH/I U p 1.94086E-15 -1.19533E-15 3.13619E-152516 Coal stove, 5-15 kW/RER/I U p 1.91975E-15 -1.15199E-15 3.07174E-152517 Interim storage, nuclear waste to dispose in final repository SF, HLW, and ILW/CH/I U p 1.86164E-15 -1.14309E-15 3.00472E-152518 Sorting plant for construction waste/CH/I U p 1.83102E-15 -8.29631E-16 2.66065E-152519 Oil power plant 500MW/RER/I U p 1.79116E-15 -1.08149E-15 2.87265E-152520 Infra boiler oil 10kW U - p 1.7114E-15 -8.47352E-17 1.79614E-152521 Wind power plant 30kW, moving parts/CH/I U p 1.67367E-15 -1.03077E-15 2.70443E-152522 Infra boiler oil 100kW U - p 1.64751E-15 -6.73027E-17 1.71482E-152523 Blast furnace/RER/I U p 1.62415E-15 -1.03523E-15 2.65939E-152524 Aluminium hydroxide, plant/RER/I U p 1.60965E-15 -9.27391E-16 2.53704E-152525 Blast oxygen furnace converter/RER/I U p 1.5594E-15 -9.87713E-16 2.54711E-152526 Wooden board manufacturing plant, organic bonded boards/RER/I U p 1.48103E-15 -6.32562E-17 1.54429E-152527 Non-ferrous metal, mine, underground/GLO/I U p 1.3308E-15 -1.9755E-15 3.3063E-152528 Liquid storage tank, chemicals, organics/CH/I U p 1.02814E-15 -7.99809E-16 1.82795E-152529 Wind power plant 800kW, fixed parts/CH/I U p 1.00852E-15 -6.211E-16 1.62962E-152530 Wind power plant 150kW, moving parts/CH/I U p 9.16517E-16 -5.64478E-16 1.481E-152531 Wind power plant 30kW, fixed parts/CH/I U p 8.36778E-16 -5.15403E-16 1.35218E-152532 Preservative treatment, infrastructure/RER/I U p 8.31035E-16 -4.58057E-16 1.28909E-152533 Infra power saw U -- p 8.25207E-16 -1.37523E-15 2.20043E-15
24 of 25
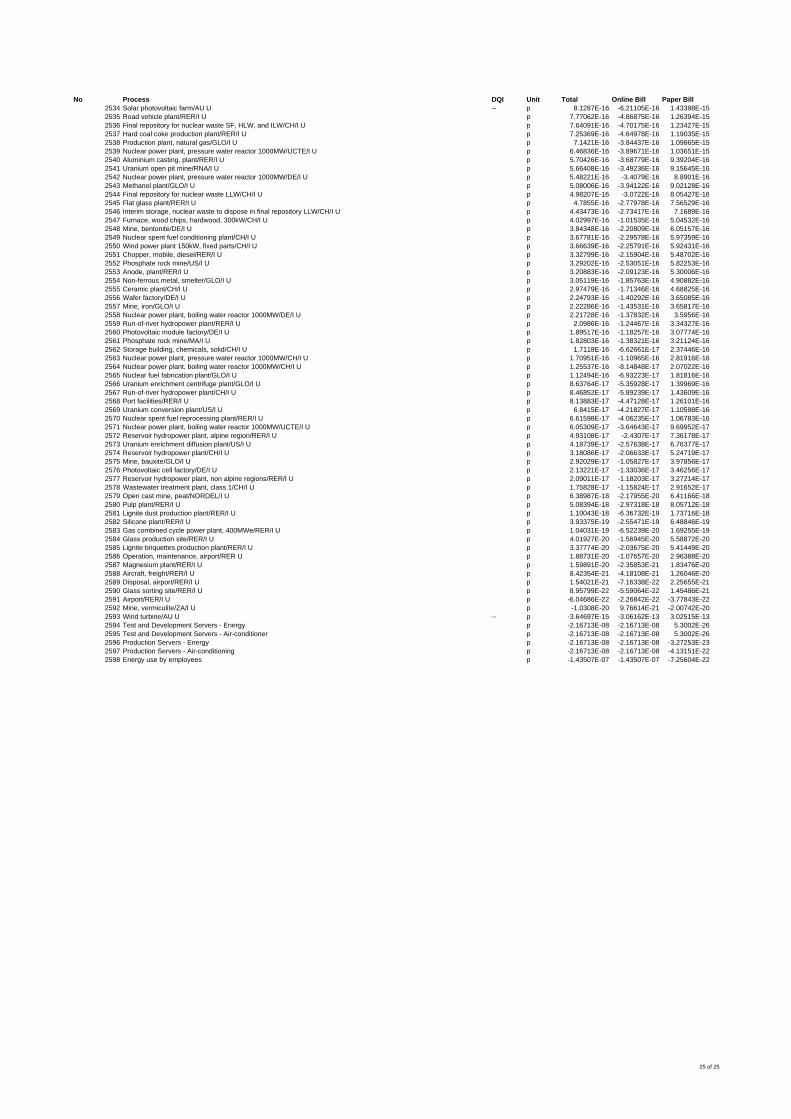
No Process DQI Unit Total Online Bill Paper Bill2534 Solar photovoltaic farm/AU U -- p 8.1287E-16 -6.21105E-16 1.43398E-152535 Road vehicle plant/RER/I U p 7.77062E-16 -4.86875E-16 1.26394E-152536 Final repository for nuclear waste SF, HLW, and ILW/CH/I U p 7.64091E-16 -4.70175E-16 1.23427E-152537 Hard coal coke production plant/RER/I U p 7.25369E-16 -4.64978E-16 1.19035E-152538 Production plant, natural gas/GLO/I U p 7.1421E-16 -3.84437E-16 1.09865E-152539 Nuclear power plant, pressure water reactor 1000MW/UCTE/I U p 6.46836E-16 -3.89671E-16 1.03651E-152540 Aluminium casting, plant/RER/I U p 5.70426E-16 -3.68779E-16 9.39204E-162541 Uranium open pit mine/RNA/I U p 5.66408E-16 -3.49236E-16 9.15645E-162542 Nuclear power plant, pressure water reactor 1000MW/DE/I U p 5.48221E-16 -3.4079E-16 8.8901E-162543 Methanol plant/GLO/I U p 5.08006E-16 -3.94122E-16 9.02128E-162544 Final repository for nuclear waste LLW/CH/I U p 4.98207E-16 -3.0722E-16 8.05427E-162545 Flat glass plant/RER/I U p 4.7855E-16 -2.77978E-16 7.56529E-162546 Interim storage, nuclear waste to dispose in final repository LLW/CH/I U p 4.43473E-16 -2.73417E-16 7.1689E-162547 Furnace, wood chips, hardwood, 300kW/CH/I U p 4.02997E-16 -1.01535E-16 5.04532E-162548 Mine, bentonite/DE/I U p 3.84348E-16 -2.20809E-16 6.05157E-162549 Nuclear spent fuel conditioning plant/CH/I U p 3.67781E-16 -2.29578E-16 5.97359E-162550 Wind power plant 150kW, fixed parts/CH/I U p 3.66639E-16 -2.25791E-16 5.92431E-162551 Chopper, mobile, diesel/RER/I U p 3.32799E-16 -2.15904E-16 5.48702E-162552 Phosphate rock mine/US/I U p 3.29202E-16 -2.53051E-16 5.82253E-162553 Anode, plant/RER/I U p 3.20883E-16 -2.09123E-16 5.30006E-162554 Non-ferrous metal, smelter/GLO/I U p 3.05119E-16 -1.85763E-16 4.90882E-162555 Ceramic plant/CH/I U p 2.97479E-16 -1.71346E-16 4.68825E-162556 Wafer factory/DE/I U p 2.24793E-16 -1.40292E-16 3.65085E-162557 Mine, iron/GLO/I U p 2.22286E-16 -1.43531E-16 3.65817E-162558 Nuclear power plant, boiling water reactor 1000MW/DE/I U p 2.21728E-16 -1.37832E-16 3.5956E-162559 Run-of-river hydropower plant/RER/I U p 2.0986E-16 -1.24467E-16 3.34327E-162560 Photovoltaic module factory/DE/I U p 1.89517E-16 -1.18257E-16 3.07774E-162561 Phosphate rock mine/MA/I U p 1.82803E-16 -1.38321E-16 3.21124E-162562 Storage building, chemicals, solid/CH/I U p 1.7118E-16 -6.62661E-17 2.37446E-162563 Nuclear power plant, pressure water reactor 1000MW/CH/I U p 1.70951E-16 -1.10965E-16 2.81916E-162564 Nuclear power plant, boiling water reactor 1000MW/CH/I U p 1.25537E-16 -8.14848E-17 2.07022E-162565 Nuclear fuel fabrication plant/GLO/I U p 1.12494E-16 -6.93223E-17 1.81816E-162566 Uranium enrichment centrifuge plant/GLO/I U p 8.63764E-17 -5.35928E-17 1.39969E-162567 Run-of-river hydropower plant/CH/I U p 8.46852E-17 -5.89239E-17 1.43609E-162568 Port facilities/RER/I U p 8.13883E-17 -4.47128E-17 1.26101E-162569 Uranium conversion plant/US/I U p 6.8415E-17 -4.21827E-17 1.10598E-162570 Nuclear spent fuel reprocessing plant/RER/I U p 6.61598E-17 -4.06235E-17 1.06783E-162571 Nuclear power plant, boiling water reactor 1000MW/UCTE/I U p 6.05309E-17 -3.64643E-17 9.69952E-172572 Reservoir hydropower plant, alpine region/RER/I U p 4.93108E-17 -2.4307E-17 7.36178E-172573 Uranium enrichment diffusion plant/US/I U p 4.18739E-17 -2.57638E-17 6.76377E-172574 Reservoir hydropower plant/CH/I U p 3.18086E-17 -2.06633E-17 5.24719E-172575 Mine, bauxite/GLO/I U p 2.92029E-17 -1.05827E-17 3.97856E-172576 Photovoltaic cell factory/DE/I U p 2.13221E-17 -1.33036E-17 3.46256E-172577 Reservoir hydropower plant, non alpine regions/RER/I U p 2.09011E-17 -1.18203E-17 3.27214E-172578 Wastewater treatment plant, class 1/CH/I U p 1.75828E-17 -1.15824E-17 2.91652E-172579 Open cast mine, peat/NORDEL/I U p 6.38987E-18 -2.17955E-20 6.41166E-182580 Pulp plant/RER/I U p 5.08394E-18 -2.97318E-18 8.05712E-182581 Lignite dust production plant/RER/I U p 1.10043E-18 -6.36732E-19 1.73716E-182582 Silicone plant/RER/I U p 3.93375E-19 -2.55471E-19 6.48846E-192583 Gas combined cycle power plant, 400MWe/RER/I U p 1.04031E-19 -6.52239E-20 1.69255E-192584 Glass production site/RER/I U p 4.01927E-20 -1.56945E-20 5.58872E-202585 Lignite briquettes production plant/RER/I U p 3.37774E-20 -2.03675E-20 5.41449E-202586 Operation, maintenance, airport/RER U p 1.88731E-20 -1.07657E-20 2.96388E-202587 Magnesium plant/RER/I U p 1.59891E-20 -2.35853E-21 1.83476E-202588 Aircraft, freight/RER/I U p 8.42354E-21 -4.18108E-21 1.26046E-202589 Disposal, airport/RER/I U p 1.54021E-21 -7.16338E-22 2.25655E-212590 Glass sorting site/RER/I U p 8.95799E-22 -5.59064E-22 1.45486E-212591 Airport/RER/I U p -6.04686E-22 -2.26842E-22 -3.77843E-222592 Mine, vermiculite/ZA/I U p -1.0308E-20 9.76614E-21 -2.00742E-202593 Wind turbine/AU U -- p -3.64697E-15 -3.06162E-13 3.02515E-132594 Test and Development Servers - Energy p -2.16713E-08 -2.16713E-08 5.3002E-262595 Test and Development Servers - Air-conditioner p -2.16713E-08 -2.16713E-08 5.3002E-262596 Production Servers - Energy p -2.16713E-08 -2.16713E-08 -3.27253E-232597 Production Servers - Air-conditioning p -2.16713E-08 -2.16713E-08 -4.13151E-222598 Energy use by employees p -1.43507E-07 -1.43507E-07 -7.25604E-22
25 of 25
O N L I N E B I L L I N G L I F E C Y C L E A N A L Y S I S
Appendix B Data Output Tables from SIMAPRO
Prepared for Telstra, 29 April 2008.
B.3 Paper Inventory
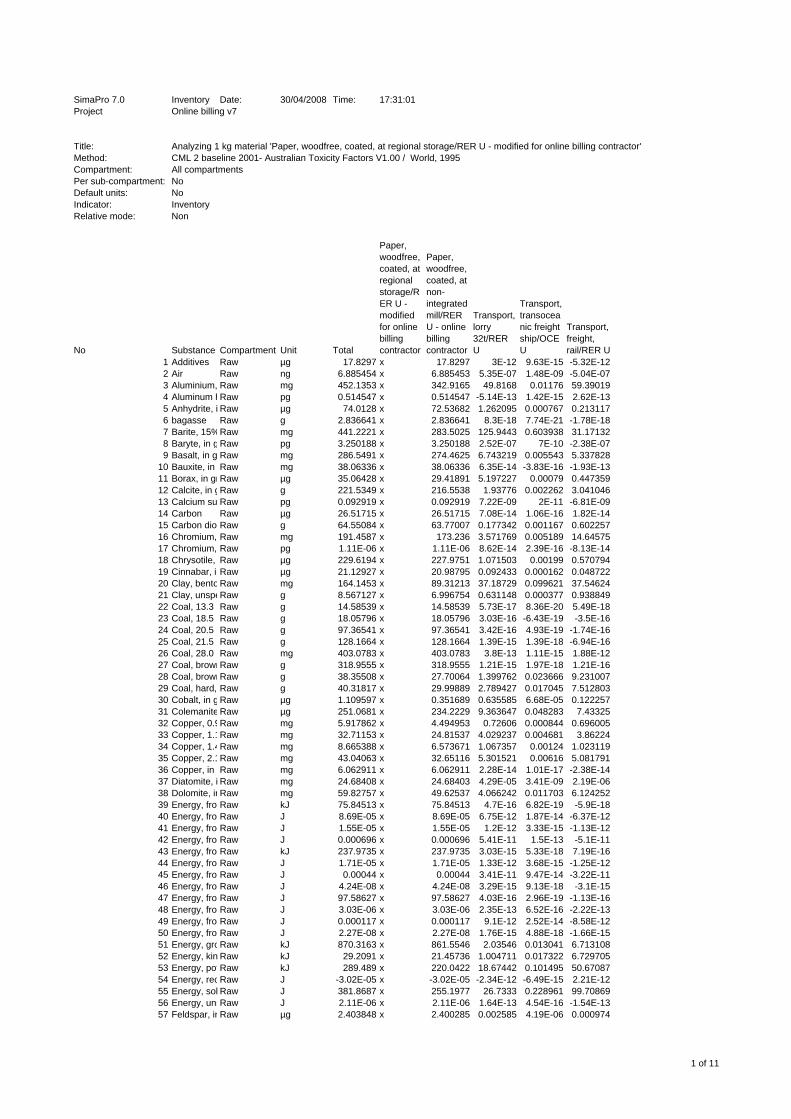
SimaPro 7.0 Inventory Date: 30/04/2008 Time: 17:31:01Project Online billing v7
Title: Analyzing 1 kg material 'Paper, woodfree, coated, at regional storage/RER U - modified for online billing contractor'Method: CML 2 baseline 2001- Australian Toxicity Factors V1.00 / World, 1995Compartment: All compartmentsPer sub-compartment: NoDefault units: NoIndicator: InventoryRelative mode: Non
No Substance Compartment Unit Total
Paper, woodfree, coated, at regional storage/RER U - modified for online billing contractor
Paper, woodfree, coated, at non-integrated mill/RER U - online billing contractor
Transport, lorry 32t/RER U
Transport, transoceanic freight ship/OCE U
Transport, freight, rail/RER U
1 Additives Raw µg 17.8297 x 17.8297 3E-12 9.63E-15 -5.32E-122 Air Raw ng 6.885454 x 6.885453 5.35E-07 1.48E-09 -5.04E-073 Aluminium, Raw mg 452.1353 x 342.9165 49.8168 0.01176 59.390194 Aluminum hRaw pg 0.514547 x 0.514547 -5.14E-13 1.42E-15 2.62E-135 Anhydrite, i Raw µg 74.0128 x 72.53682 1.262095 0.000767 0.2131176 bagasse Raw g 2.836641 x 2.836641 8.3E-18 7.74E-21 -1.78E-187 Barite, 15%Raw mg 441.2221 x 283.5025 125.9443 0.603938 31.171328 Baryte, in g Raw pg 3.250188 x 3.250188 2.52E-07 7E-10 -2.38E-079 Basalt, in g Raw mg 286.5491 x 274.4625 6.743219 0.005543 5.337828
10 Bauxite, in gRaw mg 38.06336 x 38.06336 6.35E-14 -3.83E-16 -1.93E-1311 Borax, in grRaw µg 35.06428 x 29.41891 5.197227 0.00079 0.44735912 Calcite, in gRaw g 221.5349 x 216.5538 1.93776 0.002262 3.04104613 Calcium su Raw pg 0.092919 x 0.092919 7.22E-09 2E-11 -6.81E-0914 Carbon Raw µg 26.51715 x 26.51715 7.08E-14 1.06E-16 1.82E-1415 Carbon dioxRaw g 64.55084 x 63.77007 0.177342 0.001167 0.60225716 Chromium, Raw mg 191.4587 x 173.236 3.571769 0.005189 14.6457517 Chromium, Raw pg 1.11E-06 x 1.11E-06 8.62E-14 2.39E-16 -8.13E-1418 Chrysotile, Raw µg 229.6194 x 227.9751 1.071503 0.00199 0.57079419 Cinnabar, inRaw µg 21.12927 x 20.98795 0.092433 0.000162 0.04872220 Clay, bento Raw mg 164.1453 x 89.31213 37.18729 0.099621 37.5462421 Clay, unspeRaw g 8.567127 x 6.996754 0.631148 0.000377 0.93884922 Coal, 13.3 MRaw g 14.58539 x 14.58539 5.73E-17 8.36E-20 5.49E-1823 Coal, 18.5 MRaw g 18.05796 x 18.05796 3.03E-16 -6.43E-19 -3.5E-1624 Coal, 20.5 MRaw g 97.36541 x 97.36541 3.42E-16 4.93E-19 -1.74E-1625 Coal, 21.5 MRaw g 128.1664 x 128.1664 1.39E-15 1.39E-18 -6.94E-1626 Coal, 28.0 MRaw mg 403.0783 x 403.0783 3.8E-13 1.11E-15 1.88E-1227 Coal, brownRaw g 318.9555 x 318.9555 1.21E-15 1.97E-18 1.21E-1628 Coal, brownRaw g 38.35508 x 27.70064 1.399762 0.023666 9.23100729 Coal, hard, Raw g 40.31817 x 29.99889 2.789427 0.017045 7.51280330 Cobalt, in g Raw µg 1.109597 x 0.351689 0.635585 6.68E-05 0.12225731 Colemanite Raw µg 251.0681 x 234.2229 9.363647 0.048283 7.4332532 Copper, 0.9Raw mg 5.917862 x 4.494953 0.72606 0.000844 0.69600533 Copper, 1.1Raw mg 32.71153 x 24.81537 4.029237 0.004681 3.8622434 Copper, 1.4Raw mg 8.665388 x 6.573671 1.067357 0.00124 1.02311935 Copper, 2.1Raw mg 43.04063 x 32.65116 5.301521 0.00616 5.08179136 Copper, in gRaw mg 6.062911 x 6.062911 2.28E-14 1.01E-17 -2.38E-1437 Diatomite, i Raw mg 24.68408 x 24.68403 4.29E-05 3.41E-09 2.19E-0638 Dolomite, inRaw mg 59.82757 x 49.62537 4.066242 0.011703 6.12425239 Energy, fromRaw kJ 75.84513 x 75.84513 4.7E-16 6.82E-19 -5.9E-1840 Energy, fromRaw J 8.69E-05 x 8.69E-05 6.75E-12 1.87E-14 -6.37E-1241 Energy, fromRaw J 1.55E-05 x 1.55E-05 1.2E-12 3.33E-15 -1.13E-1242 Energy, fromRaw J 0.000696 x 0.000696 5.41E-11 1.5E-13 -5.1E-1143 Energy, fromRaw kJ 237.9735 x 237.9735 3.03E-15 5.33E-18 7.19E-1644 Energy, fromRaw J 1.71E-05 x 1.71E-05 1.33E-12 3.68E-15 -1.25E-1245 Energy, fromRaw J 0.00044 x 0.00044 3.41E-11 9.47E-14 -3.22E-1146 Energy, fromRaw J 4.24E-08 x 4.24E-08 3.29E-15 9.13E-18 -3.1E-1547 Energy, fromRaw J 97.58627 x 97.58627 4.03E-16 2.96E-19 -1.13E-1648 Energy, fromRaw J 3.03E-06 x 3.03E-06 2.35E-13 6.52E-16 -2.22E-1349 Energy, fromRaw J 0.000117 x 0.000117 9.1E-12 2.52E-14 -8.58E-1250 Energy, fromRaw J 2.27E-08 x 2.27E-08 1.76E-15 4.88E-18 -1.66E-1551 Energy, groRaw kJ 870.3163 x 861.5546 2.03546 0.013041 6.71310852 Energy, kin Raw kJ 29.2091 x 21.45736 1.004711 0.017322 6.72970553 Energy, potRaw kJ 289.489 x 220.0422 18.67442 0.101495 50.6708754 Energy, recRaw J -3.02E-05 x -3.02E-05 -2.34E-12 -6.49E-15 2.21E-1255 Energy, sol Raw J 381.8687 x 255.1977 26.7333 0.228961 99.7086956 Energy, unsRaw J 2.11E-06 x 2.11E-06 1.64E-13 4.54E-16 -1.54E-1357 Feldspar, inRaw µg 2.403848 x 2.400285 0.002585 4.19E-06 0.000974
1 of 11
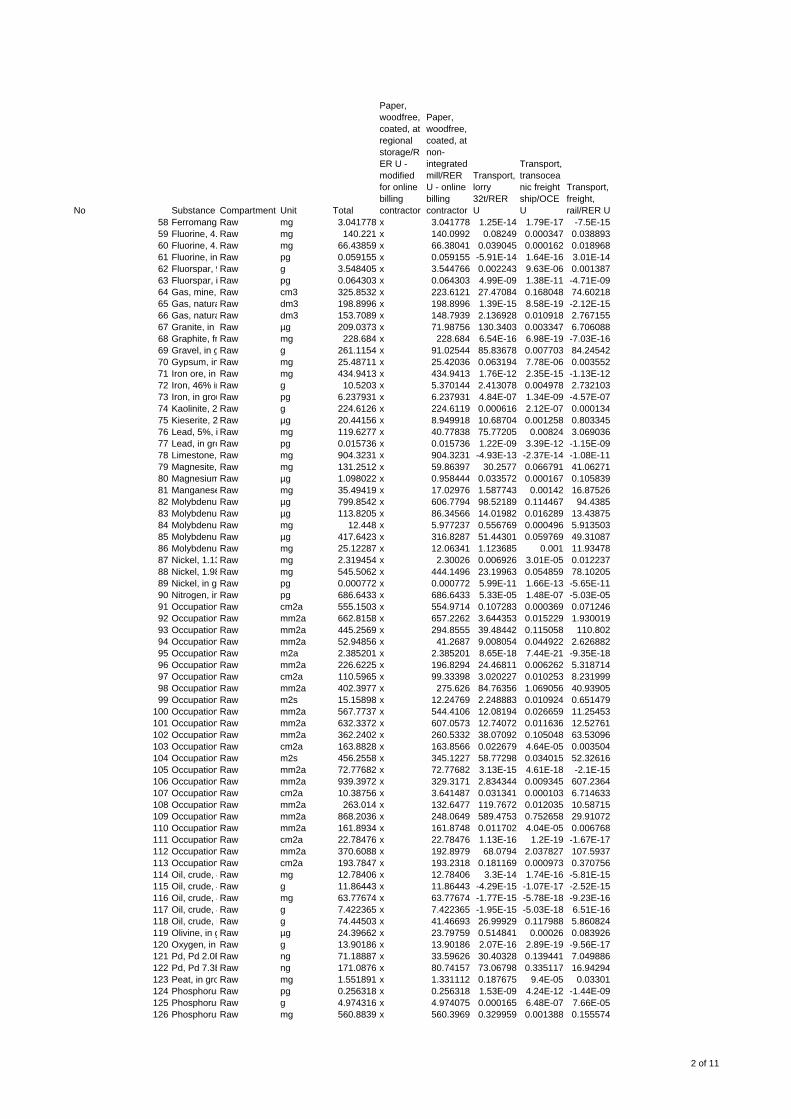
No Substance Compartment Unit Total
Paper, woodfree, coated, at regional storage/RER U - modified for online billing contractor
Paper, woodfree, coated, at non-integrated mill/RER U - online billing contractor
Transport, lorry 32t/RER U
Transport, transoceanic freight ship/OCE U
Transport, freight, rail/RER U
58 FerromangaRaw mg 3.041778 x 3.041778 1.25E-14 1.79E-17 -7.5E-1559 Fluorine, 4. Raw mg 140.221 x 140.0992 0.08249 0.000347 0.03889360 Fluorine, 4. Raw mg 66.43859 x 66.38041 0.039045 0.000162 0.01896861 Fluorine, in Raw pg 0.059155 x 0.059155 -5.91E-14 1.64E-16 3.01E-1462 Fluorspar, 9Raw g 3.548405 x 3.544766 0.002243 9.63E-06 0.00138763 Fluorspar, i Raw pg 0.064303 x 0.064303 4.99E-09 1.38E-11 -4.71E-0964 Gas, mine, Raw cm3 325.8532 x 223.6121 27.47084 0.168048 74.6021865 Gas, naturaRaw dm3 198.8996 x 198.8996 1.39E-15 8.58E-19 -2.12E-1566 Gas, naturaRaw dm3 153.7089 x 148.7939 2.136928 0.010918 2.76715567 Granite, in gRaw µg 209.0373 x 71.98756 130.3403 0.003347 6.70608868 Graphite, fr Raw mg 228.684 x 228.684 6.54E-16 6.98E-19 -7.03E-1669 Gravel, in gRaw g 261.1154 x 91.02544 85.83678 0.007703 84.2454270 Gypsum, in Raw mg 25.48711 x 25.42036 0.063194 7.78E-06 0.00355271 Iron ore, in Raw mg 434.9413 x 434.9413 1.76E-12 2.35E-15 -1.13E-1272 Iron, 46% inRaw g 10.5203 x 5.370144 2.413078 0.004978 2.73210373 Iron, in grouRaw pg 6.237931 x 6.237931 4.84E-07 1.34E-09 -4.57E-0774 Kaolinite, 24Raw g 224.6126 x 224.6119 0.000616 2.12E-07 0.00013475 Kieserite, 2 Raw µg 20.44156 x 8.949918 10.68704 0.001258 0.80334576 Lead, 5%, i Raw mg 119.6277 x 40.77838 75.77205 0.00824 3.06903677 Lead, in groRaw pg 0.015736 x 0.015736 1.22E-09 3.39E-12 -1.15E-0978 Limestone, Raw mg 904.3231 x 904.3231 -4.93E-13 -2.37E-14 -1.08E-1179 Magnesite, Raw mg 131.2512 x 59.86397 30.2577 0.066791 41.0627180 MagnesiumRaw µg 1.098022 x 0.958444 0.033572 0.000167 0.10583981 ManganeseRaw mg 35.49419 x 17.02976 1.587743 0.00142 16.8752682 MolybdenumRaw µg 799.8542 x 606.7794 98.52189 0.114467 94.438583 MolybdenumRaw µg 113.8205 x 86.34566 14.01982 0.016289 13.4387584 MolybdenumRaw mg 12.448 x 5.977237 0.556769 0.000496 5.91350385 MolybdenumRaw µg 417.6423 x 316.8287 51.44301 0.059769 49.3108786 MolybdenumRaw mg 25.12287 x 12.06341 1.123685 0.001 11.9347887 Nickel, 1.13Raw mg 2.319454 x 2.30026 0.006926 3.01E-05 0.01223788 Nickel, 1.98Raw mg 545.5062 x 444.1496 23.19963 0.054859 78.1020589 Nickel, in grRaw pg 0.000772 x 0.000772 5.99E-11 1.66E-13 -5.65E-1190 Nitrogen, inRaw pg 686.6433 x 686.6433 5.33E-05 1.48E-07 -5.03E-0591 Occupation Raw cm2a 555.1503 x 554.9714 0.107283 0.000369 0.07124692 Occupation Raw mm2a 662.8158 x 657.2262 3.644353 0.015229 1.93001993 Occupation Raw mm2a 445.2569 x 294.8555 39.48442 0.115058 110.80294 Occupation Raw mm2a 52.94856 x 41.2687 9.008054 0.044922 2.62688295 Occupation Raw m2a 2.385201 x 2.385201 8.65E-18 7.44E-21 -9.35E-1896 Occupation Raw mm2a 226.6225 x 196.8294 24.46811 0.006262 5.31871497 Occupation Raw cm2a 110.5965 x 99.33398 3.020227 0.010253 8.23199998 Occupation Raw mm2a 402.3977 x 275.626 84.76356 1.069056 40.9390599 Occupation Raw m2s 15.15898 x 12.24769 2.248883 0.010924 0.651479
100 Occupation Raw mm2a 567.7737 x 544.4106 12.08194 0.026659 11.25453101 Occupation Raw mm2a 632.3372 x 607.0573 12.74072 0.011636 12.52761102 Occupation Raw mm2a 362.2402 x 260.5332 38.07092 0.105048 63.53096103 Occupation Raw cm2a 163.8828 x 163.8566 0.022679 4.64E-05 0.003504104 Occupation Raw m2s 456.2558 x 345.1227 58.77298 0.034015 52.32616105 Occupation Raw mm2a 72.77682 x 72.77682 3.13E-15 4.61E-18 -2.1E-15106 Occupation Raw mm2a 939.3972 x 329.3171 2.834344 0.009345 607.2364107 Occupation Raw cm2a 10.38756 x 3.641487 0.031341 0.000103 6.714633108 Occupation Raw mm2a 263.014 x 132.6477 119.7672 0.012035 10.58715109 Occupation Raw mm2a 868.2036 x 248.0649 589.4753 0.752658 29.91072110 Occupation Raw mm2a 161.8934 x 161.8748 0.011702 4.04E-05 0.006768111 Occupation Raw cm2a 22.78476 x 22.78476 1.13E-16 1.2E-19 -1.67E-17112 Occupation Raw mm2a 370.6088 x 192.8979 68.0794 2.037827 107.5937113 Occupation Raw cm2a 193.7847 x 193.2318 0.181169 0.000973 0.370756114 Oil, crude, 4Raw mg 12.78406 x 12.78406 3.3E-14 1.74E-16 -5.81E-15115 Oil, crude, 4Raw g 11.86443 x 11.86443 -4.29E-15 -1.07E-17 -2.52E-15116 Oil, crude, 4Raw mg 63.77674 x 63.77674 -1.77E-15 -5.78E-18 -9.23E-16117 Oil, crude, 4Raw g 7.422365 x 7.422365 -1.95E-15 -5.03E-18 6.51E-16118 Oil, crude, i Raw g 74.44503 x 41.46693 26.99929 0.117988 5.860824119 Olivine, in gRaw µg 24.39662 x 23.79759 0.514841 0.00026 0.083926120 Oxygen, in Raw g 13.90186 x 13.90186 2.07E-16 2.89E-19 -9.56E-17121 Pd, Pd 2.0ERaw ng 71.18887 x 33.59626 30.40328 0.139441 7.049886122 Pd, Pd 7.3ERaw ng 171.0876 x 80.74157 73.06798 0.335117 16.94294123 Peat, in groRaw mg 1.551891 x 1.331112 0.187675 9.4E-05 0.03301124 PhosphorusRaw pg 0.256318 x 0.256318 1.53E-09 4.24E-12 -1.44E-09125 PhosphorusRaw g 4.974316 x 4.974075 0.000165 6.48E-07 7.66E-05126 PhosphorusRaw mg 560.8839 x 560.3969 0.329959 0.001388 0.155574
2 of 11
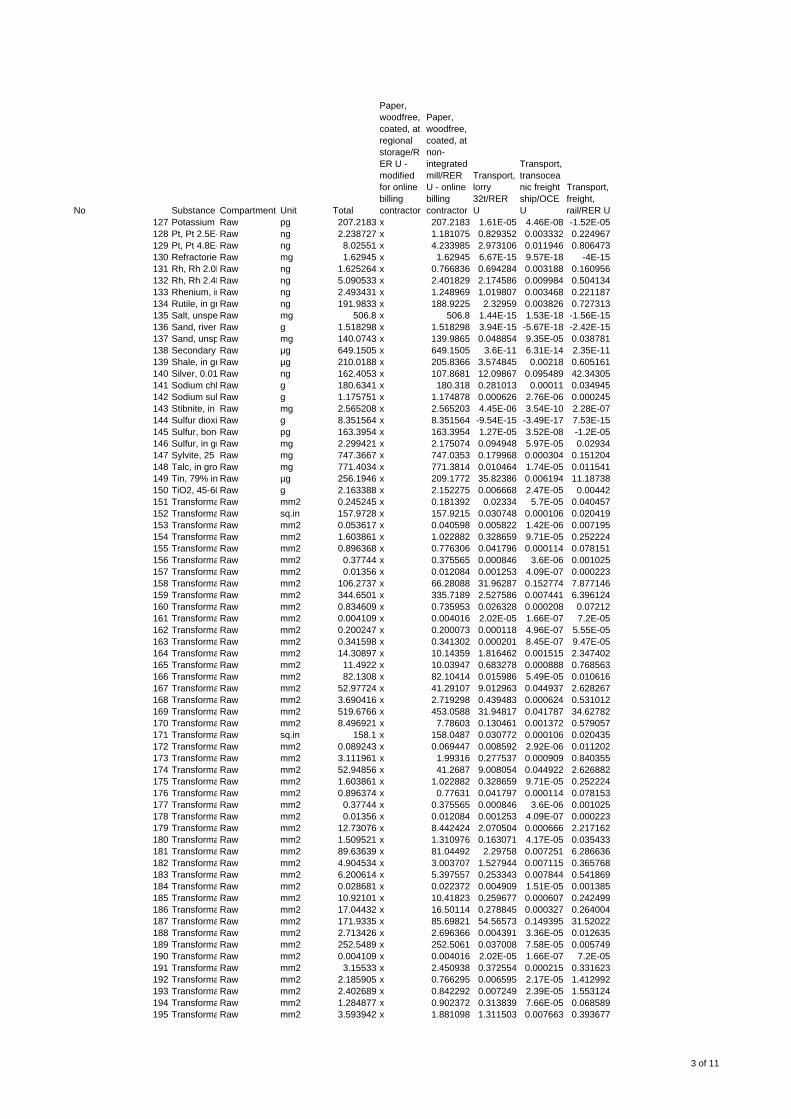
No Substance Compartment Unit Total
Paper, woodfree, coated, at regional storage/RER U - modified for online billing contractor
Paper, woodfree, coated, at non-integrated mill/RER U - online billing contractor
Transport, lorry 32t/RER U
Transport, transoceanic freight ship/OCE U
Transport, freight, rail/RER U
127 Potassium Raw pg 207.2183 x 207.2183 1.61E-05 4.46E-08 -1.52E-05128 Pt, Pt 2.5E-Raw ng 2.238727 x 1.181075 0.829352 0.003332 0.224967129 Pt, Pt 4.8E-Raw ng 8.02551 x 4.233985 2.973106 0.011946 0.806473130 RefractoriesRaw mg 1.62945 x 1.62945 6.67E-15 9.57E-18 -4E-15131 Rh, Rh 2.0ERaw ng 1.625264 x 0.766836 0.694284 0.003188 0.160956132 Rh, Rh 2.4ERaw ng 5.090533 x 2.401829 2.174586 0.009984 0.504134133 Rhenium, inRaw ng 2.493431 x 1.248969 1.019807 0.003468 0.221187134 Rutile, in gr Raw ng 191.9833 x 188.9225 2.32959 0.003826 0.727313135 Salt, unspe Raw mg 506.8 x 506.8 1.44E-15 1.53E-18 -1.56E-15136 Sand, river,Raw g 1.518298 x 1.518298 3.94E-15 -5.67E-18 -2.42E-15137 Sand, unsp Raw mg 140.0743 x 139.9865 0.048854 9.35E-05 0.038781138 Secondary Raw µg 649.1505 x 649.1505 3.6E-11 6.31E-14 2.35E-11139 Shale, in gr Raw µg 210.0188 x 205.8366 3.574845 0.00218 0.605161140 Silver, 0.01 Raw ng 162.4053 x 107.8681 12.09867 0.095489 42.34305141 Sodium chloRaw g 180.6341 x 180.318 0.281013 0.00011 0.034945142 Sodium sul Raw g 1.175751 x 1.174878 0.000626 2.76E-06 0.000245143 Stibnite, in gRaw mg 2.565208 x 2.565203 4.45E-06 3.54E-10 2.28E-07144 Sulfur dioxidRaw g 8.351564 x 8.351564 -9.54E-15 -3.49E-17 7.53E-15145 Sulfur, bondRaw pg 163.3954 x 163.3954 1.27E-05 3.52E-08 -1.2E-05146 Sulfur, in grRaw mg 2.299421 x 2.175074 0.094948 5.97E-05 0.02934147 Sylvite, 25 %Raw mg 747.3667 x 747.0353 0.179968 0.000304 0.151204148 Talc, in gro Raw mg 771.4034 x 771.3814 0.010464 1.74E-05 0.011541149 Tin, 79% in Raw µg 256.1946 x 209.1772 35.82386 0.006194 11.18738150 TiO2, 45-60Raw g 2.163388 x 2.152275 0.006668 2.47E-05 0.00442151 TransformaRaw mm2 0.245245 x 0.181392 0.02334 5.7E-05 0.040457152 TransformaRaw sq.in 157.9728 x 157.9215 0.030748 0.000106 0.020419153 TransformaRaw mm2 0.053617 x 0.040598 0.005822 1.42E-06 0.007195154 TransformaRaw mm2 1.603861 x 1.022882 0.328659 9.71E-05 0.252224155 TransformaRaw mm2 0.896368 x 0.776306 0.041796 0.000114 0.078151156 TransformaRaw mm2 0.37744 x 0.375565 0.000846 3.6E-06 0.001025157 TransformaRaw mm2 0.01356 x 0.012084 0.001253 4.09E-07 0.000223158 TransformaRaw mm2 106.2737 x 66.28088 31.96287 0.152774 7.877146159 TransformaRaw mm2 344.6501 x 335.7189 2.527586 0.007441 6.396124160 TransformaRaw mm2 0.834609 x 0.735953 0.026328 0.000208 0.07212161 TransformaRaw mm2 0.004109 x 0.004016 2.02E-05 1.66E-07 7.2E-05162 TransformaRaw mm2 0.200247 x 0.200073 0.000118 4.96E-07 5.55E-05163 TransformaRaw mm2 0.341598 x 0.341302 0.000201 8.45E-07 9.47E-05164 TransformaRaw mm2 14.30897 x 10.14359 1.816462 0.001515 2.347402165 TransformaRaw mm2 11.4922 x 10.03947 0.683278 0.000888 0.768563166 TransformaRaw mm2 82.1308 x 82.10414 0.015986 5.49E-05 0.010616167 TransformaRaw mm2 52.97724 x 41.29107 9.012963 0.044937 2.628267168 TransformaRaw mm2 3.690416 x 2.719298 0.439483 0.000624 0.531012169 TransformaRaw mm2 519.6766 x 453.0588 31.94817 0.041787 34.62782170 TransformaRaw mm2 8.496921 x 7.78603 0.130461 0.001372 0.579057171 TransformaRaw sq.in 158.1 x 158.0487 0.030772 0.000106 0.020435172 TransformaRaw mm2 0.089243 x 0.069447 0.008592 2.92E-06 0.011202173 TransformaRaw mm2 3.111961 x 1.99316 0.277537 0.000909 0.840355174 TransformaRaw mm2 52.94856 x 41.2687 9.008054 0.044922 2.626882175 TransformaRaw mm2 1.603861 x 1.022882 0.328659 9.71E-05 0.252224176 TransformaRaw mm2 0.896374 x 0.77631 0.041797 0.000114 0.078153177 TransformaRaw mm2 0.37744 x 0.375565 0.000846 3.6E-06 0.001025178 TransformaRaw mm2 0.01356 x 0.012084 0.001253 4.09E-07 0.000223179 TransformaRaw mm2 12.73076 x 8.442424 2.070504 0.000666 2.217162180 TransformaRaw mm2 1.509521 x 1.310976 0.163071 4.17E-05 0.035433181 TransformaRaw mm2 89.63639 x 81.04492 2.29758 0.007251 6.286636182 TransformaRaw mm2 4.904534 x 3.003707 1.527944 0.007115 0.365768183 TransformaRaw mm2 6.200614 x 5.397557 0.253343 0.007844 0.541869184 TransformaRaw mm2 0.028681 x 0.022372 0.004909 1.51E-05 0.001385185 TransformaRaw mm2 10.92101 x 10.41823 0.259677 0.000607 0.242499186 TransformaRaw mm2 17.04432 x 16.50114 0.278845 0.000327 0.264004187 TransformaRaw mm2 171.9335 x 85.69821 54.56573 0.149395 31.52022188 TransformaRaw mm2 2.713426 x 2.696366 0.004391 3.36E-05 0.012635189 TransformaRaw mm2 252.5489 x 252.5061 0.037008 7.58E-05 0.005749190 TransformaRaw mm2 0.004109 x 0.004016 2.02E-05 1.66E-07 7.2E-05191 TransformaRaw mm2 3.15533 x 2.450938 0.372554 0.000215 0.331623192 TransformaRaw mm2 2.185905 x 0.766295 0.006595 2.17E-05 1.412992193 TransformaRaw mm2 2.402689 x 0.842292 0.007249 2.39E-05 1.553124194 TransformaRaw mm2 1.284877 x 0.902372 0.313839 7.66E-05 0.068589195 TransformaRaw mm2 3.593942 x 1.881098 1.311503 0.007663 0.393677
3 of 11
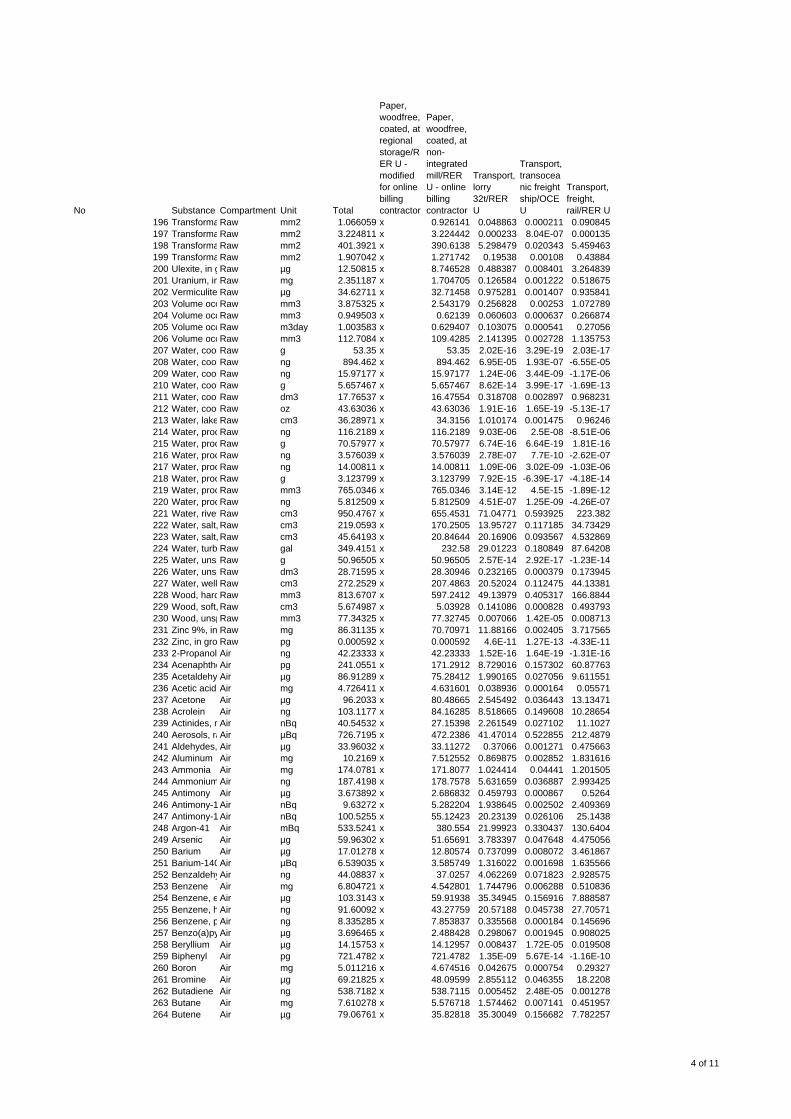
No Substance Compartment Unit Total
Paper, woodfree, coated, at regional storage/RER U - modified for online billing contractor
Paper, woodfree, coated, at non-integrated mill/RER U - online billing contractor
Transport, lorry 32t/RER U
Transport, transoceanic freight ship/OCE U
Transport, freight, rail/RER U
196 TransformaRaw mm2 1.066059 x 0.926141 0.048863 0.000211 0.090845197 TransformaRaw mm2 3.224811 x 3.224442 0.000233 8.04E-07 0.000135198 TransformaRaw mm2 401.3921 x 390.6138 5.298479 0.020343 5.459463199 TransformaRaw mm2 1.907042 x 1.271742 0.19538 0.00108 0.43884200 Ulexite, in gRaw µg 12.50815 x 8.746528 0.488387 0.008401 3.264839201 Uranium, inRaw mg 2.351187 x 1.704705 0.126584 0.001222 0.518675202 Vermiculite Raw µg 34.62711 x 32.71458 0.975281 0.001407 0.935841203 Volume occRaw mm3 3.875325 x 2.543179 0.256828 0.00253 1.072789204 Volume occRaw mm3 0.949503 x 0.62139 0.060603 0.000637 0.266874205 Volume occRaw m3day 1.003583 x 0.629407 0.103075 0.000541 0.27056206 Volume occRaw mm3 112.7084 x 109.4285 2.141395 0.002728 1.135753207 Water, cool Raw g 53.35 x 53.35 2.02E-16 3.29E-19 2.03E-17208 Water, cool Raw ng 894.462 x 894.462 6.95E-05 1.93E-07 -6.55E-05209 Water, cool Raw ng 15.97177 x 15.97177 1.24E-06 3.44E-09 -1.17E-06210 Water, cool Raw g 5.657467 x 5.657467 8.62E-14 3.99E-17 -1.69E-13211 Water, cool Raw dm3 17.76537 x 16.47554 0.318708 0.002897 0.968231212 Water, cool Raw oz 43.63036 x 43.63036 1.91E-16 1.65E-19 -5.13E-17213 Water, lake Raw cm3 36.28971 x 34.3156 1.010174 0.001475 0.96246214 Water, procRaw ng 116.2189 x 116.2189 9.03E-06 2.5E-08 -8.51E-06215 Water, procRaw g 70.57977 x 70.57977 6.74E-16 6.64E-19 1.81E-16216 Water, procRaw ng 3.576039 x 3.576039 2.78E-07 7.7E-10 -2.62E-07217 Water, procRaw ng 14.00811 x 14.00811 1.09E-06 3.02E-09 -1.03E-06218 Water, procRaw g 3.123799 x 3.123799 7.92E-15 -6.39E-17 -4.18E-14219 Water, procRaw mm3 765.0346 x 765.0346 3.14E-12 4.5E-15 -1.89E-12220 Water, procRaw ng 5.812509 x 5.812509 4.51E-07 1.25E-09 -4.26E-07221 Water, riverRaw cm3 950.4767 x 655.4531 71.04771 0.593925 223.382222 Water, salt, Raw cm3 219.0593 x 170.2505 13.95727 0.117185 34.73429223 Water, salt, Raw cm3 45.64193 x 20.84644 20.16906 0.093567 4.532869224 Water, turb Raw gal 349.4151 x 232.58 29.01223 0.180849 87.64208225 Water, unspRaw g 50.96505 x 50.96505 2.57E-14 2.92E-17 -1.23E-14226 Water, unspRaw dm3 28.71595 x 28.30946 0.232165 0.000379 0.173945227 Water, well Raw cm3 272.2529 x 207.4863 20.52024 0.112475 44.13381228 Wood, hardRaw mm3 813.6707 x 597.2412 49.13979 0.405317 166.8844229 Wood, soft, Raw cm3 5.674987 x 5.03928 0.141086 0.000828 0.493793230 Wood, unspRaw mm3 77.34325 x 77.32745 0.007066 1.42E-05 0.008713231 Zinc 9%, in Raw mg 86.31135 x 70.70971 11.88166 0.002405 3.717565232 Zinc, in gro Raw pg 0.000592 x 0.000592 4.6E-11 1.27E-13 -4.33E-11233 2-Propanol Air ng 42.23333 x 42.23333 1.52E-16 1.64E-19 -1.31E-16234 AcenaphtheAir pg 241.0551 x 171.2912 8.729016 0.157302 60.87763235 AcetaldehydAir µg 86.91289 x 75.28412 1.990165 0.027056 9.611551236 Acetic acid Air mg 4.726411 x 4.631601 0.038936 0.000164 0.05571237 Acetone Air µg 96.2033 x 80.48665 2.545492 0.036443 13.13471238 Acrolein Air ng 103.1177 x 84.16285 8.518665 0.149608 10.28654239 Actinides, raAir nBq 40.54532 x 27.15398 2.261549 0.027102 11.1027240 Aerosols, raAir µBq 726.7195 x 472.2386 41.47014 0.522855 212.4879241 Aldehydes, Air µg 33.96032 x 33.11272 0.37066 0.001271 0.475663242 Aluminum Air mg 10.2169 x 7.512552 0.869875 0.002852 1.831616243 Ammonia Air mg 174.0781 x 171.8077 1.024414 0.04441 1.201505244 Ammonium Air ng 187.4198 x 178.7578 5.631659 0.036887 2.993425245 Antimony Air µg 3.673892 x 2.686832 0.459793 0.000867 0.5264246 Antimony-1 Air nBq 9.63272 x 5.282204 1.938645 0.002502 2.409369247 Antimony-1 Air nBq 100.5255 x 55.12423 20.23139 0.026106 25.1438248 Argon-41 Air mBq 533.5241 x 380.554 21.99923 0.330437 130.6404249 Arsenic Air µg 59.96302 x 51.65691 3.783397 0.047648 4.475056250 Barium Air µg 17.01278 x 12.80574 0.737099 0.008072 3.461867251 Barium-140Air µBq 6.539035 x 3.585749 1.316022 0.001698 1.635566252 BenzaldehyAir ng 44.08837 x 37.0257 4.062269 0.071823 2.928575253 Benzene Air mg 6.804721 x 4.542801 1.744796 0.006288 0.510836254 Benzene, e Air µg 103.3143 x 59.91938 35.34945 0.156916 7.888587255 Benzene, h Air ng 91.60092 x 43.27759 20.57188 0.045738 27.70571256 Benzene, p Air ng 8.335285 x 7.853837 0.335568 0.000184 0.145696257 Benzo(a)pyAir µg 3.696465 x 2.488428 0.298067 0.001945 0.908025258 Beryllium Air µg 14.15753 x 14.12957 0.008437 1.72E-05 0.019508259 Biphenyl Air pg 721.4782 x 721.4782 1.35E-09 5.67E-14 -1.16E-10260 Boron Air mg 5.011216 x 4.674516 0.042675 0.000754 0.29327261 Bromine Air µg 69.21825 x 48.09599 2.855112 0.046355 18.2208262 Butadiene Air ng 538.7182 x 538.7115 0.005452 2.48E-05 0.001278263 Butane Air mg 7.610278 x 5.576718 1.574462 0.007141 0.451957264 Butene Air µg 79.06761 x 35.82818 35.30049 0.156682 7.782257
4 of 11
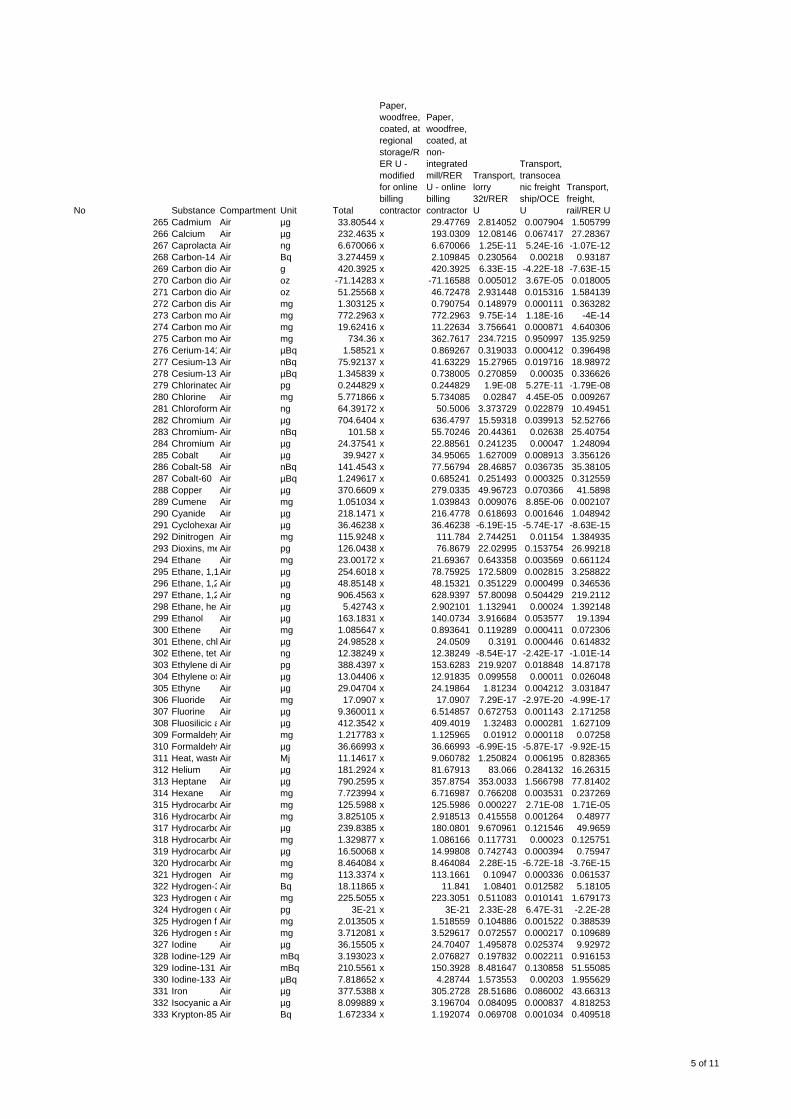
No Substance Compartment Unit Total
Paper, woodfree, coated, at regional storage/RER U - modified for online billing contractor
Paper, woodfree, coated, at non-integrated mill/RER U - online billing contractor
Transport, lorry 32t/RER U
Transport, transoceanic freight ship/OCE U
Transport, freight, rail/RER U
265 Cadmium Air µg 33.80544 x 29.47769 2.814052 0.007904 1.505799266 Calcium Air µg 232.4635 x 193.0309 12.08146 0.067417 27.28367267 CaprolactamAir ng 6.670066 x 6.670066 1.25E-11 5.24E-16 -1.07E-12268 Carbon-14 Air Bq 3.274459 x 2.109845 0.230564 0.00218 0.93187269 Carbon dioxAir g 420.3925 x 420.3925 6.33E-15 -4.22E-18 -7.63E-15270 Carbon dioxAir oz -71.14283 x -71.16588 0.005012 3.67E-05 0.018005271 Carbon dioxAir oz 51.25568 x 46.72478 2.931448 0.015316 1.584139272 Carbon disuAir mg 1.303125 x 0.790754 0.148979 0.000111 0.363282273 Carbon mo Air mg 772.2963 x 772.2963 9.75E-14 1.18E-16 -4E-14274 Carbon mo Air mg 19.62416 x 11.22634 3.756641 0.000871 4.640306275 Carbon mo Air mg 734.36 x 362.7617 234.7215 0.950997 135.9259276 Cerium-141Air µBq 1.58521 x 0.869267 0.319033 0.000412 0.396498277 Cesium-134Air nBq 75.92137 x 41.63229 15.27965 0.019716 18.98972278 Cesium-137Air µBq 1.345839 x 0.738005 0.270859 0.00035 0.336626279 ChlorinatedAir pg 0.244829 x 0.244829 1.9E-08 5.27E-11 -1.79E-08280 Chlorine Air mg 5.771866 x 5.734085 0.02847 4.45E-05 0.009267281 Chloroform Air ng 64.39172 x 50.5006 3.373729 0.022879 10.49451282 Chromium Air µg 704.6404 x 636.4797 15.59318 0.039913 52.52766283 Chromium- Air nBq 101.58 x 55.70246 20.44361 0.02638 25.40754284 Chromium VAir µg 24.37541 x 22.88561 0.241235 0.00047 1.248094285 Cobalt Air µg 39.9427 x 34.95065 1.627009 0.008913 3.356126286 Cobalt-58 Air nBq 141.4543 x 77.56794 28.46857 0.036735 35.38105287 Cobalt-60 Air µBq 1.249617 x 0.685241 0.251493 0.000325 0.312559288 Copper Air µg 370.6609 x 279.0335 49.96723 0.070366 41.5898289 Cumene Air mg 1.051034 x 1.039843 0.009076 8.85E-06 0.002107290 Cyanide Air µg 218.1471 x 216.4778 0.618693 0.001646 1.048942291 CyclohexanAir µg 36.46238 x 36.46238 -6.19E-15 -5.74E-17 -8.63E-15292 Dinitrogen mAir mg 115.9248 x 111.784 2.744251 0.01154 1.384935293 Dioxins, meAir pg 126.0438 x 76.8679 22.02995 0.153754 26.99218294 Ethane Air mg 23.00172 x 21.69367 0.643358 0.003569 0.661124295 Ethane, 1,1Air µg 254.6018 x 78.75925 172.5809 0.002815 3.258822296 Ethane, 1,2Air µg 48.85148 x 48.15321 0.351229 0.000499 0.346536297 Ethane, 1,2Air ng 906.4563 x 628.9397 57.80098 0.504429 219.2112298 Ethane, hexAir µg 5.42743 x 2.902101 1.132941 0.00024 1.392148299 Ethanol Air µg 163.1831 x 140.0734 3.916684 0.053577 19.1394300 Ethene Air mg 1.085647 x 0.893641 0.119289 0.000411 0.072306301 Ethene, chl Air µg 24.98528 x 24.0509 0.3191 0.000446 0.614832302 Ethene, tetrAir ng 12.38249 x 12.38249 -8.54E-17 -2.42E-17 -1.01E-14303 Ethylene di Air pg 388.4397 x 153.6283 219.9207 0.018848 14.87178304 Ethylene oxAir µg 13.04406 x 12.91835 0.099558 0.00011 0.026048305 Ethyne Air µg 29.04704 x 24.19864 1.81234 0.004212 3.031847306 Fluoride Air mg 17.0907 x 17.0907 7.29E-17 -2.97E-20 -4.99E-17307 Fluorine Air µg 9.360011 x 6.514857 0.672753 0.001143 2.171258308 Fluosilicic aAir µg 412.3542 x 409.4019 1.32483 0.000281 1.627109309 FormaldehyAir mg 1.217783 x 1.125965 0.01912 0.000118 0.07258310 FormaldehyAir µg 36.66993 x 36.66993 -6.99E-15 -5.87E-17 -9.92E-15311 Heat, wasteAir Mj 11.14617 x 9.060782 1.250824 0.006195 0.828365312 Helium Air µg 181.2924 x 81.67913 83.066 0.284132 16.26315313 Heptane Air µg 790.2595 x 357.8754 353.0033 1.566798 77.81402314 Hexane Air mg 7.723994 x 6.716987 0.766208 0.003531 0.237269315 HydrocarboAir mg 125.5988 x 125.5986 0.000227 2.71E-08 1.71E-05316 HydrocarboAir mg 3.825105 x 2.918513 0.415558 0.001264 0.48977317 HydrocarboAir µg 239.8385 x 180.0801 9.670961 0.121546 49.9659318 HydrocarboAir mg 1.329877 x 1.086166 0.117731 0.00023 0.125751319 HydrocarboAir µg 16.50068 x 14.99808 0.742743 0.000394 0.75947320 HydrocarboAir mg 8.464084 x 8.464084 2.28E-15 -6.72E-18 -3.76E-15321 Hydrogen Air mg 113.3374 x 113.1661 0.10947 0.000336 0.061537322 Hydrogen-3Air Bq 18.11865 x 11.841 1.08401 0.012582 5.18105323 Hydrogen cAir mg 225.5055 x 223.3051 0.511083 0.010141 1.679173324 Hydrogen cAir pg 3E-21 x 3E-21 2.33E-28 6.47E-31 -2.2E-28325 Hydrogen flAir mg 2.013505 x 1.518559 0.104886 0.001522 0.388539326 Hydrogen sAir mg 3.712081 x 3.529617 0.072557 0.000217 0.109689327 Iodine Air µg 36.15505 x 24.70407 1.495878 0.025374 9.92972328 Iodine-129 Air mBq 3.193023 x 2.076827 0.197832 0.002211 0.916153329 Iodine-131 Air mBq 210.5561 x 150.3928 8.481647 0.130858 51.55085330 Iodine-133 Air µBq 7.818652 x 4.28744 1.573553 0.00203 1.955629331 Iron Air µg 377.5388 x 305.2728 28.51686 0.086002 43.66313332 Isocyanic a Air µg 8.099889 x 3.196704 0.084095 0.000837 4.818253333 Krypton-85 Air Bq 1.672334 x 1.192074 0.069708 0.001034 0.409518
5 of 11
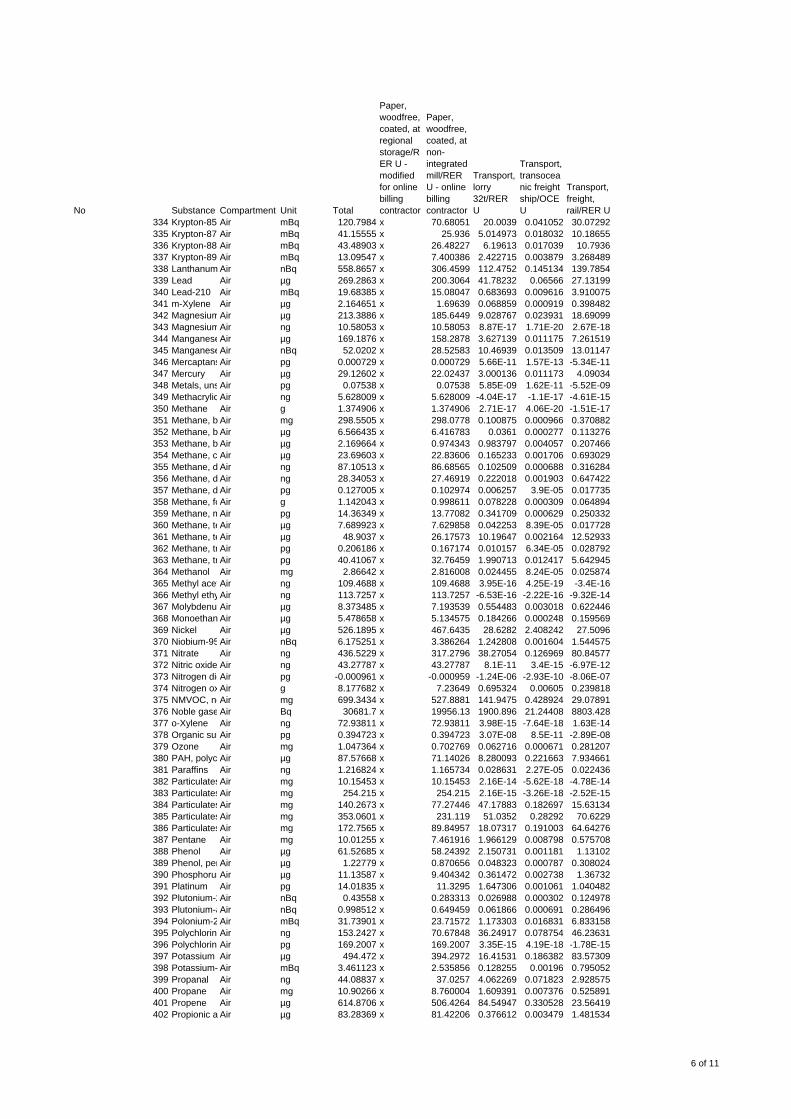
No Substance Compartment Unit Total
Paper, woodfree, coated, at regional storage/RER U - modified for online billing contractor
Paper, woodfree, coated, at non-integrated mill/RER U - online billing contractor
Transport, lorry 32t/RER U
Transport, transoceanic freight ship/OCE U
Transport, freight, rail/RER U
334 Krypton-85mAir mBq 120.7984 x 70.68051 20.0039 0.041052 30.07292335 Krypton-87 Air mBq 41.15555 x 25.936 5.014973 0.018032 10.18655336 Krypton-88 Air mBq 43.48903 x 26.48227 6.19613 0.017039 10.7936337 Krypton-89 Air mBq 13.09547 x 7.400386 2.422715 0.003879 3.268489338 Lanthanum Air nBq 558.8657 x 306.4599 112.4752 0.145134 139.7854339 Lead Air µg 269.2863 x 200.3064 41.78232 0.06566 27.13199340 Lead-210 Air mBq 19.68385 x 15.08047 0.683693 0.009616 3.910075341 m-Xylene Air µg 2.164651 x 1.69639 0.068859 0.000919 0.398482342 MagnesiumAir µg 213.3886 x 185.6449 9.028767 0.023931 18.69099343 MagnesiumAir ng 10.58053 x 10.58053 8.87E-17 1.71E-20 2.67E-18344 ManganeseAir µg 169.1876 x 158.2878 3.627139 0.011175 7.261519345 ManganeseAir nBq 52.0202 x 28.52583 10.46939 0.013509 13.01147346 MercaptansAir pg 0.000729 x 0.000729 5.66E-11 1.57E-13 -5.34E-11347 Mercury Air µg 29.12602 x 22.02437 3.000136 0.011173 4.09034348 Metals, unsAir pg 0.07538 x 0.07538 5.85E-09 1.62E-11 -5.52E-09349 Methacrylic Air ng 5.628009 x 5.628009 -4.04E-17 -1.1E-17 -4.61E-15350 Methane Air g 1.374906 x 1.374906 2.71E-17 4.06E-20 -1.51E-17351 Methane, b Air mg 298.5505 x 298.0778 0.100875 0.000966 0.370882352 Methane, b Air µg 6.566435 x 6.416783 0.0361 0.000277 0.113276353 Methane, b Air µg 2.169664 x 0.974343 0.983797 0.004057 0.207466354 Methane, c Air µg 23.69603 x 22.83606 0.165233 0.001706 0.693029355 Methane, d Air ng 87.10513 x 86.68565 0.102509 0.000688 0.316284356 Methane, d Air ng 28.34053 x 27.46919 0.222018 0.001903 0.647422357 Methane, d Air pg 0.127005 x 0.102974 0.006257 3.9E-05 0.017735358 Methane, foAir g 1.142043 x 0.998611 0.078228 0.000309 0.064894359 Methane, mAir pg 14.36349 x 13.77082 0.341709 0.000629 0.250332360 Methane, teAir µg 7.689923 x 7.629858 0.042253 8.39E-05 0.017728361 Methane, teAir µg 48.9037 x 26.17573 10.19647 0.002164 12.52933362 Methane, tr Air pg 0.206186 x 0.167174 0.010157 6.34E-05 0.028792363 Methane, tr Air pg 40.41067 x 32.76459 1.990713 0.012417 5.642945364 Methanol Air mg 2.86642 x 2.816008 0.024455 8.24E-05 0.025874365 Methyl acetAir ng 109.4688 x 109.4688 3.95E-16 4.25E-19 -3.4E-16366 Methyl ethyAir ng 113.7257 x 113.7257 -6.53E-16 -2.22E-16 -9.32E-14367 MolybdenumAir µg 8.373485 x 7.193539 0.554483 0.003018 0.622446368 Monoethan Air µg 5.478658 x 5.134575 0.184266 0.000248 0.159569369 Nickel Air µg 526.1895 x 467.6435 28.6282 2.408242 27.5096370 Niobium-95Air nBq 6.175251 x 3.386264 1.242808 0.001604 1.544575371 Nitrate Air ng 436.5229 x 317.2796 38.27054 0.126969 80.84577372 Nitric oxide Air ng 43.27787 x 43.27787 8.1E-11 3.4E-15 -6.97E-12373 Nitrogen dioAir pg -0.000961 x -0.000959 -1.24E-06 -2.93E-10 -8.06E-07374 Nitrogen oxAir g 8.177682 x 7.23649 0.695324 0.00605 0.239818375 NMVOC, noAir mg 699.3434 x 527.8881 141.9475 0.428924 29.07891376 Noble gase Air Bq 30681.7 x 19956.13 1900.896 21.24408 8803.428377 o-Xylene Air ng 72.93811 x 72.93811 3.98E-15 -7.64E-18 1.63E-14378 Organic subAir pg 0.394723 x 0.394723 3.07E-08 8.5E-11 -2.89E-08379 Ozone Air mg 1.047364 x 0.702769 0.062716 0.000671 0.281207380 PAH, polycyAir µg 87.57668 x 71.14026 8.280093 0.221663 7.934661381 Paraffins Air ng 1.216824 x 1.165734 0.028631 2.27E-05 0.022436382 ParticulatesAir mg 10.15453 x 10.15453 2.16E-14 -5.62E-18 -4.78E-14383 ParticulatesAir mg 254.215 x 254.215 2.16E-15 -3.26E-18 -2.52E-15384 ParticulatesAir mg 140.2673 x 77.27446 47.17883 0.182697 15.63134385 ParticulatesAir mg 353.0601 x 231.119 51.0352 0.28292 70.6229386 ParticulatesAir mg 172.7565 x 89.84957 18.07317 0.191003 64.64276387 Pentane Air mg 10.01255 x 7.461916 1.966129 0.008798 0.575708388 Phenol Air µg 61.52685 x 58.24392 2.150731 0.001181 1.13102389 Phenol, penAir µg 1.22779 x 0.870656 0.048323 0.000787 0.308024390 PhosphorusAir µg 11.13587 x 9.404342 0.361472 0.002738 1.36732391 Platinum Air pg 14.01835 x 11.3295 1.647306 0.001061 1.040482392 Plutonium-2Air nBq 0.43558 x 0.283313 0.026988 0.000302 0.124978393 Plutonium-aAir nBq 0.998512 x 0.649459 0.061866 0.000691 0.286496394 Polonium-2 Air mBq 31.73901 x 23.71572 1.173303 0.016831 6.833158395 PolychlorinaAir ng 153.2427 x 70.67848 36.24917 0.078754 46.23631396 PolychlorinaAir pg 169.2007 x 169.2007 3.35E-15 4.19E-18 -1.78E-15397 Potassium Air µg 494.472 x 394.2972 16.41531 0.186382 83.57309398 Potassium- Air mBq 3.461123 x 2.535856 0.128255 0.00196 0.795052399 Propanal Air ng 44.08837 x 37.0257 4.062269 0.071823 2.928575400 Propane Air mg 10.90266 x 8.760004 1.609391 0.007376 0.525891401 Propene Air µg 614.8706 x 506.4264 84.54947 0.330528 23.56419402 Propionic a Air µg 83.28369 x 81.42206 0.376612 0.003479 1.481534
6 of 11
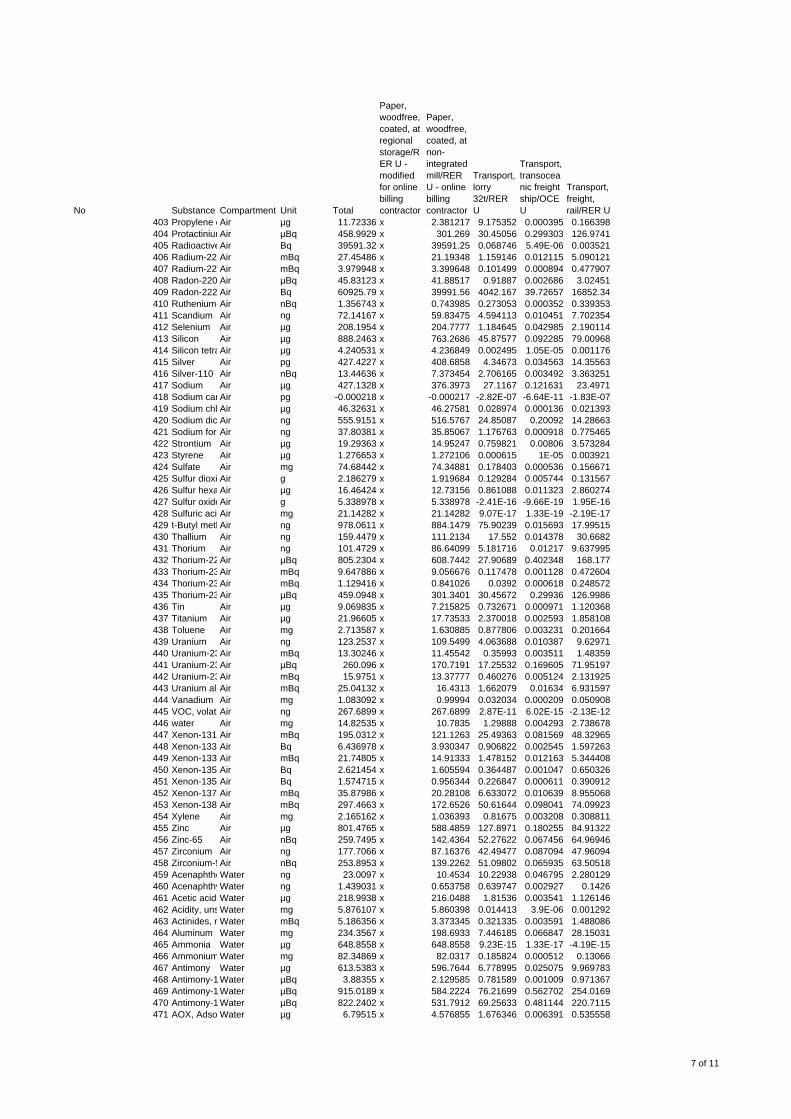
No Substance Compartment Unit Total
Paper, woodfree, coated, at regional storage/RER U - modified for online billing contractor
Paper, woodfree, coated, at non-integrated mill/RER U - online billing contractor
Transport, lorry 32t/RER U
Transport, transoceanic freight ship/OCE U
Transport, freight, rail/RER U
403 Propylene oAir µg 11.72336 x 2.381217 9.175352 0.000395 0.166398404 ProtactiniumAir µBq 458.9929 x 301.269 30.45056 0.299303 126.9741405 RadioactiveAir Bq 39591.32 x 39591.25 0.068746 5.49E-06 0.003521406 Radium-226Air mBq 27.45486 x 21.19348 1.159146 0.012115 5.090121407 Radium-228Air mBq 3.979948 x 3.399648 0.101499 0.000894 0.477907408 Radon-220 Air µBq 45.83123 x 41.88517 0.91887 0.002686 3.02451409 Radon-222 Air Bq 60925.79 x 39991.56 4042.167 39.72657 16852.34410 Ruthenium-Air nBq 1.356743 x 0.743985 0.273053 0.000352 0.339353411 Scandium Air ng 72.14167 x 59.83475 4.594113 0.010451 7.702354412 Selenium Air µg 208.1954 x 204.7777 1.184645 0.042985 2.190114413 Silicon Air µg 888.2463 x 763.2686 45.87577 0.092285 79.00968414 Silicon tetraAir µg 4.240531 x 4.236849 0.002495 1.05E-05 0.001176415 Silver Air pg 427.4227 x 408.6858 4.34673 0.034563 14.35563416 Silver-110 Air nBq 13.44636 x 7.373454 2.706165 0.003492 3.363251417 Sodium Air µg 427.1328 x 376.3973 27.1167 0.121631 23.4971418 Sodium car Air pg -0.000218 x -0.000217 -2.82E-07 -6.64E-11 -1.83E-07419 Sodium chloAir µg 46.32631 x 46.27581 0.028974 0.000136 0.021393420 Sodium dic Air ng 555.9151 x 516.5767 24.85087 0.20092 14.28663421 Sodium formAir ng 37.80381 x 35.85067 1.176763 0.000918 0.775465422 Strontium Air µg 19.29363 x 14.95247 0.759821 0.00806 3.573284423 Styrene Air µg 1.276653 x 1.272106 0.000615 1E-05 0.003921424 Sulfate Air mg 74.68442 x 74.34881 0.178403 0.000536 0.156671425 Sulfur dioxidAir g 2.186279 x 1.919684 0.129284 0.005744 0.131567426 Sulfur hexa Air µg 16.46424 x 12.73156 0.861088 0.011323 2.860274427 Sulfur oxideAir g 5.338978 x 5.338978 -2.41E-16 -9.66E-19 1.95E-16428 Sulfuric acidAir mg 21.14282 x 21.14282 9.07E-17 1.33E-19 -2.19E-17429 t-Butyl methAir ng 978.0611 x 884.1479 75.90239 0.015693 17.99515430 Thallium Air ng 159.4479 x 111.2134 17.552 0.014378 30.6682431 Thorium Air ng 101.4729 x 86.64099 5.181716 0.01217 9.637995432 Thorium-22Air µBq 805.2304 x 608.7442 27.90689 0.402348 168.177433 Thorium-23Air mBq 9.647886 x 9.056676 0.117478 0.001128 0.472604434 Thorium-23Air mBq 1.129416 x 0.841026 0.0392 0.000618 0.248572435 Thorium-23Air µBq 459.0948 x 301.3401 30.45672 0.29936 126.9986436 Tin Air µg 9.069835 x 7.215825 0.732671 0.000971 1.120368437 Titanium Air µg 21.96605 x 17.73533 2.370018 0.002593 1.858108438 Toluene Air mg 2.713587 x 1.630885 0.877806 0.003231 0.201664439 Uranium Air ng 123.2537 x 109.5499 4.063688 0.010387 9.62971440 Uranium-23Air mBq 13.30246 x 11.45542 0.35993 0.003511 1.48359441 Uranium-23Air µBq 260.096 x 170.7191 17.25532 0.169605 71.95197442 Uranium-23Air mBq 15.9751 x 13.37777 0.460276 0.005124 2.131925443 Uranium alpAir mBq 25.04132 x 16.4313 1.662079 0.01634 6.931597444 Vanadium Air mg 1.083092 x 0.99994 0.032034 0.000209 0.050908445 VOC, volati Air ng 267.6899 x 267.6899 2.87E-11 6.02E-15 -2.13E-12446 water Air mg 14.82535 x 10.7835 1.29888 0.004293 2.738678447 Xenon-131mAir mBq 195.0312 x 121.1263 25.49363 0.081569 48.32965448 Xenon-133 Air Bq 6.436978 x 3.930347 0.906822 0.002545 1.597263449 Xenon-133mAir mBq 21.74805 x 14.91333 1.478152 0.012163 5.344408450 Xenon-135 Air Bq 2.621454 x 1.605594 0.364487 0.001047 0.650326451 Xenon-135mAir Bq 1.574715 x 0.956344 0.226847 0.000611 0.390912452 Xenon-137 Air mBq 35.87986 x 20.28108 6.633072 0.010639 8.955068453 Xenon-138 Air mBq 297.4663 x 172.6526 50.61644 0.098041 74.09923454 Xylene Air mg 2.165162 x 1.036393 0.81675 0.003208 0.308811455 Zinc Air µg 801.4765 x 588.4859 127.8971 0.180255 84.91322456 Zinc-65 Air nBq 259.7495 x 142.4364 52.27622 0.067456 64.96946457 Zirconium Air ng 177.7066 x 87.16376 42.49477 0.087094 47.96094458 Zirconium-9Air nBq 253.8953 x 139.2262 51.09802 0.065935 63.50518459 AcenaphtheWater ng 23.0097 x 10.4534 10.22938 0.046795 2.280129460 AcenaphthyWater ng 1.439031 x 0.653758 0.639747 0.002927 0.1426461 Acetic acid Water µg 218.9938 x 216.0488 1.81536 0.003541 1.126146462 Acidity, unsWater mg 5.876107 x 5.860398 0.014413 3.9E-06 0.001292463 Actinides, raWater mBq 5.186356 x 3.373345 0.321335 0.003591 1.488086464 Aluminum Water mg 234.3567 x 198.6933 7.446185 0.066847 28.15031465 Ammonia Water µg 648.8558 x 648.8558 9.23E-15 1.33E-17 -4.19E-15466 Ammonium Water mg 82.34869 x 82.0317 0.185824 0.000512 0.13066467 Antimony Water µg 613.5383 x 596.7644 6.778995 0.025075 9.969783468 Antimony-1 Water µBq 3.88355 x 2.129585 0.781589 0.001009 0.971367469 Antimony-1 Water µBq 915.0189 x 584.2224 76.21699 0.562702 254.0169470 Antimony-1 Water µBq 822.2402 x 531.7912 69.25633 0.481144 220.7115471 AOX, Adso Water µg 6.79515 x 4.576855 1.676346 0.006391 0.535558
7 of 11
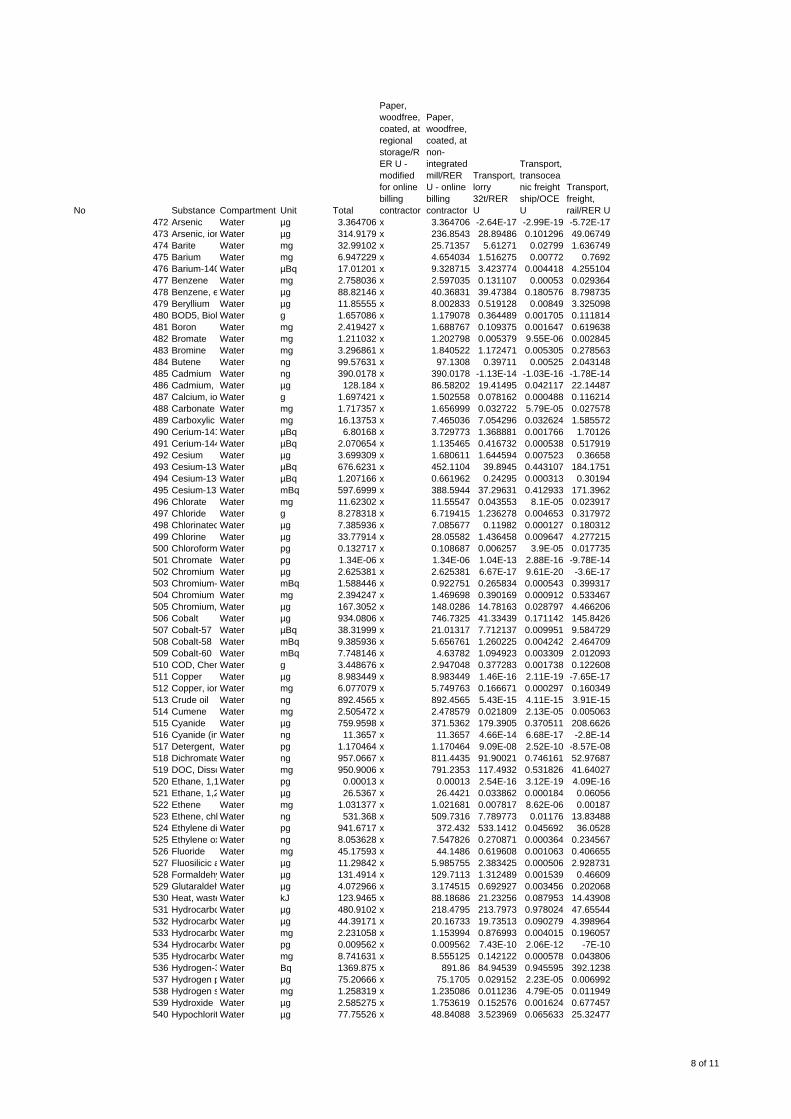
No Substance Compartment Unit Total
Paper, woodfree, coated, at regional storage/RER U - modified for online billing contractor
Paper, woodfree, coated, at non-integrated mill/RER U - online billing contractor
Transport, lorry 32t/RER U
Transport, transoceanic freight ship/OCE U
Transport, freight, rail/RER U
472 Arsenic Water µg 3.364706 x 3.364706 -2.64E-17 -2.99E-19 -5.72E-17473 Arsenic, ionWater µg 314.9179 x 236.8543 28.89486 0.101296 49.06749474 Barite Water mg 32.99102 x 25.71357 5.61271 0.02799 1.636749475 Barium Water mg 6.947229 x 4.654034 1.516275 0.00772 0.7692476 Barium-140Water µBq 17.01201 x 9.328715 3.423774 0.004418 4.255104477 Benzene Water mg 2.758036 x 2.597035 0.131107 0.00053 0.029364478 Benzene, e Water µg 88.82146 x 40.36831 39.47384 0.180576 8.798735479 Beryllium Water µg 11.85555 x 8.002833 0.519128 0.00849 3.325098480 BOD5, BioloWater g 1.657086 x 1.179078 0.364489 0.001705 0.111814481 Boron Water mg 2.419427 x 1.688767 0.109375 0.001647 0.619638482 Bromate Water mg 1.211032 x 1.202798 0.005379 9.55E-06 0.002845483 Bromine Water mg 3.296861 x 1.840522 1.172471 0.005305 0.278563484 Butene Water ng 99.57631 x 97.1308 0.39711 0.00525 2.043148485 Cadmium Water ng 390.0178 x 390.0178 -1.13E-14 -1.03E-16 -1.78E-14486 Cadmium, i Water µg 128.184 x 86.58202 19.41495 0.042117 22.14487487 Calcium, io Water g 1.697421 x 1.502558 0.078162 0.000488 0.116214488 Carbonate Water mg 1.717357 x 1.656999 0.032722 5.79E-05 0.027578489 Carboxylic aWater mg 16.13753 x 7.465036 7.054296 0.032624 1.585572490 Cerium-141Water µBq 6.80168 x 3.729773 1.368881 0.001766 1.70126491 Cerium-144Water µBq 2.070654 x 1.135465 0.416732 0.000538 0.517919492 Cesium Water µg 3.699309 x 1.680611 1.644594 0.007523 0.36658493 Cesium-134Water µBq 676.6231 x 452.1104 39.8945 0.443107 184.1751494 Cesium-136Water µBq 1.207166 x 0.661962 0.24295 0.000313 0.30194495 Cesium-137Water mBq 597.6999 x 388.5944 37.29631 0.412933 171.3962496 Chlorate Water mg 11.62302 x 11.55547 0.043553 8.1E-05 0.023917497 Chloride Water g 8.278318 x 6.719415 1.236278 0.004653 0.317972498 ChlorinatedWater µg 7.385936 x 7.085677 0.11982 0.000127 0.180312499 Chlorine Water µg 33.77914 x 28.05582 1.436458 0.009647 4.277215500 Chloroform Water pg 0.132717 x 0.108687 0.006257 3.9E-05 0.017735501 Chromate Water pg 1.34E-06 x 1.34E-06 1.04E-13 2.88E-16 -9.78E-14502 Chromium Water µg 2.625381 x 2.625381 6.67E-17 9.61E-20 -3.6E-17503 Chromium- Water mBq 1.588446 x 0.922751 0.265834 0.000543 0.399317504 Chromium VWater mg 2.394247 x 1.469698 0.390169 0.000912 0.533467505 Chromium, Water µg 167.3052 x 148.0286 14.78163 0.028797 4.466206506 Cobalt Water µg 934.0806 x 746.7325 41.33439 0.171142 145.8426507 Cobalt-57 Water µBq 38.31999 x 21.01317 7.712137 0.009951 9.584729508 Cobalt-58 Water mBq 9.385936 x 5.656761 1.260225 0.004242 2.464709509 Cobalt-60 Water mBq 7.748146 x 4.63782 1.094923 0.003309 2.012093510 COD, ChemWater g 3.448676 x 2.947048 0.377283 0.001738 0.122608511 Copper Water µg 8.983449 x 8.983449 1.46E-16 2.11E-19 -7.65E-17512 Copper, ionWater mg 6.077079 x 5.749763 0.166671 0.000297 0.160349513 Crude oil Water ng 892.4565 x 892.4565 5.43E-15 4.11E-15 3.91E-15514 Cumene Water mg 2.505472 x 2.478579 0.021809 2.13E-05 0.005063515 Cyanide Water µg 759.9598 x 371.5362 179.3905 0.370511 208.6626516 Cyanide (in Water ng 11.3657 x 11.3657 4.66E-14 6.68E-17 -2.8E-14517 Detergent, Water pg 1.170464 x 1.170464 9.09E-08 2.52E-10 -8.57E-08518 DichromateWater ng 957.0667 x 811.4435 91.90021 0.746161 52.97687519 DOC, DissoWater mg 950.9006 x 791.2353 117.4932 0.531826 41.64027520 Ethane, 1,1Water pg 0.00013 x 0.00013 2.54E-16 3.12E-19 4.09E-16521 Ethane, 1,2Water µg 26.5367 x 26.4421 0.033862 0.000184 0.06056522 Ethene Water mg 1.031377 x 1.021681 0.007817 8.62E-06 0.00187523 Ethene, chl Water ng 531.368 x 509.7316 7.789773 0.01176 13.83488524 Ethylene di Water pg 941.6717 x 372.432 533.1412 0.045692 36.0528525 Ethylene oxWater ng 8.053628 x 7.547826 0.270871 0.000364 0.234567526 Fluoride Water mg 45.17593 x 44.1486 0.619608 0.001063 0.406655527 Fluosilicic aWater µg 11.29842 x 5.985755 2.383425 0.000506 2.928731528 FormaldehyWater µg 131.4914 x 129.7113 1.312489 0.001539 0.46609529 GlutaraldehWater µg 4.072966 x 3.174515 0.692927 0.003456 0.202068530 Heat, wasteWater kJ 123.9465 x 88.18686 21.23256 0.087953 14.43908531 HydrocarboWater µg 480.9102 x 218.4795 213.7973 0.978024 47.65544532 HydrocarboWater µg 44.39171 x 20.16733 19.73513 0.090279 4.398964533 HydrocarboWater mg 2.231058 x 1.153994 0.876993 0.004015 0.196057534 HydrocarboWater pg 0.009562 x 0.009562 7.43E-10 2.06E-12 -7E-10535 HydrocarboWater mg 8.741631 x 8.555125 0.142122 0.000578 0.043806536 Hydrogen-3Water Bq 1369.875 x 891.86 84.94539 0.945595 392.1238537 Hydrogen pWater µg 75.20666 x 75.1705 0.029152 2.23E-05 0.006992538 Hydrogen sWater mg 1.258319 x 1.235086 0.011236 4.79E-05 0.011949539 Hydroxide Water µg 2.585275 x 1.753619 0.152576 0.001624 0.677457540 Hypochlorit Water µg 77.75526 x 48.84088 3.523969 0.065633 25.32477
8 of 11
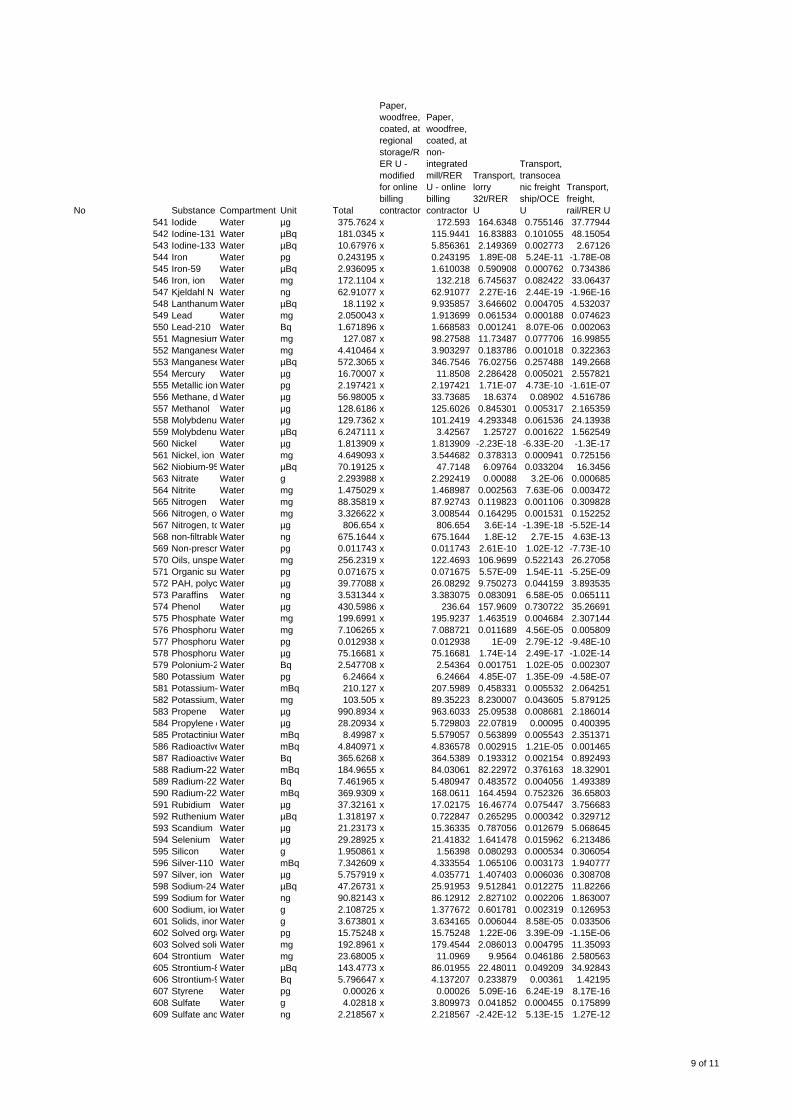
No Substance Compartment Unit Total
Paper, woodfree, coated, at regional storage/RER U - modified for online billing contractor
Paper, woodfree, coated, at non-integrated mill/RER U - online billing contractor
Transport, lorry 32t/RER U
Transport, transoceanic freight ship/OCE U
Transport, freight, rail/RER U
541 Iodide Water µg 375.7624 x 172.593 164.6348 0.755146 37.77944542 Iodine-131 Water µBq 181.0345 x 115.9441 16.83883 0.101055 48.15054543 Iodine-133 Water µBq 10.67976 x 5.856361 2.149369 0.002773 2.67126544 Iron Water pg 0.243195 x 0.243195 1.89E-08 5.24E-11 -1.78E-08545 Iron-59 Water µBq 2.936095 x 1.610038 0.590908 0.000762 0.734386546 Iron, ion Water mg 172.1104 x 132.218 6.745637 0.082422 33.06437547 Kjeldahl N Water ng 62.91077 x 62.91077 2.27E-16 2.44E-19 -1.96E-16548 Lanthanum Water µBq 18.1192 x 9.935857 3.646602 0.004705 4.532037549 Lead Water mg 2.050043 x 1.913699 0.061534 0.000188 0.074623550 Lead-210 Water Bq 1.671896 x 1.668583 0.001241 8.07E-06 0.002063551 MagnesiumWater mg 127.087 x 98.27588 11.73487 0.077706 16.99855552 ManganeseWater mg 4.410464 x 3.903297 0.183786 0.001018 0.322363553 ManganeseWater µBq 572.3065 x 346.7546 76.02756 0.257488 149.2668554 Mercury Water µg 16.70007 x 11.8508 2.286428 0.005021 2.557821555 Metallic ion Water pg 2.197421 x 2.197421 1.71E-07 4.73E-10 -1.61E-07556 Methane, d Water µg 56.98005 x 33.73685 18.6374 0.08902 4.516786557 Methanol Water µg 128.6186 x 125.6026 0.845301 0.005317 2.165359558 MolybdenumWater µg 129.7362 x 101.2419 4.293348 0.061536 24.13938559 MolybdenumWater µBq 6.247111 x 3.42567 1.25727 0.001622 1.562549560 Nickel Water µg 1.813909 x 1.813909 -2.23E-18 -6.33E-20 -1.3E-17561 Nickel, ion Water mg 4.649093 x 3.544682 0.378313 0.000941 0.725156562 Niobium-95Water µBq 70.19125 x 47.7148 6.09764 0.033204 16.3456563 Nitrate Water g 2.293988 x 2.292419 0.00088 3.2E-06 0.000685564 Nitrite Water mg 1.475029 x 1.468987 0.002563 7.63E-06 0.003472565 Nitrogen Water mg 88.35819 x 87.92743 0.119823 0.001106 0.309828566 Nitrogen, orWater mg 3.326622 x 3.008544 0.164295 0.001531 0.152252567 Nitrogen, toWater µg 806.654 x 806.654 3.6E-14 -1.39E-18 -5.52E-14568 non-filtrableWater ng 675.1644 x 675.1644 1.8E-12 2.7E-15 4.63E-13569 Non-prescr Water pg 0.011743 x 0.011743 2.61E-10 1.02E-12 -7.73E-10570 Oils, unspe Water mg 256.2319 x 122.4693 106.9699 0.522143 26.27058571 Organic subWater pg 0.071675 x 0.071675 5.57E-09 1.54E-11 -5.25E-09572 PAH, polycyWater µg 39.77088 x 26.08292 9.750273 0.044159 3.893535573 Paraffins Water ng 3.531344 x 3.383075 0.083091 6.58E-05 0.065111574 Phenol Water µg 430.5986 x 236.64 157.9609 0.730722 35.26691575 Phosphate Water mg 199.6991 x 195.9237 1.463519 0.004684 2.307144576 PhosphorusWater mg 7.106265 x 7.088721 0.011689 4.56E-05 0.005809577 PhosphorusWater pg 0.012938 x 0.012938 1E-09 2.79E-12 -9.48E-10578 PhosphorusWater µg 75.16681 x 75.16681 1.74E-14 2.49E-17 -1.02E-14579 Polonium-2 Water Bq 2.547708 x 2.54364 0.001751 1.02E-05 0.002307580 Potassium Water pg 6.24664 x 6.24664 4.85E-07 1.35E-09 -4.58E-07581 Potassium- Water mBq 210.127 x 207.5989 0.458331 0.005532 2.064251582 Potassium, Water mg 103.505 x 89.35223 8.230007 0.043605 5.879125583 Propene Water µg 990.8934 x 963.6033 25.09538 0.008681 2.186014584 Propylene oWater µg 28.20934 x 5.729803 22.07819 0.00095 0.400395585 ProtactiniumWater mBq 8.49987 x 5.579057 0.563899 0.005543 2.351371586 RadioactiveWater mBq 4.840971 x 4.836578 0.002915 1.21E-05 0.001465587 RadioactiveWater Bq 365.6268 x 364.5389 0.193312 0.002154 0.892493588 Radium-224Water mBq 184.9655 x 84.03061 82.22972 0.376163 18.32901589 Radium-226Water Bq 7.461965 x 5.480947 0.483572 0.004056 1.493389590 Radium-228Water mBq 369.9309 x 168.0611 164.4594 0.752326 36.65803591 Rubidium Water µg 37.32161 x 17.02175 16.46774 0.075447 3.756683592 Ruthenium-Water µBq 1.318197 x 0.722847 0.265295 0.000342 0.329712593 Scandium Water µg 21.23173 x 15.36335 0.787056 0.012679 5.068645594 Selenium Water µg 29.28925 x 21.41832 1.641478 0.015962 6.213486595 Silicon Water g 1.950861 x 1.56398 0.080293 0.000534 0.306054596 Silver-110 Water mBq 7.342609 x 4.333554 1.065106 0.003173 1.940777597 Silver, ion Water µg 5.757919 x 4.035771 1.407403 0.006036 0.308708598 Sodium-24 Water µBq 47.26731 x 25.91953 9.512841 0.012275 11.82266599 Sodium formWater ng 90.82143 x 86.12912 2.827102 0.002206 1.863007600 Sodium, ionWater g 2.108725 x 1.377672 0.601781 0.002319 0.126953601 Solids, inorgWater g 3.673801 x 3.634165 0.006044 8.58E-05 0.033506602 Solved orgaWater pg 15.75248 x 15.75248 1.22E-06 3.39E-09 -1.15E-06603 Solved solidWater mg 192.8961 x 179.4544 2.086013 0.004795 11.35093604 Strontium Water mg 23.68005 x 11.0969 9.9564 0.046186 2.580563605 Strontium-8Water µBq 143.4773 x 86.01955 22.48011 0.049209 34.92843606 Strontium-9Water Bq 5.796647 x 4.137207 0.233879 0.00361 1.42195607 Styrene Water pg 0.00026 x 0.00026 5.09E-16 6.24E-19 8.17E-16608 Sulfate Water g 4.02818 x 3.809973 0.041852 0.000455 0.175899609 Sulfate and Water ng 2.218567 x 2.218567 -2.42E-12 5.13E-15 1.27E-12
9 of 11
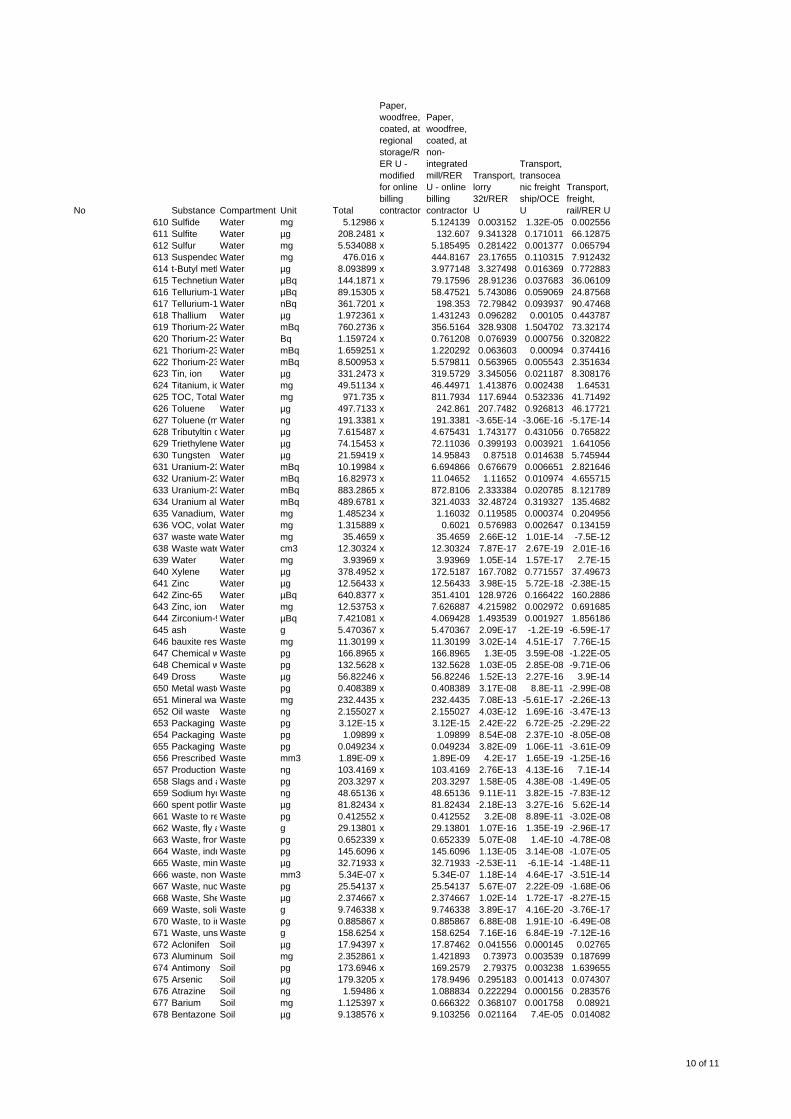
No Substance Compartment Unit Total
Paper, woodfree, coated, at regional storage/RER U - modified for online billing contractor
Paper, woodfree, coated, at non-integrated mill/RER U - online billing contractor
Transport, lorry 32t/RER U
Transport, transoceanic freight ship/OCE U
Transport, freight, rail/RER U
610 Sulfide Water mg 5.12986 x 5.124139 0.003152 1.32E-05 0.002556611 Sulfite Water µg 208.2481 x 132.607 9.341328 0.171011 66.12875612 Sulfur Water mg 5.534088 x 5.185495 0.281422 0.001377 0.065794613 Suspended Water mg 476.016 x 444.8167 23.17655 0.110315 7.912432614 t-Butyl methWater µg 8.093899 x 3.977148 3.327498 0.016369 0.772883615 TechnetiumWater µBq 144.1871 x 79.17596 28.91236 0.037683 36.06109616 Tellurium-1 Water µBq 89.15305 x 58.47521 5.743086 0.059069 24.87568617 Tellurium-1 Water nBq 361.7201 x 198.353 72.79842 0.093937 90.47468618 Thallium Water µg 1.972361 x 1.431243 0.096282 0.00105 0.443787619 Thorium-22Water mBq 760.2736 x 356.5164 328.9308 1.504702 73.32174620 Thorium-23Water Bq 1.159724 x 0.761208 0.076939 0.000756 0.320822621 Thorium-23Water mBq 1.659251 x 1.220292 0.063603 0.00094 0.374416622 Thorium-23Water mBq 8.500953 x 5.579811 0.563965 0.005543 2.351634623 Tin, ion Water µg 331.2473 x 319.5729 3.345056 0.021187 8.308176624 Titanium, ioWater mg 49.51134 x 46.44971 1.413876 0.002438 1.64531625 TOC, Total Water mg 971.735 x 811.7934 117.6944 0.532336 41.71492626 Toluene Water µg 497.7133 x 242.861 207.7482 0.926813 46.17721627 Toluene (m Water ng 191.3381 x 191.3381 -3.65E-14 -3.06E-16 -5.17E-14628 Tributyltin cWater µg 7.615487 x 4.675431 1.743177 0.431056 0.765822629 Triethylene Water µg 74.15453 x 72.11036 0.399193 0.003921 1.641056630 Tungsten Water µg 21.59419 x 14.95843 0.87518 0.014638 5.745944631 Uranium-23Water mBq 10.19984 x 6.694866 0.676679 0.006651 2.821646632 Uranium-23Water mBq 16.82973 x 11.04652 1.11652 0.010974 4.655715633 Uranium-23Water mBq 883.2865 x 872.8106 2.333384 0.020785 8.121789634 Uranium alpWater mBq 489.6781 x 321.4033 32.48724 0.319327 135.4682635 Vanadium, Water mg 1.485234 x 1.16032 0.119585 0.000374 0.204956636 VOC, volati Water mg 1.315889 x 0.6021 0.576983 0.002647 0.134159637 waste wate Water mg 35.4659 x 35.4659 2.66E-12 1.01E-14 -7.5E-12638 Waste wateWater cm3 12.30324 x 12.30324 7.87E-17 2.67E-19 2.01E-16639 Water Water mg 3.93969 x 3.93969 1.05E-14 1.57E-17 2.7E-15640 Xylene Water µg 378.4952 x 172.5187 167.7082 0.771557 37.49673641 Zinc Water µg 12.56433 x 12.56433 3.98E-15 5.72E-18 -2.38E-15642 Zinc-65 Water µBq 640.8377 x 351.4101 128.9726 0.166422 160.2886643 Zinc, ion Water mg 12.53753 x 7.626887 4.215982 0.002972 0.691685644 Zirconium-9Water µBq 7.421081 x 4.069428 1.493539 0.001927 1.856186645 ash Waste g 5.470367 x 5.470367 2.09E-17 -1.2E-19 -6.59E-17646 bauxite resiWaste mg 11.30199 x 11.30199 3.02E-14 4.51E-17 7.76E-15647 Chemical wWaste pg 166.8965 x 166.8965 1.3E-05 3.59E-08 -1.22E-05648 Chemical wWaste pg 132.5628 x 132.5628 1.03E-05 2.85E-08 -9.71E-06649 Dross Waste µg 56.82246 x 56.82246 1.52E-13 2.27E-16 3.9E-14650 Metal wasteWaste pg 0.408389 x 0.408389 3.17E-08 8.8E-11 -2.99E-08651 Mineral wasWaste mg 232.4435 x 232.4435 7.08E-13 -5.61E-17 -2.26E-13652 Oil waste Waste ng 2.155027 x 2.155027 4.03E-12 1.69E-16 -3.47E-13653 Packaging wWaste pg 3.12E-15 x 3.12E-15 2.42E-22 6.72E-25 -2.29E-22654 Packaging wWaste pg 1.09899 x 1.09899 8.54E-08 2.37E-10 -8.05E-08655 Packaging wWaste pg 0.049234 x 0.049234 3.82E-09 1.06E-11 -3.61E-09656 Prescribed Waste mm3 1.89E-09 x 1.89E-09 4.2E-17 1.65E-19 -1.25E-16657 Production Waste ng 103.4169 x 103.4169 2.76E-13 4.13E-16 7.1E-14658 Slags and aWaste pg 203.3297 x 203.3297 1.58E-05 4.38E-08 -1.49E-05659 Sodium hydWaste ng 48.65136 x 48.65136 9.11E-11 3.82E-15 -7.83E-12660 spent potlinWaste µg 81.82434 x 81.82434 2.18E-13 3.27E-16 5.62E-14661 Waste to reWaste pg 0.412552 x 0.412552 3.2E-08 8.89E-11 -3.02E-08662 Waste, fly aWaste g 29.13801 x 29.13801 1.07E-16 1.35E-19 -2.96E-17663 Waste, fromWaste pg 0.652339 x 0.652339 5.07E-08 1.4E-10 -4.78E-08664 Waste, induWaste pg 145.6096 x 145.6096 1.13E-05 3.14E-08 -1.07E-05665 Waste, min Waste µg 32.71933 x 32.71933 -2.53E-11 -6.1E-14 -1.48E-11666 waste, non-Waste mm3 5.34E-07 x 5.34E-07 1.18E-14 4.64E-17 -3.51E-14667 Waste, nuc Waste pg 25.54137 x 25.54137 5.67E-07 2.22E-09 -1.68E-06668 Waste, SheWaste µg 2.374667 x 2.374667 1.02E-14 1.72E-17 -8.27E-15669 Waste, solidWaste g 9.746338 x 9.746338 3.89E-17 4.16E-20 -3.76E-17670 Waste, to inWaste pg 0.885867 x 0.885867 6.88E-08 1.91E-10 -6.49E-08671 Waste, uns Waste g 158.6254 x 158.6254 7.16E-16 6.84E-19 -7.12E-16672 Aclonifen Soil µg 17.94397 x 17.87462 0.041556 0.000145 0.02765673 Aluminum Soil mg 2.352861 x 1.421893 0.73973 0.003539 0.187699674 Antimony Soil pg 173.6946 x 169.2579 2.79375 0.003238 1.639655675 Arsenic Soil µg 179.3205 x 178.9496 0.295183 0.001413 0.074307676 Atrazine Soil ng 1.59486 x 1.088834 0.222294 0.000156 0.283576677 Barium Soil mg 1.125397 x 0.666322 0.368107 0.001758 0.08921678 Bentazone Soil µg 9.138576 x 9.103256 0.021164 7.4E-05 0.014082
10 of 11
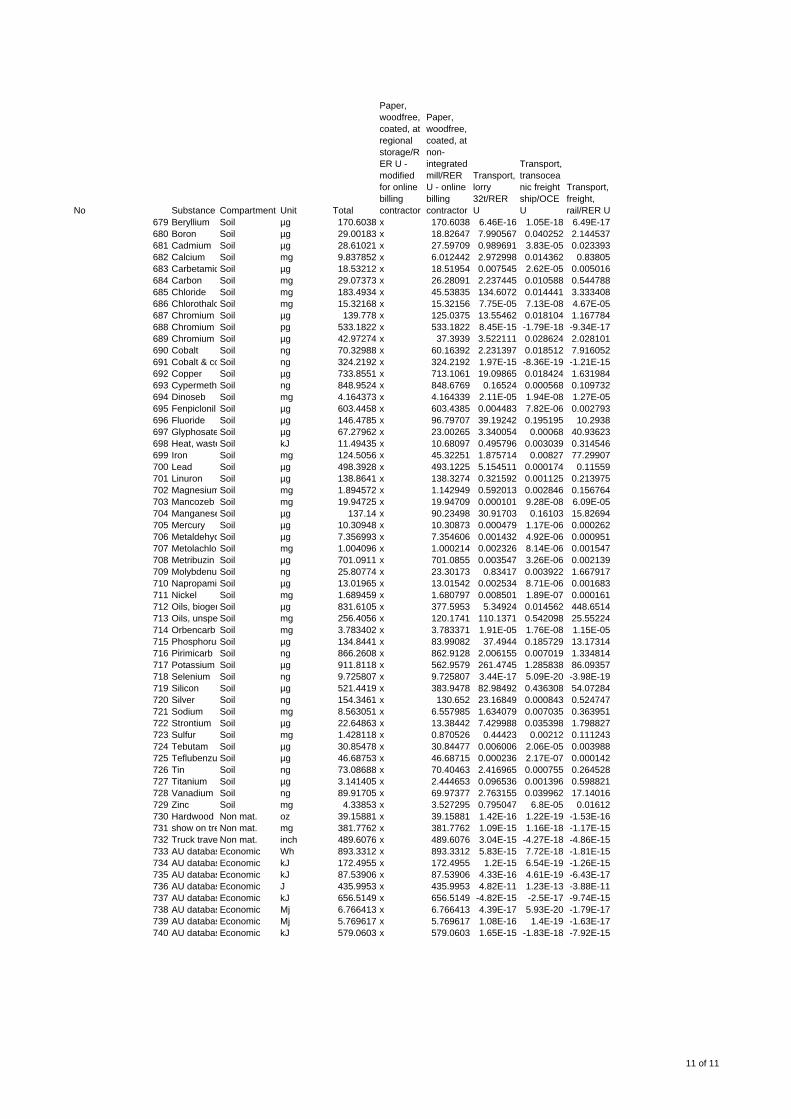
No Substance Compartment Unit Total
Paper, woodfree, coated, at regional storage/RER U - modified for online billing contractor
Paper, woodfree, coated, at non-integrated mill/RER U - online billing contractor
Transport, lorry 32t/RER U
Transport, transoceanic freight ship/OCE U
Transport, freight, rail/RER U
679 Beryllium Soil µg 170.6038 x 170.6038 6.46E-16 1.05E-18 6.49E-17680 Boron Soil µg 29.00183 x 18.82647 7.990567 0.040252 2.144537681 Cadmium Soil µg 28.61021 x 27.59709 0.989691 3.83E-05 0.023393682 Calcium Soil mg 9.837852 x 6.012442 2.972998 0.014362 0.83805683 CarbetamidSoil µg 18.53212 x 18.51954 0.007545 2.62E-05 0.005016684 Carbon Soil mg 29.07373 x 26.28091 2.237445 0.010588 0.544788685 Chloride Soil mg 183.4934 x 45.53835 134.6072 0.014441 3.333408686 ChlorothaloSoil mg 15.32168 x 15.32156 7.75E-05 7.13E-08 4.67E-05687 Chromium Soil µg 139.778 x 125.0375 13.55462 0.018104 1.167784688 Chromium (Soil pg 533.1822 x 533.1822 8.45E-15 -1.79E-18 -9.34E-17689 Chromium VSoil µg 42.97274 x 37.3939 3.522111 0.028624 2.028101690 Cobalt Soil ng 70.32988 x 60.16392 2.231397 0.018512 7.916052691 Cobalt & coSoil ng 324.2192 x 324.2192 1.97E-15 -8.36E-19 -1.21E-15692 Copper Soil µg 733.8551 x 713.1061 19.09865 0.018424 1.631984693 CypermethrSoil ng 848.9524 x 848.6769 0.16524 0.000568 0.109732694 Dinoseb Soil mg 4.164373 x 4.164339 2.11E-05 1.94E-08 1.27E-05695 Fenpiclonil Soil µg 603.4458 x 603.4385 0.004483 7.82E-06 0.002793696 Fluoride Soil µg 146.4785 x 96.79707 39.19242 0.195195 10.2938697 Glyphosate Soil µg 67.27962 x 23.00265 3.340054 0.00068 40.93623698 Heat, wasteSoil kJ 11.49435 x 10.68097 0.495796 0.003039 0.314546699 Iron Soil mg 124.5056 x 45.32251 1.875714 0.00827 77.29907700 Lead Soil µg 498.3928 x 493.1225 5.154511 0.000174 0.11559701 Linuron Soil µg 138.8641 x 138.3274 0.321592 0.001125 0.213975702 MagnesiumSoil mg 1.894572 x 1.142949 0.592013 0.002846 0.156764703 Mancozeb Soil mg 19.94725 x 19.94709 0.000101 9.28E-08 6.09E-05704 ManganeseSoil µg 137.14 x 90.23498 30.91703 0.16103 15.82694705 Mercury Soil µg 10.30948 x 10.30873 0.000479 1.17E-06 0.000262706 MetaldehydSoil µg 7.356993 x 7.354606 0.001432 4.92E-06 0.000951707 MetolachlorSoil mg 1.004096 x 1.000214 0.002326 8.14E-06 0.001547708 Metribuzin Soil µg 701.0911 x 701.0855 0.003547 3.26E-06 0.002139709 MolybdenumSoil ng 25.80774 x 23.30173 0.83417 0.003922 1.667917710 NapropamidSoil µg 13.01965 x 13.01542 0.002534 8.71E-06 0.001683711 Nickel Soil mg 1.689459 x 1.680797 0.008501 1.89E-07 0.000161712 Oils, biogenSoil µg 831.6105 x 377.5953 5.34924 0.014562 448.6514713 Oils, unspe Soil mg 256.4056 x 120.1741 110.1371 0.542098 25.55224714 Orbencarb Soil mg 3.783402 x 3.783371 1.91E-05 1.76E-08 1.15E-05715 PhosphorusSoil µg 134.8441 x 83.99082 37.4944 0.185729 13.17314716 Pirimicarb Soil ng 866.2608 x 862.9128 2.006155 0.007019 1.334814717 Potassium Soil µg 911.8118 x 562.9579 261.4745 1.285838 86.09357718 Selenium Soil ng 9.725807 x 9.725807 3.44E-17 5.09E-20 -3.98E-19719 Silicon Soil µg 521.4419 x 383.9478 82.98492 0.436308 54.07284720 Silver Soil ng 154.3461 x 130.652 23.16849 0.000843 0.524747721 Sodium Soil mg 8.563051 x 6.557985 1.634079 0.007035 0.363951722 Strontium Soil µg 22.64863 x 13.38442 7.429988 0.035398 1.798827723 Sulfur Soil mg 1.428118 x 0.870526 0.44423 0.00212 0.111243724 Tebutam Soil µg 30.85478 x 30.84477 0.006006 2.06E-05 0.003988725 Teflubenzu Soil µg 46.68753 x 46.68715 0.000236 2.17E-07 0.000142726 Tin Soil ng 73.08688 x 70.40463 2.416965 0.000755 0.264528727 Titanium Soil µg 3.141405 x 2.444653 0.096536 0.001396 0.598821728 Vanadium Soil ng 89.91705 x 69.97377 2.763155 0.039962 17.14016729 Zinc Soil mg 4.33853 x 3.527295 0.795047 6.8E-05 0.01612730 Hardwood RNon mat. oz 39.15881 x 39.15881 1.42E-16 1.22E-19 -1.53E-16731 show on treNon mat. mg 381.7762 x 381.7762 1.09E-15 1.16E-18 -1.17E-15732 Truck trave Non mat. inch 489.6076 x 489.6076 3.04E-15 -4.27E-18 -4.86E-15733 AU databasEconomic Wh 893.3312 x 893.3312 5.83E-15 7.72E-18 -1.81E-15734 AU databasEconomic kJ 172.4955 x 172.4955 1.2E-15 6.54E-19 -1.26E-15735 AU databasEconomic kJ 87.53906 x 87.53906 4.33E-16 4.61E-19 -6.43E-17736 AU databasEconomic J 435.9953 x 435.9953 4.82E-11 1.23E-13 -3.88E-11737 AU databasEconomic kJ 656.5149 x 656.5149 -4.82E-15 -2.5E-17 -9.74E-15738 AU databasEconomic Mj 6.766413 x 6.766413 4.39E-17 5.93E-20 -1.79E-17739 AU databasEconomic Mj 5.769617 x 5.769617 1.08E-16 1.4E-19 -1.63E-17740 AU databasEconomic kJ 579.0603 x 579.0603 1.65E-15 -1.83E-18 -7.92E-15
11 of 11

O N L I N E B I L L I N G L I F E C Y C L E A N A L Y S I S
Appendix C Peer Review Report and Responses
Prepared for Telstra, 29 April 2008.
C. Peer Review Report and Responses
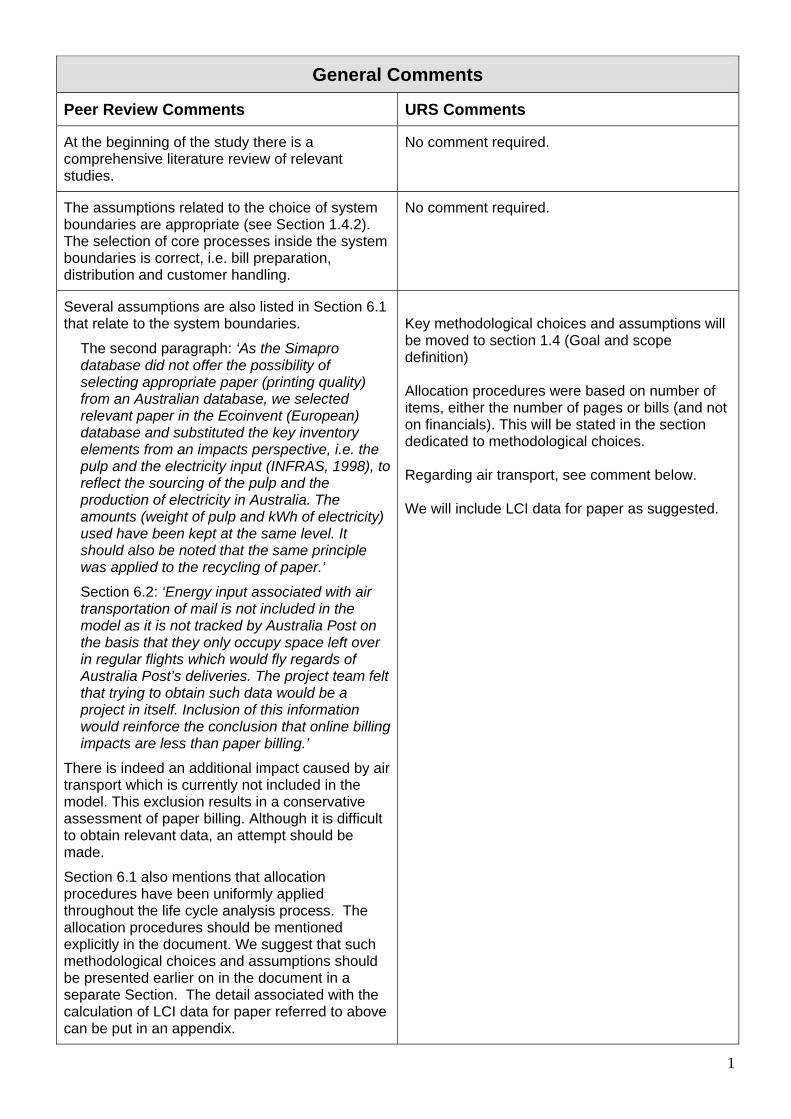
1
General Comments
Peer Review Comments URS Comments
At the beginning of the study there is a comprehensive literature review of relevant studies.
No comment required.
The assumptions related to the choice of system boundaries are appropriate (see Section 1.4.2). The selection of core processes inside the system boundaries is correct, i.e. bill preparation, distribution and customer handling.
No comment required.
Several assumptions are also listed in Section 6.1 that relate to the system boundaries.
The second paragraph: ‘As the Simapro database did not offer the possibility of selecting appropriate paper (printing quality) from an Australian database, we selected relevant paper in the Ecoinvent (European) database and substituted the key inventory elements from an impacts perspective, i.e. the pulp and the electricity input (INFRAS, 1998), to reflect the sourcing of the pulp and the production of electricity in Australia. The amounts (weight of pulp and kWh of electricity) used have been kept at the same level. It should also be noted that the same principle was applied to the recycling of paper.’
Section 6.2: ‘Energy input associated with air transportation of mail is not included in the model as it is not tracked by Australia Post on the basis that they only occupy space left over in regular flights which would fly regards of Australia Post’s deliveries. The project team felt that trying to obtain such data would be a project in itself. Inclusion of this information would reinforce the conclusion that online billing impacts are less than paper billing.’
There is indeed an additional impact caused by air transport which is currently not included in the model. This exclusion results in a conservative assessment of paper billing. Although it is difficult to obtain relevant data, an attempt should be made.
Section 6.1 also mentions that allocation procedures have been uniformly applied throughout the life cycle analysis process. The allocation procedures should be mentioned explicitly in the document. We suggest that such methodological choices and assumptions should be presented earlier on in the document in a separate Section. The detail associated with the calculation of LCI data for paper referred to above can be put in an appendix.
Key methodological choices and assumptions will be moved to section 1.4 (Goal and scope definition) Allocation procedures were based on number of items, either the number of pages or bills (and not on financials). This will be stated in the section dedicated to methodological choices. Regarding air transport, see comment below. We will include LCI data for paper as suggested.
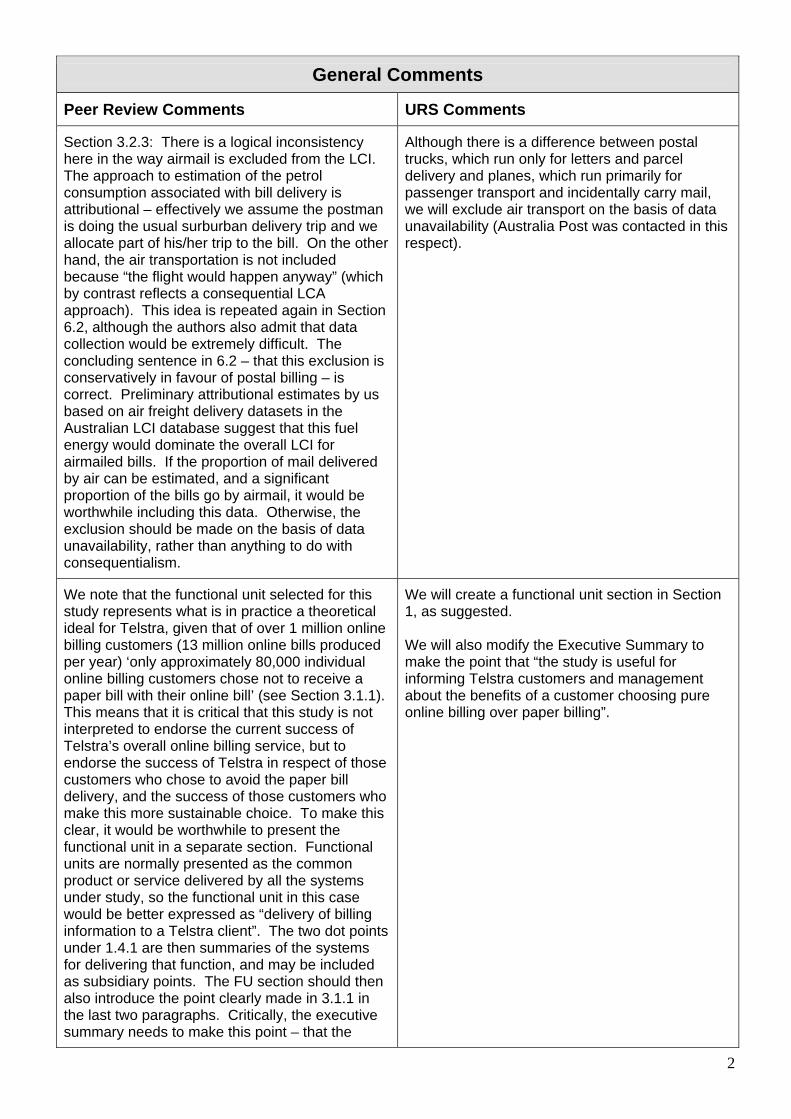
2
General Comments
Peer Review Comments URS Comments
Section 3.2.3: There is a logical inconsistency here in the way airmail is excluded from the LCI. The approach to estimation of the petrol consumption associated with bill delivery is attributional – effectively we assume the postman is doing the usual surburban delivery trip and we allocate part of his/her trip to the bill. On the other hand, the air transportation is not included because “the flight would happen anyway” (which by contrast reflects a consequential LCA approach). This idea is repeated again in Section 6.2, although the authors also admit that data collection would be extremely difficult. The concluding sentence in 6.2 – that this exclusion is conservatively in favour of postal billing – is correct. Preliminary attributional estimates by us based on air freight delivery datasets in the Australian LCI database suggest that this fuel energy would dominate the overall LCI for airmailed bills. If the proportion of mail delivered by air can be estimated, and a significant proportion of the bills go by airmail, it would be worthwhile including this data. Otherwise, the exclusion should be made on the basis of data unavailability, rather than anything to do with consequentialism.
Although there is a difference between postal trucks, which run only for letters and parcel delivery and planes, which run primarily for passenger transport and incidentally carry mail, we will exclude air transport on the basis of data unavailability (Australia Post was contacted in this respect).
We note that the functional unit selected for this study represents what is in practice a theoretical ideal for Telstra, given that of over 1 million online billing customers (13 million online bills produced per year) ‘only approximately 80,000 individual online billing customers chose not to receive a paper bill with their online bill’ (see Section 3.1.1). This means that it is critical that this study is not interpreted to endorse the current success of Telstra’s overall online billing service, but to endorse the success of Telstra in respect of those customers who chose to avoid the paper bill delivery, and the success of those customers who make this more sustainable choice. To make this clear, it would be worthwhile to present the functional unit in a separate section. Functional units are normally presented as the common product or service delivered by all the systems under study, so the functional unit in this case would be better expressed as “delivery of billing information to a Telstra client”. The two dot points under 1.4.1 are then summaries of the systems for delivering that function, and may be included as subsidiary points. The FU section should then also introduce the point clearly made in 3.1.1 in the last two paragraphs. Critically, the executive summary needs to make this point – that the
We will create a functional unit section in Section 1, as suggested. We will also modify the Executive Summary to make the point that “the study is useful for informing Telstra customers and management about the benefits of a customer choosing pure online billing over paper billing”.
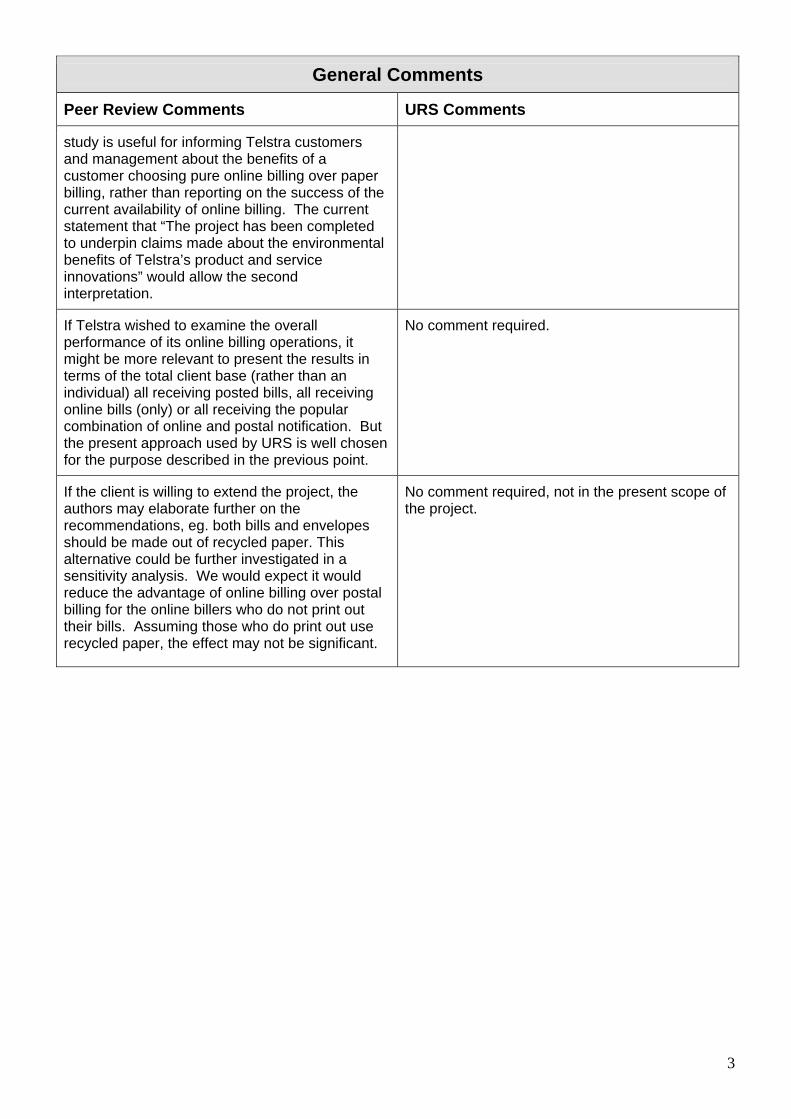
3
General Comments
Peer Review Comments URS Comments
study is useful for informing Telstra customers and management about the benefits of a customer choosing pure online billing over paper billing, rather than reporting on the success of the current availability of online billing. The current statement that “The project has been completed to underpin claims made about the environmental benefits of Telstra’s product and service innovations” would allow the second interpretation.
If Telstra wished to examine the overall performance of its online billing operations, it might be more relevant to present the results in terms of the total client base (rather than an individual) all receiving posted bills, all receiving online bills (only) or all receiving the popular combination of online and postal notification. But the present approach used by URS is well chosen for the purpose described in the previous point.
No comment required.
If the client is willing to extend the project, the authors may elaborate further on the recommendations, eg. both bills and envelopes should be made out of recycled paper. This alternative could be further investigated in a sensitivity analysis. We would expect it would reduce the advantage of online billing over postal billing for the online billers who do not print out their bills. Assuming those who do print out use recycled paper, the effect may not be significant.
No comment required, not in the present scope of the project.
4
Specific Comments
Peer Review Comments URS Comments
Executive summary
Two very minor typos: “… it is not possible to read the results of this LCA as total values…”; “The impact categories for the comparative LCA indicate that the environmental burdens associated with online billing…”
Recommendation accepted.
Key recommendation 1)… shouldn’t that be server utilisation rather than capacity to be maximised?
Recommendation accepted.
Methodology
Water usage: the authors write ‘It should be noted that water resource depletion is not a separate indicator available in CML 2001, nor the Eco-indicator 99 methodology. Although water scarcity is a major issue in Australia, the only impact associated with the processes included in the model that involve direct water usage was the pulping of wood for paper, hence this is not considered a major concern.’ Water is used (not only) for paper production, but also in electricity generation, manufacturing of capital equipment etc. Hence, water might be included in addition to the other four impact categories due to its overarching importance in the Australian context. The authors should consider using EDIP 1997 which does include water use.
Water usage is a recognised shortfall of the current methods as there is no indicator for direct water usage. The EDIP 1997 method has human toxicity/water and ecotoxicity/water indicators, accounting for emissions to water but not water usage. While water is part of the inventories as an input, both in EDIP 1997 and CML 2001, it would be very difficult to use meaningfully, as there are many different categories of water input (from river water to salt water) in various units. We therefore recommend not to include water use and have stated in the report: ‘water was excluded from the project scope. We hypothesise that water demand would be correlated to other resource use and therefore favour online billing’. .
Section 2.5 third paragraph is a little unclear: ‘One of the key aspects of the model is paper usage which creates environmental impacts associated with land clearing. It was therefore determined that a land use indicator was needed. As CML 2001 V2.0 – Australian toxicity factors does not provide a land use impact category, Eco-indicator 99 method, (Goedkoep and Spriensma, 2000) Australian substances, version 2.03 was applied to the model. Eco-indicator 99 is an assessment method that has been updated and developed based on the well known Eco-indicator 95 (Goedkeop 1995). It is compatible with AS/ISO 14042 requirements and the version of Eco-indicator 99 applied is the same as the European version however Australian substance definitions for fuels have been added.’ How about replacing the third sentence with “Because the Australian toxicity factors in CML 2001 v2.0 do not include a land use impact category, the Eco-indicator 99 method, (Goedkoep and Spriensma, 2000) Australian substances, v2.03 was used”?
Recommendation accepted.
5
Specific Comments
Peer Review Comments URS Comments
Life cycle inventory
Table 3-2 should be labelled like the other tables in terms of the data source. As this data seems to be critical, a sensitivity analysis of the % use for online billing would be appropriate.
Ref. to “Telstra, pers. Communication” will be added. A sensitivity analysis on the amount of energy used by the servers was carried out. The recommended sensitivity analysis on the % use for online billing would be equivalent to this sensitivity analysis (as, at the end of the day, it all depends on how much electricity use is attributed to online billing). A link between % of use of the server for online billing and electricity use sensitivity analysis will be made explicitly in the report to cover this recommendation.
Section 3.1.2 (Server usage impact)… Firstly, the second paragraph says two E25K Sun servers are used by Telstra. This is seems to contradict Table 3-2. This should be clarified or fixed. Secondly, the assumption ‘a 1:1 ratio is assumed for close control air conditioning energy usage and server energy usage’ based on Koomey (2007) deserves elaboration. Can the authors please justify why this ratio has been chosen? Later on in Section 5.1.1 a sensitivity analysis investigates the influence of control air conditioning energy usage. This seems to be a critical assumption. More description would be helpful here. Thirdly, a minor improvement in this line – it would be clearer if “between the” was inserted instead of “for”.
The servers numbers are indeed unclear, and have been clarified: there are actually 35 servers in total. Selection of the 1 to 1 ratio will be elaborated upon: “Koomey (2007) has found that “ [the] total power used by servers represented about 0.6% of total U.S. electricity consumption in 2005.” and that “When cooling and auxiliary infrastructure are included, that number grows to 1.2%”, which led us to conclude that the power used by servers for their data operation function is approximately the same as the power used by the cooling and auxiliary infrastructure. In the same study, a graph shows that the proportion is approximately the same when considering worldwide data.
This is also supported by data from a presentation by IBM which suggests that IT load accounts for 45% of data centre energy use consumption while ancillary activities account for 55% of the energy use.” Energy Efficiency in the Data Center, IBM, 2007 ”Between the” will replaced “for”..
Section 3.1.2 (Server materials impacts). The report says ‘Table A-2, in Appendix A outlines the material composition assumed for the average Telstra server’. This seems to actually be a reference to Table A-1.
Recommendation accepted.
Section 3.1.2 (Employee energy usage). Firstly, the report says 246 kWh.m-2 and 75 MJ.m-2 are needed. These data need a reference. Secondly: ‘In total, 47.3% of the capacity of the servers is used to run the online billing service, therefore
Recommendation accepted. Source: Telstra, has been added and the appropriate paragraph rephrased.
6
Specific Comments
Peer Review Comments URS Comments
gas and electricity relative to staff running the servers was apportioned to reflect this percentage and 20,363 kWh of electricity and 6 GJ of gas was incorporated into the model.’ The causation is not absolutely clear in this sentence. How about “Considering all the data in Table 3-2, 47.3% of server capacity was associated with online billing. We used this factor to allocate to the model a fraction the total electricity and gas demands caused by the employment of the server staff. These fractions were thus 20,363 kWh electricity and 6 GJ gas respectively.”
Section 3.1.4 Printing online bills. The assumption that ‘50% of printed online bills are recycled and 50% are sent to landfill’ should be backed up by literature or a statement made to the effect that the assumption was made because no data or literature was found.
It is backed-up by IndustryEdge reference, see footnote.
Table 3-5: The reference “Evans et al 2001” is missing in Section 8.
Recommendation accepted.
Table 3-6: The reference “Telstra” is incomplete and missing in Section 8.
Recommendation accepted. Note it is a personal communication
Table 3-7: “Carbon black”; The reference is incomplete and missing in Section 8.
Recommendation accepted.
Section 3.3 refers to Appendix C. This needs to be added to the report.
Recommendation accepted.
Table 3-11 provides a good overview of comparative LCI data. It’s a particularly minor point but given the significant figures of the other data, it would be nice to quote the petrol consumption as 0.59 mL/bill and black toner as 0.20 g/bill. More importantly, the origin of the following data is unclear for online billing: electricity 28,8 Wh/bill and gas 130 J/bill. What does “equipment 35 servers” mean? But the sum of all servers is 43 (see Table 3-4).
Recommendation accepted.. As mentioned above, Table 3-4 needs to be fixed, as it is confusing. There are actually 35 servers, the E25K servers being used both for Production and Test and Development.
Life cycle impact results
Page 4-1 last paragraph. “32 g 1,4-DCB equivalent”. There are two other instances of this.
Recommendation accepted.
In Section 4.4 we suggest replacement of the 4th and 5th sentences with “For each impact category, Table 4-2 shows the key contributing processes (including the size of the burden associated with that contributing process).”
Recommendation accepted.
7
Specific Comments
Peer Review Comments URS Comments
We got the general message of Table 4-2 but found interpreting some aspects was difficult. One simple thing: “Paper” in the second column is presumably “Production of paper”? If so, why are potatoes and fruit production involved in making it? More puzzling is how some values in the fifth column are positive and qualified by negative numbers in the seventh column, and sometimes the opposite, while generally the signs agree. There may be a good reason for this and it should be explained to the reader.
Recommendation accepted. This table will be fully revised.
Last paragraph: “energy usage and paper consumption are the key activities”.
Recommendation accepted.: “energy usage and paper consumption are the key activities contributing to the impacts”
At A4 size, Figures 4-1 to 3 are difficult to read. We suggest URS sacrifices the footer space, shifts the headings to the left and enlarges the diagrams for clarity.
Recommendation accepted.
The last paragraph before Section 5.1. Global Warming is quite information-dense. We suggest: ‘The sensitivity analysis demonstrated that the global warming burdens associated with online billing exceed those associated with paper billing when the number of customers receiving both paper and online bills is reduced to 70% of the base case figure. This also occurs if the server energy increases by 50% or approximately 95% of customers print their online bill. With regards to land use, the land use burdens associated with online billing exceed those associated with paper billing if 100% of customers recycle their paper bills.’
Recommendation accepted.
Sensitivity analysis
First paragraph: “This is because the energy usage of the servers remains constant regardless of the reduction in the number of bills produced.” Wouldn’t the proportion of the server energy associated with online billing (Table 3-2) decrease?
No, the data used by each application (online billing or other) sits on the server and requires the same amount of energy regardless of whether it is used or not by the said application. This will be referenced to “Telstra, pers. Communication”. Therefore the proportion of the server energy associated with online billing varies very little, but the number of online bills which this information allows to manage varies. We therefore prefer to keep our wording.
The illustration of Figure 5-2 is a little confusing, i.e. increasing positive numbers on the left part of the x-axis followed by decreasing negative figures. Can the layout be sorted in a more logical format? This comment is applicable to all Figures
It could be changed, but we do not think that the readability would be much improved, so we propose to leave these diagrams as they are.

8
Specific Comments
Peer Review Comments URS Comments
5-Xs.
Section 5.2.3. Minor point: URS could clarify whether this sensitivity test is intended to take into account uncertainty in the data URS has obtained for paper bill length, or is a reflection of known variability in paper bill length.
It is not so much an uncertainty as to the actual paper bill length than a possibility for Telstra to reduce the bill length by improving the layout. This sentence will be added to the paragraph.
References
Minor point – there are two uses of “et al”, which ought to be spelt out.
Recommendation accepted.
The Koomey (2007) reference is not available online, and the URL is wrong /misspelt.
Recommendation accepted., The URL is incorrect and should read: http://enterprise.amd.com/Downloads/svrpwrusecompletefinal.pdf
Some references are missing (see comments above)
Recommendation accepted.