Embed Size (px)
Citation preview
Data Warehousing
Online Analytical Processing (OLAP)
Naveed Iqbal, Assistant Professor
NUCES, Islamabad Campus(Lecture Slides Weeks # 9&10)
2
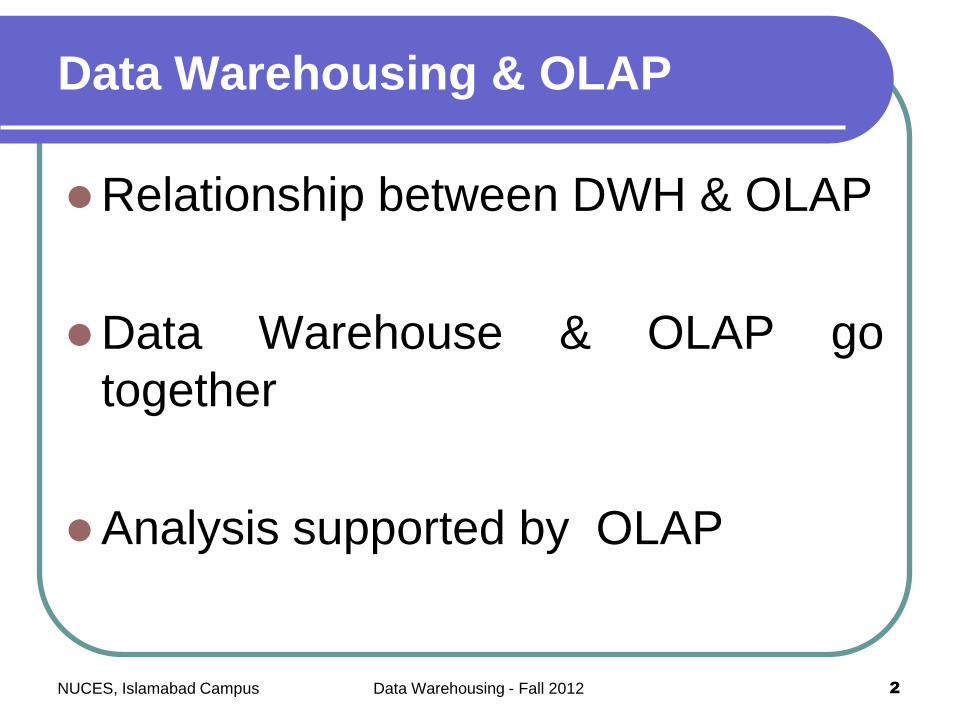
Data Warehousing & OLAP
Relationship between DWH & OLAP
Data Warehouse & OLAP go
together
Analysis supported by OLAP
NUCES, Islamabad Campus Data Warehousing - Fall 2012
3
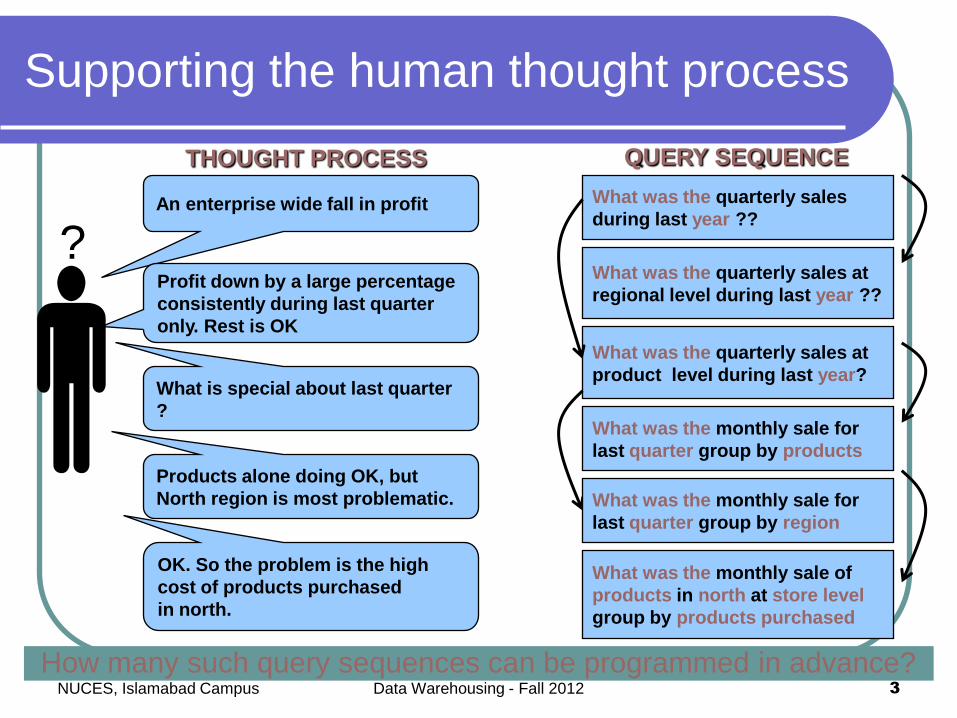
Supporting the human thought process
How many such query sequences can be programmed in advance?
THOUGHT PROCESS QUERY SEQUENCE
An enterprise wide fall in profit
Profit down by a large percentage
consistently during last quarter
only. Rest is OK
What is special about last quarter
?
Products alone doing OK, but
North region is most problematic.
What was the quarterly sales
during last year ??
What was the quarterly sales at
regional level during last year ??
What was the monthly sale for
last quarter group by products
What was the monthly sale of
products in north at store level
group by products purchased
OK. So the problem is the high
cost of products purchased
in north.
What was the quarterly sales at
product level during last year??
What was the monthly sale for
last quarter group by region
NUCES, Islamabad Campus Data Warehousing - Fall 2012
4
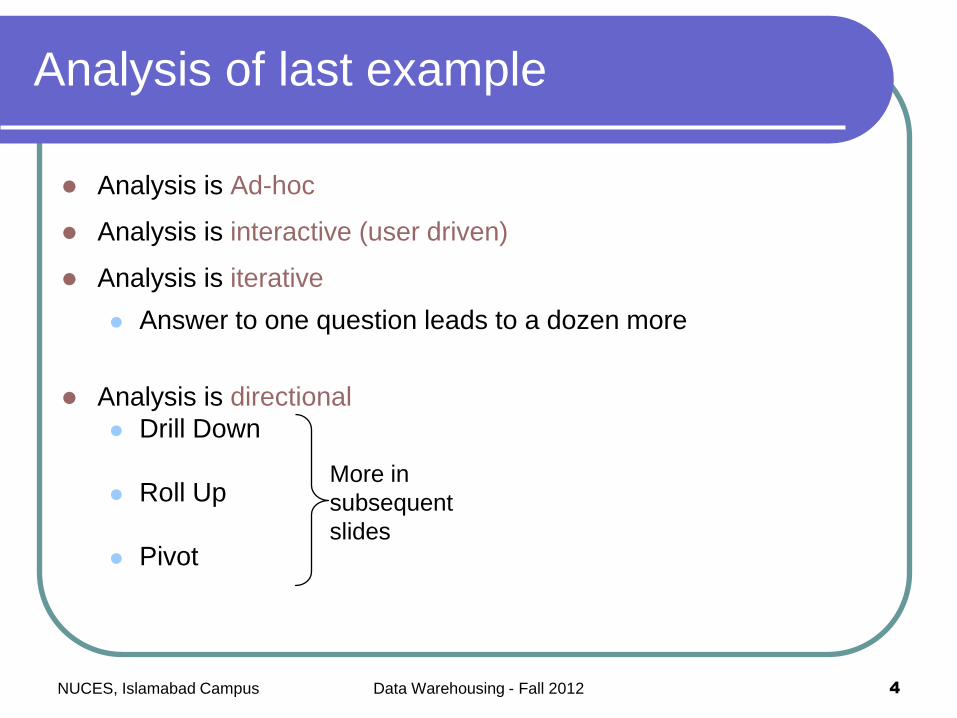
Analysis of last example
Analysis is Ad-hoc
Analysis is interactive (user driven)
Analysis is iterative
Answer to one question leads to a dozen more
Analysis is directional
Drill Down
Roll Up
Pivot
More in
subsequent
slides
NUCES, Islamabad Campus Data Warehousing - Fall 2012
5
Challenges…
Not feasible to write predefined queries.
Fails to remain user_driven (becomes programmer driven).
Fails to remain ad_hoc and hence is not interactive.
Enable ad-hoc query support
Business user can not build his/her own queries (does not know SQL, should not know it).
On_the_go SQL generation and execution too slow.
NUCES, Islamabad Campus Data Warehousing - Fall 2012
6
Challenges
Contradiction Want to compute answers in advance, but
don't know the questions
Solution Compute answers to “all” possible “queries”.
But how?
NOTE: Queries are multidimensionalaggregates at some level
NUCES, Islamabad Campus Data Warehousing - Fall 2012
7
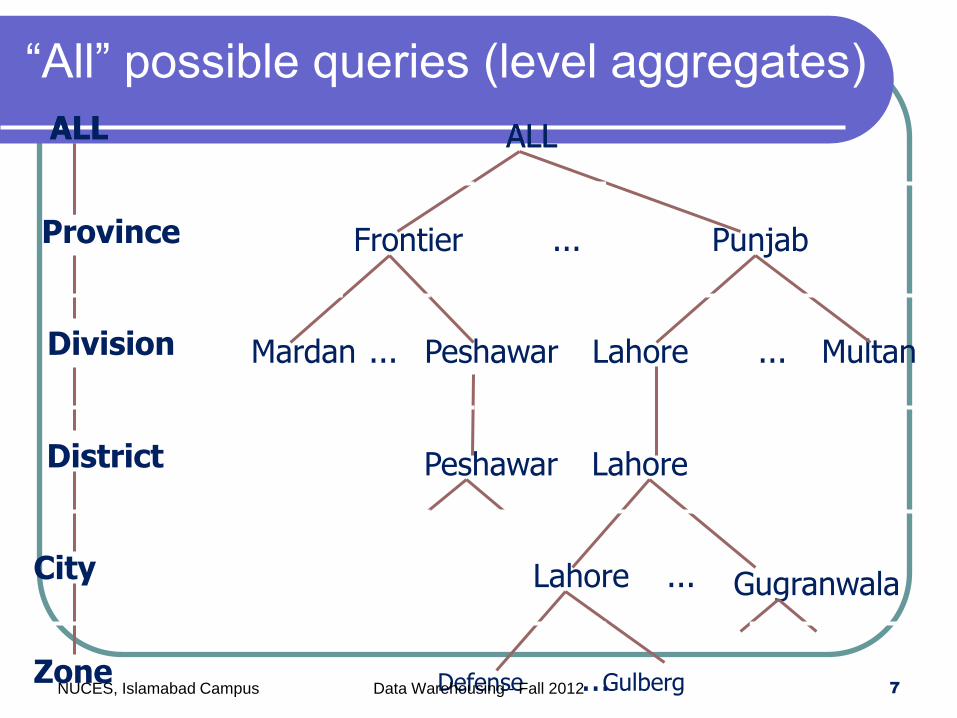
“All” possible queries (level aggregates)
Province Frontier Punjab...
Division MultanLahorePeshawarMardan ......
Lahore ... GugranwalaCity
Zone GulbergDefense ...
District LahorePeshawar
ALL ALLALL ALL
NUCES, Islamabad Campus Data Warehousing - Fall 2012

8
OLAP: Facts & Dimensions
FACTS: Quantitative values (numbers) or“measures.”
e.g., units sold, sales $, Co, Kg etc.
DIMENSIONS: Descriptive categories.
e.g., time, geography, product etc.
DIM often organized in hierarchiesrepresenting levels of detail in the data (e.g.,week, month, quarter, year, decade etc.).
NUCES, Islamabad Campus Data Warehousing - Fall 2012
9
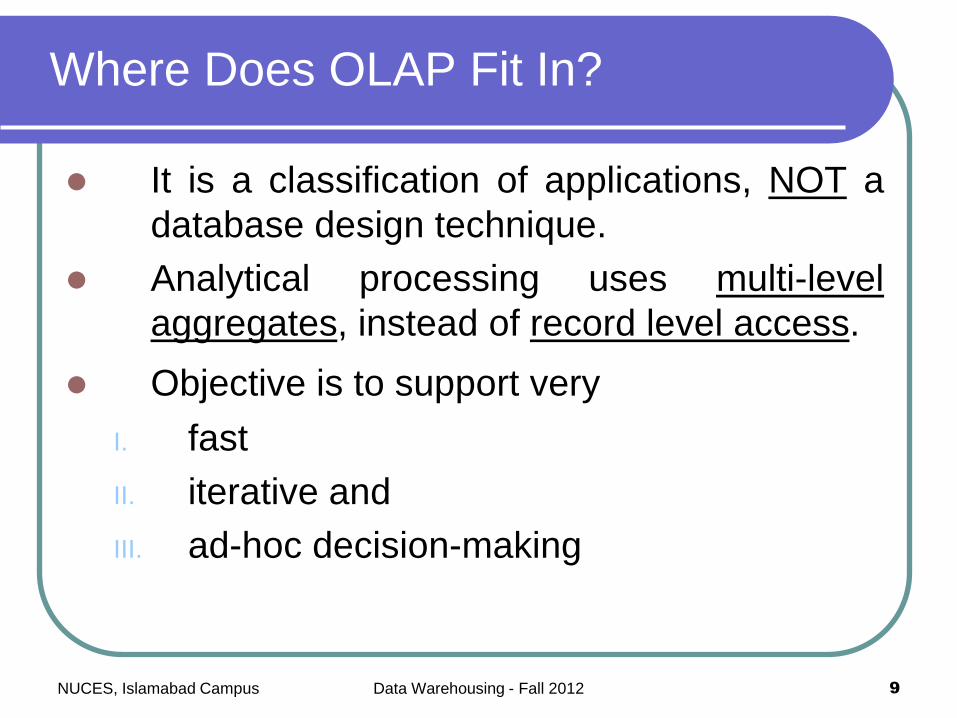
Where Does OLAP Fit In?
It is a classification of applications, NOT a
database design technique.
Analytical processing uses multi-level
aggregates, instead of record level access.
Objective is to support very
I. fast
II. iterative and
III. ad-hoc decision-making
NUCES, Islamabad Campus Data Warehousing - Fall 2012
10
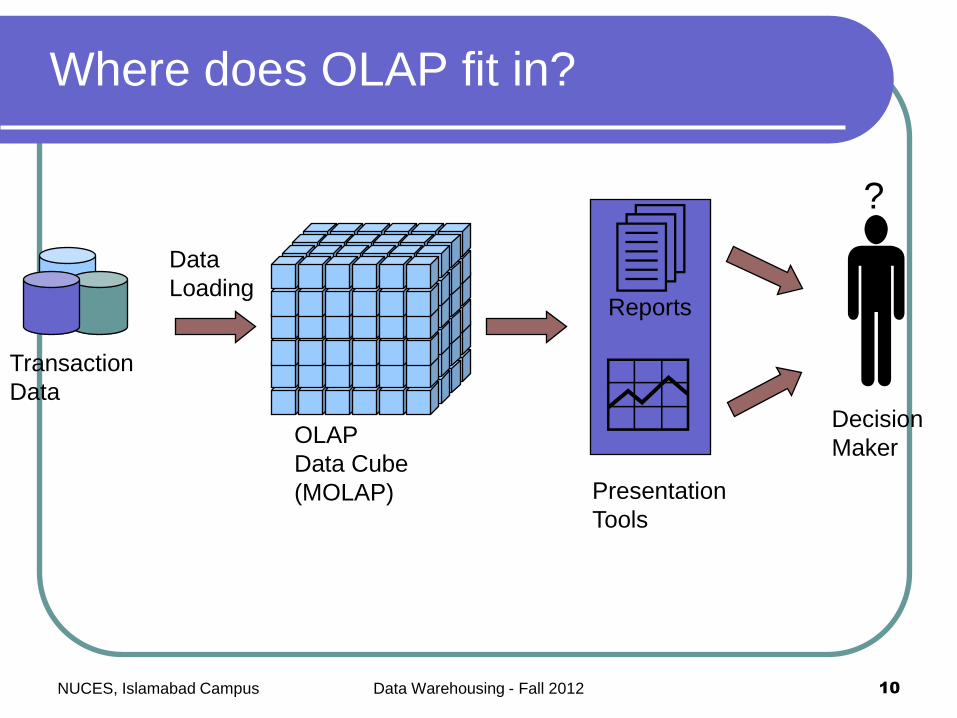
Where does OLAP fit in?
Transaction
Data
Presentation
Tools
Reports
OLAP
Data Cube
(MOLAP)
Data
Loading ?
Decision
Maker
NUCES, Islamabad Campus Data Warehousing - Fall 2012
11
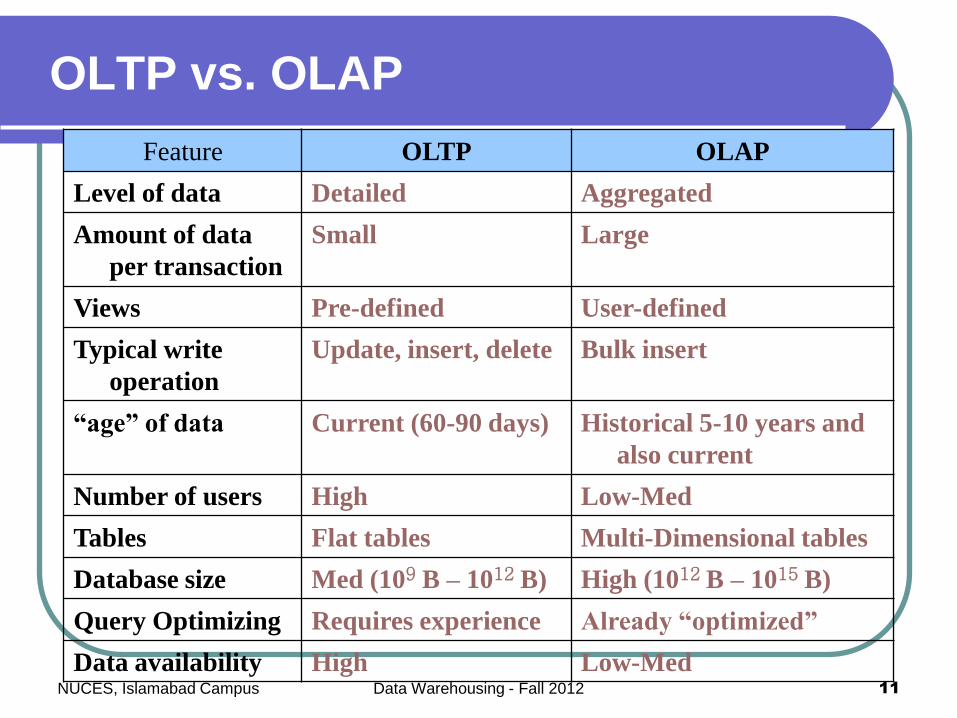
OLTP vs. OLAP
Feature OLTP OLAP
Level of data Detailed Aggregated
Amount of data
per transaction
Small Large
Views Pre-defined User-defined
Typical write
operation
Update, insert, delete Bulk insert
“age” of data Current (60-90 days) Historical 5-10 years and
also current
Number of users High Low-Med
Tables Flat tables Multi-Dimensional tables
Database size Med (109 B – 1012 B) High (1012 B – 1015 B)
Query Optimizing Requires experience Already “optimized”
Data availability High Low-MedNUCES, Islamabad Campus Data Warehousing - Fall 2012
12
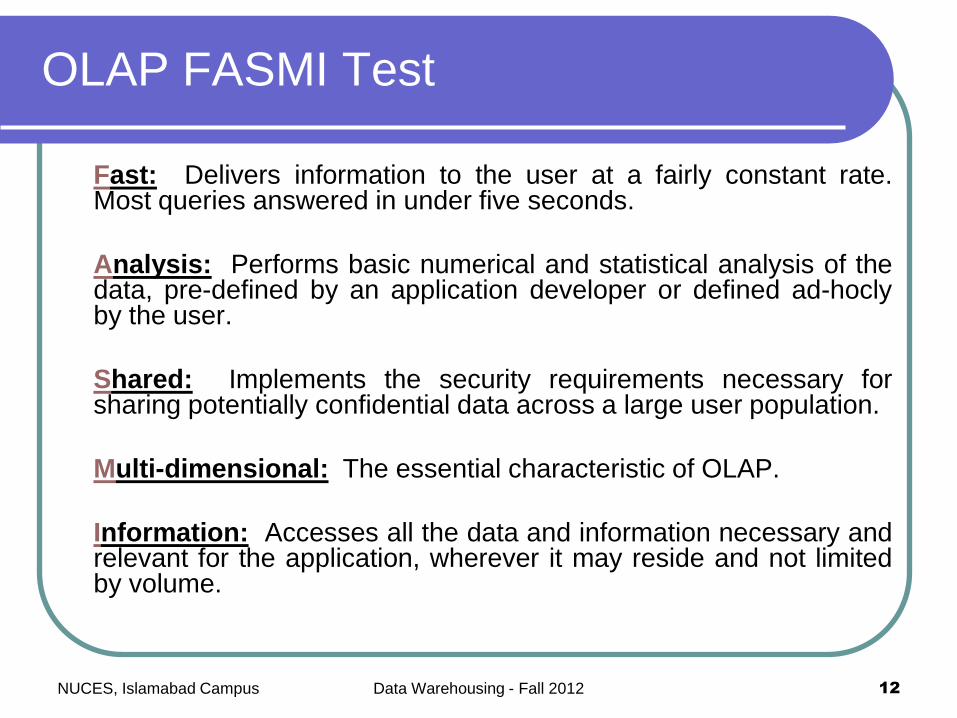
OLAP FASMI Test
Fast: Delivers information to the user at a fairly constant rate.Most queries answered in under five seconds.
Analysis: Performs basic numerical and statistical analysis of thedata, pre-defined by an application developer or defined ad-hoclyby the user.
Shared: Implements the security requirements necessary forsharing potentially confidential data across a large user population.
Multi-dimensional: The essential characteristic of OLAP.
Information: Accesses all the data and information necessary andrelevant for the application, wherever it may reside and not limitedby volume.
NUCES, Islamabad Campus Data Warehousing - Fall 2012

Multidimensional OLAP
(MOLAP)

14
OLAP Implementations
1. MOLAP: OLAP implemented with a multi-dimensional data
structure.
2. ROLAP: OLAP implemented with a relational database.
3. HOLAP: OLAP implemented as a hybrid of MOLAP and
ROLAP.
4. DOLAP: OLAP implemented for desktop decision support
environments.
NUCES, Islamabad Campus Data Warehousing - Fall 2012
15
MOLAP Implementations
OLAP has historically been implemented using a
multi_dimensional data structure or “cube”.
Dimensions are key business factors for analysis:
Geographies (city, district, division, province,...)
Products (item, product category, product
department,...)
Dates (day, week, month, quarter, year,...)
Very high performance achieved by O(1) time lookup
into “cube” data structure to retrieve pre_aggregated
results.
NUCES, Islamabad Campus Data Warehousing - Fall 2012
16
MOLAP Implementations
No standard query language for querying MOLAP
- No SQL !
Vendors provide proprietary languages allowing business users to
create queries that involve pivots, drilling down, or rolling up.
- E.g. MDX of Microsoft
- Languages generally involve extensive visual (click and drag)
support.
- Application Programming Interface (API)’s also provided for
probing the cubes.
NUCES, Islamabad Campus Data Warehousing - Fall 2012
17
Aggregations in MOLAP
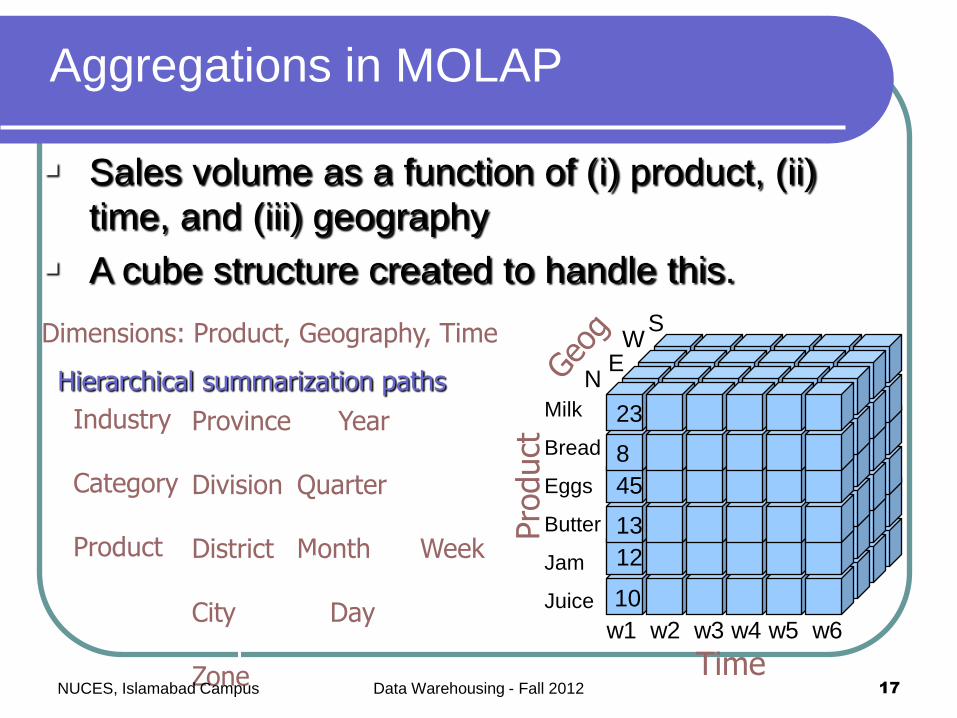
Sales volume as a function of (i) product, (ii)
time, and (iii) geography
A cube structure created to handle this.
Dimensions: Product, Geography, Time
Industry
Category
Product
Hierarchical summarization paths
Pro
duct
Timew1 w2 w3 w4 w5 w6
Milk
Bread
Eggs
Butter
Jam
Juice
NE
WS
12
13
45
8
23
10
Province
Division
District
City
Zone
Year
Quarter
Month Week
Day
NUCES, Islamabad Campus Data Warehousing - Fall 2012
18
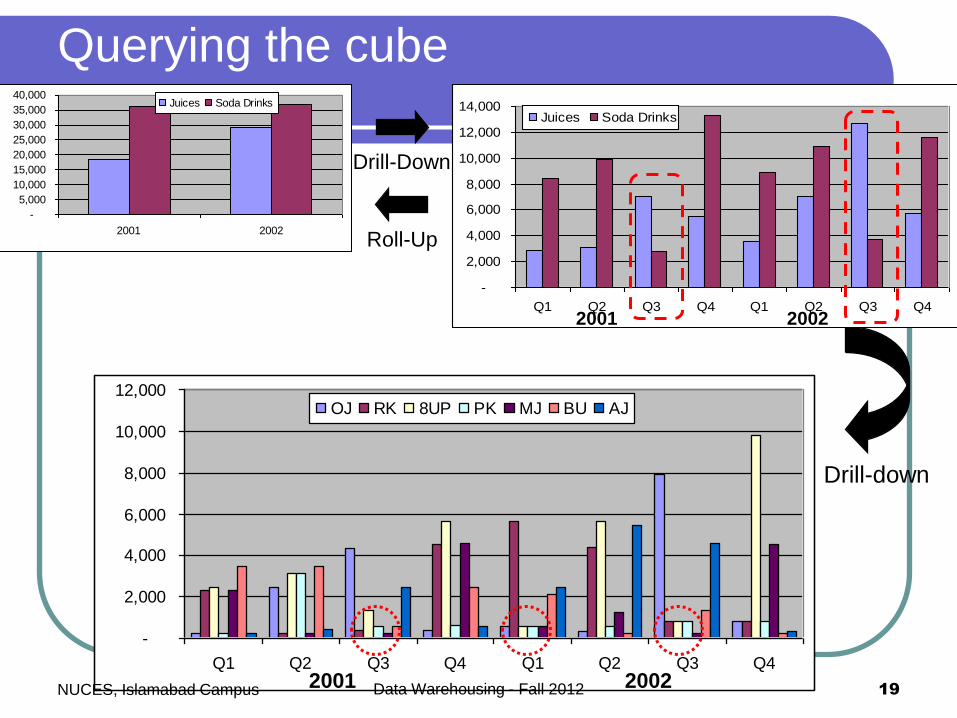
Cube operations
Drill down: get more details
e.g., given summarized sales as above, find breakupof sales by city within each region, or within Sindh
Rollup: summarize data
e.g., given sales data, summarize sales for last yearby product category and region
Slice and dice: select and project
e.g.: Sales of soft-drinks in Karachi during lastquarter
Pivot: change the view of data
NUCES, Islamabad Campus Data Warehousing - Fall 2012
19
Drill-down
-
2,000
4,000
6,000
8,000
10,000
12,000
Q1 Q2 Q3 Q4 Q1 Q2 Q3 Q4
OJ RK 8UP PK MJ BU AJ
2001 2002
Querying the cube
-
5,000
10,000
15,000
20,000
25,000
30,000
35,000
40,000
2001 2002
Juices Soda Drinks
-
2,000
4,000
6,000
8,000
10,000
12,000
14,000
Q1 Q2 Q3 Q4 Q1 Q2 Q3 Q4
Juices Soda Drinks
2001 2002
Drill-Down
Roll-Up
NUCES, Islamabad Campus Data Warehousing - Fall 2012

20
Querying the cube: Pivoting
-
5,000
10,000
15,000
20,000
25,000
30,000
35,000
40,000
2001 2002
Juices Soda Drinks
-
2,000
4,000
6,000
8,000
10,000
12,000
14,000
16,000
18,000
Orange
juice
Mango
juice
Apple
juice
Rola-
Kola
8-UP Bubbly-
UP
Pola-
Kola
2001 2002
NUCES, Islamabad Campus Data Warehousing - Fall 2012
21
MOLAP evaluation
Advantages of MOLAP: Instant response (pre-calculated
aggregates).
Impossible to ask question without an
answer.
Value added functions (ranking, %
change).
NUCES, Islamabad Campus Data Warehousing - Fall 2012
22
MOLAP evaluation
Drawbacks of MOLAP:
Long load time ( pre-calculating the cube
may take days!).
Very sparse cube (wastage of space) for
high cardinality (sometimes in small
hundreds). e.g. number of heaters sold in
Jacobabad or Sibi.
NUCES, Islamabad Campus Data Warehousing - Fall 2012
23
MOLAP Implementation issues
Maintenance issue: Every data item received
must be aggregated into every cube (assuming
“to-date” summaries are maintained). Lot of
work.
Storage issue: As dimensions get less
detailed (e.g., year vs. day) cubes get much
smaller, but storage consequences for building
hundreds of cubes can be significant. Lot of
space.
NUCES, Islamabad Campus Data Warehousing - Fall 2012
24
Partitioned Cubes
To overcome the space limitation of MOLAP, the cube ispartitioned.
The divide&conquer cube partitioning approach helps alleviate thescalability limitations of MOLAP implementation.
One logical cube of data can be spread across multiple physicalcubes on separate (or same) servers.
Ideal cube partitioning is completely invisible to end users.
Performance degradation does occurs in case of a join acrosspartitioned cubes.
NUCES, Islamabad Campus Data Warehousing - Fall 2012
25
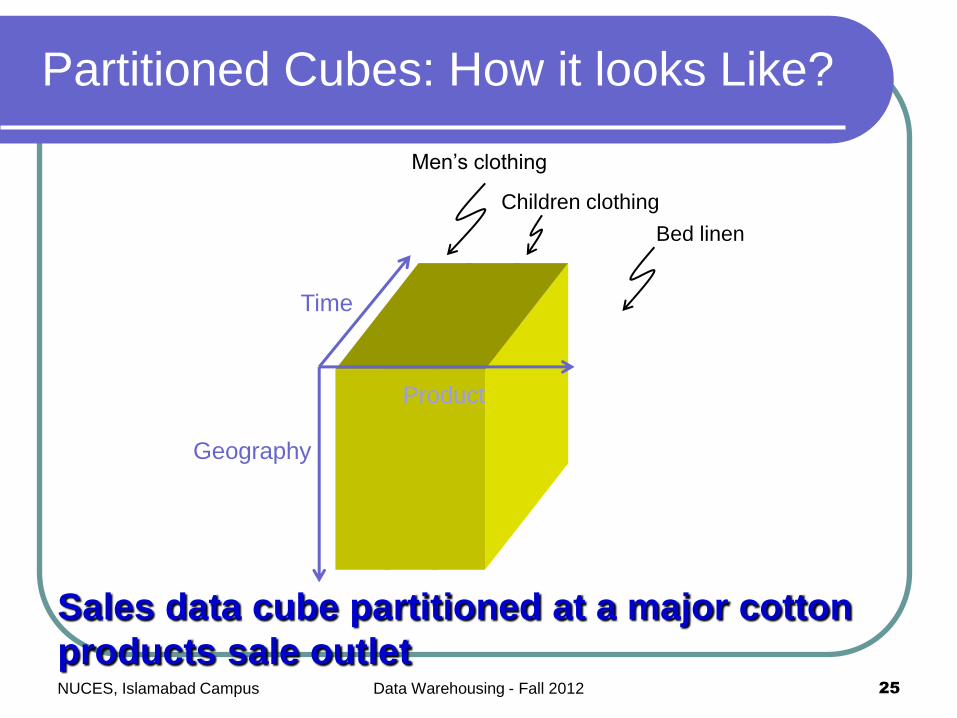
Partitioned Cubes: How it looks Like?
Time
Geography
Men’s clothing
Children clothing
Bed linen
Sales data cube partitioned at a major cotton
products sale outlet
Product
NUCES, Islamabad Campus Data Warehousing - Fall 2012
26
Virtual Cubes
Used to query two dissimilar cubes by creating a third“virtual” cube by a join between two cubes.
Logically similar to a relational view i.e. linking two (ormore) cubes along common dimension(s).
Biggest advantage is saving in space by eliminatingstorage of redundant information.
Example: Joining the store cube and the list price cubealong the product dimension, to calculate the sale pricewithout redundant storage of the sale price data.
NUCES, Islamabad Campus Data Warehousing - Fall 2012
Relational OLAP (ROLAP)
28
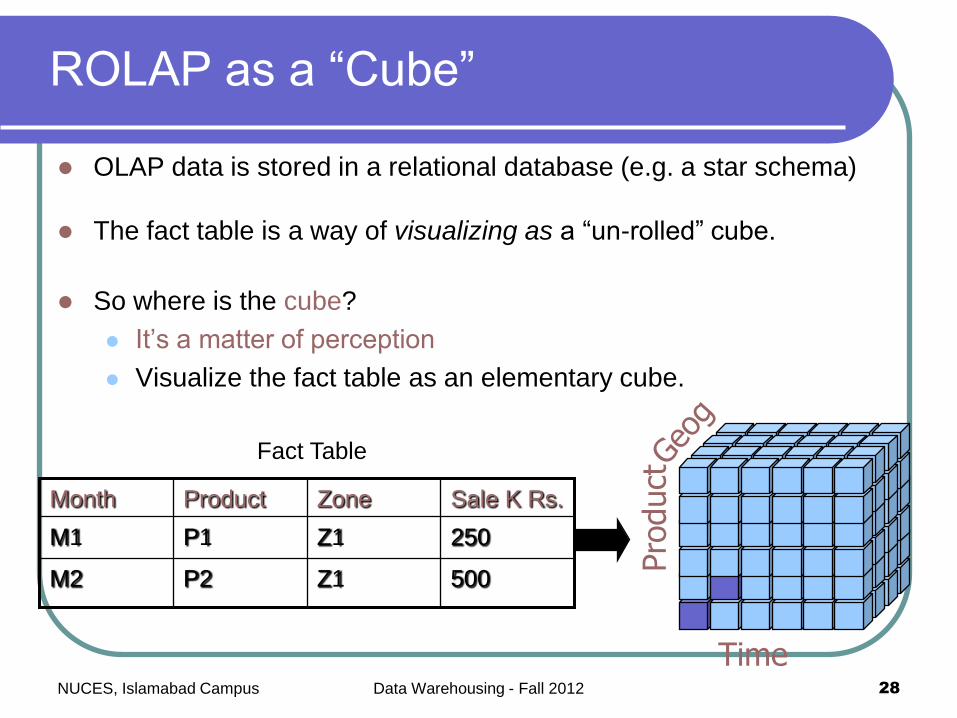
ROLAP as a “Cube”
OLAP data is stored in a relational database (e.g. a star schema)
The fact table is a way of visualizing as a “un-rolled” cube.
So where is the cube?
It’s a matter of perception
Visualize the fact table as an elementary cube.
Pro
duct
Time
500Z1P2M2
250Z1P1M1
Sale K Rs.ZoneProductMonth
Fact Table
NUCES, Islamabad Campus Data Warehousing - Fall 2012
29
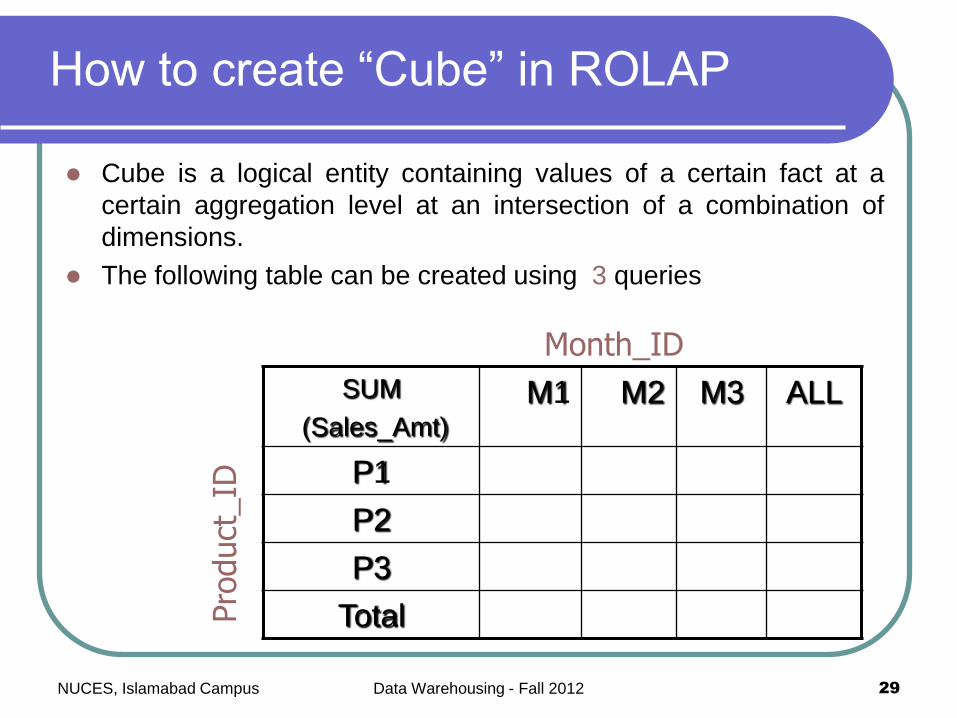
How to create “Cube” in ROLAP
Cube is a logical entity containing values of a certain fact at a
certain aggregation level at an intersection of a combination of
dimensions.
The following table can be created using 3 queries
SUM
(Sales_Amt)
M1 M2 M3 ALL
P1
P2
P3
Total
Month_ID
Pro
duct
_ID
NUCES, Islamabad Campus Data Warehousing - Fall 2012
30
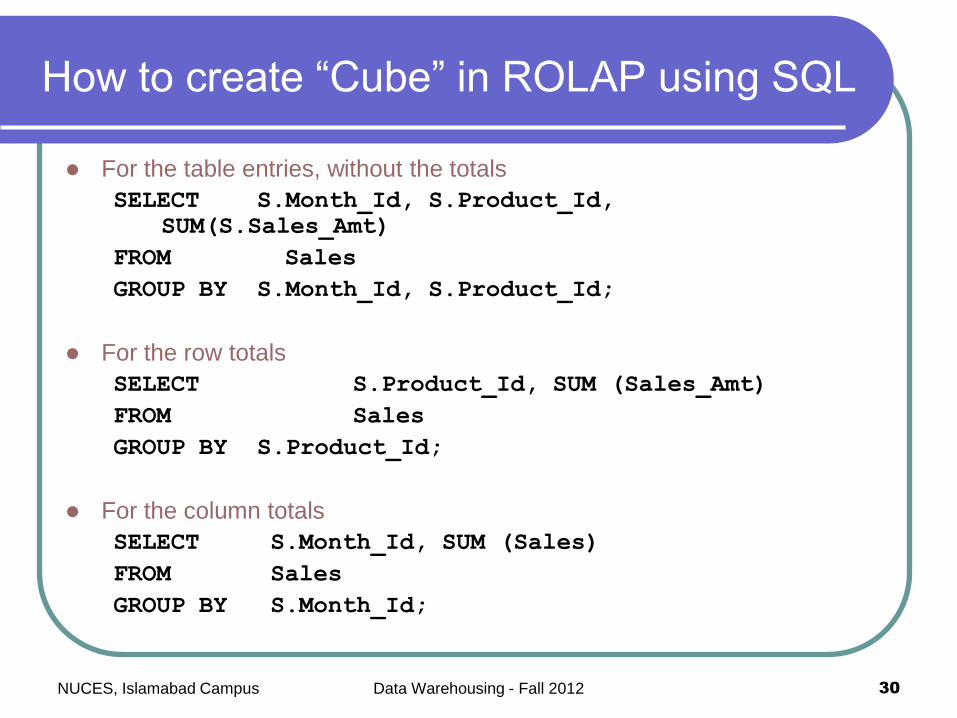
For the table entries, without the totals
SELECT S.Month_Id, S.Product_Id,
SUM(S.Sales_Amt)
FROM Sales
GROUP BY S.Month_Id, S.Product_Id;
For the row totals
SELECT S.Product_Id, SUM (Sales_Amt)
FROM Sales
GROUP BY S.Product_Id;
For the column totals
SELECT S.Month_Id, SUM (Sales)
FROM Sales
GROUP BY S.Month_Id;
How to create “Cube” in ROLAP using SQL
NUCES, Islamabad Campus Data Warehousing - Fall 2012
31
Problem With Simple Approach
Number of required queries increases
exponentially with the increase in number of
dimensions.
Its wasteful to compute all queries.
In the example, the first query can do most of the
work of the other two queries
If we could save that result and aggregate over
Month_Id and Product_Id, we could compute the
other queries more efficiently
NUCES, Islamabad Campus Data Warehousing - Fall 2012
32
CUBE Clause
The CUBE clause is part of SQL:1999
GROUP BY CUBE (v1, v2, …, vn)
Equivalent to a collection of GROUP BYs,
one for each of the subsets of v1, v2, …, vn
NUCES, Islamabad Campus Data Warehousing - Fall 2012
33
ROLAP & Space Requirement
If one is not careful, with the increase in number
of dimensions, the number of summary tables
gets very large
Consider the example discussed earlier with the
following two dimensions on the fact table...
Time: Day, Week, Month, Quarter, Year, All Days
Product: Item, Sub-Category, Category, All Products
NUCES, Islamabad Campus Data Warehousing - Fall 2012
34
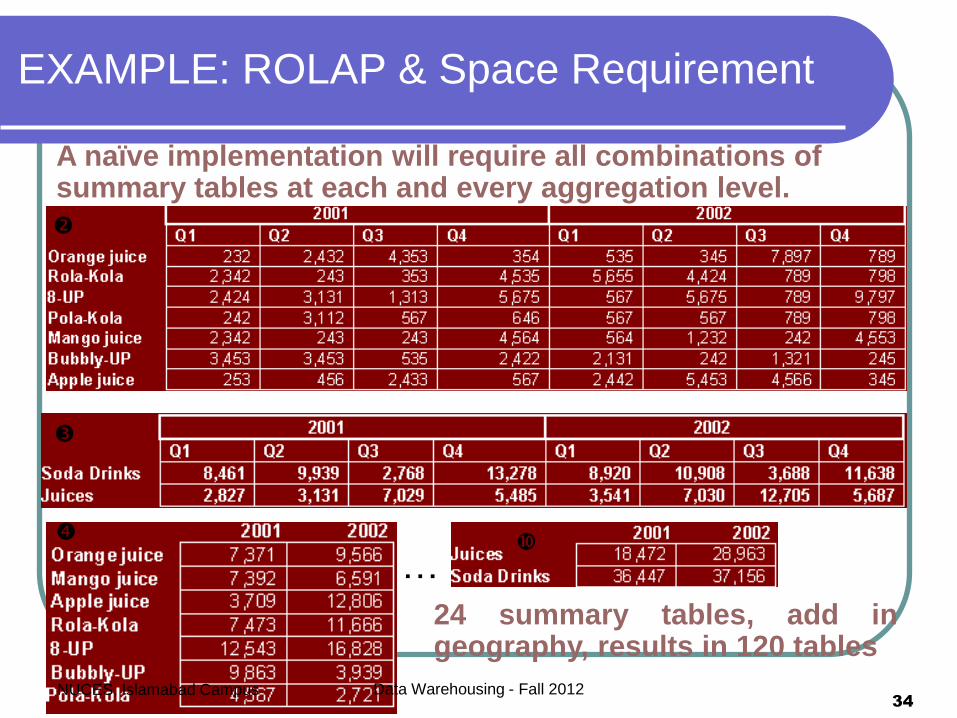
A naïve implementation will require all combinations of summary tables at each and every aggregation level.
…
24 summary tables, add ingeography, results in 120 tables
EXAMPLE: ROLAP & Space Requirement
NUCES, Islamabad Campus Data Warehousing - Fall 2012
35
ROLAP Issues
Maintenance.
Non standard hierarchy of dimensions.
Non standard conventions.
Explosion of storage space requirement.
Aggregation pit-falls.
NUCES, Islamabad Campus Data Warehousing - Fall 2012
36
ROLAP Issue: Maintenance
Summary tables are mostly a maintenance issue(similar to MOLAP) than a storage issue.
Notice that summary tables get much smaller asdimensions get less detailed (e.g., year vs. day).
Should plan for twice the size of the unsummarized datafor ROLAP summaries in most environments.
Assuming "to-date" summaries, every detail record thatis received into warehouse must aggregate into EVERYsummary table.
NUCES, Islamabad Campus Data Warehousing - Fall 2012

37
Dimensions are NOT always simple hierarchies
Dimensions can be more than simple hierarchies i.e. item,subcategory, category, etc.
The product dimension might also branch off by trade style that crosssimple hierarchy boundaries such as:
Looking at sales of air conditioners that cross manufacturerboundaries, such as COY1, COY2, COY3 etc.
Looking at sales of all “green colored” items that even cross productcategories (washing machine, refrigerator, split-AC, etc.).
Looking at a combination of both.
ROLAP Issue: Hierarchies
NUCES, Islamabad Campus Data Warehousing - Fall 2012
38
Conventions are NOT absolute
Example: What is calendar year? What is a week?
Calendar:
01 Jan. to 31 Dec or
01 Jul. to 30 Jun. or
01 Sep to 30 Aug.
Week:
Mon. to Sat. or Thu. to Wed.
ROLAP Issue: Convention
NUCES, Islamabad Campus Data Warehousing - Fall 2012
39
ROLAP Issue: Storage space explosion
Summary tables required for non-standard
grouping
Summary tables required along different
definitions of year, week etc.
Brute force approach would quickly overwhelm
the system storage capacity due to a
combinatorial explosion.
NUCES, Islamabad Campus Data Warehousing - Fall 2012

40
ROALP Issues: Aggregation pitfalls
Coarser granularity correspondingly
decreases potential cardinality.
Aggregating whatever that can be
aggregated.
Throwing away the detail data after
aggregation.
NUCES, Islamabad Campus Data Warehousing - Fall 2012
41
How to Reduce Summary tables?
Many ROLAP products have developed
means to reduce the number of summary
tables by: Building summaries on-the-fly as required by end-
user applications.
Enhancing performance on common queries at
coarser granularities.
Providing smart tools to assist DBAs in selecting the
"best” aggregations to build i.e. trade-off between
speed and space.
NUCES, Islamabad Campus Data Warehousing - Fall 2012

42
Maximum performance boost implies using lots
of disk space for storing every pre-calculation.
Minimum performance boost implies no disk
space with zero pre-calculation.
Using meta data to determine best level of pre-
aggregation from which all other aggregates
can be computed.
Performance vs. Space Trade-Off
NUCES, Islamabad Campus Data Warehousing - Fall 2012
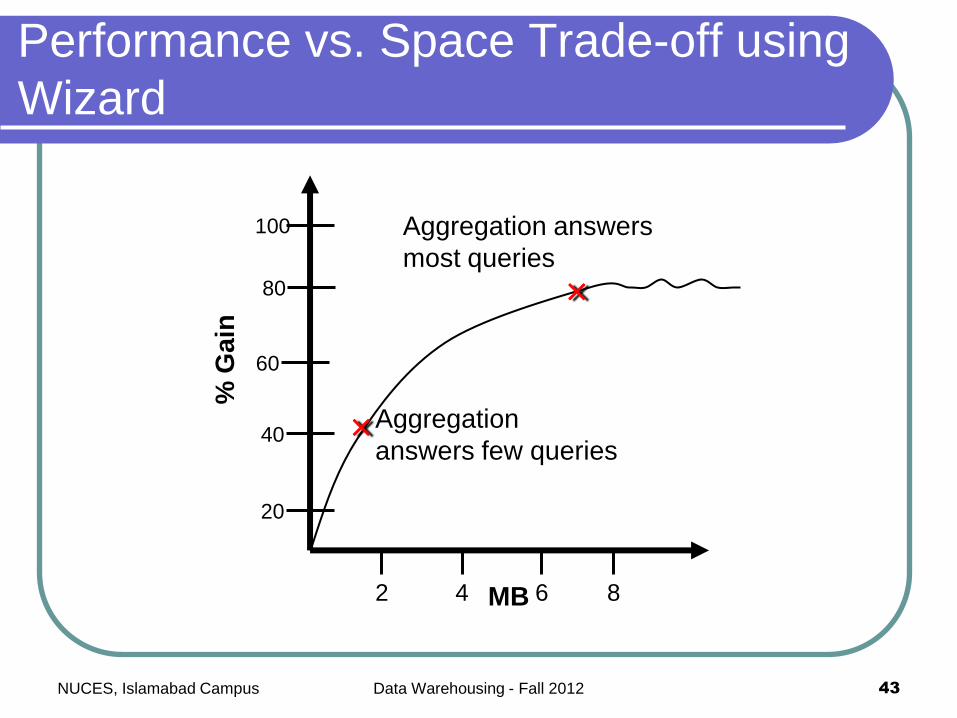
Performance vs. Space Trade-off using
Wizard
20
40
60
80
100
2 4 6 8
MB
% G
ain
Aggregation answers
most queries
Aggregation
answers few queries
NUCES, Islamabad Campus 43Data Warehousing - Fall 2012
44
HOLAP
Target is to get the best of both worlds.
HOLAP (Hybrid OLAP) allow co-
existence of pre-built MOLAP cubes
alongside relational OLAP or ROLAP
structures.
How much to pre-build?
NUCES, Islamabad Campus Data Warehousing - Fall 2012
45
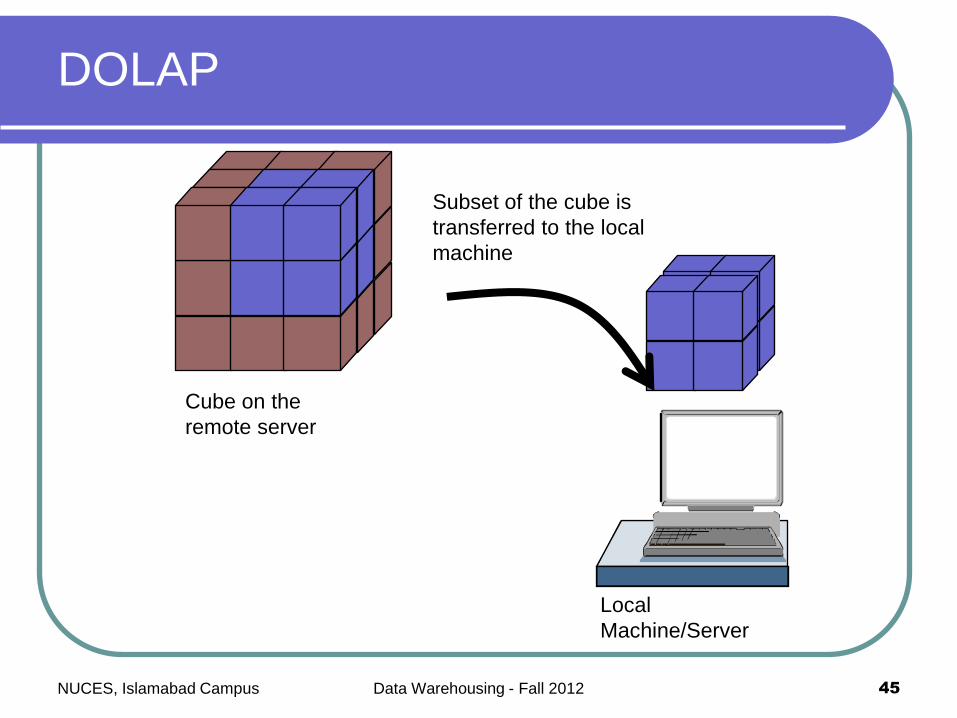
DOLAP
Cube on the
remote server
Local
Machine/Server
Subset of the cube is
transferred to the local
machine
NUCES, Islamabad Campus Data Warehousing - Fall 2012