Embed Size (px)
DESCRIPTION
ongc Valuation by DCF method
Citation preview
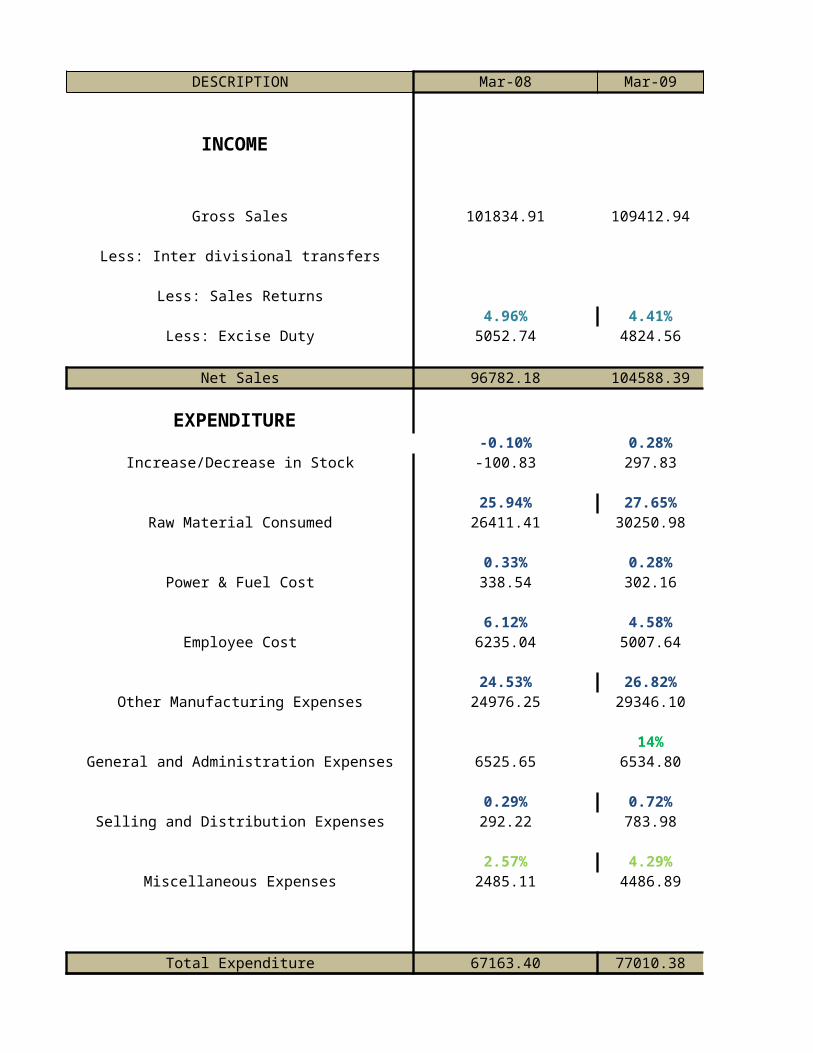
DESCRIPTION Mar-08 Mar-09 Mar-10
INCOME
Gross Sales 101834.91 109412.94 106174.11
Less: Inter divisional transfers 5.27
Less: Sales Returns4.96% 4.41% 4.16%
Less: Excise Duty 5052.74 4824.56 4414.28
Net Sales 96782.18 104588.39 101754.57
EXPENDITURE -0.10% 0.28% -0.35%
Increase/Decrease in Stock -100.83 297.83 -358.01
25.94% 27.65% 25.96%Raw Material Consumed 26411.41 30250.98 27559.52
0.33% 0.28% 0.27%Power & Fuel Cost 338.54 302.16 281.49
6.12% 4.58% 5.66%Employee Cost 6235.04 5007.64 6010.30
24.53% 26.82% 23.81%Other Manufacturing Expenses 24976.25 29346.10 25275.82
14% 176%General and Administration Expenses 6525.65 6534.80 18041.66
0.29% 0.72% 0.35%Selling and Distribution Expenses 292.22 783.98 373.42
2.57% 4.29% 1.70%Miscellaneous Expenses 2485.11 4486.89 1726.24
Total Expenditure 67163.40 77010.38 78910.43
Operating Profit (Excl OI) 29618.78 27578.00 22844.13
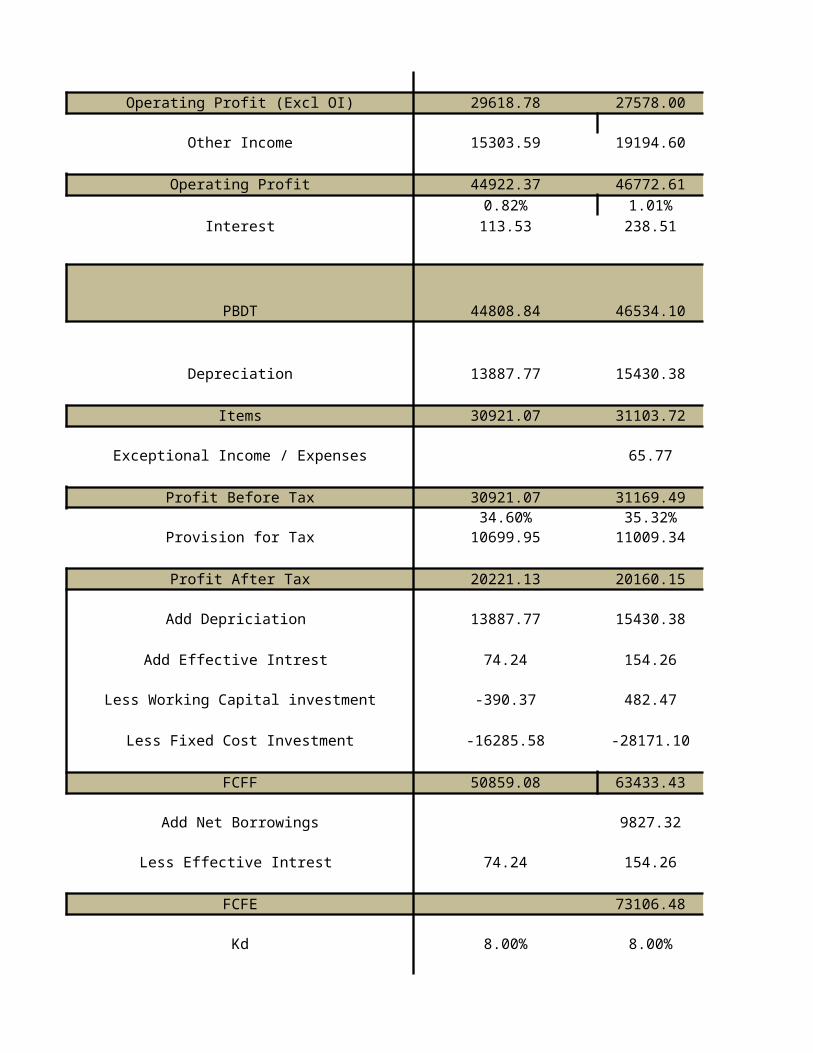
Other Income 15303.59 19194.60 26818.25
Operating Profit 44922.37 46772.61 49662.380.82% 1.01% 2.12%
Interest 113.53 238.51 502.19
PBDT 44808.84 46534.10 49160.19
Depreciation 13887.77 15430.38 18718.83
Profit Before Taxation & Exceptional Items 30921.07 31103.72 30441.36
Exceptional Income / Expenses 65.77
Profit Before Tax 30921.07 31169.49 30441.3634.60% 35.32% 35.19%
Provision for Tax 10699.95 11009.34 10713.79
Profit After Tax 20221.12 20160.15 19727.57
Add Depriciation 13887.77 15430.38 18718.83
Add Effective Intrest 74.24 154.26 325.44
Less Working Capital investment -390.37 482.47 -1619.61
Less Fixed Cost Investment -16285.58 -28171.10 -21101.88
FCFF 50859.08 63433.43 61493.34
Add Net Borrowings 9827.32 21.71
Less Effective Intrest 74.24 154.26 325.44
FCFE 73106.48 61189.60
Kd 8.00% 8.00% 8.00%
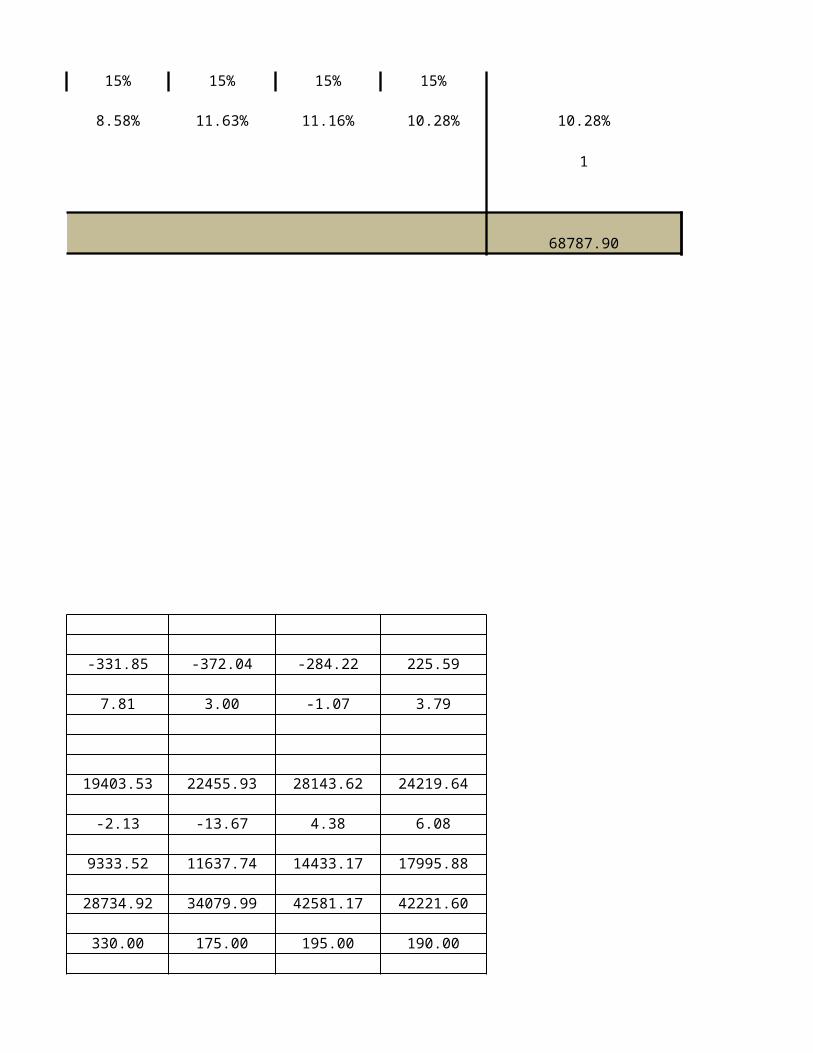
Ke 15% 15% 15%
WACC 8.93% 8.58% 8.58%
Discount Year
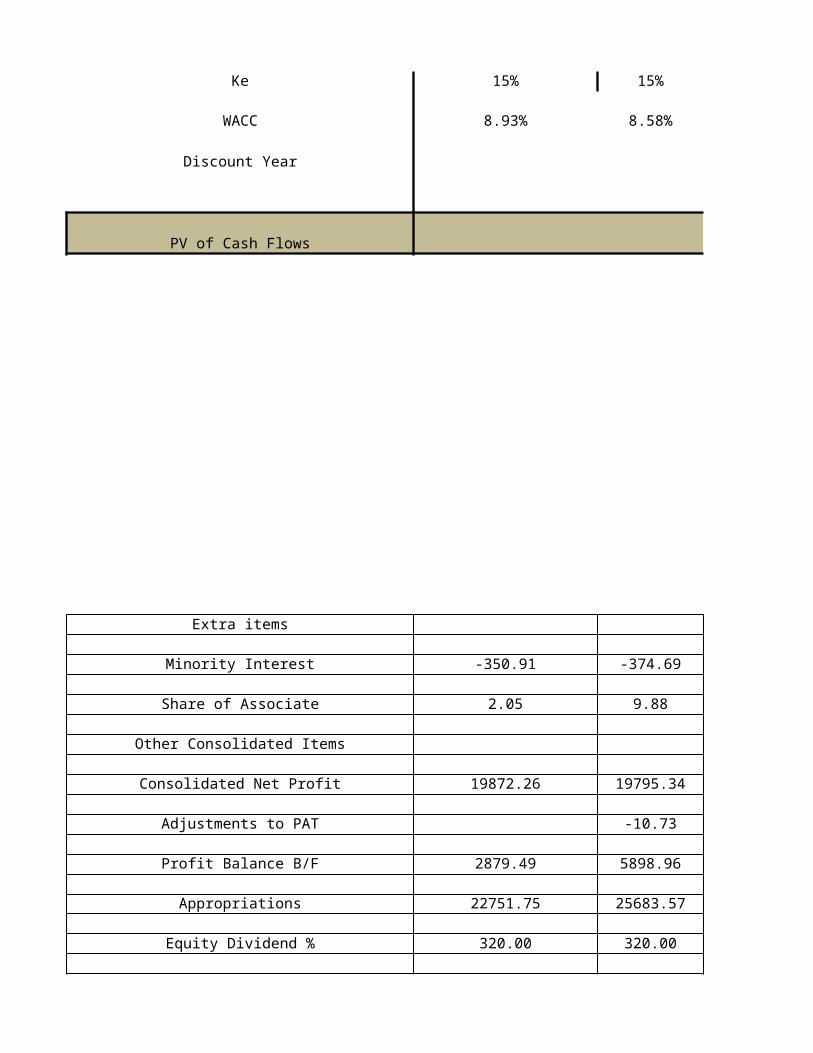
PV of Cash Flows
Extra items
Minority Interest -350.91 -374.69 -331.85
Share of Associate 2.05 9.88 7.81
Other Consolidated Items
Consolidated Net Profit 19872.26 19795.34 19403.53
Adjustments to PAT -10.73 -2.13
Profit Balance B/F 2879.49 5898.96 9333.52
Appropriations 22751.75 25683.57 28734.92
Equity Dividend % 320.00 320.00 330.00
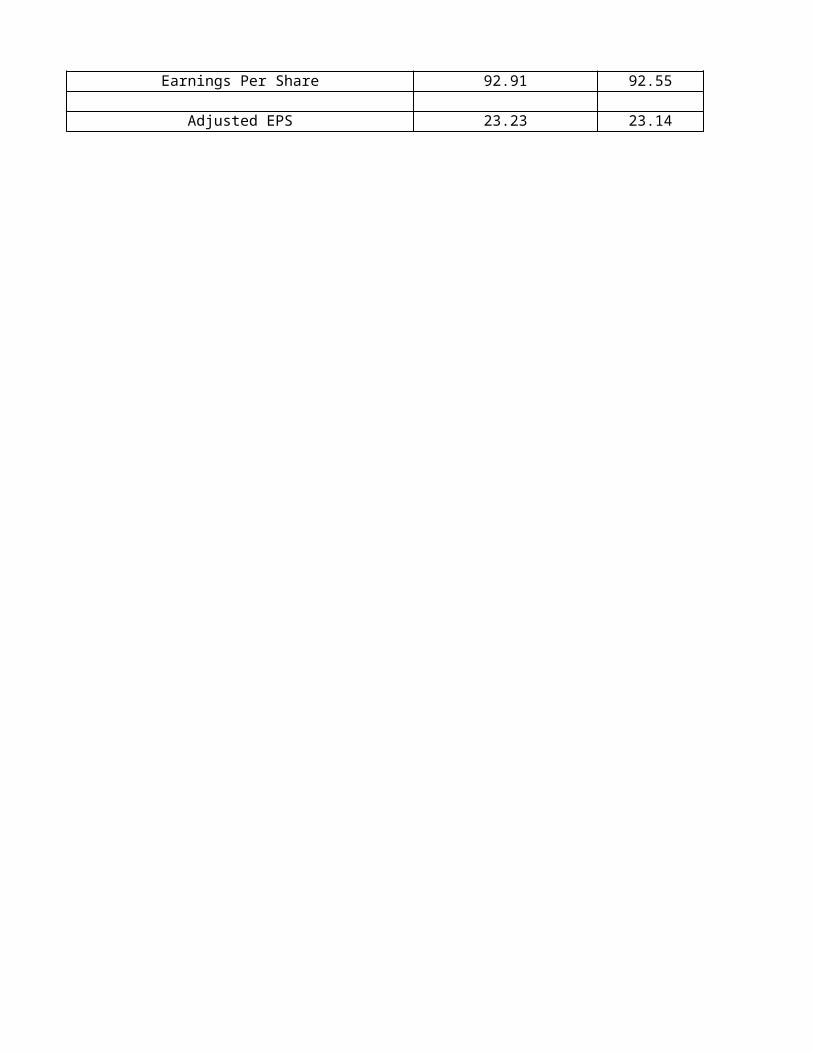
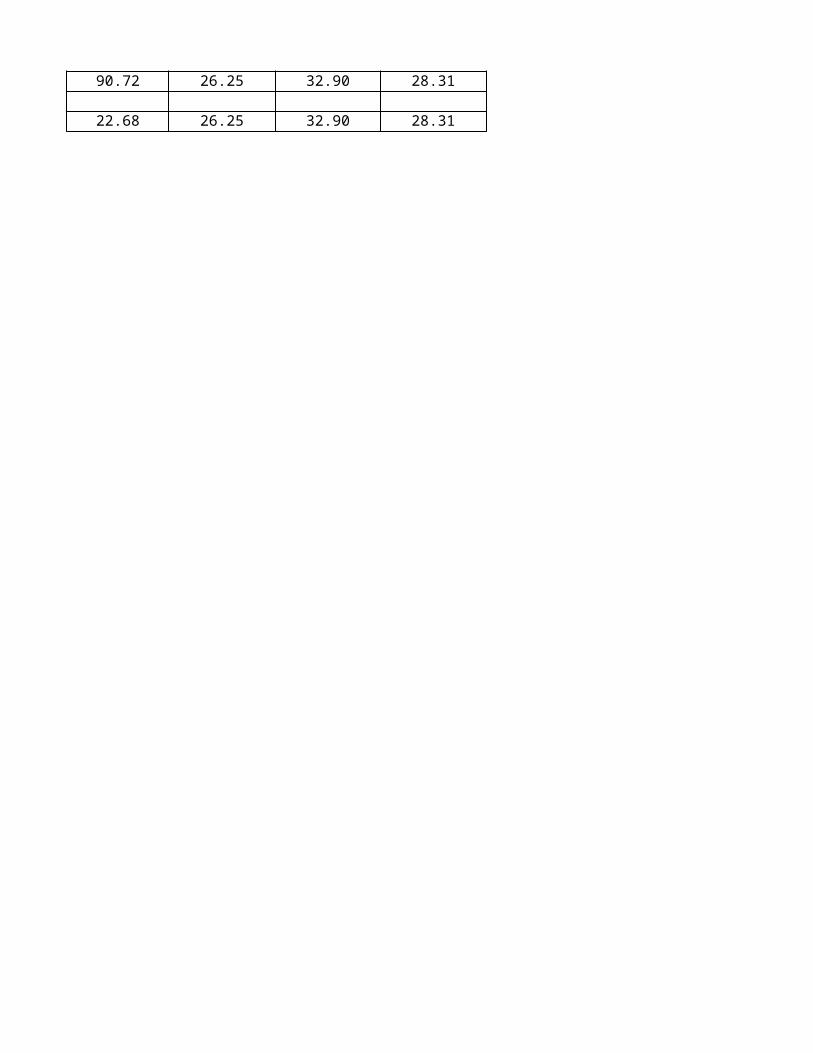
Earnings Per Share 92.91 92.55 90.72
Adjusted EPS 23.23 23.14 22.68
Mar-11 Mar-12 Mar-13 Mar-14 Mar-15 Mar-16
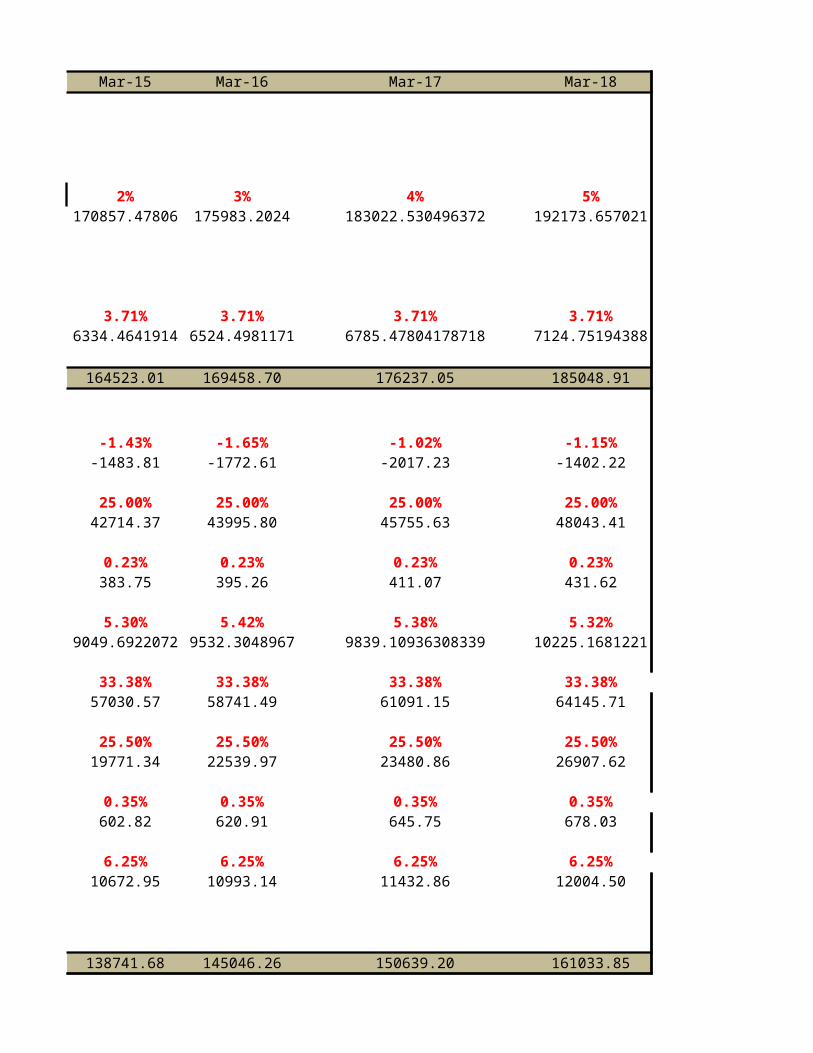
1% 2% 3%125287.32 151100.33 165848.84 167507.33143 170857.478059 175983.2024
4.11% 2.53% 2.08% 3.71% 3.71% 3.71%5153.45 3815.38 3445.67 6210.26 6334.46419136 6524.4981171
120133.87 147284.95 162403.17 161297.07 164523.01 169458.70
-4.77% -0.36% -0.67% -1.00% -1.43% -1.65%-5734.10 -536.84 -1092.99 -1608.09 -1483.81 -1772.61
27.37% 0.00% 0.00% 25.00% 25.00% 25.00%34289.98 0.04 41876.83 42714.37 43995.80
0.27% 0.12% 0.13% 0.23% 0.23% 0.23%339.74 185.85 218.25 376.22 383.75 395.26
5.71% 5.20% 5.22% 5.41% 5.30% 5.42%7149.56 7864.51 8650.96 9069.92092438406 9049.69220723 9532.30489668
34.78% 42.99% 47.35% 33.38% 33.38% 33.38%43575.83 64957.36 78529.87 55912.33 57030.57 58741.49
-61% 180% 28% 25.50% 25.50% 25.50%7097.89 19873.98 25496.28 17480.05 19771.34 22539.97
0.31% 0.22% 0.23% 0.35% 0.35% 0.35%387.85 333.92 383.41 591.00 602.82 620.91
9.95% 9.56% 9.42% 6.25% 6.25% 6.25%11953.23 14076.87 15295.81 10463.67 10672.95 10993.14
99059.98 106755.66 127481.64 134161.94 138741.68 145046.26
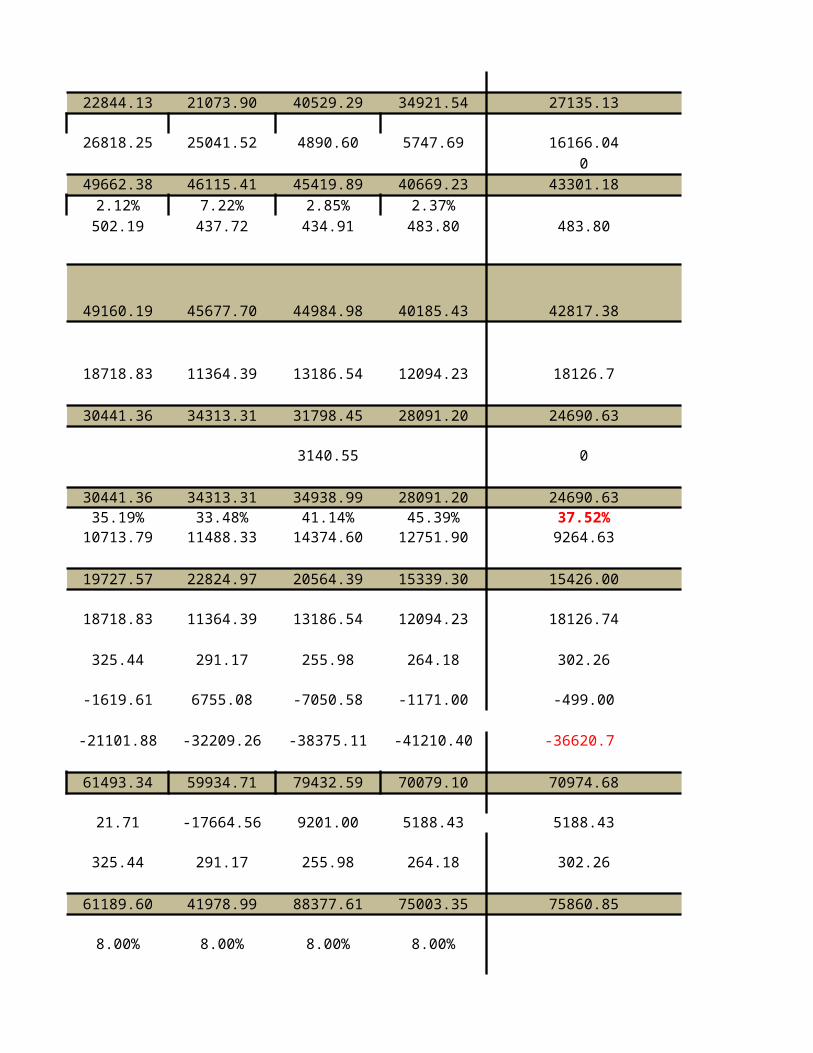
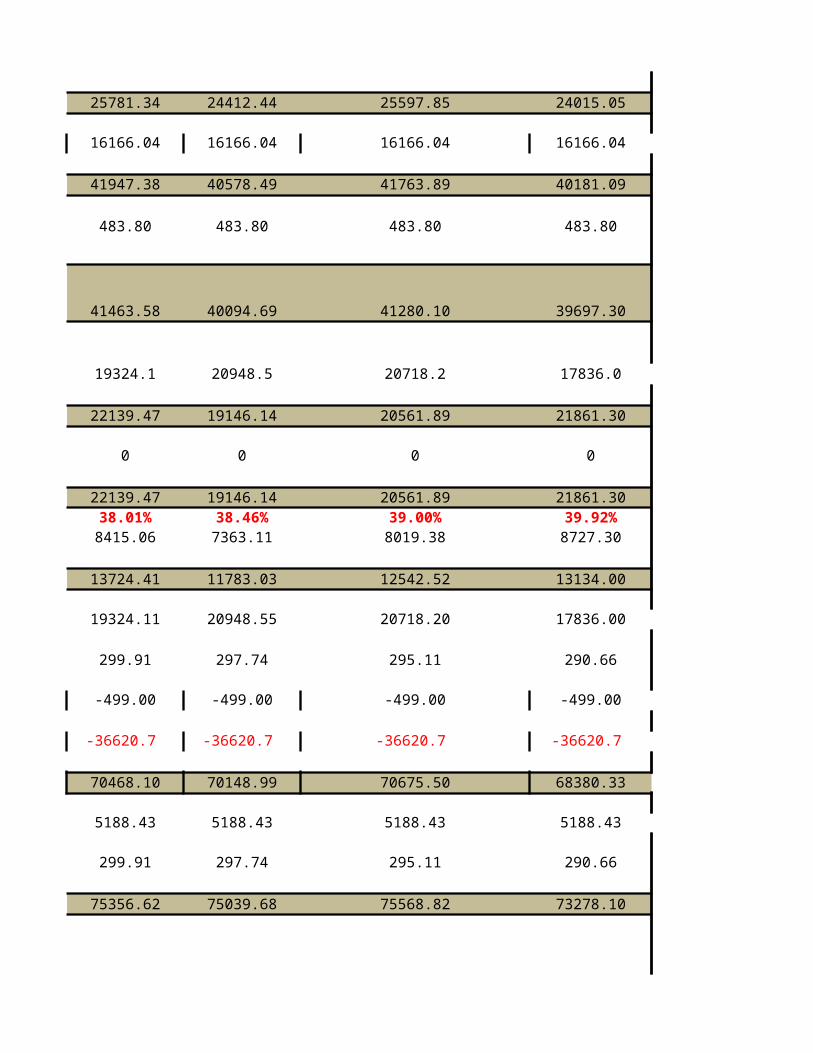
21073.90 40529.29 34921.54 27135.13 25781.34 24412.44
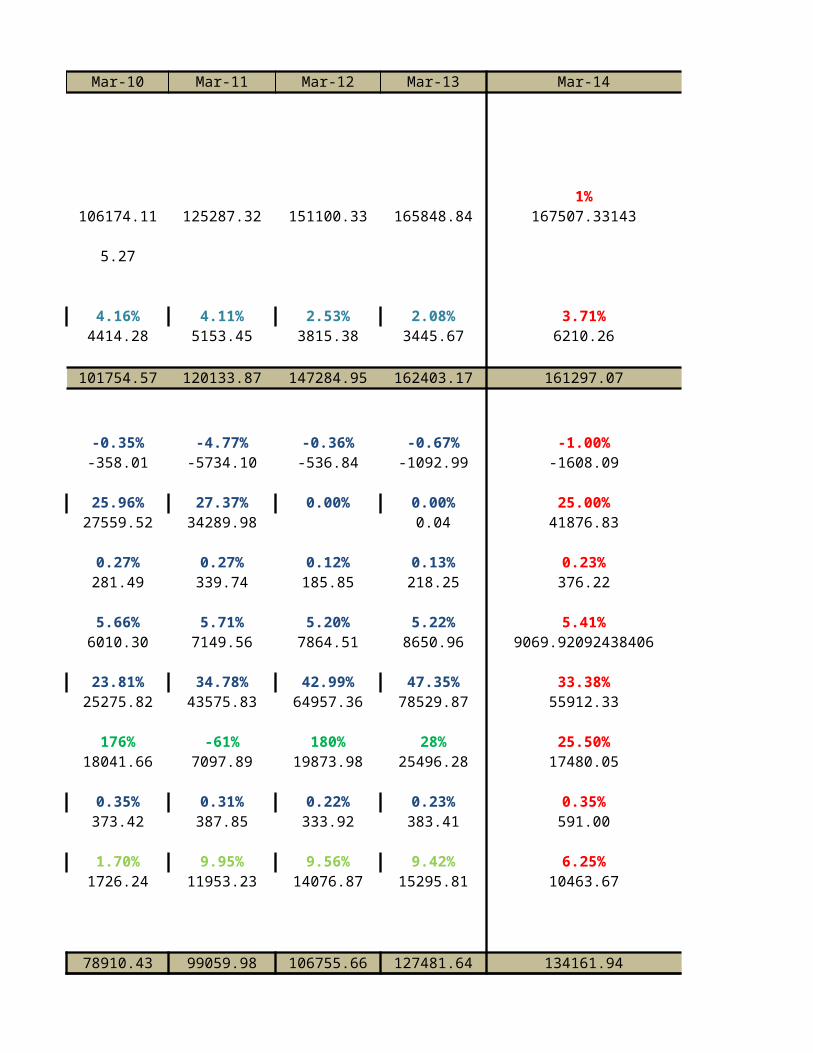
25041.52 4890.60 5747.69 16166.04 16166.04 16166.040
46115.41 45419.89 40669.23 43301.18 41947.38 40578.497.22% 2.85% 2.37%437.72 434.91 483.80 483.80 483.80 483.80
45677.70 44984.98 40185.43 42817.38 41463.58 40094.69
11364.39 13186.54 12094.23 18126.7 19324.1 20948.5
34313.31 31798.45 28091.20 24690.63 22139.47 19146.14
3140.55 0 0 0
34313.31 34938.99 28091.20 24690.63 22139.47 19146.1433.48% 41.14% 45.39% 37.52% 38.01% 38.46%
11488.33 14374.60 12751.90 9264.63 8415.06 7363.11
22824.97 20564.39 15339.30 15426.00 13724.41 11783.03
11364.39 13186.54 12094.23 18126.74 19324.11 20948.55
291.17 255.98 264.18 302.26 299.91 297.74
6755.08 -7050.58 -1171.00 -499.00 -499.00 -499.00
-32209.26 -38375.11 -41210.40 -36620.7 -36620.7 -36620.7
59934.71 79432.59 70079.10 70974.68 70468.10 70148.99
-17664.56 9201.00 5188.43 5188.43 5188.43 5188.43
291.17 255.98 264.18 302.26 299.91 297.74
41978.99 88377.61 75003.35 75860.85 75356.62 75039.68
8.00% 8.00% 8.00%
15% 15% 15%
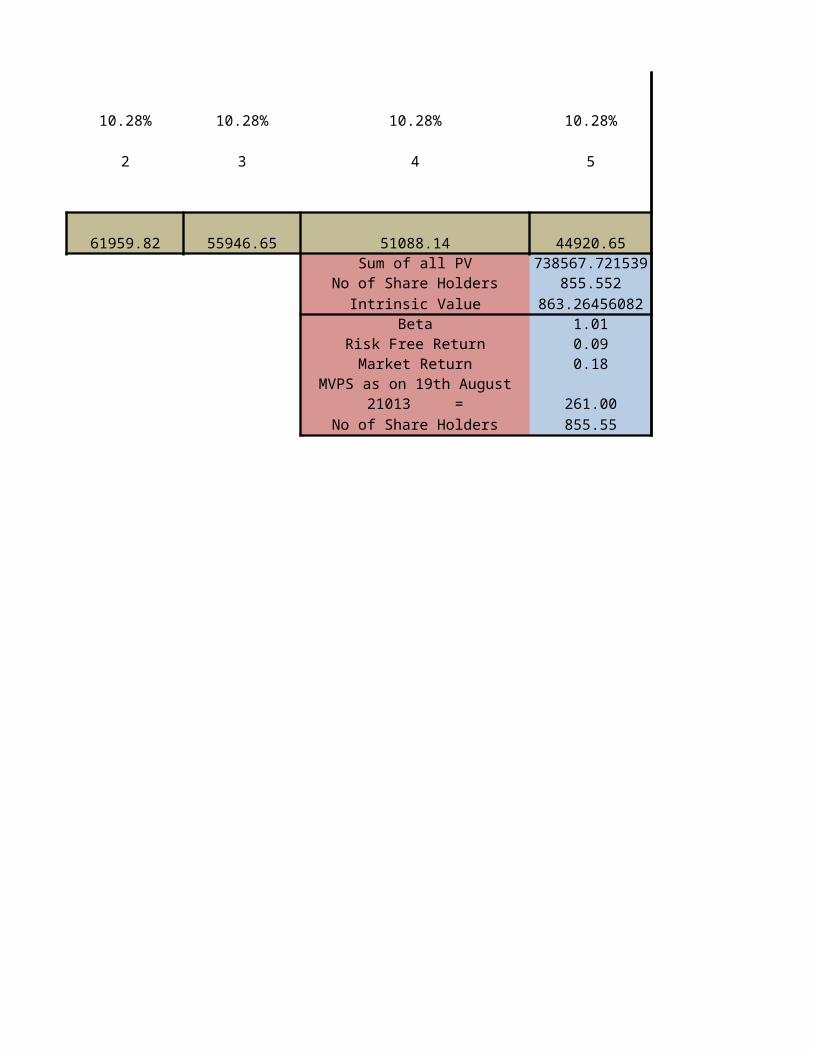
11.63% 11.16% 10.28% 10.28% 10.28% 10.28%
1 2 3
68787.90 61959.82 55946.65
-372.04 -284.22 225.59
3.00 -1.07 3.79
22455.93 28143.62 24219.64
-13.67 4.38 6.08
11637.74 14433.17 17995.88
34079.99 42581.17 42221.60
175.00 195.00 190.00
26.25 32.90 28.31
26.25 32.90 28.31
Mar-17 Mar-18
4% 5%183022.530496372 192173.657021
3.71% 3.71%6785.47804178718 7124.75194388
176237.05 185048.91
-1.02% -1.15%-2017.23 -1402.22
25.00% 25.00%45755.63 48043.41
0.23% 0.23%411.07 431.62
5.38% 5.32%9839.10936308339 10225.1681221
33.38% 33.38%61091.15 64145.71
25.50% 25.50%23480.86 26907.62
0.35% 0.35%645.75 678.03
6.25% 6.25%11432.86 12004.50
150639.20 161033.85
25597.85 24015.05
16166.04 16166.04
41763.89 40181.09Mar-14 Mar-15
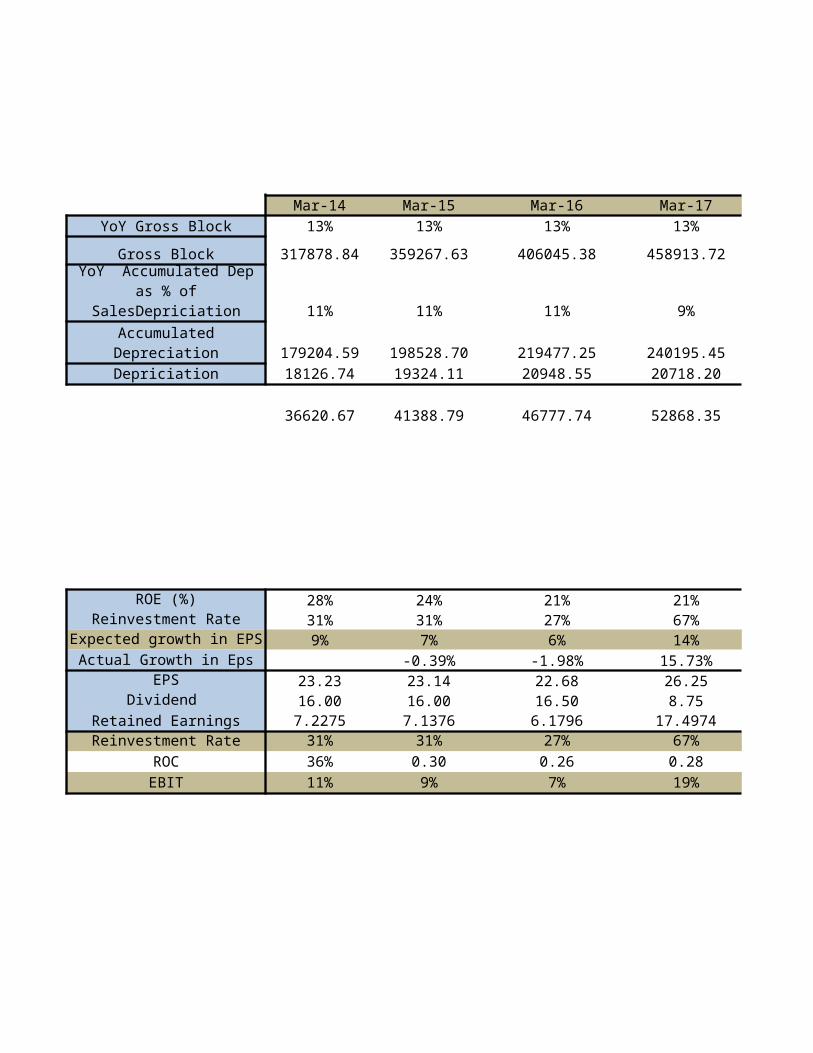
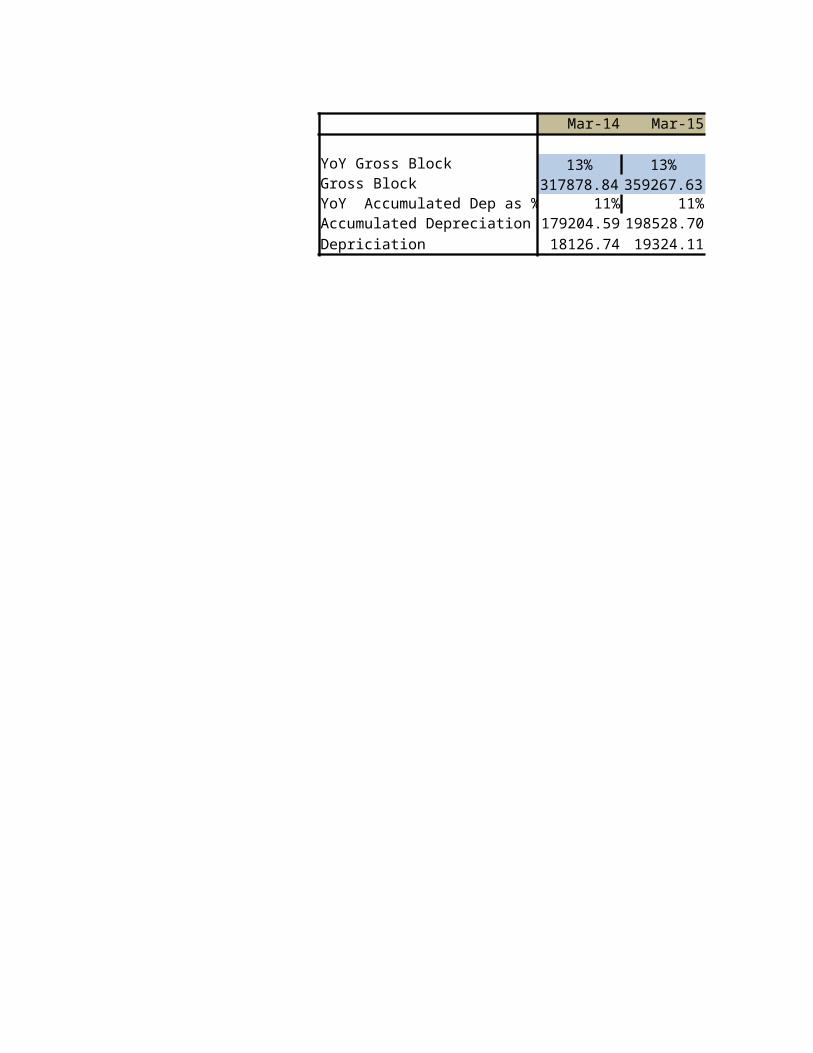
483.80 483.80 YoY Gross Block 13% 13%
Gross Block 317878.84 359267.63
41280.10 39697.30 11% 11%
Accumulated Depreciation 179204.59 198528.7020718.2 17836.0 Depriciation 18126.74 19324.11
20561.89 21861.30 36620.67 41388.79
0 0
20561.89 21861.3039.00% 39.92%8019.38 8727.30
12542.52 13134.00ROE (%) 28% 24%
20718.20 17836.00 Reinvestment Rate 31% 31%Expected growth in EPS 9% 7%
295.11 290.66 Actual Growth in Eps -0.39%EPS 23.23 23.14
-499.00 -499.00 Dividend 16.00 16.00Retained Earnings 7.2275 7.1376
-36620.7 -36620.7 Reinvestment Rate 31% 31%ROC 36% 0.30
70675.50 68380.33 Expected growth in EBIT 11% 9%
5188.43 5188.43
295.11 290.66
75568.82 73278.10
10.28% 10.28%
4 5
YoY Accumulated Dep as % of SalesDepriciation
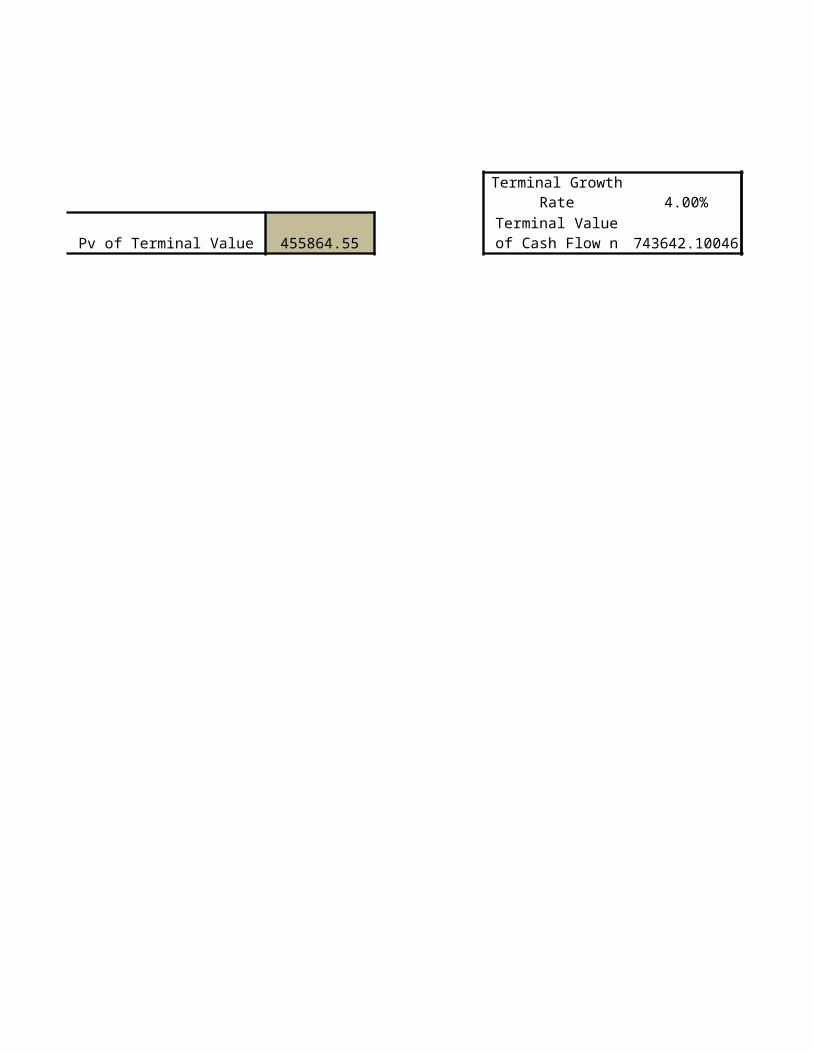
51088.14 44920.65 Pv of Terminal Value 455864.55Sum of all PV 738567.721539
No of Share Holders 855.552Intrinsic Value 863.26456082
Beta 1.01Risk Free Return 0.09Market Return 0.18
261.00No of Share Holders 855.55
MVPS as on 19th August 21013 =
420000
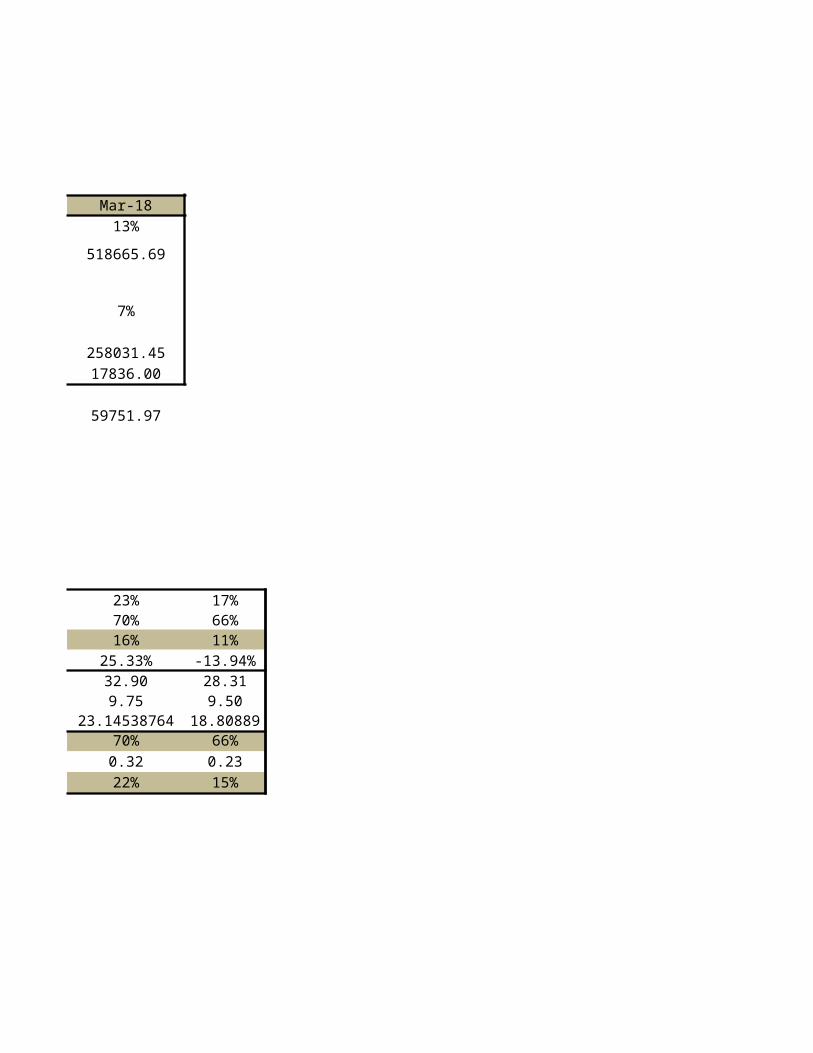
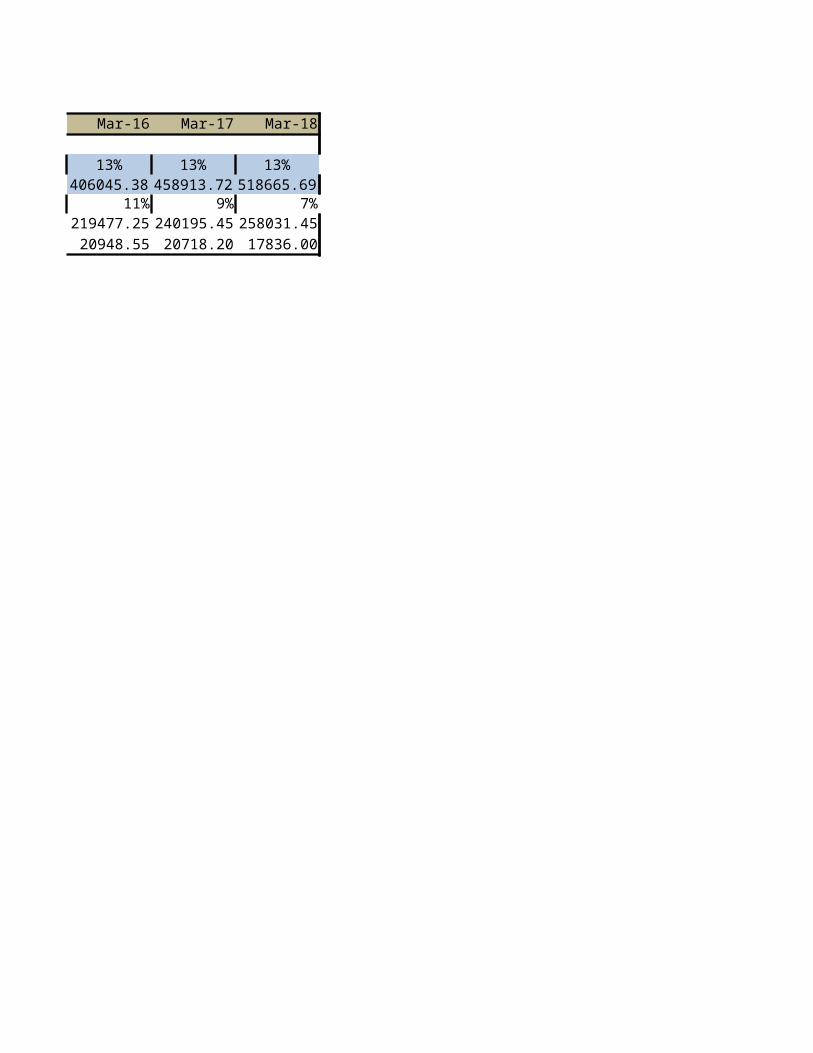
Mar-16 Mar-17 Mar-1813% 13% 13%
406045.38 458913.72 518665.69
11% 9% 7%
219477.25 240195.45 258031.4520948.55 20718.20 17836.00
46777.74 52868.35 59751.97
21% 21% 23% 17%27% 67% 70% 66%6% 14% 16% 11%
-1.98% 15.73% 25.33% -13.94%22.68 26.25 32.90 28.3116.50 8.75 9.75 9.50
6.1796 17.4974 23.14538764 18.80889227% 67% 70% 66%0.26 0.28 0.32 0.237% 19% 22% 15%
4.00%
743642.10046
Terminal Growth Rate
Terminal Value of Cash Flow n
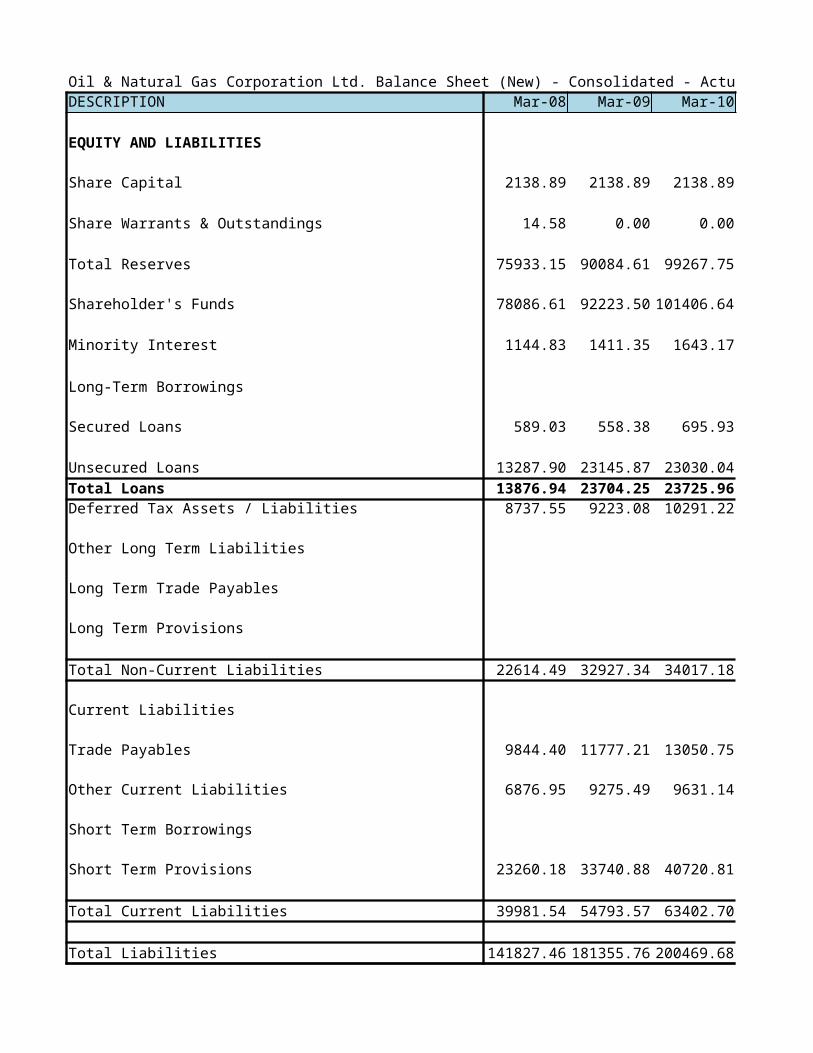
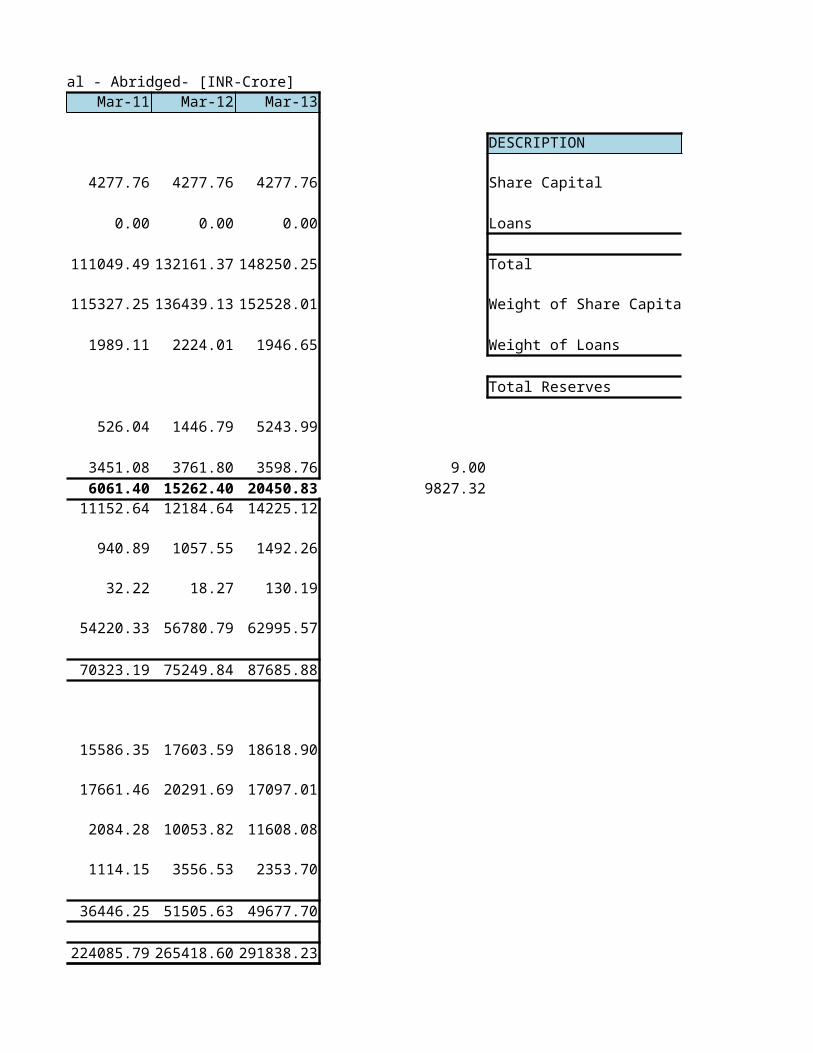
Oil & Natural Gas Corporation Ltd. Balance Sheet (New) - Consolidated - Actual - Abridged- [INR-Crore]DESCRIPTION Mar-08 Mar-09 Mar-10 Mar-11
EQUITY AND LIABILITIES
Share Capital 2138.89 2138.89 2138.89 4277.76
Share Warrants & Outstandings 14.58 0.00 0.00 0.00
Total Reserves 75933.15 90084.61 99267.75 111049.49
Shareholder's Funds 78086.61 92223.50 101406.64 115327.25
Minority Interest 1144.83 1411.35 1643.17 1989.11
Long-Term Borrowings
Secured Loans 589.03 558.38 695.93 526.04
Unsecured Loans 13287.90 23145.87 23030.04 3451.08Total Loans 13876.94 23704.25 23725.96 6061.40Deferred Tax Assets / Liabilities 8737.55 9223.08 10291.22 11152.64
Other Long Term Liabilities 940.89
Long Term Trade Payables 32.22
Long Term Provisions 54220.33
Total Non-Current Liabilities 22614.49 32927.34 34017.18 70323.19
Current Liabilities
Trade Payables 9844.40 11777.21 13050.75 15586.35
Other Current Liabilities 6876.95 9275.49 9631.14 17661.46
Short Term Borrowings 2084.28
Short Term Provisions 23260.18 33740.88 40720.81 1114.15
Total Current Liabilities 39981.54 54793.57 63402.70 36446.25
Total Liabilities 141827.46 181355.76 200469.68 224085.79
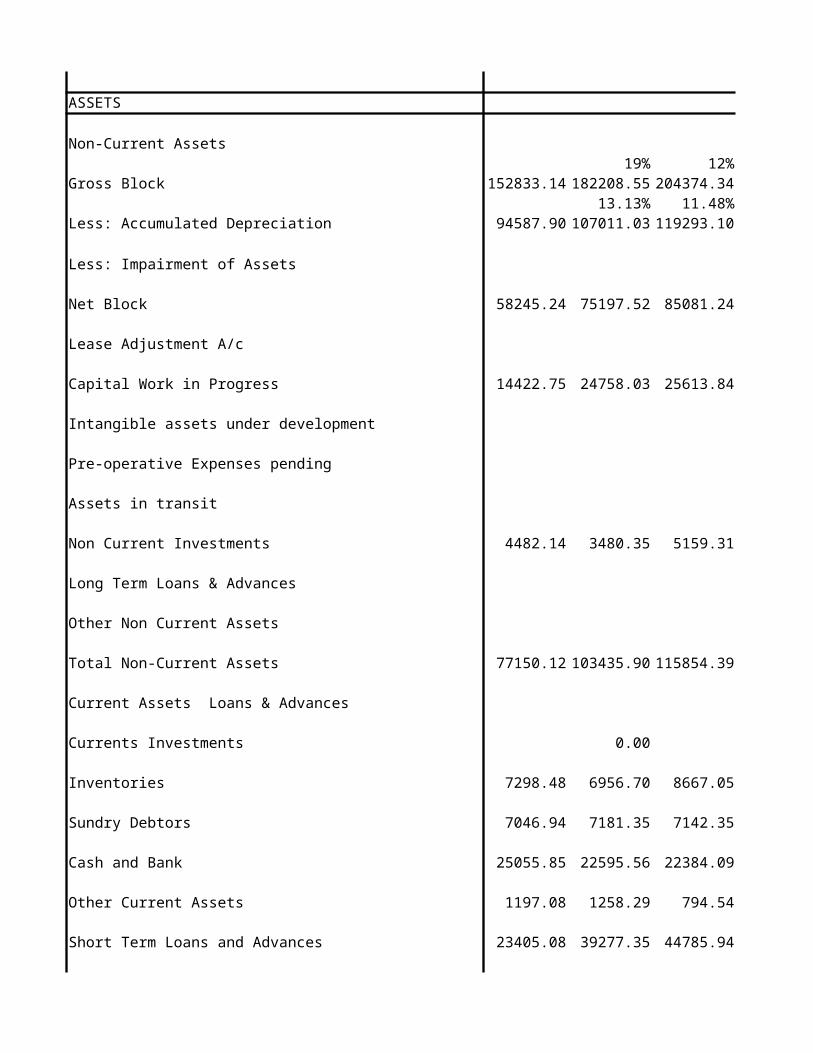
ASSETS
Non-Current Assets
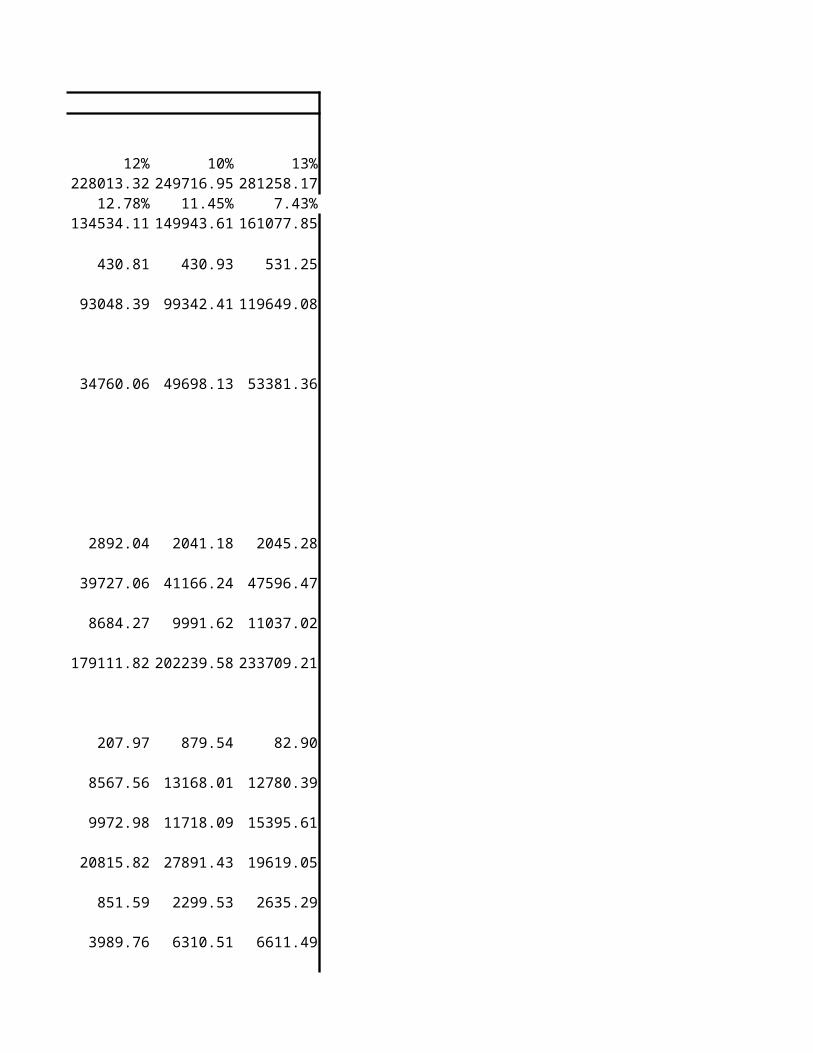
19% 12% 12%Gross Block 152833.14 182208.55 204374.34 228013.32
13.13% 11.48% 12.78%Less: Accumulated Depreciation 94587.90 107011.03 119293.10 134534.11
Less: Impairment of Assets 430.81
Net Block 58245.24 75197.52 85081.24 93048.39
Lease Adjustment A/c
Capital Work in Progress 14422.75 24758.03 25613.84 34760.06
Intangible assets under development
Pre-operative Expenses pending
Assets in transit
Non Current Investments 4482.14 3480.35 5159.31 2892.04
Long Term Loans & Advances 39727.06
Other Non Current Assets 8684.27
Total Non-Current Assets 77150.12 103435.90 115854.39 179111.82
Current Assets Loans & Advances
Currents Investments 0.00 207.97
Inventories 7298.48 6956.70 8667.05 8567.56
Sundry Debtors 7046.94 7181.35 7142.35 9972.98
Cash and Bank 25055.85 22595.56 22384.09 20815.82
Other Current Assets 1197.08 1258.29 794.54 851.59
Short Term Loans and Advances 23405.08 39277.35 44785.94 3989.76
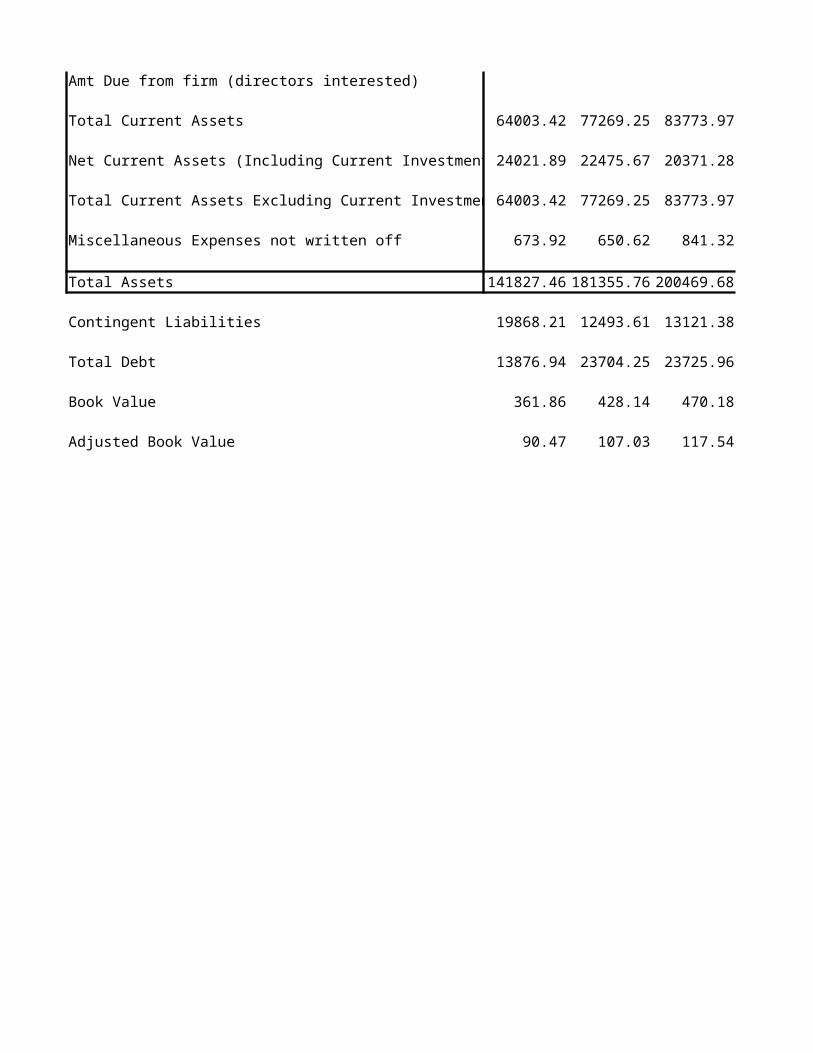
Amt Due from firm (directors interested)
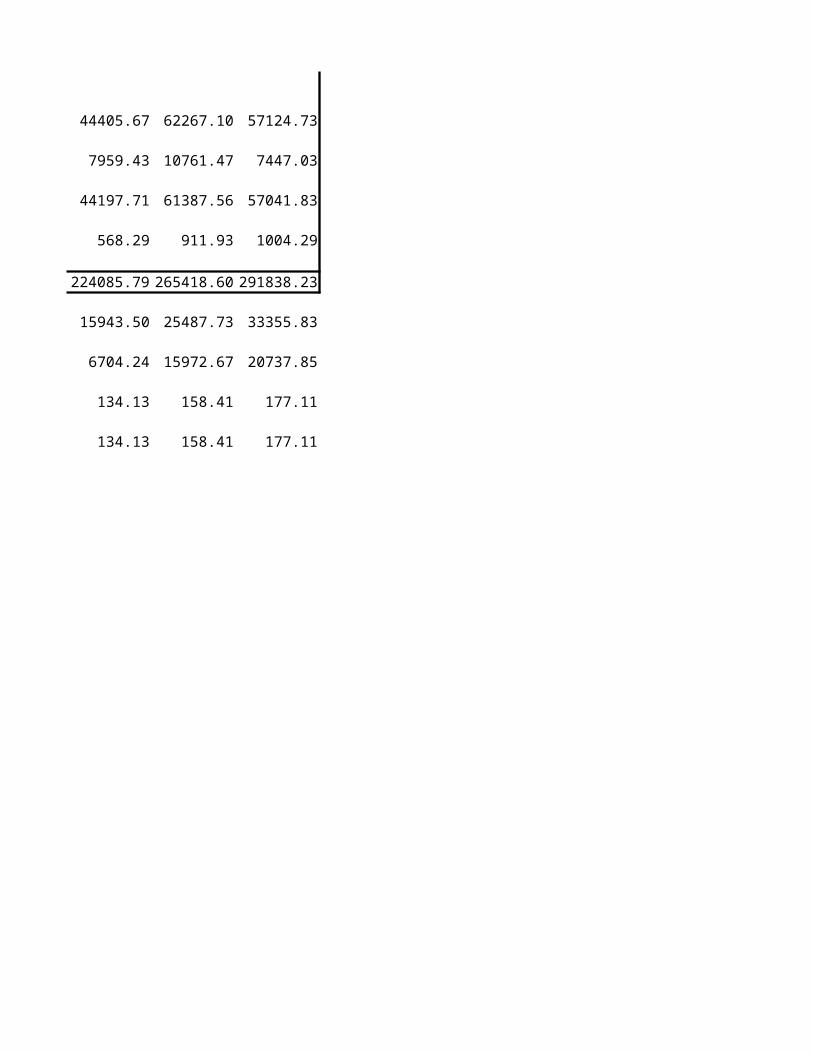
Total Current Assets 64003.42 77269.25 83773.97 44405.67
Net Current Assets (Including Current Investments) 24021.89 22475.67 20371.28 7959.43
Total Current Assets Excluding Current Investments 64003.42 77269.25 83773.97 44197.71
Miscellaneous Expenses not written off 673.92 650.62 841.32 568.29
Total Assets 141827.46 181355.76 200469.68 224085.79
Contingent Liabilities 19868.21 12493.61 13121.38 15943.50
Total Debt 13876.94 23704.25 23725.96 6704.24
Book Value 361.86 428.14 470.18 134.13
Adjusted Book Value 90.47 107.03 117.54 134.13
Mar-12 Mar-13
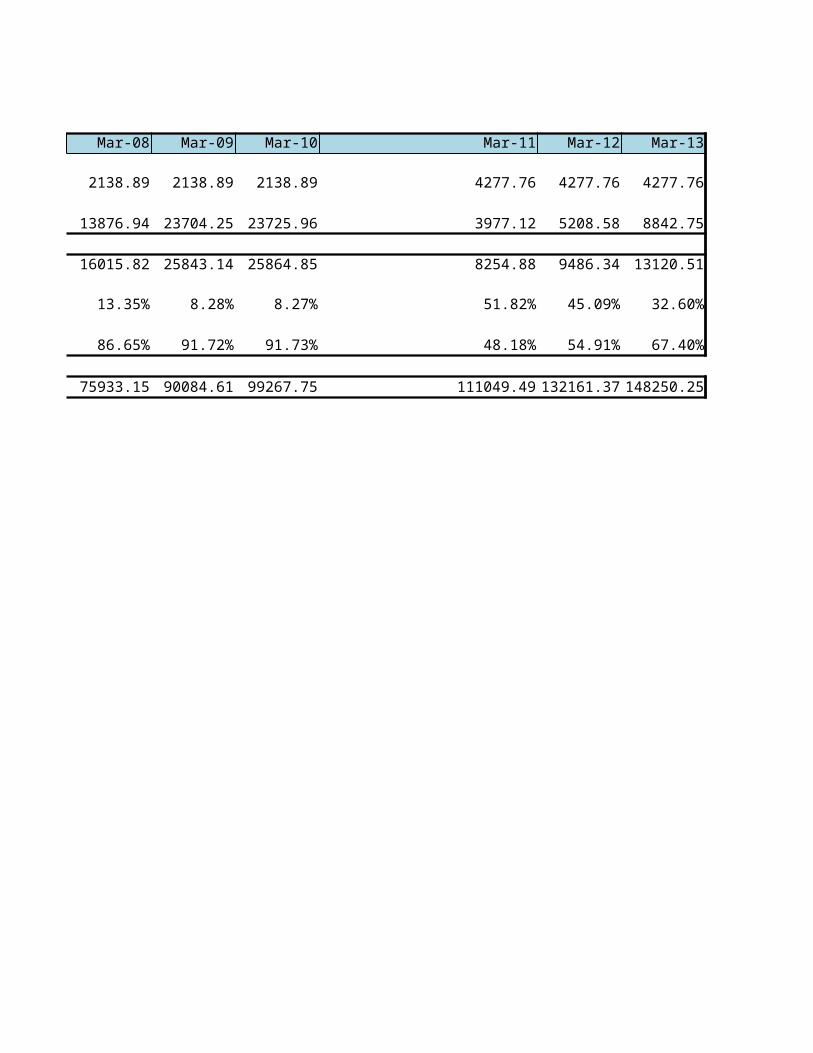
DESCRIPTION Mar-08 Mar-09
4277.76 4277.76 Share Capital 2138.89 2138.89
0.00 0.00 Loans 13876.94 23704.25
132161.37 148250.25 Total 16015.82 25843.14
136439.13 152528.01 Weight of Share Capital 13.35% 8.28%
2224.01 1946.65 Weight of Loans 86.65% 91.72%
Total Reserves 75933.15 90084.61
1446.79 5243.99
3761.80 3598.76 9.0015262.40 20450.83 9827.3212184.64 14225.12
1057.55 1492.26
18.27 130.19
56780.79 62995.57
75249.84 87685.88
17603.59 18618.90
20291.69 17097.01
10053.82 11608.08
3556.53 2353.70
51505.63 49677.70
265418.60 291838.23
10% 13%249716.95 281258.17
11.45% 7.43%149943.61 161077.85
430.93 531.25
99342.41 119649.08
49698.13 53381.36
2041.18 2045.28
41166.24 47596.47
9991.62 11037.02
202239.58 233709.21
879.54 82.90
13168.01 12780.39
11718.09 15395.61
27891.43 19619.05
2299.53 2635.29
6310.51 6611.49
62267.10 57124.73
10761.47 7447.03
61387.56 57041.83
911.93 1004.29
265418.60 291838.23
25487.73 33355.83
15972.67 20737.85
158.41 177.11
158.41 177.11
Mar-10 Mar-11 Mar-12 Mar-13
2138.89 4277.76 4277.76 4277.76
23725.96 3977.12 5208.58 8842.75
25864.85 8254.88 9486.34 13120.51
8.27% 51.82% 45.09% 32.60%
91.73% 48.18% 54.91% 67.40%
99267.75 111049.49 132161.37 148250.25
Mar-14 Mar-15 Mar-16 Mar-17 Mar-18
YoY Gross Block 13% 13% 13% 13% 13%Gross Block 317878.84 359267.63 406045.38 458913.72 518665.69YoY Accumulated Dep as % of S 11% 11% 11% 9% 7%Accumulated Depreciation 179204.59 198528.70 219477.25 240195.45 258031.45Depriciation 18126.74 19324.11 20948.55 20718.20 17836.00
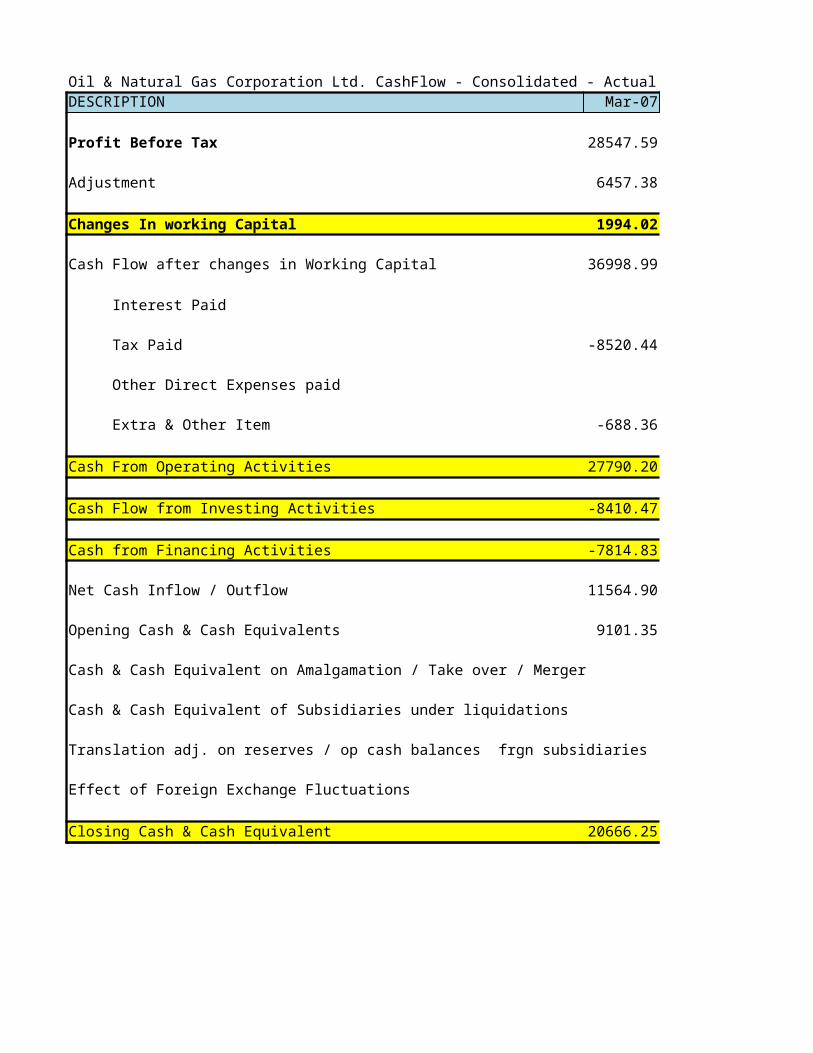
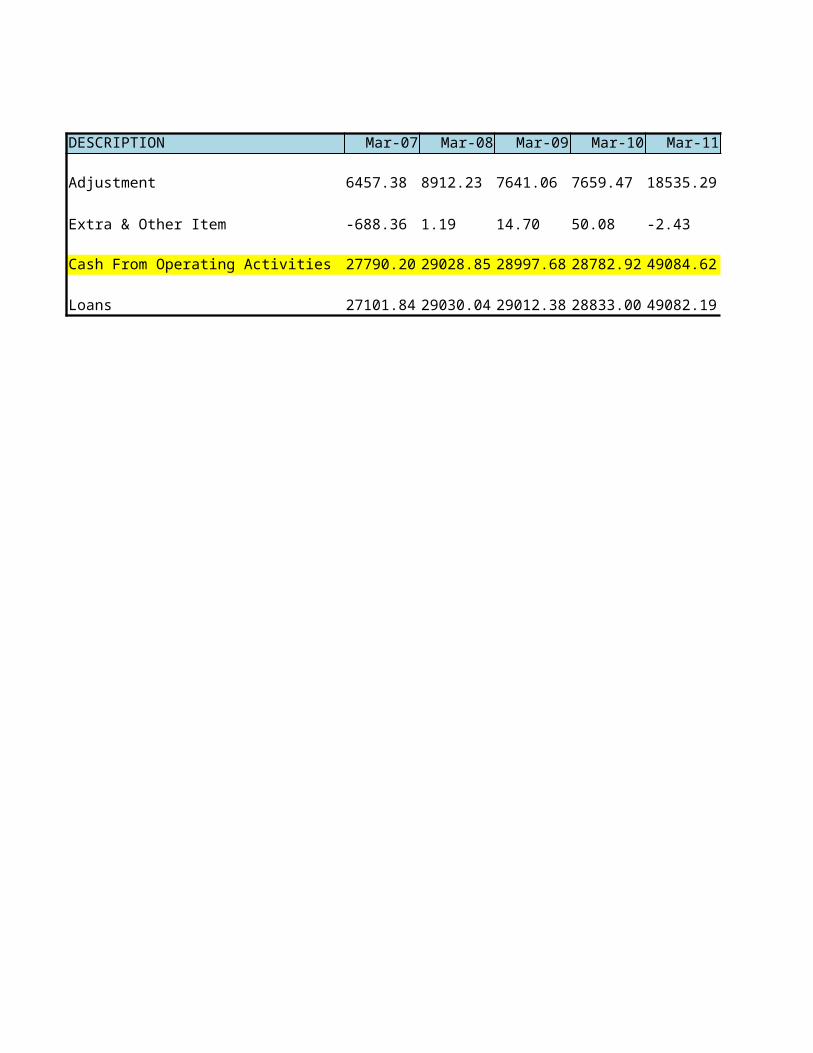
Oil & Natural Gas Corporation Ltd. CashFlow - Consolidated - Actual - Abridged- [INR-Crore]DESCRIPTION Mar-07 Mar-08 Mar-09
Profit Before Tax 28547.59 31014.08 31103.72
Adjustment 6457.38 8912.23 7641.06
Changes In working Capital 1994.02 -390.37 482.47
Cash Flow after changes in Working Capital 36998.99 39535.94 39227.24
Interest Paid
Tax Paid -8520.44 -10508.27 -10244.26
Other Direct Expenses paid
Extra & Other Item -688.36 1.19 14.70
Cash From Operating Activities 27790.20 29028.85 28997.68
Cash Flow from Investing Activities -8410.47 -16285.58 -28171.10
Cash from Financing Activities -7814.83 -8365.23 -3289.22
Net Cash Inflow / Outflow 11564.90 4378.04 -2462.64
Opening Cash & Cash Equivalents 9101.35 20670.62 25048.68
Cash & Cash Equivalent on Amalgamation / Take over / Merger
Cash & Cash Equivalent of Subsidiaries under liquidations
Effect of Foreign Exchange Fluctuations
Closing Cash & Cash Equivalent 20666.25 25048.66 22586.04
Translation adj. on reserves / op cash balances frgn subsidiaries
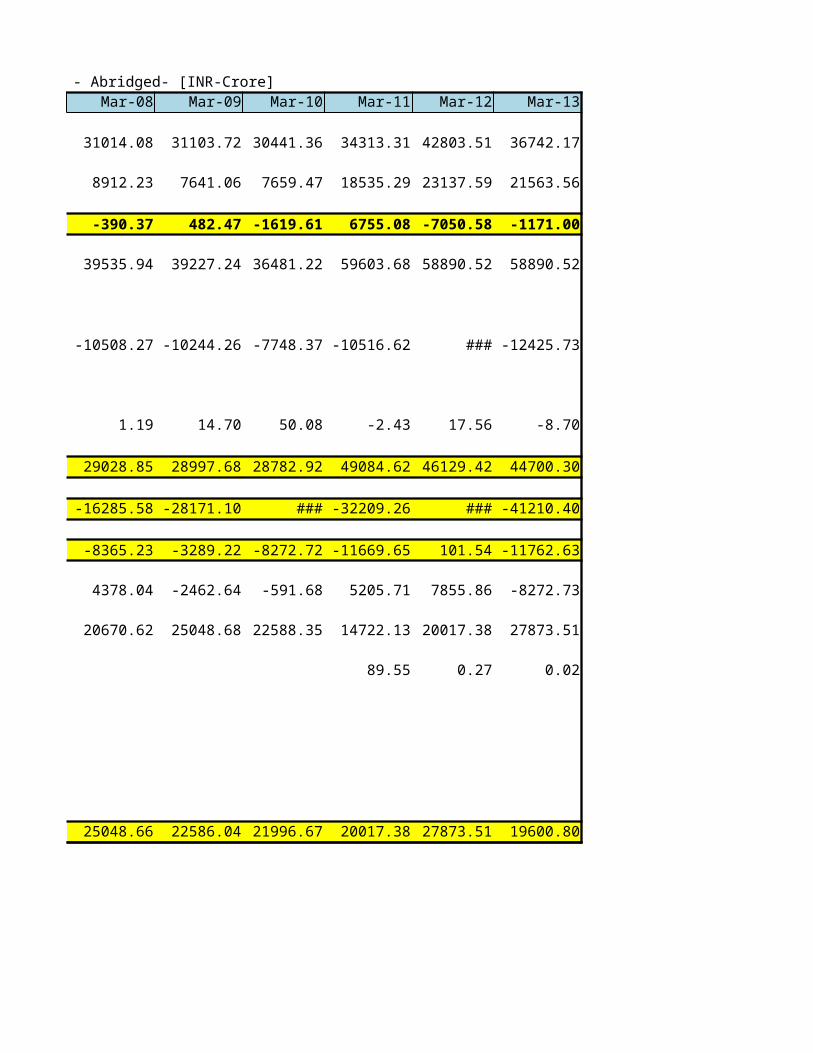
Mar-10 Mar-11 Mar-12 Mar-13
30441.36 34313.31 42803.51 36742.17 DESCRIPTION Mar-07
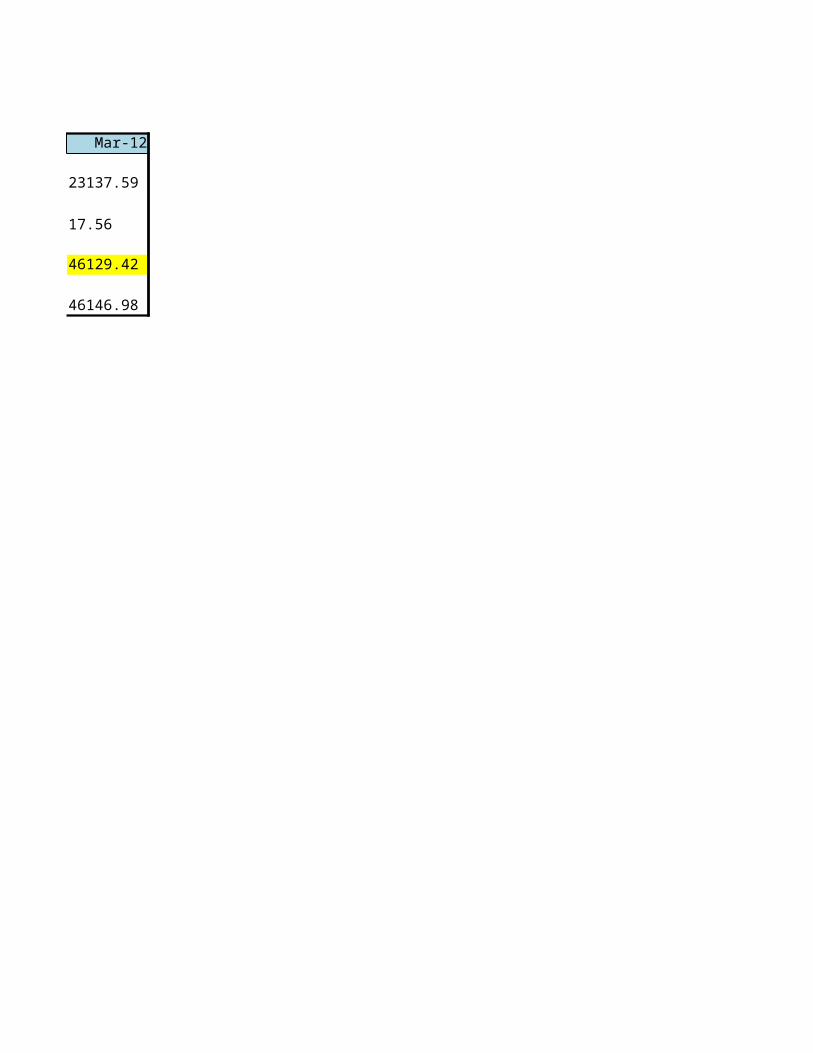
7659.47 18535.29 23137.59 21563.56 Adjustment 6457.38
-1619.61 6755.08 -7050.58 -1171.00 Extra & Other Item -688.36
36481.22 59603.68 58890.52 58890.52 Cash From Operating Activities 27790.20
Loans 27101.84
-7748.37 -10516.62 -12778.66 -12425.73
50.08 -2.43 17.56 -8.70
28782.92 49084.62 46129.42 44700.30
-21101.88 -32209.26 -38375.11 -41210.40
-8272.72 -11669.65 101.54 -11762.63
-591.68 5205.71 7855.86 -8272.73
22588.35 14722.13 20017.38 27873.51
89.55 0.27 0.02
21996.67 20017.38 27873.51 19600.80
Mar-08 Mar-09 Mar-10 Mar-11 Mar-12
8912.23 7641.06 7659.47 18535.29 23137.59
1.19 14.70 50.08 -2.43 17.56
29028.85 28997.68 28782.92 49084.62 46129.42
29030.04 29012.38 28833.00 49082.19 46146.98
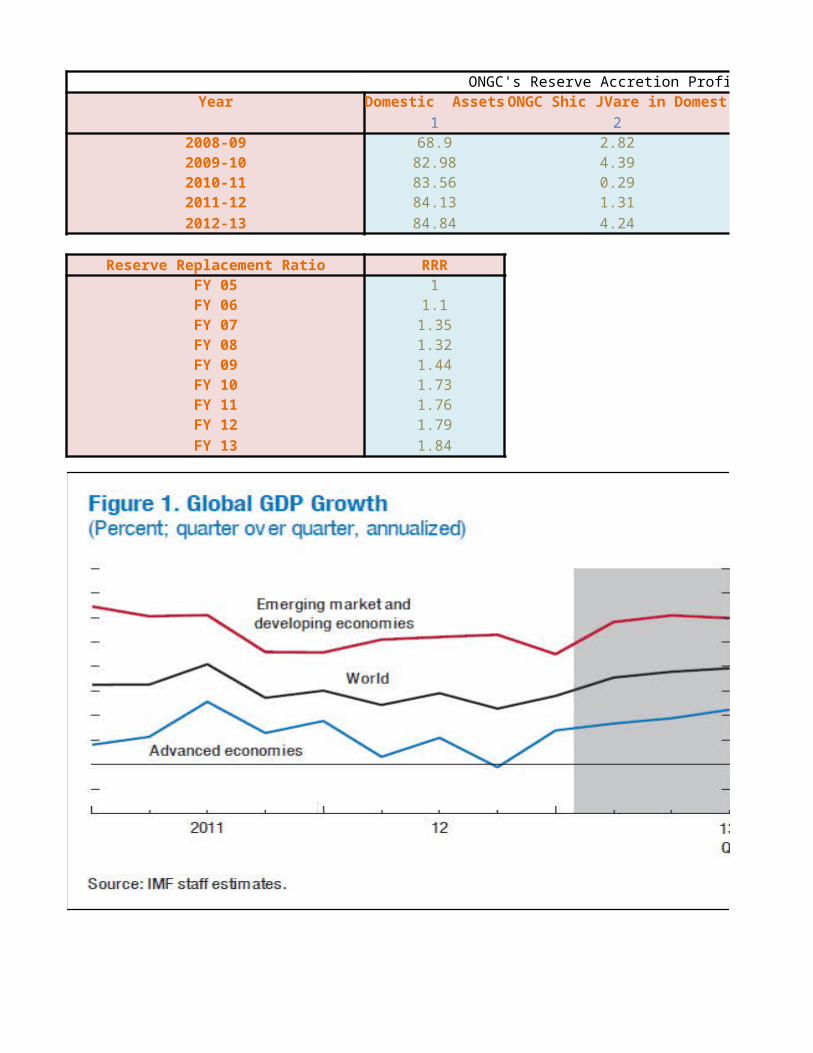
ONGC's Reserve Accretion Profile (in MMtoe)Year Domestic Assets ONGC Shic JVare in Domest
1 22008-09 68.9 2.822009-10 82.98 4.392010-11 83.56 0.292011-12 84.13 1.312012-13 84.84 4.24
Reserve Replacement Ratio RRRFY 05 1FY 06 1.1FY 07 1.35FY 08 1.32FY 09 1.44FY 10 1.73FY 11 1.76FY 12 1.79FY 13 1.84
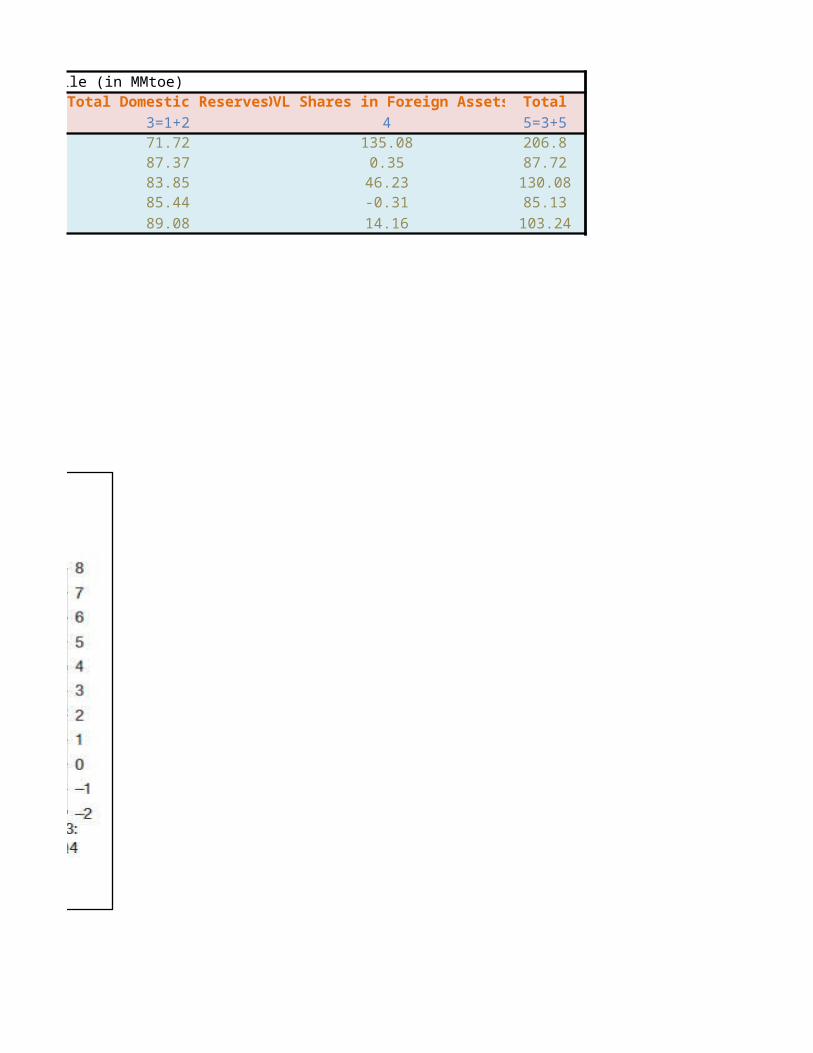
ONGC's Reserve Accretion Profile (in MMtoe)Total Domestic Reserves OVL Shares in Foreign Assets Total
3=1+2 4 5=3+571.72 135.08 206.887.37 0.35 87.7283.85 46.23 130.0885.44 -0.31 85.1389.08 14.16 103.24
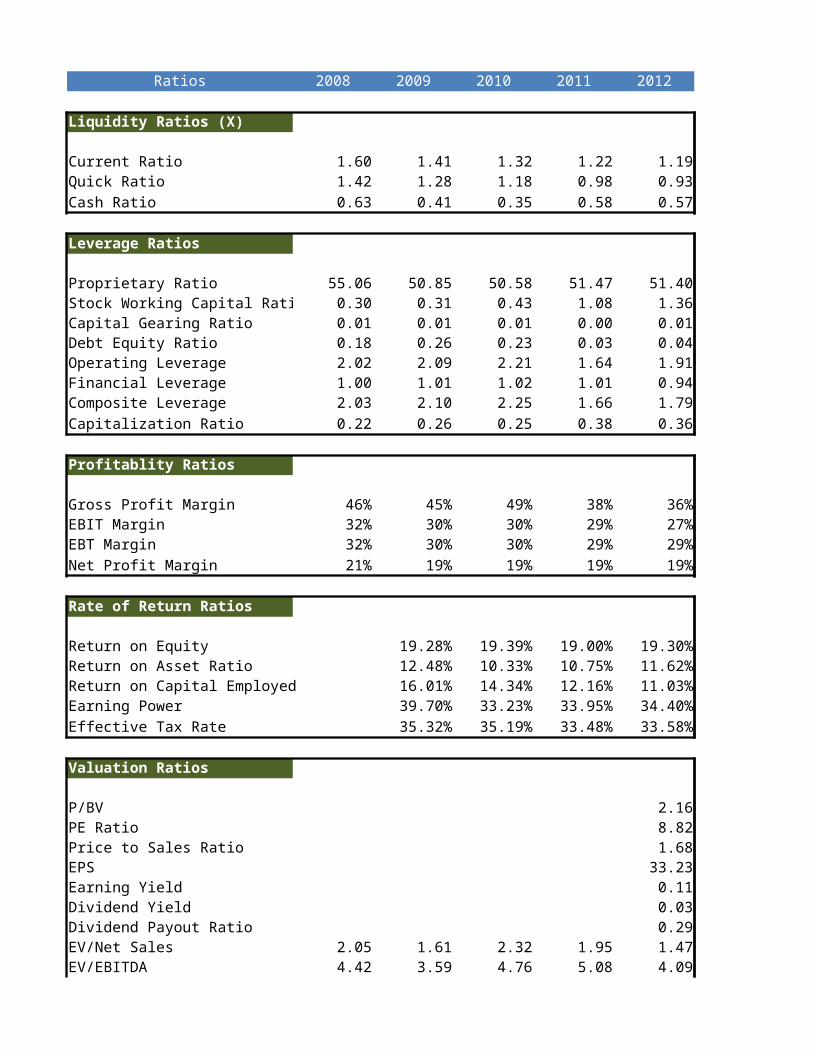
Ratios 2008 2009 2010 2011 2012
Liquidity Ratios (X)
Current Ratio 1.60 1.41 1.32 1.22 1.19Quick Ratio 1.42 1.28 1.18 0.98 0.93Cash Ratio 0.63 0.41 0.35 0.58 0.57
Leverage Ratios
Proprietary Ratio 55.06 50.85 50.58 51.47 51.40Stock Working Capital Ratio 0.30 0.31 0.43 1.08 1.36Capital Gearing Ratio 0.01 0.01 0.01 0.00 0.01Debt Equity Ratio 0.18 0.26 0.23 0.03 0.04Operating Leverage 2.02 2.09 2.21 1.64 1.91Financial Leverage 1.00 1.01 1.02 1.01 0.94Composite Leverage 2.03 2.10 2.25 1.66 1.79Capitalization Ratio 0.22 0.26 0.25 0.38 0.36
Profitablity Ratios
Gross Profit Margin 46% 45% 49% 38% 36%EBIT Margin 32% 30% 30% 29% 27%EBT Margin 32% 30% 30% 29% 29%Net Profit Margin 21% 19% 19% 19% 19%
Rate of Return Ratios
Return on Equity 19.28% 19.39% 19.00% 19.30%Return on Asset Ratio 12.48% 10.33% 10.75% 11.62%Return on Capital Employed 16.01% 14.34% 12.16% 11.03%Earning Power 39.70% 33.23% 33.95% 34.40%Effective Tax Rate 35.32% 35.19% 33.48% 33.58%
Valuation Ratios
P/BV 2.16PE Ratio 8.82Price to Sales Ratio 1.68EPS 33.23Earning Yield 0.11Dividend Yield 0.03Dividend Payout Ratio 0.29EV/Net Sales 2.05 1.61 2.32 1.95 1.47EV/EBITDA 4.42 3.59 4.76 5.08 4.09
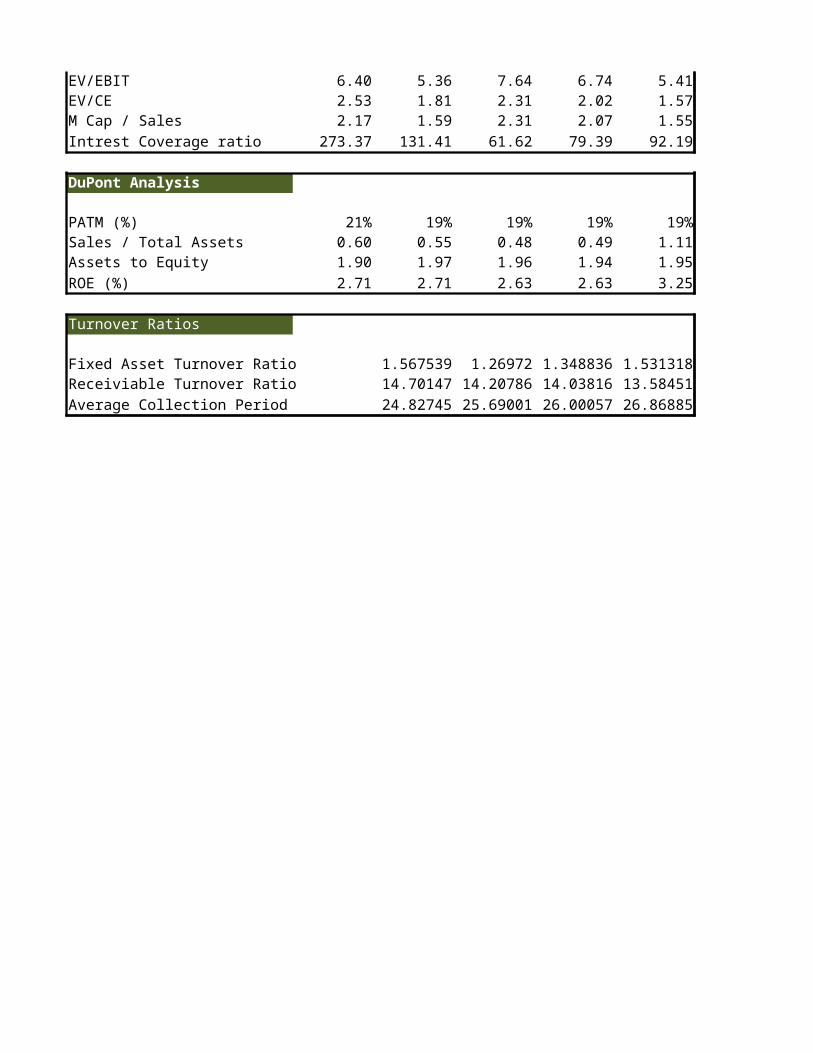
EV/EBIT 6.40 5.36 7.64 6.74 5.41EV/CE 2.53 1.81 2.31 2.02 1.57M Cap / Sales 2.17 1.59 2.31 2.07 1.55Intrest Coverage ratio 273.37 131.41 61.62 79.39 92.19
DuPont Analysis
PATM (%) 21% 19% 19% 19% 19%Sales / Total Assets 0.60 0.55 0.48 0.49 1.11Assets to Equity 1.90 1.97 1.96 1.94 1.95ROE (%) 2.71 2.71 2.63 2.63 3.25
Turnover Ratios
Fixed Asset Turnover Ratio 1.5675394 1.26972 1.3488365 1.5313177Receiviable Turnover Ratio 14.70147 14.207858 14.038156 13.584506Average Collection Period 24.82745 25.69001 26.000565 26.868847
MVPS as on 30th October 21013 = 290No of Share Holders 855.5520Dividend Per Share 9.75
Cash Flow Ratio Mar-08 Mar-09 Mar-10 Mar-11 Mar-12 Mar-13Cash Flow Per share 135.72 135.57 134.57 57.37 53.92 52.25Price to Cash Flow Ratio 1.81 1.44 2.04 5.06 4.96 5.96Free Cash Flow per Share 93.01 85.29 68.53 9.02 18.03 19.81Price to Free Cash Flow 2.64 2.29 4.01 32.16 14.83 15.72Free Cash Flow Yield 0.38 0.44 0.25 0.03 0.07 0.06Sales to cash flow ratios 3.33 3.61 3.54 2.45 3.19 3.63Dupont Analysis Mar-08 Mar-09 Mar-10 Mar-11 Mar-12 Mar-13PATM (%) 19.86 18.43 18.58 18.22 18.81 14.47Sales / Total Assets(x) 0.71 0.68 0.56 0.59 0.62 0.60Assets to Equity (x) 2.00 1.91 1.99 1.97 1.96 1.94ROE (%) 28.16 23.86 20.53 21.20 22.72 16.71DESCRIPTION Mar-08 Mar-09 Mar-10 Mar-11 Mar-12 Mar-13Operational & Financial RatiosEarnings Per Share (Rs) 92.91 92.55 90.72 26.25 32.90 28.31Adjusted EPS (Rs.) 23.23 23.14 22.68 26.25 32.90 28.31CEPS(Rs) 39.87 41.60 44.94 39.96 48.64 42.18DPS(Rs) 32.00 32.00 33.00 8.75 9.75 9.50Adj DPS(Rs) 16.00 16.00 16.50 8.75 9.75 9.50Book Value (Rs) 361.86 428.14 470.18 134.13 158.41 177.11Adjusted Book Value (Rs) 90.47 107.03 117.54 134.13 158.41 177.11Tax Rate(%) 34.60 35.32 35.19 33.48 33.58 34.71Dividend Pay Out Ratio(%) 34.44 34.58 36.38 33.34 29.64 33.56Margin RatiosPBIDTM (%) 44.11 42.75 46.77 36.81 35.26 29.74EBITM (%) 30.48 28.71 29.14 27.74 28.62 22.45Pre Tax Margin(%) 30.36 28.49 28.67 27.39 28.33 22.15PATM (%) 19.86 18.43 18.58 18.22 18.81 14.47CPM(%) 33.49 32.53 36.21 27.29 27.54 21.76Performance RatiosROA (%) 14.05 12.48 10.33 10.75 11.62 8.61ROE (%) 28.16 23.86 20.53 21.20 22.72 16.71ROCE (%) 35.62 30.41 25.83 28.36 31.75 23.05Asset Turnover(x) 0.71 0.68 0.56 0.59 0.62 0.60Inventory Turnover(x) 15.46 15.35 13.59 14.54 13.90 12.78Debtors Turnover(x) 17.17 15.38 14.82 14.64 13.93 12.23Fixed Asset Turnover (x) 0.69 0.65 0.55 0.58 0.63 0.62Sales/Working Capital (x) 4.24 4.87 5.21 15.74 14.04 22.27Efficiency RatiosFixed Capital/Sales(x) 1.44 1.53 1.82 1.73 1.58 1.60Receivable days 21.26 23.73 24.62 24.93 26.20 29.84Inventory Days 23.61 23.78 26.86 25.10 26.25 28.55Payable days 44.72 48.47 57.76 53.68 76.99 72.24Growth RatioNet Sales Growth(%) 17.65 8.07 -2.71 18.06 22.60 10.26Core EBITDA Growth(%) 14.01 4.12 6.18 -7.14 15.55 -7.44EBIT Growth(%) 11.20 1.20 -1.48 12.30 24.42 -13.91PAT Growth(%) 12.96 -0.30 -2.15 15.70 24.55 -15.61
Adj. EPS Growth(%) 11.83 -0.39 -1.98 15.73 25.33 -13.94Financial Stability RatiosTotal Debt/Equity(x) 0.18 0.26 0.24 0.05 0.11 0.14Current Ratio(x) 1.60 1.41 1.32 1.22 1.21 1.15Quick Ratio(x) 1.42 1.28 1.18 0.98 0.95 0.89Interest Cover(x) 273.37 131.69 61.62 79.39 99.42 76.95Total Debt/Mcap(x) 0.26 0.57 0.40 0.02 0.07 0.08Valuation RatiosAdjusted PE (x) 10.56 8.42 12.11 11.05 8.13 11.01PCE(x) 6.15 4.69 6.11 7.26 5.50 7.39Price / Book Value(x) 2.71 1.82 2.34 2.16 1.69 1.76Dividend Yield(%) 3.26 4.10 3.00 3.02 3.65 3.05EV/Net Sales(x) 2.05 1.61 2.32 1.94 1.47 1.65EV/EBITDA(x) 4.42 3.59 4.76 5.06 4.06 5.42EV/EBIT(x) 6.40 5.35 7.64 6.72 5.00 7.18EV/CE(x) 1.40 0.93 1.18 1.04 0.81 0.92M Cap / Sales 2.17 1.59 2.31 2.07 1.55 1.64High PE 16.44 11.88 13.60 16.07 12.11 10.37Low PE 9.42 6.68 8.69 11.05 9.38 7.39
Mar-08 Mar-09 Mar-10 Mar-11 Mar-12 Mar-13ROE (%) 28% 24% 21% 21% 23% 17%Retention Ratio 31.12% 30.85% 27.25% 66.66% 70.36% 66.44%
Expected growth in EPS 8.8% 7.4% 5.6% 14.1% 16.0% 11.1%EPS 23.23 23.14 22.68 26.25 32.90 28.31Dividend 16.00 16.00 16.50 8.75 9.75 9.50
Retention Ratio 7.23 7.14 6.18 17.50 23.15 18.81
#NAME?