Embed Size (px)
Citation preview

1
Geschäftsentwicklung 2010Vienna Insurance GroupONE PART OF THE
WHOLE
Press talk
Results 1H 2011
Vienna, August 18th 2011
3
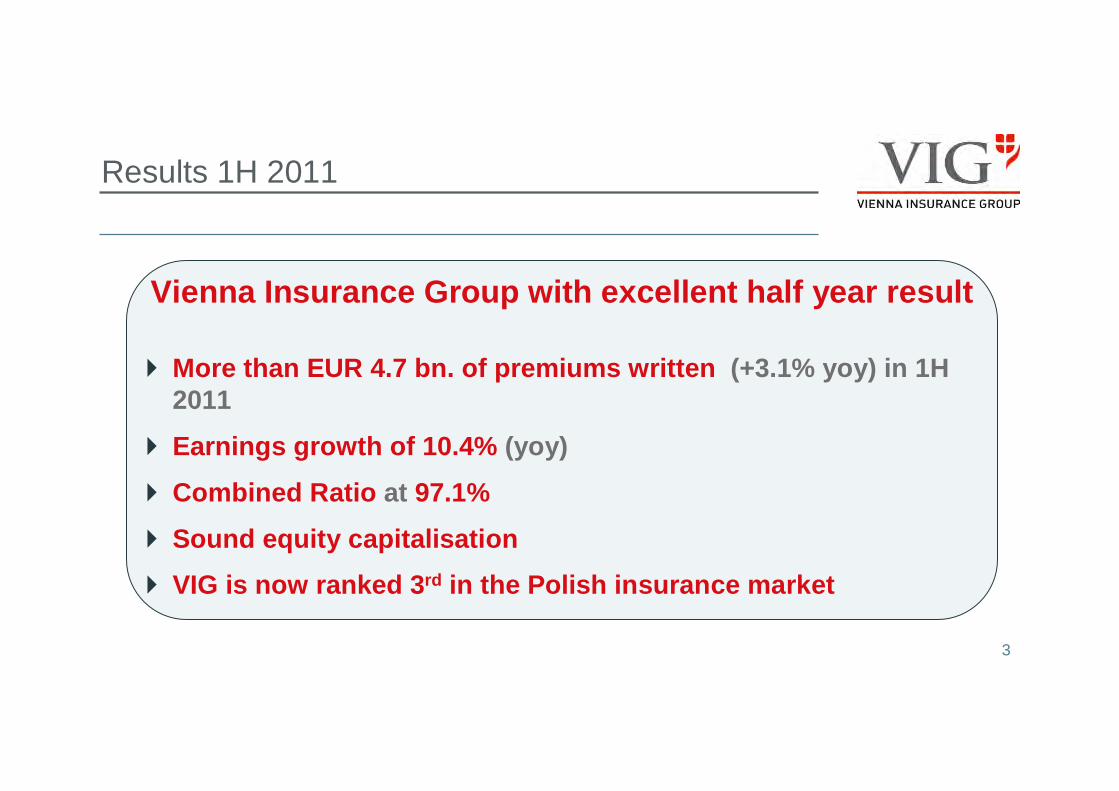
Results 1H 2011
Vienna Insurance Group with excellent half year resu lt
� More than EUR 4.7 bn. of premiums written (+3.1% yoy) in 1H 2011
� Earnings growth of 10.4% (yoy)
� Combined Ratio at 97.1%
� Sound equity capitalisation
� VIG is now ranked 3 rd in the Polish insurance market
4
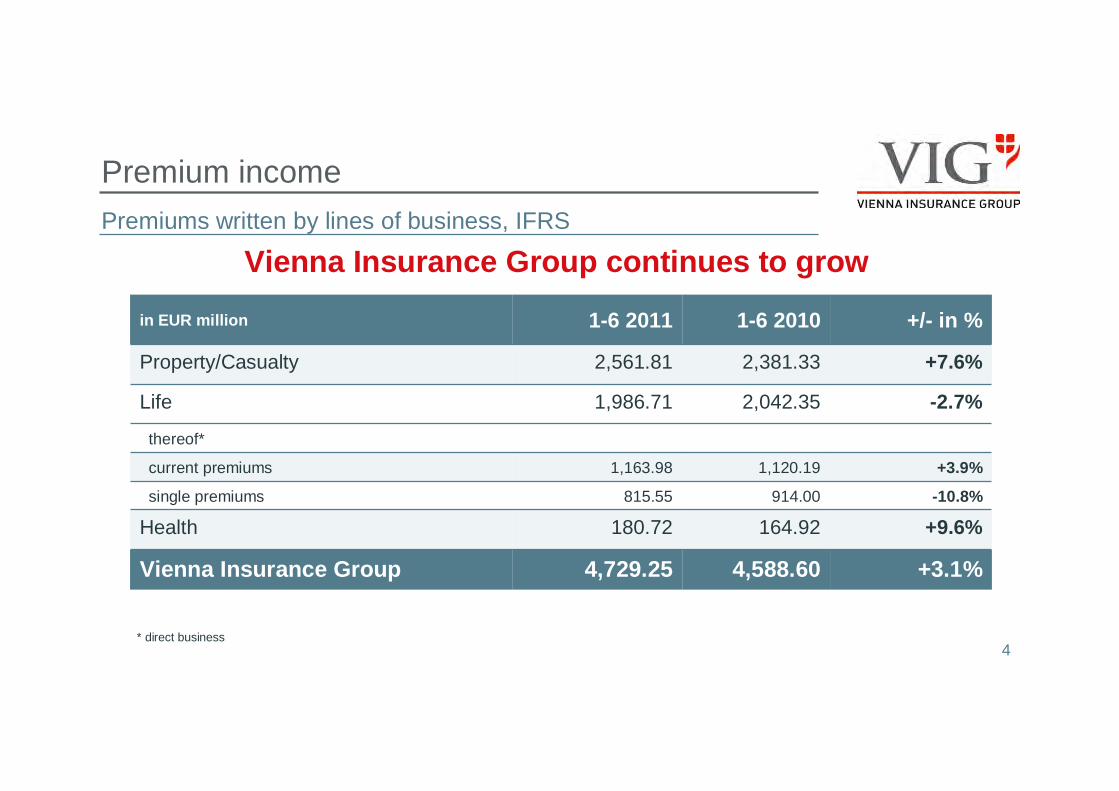
Premium income
Premiums written by lines of business, IFRS
Vienna Insurance Group continues to grow
thereof*
+3.9%1,120.191,163.98current premiums
-10.8%914.00815.55single premiums
4,588.60
164.92
2,042.35
2,381.33
1-6 2010
4,729.25
180.72
1,986.71
2,561.81
1-6 2011
+3.1%
+9.6%
-2.7%
+7.6%
+/- in %
Vienna Insurance Group
in EUR million
Property/Casualty
Life
Health
* direct business
5
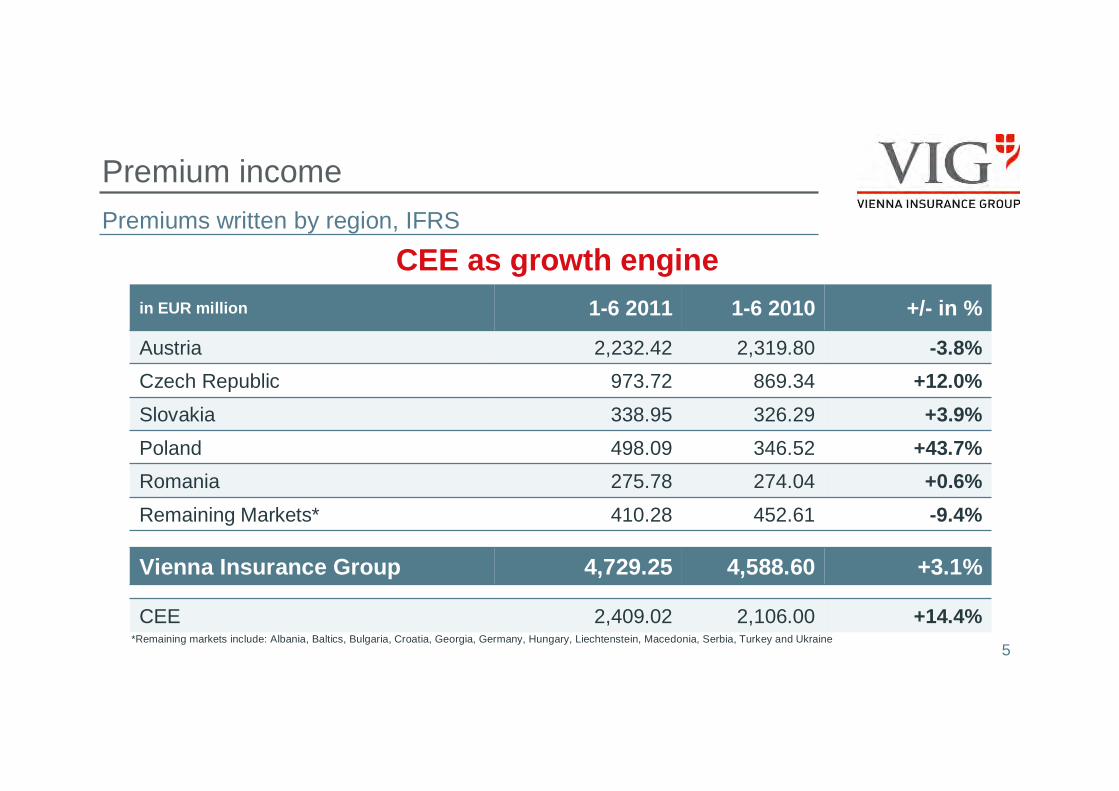
-9.4%452.61410.28Remaining Markets*
2,106.00
4,588.60
274.04
346.52
326.29
869.34
2,319.80
1-6 2010
+14.4%
+3.1%
+0.6%
+43.7%
+3.9%
+12.0%
-3.8%
+/- in %
2,409.02CEE
in EUR million 1-6 2011
Austria 2,232.42
Czech Republic 973.72
Slovakia 338.95
Poland 498.09
Romania 275.78
Vienna Insurance Group 4,729.25
CEE as growth engine
Premium income
Premiums written by region, IFRS
*Remaining markets include: Albania, Baltics, Bulgaria, Croatia, Georgia, Germany, Hungary, Liechtenstein, Macedonia, Serbia, Turkey and Ukraine
6
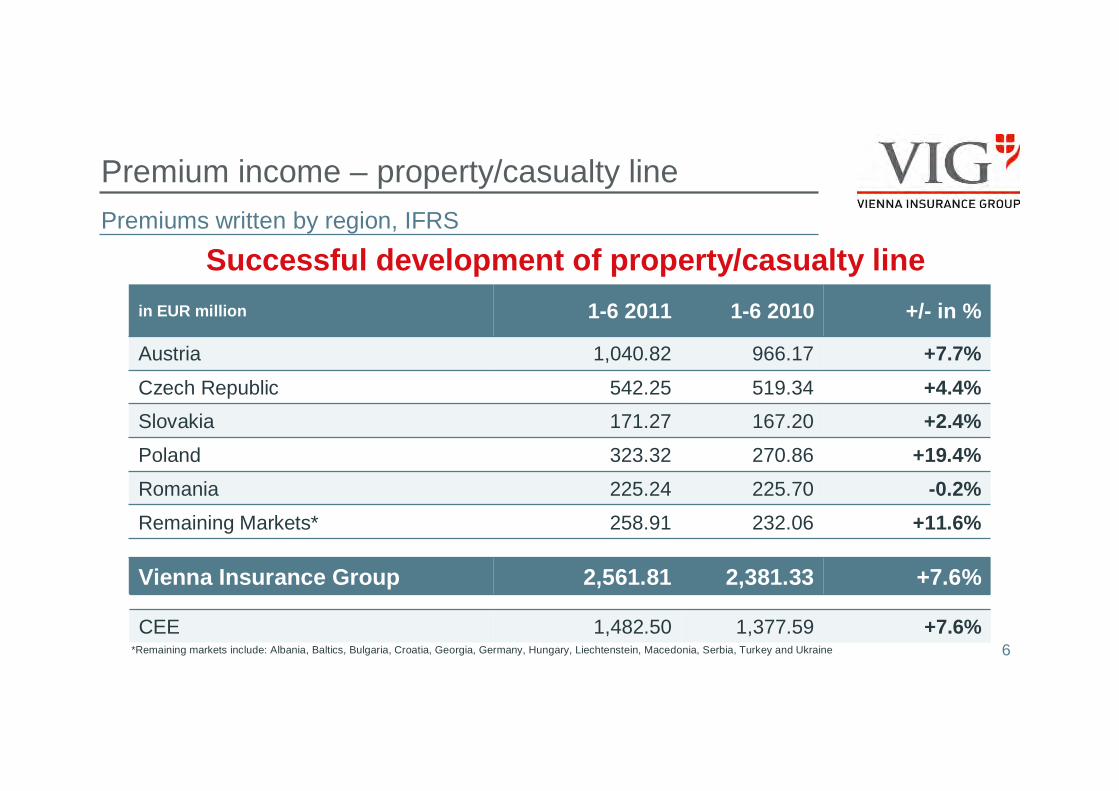
+11.6%232.06258.91Remaining Markets*
2,381.33
225.70
270.86
167.20
519.34
966.17
1-6 2010
+7.6%
-0.2%
+19.4%
+2.4%
+4.4%
+7.7%
+/- in %in EUR million 1-6 2011
Austria 1,040.82
Czech Republic 542.25
Slovakia 171.27
Poland 323.32
Romania 225.24
Vienna Insurance Group 2,561.81
Successful development of property/casualty line
Premium income – property/casualty line
Premiums written by region, IFRS
+7.6%1,377.591,482.50CEE*Remaining markets include: Albania, Baltics, Bulgaria, Croatia, Georgia, Germany, Hungary, Liechtenstein, Macedonia, Serbia, Turkey and Ukraine
7
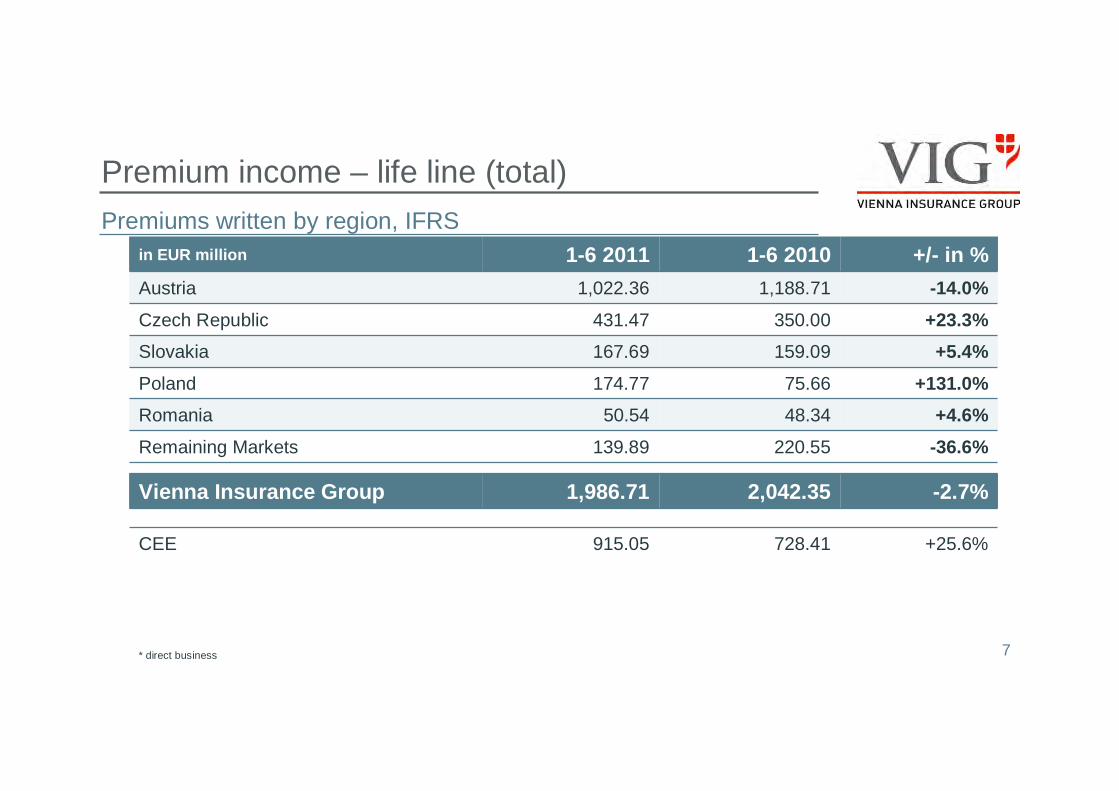
Premium income – life line (total)
Premiums written by region, IFRS
+25.6%728.41915.05CEE
in EUR million 1-6 2011 1-6 2010 +/- in %
Austria 1,022.36 1,188.71 -14.0%
Czech Republic 431.47 350.00 +23.3%
Slovakia 167.69 159.09 +5.4%
Poland 174.77 75.66 +131.0%
Romania 50.54 48.34 +4.6%
Remaining Markets 139.89 220.55 -36.6%
Vienna Insurance Group 1,986.71 2,042.35 -2.7%
* direct business
8
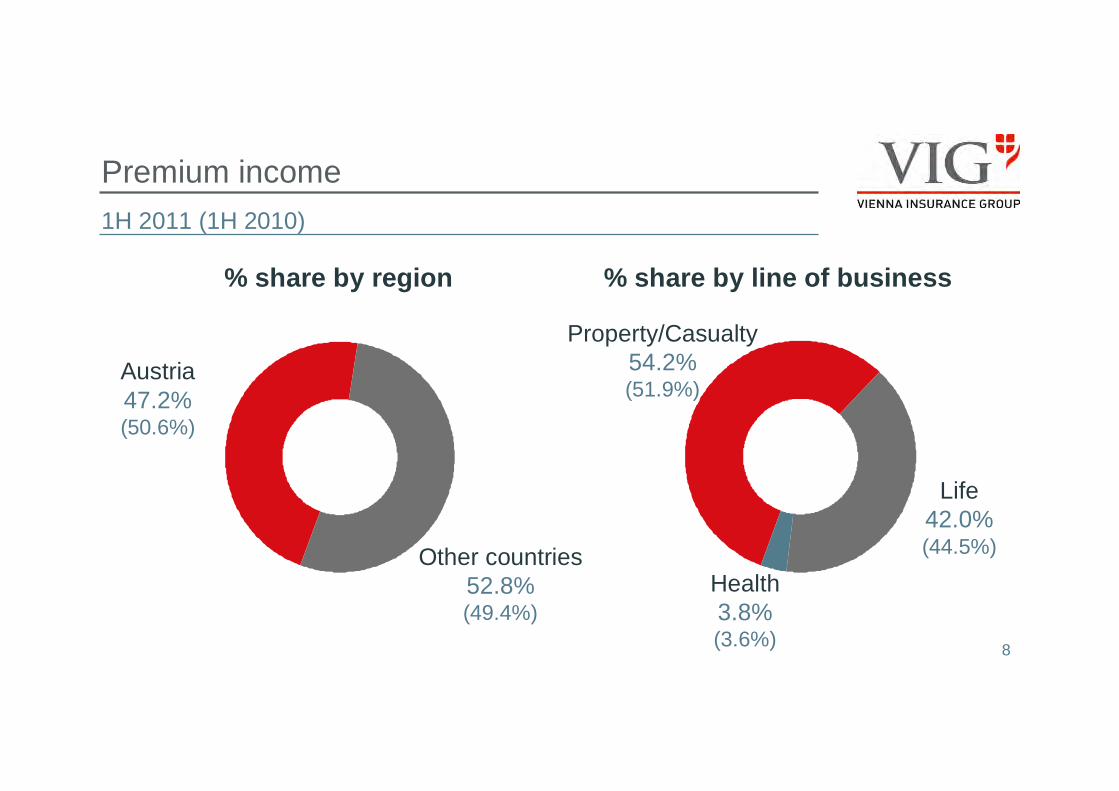
Premium income
1H 2011 (1H 2010)
Austria47.2%(50.6%)
Other countries52.8%(49.4%)
% share by region % share by line of business
Property/Casualty54.2%(51.9%)
Life42.0%(44.5%)
Health3.8%(3.6%)
9
VIG - Austria
1H 2011
Premiums written P/CEUR 1,040.82 million (+7.7%)
Profit before taxEUR 140.04 million (+1.4%)
Total market share 1Q 201125.4% (1st place)
� Strong development of premiums written in Property/Casualty line
� Extension of minimum binding period ���� reduction of single premiums
10
VIG - Czech Republic
1H 2011
� Excellent performance of life line (+23.3%)
� Increase of VIG market share of 1%p
Premiums writtenEUR 973.72 million (+12.0%)
Profit before taxEUR 91.35 million (+35.0%)
Total market share 1-2Q 201130.3% (1st place)
11
VIG - Slovakia
1H 2011
Premiums writtenEUR 338.95 million (+3.9%)
Profit before taxEUR 28.56 million (+121.6%)
Total market share 1Q 201132.2% (1st place)
� Earnings more than doubled
� Increase of VIG market share of 0.4%p
12
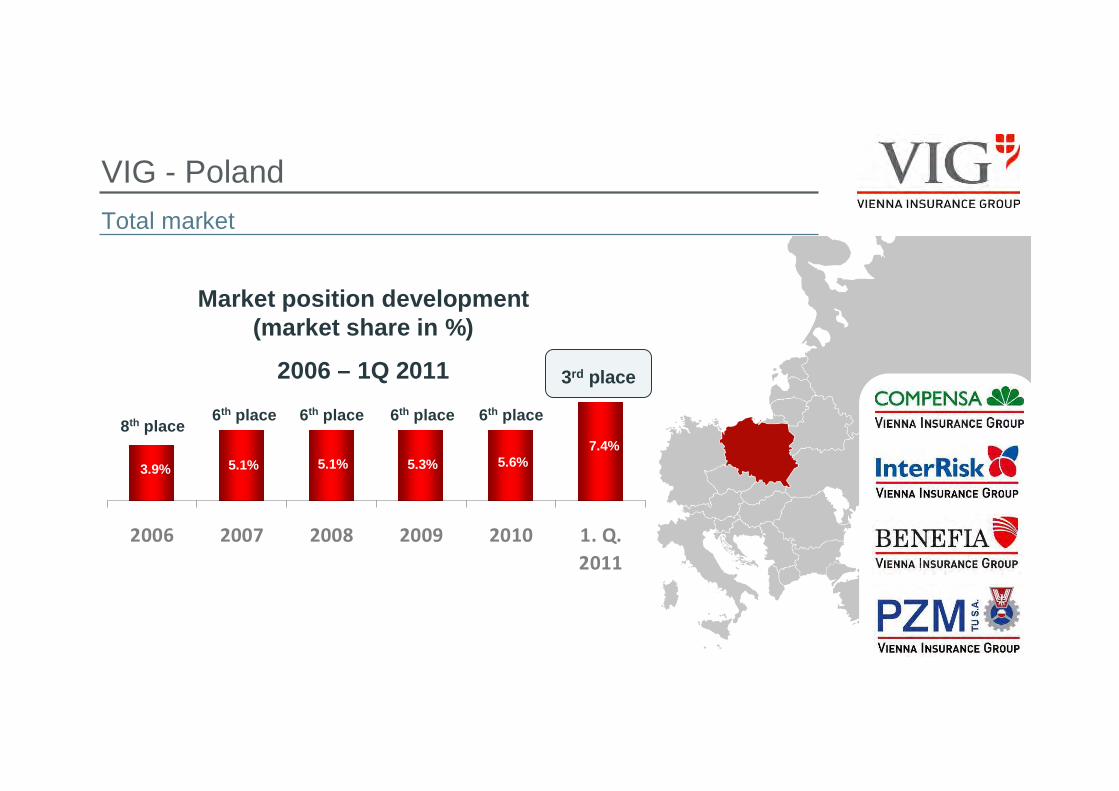
VIG - Poland
1H 2011
Premiums writtenEUR 498.09 million (+43.7%)
Profit before taxEUR 24.57 million (+140.3%)
Total market share 1Q 20117.4% (3rd place)
� VIG now among top 3 insurance companies
� Premiums written in life line more than doubled
13
VIG - Poland
2006 2007 2008 2009 2010 1. Q.
2011
Market position development (market share in %)
2006 – 1Q 2011
8th place6th place
3rd place
3.9% 5.1% 5.1% 5.3% 5.6%7.4%
6th place 6 th place 6 th place
Total market
14
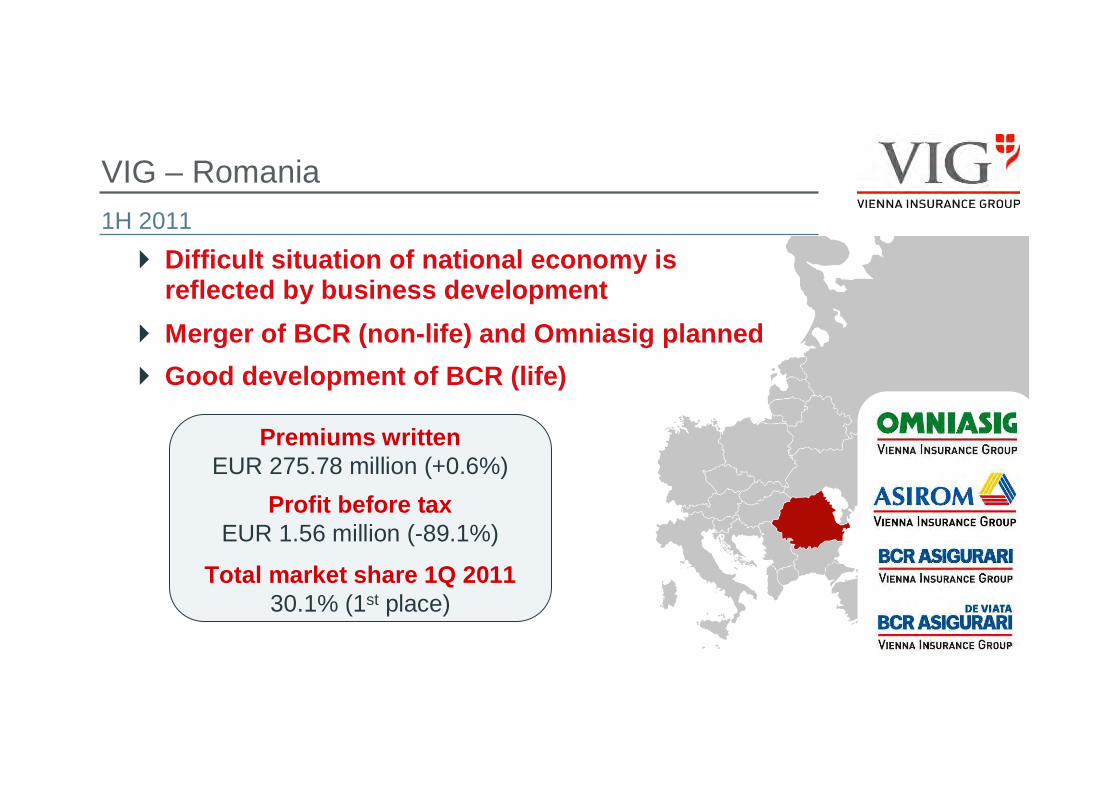
VIG – Romania
1H 2011
Premiums writtenEUR 275.78 million (+0.6%)
Profit before taxEUR 1.56 million (-89.1%)
Total market share 1Q 201130.1% (1st place)
� Difficult situation of national economy is reflected by business development
� Merger of BCR (non-life) and Omniasig planned
� Good development of BCR (life)
15
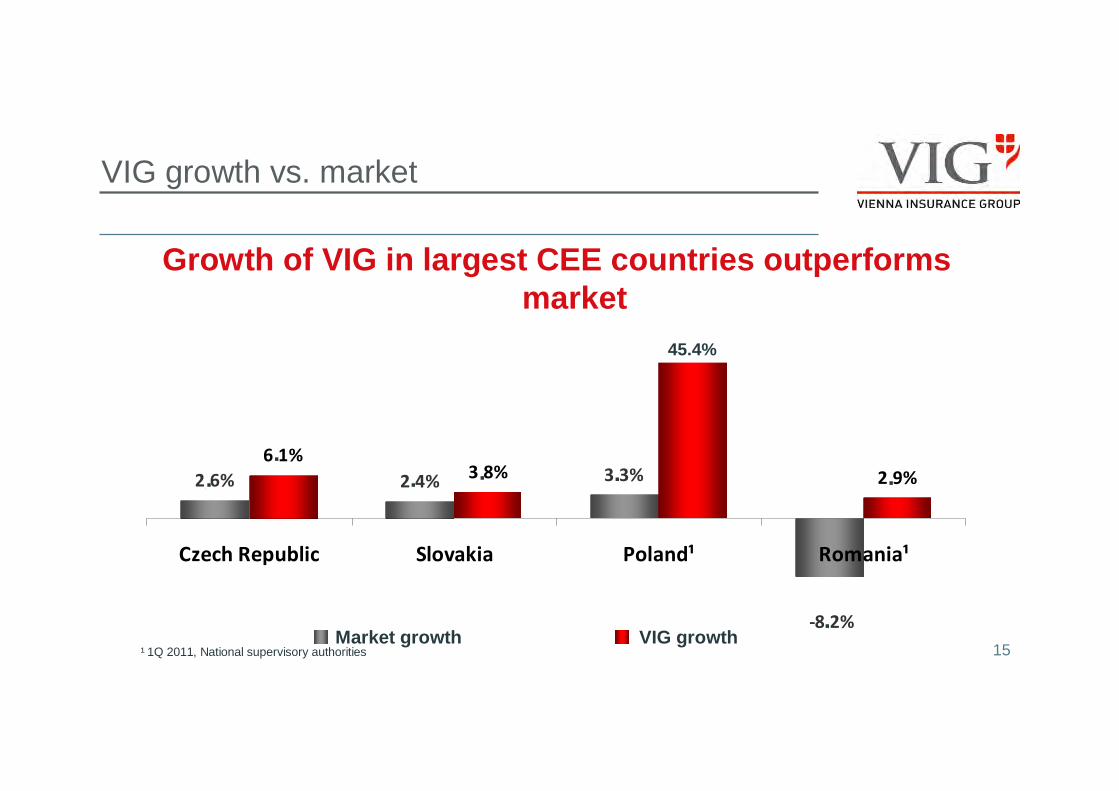
2,6% 2,4% 3,3%6,1%
3,8% 2,9%
-8,2%
Czech Republic Slovakia Poland¹ Romania¹
Marktwachstum VIG Wachstum
VIG growth vs. market
Growth of VIG in largest CEE countries outperforms market
Market growth VIG growth
45.4%
..
. . .
.
.
¹ 1Q 2011, National supervisory authorities
16
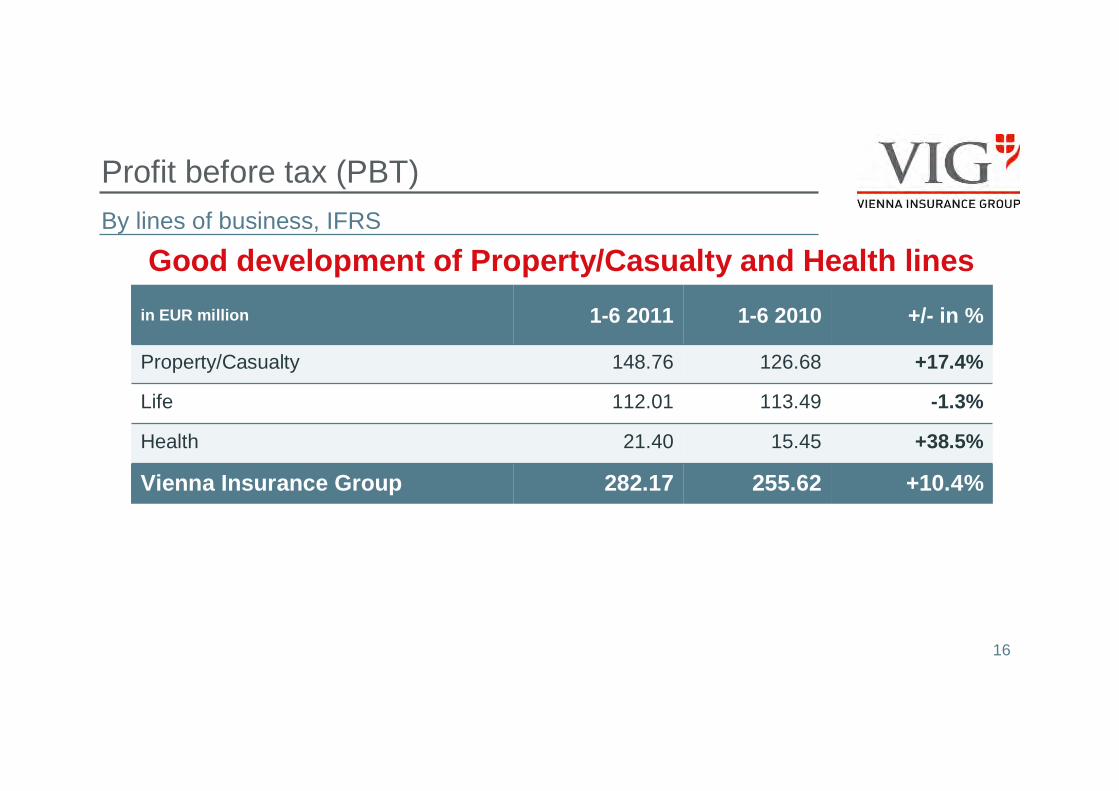
Profit before tax (PBT)
By lines of business, IFRS
255.62
15.45
113.49
126.68
1-6 2010
282.17
21.40
112.01
148.76
1-6 2011
+10.4%
+38.5%
-1.3%
+17.4%
+/- in %
Vienna Insurance Group
in EUR million
Property/Casualty
Life
Health
Good development of Property/Casualty and Health lines
17
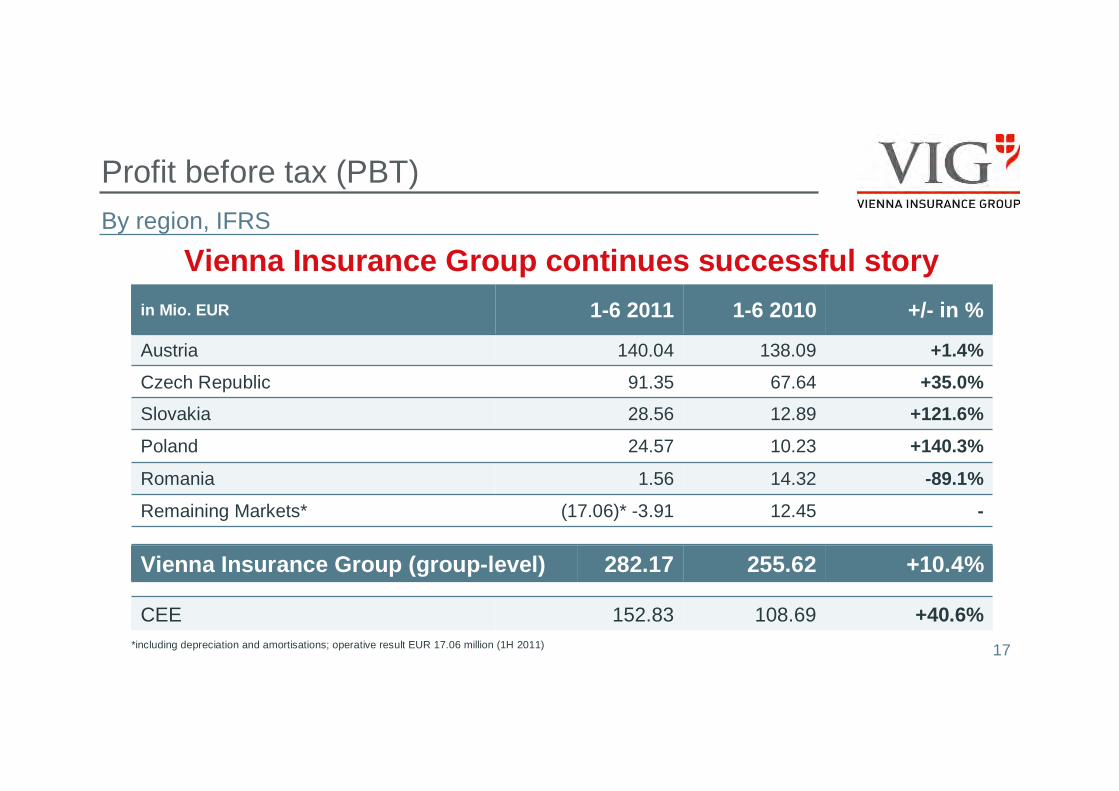
-12.45(17.06)* -3.91Remaining Markets*
108.69
255.62
14.32
10.23
12.89
67.64
138.09
1-6 2010
+40.6%
+10.4%
-89.1%
+140.3%
+121.6%
+35.0%
+1.4%
+/- in %
152.83CEE
in Mio. EUR 1-6 2011
Austria 140.04
Czech Republic 91.35
Slovakia 28.56
Poland 24.57
Romania 1.56
Vienna Insurance Group (group-level) 282.17
Vienna Insurance Group continues successful story
Profit before tax (PBT)
By region, IFRS
*including depreciation and amortisations; operative result EUR 17.06 million (1H 2011)
1818
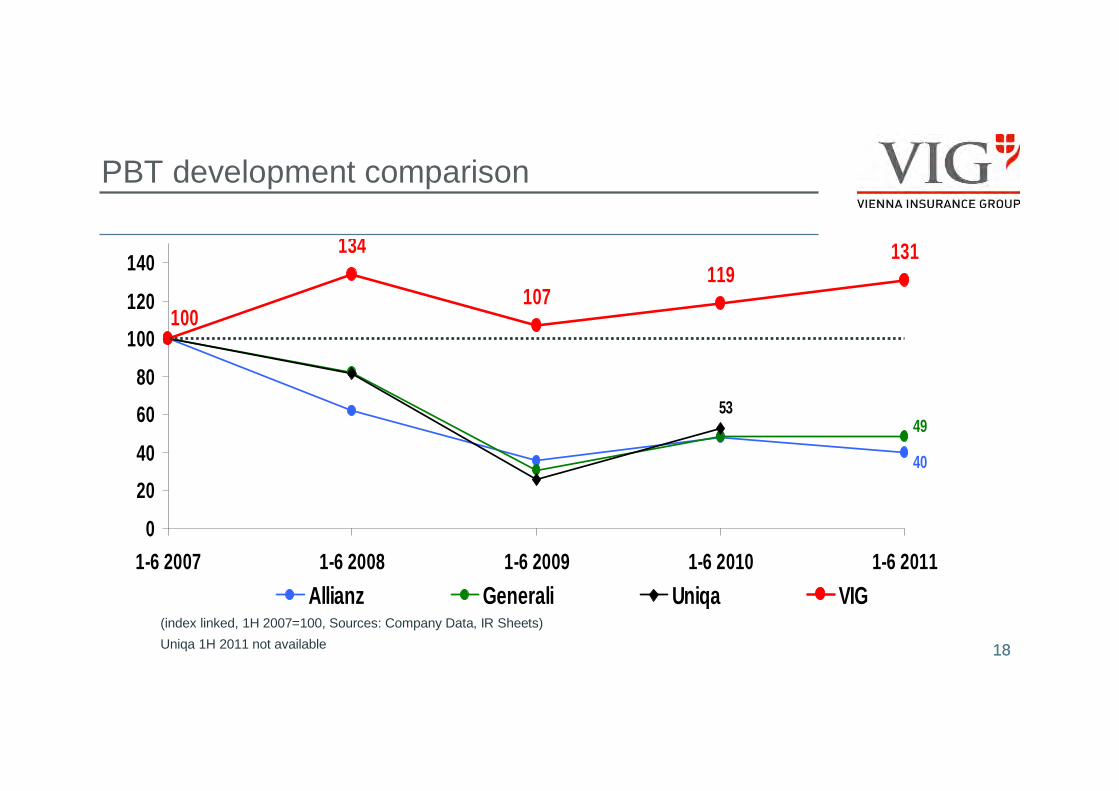
(index linked, 1H 2007=100, Sources: Company Data, IR Sheets)
Uniqa 1H 2011 not available
PBT development comparison
134
107119
131
40
4953
100
0
20
40
60
80
100
120
140
1-6 2007 1-6 2008 1-6 2009 1-6 2010 1-6 2011
Allianz Generali Uniqa VIG
1919
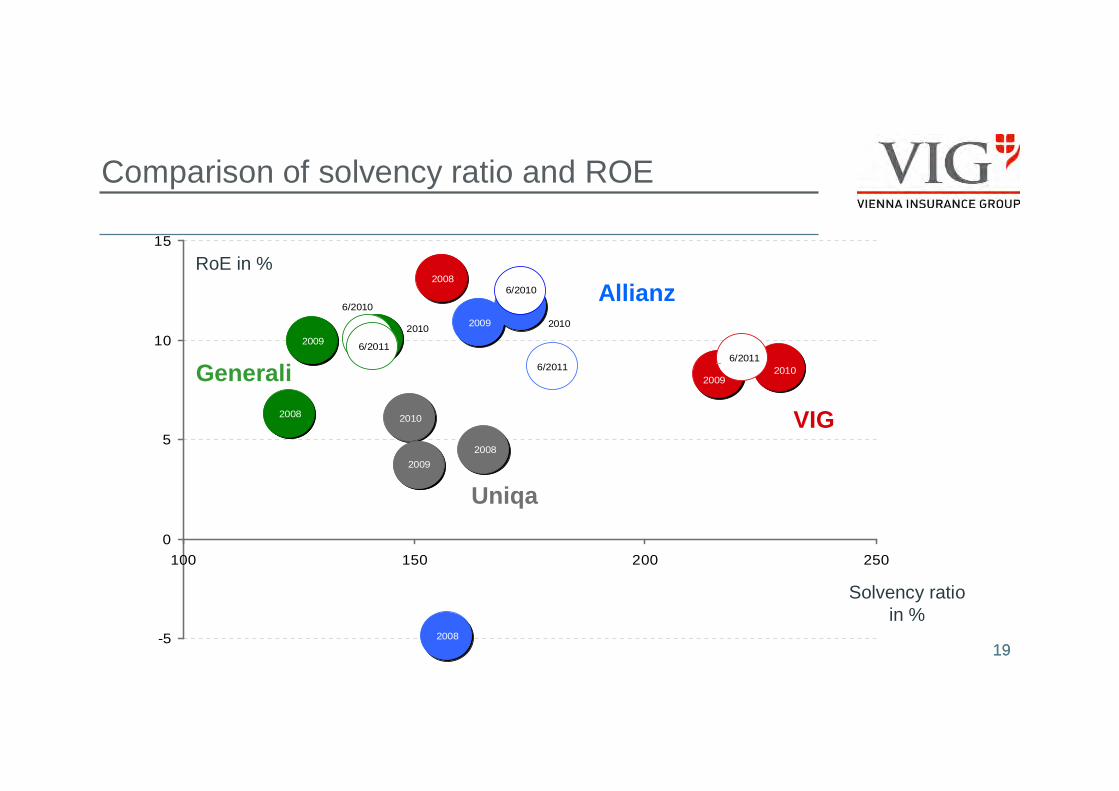
2008
20092010
6/2011
2008
2009 2010
6/2010
6/2011
2008
20092010
6/2010
6/2011
2008
2009
2010
-5
0
5
10
15
100 150 200 250
Solvency ratio in %
RoE in %
Allianz
VIG
Uniqa
Generali
Comparison of solvency ratio and ROE
20
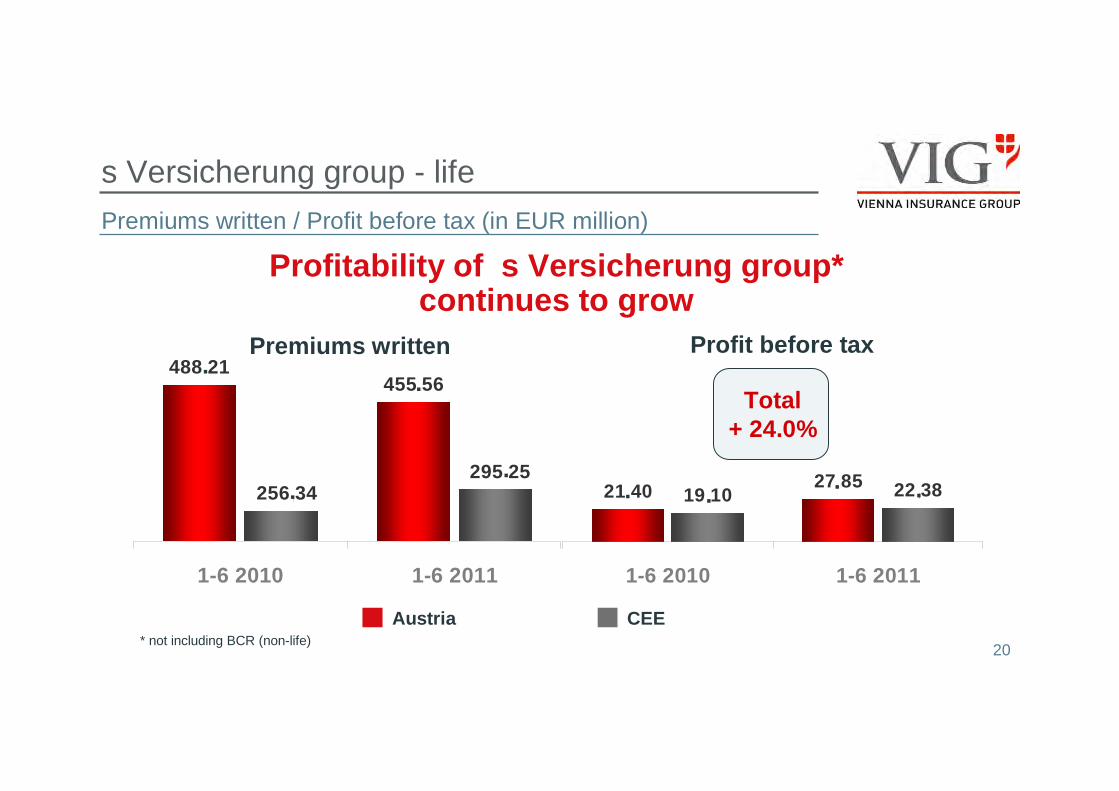
s Versicherung group - life
Premiums written / Profit before tax (in EUR million)
Profitability of s Versicherung group* continues to grow
455,56488,21
256,34295,25
1-6 2010 1-6 2011
19,10 22,3827,8521,40
1-6 2010 1-6 2011
Premiums written Profit before tax
* not including BCR (non-life)
Total+ 24.0%
Austria CEE
.
.
.
.. . . .
21
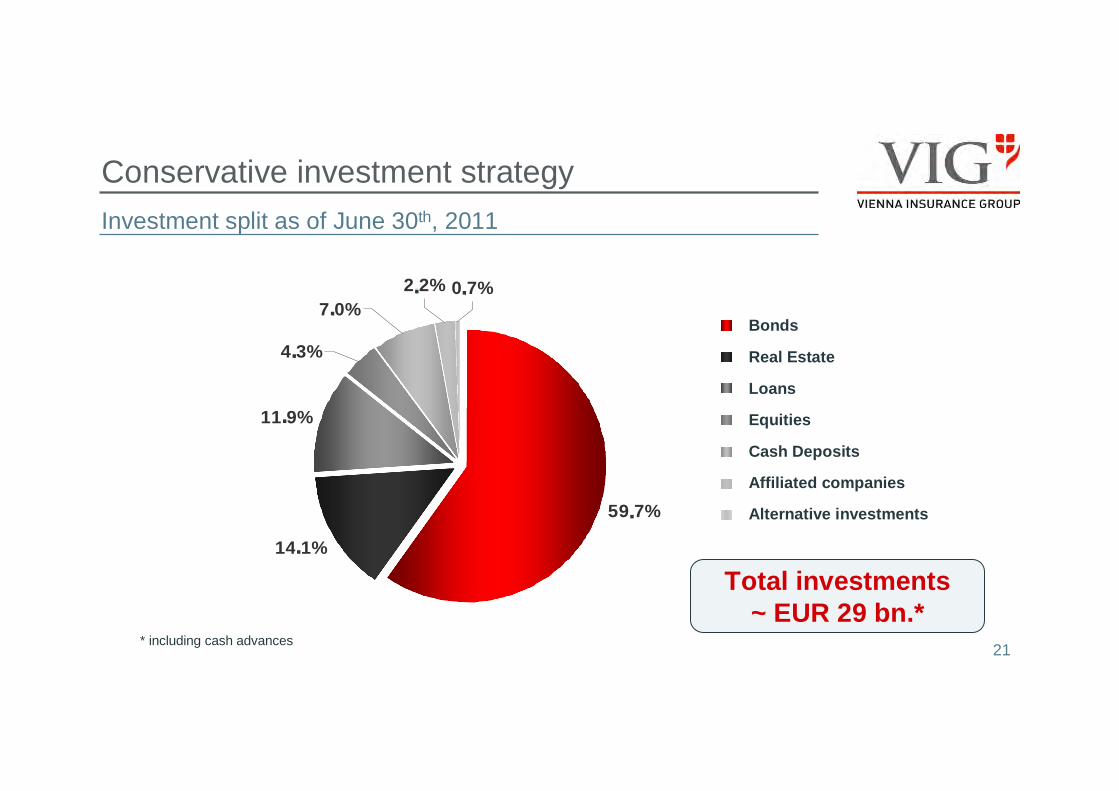
2,2%7,0%
0,7%
59,7%
14,1%
11,9%
4,3%
Conservative investment strategy
Investment split as of June 30th, 2011
Total investments~ EUR 29 bn.*
.
.
.
.. .
.
Bonds
Real Estate
Equities
Cash Deposits
Affiliated companies
Alternative investments
Loans
* including cash advances
22
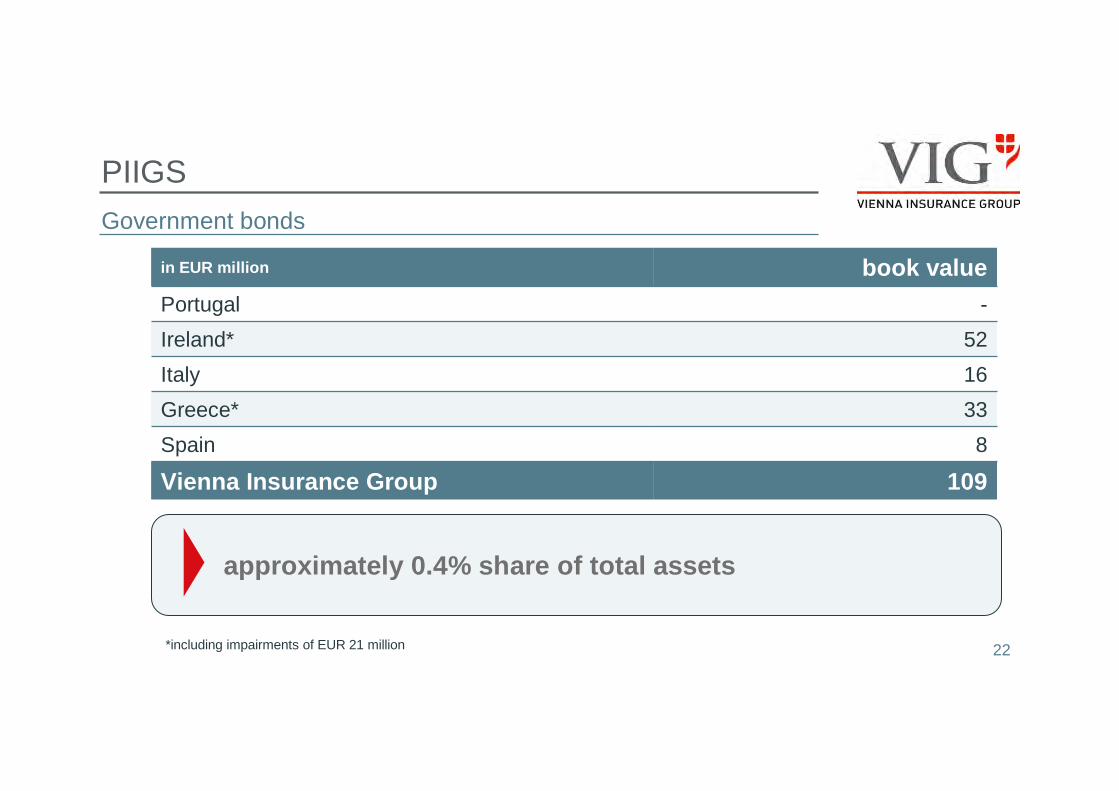
PIIGS
Government bonds
in EUR million book value
Portugal -
Ireland* 52
Italy 16
Greece* 33
Spain 8
Vienna Insurance Group 109
approximately 0.4% share of total assets
*including impairments of EUR 21 million

Recent Developments
24
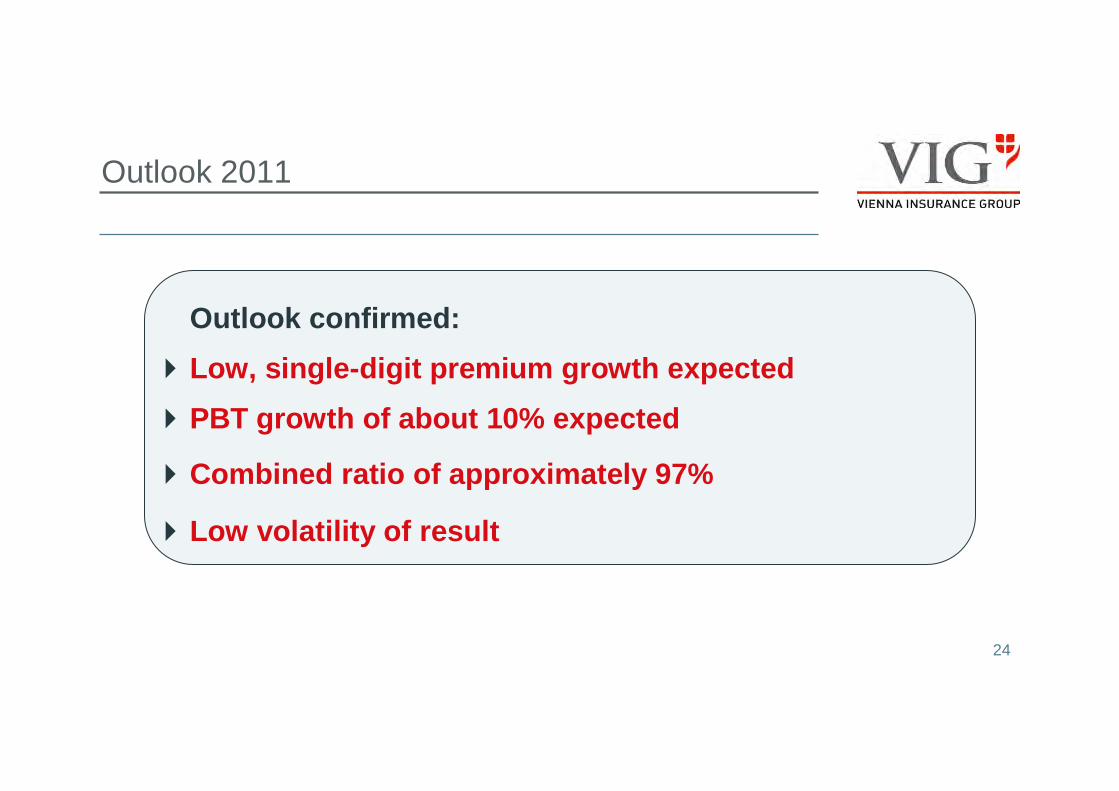
Outlook 2011
Outlook confirmed:
�Low, single-digit premium growth expected
�PBT growth of about 10% expected
�Combined ratio of approximately 97%
�Low volatility of result
25
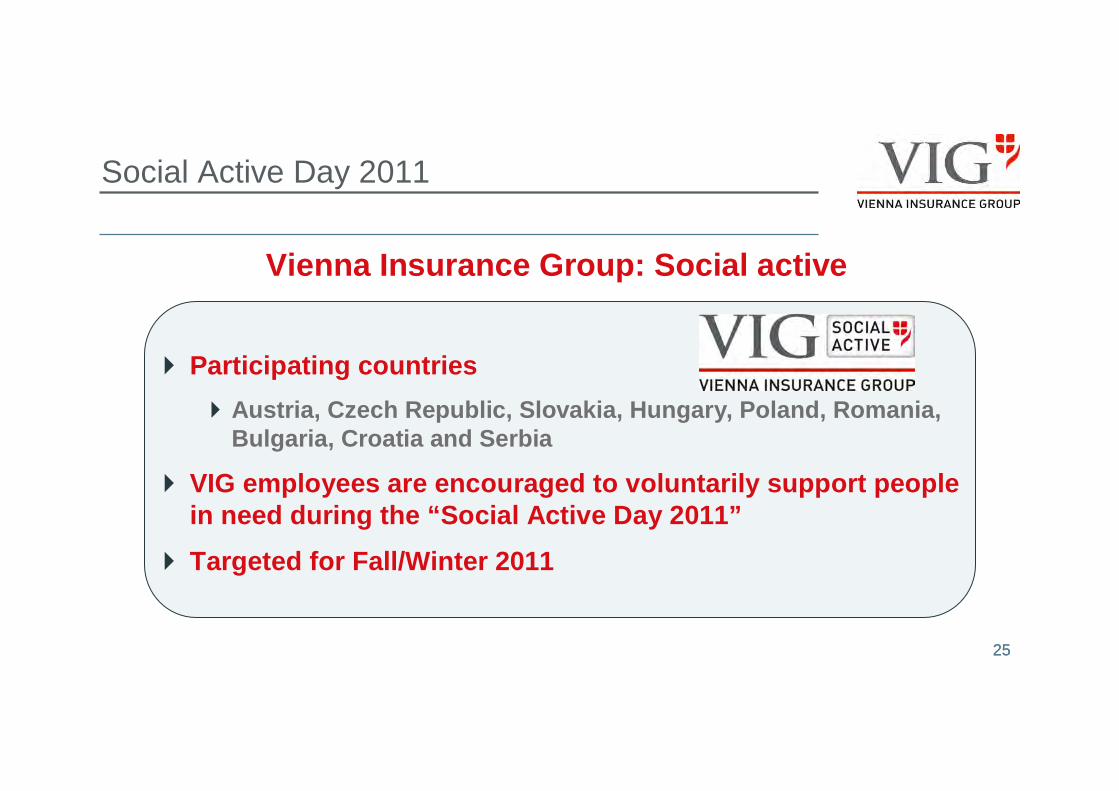
� Participating countries
�Austria, Czech Republic, Slovakia, Hungary, Poland, Romania, Bulgaria, Croatia and Serbia
� VIG employees are encouraged to voluntarily support people in need during the “Social Active Day 2011”
� Targeted for Fall/Winter 2011
25
Social Active Day 2011
Vienna Insurance Group: Social active

Thank you for your attention!