Embed Size (px)
Citation preview

STATE OF WISCONSIN
2017 ECONOMIC ANDWORKFORCE PROFILE
Oneida County
DETI-17957-ONI-P (R. 3/2018)
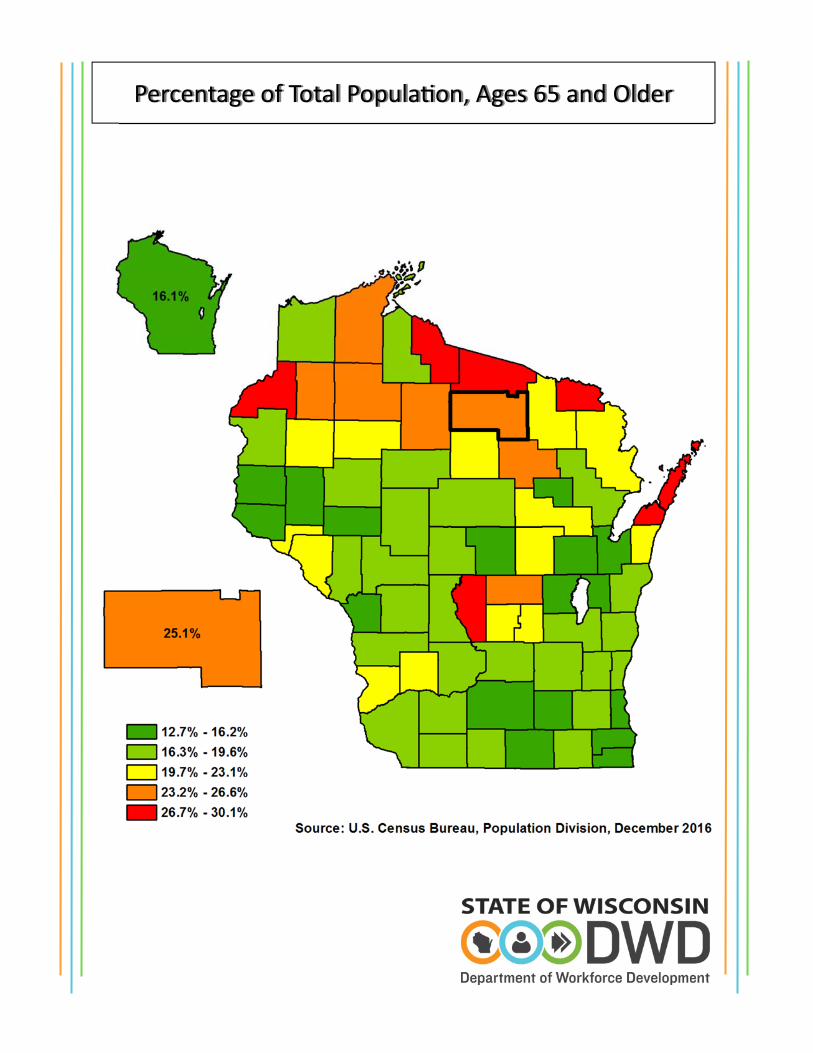
Percentage of Total Popula on, Ages 65 and Older

1
Wisconsin now has more people employed and more private sector jobs than at any me in its history. As of this wri ng, the state added 56,100 jobs during 2016 and 2017 . Employment increased in almost all industry sectors, with prominent gains in construc on, manufacturing, and healthcare.
Wisconsin’s unemployment rate is near lows not seen in a genera on, decreasing from 4.3 percent in January 2016 to 3.2 percent in December 2017, on a seasonally adjusted basis.
Wisconsin faces a worker quan ty challenge. The number of re ring Baby Boomers nearly match the influx of new workers, resul ng in a slow growing workforce and placing constraints on the ability by employers across all industries to hire talent. Many businesses report that the lack of available workers has hindered expansion and, in some cases, even curtailed their ability to meet current product orders.
The blue‐line, orange‐line graph to the right illustrates the situa on in Wisconsin and other upper‐Midwest states. While Wisconsin's popula‐
on will con nue to grow over the next twenty years, the workforce faces serious constraints.
The labor force par cipa on rate (LFPR), defined as the labor force (sum of employed and unemployed) divided by the total popula on ages 16 and older, measures the popula‐
on's engagement in the workforce and serves as an indicator in deter‐mining how Wisconsin's workforce will be constrained.
The overall LFPR peaked in the late 1990s and has been trending lower ever since. The LFPR of peaks across the 30‐55 age cohort at over ninety percent and decreases rapidly into the single digits by age seventy. Baby Boomers have and con nue to exit with respect to their LFPR. The mass of Baby Boomers has moved into the work lifecycle stage of declining
LFPRs, with the tail end of the cohort turning 55 in 2019.
A recent development is the change in the labor force par cipa on rate trend. The LFPR of older workers (those aged 55 years and older) has turned upwards, resul ng in fla en‐ing of the overall LFPR. More boom‐ers are staying in the workforce longer, which may portend higher workforce growth over the coming years. Due to the size of the Baby Boomer cohort and the sensi vity of the LFPR to workforce growth rates, a rela vely small change in the LFPR of older workers would significantly boost the number in the workforce.
Source: Local Area Unemployment Sta s cs, Bureau of Labor Sta s cs
Source: Bureau of Labor Sta s cs

2
Popula on and Demographics
Oneida County gained 210 residents from April 2010 to January 2016, increasing at a rate of 0.6%, which is
slower than the statewide growth rate of 1.5%. This ranks Oneida as the 39th fastest growing county among the
state’s 72 coun es.
Net migra on, which is defined as people moving into the county minus those leaving, was posi ve for the peri‐
od studied, while over a third of Wisconsin coun es experienced nega ve net migra ons over the last five
years. Popula on change due to net‐migra on was 2.9% from 2010 to 2016, up by a 0.9% percentage point in‐
crease in the 2010‐2015 trend in the last county profile.
Growth due to natural increase (as seen on the
graph below) was –2.3% in Oneida County, much
lower than the statewide percent gain of 1.8%. This
highlights the high median age in the county. Onei‐
da County had a median age of 49.9, which is signifi‐
cantly higher than the State of Wisconsin’s median
age of 39.0 (ACS, 2011‐2015).
Of the two sources of popula on growth, natural
increase tends to be more stable. Birth and death
pa erns normally don’t change quickly over me,
while net migra on can be more vola le. Previous
county profiles tended to show the majority of
growth due to net migra on. That trend has since
reversed, highligh ng how quickly migra on trends
can change.
Source: Demographic Services Center, Wisconsin Department of Administra on
Source: Demographic Services Center, Wisconsin Department of Administra on
Components of Popula on Change

3
Labor Force Dynamics
The graph above displays Oneida County’s monthly unemployment rate over the last 15 years comparing it to
the state and na on. Oneida’s rate of 2.9% in May 2017 is quite low historically speaking, and addi onally is low‐
er than all of the May unemployment rates during the booming economy of the late 1990s. While a growing
economy is par ally responsible for today’s low unemployment rates, the trend of slow labor force growth (or
even declines in some coun es) due to baby boomers leaving the labor force also impacts the rates. Low unem‐
ployment rates mean two things. People looking for work are having an easier me finding it and businesses
now have a smaller pool of candi‐
dates to draw poten al employees
from.
The labor force consists of the em‐
ployed and unemployed (represented
as the sum of stacked bars), so the
trend will be along the top edge of
the bars. Oneida’s labor force has
displayed a trend since 2000 of
very gradual and rollercoaster‐like
behavior. Overall, the labor force
has decreased by 968 since 2000.
Oneida’s older popula on may
amplify the impact that re ring
baby boomers will have on the ar‐
ea’s labor force.
Source: Local Area Unemployment Sta s cs, Bureau of Labor Sta s cs
Source: Local Area Unemployment Sta s cs, Bureau of Labor Sta s cs

4
Industry Employment and Wages
From the Quarterly Census of Employment and Wages (QCEW) program, trends in the industry sector composi‐
on of Oneida County can be examined. While labor market informa on examines the employment status of
Oneida County residents, this informa on is based on establishments located within Oneida County. Due to con‐
fiden ality disclosure concerns, data for all industry sectors may not be available.
Trade, Transporta on, U li es, Educa on & Health, and Leisure & Hospitality have the largest share of jobs in
Oneida County, respec vely. Together, these sectors accounted for 63.6% of jobs in Oneida County for 2016.
Public Administra on had the largest numerical and propor onal gain from 2015 to 2016 with a gain of 116
(12.9%) workers. Similar to the 2014 county profile of Oneida, most sectors displayed increases in employment.
Generally, the propor on of
jobs in an industry sector
matches closely with its share
of payroll. However, the Lei‐
sure & Hospitality sector
stands out as having a no ce‐
ably smaller por on of payroll
compared with its share of
jobs. This difference reflects
lower wages within the sector
as well as the higher por on
of part‐ me workers. Educa‐
on & Health was the only
sector with wages above the
state average.

5
Employment Projec ons
While studying past trends is useful, DWD also produces projec ons of industry and occupa on employment into
the future. The data presented on this page and the next is produced every two years, following Bureau of Labor
Sta s cs methodology. The current ten‐year forecast examines employment over the period between 2014 and
2024 and has been published at both the state and Workforce Development Area level. The industry and occupa‐
onal employment projec ons in this profile are for the nine‐county North Central Wisconsin Workforce Develop‐
ment Area. This region includes more than just the area directly impacted by the Oneida County regional econo‐
my. Employment in Oneida County accounts for about 7% of employment in the region. However, employment
and economic dynamics are similar enough within all parts of the region to comment on general trends.
Employment across all industries is expected to grow by 6% over the ten year period, or almost 13,000 workers.
This projec on only forecasts levels of filled posi ons rather than poten al demand. This further illustrates the
issues associated with the aging popula on—while growth in the labor force is slowing, and in some coun es
even declining, job growth is expected to con nue. So while businesses are already having difficulty filling the job
openings vacated by re rees, increasing difficulty will be felt filling new openings as well. This could even con‐
strain job growth; if openings businesses already have can’t be filled, businesses may not find enough employees
to fill newly created posi ons, even if enough demand in the market exists to expand.
Solu ons to this issue will be different for each business, but will likely include a combina on of possibili es like
talent pipeline development (examples include the Wisconsin Fast Forward training grants, and business alliances
aimed at marke ng specific careers), increased focus on talent a rac on and reten on, engaging under‐u lized
workforces (like those with barriers to workforce entry), increased automa on, and retaining re rees in non‐
conven onal work arrangements to name a few.
The most significant numerical growth is expected in Educa on & Health Services (3,892, 8% growth rate), and
Trade, Transporta on, U li es (2,195, 5% growth rate). Another super‐sector with strong an cipated growth is
the Professional & Business Services sector (1,144, 10%).

6
Employment Projec ons
In 2014, the area's largest occupa on group was Office & Administra ve Support with 34,446 jobs, 14.8 percent
of total employment. Of the 22 occupa on groups, the top 5 groups were as follows: Management, Sales & Re‐
lated, Office & Administra ve Support, Produc on, and Transporta on & Material Moving. These groups ac‐
counted for 47.5% of jobs. While these 5 groups are projected to remain the top groups in 2022, the share of
jobs within these groups is projected to decline to 46.6% of jobs, a 0.9 percentage point decrease.
The share of total jobs by occupa onal group is projected to change li le through 2024. However, the top three
groups, Office & Administra ve Support; Produc on; and Sales & Related, are projected to experience the larg‐
est decreases in share. The Personal Care & Service group is projected to have the largest gain in job share be‐
tween 2014 and 2024, with a rise from 4.6% to 5.1% of jobs, a 0.5 percentage point increase.
Significant growth is also an cipated in many other occupa onal sectors, suppor ng the narra ve of long‐range
stability in many of the region’s largest industries. The other trend that is also illustrated is that of labor con‐
straints as openings created due to replacement needs outnumber those generated by new growth. This sug‐
gests that there will be increased importance placed on the availability and skill sets of young workers entering
the region’s workforce. It is vitally important to realize that slow growth or declines in employment don’t neces‐
Source: Office of Economic Advisors, Wisconsin Department of Workforce Development, September 2015

7
sarily reflect on the health of those industries. Employment declines may be due to factors such as increased au‐
toma on and produc vity. There will be many openings simply due to re rements! The graph above displays
North Central’s job base by major industry sector outlining the age distribu on of its job holders. The age distribu‐
ons vary widely from industry to industry, easily observed from the graph. Two factors that shape this composi‐
on are labor availability and the occupa onal composi on within the industries. The general age composi on of
the popula on and the likelihood of par cipa on in the labor force drive the availability of labor for hire.
Occupa onal composi on within an area is the more complex factor, influenced by a job holder’s life stage, expe‐
rience, educa on/training, etc. This tends to correspond to age. For example, younger inexperienced workers
tend to work in entry‐level jobs. These entry jobs are more prominent in industries such as the leisure and hospi‐
tality sector. Other industries, such as the educa on and health care sector, require workers to have completed a
higher level of formal educa on or training and so they have a rela vely low share of the youngest working co‐
horts. Typically, higher educa on levels tend to correspond to older age groups who have invested the me nec‐
essary to achieve those advanced educa onal levels. O en when examining age/labor force issues, we focus too
broadly on labor force entry and exit data, to tell us how many workers are available. While useful, this ignores
the dynamics within the workforce, which is not a homogenous popula on. Data such as age by industry can give
us ac onable informa on like which industry will have the most upcoming re rements, promp ng a need for re‐
cruitment and succession planning.
The age group represen ng the largest share of job holders, independent of industry, is the 45‐54 group ac‐
coun ng for 22.9% of North Central’s total job holders.
For More Informa on:
Mitchell Rupp
Regional Economist — North Central WDA
Phone: (715) 261‐8728 Email: [email protected]